EP3252465A1 - Noise level estimation method, measurement data processing device, and program for measurement data processing - Google Patents
Noise level estimation method, measurement data processing device, and program for measurement data processing Download PDFInfo
- Publication number
- EP3252465A1 EP3252465A1 EP15879857.9A EP15879857A EP3252465A1 EP 3252465 A1 EP3252465 A1 EP 3252465A1 EP 15879857 A EP15879857 A EP 15879857A EP 3252465 A1 EP3252465 A1 EP 3252465A1
- Authority
- EP
- European Patent Office
- Prior art keywords
- segment
- segments
- noise
- noise level
- waveform data
- Prior art date
- Legal status (The legal status is an assumption and is not a legal conclusion. Google has not performed a legal analysis and makes no representation as to the accuracy of the status listed.)
- Withdrawn
Links
Images




Classifications
-
- G—PHYSICS
- G01—MEASURING; TESTING
- G01N—INVESTIGATING OR ANALYSING MATERIALS BY DETERMINING THEIR CHEMICAL OR PHYSICAL PROPERTIES
- G01N30/00—Investigating or analysing materials by separation into components using adsorption, absorption or similar phenomena or using ion-exchange, e.g. chromatography or field flow fractionation
- G01N30/02—Column chromatography
- G01N30/86—Signal analysis
- G01N30/8603—Signal analysis with integration or differentiation
- G01N30/861—Differentiation
-
- G—PHYSICS
- G01—MEASURING; TESTING
- G01N—INVESTIGATING OR ANALYSING MATERIALS BY DETERMINING THEIR CHEMICAL OR PHYSICAL PROPERTIES
- G01N30/00—Investigating or analysing materials by separation into components using adsorption, absorption or similar phenomena or using ion-exchange, e.g. chromatography or field flow fractionation
- G01N30/02—Column chromatography
- G01N30/86—Signal analysis
- G01N30/8624—Detection of slopes or peaks; baseline correction
- G01N30/8641—Baseline
-
- G—PHYSICS
- G01—MEASURING; TESTING
- G01N—INVESTIGATING OR ANALYSING MATERIALS BY DETERMINING THEIR CHEMICAL OR PHYSICAL PROPERTIES
- G01N30/00—Investigating or analysing materials by separation into components using adsorption, absorption or similar phenomena or using ion-exchange, e.g. chromatography or field flow fractionation
- G01N30/02—Column chromatography
- G01N30/86—Signal analysis
- G01N30/8675—Evaluation, i.e. decoding of the signal into analytical information
-
- G—PHYSICS
- G01—MEASURING; TESTING
- G01N—INVESTIGATING OR ANALYSING MATERIALS BY DETERMINING THEIR CHEMICAL OR PHYSICAL PROPERTIES
- G01N30/00—Investigating or analysing materials by separation into components using adsorption, absorption or similar phenomena or using ion-exchange, e.g. chromatography or field flow fractionation
- G01N30/02—Column chromatography
- G01N30/86—Signal analysis
- G01N30/8675—Evaluation, i.e. decoding of the signal into analytical information
- G01N30/8686—Fingerprinting, e.g. without prior knowledge of the sample components
Definitions
- the present invention relates to a method for estimating the magnitude of a noise component (noise level) in a chromatogram, spectrum or other kinds of measurement data composed of a peak component, baseline component and noise component, as well as a device for processing such measurement data and a program for processing measurement data.
- a noise component noise level
- liquid chromatograph One type of device for analyzing components contained in a liquid sample is the liquid chromatograph.
- a liquid sample is carried by a stream of mobile phase and introduced into a column.
- the components in the sample are temporally separated within the column and subsequently detected with a detector, such as an absorptiometer, to create a chromatogram.
- a detector such as an absorptiometer
- Each component is identified from the position of a peak on the chromatogram, and the concentration of that component is determined from the height or area of that peak (for example, see Patent Literature 1).
- a chromatogram obtained by a measurement can be separated into three components, i.e. the peak component, baseline component and noise component.
- the magnitude of the peak component changes with the elution of various components contained in the liquid sample, while that of the baseline component changes due to such factors as a change in the pressure of the pump supplying the mobile phase or a change in the ambient temperature (baseline drift).
- the change of the baseline component is normally slower than that of the peak component or noise component.
- the magnitude of the noise component fluctuates due to various factors, and its fluctuating amplitude is considerably high. Therefore, it is difficult to isolate the noise component from the chromatogram.
- Fig. 1 shows one example of the waveforms (profiles) of a peak component (a), noise component (b) and their sum (c) as well as the power spectra respectively obtained by Fourier-transforming those profiles.
- the peak component is localized within a low frequency band, while the noise component is spread over a wide frequency band.
- high-pass filters which reduce frequency components lower than a predetermined frequency have been used.
- the peak component localized within the low frequency band can be mostly removed.
- a second-order difference filter is used as the high-pass filter.
- Using a second-order difference filter as the high-pass filter yields a signal having a similar shape to a profile obtained by the second-order differentiation of the chromatogram.
- the baseline component is also normally localized within the low frequency band and therefore can be mostly removed by the high-pass filter, as with the peak component.
- Patent Literature 1 JP 7-98270 A
- the problem to be solved by the present invention is to provide a noise level estimation method, measurement data processing device, and program for processing measurement data by which the noise component contained in measurement data which contain the three components of a peak component, baseline component and noise component can be assuredly isolated, so that the noise level can be estimated with high accuracy.
- the first aspect of the present invention developed for solving the previously described problem is a method for estimating a noise level representing the magnitude of a noise component from measurement data containing the three components of a peak component, baseline component and noise component, the method including:
- Examples of data that can be used as the assumed noise data include: a set of data purely composed of colored noise, such as white noise having a power spectrum whose magnitude is uniform and independent of the frequency, pink noise having a power spectrum whose magnitude is inversely proportional to the frequency, or brown noise whose having a power spectrum whose magnitude is inversely proportional to the square of the frequency; and a set of data prepared from actually measured noise.
- the threshold of the widths of the plurality of segments may be defined, for example, as the upper limit value of the distribution of the widths of the plurality of segments obtained by dividing the first waveform data, or as the upper limit value of a distribution including a predetermined proportion (e.g. 90 %) of those segments.
- the estimation of the noise level based on the heights or areas of the plurality of segments included in the first segment group can be achieved, for example, by calculating the average value or median of the heights or areas of those segments.
- the second waveform obtained by extracting high frequency measurement components by using the high-pass filter is divided into a plurality of segments. Subsequently, each segment whose width is larger than the segment-width threshold calculated from assumed noise data is excluded, being identified as a segment which has originated from a component different from the noise component, i.e. which has originated from the peak component or baseline component. Therefore, even if a portion of the peak component or baseline component passes through the high-pass filter, the segment corresponding to that portion is excluded at this stage. Thus, the noise component is assuredly isolated from the measurement data, so that the noise level can be estimated with high accuracy.
- the noise level estimation method according to the present invention may further include:
- an outlier of the height or area of the segment By excluding an outlier of the height or area of the segment from the estimation of the noise level in this manner, a segment which has originated from a component different from noise yet has not been excluded by a mere comparison of the width can be excluded so as to estimate the noise level with an even higher level of accuracy.
- the estimation accuracy of the noise level can be further improved by repeating the process of removing a segment having an outlier and estimating the noise level until all outliers are removed or until a predetermined number of repetitions is reached.
- the noise level estimation method according to the present invention may also include:
- a noise level for a set of segments located within a predetermined range from the segment concerned in the previously described manner a local noise level at the segment position of each segment can be determined.
- the noise level may also temporally change.
- the noise level can be estimated with high accuracy even in the case where the noise level temporally changes.
- the previously described technique of excluding a segment having an outlier to improve the estimation accuracy of the noise level can also be applied in the determination of the noise level at the segment position of each segment.
- the estimation accuracy of the noise level can be further improved by repeating the process of excluding a segment having an outlier and estimating the noise level until all outliers are removed or until a predetermined number of repetitions is reached.
- the second aspect of the present invention developed for solving the previously described problem is a measurement data processing device used for estimating a noise level from measurement data containing the three components of a peak component, baseline component and noise component, the device including:
- the third aspect of the present invention developed for solving the previously described problem is a program for processing measurement data, used for estimating a noise level from measurement data containing the three components of a peak component, baseline component and noise component, the program characterized by making a computer, provided with a storage section for holding a segment-width threshold and a high-pass filter, function as the second waveform acquirer, the segment divider, the first segment group creator and the noise level calculator described in the second aspect of the present invention.
- the noise component contained in measurement data which include the three components of a peak component, baseline component and noise component can be assuredly isolated, so that the noise level can be estimated with high accuracy.
- Embodiments of the noise level estimation method, measurement data processing device, and program for processing measurement data according to the present invention are hereinafter described with reference to the attached drawings.
- the following embodiments deal with the case of estimating a noise level which is the magnitude of a noise component contained in a chromatogram acquired using a liquid chromatograph.
- Fig. 2 shows the configuration of a measurement data processing device 10 according to the first embodiment.
- the measurement data processing device 10 is actually a general-purpose personal computer provided with a central processing unit (CPU) 11, memory 12, display unit (monitor) 13, input unit 14, high-pass filter 15, storage section 16 including a high-volume storage device (e.g. hard disk), communication interface (com. I/F) 17, and other elements.
- the measurement data processing device 10 can be connected to a liquid chromatograph (not shown) through the communication interface 17.
- a program 18 for processing measurement data is stored in addition to the OS (operating system). Executing this program 18 for processing measurement data makes the CPU 11 function as an assumed noise data creator 18a, first waveform data creator 18b, segment divider 18c, threshold setter 18d, second waveform data creator 18e, first segment group creator 18f, second segment group creator 18g, and noise level calculator 18h, all of which will be described later.
- the noise level estimation method using the measurement data processing device 10 of the present embodiment is hereinafter described with reference to the flowchart of Fig. 3 .
- the assumed noise data creator 18a creates assumed noise data which are purely composed of assumed noise for measurement data (Step S1).
- the assumed noise in the present embodiment is normal white noise.
- Normal white noise is a type of noise having both the characteristics of white noise which has a constant intensity at all frequencies and those of Gaussian noise (normally distributed noise).
- the first waveform data creator 18b creates first waveform data which are waveform data of high frequency noise components obtained by attenuating low frequency components in the assumed noise data by using the high-pass filter 15 (Step S2).
- the high-pass filter 15 in the present embodiment is a second-order difference filter.
- a set of data different from those created from the normal white noise may also be used as the assumed noise data, such as a set of data created from colored noise, such as pink noise or brown noise, or a set of actually measured noise data.
- the segment divider 18c divides the first waveform data into a plurality of segments so that each section where positive values successively occur or each section where negative values successively occur in the first waveform data is defined as one segment (Step S3).
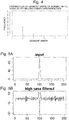
- the threshold setter 18d creates a distribution of the widths of those segments ( Fig. 4 ) and sets the segment-width threshold based on that distribution (Step S4).
- the largest value in the distribution of the segment width i.e. six (arbitrary unit in the time-axis direction), is set as the threshold, and this value is saved in the storage section 16.
- the threshold set by Steps S1 through S4 can be applied to a plurality of sets of chromatogram data. Accordingly, by previously setting the threshold and saving it in the storage section 16, a noise component can be estimated from each of the plurality of sets of chromatogram data by merely performing Step S6 and subsequent steps, which will be hereinafter described.
- the second waveform data creator 18e reads measurement data of a chromatogram previously stored in the storage section 16 ( Fig. 5A ), and creates second waveform data, which are waveform data of high frequency measurement components, using the high-pass filter 15 (Step S5; Fig. 5B ).
- the segment divider 18c divides the second waveform data into a plurality of segments so that each section where positive values successively occur or each section where negative values successively occur in the second waveform data is defined as one segment (Step S6; Fig. 6A ).
- Step S7 is a process for excluding a peak component or baseline component based on the fact that a segment which corresponds to a peak component or baseline component that has passed through the high-pass filter has a larger width than that of a segment which originates from the noise component.
- the noise level calculator 18h computes the area of each of the segments included in the first segment group and sets the average of the computed areas as the segment-area reference value. Then, the second segment group creator 18g compares the area of each segment in the first segment group with the segment area reference value, extracts outliers included within a certain proportion (e.g. 5 %) of the total number of the segments in descending order of the difference from the area reference value, and excludes the segments corresponding to the outliers (Step S8), to create a second segment group (StepS9).
- a certain proportion e.g. 5 %
- the extraction of the outliers can be achieved, for example, by regarding any value larger than the average + N ⁇ of the segment areas of the segments as an outlier (where N is a positive integer, and ⁇ is the unbiased standard deviation).
- N is a positive integer, and ⁇ is the unbiased standard deviation.
- a suitable value for each set of measurement data can be used taking into account the distribution of the segment-area values.
- the segment-area value may be the median of the distribution of the segment areas of the segments.
- the extraction of the outliers can be achieved, for example, by regarding any value larger than the median + M ⁇ MAD (median absolute deviation) of the areas of the segments as an outlier (where M is a positive integer).
- the extraction of the outliers can also be achieved by various other methods, e.g. by extracting any value whose difference from the area reference value is larger than a previously set value.
- Steps S7 through S9 is intended for removing the influence of a noise component having a singular magnitude caused by an accidental factor during the measurement.
- an extremely small area value of the segment may also be treated as an outlier, in which case any value which does not fall within the range given by the average value ⁇ N ⁇ of the segment areas, or the median ⁇ M ⁇ MAD of the segment areas, can be regarded as an outlier.
- Those steps also remove segments which have originated from a peak or baseline yet have not been excluded by the process using the threshold of the width.
- the noise level calculator After the second segment group is created, the noise level calculator once more computes the area of each segment included in the second segment group, and sets the average of the computed areas as the segment area reference value (Step S10). Then, based on this segment area reference value, the noise level calculator determines whether or not an outlier exists among the area values of the segments. If no outlier exists ("YES” in Step S11), the noise level calculator computes the noise level from the latest segment area reference value. If an outlier still exists (“NO” in Step S11), the extraction and exclusion of an outlier (Step S8) is once more performed by the second segment group creator 18g to create the second segment group (Step S9), and the segment area reference value is newly set (Step S10). Such a process is repeated until all outliers are removed. After that, the noise level is calculated.
- the device may be configured to calculate the noise level, regardless of whether or not an outlier exists, after the number of repetitions of Steps S8 through S10 has reached a predetermined number (e.g. five).
- Steps S8 through S11 The process from Steps S8 through S11 is intended for a high-accuracy calculation of the noise level and is not indispensable for the present invention. That is to say, the noise level may be directly calculated from the areas of the segments in the first segment group.
- the noise level estimation method, measurement data processing device and program for processing measurement data according to the first embodiment, even if a portion of the peak component or baseline component passes through the high-pass filter, the segment corresponding to that portion is excluded. Therefore, the noise component can be assuredly isolated from the measurement data, so that the noise level can be estimated with high accuracy. Additionally, according to the first embodiment, by excluding an outlier of the segment area from the estimation of the noise level, a segment which has originated from a component different from noise yet has not been excluded by a mere comparison of the width can be excluded, so that the noise level can be estimated with an even higher level of accuracy. It should be noted that, as opposed to the previous example in which the segment (area) reference value and the noise level are determined based on the area values of the segments, the segment (height) reference value and the noise level may be determined from the heights of the segments.
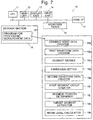
- Fig. 7 shows the configuration of a measurement data processing device 10a according to the second embodiment.
- the same components as described in the first embodiment are denoted by the same numerals and will not be described.
- executing the program 181 for processing measurement data makes the CPU 11 function as an assumed noise data creator 18a, first waveform data creator 18b, segment divider 18c, threshold setter 18d, second waveform data creator 18e, first segment group creator 18f, segment position determiner 18j, target segment extractor 18k and noise level calculator 18h, all of which will be described later.
- the noise level estimation method using the measurement data processing device 10 of the present embodiment is hereinafter described with reference to the flowchart of Fig. 8 .
- the same processes as described in the first embodiment are denoted by the same numerals and will not be described.
- Steps S1 through S4 The setting of the segment-width threshold using assumed noise data (Steps S1 through S4) and the creation of the first segment group which is a set of waveform data of high frequency components (Steps S5 through S7) are the same as in the first embodiment.
- the second embodiment is characterized by the subsequent Steps S21 through S27.
- the segment position determiner 18j designates, for each of the segments in the first segment group, the central position of the segment concerned as the segment position (Step S21). Subsequently, for one segment (which is hereinafter called the "segment in question") among those segments, the target segment extractor 18k extracts, as the target segments, one or more segments having their respective segment positions located within a preciously set range from the segment position of the segment in question (Step S22). Then, the noise level calculator 18h computes the noise level at the segment position of the segment in question based on the average (or median or the like) of the areas (or heights) of the target segments and the segment in question (Step 25).
- Steps S22 through S25 are performed for every segment in the first segment group.
- the noise level at the segment position of each segment is completed for all segments ("YES" in Step S26)
- the noise level at the segment position of each segment excluded from the creation of the first segment group i.e. each segment originating from the peak component or baseline component
- the interpolation of the noise level can be performed by an appropriate method for the mode of change in the noise level, such as the linear interpolation or spline interpolation.
- the noise level estimation method, measurement data processing device and program for processing measurement data according to the second embodiment the peak component and baseline component can be assuredly excluded, and furthermore, the noise level at each position on the chromatogram can be calculated.
- Such a method or device according to the second embodiment can be suitably used in the case where the noise level fluctuates due to the measurement system, e.g. in a chromatogram obtained by a gradient analysis in which the baseline component easily fluctuates, causing a corresponding fluctuation in the noise level.
- Both of the first and second embodiments are mere examples and can be appropriately changed in line with the gist of the present invention.
- the previously described embodiments are concerned with the case of processing a chromatogram obtained with a liquid chromatograph.
- the present invention can be used to determine not only the noise level in a chromatogram obtained with a liquid chromatograph or gas chromatograph but also in various other kinds of measurement data, such as a spectrum obtained by a spectrometric measurement.
- each section where positive values successively occur or each section where negative values successively occur in the waveform data of high frequency components extracted by using a second-order difference filter is defined as one segment.
- Other kinds of high-pass filters may also be used to extract high frequency components.
- a section where positive values successively occur (or a section where negative values successively occur) in the waveform data of high frequency components extracted by using an n th -order difference filter corresponds to a section between a local maximum and a local minimum neighboring each other in the waveform data of high frequency components extracted by using an n+1 st -order difference filter.
- the previously described processing of measurement data can be similarly performed by dividing the waveform data into segments so that each section between a local maximum and a local minimum neighboring each other is defined as one segment, instead of defining each section where positive values successively occur (or each section where negative values successively occur) as one segment.
Landscapes
- General Physics & Mathematics (AREA)
- Physics & Mathematics (AREA)
- Immunology (AREA)
- Pathology (AREA)
- Analytical Chemistry (AREA)
- Biochemistry (AREA)
- General Health & Medical Sciences (AREA)
- Life Sciences & Earth Sciences (AREA)
- Health & Medical Sciences (AREA)
- Chemical & Material Sciences (AREA)
- Algebra (AREA)
- Mathematical Analysis (AREA)
- Mathematical Optimization (AREA)
- Pure & Applied Mathematics (AREA)
- Engineering & Computer Science (AREA)
- Library & Information Science (AREA)
- Measurement Of Mechanical Vibrations Or Ultrasonic Waves (AREA)
- Indication And Recording Devices For Special Purposes And Tariff Metering Devices (AREA)
Abstract
Description
- The present invention relates to a method for estimating the magnitude of a noise component (noise level) in a chromatogram, spectrum or other kinds of measurement data composed of a peak component, baseline component and noise component, as well as a device for processing such measurement data and a program for processing measurement data.
- One type of device for analyzing components contained in a liquid sample is the liquid chromatograph. In a liquid chromatograph, a liquid sample is carried by a stream of mobile phase and introduced into a column. The components in the sample are temporally separated within the column and subsequently detected with a detector, such as an absorptiometer, to create a chromatogram. Each component is identified from the position of a peak on the chromatogram, and the concentration of that component is determined from the height or area of that peak (for example, see Patent Literature 1).
- In general, a chromatogram obtained by a measurement can be separated into three components, i.e. the peak component, baseline component and noise component. The magnitude of the peak component changes with the elution of various components contained in the liquid sample, while that of the baseline component changes due to such factors as a change in the pressure of the pump supplying the mobile phase or a change in the ambient temperature (baseline drift). The change of the baseline component is normally slower than that of the peak component or noise component. By comparison, the magnitude of the noise component (noise level) fluctuates due to various factors, and its fluctuating amplitude is considerably high. Therefore, it is difficult to isolate the noise component from the chromatogram.
-
Fig. 1 shows one example of the waveforms (profiles) of a peak component (a), noise component (b) and their sum (c) as well as the power spectra respectively obtained by Fourier-transforming those profiles. As can be seen in those power spectra, the peak component is localized within a low frequency band, while the noise component is spread over a wide frequency band. - Accordingly, in order to extract the noise component from a chromatogram, high-pass filters which reduce frequency components lower than a predetermined frequency have been used. By the filter, the peak component localized within the low frequency band can be mostly removed. As the high-pass filter, for example, a second-order difference filter is used. Using a second-order difference filter as the high-pass filter yields a signal having a similar shape to a profile obtained by the second-order differentiation of the chromatogram. Though not shown in
Fig. 1 , the baseline component is also normally localized within the low frequency band and therefore can be mostly removed by the high-pass filter, as with the peak component. - Patent Literature 1:
JP 7-98270 A - As just described, by using a high-pass filter, a considerable portion of the peak component and baseline component can be removed from a chromatogram to isolate the noise component. However, it is impossible to completely isolate the noise component from the other ones. Accordingly, it has been difficult to estimate the noise level in a chromatogram with high accuracy by merely using the high-pass filter. This problem becomes particularly noticeable when the peak intensity of the chromatogram is high or when there is a large number of peaks.
- Although the previous description is concerned with the case of a chromatogram, similar problems can also occur in various other kinds of measurement data which contain a peak component, baseline component and noise component, as in a spectrum obtained in a spectroscopic measurement.
- The problem to be solved by the present invention is to provide a noise level estimation method, measurement data processing device, and program for processing measurement data by which the noise component contained in measurement data which contain the three components of a peak component, baseline component and noise component can be assuredly isolated, so that the noise level can be estimated with high accuracy.
- The first aspect of the present invention developed for solving the previously described problem is a method for estimating a noise level representing the magnitude of a noise component from measurement data containing the three components of a peak component, baseline component and noise component, the method including:
- a) extracting, from assumed noise data purely composed of assumed noise for the measurement data, high frequency noise components by means of a high-pass filter which attenuates frequency components lower than a predetermined frequency, dividing first waveform data which are waveform data of the high frequency noise components into a plurality of segments so that each section where positive values successively occur or each section where negative values successively occur in the first waveform data is defined as one segment, or so that each section between a local maximum and a local minimum neighboring each other in the first waveform data is defined as one segment, and determining a segment-width threshold based on the distribution of the widths of the plurality of segments;
- b) extracting high frequency measurement components from the measurement data by means of the high-pass filter, and dividing second waveform data which are waveform data of the high frequency measurement components into a plurality of segments so that each section where positive values successively occur or each section where negative values successively occur in the second waveform data is defined as one segment, or so that each section between a local maximum and a local minimum neighboring each other in the second waveform data is defined as one segment;
- c) excluding each segment having a width larger than the threshold from the plurality of segments obtained by dividing the second waveform data, to create a first segment group formed by the remaining segments; and
- d) determining the noise level based on the heights or areas of the plurality of segments included in the first segment group.
- Examples of data that can be used as the assumed noise data include: a set of data purely composed of colored noise, such as white noise having a power spectrum whose magnitude is uniform and independent of the frequency, pink noise having a power spectrum whose magnitude is inversely proportional to the frequency, or brown noise whose having a power spectrum whose magnitude is inversely proportional to the square of the frequency; and a set of data prepared from actually measured noise.
- The threshold of the widths of the plurality of segments may be defined, for example, as the upper limit value of the distribution of the widths of the plurality of segments obtained by dividing the first waveform data, or as the upper limit value of a distribution including a predetermined proportion (e.g. 90 %) of those segments.
- The estimation of the noise level based on the heights or areas of the plurality of segments included in the first segment group can be achieved, for example, by calculating the average value or median of the heights or areas of those segments.
- In the noise level estimation method according to the present invention, the second waveform obtained by extracting high frequency measurement components by using the high-pass filter is divided into a plurality of segments. Subsequently, each segment whose width is larger than the segment-width threshold calculated from assumed noise data is excluded, being identified as a segment which has originated from a component different from the noise component, i.e. which has originated from the peak component or baseline component. Therefore, even if a portion of the peak component or baseline component passes through the high-pass filter, the segment corresponding to that portion is excluded at this stage. Thus, the noise component is assuredly isolated from the measurement data, so that the noise level can be estimated with high accuracy.
- Preferably, the noise level estimation method according to the present invention may further include:
- e) extracting an outlier from the heights or areas of the plurality of segments included in the first segment group by comparing each of the heights or areas with the noise level obtained by the estimation;
- f) excluding a segment having the outlier from the plurality of segments of the first segment group, to create a second segment group;
- g) determining a noise level based on the heights or areas of the plurality of segments included in the second segment group.
- By excluding an outlier of the height or area of the segment from the estimation of the noise level in this manner, a segment which has originated from a component different from noise yet has not been excluded by a mere comparison of the width can be excluded so as to estimate the noise level with an even higher level of accuracy. The estimation accuracy of the noise level can be further improved by repeating the process of removing a segment having an outlier and estimating the noise level until all outliers are removed or until a predetermined number of repetitions is reached.
- The noise level estimation method according to the present invention may also include:
- h) determining, for each of the plurality of segments in the second waveform data, a segment position representative of the segment concerned;
- i) extracting, for each of the plurality of segments in the second waveform data, target segments which are segments having their respective segment positions located within a predetermined range from the segment position of the segment concerned; and
- j) determining the noise level at the segment position of the segment concerned, based on the heights or areas of the segment concerned and the target segments.
- By estimating, for each of the plurality of segments in the high frequency measurement data, a noise level for a set of segments located within a predetermined range from the segment concerned in the previously described manner, a local noise level at the segment position of each segment can be determined.
- For example, in a gradient analysis in which measurement conditions are temporally changed, the noise level may also temporally change. By estimating, for each of the plurality of segments, the noise level at the segment position of the segment concerned in the previously described manner the noise level can be estimated with high accuracy even in the case where the noise level temporally changes.
- The previously described technique of excluding a segment having an outlier to improve the estimation accuracy of the noise level can also be applied in the determination of the noise level at the segment position of each segment. The estimation accuracy of the noise level can be further improved by repeating the process of excluding a segment having an outlier and estimating the noise level until all outliers are removed or until a predetermined number of repetitions is reached.
- The second aspect of the present invention developed for solving the previously described problem is a measurement data processing device used for estimating a noise level from measurement data containing the three components of a peak component, baseline component and noise component, the device including:
- a) a high-pass filter for attenuating frequency components lower than a predetermined frequency;
- b) a storage section for holding a segment-width threshold, the threshold previously determined by extracting, from assumed noise data purely composed of assumed noise for the measurement data, high frequency noise components by means of the high-pass filter, dividing first waveform data which are waveform data of the high frequency noise components into a plurality of segments so that each section where positive values successively occur or each section where negative values successively occur in the first waveform data is defined as one segment, or so that each section between a local maximum and a local minimum neighboring each other in the first waveform data is defined as one segment, and determining the threshold based on the distribution of the widths of the plurality of segments;
- c) a second waveform data acquirer for extracting high frequency measurement components from the measurement data by means of the high-pass filter, and for acquiring second waveform data which are waveform data of the high frequency measurement components;
- d) a segment divider for dividing the second waveform data into a plurality of segments so that each section where positive values successively occur or each section where negative values successively occur in the second waveform data is defined as one segment, or so that each section between a local maximum and a local minimum neighboring each other in the second waveform data is defined as one segment;
- e) a first segment group creator for excluding each segment having a width larger than the threshold from the plurality of segments obtained by dividing the second waveform data, to create a first segment group; and
- f) a noise level calculator for determining the noise level based on the heights or areas of the plurality of segments included in the first segment group.
- The third aspect of the present invention developed for solving the previously described problem is a program for processing measurement data, used for estimating a noise level from measurement data containing the three components of a peak component, baseline component and noise component, the program characterized by making a computer, provided with a storage section for holding a segment-width threshold and a high-pass filter, function as the second waveform acquirer, the segment divider, the first segment group creator and the noise level calculator described in the second aspect of the present invention.
- With the noise level estimation method, measurement data processing device or program for processing measurement data according to the present invention, the noise component contained in measurement data which include the three components of a peak component, baseline component and noise component can be assuredly isolated, so that the noise level can be estimated with high accuracy.
-
-
Fig. 1 shows waveforms of a peak component, noise component and their sum as well as their respective power spectra. -
Fig. 2 is a configuration diagram of a measurement data processing device according to the first embodiment. -
Fig. 3 is a flowchart in a noise level estimation method according to the first embodiment. -
Fig. 4 shows a distribution of the segment width of normal white noise after a second-order difference calculation. -
Figs. 5A and 5B are the measurement data and first waveform data in the first embodiment, respectively. -
Figs. 6A and 6B illustrate the division into segments and the exclusion of segments in the first embodiment, respectively. -
Fig. 7 is a configuration diagram of a measurement data processing device according to the second embodiment. -
Fig. 8 is a flowchart in a noise level estimation method according to the second embodiment. - Embodiments of the noise level estimation method, measurement data processing device, and program for processing measurement data according to the present invention are hereinafter described with reference to the attached drawings. The following embodiments deal with the case of estimating a noise level which is the magnitude of a noise component contained in a chromatogram acquired using a liquid chromatograph.
-
Fig. 2 shows the configuration of a measurementdata processing device 10 according to the first embodiment. The measurementdata processing device 10 is actually a general-purpose personal computer provided with a central processing unit (CPU) 11,memory 12, display unit (monitor) 13,input unit 14, high-pass filter 15,storage section 16 including a high-volume storage device (e.g. hard disk), communication interface (com. I/F) 17, and other elements. The measurementdata processing device 10 can be connected to a liquid chromatograph (not shown) through thecommunication interface 17. - In the
storage section 16, aprogram 18 for processing measurement data is stored in addition to the OS (operating system). Executing thisprogram 18 for processing measurement data makes theCPU 11 function as an assumednoise data creator 18a, firstwaveform data creator 18b,segment divider 18c,threshold setter 18d, secondwaveform data creator 18e, firstsegment group creator 18f, secondsegment group creator 18g, andnoise level calculator 18h, all of which will be described later. - The noise level estimation method using the measurement
data processing device 10 of the present embodiment is hereinafter described with reference to the flowchart ofFig. 3 . - Initially, based on a user input, the assumed
noise data creator 18a creates assumed noise data which are purely composed of assumed noise for measurement data (Step S1). The assumed noise in the present embodiment is normal white noise. Normal white noise is a type of noise having both the characteristics of white noise which has a constant intensity at all frequencies and those of Gaussian noise (normally distributed noise). The firstwaveform data creator 18b creates first waveform data which are waveform data of high frequency noise components obtained by attenuating low frequency components in the assumed noise data by using the high-pass filter 15 (Step S2). The high-pass filter 15 in the present embodiment is a second-order difference filter. A set of data different from those created from the normal white noise may also be used as the assumed noise data, such as a set of data created from colored noise, such as pink noise or brown noise, or a set of actually measured noise data. - After the first waveform data are created, the
segment divider 18c divides the first waveform data into a plurality of segments so that each section where positive values successively occur or each section where negative values successively occur in the first waveform data is defined as one segment (Step S3). Then, thethreshold setter 18d creates a distribution of the widths of those segments (Fig. 4 ) and sets the segment-width threshold based on that distribution (Step S4). In the present embodiment, the largest value in the distribution of the segment width, i.e. six (arbitrary unit in the time-axis direction), is set as the threshold, and this value is saved in thestorage section 16. It should be noted that the threshold set by Steps S1 through S4 can be applied to a plurality of sets of chromatogram data. Accordingly, by previously setting the threshold and saving it in thestorage section 16, a noise component can be estimated from each of the plurality of sets of chromatogram data by merely performing Step S6 and subsequent steps, which will be hereinafter described. - Subsequently, the second
waveform data creator 18e reads measurement data of a chromatogram previously stored in the storage section 16 (Fig. 5A ), and creates second waveform data, which are waveform data of high frequency measurement components, using the high-pass filter 15 (Step S5;Fig. 5B ). After the second waveform data are created, thesegment divider 18c divides the second waveform data into a plurality of segments so that each section where positive values successively occur or each section where negative values successively occur in the second waveform data is defined as one segment (Step S6;Fig. 6A ). Then, the firstsegment group creator 18f compares the width of each of the segments in the second waveform data with the segment-width threshold which has been set from the first waveform data, and excludes each segment having a width larger than the threshold, to create a first segment group (Step S7;Fig. 6B ). Step S7 is a process for excluding a peak component or baseline component based on the fact that a segment which corresponds to a peak component or baseline component that has passed through the high-pass filter has a larger width than that of a segment which originates from the noise component. - After the first segment group is created, the
noise level calculator 18h computes the area of each of the segments included in the first segment group and sets the average of the computed areas as the segment-area reference value. Then, the secondsegment group creator 18g compares the area of each segment in the first segment group with the segment area reference value, extracts outliers included within a certain proportion (e.g. 5 %) of the total number of the segments in descending order of the difference from the area reference value, and excludes the segments corresponding to the outliers (Step S8), to create a second segment group (StepS9). For example, the extraction of the outliers can be achieved, for example, by regarding any value larger than the average + Nσ of the segment areas of the segments as an outlier (where N is a positive integer, and σ is the unbiased standard deviation). As for N, a suitable value for each set of measurement data can be used taking into account the distribution of the segment-area values. - The segment-area value may be the median of the distribution of the segment areas of the segments. In this case, the extraction of the outliers can be achieved, for example, by regarding any value larger than the median + M×MAD (median absolute deviation) of the areas of the segments as an outlier (where M is a positive integer).
- The extraction of the outliers can also be achieved by various other methods, e.g. by extracting any value whose difference from the area reference value is larger than a previously set value.
- The process of Steps S7 through S9 is intended for removing the influence of a noise component having a singular magnitude caused by an accidental factor during the measurement. In the process of removing the influence of a noise component having a singular magnitude, an extremely small area value of the segment may also be treated as an outlier, in which case any value which does not fall within the range given by the average value ± Nσ of the segment areas, or the median ± M×MAD of the segment areas, can be regarded as an outlier.
- Those steps also remove segments which have originated from a peak or baseline yet have not been excluded by the process using the threshold of the width.
- After the second segment group is created, the noise level calculator once more computes the area of each segment included in the second segment group, and sets the average of the computed areas as the segment area reference value (Step S10). Then, based on this segment area reference value, the noise level calculator determines whether or not an outlier exists among the area values of the segments. If no outlier exists ("YES" in Step S11), the noise level calculator computes the noise level from the latest segment area reference value. If an outlier still exists ("NO" in Step S11), the extraction and exclusion of an outlier (Step S8) is once more performed by the second
segment group creator 18g to create the second segment group (Step S9), and the segment area reference value is newly set (Step S10). Such a process is repeated until all outliers are removed. After that, the noise level is calculated. - If the value of N or M included in the calculation formula of the boundary value used for the extraction of the outliers is small, it may be impossible to remove all outliers by the repetition of Steps S8 through S10. To deal with such a case, the device may be configured to calculate the noise level, regardless of whether or not an outlier exists, after the number of repetitions of Steps S8 through S10 has reached a predetermined number (e.g. five).
- The process from Steps S8 through S11 is intended for a high-accuracy calculation of the noise level and is not indispensable for the present invention. That is to say, the noise level may be directly calculated from the areas of the segments in the first segment group.
- Thus, with the noise level estimation method, measurement data processing device and program for processing measurement data according to the first embodiment, even if a portion of the peak component or baseline component passes through the high-pass filter, the segment corresponding to that portion is excluded. Therefore, the noise component can be assuredly isolated from the measurement data, so that the noise level can be estimated with high accuracy. Additionally, according to the first embodiment, by excluding an outlier of the segment area from the estimation of the noise level, a segment which has originated from a component different from noise yet has not been excluded by a mere comparison of the width can be excluded, so that the noise level can be estimated with an even higher level of accuracy. It should be noted that, as opposed to the previous example in which the segment (area) reference value and the noise level are determined based on the area values of the segments, the segment (height) reference value and the noise level may be determined from the heights of the segments.
-
Fig. 7 shows the configuration of a measurement data processing device 10a according to the second embodiment. The same components as described in the first embodiment are denoted by the same numerals and will not be described. In the second embodiment, executing theprogram 181 for processing measurement data makes theCPU 11 function as an assumednoise data creator 18a, firstwaveform data creator 18b,segment divider 18c,threshold setter 18d, secondwaveform data creator 18e, firstsegment group creator 18f,segment position determiner 18j,target segment extractor 18k andnoise level calculator 18h, all of which will be described later. - The noise level estimation method using the measurement
data processing device 10 of the present embodiment is hereinafter described with reference to the flowchart ofFig. 8 . The same processes as described in the first embodiment are denoted by the same numerals and will not be described. - The setting of the segment-width threshold using assumed noise data (Steps S1 through S4) and the creation of the first segment group which is a set of waveform data of high frequency components (Steps S5 through S7) are the same as in the first embodiment. The second embodiment is characterized by the subsequent Steps S21 through S27.
- After the first segment group is created, the
segment position determiner 18j designates, for each of the segments in the first segment group, the central position of the segment concerned as the segment position (Step S21). Subsequently, for one segment (which is hereinafter called the "segment in question") among those segments, thetarget segment extractor 18k extracts, as the target segments, one or more segments having their respective segment positions located within a preciously set range from the segment position of the segment in question (Step S22). Then, thenoise level calculator 18h computes the noise level at the segment position of the segment in question based on the average (or median or the like) of the areas (or heights) of the target segments and the segment in question (Step 25). - Steps S22 through S25 are performed for every segment in the first segment group. After the calculation of the noise level at the segment position of each segment is completed for all segments ("YES" in Step S26), the noise level at the segment position of each segment excluded from the creation of the first segment group (i.e. each segment originating from the peak component or baseline component) is interpolated (Step S27). The interpolation of the noise level can be performed by an appropriate method for the mode of change in the noise level, such as the linear interpolation or spline interpolation.
- Thus, with the noise level estimation method, measurement data processing device and program for processing measurement data according to the second embodiment, the peak component and baseline component can be assuredly excluded, and furthermore, the noise level at each position on the chromatogram can be calculated. Such a method or device according to the second embodiment can be suitably used in the case where the noise level fluctuates due to the measurement system, e.g. in a chromatogram obtained by a gradient analysis in which the baseline component easily fluctuates, causing a corresponding fluctuation in the noise level.
- Both of the first and second embodiments are mere examples and can be appropriately changed in line with the gist of the present invention.
- The previously described embodiments have been divided into two embodiments in order to separately describe their respective configurations and steps. It is also possible to configure a device which includes the configurations and steps of both of the first and second embodiments. With this configuration, it is possible to determine the noise level at each position on a chromatogram as well as improve the accuracy of that noise level.
- The previously described embodiments are concerned with the case of processing a chromatogram obtained with a liquid chromatograph. The present invention can be used to determine not only the noise level in a chromatogram obtained with a liquid chromatograph or gas chromatograph but also in various other kinds of measurement data, such as a spectrum obtained by a spectrometric measurement.
- In the previous embodiments, each section where positive values successively occur or each section where negative values successively occur in the waveform data of high frequency components extracted by using a second-order difference filter is defined as one segment. Other kinds of high-pass filters may also be used to extract high frequency components. It should be noted that a section where positive values successively occur (or a section where negative values successively occur) in the waveform data of high frequency components extracted by using an nth-order difference filter (where n is an integer equal to or greater than two) corresponds to a section between a local maximum and a local minimum neighboring each other in the waveform data of high frequency components extracted by using an n+1st-order difference filter. That is to say, the previously described processing of measurement data can be similarly performed by dividing the waveform data into segments so that each section between a local maximum and a local minimum neighboring each other is defined as one segment, instead of defining each section where positive values successively occur (or each section where negative values successively occur) as one segment.
-
- 10, 10a...
- Measurement Data Processing Device
- 11...
- CPU
- 12...
- Memory
- 13 ...
- Display Unit
- 14...
- Input Unit
- 15...
- High-Pass Filter
- 16...
- Storage Section
- 18, 181...
- Program for Processing Measurement Data
18a... Assumed Noise Data Creator
18b... First Waveform Data Creator
18c... Segment Divider
18d... Threshold Setter
18e... Second Waveform Data Creator
18f... First Segment Group Creator
18g... Second Segment Group Creator
18h... Noise Level Calculator
18j... Segment Position Determiner
18k... Target Segment Extractor - 17...
- Communication Interface
Claims (7)
- A noise level estimation method for estimating a noise level representing a magnitude of a noise component from measurement data containing three components of a peak component, baseline component and noise component, the method comprising:a) extracting, from assumed noise data purely composed of assumed noise for the measurement data, high frequency noise components by means of a high-pass filter which reduces frequency components lower than a predetermined frequency, dividing first waveform data which are waveform data of the high frequency noise components into a plurality of segments so that each section where positive values successively occur or each section where negative values successively occur in the first waveform data is defined as one segment, or so that each section between a local maximum and a local minimum neighboring each other in the first waveform data is defined as one segment, and determining a segment-width threshold based on a distribution of widths of the plurality of segments;b) extracting high frequency measurement components from the measurement data by means of the high-pass filter, and dividing second waveform data which are waveform data of the high frequency measurement components into a plurality of segments so that each section where positive values successively occur or each section where negative values successively occur in the second waveform data is defined as one segment, or so that each section between a local maximum and a local minimum neighboring each other in the second waveform data is defined as one segment;c) excluding each segment having a width larger than the threshold from the plurality of segments obtained by dividing the second waveform data, to create a first segment group formed by the remaining segments; andd) determining the noise level based on heights or areas of the plurality of segments included in the first segment group.
- The noise level estimation method according to claim 1, further comprising:e) extracting an outlier from the heights or areas of the plurality of segments included in the first segment group by comparing each of the heights or areas with the noise level;f) excluding a segment having the outlier from the plurality of segments of the first segment group, to create a second segment group;g) determining a noise level based on the heights or areas of the plurality of segments included in the second segment group.
- The noise level estimation method according to claim 1, further comprising:h) determining, for each of the plurality of segments in the first segment group, a segment position representative of the segment concerned;i) extracting, for each of the plurality of segments in the first segment group, target segments which are segments having their respective segment positions located within a predetermined range from the segment position of the segment concerned; andj) determining a noise level at the segment position of the segment concerned, based on the heights or areas of the segment concerned and the target segments.
- The noise level estimation method according to claim 3, further comprising:k) extracting an outlier from the heights or areas of the target segments by comparing each of the heights or areas with the height or area of the segment concerned;1) excluding a segment having the outlier from the segment concerned or the target segments, to create a second segment group;m) determining a noise level at the segment position of the segment concerned, based on the heights or areas of the segments included in the second segment group.
- The noise level estimation method according to claim 2 or 4, wherein:the noise level is determined after a process including steps of extracting an outlier from the heights or areas of the segments included in the second segment group and removing a segment corresponding to the outlier to newly create the second segment group is repeated until all outliers are removed or until a predetermined number of repetitions is reached.
- A measurement data processing device used for estimating a noise level from measurement data containing three components of a peak component, baseline component and noise component, the device comprising:a) a high-pass filter for reducing frequency components lower than a predetermined frequency;b) a storage section for holding a segment-width threshold, the threshold previously determined by extracting, from assumed noise data purely composed of assumed noise for the measurement data, high frequency noise components by means of the high-pass filter, dividing first waveform data which are waveform data of the high frequency noise components into a plurality of segments so that each section where positive values successively occur or each section where negative values successively occur in the first waveform data is defined as one segment, or so that each section between a local maximum and a local minimum neighboring each other in the first waveform data is defined as one segment, and determining the threshold based on a distribution of widths of the plurality of segments;c) a second waveform data acquirer for extracting high frequency measurement components from the measurement data by means of the high-pass filter, and for acquiring second waveform data which are waveform data of the high frequency measurement components;d) a segment divider for dividing the second waveform data into a plurality of segments so that each section where positive values successively occur or each section where negative values successively occur in the second waveform data is defined as one segment, or so that each section between a local maximum and a local minimum neighboring each other in the second waveform data is defined as one segment;e) a first segment group creator for excluding each segment having a width larger than the threshold from the plurality of segments obtained by dividing the second waveform data, to create a first segment group; andf) a noise level calculator for determining the noise level based on heights or areas of the plurality of segments included in the first segment group.
- A program for processing measurement data, used for estimating a noise level from measurement data containing three components of a peak component, baseline component and noise component, the program characterized by making a computer, provided with a storage section for holding a segment-width threshold and a high-pass filter, function as the second waveform acquirer, the segment divider, the first segment group creator and the noise level calculator described in claim 6.
Applications Claiming Priority (1)
| Application Number | Priority Date | Filing Date | Title |
|---|---|---|---|
| PCT/JP2015/051973 WO2016120959A1 (en) | 2015-01-26 | 2015-01-26 | Noise level estimation method, measurement data processing device, and program for measurement data processing |
Publications (2)
| Publication Number | Publication Date |
|---|---|
| EP3252465A1 true EP3252465A1 (en) | 2017-12-06 |
| EP3252465A4 EP3252465A4 (en) | 2018-01-17 |
Family
ID=56542619
Family Applications (1)
| Application Number | Title | Priority Date | Filing Date |
|---|---|---|---|
| EP15879857.9A Withdrawn EP3252465A4 (en) | 2015-01-26 | 2015-01-26 | Noise level estimation method, measurement data processing device, and program for measurement data processing |
Country Status (5)
| Country | Link |
|---|---|
| US (1) | US10359404B2 (en) |
| EP (1) | EP3252465A4 (en) |
| JP (1) | JP6458812B2 (en) |
| CN (1) | CN107209157B (en) |
| WO (1) | WO2016120959A1 (en) |
Families Citing this family (6)
| Publication number | Priority date | Publication date | Assignee | Title |
|---|---|---|---|---|
| WO2016132422A1 (en) * | 2015-02-16 | 2016-08-25 | 株式会社島津製作所 | Noise level estimation method, measurement data processing device, and program for measurement data processing |
| WO2018004623A1 (en) * | 2016-06-30 | 2018-01-04 | Intel Corporation | Sensor based data set method and apparatus |
| CN109714821B (en) * | 2017-10-23 | 2020-09-29 | 深圳市优必选科技有限公司 | Method and device for selecting wireless positioning and ranging base station |
| JP7324050B2 (en) * | 2019-05-27 | 2023-08-09 | 株式会社東芝 | Waveform segmentation device and waveform segmentation method |
| CN114444542A (en) * | 2022-01-10 | 2022-05-06 | 中国科学院苏州生物医学工程技术研究所 | Liquid chromatography peak noise estimation method, device, storage medium and system |
| CN117314790B (en) * | 2023-11-23 | 2024-02-13 | 奥谱天成(湖南)信息科技有限公司 | Hyperspectral image noise processing method |
Family Cites Families (14)
| Publication number | Priority date | Publication date | Assignee | Title |
|---|---|---|---|---|
| JPS62291562A (en) * | 1986-06-11 | 1987-12-18 | Hitachi Ltd | Chromatographic data processing method |
| JPH051953A (en) * | 1991-06-24 | 1993-01-08 | Shimadzu Corp | Peak judging method |
| JPH0798270A (en) | 1993-09-29 | 1995-04-11 | Shimadzu Corp | Flow-through type UV-visible spectrophotometer |
| US5966684A (en) * | 1995-11-09 | 1999-10-12 | Richardson; Thomas L. | Method and apparatus for cancelling periodic electrical interference |
| US5748491A (en) * | 1995-12-20 | 1998-05-05 | The Perkin-Elmer Corporation | Deconvolution method for the analysis of data resulting from analytical separation processes |
| US6112161A (en) * | 1997-09-17 | 2000-08-29 | Hewlett-Packard | Method, apparatus, and article of manufacture for enhanced intergration of signals |
| JP4016831B2 (en) * | 2002-12-26 | 2007-12-05 | 株式会社大林組 | Wavelet transform method for wall peeling diagnosis and apparatus for wall peeling diagnosis |
| US20050285023A1 (en) * | 2004-06-23 | 2005-12-29 | Lambda Solutions, Inc. | Automatic background removal for input data |
| JP2009008582A (en) * | 2007-06-29 | 2009-01-15 | Shimadzu Corp | Chromatogram data processor |
| US20100283785A1 (en) * | 2009-05-11 | 2010-11-11 | Agilent Technologies, Inc. | Detecting peaks in two-dimensional signals |
| DE102009035587B3 (en) * | 2009-07-31 | 2011-03-24 | Siemens Aktiengesellschaft | Method for filtering a chromatogram |
| WO2011106527A2 (en) * | 2010-02-24 | 2011-09-01 | Ampersand International, Inc. | Method for noise filtering based on confidence interval evaluation |
| CN102998296B (en) * | 2012-11-28 | 2014-10-29 | 中国科学院重庆绿色智能技术研究院 | Raman spectra pretreatment method for removing effects of background noises |
| JP2014137350A (en) * | 2013-01-18 | 2014-07-28 | Hitachi High-Technologies Corp | Method for removing noise of chromatogram, and chromatography apparatus |
-
2015
- 2015-01-26 US US15/544,036 patent/US10359404B2/en active Active
- 2015-01-26 CN CN201580073796.6A patent/CN107209157B/en active Active
- 2015-01-26 EP EP15879857.9A patent/EP3252465A4/en not_active Withdrawn
- 2015-01-26 WO PCT/JP2015/051973 patent/WO2016120959A1/en not_active Ceased
- 2015-01-26 JP JP2016571512A patent/JP6458812B2/en active Active
Also Published As
| Publication number | Publication date |
|---|---|
| EP3252465A4 (en) | 2018-01-17 |
| CN107209157A (en) | 2017-09-26 |
| JPWO2016120959A1 (en) | 2017-06-29 |
| CN107209157B (en) | 2019-04-02 |
| US10359404B2 (en) | 2019-07-23 |
| US20180011067A1 (en) | 2018-01-11 |
| WO2016120959A1 (en) | 2016-08-04 |
| JP6458812B2 (en) | 2019-01-30 |
Similar Documents
| Publication | Publication Date | Title |
|---|---|---|
| US10359404B2 (en) | Noise level estimation method, measurement data processing device and program for processing measurement data | |
| US20190064130A1 (en) | Peak detection method and data processing device | |
| CN105105737A (en) | Motion state heart rate monitoring method based on photoplethysmography and spectrum analysis | |
| US20160025691A1 (en) | Chromatography/mass spectrometry data processing device | |
| EP3736567A1 (en) | Data processing method for chromatograph mass spectrometry, chromatograph mass spectrometer, and program for processing chromatograph mass spectrometry data | |
| CN107860845B (en) | A method for accurate identification of compounds by automatic resolution of overlapping peaks by GC-MS | |
| JP2015049136A5 (en) | ||
| US20240345046A1 (en) | Waveform-analyzing method, waveform-analyzing device, and analyzing system | |
| CN114391099B (en) | Waveform analysis methods and waveform analysis devices | |
| Seraj et al. | Robust electroencephalogram phase estimation with applications in brain-computer interface systems | |
| CN110234991A (en) | Spectrum data processing device | |
| JP2013101039A5 (en) | ||
| JP6060793B2 (en) | Peak detector | |
| US11187685B2 (en) | Noise level estimation method, measurement data processing device, and program for processing measurement data | |
| CN109219748B (en) | Peak detection method and data processing apparatus | |
| JP6256162B2 (en) | Signal waveform data processing device | |
| US20080073499A1 (en) | Peak finding in low-resolution mass spectrometry by use of chromatographic integration routines | |
| EP3486641B1 (en) | Data processing apparatus and data processing method | |
| US20220308013A1 (en) | Method for correcting data related to electrophoresis, method for determining whether peak is sample-derived peak or spike, apparatus, and program | |
| US11321425B2 (en) | Method and device for processing data | |
| JP6680139B2 (en) | Data smoothing method and program for executing the method | |
| Berrier et al. | Examination of the two-dimensional mass channel cluster plot method for gas chromatography–mass spectrometry in the context of the statistical model of overlap | |
| CN121007866A (en) | Analysis based on multiplicative scattering correction for endpoint detection of dynamic processes | |
| RU2015148529A (en) | METHOD FOR MEASURING THE CHARACTERISTICS OF THE ISOTOPE SYSTEM OF THE SAMPLE IN STEP-BY-STEP SELECTION OF ANALYZED SUBSTANCE (OPTIONS) | |
| JP2019020800A (en) | Support apparatus and support method |
Legal Events
| Date | Code | Title | Description |
|---|---|---|---|
| PUAI | Public reference made under article 153(3) epc to a published international application that has entered the european phase |
Free format text: ORIGINAL CODE: 0009012 |
|
| 17P | Request for examination filed |
Effective date: 20170810 |
|
| AK | Designated contracting states |
Kind code of ref document: A1 Designated state(s): AL AT BE BG CH CY CZ DE DK EE ES FI FR GB GR HR HU IE IS IT LI LT LU LV MC MK MT NL NO PL PT RO RS SE SI SK SM TR |
|
| AX | Request for extension of the european patent |
Extension state: BA ME |
|
| A4 | Supplementary search report drawn up and despatched |
Effective date: 20171214 |
|
| RIC1 | Information provided on ipc code assigned before grant |
Ipc: G01N 30/86 20060101AFI20171208BHEP |
|
| DAX | Request for extension of the european patent (deleted) | ||
| STAA | Information on the status of an ep patent application or granted ep patent |
Free format text: STATUS: THE APPLICATION HAS BEEN WITHDRAWN |
|
| 18W | Application withdrawn |
Effective date: 20191224 |