EP3249392A1 - Crystalline phase identification method, crystalline phase identification device, and x-ray diffraction measurement system - Google Patents
Crystalline phase identification method, crystalline phase identification device, and x-ray diffraction measurement system Download PDFInfo
- Publication number
- EP3249392A1 EP3249392A1 EP17167900.4A EP17167900A EP3249392A1 EP 3249392 A1 EP3249392 A1 EP 3249392A1 EP 17167900 A EP17167900 A EP 17167900A EP 3249392 A1 EP3249392 A1 EP 3249392A1
- Authority
- EP
- European Patent Office
- Prior art keywords
- diffraction patterns
- data
- intensity
- crystalline phase
- phase identification
- Prior art date
- Legal status (The legal status is an assumption and is not a legal conclusion. Google has not performed a legal analysis and makes no representation as to the accuracy of the status listed.)
- Granted
Links
Images











Classifications
-
- G—PHYSICS
- G01—MEASURING; TESTING
- G01N—INVESTIGATING OR ANALYSING MATERIALS BY DETERMINING THEIR CHEMICAL OR PHYSICAL PROPERTIES
- G01N23/00—Investigating or analysing materials by the use of wave or particle radiation, e.g. X-rays or neutrons, not covered by groups G01N3/00 – G01N17/00, G01N21/00 or G01N22/00
- G01N23/20—Investigating or analysing materials by the use of wave or particle radiation, e.g. X-rays or neutrons, not covered by groups G01N3/00 – G01N17/00, G01N21/00 or G01N22/00 by using diffraction of the radiation by the materials, e.g. for investigating crystal structure; by using scattering of the radiation by the materials, e.g. for investigating non-crystalline materials; by using reflection of the radiation by the materials
- G01N23/207—Diffractometry using detectors, e.g. using a probe in a central position and one or more displaceable detectors in circumferential positions
-
- G—PHYSICS
- G01—MEASURING; TESTING
- G01N—INVESTIGATING OR ANALYSING MATERIALS BY DETERMINING THEIR CHEMICAL OR PHYSICAL PROPERTIES
- G01N23/00—Investigating or analysing materials by the use of wave or particle radiation, e.g. X-rays or neutrons, not covered by groups G01N3/00 – G01N17/00, G01N21/00 or G01N22/00
- G01N23/20—Investigating or analysing materials by the use of wave or particle radiation, e.g. X-rays or neutrons, not covered by groups G01N3/00 – G01N17/00, G01N21/00 or G01N22/00 by using diffraction of the radiation by the materials, e.g. for investigating crystal structure; by using scattering of the radiation by the materials, e.g. for investigating non-crystalline materials; by using reflection of the radiation by the materials
-
- G—PHYSICS
- G01—MEASURING; TESTING
- G01N—INVESTIGATING OR ANALYSING MATERIALS BY DETERMINING THEIR CHEMICAL OR PHYSICAL PROPERTIES
- G01N2223/00—Investigating materials by wave or particle radiation
- G01N2223/05—Investigating materials by wave or particle radiation by diffraction, scatter or reflection
- G01N2223/056—Investigating materials by wave or particle radiation by diffraction, scatter or reflection diffraction
- G01N2223/0566—Investigating materials by wave or particle radiation by diffraction, scatter or reflection diffraction analysing diffraction pattern
-
- G—PHYSICS
- G01—MEASURING; TESTING
- G01N—INVESTIGATING OR ANALYSING MATERIALS BY DETERMINING THEIR CHEMICAL OR PHYSICAL PROPERTIES
- G01N2223/00—Investigating materials by wave or particle radiation
- G01N2223/30—Accessories, mechanical or electrical features
- G01N2223/304—Accessories, mechanical or electrical features electric circuits, signal processing
-
- G—PHYSICS
- G01—MEASURING; TESTING
- G01N—INVESTIGATING OR ANALYSING MATERIALS BY DETERMINING THEIR CHEMICAL OR PHYSICAL PROPERTIES
- G01N2223/00—Investigating materials by wave or particle radiation
- G01N2223/40—Imaging
- G01N2223/401—Imaging image processing
-
- G—PHYSICS
- G01—MEASURING; TESTING
- G01N—INVESTIGATING OR ANALYSING MATERIALS BY DETERMINING THEIR CHEMICAL OR PHYSICAL PROPERTIES
- G01N2223/00—Investigating materials by wave or particle radiation
- G01N2223/60—Specific applications or type of materials
- G01N2223/605—Specific applications or type of materials phases
-
- G—PHYSICS
- G01—MEASURING; TESTING
- G01N—INVESTIGATING OR ANALYSING MATERIALS BY DETERMINING THEIR CHEMICAL OR PHYSICAL PROPERTIES
- G01N2223/00—Investigating materials by wave or particle radiation
- G01N2223/60—Specific applications or type of materials
- G01N2223/606—Specific applications or type of materials texture
-
- G—PHYSICS
- G01—MEASURING; TESTING
- G01N—INVESTIGATING OR ANALYSING MATERIALS BY DETERMINING THEIR CHEMICAL OR PHYSICAL PROPERTIES
- G01N2223/00—Investigating materials by wave or particle radiation
- G01N2223/60—Specific applications or type of materials
- G01N2223/62—Specific applications or type of materials powders
Definitions
- the present invention relates to a crystalline phase identification method, a crystalline phase identification device, and an X-ray diffraction measurement system for identifying a crystalline phase contained in a sample composed of a powdery crystal or a polycrystalline substance from X-ray diffraction data of the sample.
- X-ray diffraction measurement for handling powdery crystals or polycrystalline substance as a sample is called X-ray powder diffractometry.
- An X-ray diffraction pattern of a sample obtained by measurement using an X-ray diffractometer is characteristic for each crystalline phase.
- a crystalline phase contained in a sample can be identified by analysis of the X-ray diffraction pattern.
- the term 'crystalline phase' refers to the crystal structure and chemical composition of a substance which is crystalline.
- JP-A 2014-178203 discloses a technique for carrying out a qualitative analysis for identifying a crystalline phase contained in a sample with good precision on the basis of the powder diffraction pattern of a sample.
- a lattice plane having an angle that satisfies diffraction conditions must be present.
- X-rays diffracted by a lattice plane at a diffraction angle of 2 ⁇ proceed along the generating line of a cone in which the half apex angle is 2 ⁇ when 2 ⁇ ⁇ 90°, and proceed along the generating line of a cone in which the half apex angle is (180°-2 ⁇ ) when 2 ⁇ > 90°.
- X-rays diffracted by a sample composed of powdery crystal or a polycrystalline substance form numerous cones having different central angles.
- Debye-Scherrer rings obtained by X-ray powder diffractometry include a plurality of rings. Uniformity in the circumferential direction of the rings (i.e., the diffraction pattern) reflects the state of particles contained in a sample. When there are lattice planes that yield a diffraction pattern in which intensity is uniform in the circumferential direction and lattice planes that yield a diffraction pattern in which intensity is not uniform in the circumferential direction, the states of grains that contain these lattice planes are different from each other.
- Qualitative analysis is an example of an analytic method for identifying a crystalline phase.
- the two-dimensional data of an X-ray diffraction pattern of a sample is converted to "diffraction angle 2 ⁇ versus intensity I data" to create a "diffraction angle 2 ⁇ versus intensity I profile.”
- the position and intensity of peaks in the "profile of the diffraction angle 2 ⁇ versus intensity I profile" are detected.
- Diffraction angle 2 ⁇ versus intensity I data may hereinafter be referred to as "2 ⁇ -I data.”
- the "diffraction angle 2 ⁇ versus intensity I profile” may hereinafter be referred to as the "2 ⁇ -I profile.”
- a system for carrying out a qualitative analysis has a database. "Peak position" data and data for the "ratio of the peak intensity between a plurality of diffraction patterns" in an X-ray diffraction pattern are registered in the database.
- the "ratio of the peak intensity between a plurality of diffraction patterns” may hereinafter be referred to as "peak intensity ratio.”
- a system for carrying out a qualitative analysis performs a search in accordance with installed software. Specifically, data related to a plurality of known crystalline phases registered in the database is searched, and candidates of crystalline phases contained in a sample are extracted on the basis of the position of peaks detected from the sample and the peak intensity ratio detected from the sample, like the position of peaks.
- the search using the database in this case may be referred to as "search and match.”
- the uniformity of diffraction patterns in the circumferential direction is not taken into consideration when search conditions are set by software during a search and match. Accordingly, it may be possible for unintended crystalline phase candidates to be listed in the search results on the basis of diffraction pattern groups that are not attributable to the same crystalline phase, and, consequently, diffraction pattern groups having different uniformities in the circumferential direction.
- An object of the present invention is to carry out a search of crystalline phase candidates with good precision in identification of crystalline phases and improve analysis precision.
- the crystalline phase identification method of the present invention identifies a crystalline phase contained in a sample, from X-ray diffraction data of the sample which contain data of a plurality of ring-shaped diffraction patterns, using a database in which are registered data related to peak positions of X-ray diffraction patterns for a plurality of crystalline phases and data related to peak intensity ratios of X-ray diffraction patterns for a plurality of crystalline phases. Peak positions and peak intensities for a plurality of the diffraction patterns are detected from the X-ray diffraction data. The circumferential angle versus intensity data for a plurality of the diffraction patterns are created from the X-ray diffraction data.
- the diffraction patterns are grouped into a plurality of clusters (namely, groups) on the basis of the circumferential angle ( ⁇ ) versus intensity (I) data thus created. Crystalline phase candidates contained in the sample are searched from the database on the basis of sets of ratios of peak positions and peak intensities of the diffraction patterns grouped into the same cluster.
- the crystalline phase identification device of the present invention identifies a crystalline phase contained in a sample, from X-ray diffraction data of the sample which contain data of a plurality of ring-shaped diffraction patterns, using a database in which are registered data related to peak positions of X-ray diffraction patterns for a plurality of crystalline phases and data related to peak intensity ratios of X-ray diffraction patterns for a plurality of crystalline phases.
- the crystalline phase identification device comprises: detection means for detecting peak positions and peak intensities for a plurality of the diffraction patterns from the X-ray diffraction data, and creating circumferential angle versus intensity data of the diffraction patterns; clustering means for grouping the diffraction patterns into a plurality of clusters on the basis of the circumferential angle ( ⁇ ) versus intensity (I) data thus created by the detection means; and searching means for searching for crystalline phase candidates contained in the sample from the database on the basis of sets of ratios of peak positions and peak intensities of the diffraction patterns grouped into the same cluster by the clustering means.
- ring characteristic factors representing homogeneity of intensity in the circumferential direction of the diffraction patterns are determined from the circumferential angle versus intensity data of the diffraction patterns, and the diffraction patterns are grouped into a plurality of clusters in accordance with the ring characteristic factors thus determined.
- ring characteristic factor is a neologism in the present specification.
- the term “ring characteristic factor” refers to an element that expresses the homogeneity of intensity of diffraction patterns in the circumferential direction. The uniformity of diffraction patterns in the circumferential direction is made clear by ring characteristic factors. Therefore, the diffraction patterns are grouped into a plurality of clusters in accordance with the determined ring characteristic factors, whereby diffraction patterns having different uniformity in the circumferential direction can be grouped into a plurality of clusters.
- an intensity range, a standard variance, a standard deviation, or a coefficient of variation, where intensity is a variate are calculated as the ring characteristic factors from the circumferential angle versus intensity data of the diffraction patterns.
- Calculating the intensity range, standard variance, standard deviation, or coefficient of variation as ring characteristic factors allows the degree of uniformity of diffraction patterns in the circumferential direction to be quantified.
- a number of peaks and a peak width in a circumferential angle versus intensity profile are calculated as the ring characteristic factors from the circumferential angle versus intensity data of the diffraction patterns.
- Using the number of peaks and the peak width in a circumferential angle versus intensity profile as the ring characteristic factors allows diffraction patterns in which the intensity range, standard variance, standard deviation, or coefficient of variation are about the same value to be grouped into different clusters from differences in the number of peaks and the peak width.
- an intensity histogram is created as the ring characteristic factor from the circumferential angle versus intensity data of the diffraction patterns.
- an intensity histogram as the ring characteristic factor allows diffraction patterns in which the intensity range, standard variance, standard deviation, or coefficient of variation are about the same value to be grouped into different clusters from differences in the histogram. Diffraction patterns in which the number of peaks in the circumferential angle versus intensity profile is calculated to be "0" can also be grouped by differences in the histogram.
- a skewness, kurtosis, or normalized average X norm of the intensity distribution are calculated as the ring characteristic factors from the circumferential angle versus intensity data of the diffraction patterns.
- a skewness, kurtosis, or normalized average X norm of the intensity distribution as the ring characteristic factors allows characteristics of the intensity distribution to be quantified and used in clustering.
- the X-ray diffraction measurement system of the present invention comprises an X-ray diffractometer for measuring the X-ray diffraction data of a sample, and the crystalline phase identification device of any of the above-described aspects.
- a search for crystalline phase candidates can be carried out with good precision in the identification of a crystalline phase, and analysis precision can be enhanced.
- FIG. 1A is a block diagram showing a schematic configuration of an embodiment of an X-ray diffraction measurement system of the present invention.
- the X-ray diffraction measurement system comprises an X-ray diffractometer 10, a crystalline phase identification device 20, and a display device 30.
- the display device 30 is composed of, e.g., a flat panel display device or the like.
- the display device 30 may be integrally configured with the crystalline phase identification device 20.
- FIG. 1B is a diagram showing a schematic configuration of the X-ray diffractometer.
- the X-ray diffractometer 10 is configured to include a goniometer 12, an X-ray generator 13, a collimator 14, an X-ray detector 15, a control unit 16, and an input/output device 17.
- the goniometer 12 is an angle-measuring instrument.
- a sample stage for mounting and rotating a sample 11 is disposed in the center part of the goniometer 12.
- X-rays generated from the X-ray generator 13 are passed through the collimator 14 having a pinhole to form a narrow beam-like flux and are irradiated on the sample 11.
- the X-ray detector 15 detects X-rays diffracted by the sample 11.
- the control unit 16 is composed of a computer, a sequencer, a dedicated circuit, or the like, and controls the goniometer 12, the X-ray generator 13, and the X-ray detector 15.
- the input/output device 17 inputs measurement conditions or the like to the control unit 16, and outputs X-ray diffraction data detected by the X-ray detector 15 to the crystalline phase identification device 20.
- FIG. 1B shows a reflective-type X-ray diffractometer, but in lieu thereof, the device may be a transmission-type X-ray diffractometer.
- the X-ray detector is not limited to being a two-dimensional detector, and it is also possible to use a zero-dimensional detector or a one-dimensional detector. In such a case, it is necessary to move, e.g., rotate the sample or detector in relation to the center line of the sample.
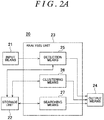
- FIG. 2A is a block diagram showing a schematic configuration of an embodiment of a crystalline phase identification device 20 of the present invention.
- the crystalline phase identification device 20 is configured to include input means 21, a storage unit 22, an analysis unit 23, and output means 24.
- the crystalline phase identification device 20 can be realized by a typical computer.
- the input means 21 and the output means 24 may be constituted by, e.g., an input/output interface or the like.
- the storage unit 22 may be constituted by, e.g., a hard disk, a memory, or the like.
- the analysis unit 23 may be constituted by, e.g., a CPU or the like.
- a database is stored in the storage unit 22.
- Data related to known X-ray diffraction patterns of a plurality of crystalline phases is registered in the database. Specifically, the data of peak positions and peak intensity ratios in a 2 ⁇ -I profile derived from the X-ray diffraction patterns of a plurality of crystalline phases are registered. More specifically, the data of the peak positions and peak intensity ratios are registered as data of the distance "d" versus intensity ratio "I" of the lattice plane (i.e., d-I data).
- the storage unit 22 may be an external hard disk or the like.
- Analysis unit 23 is configured to include detection means 25, clustering means 26, and searching means 27.
- the analysis unit 23 stores X-ray diffraction data inputted from the X-ray diffractometer 10 via the input means 21 in the storage unit 22.
- the analysis unit 23 subjects the X-ray diffraction data stored in the storage unit 22 to a later-described process and stores the processing results in the storage unit 22.
- the analysis unit 23 also displays the processing results on the display device 30 via the output means 24.
- FIG. 3 is a flowchart showing the operation of the analysis unit 23 in the first embodiment of the present invention.
- the detection means 25 of the analysis unit 23 reads the X-ray diffraction data stored in the storage unit 22, preprocesses the X-ray diffraction data, and thereafter converts the X-ray diffraction data to 2 ⁇ -I data (step 101).
- the term 'preprocessing' refers to background correction or the like; the background correction being a process for removing, e.g., noise.
- background correction includes uniform background correction, median filter correction, and the like. In the specific examples described below, uniform background correction is carried out unless otherwise particularly noted.
- preprocessing is not required to be carried out again.
- the detection means 25 detects the peak positions and peak intensities in the 2 ⁇ -I profile (i.e., the 2 ⁇ -I data) (step 102). This process is conventionally referred to as a 'peak search.' The detection means 25 subsequently creates circumferential angle ⁇ versus intensity I data (hereinafter referred to as " ⁇ -I data") of the diffraction patterns in the peak positions of the 2 ⁇ -I profile detected in step 102 (step 103).
- ⁇ -I data circumferential angle ⁇ versus intensity I data
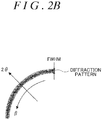
- FIG. 2B is a diagram showing the direction of the diffraction angle 2 ⁇ and the direction of the angle ⁇ .
- the intensity "I" of the ⁇ -I data is the integrated intensity in the range of the full-width at half maximum (FWHM) of the peak width at the peak positions of, e.g., the 2 ⁇ -I profile.
- the integration range may be narrowed to make the range FWHM/2, or the integration range may be increased to make the range 2FWHM.
- the range of the angle ⁇ obtained by measurement using the X-ray diffractometer 10 differs in accordance with the area of the X-ray detector 15 of the X-ray diffractometer 10, the distance (camera length) between the sample 11 and the X-ray detector 15, and whether the measurement method is a transmission method or a reflection method.
- the range of the angle ⁇ is preferably used in order to analyze the widest possible range in the resulting measurement data.
- the detection means 25 subsequently calculates or creates ring characteristic factors (described hereunder) from the ⁇ -I data (step 104).
- the clustering means 26 of the analysis unit 23 groups the diffraction patterns into a plurality of clusters in accordance with the ring characteristic factors calculated or created in step 104 (step 105).
- three ring characteristic factors are used in the clustering process, three-dimensional vectors with the ring characteristic factors as variables are created, and the diffraction patterns proximate in distance between the distal ends of vectors are grouped into the same cluster.
- the searching means 27 of the analysis unit 23 searches for crystalline phases in the database that show peak positions and peak intensity ratios with a high coincidence with the sets of peak positions and peak intensity ratios (detected in step 102) of the diffraction patterns grouped into the same clusters, with the assumption that all or a portion of the diffraction patterns contained in the same clusters are derived from the same crystalline phase (step 106).
- crystalline phase candidates are extracted.
- the searching means 27 assesses whether to end the search (step 107), and when further crystalline phase candidates are to be searched, the process returns to step 106.
- FIG. 4 is a diagram showing the ring characteristic factors used in an embodiment of the present invention.
- the values shown in FIG. 4 are used as the ring characteristic factors, where the intensity I in the ⁇ -I data is a variate "x", the values namely being the intensity range (R), standard variance (s 2 ), standard deviation (s), coefficient of variation (CV), number of peaks in a circumferential angle ( ⁇ ) versus intensity (I) profile (hereinafter referred to as " ⁇ -I profile”), peak width in the ⁇ -I profile, skewness (distortion) Sk of the intensity distribution, kurtosis (sharpness) Ku of the intensity distribution, normalized average X norm of the intensity distribution, and histogram of the intensity.
- FIG. 5A is a view showing an example of a diffraction pattern of sintered silicon.
- FIG. 5B is a diagram showing an example of a ⁇ -I profile of a diffraction pattern of sintered silicon.
- FIG. 6A is a view showing an example of a diffraction pattern of powder silicon.
- FIG. 6B is a diagram showing an example of a ⁇ -I profile of a diffraction pattern of powder silicon.
- the diffraction pattern of sintered silicon shown in FIG. 5A had low uniformity in the circumferential direction in comparison with the diffraction pattern of powder silicon shown in FIG. 6A .
- FIG. 7 is a diagram showing an example of the intensity range R, standard variance s 2 , standard deviation s, and coefficient of variation CV in the ⁇ -I data of the diffraction pattern of sintered silicon and the diffraction pattern of powder silicon.
- the intensity range R, standard variance s 2 , standard deviation s, and coefficient of variation CV of the sintered silicon which has low uniformity in the circumferential direction, all have high values in comparison with the powder silicon. It is apparent that uniformity in the circumferential direction is lower in commensurate fashion to higher values of the ring characteristic factors.
- using the intensity range R, standard variance s 2 , standard deviation s, and coefficient of variation CV allows the degree of uniformity of the diffraction pattern in the circumferential direction to be quantified. Therefore, the use of these ring characteristic factors makes it possible to group diffraction patterns having different uniformities in the circumferential direction into a plurality of clusters.
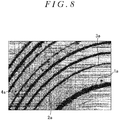
- FIG. 8 is a view showing an example of the diffraction patterns of a mixed powder sample of a mineral.
- the diffraction pattern 1a was a ring shape in which intensity varies irregularly in the circumferential direction.
- the diffraction pattern 2a was a ring shape in which intensity varies intermittently in the circumferential direction.
- the diffraction pattern 3a was a ring shape in which the intensity is uniform in the circumferential direction.
- the diffraction pattern 4a was an independent spot shape.
- FIG. 9A is a diagram showing the ⁇ -I profile of the diffraction pattern 1a.
- FIG. 9B is a diagram showing the ⁇ -I profile of the diffraction pattern 2a.
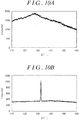
- FIG. 10A is a diagram showing the ⁇ -I profile of diffraction pattern 3a.
- FIG. 10B is a diagram showing the ⁇ -I profile of diffraction pattern 4a.
- the peak-top method for detecting only peaks at 3 ⁇ (sigma) or greater in relation to the magnitude " ⁇ " of the noise level was used for calculating the number of peaks and the width of peaks.
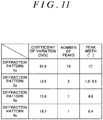
- FIG. 11 is a diagram showing the following values for the diffraction patterns 1a to 4a; namely, values of the coefficient of variation CV, values of the number of peaks in the ⁇ -I profile, and values of the peak width in the ⁇ -I profile.
- FIG. 11 is a diagram showing the values of the following diffraction patterns 1a to 4a, namely, the values of the coefficient of variation CV, the number of peaks in the ⁇ -I profile, and the peak width in the ⁇ -I profile.
- the coefficient of variation CV had a high value of 81.9 in the ring-shaped diffraction pattern 1a in which the intensity varied irregularly in the circumferential direction.
- the number of peaks and the peak width in the ring-shaped diffraction pattern 1a in which the intensity varies irregularly in the circumferential direction the number of peaks was high at 19 and the peak width was narrow at less than 1°.
- the number of peaks in the ring-shaped diffraction pattern 2a in which the intensity varies intermittently in the circumferential direction the number of peaks was 3 and the peak width was not uniform being 1.0° to 3.5°.
- the number of peaks was 1 and the peak width was relatively broad at 8.8.
- the spot-shaped diffraction pattern 4a the number of peaks is 1 and the peak width was narrow at 0.4.
- the diffraction patterns 2a, 3a, 4a in which the coefficient of variations CV are about the same value can be grouped into different clusters based the differences in the number of peaks and the peak widths in the ⁇ -I profile.
- Variability in the circumferential direction of Debye-Scherrer rings can be analyzed by creating an intensity histogram of the ⁇ -I data.
- median filter correction was carried out and the ranges of intensity from 0 (zero) to the maximum value in the ⁇ -I data of the diffraction patterns were divided into 50 to create a histogram.
- FIG. 12A is a diagram showing a histogram created from the ⁇ -I data of the diffraction pattern 1a.
- FIG. 12B is a diagram showing a histogram created from the ⁇ -I data of the diffraction pattern 2a.
- FIG. 13A is a diagram showing a histogram created from the ⁇ -I data of the diffraction pattern 3a.
- FIG. 13B is a diagram showing a histogram created from the ⁇ -I data of the diffraction pattern 4a.
- the skewness Sk indicates the amount of leftward or rightward bias in the intensity distribution of the ⁇ -I data of a diffraction pattern.
- Sk >0 the ⁇ -I data has a distribution with a long right tail.
- Kurtosis Ku indicates the peakedness (sharpness) of the intensity distribution in the ⁇ -I data of a diffraction pattern.
- Ku > the intensity distribution of the ⁇ -I data is more peaked than a normal distribution
- Ku ⁇ the intensity distribution of the ⁇ -I data is flatter than a normal distribution.
- the normalized average X norm is a value obtained by dividing the average value by the maximum value of the intensity. The closer the normalized average X norm is to "0 (zero)," the more leftward the intensity distribution of the ⁇ -I data is, and the closer to "1" the more rightward the intensity distribution of the ⁇ -I data is.
- the term "intensity distribution” refers to the features or tendencies of intensity as expressed in a frequency distribution table, a graph, or the like.
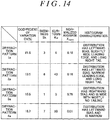
- FIG. 14 is a diagram showing the characteristics of the following values for the diffraction patterns 1a to 4a; namely, the characteristics of the values of the coefficient of variation CV, the characteristics of the skewness Sk of the intensity distribution, the characteristics of the kurtosis Ku of the intensity distribution, the characteristics of the normalized average X norm of the intensity distribution, and the characteristics of the histogram.
- the following can be said for the ring-shaped diffraction pattern 1a in which the intensity varies irregularly in the circumferential direction.
- the skewness Sk is a positive value of 3, which therefore suggests a distribution with a long right tail.
- the kurtosis Ku is a somewhat low positive value of 8, which therefore suggests a slightly more peaked distribution than a normal distribution.
- the normalized average X norm is a low value of 0.16, which therefore suggests a distribution in which the average is biased leftward.
- the shape of the histogram also indicates a distribution that is leftward, has a slightly wide leading edge, and has a long right tail.
- the skewness Sk is a positive value 6, which therefore suggests a distribution with a long right tail.
- the kurtosis Ku is a high positive value 43, which therefore suggests a more peaked distribution than a normal distribution.
- the normalized average X norm is a low value of 0.16, which therefore suggests a distribution in which the average is biased leftward.
- the shape of the histogram also indicates a distribution that is leftward, has a narrow leading edge, and has a long right tail.
- the skewness Sk is a low positive value 1, which therefore suggests a distribution with a long right tail yet nearly symmetrical.
- the kurtosis Ku is 0, which therefore suggests a distribution that is proximate to a normal distribution.
- the normalized average X norm is a large value of 0.75, which therefore suggests a distribution in which the average is biased rightward.
- the shape of the histogram also indicates a distribution that is rightward and wide with mostly no tailing.
- the skewness Sk is a slightly low positive value 7, which therefore suggests a distribution with a long right tail.
- the kurtosis Ku is a high positive value of 50, which therefore suggests a distribution that is more greatly peaked than a normal distribution.
- the normalized average X norm is a very low value of 0.01, which therefore suggests a distribution in which the average is inordinately biased leftward.
- the shape of the histogram also indicates a distribution that is leftward and narrow.
- the diffraction patterns 2a, 3a, 4a can be grouped into different clusters from the difference in histogram shapes, as well as from the values of the skewness Sk, kurtosis Ku, and normalized average X norm in relation to the diffraction patterns 2a, 3a, 4a in which the coefficients of variation CV are about the same value.
- FIG. 15A is a view showing an example of the diffraction pattern of a sheet-shaped sample composed of unoriented polypropylene.
- FIG. 15B is a view showing an example of the diffraction pattern of a sheet-shaped sample composed of oriented polypropylene.
- Patterns obtained in the same 2 ⁇ position will be compared in relation to the sheet-shaped sample composed of unoriented polypropylene and a sheet-shaped sample composed of oriented propylene.
- a diffraction pattern 5a of the sheet-shaped sample composed of unoriented polypropylene was a ring shape with uniform intensity in the circumferential direction.
- a diffraction pattern 6a of the sheet-shaped sample composed of oriented polypropylene was a ring shape in which intensity varies periodically in the circumferential direction due to the effect of the oriented aggregate structure. Variation in the intensity of the diffraction pattern 6a was symmetrically depicted.
- FIG. 16A is a diagram showing the ⁇ -I profile of diffraction pattern 5a.
- FIG. 16B is a diagram showing the ⁇ -I profile of diffraction pattern 6a.
- the number of peaks was calculated using the peak-top method for detecting only peaks at 3 ⁇ (sigma) or greater from the ⁇ -I data of these diffraction patterns, and the number of peaks was found to be "0" in both diffraction patterns. In view of this fact, the ranges of intensity from "0" to the maximum value in the ⁇ -I data of the diffraction patterns were divided into 50 to create a histogram.
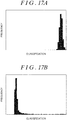
- FIG. 17A is a diagram showing a histogram created from the ⁇ -I data of the diffraction pattern 5a.
- FIG. 17B is a diagram showing a histogram created from the ⁇ -I data of the diffraction pattern 6a.
- FIG. 18 is a diagram showing the following values for the diffraction pattern 5a and diffraction pattern 6a: the characteristics of the values of the number of peaks of the intensity distribution, the characteristics of the values of the skewness Sk of the intensity distribution, the characteristics of the values of the kurtosis Ku of the intensity distribution, the characteristics of the values of the normalized average X norm of the intensity distribution, and the characteristics of the values of the histogram.
- the skewness Sk is a positive value of 4, which suggests a distribution with a long right tail.
- the kurtosis Ku is a fairly low positive value of 13, which suggests a slightly more peaked distribution than a normal distribution.
- the normalized average X norm is a very high value 0.91, which suggests a distribution in which the average is biased rightward. In actuality, the shape of the histogram was also rightward and slightly wide.
- the skewness Sk is a positive value of 4, which suggests a distribution with a long right tail.
- the kurtosis Ku is a fairly high positive value of 20, which suggests a slightly more peaked distribution than a normal distribution.
- the normalized average X norm is a low value of 0.23, which suggests a distribution in which the average is biased leftward. In actuality, the shape of the histogram was also leftward and slightly wide.
- the diffraction patterns for which the number of peaks in the ⁇ -I profile is calculated to be "0" can be grouped based on the difference in the shapes of the histograms, as well as on the values of the skewness Sk, the kurtosis Ku, and the normalized average X norm in relation to the diffraction patterns in which the number of peaks are calculated to be "0".
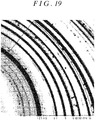
- FIG. 19 is a view showing another example of the diffraction pattern of a mixed powder sample of a mineral.
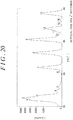
- FIG. 20 is a diagram showing the 2 ⁇ -I profile of the diffraction pattern shown in FIG. 19 .
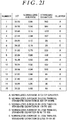
- FIG. 21 is a diagram illustrating an example of grouping using the normalized average X norm and standard deviation s as ring characteristic factors.
- the present example shows an example in which the normalized average X norm and the standard deviation s are calculated as the ring characteristic factors for the diffraction patterns 1 to 15, and grouping the diffraction patterns on the basis thereof.
- the diffraction patterns numbered 1, 2, 7, 8, 9, 12, 15 had a normalized average X norm of 0.5 or more and were therefore grouped into the same cluster A.
- the diffraction patterns numbered 3 and 11 had a normalized average X norm of less than 0.5 and a standard deviation s of 300 or more, and were therefore grouped into the same cluster B.
- the diffraction patterns numbered 4 and 10 had a normalized average X norm of less than 0.5 and a standard deviation s of 100 or more and less than 300, and were therefore grouped into the same cluster C.
- the diffraction pattern numbered 13 had a normalized average X norm of less than 0.5 and a standard deviation s of 50 or more and less than 100, and was therefore grouped into cluster D.
- the diffraction patterns numbered 5, 6, and 14 had a normalized average X norm of less than 0.5 and a standard deviation s of less than 50, and were therefore grouped into the same cluster E.
- FIG. 21 is an example showing that the normalized average X norm and the standard deviation s are useful in grouping diffraction patterns, and the grouping conditions of the clusters can be suitably determined in accordance with the numerical values obtained in individual analyses.
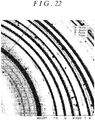
- FIG. 22 is a view showing the results of identifying crystalline phases by automatic searching on the basis of the grouping in FIG. 21 .
- Mullite was identified from the sets of peak positions and peak intensity ratios of the diffraction patterns grouped into cluster A.
- Quartz was identified from the sets of peak positions and peak intensity ratios of the diffraction patterns grouped into cluster B.
- Rutile was identified from the sets of peak positions and peak intensity ratios of the diffraction patterns grouped into cluster C.
- Topaz was identified from the sets of peak positions and peak intensity ratios of the diffraction patterns grouped into cluster E.
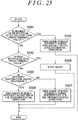
- FIG. 23 is a flowchart showing an example of a grouping process using the number of peaks in a ⁇ -I profile, the peak width in a ⁇ -I profile, and the difference in intensity distribution in the second embodiment of the present invention.
- the clustering means 26 of the analysis unit 23 first assesses whether the number of peaks in the ⁇ -I profile calculated in step 104 of FIG. 3 is equal to or greater than a predetermined value set in advance (step 201). In the case that the number of peaks is equal to or greater than a predetermined value, the clustering means 26 groups the diffraction patterns into a cluster containing ring-shaped diffraction patterns having intensity that varies irregularly in the circumferential direction (step 202).
- the clustering means 26 assesses whether the peak width in the ⁇ -I profile calculated in step 104 of FIG. 3 is less than a predetermined set in advance (step 203). When the peak width is less than a predetermined value ("Yes” in step 203), the clustering means 26 groups the diffraction patterns into a cluster containing spot-shaped diffraction patterns (step 204).
- the clustering means 26 assesses whether the intensity distribution is biased rightward on the basis of the histogram created in step 104 of FIG. 3 or the calculated normalized average X norm of the intensity distribution (step 205). When the intensity distribution is biased rightward ("Yes” in step 205), the clustering means 26 groups the diffraction patterns into a cluster containing ring-shaped diffraction patterns in which the intensity is uniform in the circumferential direction (step 206).
- the clustering means 26 groups the diffraction patterns into a cluster containing ring-shaped diffraction patterns in which the intensity varies intermittently in the circumferential direction (step 207).
- the diffraction patterns 1a to 4a described as specific examples in the first embodiment can be grouped with good efficiency.
- the number of peaks, peak width, and intensity distribution are not always required to be used for grouping in the sequence shown in FIG. 23 .
- the priority order of these ring characteristic factors to be used in grouping can be modified.
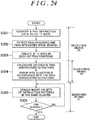
- FIG. 24 is a flowchart illustrating the operation of the analysis unit 23 in the third embodiment of the present invention.
- Steps 301 to 303 are the same as steps 101 to 103 of FIG. 3 .
- Step 305 is the same as step 106 of FIG. 3 .
- Step 306 is the same as step 107 of FIG. 3 .
- step 304 the detection means 25 of the analysis unit 23 calculates or creates ring characteristic factors on the basis of the ⁇ -I data.
- the clustering means 26 of the analysis unit 23 groups the diffraction patterns into a plurality of clusters in accordance with the ring characteristic factors thus calculated or created.
- step 104 and the process of step 105 of FIG. 3 in the first embodiment are carried out in combination in the following manner.
- FIG. 25 is a flowchart illustrating an example of a grouping using differences of the number of peaks in a ⁇ -I profile, differences of the peak width in a ⁇ -I profile, and differences of the difference in intensity distribution in the third embodiment of the present invention.
- the detection means 25 calculates the number of peaks and the peak width in the ⁇ -I profile from the ⁇ -I data (step 401).
- the clustering means 26 assesses whether the number of peaks in the ⁇ -I profile calculated in step 401 is equal to or greater than a predetermined value set in advance (step 402). When the number of peaks is equal to or greater than the predetermined value ("Yes" in step 402), the clustering means 26 groups the diffraction patterns into a cluster containing ring-shaped diffraction patterns in which the intensity varies irregularly in the circumferential direction (step 403).
- the clustering means 26 assesses whether the peak width in the ⁇ -I profile calculated in step 401 is less than a predetermined value set in advance (step 404). When the peak width is less that the predetermined value ("Yes” in step 404), the clustering means 26 groups the diffraction patterns into a cluster containing spot-shaped diffraction patterns (step 405).
- the detection means 25 creates an intensity histogram on the basis of the ⁇ -I data, or calculates the normalized average X norm of the intensity distribution (step 406).
- the clustering means 26 assesses whether the intensity distribution is biased rightward on the basis of the histogram created in step 406 or the calculated normalized average X norm of the intensity distribution (step 407).
- the clustering means 26 groups the diffraction patterns into a cluster containing ring-shaped diffraction patterns in which the intensity is uniformed in the circumferential direction (step 408).
- the clustering means 26 groups the diffraction patterns into a cluster containing ring-shaped diffraction patterns in which the intensity varies intermittently in the circumferential direction (step 409).
- the effects of the second embodiment described above can be obtained. Furthermore, in accordance with the third embodiment, a histogram or the normalized average X norm of the intensity distribution is not used as a ring characteristic factor. Moreover, in accordance with the third embodiment, creation or calculation of diffraction patterns that can be grouped is not required. Thus, in the third embodiment, diffraction pattern grouping can be carried out more rapidly because a histogram or the normalized average X norm of the intensity distribution is not used as a ring characteristic factor and there is no need to create or calculate diffraction patterns that can be grouped.
Landscapes
- Chemical & Material Sciences (AREA)
- Crystallography & Structural Chemistry (AREA)
- Physics & Mathematics (AREA)
- Health & Medical Sciences (AREA)
- Life Sciences & Earth Sciences (AREA)
- Analytical Chemistry (AREA)
- Biochemistry (AREA)
- General Health & Medical Sciences (AREA)
- General Physics & Mathematics (AREA)
- Immunology (AREA)
- Pathology (AREA)
- Analysing Materials By The Use Of Radiation (AREA)
Abstract
Description
- The present invention relates to a crystalline phase identification method, a crystalline phase identification device, and an X-ray diffraction measurement system for identifying a crystalline phase contained in a sample composed of a powdery crystal or a polycrystalline substance from X-ray diffraction data of the sample.
- Most solid substances exist in a crystalline state. Many solid substances are made of aggregated fine crystal grains. Aggregated fine crystal grains are referred to as a polycrystalline substance. X-ray diffraction measurement for handling powdery crystals or polycrystalline substance as a sample is called X-ray powder diffractometry.
- An X-ray diffraction pattern of a sample obtained by measurement using an X-ray diffractometer is characteristic for each crystalline phase. A crystalline phase contained in a sample can be identified by analysis of the X-ray diffraction pattern. As used herein, the term 'crystalline phase' refers to the crystal structure and chemical composition of a substance which is crystalline.
JP-A 2014-178203 - When the number of crystal grains in a sample is sufficiently large and the directions of lattice planes are random, a lattice plane having an angle that satisfies diffraction conditions must be present. X-rays diffracted by a lattice plane at a diffraction angle of 2θ proceed along the generating line of a cone in which the half apex angle is 2θ when 2θ < 90°, and proceed along the generating line of a cone in which the half apex angle is (180°-2θ) when 2θ > 90°. In other words, X-rays diffracted by a sample composed of powdery crystal or a polycrystalline substance form numerous cones having different central angles. When such X-rays are received in the detection surface of an X-ray detector, a concentric circular diffraction pattern is obtained. This diffraction pattern is referred to as Debye-Scherrer rings.
- Debye-Scherrer rings obtained by X-ray powder diffractometry include a plurality of rings. Uniformity in the circumferential direction of the rings (i.e., the diffraction pattern) reflects the state of particles contained in a sample. When there are lattice planes that yield a diffraction pattern in which intensity is uniform in the circumferential direction and lattice planes that yield a diffraction pattern in which intensity is not uniform in the circumferential direction, the states of grains that contain these lattice planes are different from each other.
- Qualitative analysis is an example of an analytic method for identifying a crystalline phase. In a qualitative analysis, the two-dimensional data of an X-ray diffraction pattern of a sample is converted to "diffraction angle 2θ versus intensity I data" to create a "diffraction angle 2θ versus intensity I profile." The position and intensity of peaks in the "profile of the diffraction angle 2θ versus intensity I profile" are detected.
- "Diffraction angle 2θ versus intensity I data" may hereinafter be referred to as "2θ-I data." The "diffraction angle 2θ versus intensity I profile" may hereinafter be referred to as the "2θ-I profile."
- A system for carrying out a qualitative analysis has a database. "Peak position" data and data for the "ratio of the peak intensity between a plurality of diffraction patterns" in an X-ray diffraction pattern are registered in the database. The "ratio of the peak intensity between a plurality of diffraction patterns" may hereinafter be referred to as "peak intensity ratio."
- A system for carrying out a qualitative analysis performs a search in accordance with installed software. Specifically, data related to a plurality of known crystalline phases registered in the database is searched, and candidates of crystalline phases contained in a sample are extracted on the basis of the position of peaks detected from the sample and the peak intensity ratio detected from the sample, like the position of peaks. The search using the database in this case may be referred to as "search and match."
- Conventionally, the uniformity of diffraction patterns in the circumferential direction is not taken into consideration when search conditions are set by software during a search and match. Accordingly, it may be possible for unintended crystalline phase candidates to be listed in the search results on the basis of diffraction pattern groups that are not attributable to the same crystalline phase, and, consequently, diffraction pattern groups having different uniformities in the circumferential direction.
- An object of the present invention is to carry out a search of crystalline phase candidates with good precision in identification of crystalline phases and improve analysis precision.
- The crystalline phase identification method of the present invention identifies a crystalline phase contained in a sample, from X-ray diffraction data of the sample which contain data of a plurality of ring-shaped diffraction patterns, using a database in which are registered data related to peak positions of X-ray diffraction patterns for a plurality of crystalline phases and data related to peak intensity ratios of X-ray diffraction patterns for a plurality of crystalline phases. Peak positions and peak intensities for a plurality of the diffraction patterns are detected from the X-ray diffraction data. The circumferential angle versus intensity data for a plurality of the diffraction patterns are created from the X-ray diffraction data. The diffraction patterns are grouped into a plurality of clusters (namely, groups) on the basis of the circumferential angle (β) versus intensity (I) data thus created. Crystalline phase candidates contained in the sample are searched from the database on the basis of sets of ratios of peak positions and peak intensities of the diffraction patterns grouped into the same cluster.
- The crystalline phase identification device of the present invention identifies a crystalline phase contained in a sample, from X-ray diffraction data of the sample which contain data of a plurality of ring-shaped diffraction patterns, using a database in which are registered data related to peak positions of X-ray diffraction patterns for a plurality of crystalline phases and data related to peak intensity ratios of X-ray diffraction patterns for a plurality of crystalline phases. The crystalline phase identification device comprises: detection means for detecting peak positions and peak intensities for a plurality of the diffraction patterns from the X-ray diffraction data, and creating circumferential angle versus intensity data of the diffraction patterns; clustering means for grouping the diffraction patterns into a plurality of clusters on the basis of the circumferential angle (β) versus intensity (I) data thus created by the detection means; and searching means for searching for crystalline phase candidates contained in the sample from the database on the basis of sets of ratios of peak positions and peak intensities of the diffraction patterns grouped into the same cluster by the clustering means.
- Following are the characteristics of the present invention.
- (1) Peak positions and peak intensities are detected for a plurality of diffraction patterns from the X-ray diffraction data, and circumferential angle versus intensity data of the diffraction patterns are created. As used herein, the phrase "plurality of diffraction patterns" refers to the rings contained in concentric circular Debye-Scherrer rings. The X-ray diffraction data is not limited to two-dimensional image data obtained by two-dimensional image measurement, and may be one-dimensional data or the like obtained by scanning the diffraction patterns with a detector.
- (2) Diffraction patterns are grouped into a plurality of clusters on the basis of the circumferential angle versus intensity data thus created. The diffraction patterns are thereby grouped into a plurality of clusters in accordance with the uniformity of the diffraction pattern in the circumferential direction.
- (3) Crystalline phase candidates contained in the sample are searched from a database on the basis of the sets of ratios of peak positions and peak intensities of the diffraction patterns grouped into the same cluster. A search of crystalline phase candidates is thereby carried out on the basis of the sets of diffraction patterns that are closely uniform in the circumferential direction. Therefore, a search for crystalline phase candidates is carried out with good precision in the identification of a crystalline phase, and analysis precision can be enhanced.
- Furthermore, in another aspect of the crystalline phase identification method and crystalline phase identification device of the present invention, ring characteristic factors representing homogeneity of intensity in the circumferential direction of the diffraction patterns are determined from the circumferential angle versus intensity data of the diffraction patterns, and the diffraction patterns are grouped into a plurality of clusters in accordance with the ring characteristic factors thus determined.
- The term "ring characteristic factor" is a neologism in the present specification. The term "ring characteristic factor" refers to an element that expresses the homogeneity of intensity of diffraction patterns in the circumferential direction. The uniformity of diffraction patterns in the circumferential direction is made clear by ring characteristic factors. Therefore, the diffraction patterns are grouped into a plurality of clusters in accordance with the determined ring characteristic factors, whereby diffraction patterns having different uniformity in the circumferential direction can be grouped into a plurality of clusters.
- Furthermore, in yet another aspect of the crystalline phase identification method and crystalline phase identification device of the present invention, an intensity range, a standard variance, a standard deviation, or a coefficient of variation, where intensity is a variate, are calculated as the ring characteristic factors from the circumferential angle versus intensity data of the diffraction patterns.
- Calculating the intensity range, standard variance, standard deviation, or coefficient of variation as ring characteristic factors allows the degree of uniformity of diffraction patterns in the circumferential direction to be quantified.
- Furthermore, in yet another aspect of the crystalline phase identification method and crystalline phase identification device of the present invention, a number of peaks and a peak width in a circumferential angle versus intensity profile are calculated as the ring characteristic factors from the circumferential angle versus intensity data of the diffraction patterns.
- Using the number of peaks and the peak width in a circumferential angle versus intensity profile as the ring characteristic factors allows diffraction patterns in which the intensity range, standard variance, standard deviation, or coefficient of variation are about the same value to be grouped into different clusters from differences in the number of peaks and the peak width.
- Furthermore, in yet another aspect of the crystalline phase identification method and crystalline phase identification device of the present invention, an intensity histogram is created as the ring characteristic factor from the circumferential angle versus intensity data of the diffraction patterns.
- Using an intensity histogram as the ring characteristic factor allows diffraction patterns in which the intensity range, standard variance, standard deviation, or coefficient of variation are about the same value to be grouped into different clusters from differences in the histogram. Diffraction patterns in which the number of peaks in the circumferential angle versus intensity profile is calculated to be "0" can also be grouped by differences in the histogram.
- Furthermore, in yet another aspect of the crystalline phase identification method and crystalline phase identification device of the present invention, a skewness, kurtosis, or normalized average Xnorm of the intensity distribution are calculated as the ring characteristic factors from the circumferential angle versus intensity data of the diffraction patterns. Using a skewness, kurtosis, or normalized average Xnorm of the intensity distribution as the ring characteristic factors allows characteristics of the intensity distribution to be quantified and used in clustering.
- Next, the X-ray diffraction measurement system of the present invention comprises an X-ray diffractometer for measuring the X-ray diffraction data of a sample, and the crystalline phase identification device of any of the above-described aspects.
- In accordance with the present invention, a search for crystalline phase candidates can be carried out with good precision in the identification of a crystalline phase, and analysis precision can be enhanced.
- In the drawings:
-
FIG. 1A is a block diagram showing a configuration of an embodiment of an X-ray diffraction measurement system of the present invention; -
FIG. 1B is a diagram showing an example of the configuration of the X-ray diffractometer ofFIG. 1A ; -
FIG. 2A is a block diagram showing a configuration of an embodiment of a crystalline phase identification device of the present invention; -
FIG. 2B is a diagram showing the direction of the diffraction angle 2θ and the direction of the angle β; -
FIG. 3 is a flowchart showing the operation of an example of theanalysis unit 23 ofFIG. 1 ; -
FIG. 4 is a diagram showing ring characteristic factors used in an embodiment of the crystalline phase identification method of the present invention; -
FIG. 5A is a view showing an example of a diffraction pattern of sintered silicon; -
FIG. 5B is a diagram showing an example of a β-I profile of a diffraction pattern of sintered silicon; -
FIG. 6A is a view showing an example of a diffraction pattern of powder silicon; -
FIG. 6B is a diagram showing an example of a β-I profile of a diffraction pattern of powder silicon; -
FIG. 7 is a diagram showing an example of the intensity range, standard variance, standard deviation, and coefficient of variation in the diffraction pattern of sintered silicon and the diffraction pattern of powder silicon; -
FIG. 8 is a view showing an example of the diffraction pattern of a mixed powder sample of a mineral; -
FIG. 9A is a diagram showing the β-I profile ofdiffraction pattern 1a ofFIG. 8 ; -
FIG. 9B is a diagram showing the β-I profile ofdiffraction pattern 2a ofFIG. 8 ; -
FIG. 10A is a diagram showing the β-I profile ofdiffraction pattern 3a ofFIG. 8 ; -
FIG. 10B is a diagram showing the β-I profile ofdiffraction pattern 4a ofFIG. 8 ; -
FIG. 11 is a diagram showing the following factors for thediffraction patterns 1a to 4a ofFIG. 8 , namely, the coefficient of variation, the number of peaks in the β-I profile, and the peak width in the β-I profile; -
FIG. 12A is a diagram showing a histogram created from the β-I data of thediffraction pattern 1a ofFIG. 8 ; -
FIG. 12B is a diagram showing a histogram created from the β-I data of thediffraction pattern 2a ofFIG. 8 ; -
FIG. 13A is a diagram showing a histogram created from the β-I data of thediffraction pattern 3a ofFIG. 8 ; -
FIG. 13B is a diagram showing a histogram created from the β-I data of thediffraction pattern 4a ofFIG. 8 ; -
FIG. 14 is a diagram showing the characteristics of each of the following elements for thediffraction patterns 1a to 4a ofFIG. 8 , namely, the coefficient of variation, the skewness of the intensity distribution, the kurtosis of the intensity distribution, the normalized average of the intensity distribution, and the histogram; -
FIG. 15A is a diagram showing an example of the diffraction pattern of a sheet-shaped sample composed of unoriented polypropylene; -
FIG. 15B is a diagram showing an example of the diffraction pattern of a sheet-shaped sample composed of oriented polypropylene; -
FIG. 16A is a diagram showing the β-I profile ofdiffraction pattern 5a ofFIG. 15A ; -
FIG. 16B is a diagram showing the β-I profile ofdiffraction pattern 6a ofFIG. 15B ; -
FIG. 17A is a diagram showing a histogram created from the β-I data of thediffraction pattern 5a ofFIG. 15A ; -
FIG. 17B is a diagram showing a histogram created from the β-I data of thediffraction pattern 6a ofFIG. 15B ; -
FIG. 18 is a diagram showing the characteristics of each of the following elements for thediffraction pattern 5a ofFIG. 15A and thediffraction pattern 6a ofFIG. 15B , namely, the number of peaks, the skewness of the intensity distribution, the kurtosis of the intensity distribution, the normalized average of the intensity distribution, and the histogram; -
FIG. 19 is a view showing another example of the diffraction pattern of a mixed powder sample of a mineral; -
FIG. 20 is a diagram showing the 2θ-I profile of the diffraction pattern shown inFIG. 19 ; -
FIG. 21 is a diagram showing an example of grouping using the normalized average and standard deviation as ring characteristic factors; -
FIG. 22 is a view showing the results of identifying crystalline phases by automatic searching on the basis of the grouping inFIG. 21 ; -
FIG. 23 is a flowchart showing an example of a grouping process using the difference in the number of peaks in a β-I profile, the difference in the peak width in a β-I profile, and the difference in intensity distribution in a second embodiment of the crystalline phase identification method of the present invention; -
FIG. 24 is a flowchart showing an example of the operation of theanalysis unit 23 in a third embodiment of the crystalline phase identification method of the present invention; and -
FIG. 25 is a flowchart showing an example of a grouping process using the difference in the number of peaks in a β-I profile, the difference in the peak width in a β-I profile, and the difference in intensity distribution in a third embodiment of the crystalline phase identification method of the present invention. -
FIG. 1A is a block diagram showing a schematic configuration of an embodiment of an X-ray diffraction measurement system of the present invention. The X-ray diffraction measurement system comprises anX-ray diffractometer 10, a crystallinephase identification device 20, and adisplay device 30. Thedisplay device 30 is composed of, e.g., a flat panel display device or the like. Thedisplay device 30 may be integrally configured with the crystallinephase identification device 20. -
FIG. 1B is a diagram showing a schematic configuration of the X-ray diffractometer. TheX-ray diffractometer 10 is configured to include agoniometer 12, anX-ray generator 13, acollimator 14, anX-ray detector 15, acontrol unit 16, and an input/output device 17. Thegoniometer 12 is an angle-measuring instrument. A sample stage for mounting and rotating asample 11 is disposed in the center part of thegoniometer 12. X-rays generated from theX-ray generator 13 are passed through thecollimator 14 having a pinhole to form a narrow beam-like flux and are irradiated on thesample 11. - The
X-ray detector 15 detects X-rays diffracted by thesample 11. When X-rays are irradiated on thesample 11 at angle of "θ" relative to a lattice plane in thesample 11, the diffraction angle of X-rays are "2θ". Thecontrol unit 16 is composed of a computer, a sequencer, a dedicated circuit, or the like, and controls thegoniometer 12, theX-ray generator 13, and theX-ray detector 15. The input/output device 17 inputs measurement conditions or the like to thecontrol unit 16, and outputs X-ray diffraction data detected by theX-ray detector 15 to the crystallinephase identification device 20. -
FIG. 1B shows a reflective-type X-ray diffractometer, but in lieu thereof, the device may be a transmission-type X-ray diffractometer. The X-ray detector is not limited to being a two-dimensional detector, and it is also possible to use a zero-dimensional detector or a one-dimensional detector. In such a case, it is necessary to move, e.g., rotate the sample or detector in relation to the center line of the sample. -
FIG. 2A is a block diagram showing a schematic configuration of an embodiment of a crystallinephase identification device 20 of the present invention. The crystallinephase identification device 20 is configured to include input means 21, astorage unit 22, ananalysis unit 23, and output means 24. The crystallinephase identification device 20 can be realized by a typical computer. In such a case, the input means 21 and the output means 24 may be constituted by, e.g., an input/output interface or the like. Thestorage unit 22 may be constituted by, e.g., a hard disk, a memory, or the like. Theanalysis unit 23 may be constituted by, e.g., a CPU or the like. - A database is stored in the
storage unit 22. Data related to known X-ray diffraction patterns of a plurality of crystalline phases is registered in the database. Specifically, the data of peak positions and peak intensity ratios in a 2θ-I profile derived from the X-ray diffraction patterns of a plurality of crystalline phases are registered. More specifically, the data of the peak positions and peak intensity ratios are registered as data of the distance "d" versus intensity ratio "I" of the lattice plane (i.e., d-I data). Thestorage unit 22 may be an external hard disk or the like. -
Analysis unit 23 is configured to include detection means 25, clustering means 26, and searching means 27. Theanalysis unit 23 stores X-ray diffraction data inputted from theX-ray diffractometer 10 via the input means 21 in thestorage unit 22. Theanalysis unit 23 subjects the X-ray diffraction data stored in thestorage unit 22 to a later-described process and stores the processing results in thestorage unit 22. Theanalysis unit 23 also displays the processing results on thedisplay device 30 via the output means 24. -
FIG. 3 is a flowchart showing the operation of theanalysis unit 23 in the first embodiment of the present invention. First, the detection means 25 of theanalysis unit 23 reads the X-ray diffraction data stored in thestorage unit 22, preprocesses the X-ray diffraction data, and thereafter converts the X-ray diffraction data to 2θ-I data (step 101). As used herein, the term 'preprocessing' refers to background correction or the like; the background correction being a process for removing, e.g., noise. - In general, background correction includes uniform background correction, median filter correction, and the like. In the specific examples described below, uniform background correction is carried out unless otherwise particularly noted. When the
X-ray diffractometer 10 is provided with a data processing unit and preprocessing has already been carried out by theX-ray diffractometer 10, preprocessing is not required to be carried out again. - Next, the detection means 25 detects the peak positions and peak intensities in the 2θ-I profile (i.e., the 2θ-I data) (step 102). This process is conventionally referred to as a 'peak search.' The detection means 25 subsequently creates circumferential angle β versus intensity I data (hereinafter referred to as "β-I data") of the diffraction patterns in the peak positions of the 2θ-I profile detected in step 102 (step 103).
-
FIG. 2B is a diagram showing the direction of the diffraction angle 2θ and the direction of the angle β. In this case, the intensity "I" of the β-I data is the integrated intensity in the range of the full-width at half maximum (FWHM) of the peak width at the peak positions of, e.g., the 2θ-I profile. The integration range may be narrowed to make the range FWHM/2, or the integration range may be increased to make the range 2FWHM. - The range of the angle β obtained by measurement using the
X-ray diffractometer 10 differs in accordance with the area of theX-ray detector 15 of theX-ray diffractometer 10, the distance (camera length) between thesample 11 and theX-ray detector 15, and whether the measurement method is a transmission method or a reflection method. However, the range of the angle β is preferably used in order to analyze the widest possible range in the resulting measurement data. - In
FIG. 3 , the detection means 25 subsequently calculates or creates ring characteristic factors (described hereunder) from the β-I data (step 104). Next, the clustering means 26 of theanalysis unit 23 groups the diffraction patterns into a plurality of clusters in accordance with the ring characteristic factors calculated or created in step 104 (step 105). When, e.g., three ring characteristic factors are used in the clustering process, three-dimensional vectors with the ring characteristic factors as variables are created, and the diffraction patterns proximate in distance between the distal ends of vectors are grouped into the same cluster. - Next, the searching means 27 of the
analysis unit 23 searches for crystalline phases in the database that show peak positions and peak intensity ratios with a high coincidence with the sets of peak positions and peak intensity ratios (detected in step 102) of the diffraction patterns grouped into the same clusters, with the assumption that all or a portion of the diffraction patterns contained in the same clusters are derived from the same crystalline phase (step 106). As a result of this search, crystalline phase candidates are extracted. Lastly, the searching means 27 assesses whether to end the search (step 107), and when further crystalline phase candidates are to be searched, the process returns to step 106. -
FIG. 4 is a diagram showing the ring characteristic factors used in an embodiment of the present invention. In the present embodiment, the values shown inFIG. 4 are used as the ring characteristic factors, where the intensity I in the β-I data is a variate "x", the values namely being the intensity range (R), standard variance (s2), standard deviation (s), coefficient of variation (CV), number of peaks in a circumferential angle (β) versus intensity (I) profile (hereinafter referred to as "β-I profile"), peak width in the β-I profile, skewness (distortion) Sk of the intensity distribution, kurtosis (sharpness) Ku of the intensity distribution, normalized average Xnorm of the intensity distribution, and histogram of the intensity. - Sintered silicon and powder silicon having an average grain diameter of 5 µm were measured as an example of measuring samples with different particle states. As a result of the measurement, two X-ray diffraction patterns having two different uniformities in the circumferential direction were obtained.
FIG. 5A is a view showing an example of a diffraction pattern of sintered silicon.FIG. 5B is a diagram showing an example of a β-I profile of a diffraction pattern of sintered silicon. -
FIG. 6A is a view showing an example of a diffraction pattern of powder silicon.FIG. 6B is a diagram showing an example of a β-I profile of a diffraction pattern of powder silicon. The diffraction pattern of sintered silicon shown inFIG. 5A had low uniformity in the circumferential direction in comparison with the diffraction pattern of powder silicon shown inFIG. 6A . The above-described intensity range R, standard variance s2, standard deviation s, and coefficient of variation CV were calculated in the range of β = 75° to 105° from the β-I data of the diffraction patterns. -
FIG. 7 is a diagram showing an example of the intensity range R, standard variance s2, standard deviation s, and coefficient of variation CV in the β-I data of the diffraction pattern of sintered silicon and the diffraction pattern of powder silicon. The intensity range R, standard variance s2, standard deviation s, and coefficient of variation CV of the sintered silicon, which has low uniformity in the circumferential direction, all have high values in comparison with the powder silicon. It is apparent that uniformity in the circumferential direction is lower in commensurate fashion to higher values of the ring characteristic factors. Thus, using the intensity range R, standard variance s2, standard deviation s, and coefficient of variation CV allows the degree of uniformity of the diffraction pattern in the circumferential direction to be quantified. Therefore, the use of these ring characteristic factors makes it possible to group diffraction patterns having different uniformities in the circumferential direction into a plurality of clusters. - A mixed powder sample of a mineral was measured while being rotated in an in-plane direction, and X-ray diffraction patterns having a plurality of Debye-Scherrer rings differing in uniformity in the circumferential direction were obtained.
FIG. 8 is a view showing an example of the diffraction patterns of a mixed powder sample of a mineral. Thediffraction pattern 1a was a ring shape in which intensity varies irregularly in the circumferential direction. Thediffraction pattern 2a was a ring shape in which intensity varies intermittently in the circumferential direction. Thediffraction pattern 3a was a ring shape in which the intensity is uniform in the circumferential direction. Thediffraction pattern 4a was an independent spot shape. -
FIG. 9A is a diagram showing the β-I profile of thediffraction pattern 1a.FIG. 9B is a diagram showing the β-I profile of thediffraction pattern 2a.FIG. 10A is a diagram showing the β-I profile ofdiffraction pattern 3a.FIG. 10B is a diagram showing the β-I profile ofdiffraction pattern 4a. The coefficient of variation CV in the β-I data, the number of peaks in the β-1 profile, and the peak width in the β-I profile were calculated in the range of β = 115° to 165° from the β-I data of the diffraction patterns. The peak-top method for detecting only peaks at 3σ (sigma) or greater in relation to the magnitude "σ" of the noise level was used for calculating the number of peaks and the width of peaks. -
FIG. 11 is a diagram showing the following values for thediffraction patterns 1a to 4a; namely, values of the coefficient of variation CV, values of the number of peaks in the β-I profile, and values of the peak width in the β-I profile.FIG. 11 is a diagram showing the values of the followingdiffraction patterns 1a to 4a, namely, the values of the coefficient of variation CV, the number of peaks in the β-I profile, and the peak width in the β-I profile. The coefficient of variation CV had a high value of 81.9 in the ring-shapeddiffraction pattern 1a in which the intensity varied irregularly in the circumferential direction. In contrast, the value was 13.5 in thediffraction pattern 2a, 15.9 in thediffraction pattern 3a, and 16.7 in thediffraction pattern 4a. These values were less than that indiffraction pattern 1a. There was not a large difference betweendiffraction patterns - On the other hand, in relation to the number of peaks and the peak width in the ring-shaped
diffraction pattern 1a in which the intensity varies irregularly in the circumferential direction, the number of peaks was high at 19 and the peak width was narrow at less than 1°. In the ring-shapeddiffraction pattern 2a in which the intensity varies intermittently in the circumferential direction, the number of peaks was 3 and the peak width was not uniform being 1.0° to 3.5°. In the ring-shapeddiffraction pattern 3a in which the intensity is uniform in the circumferential direction, the number of peaks was 1 and the peak width was relatively broad at 8.8. In the spot-shapeddiffraction pattern 4a, the number of peaks is 1 and the peak width was narrow at 0.4. It is apparent from this specific example that thediffraction patterns - Variability in the circumferential direction of Debye-Scherrer rings can be analyzed by creating an intensity histogram of the β-I data. In the
diffraction patterns 1a to 4a ofFIG. 8 , median filter correction was carried out and the ranges of intensity from 0 (zero) to the maximum value in the β-I data of the diffraction patterns were divided into 50 to create a histogram. -
FIG. 12A is a diagram showing a histogram created from the β-I data of thediffraction pattern 1a.FIG. 12B is a diagram showing a histogram created from the β-I data of thediffraction pattern 2a.FIG. 13A is a diagram showing a histogram created from the β-I data of thediffraction pattern 3a.FIG. 13B is a diagram showing a histogram created from the β-I data of thediffraction pattern 4a. - The skewness Sk indicates the amount of leftward or rightward bias in the intensity distribution of the β-I data of a diffraction pattern. When Sk > 0, the β-I data has a distribution with a long right tail. When Sk < 0, the β-I data has a distribution with a long left tail.
- Kurtosis Ku indicates the peakedness (sharpness) of the intensity distribution in the β-I data of a diffraction pattern. When Ku > 0, the intensity distribution of the β-I data is more peaked than a normal distribution, and when Ku < 0, the intensity distribution of the β-I data is flatter than a normal distribution.
- The normalized average Xnorm is a value obtained by dividing the average value by the maximum value of the intensity. The closer the normalized average Xnorm is to "0 (zero)," the more leftward the intensity distribution of the β-I data is, and the closer to "1" the more rightward the intensity distribution of the β-I data is.
- Using the skewness Sk of the intensity distribution, kurtosis Ku of the intensity distribution, or the normalized average Xnorm of the intensity distribution as ring characteristic factors allows the characteristics of the intensity distribution to be quantified and used in clustering. As used herein, the term "intensity distribution" refers to the features or tendencies of intensity as expressed in a frequency distribution table, a graph, or the like.
-
FIG. 14 is a diagram showing the characteristics of the following values for thediffraction patterns 1a to 4a; namely, the characteristics of the values of the coefficient of variation CV, the characteristics of the skewness Sk of the intensity distribution, the characteristics of the kurtosis Ku of the intensity distribution, the characteristics of the normalized average Xnorm of the intensity distribution, and the characteristics of the histogram. The following can be said for the ring-shapeddiffraction pattern 1a in which the intensity varies irregularly in the circumferential direction. Namely, the skewness Sk is a positive value of 3, which therefore suggests a distribution with a long right tail. The kurtosis Ku is a somewhat low positive value of 8, which therefore suggests a slightly more peaked distribution than a normal distribution. Also, the normalized average Xnorm is a low value of 0.16, which therefore suggests a distribution in which the average is biased leftward. In actuality, the shape of the histogram also indicates a distribution that is leftward, has a slightly wide leading edge, and has a long right tail. - The following can be said for the ring-shaped
diffraction pattern 2a in which the intensity varies intermittently in the circumferential direction. Namely, the skewness Sk is apositive value 6, which therefore suggests a distribution with a long right tail. The kurtosis Ku is a highpositive value 43, which therefore suggests a more peaked distribution than a normal distribution. Also, the normalized average Xnorm is a low value of 0.16, which therefore suggests a distribution in which the average is biased leftward. In actuality, the shape of the histogram also indicates a distribution that is leftward, has a narrow leading edge, and has a long right tail. - The following can be said for the ring-shaped
diffraction pattern 3a in which the intensity is uniform in the circumferential direction. Namely, the skewness Sk is a lowpositive value 1, which therefore suggests a distribution with a long right tail yet nearly symmetrical. The kurtosis Ku is 0, which therefore suggests a distribution that is proximate to a normal distribution. Also, the normalized average Xnorm is a large value of 0.75, which therefore suggests a distribution in which the average is biased rightward. In actuality, the shape of the histogram also indicates a distribution that is rightward and wide with mostly no tailing. - The following can be said for the spot-shaped
diffraction pattern 4a. Namely, the skewness Sk is a slightly lowpositive value 7, which therefore suggests a distribution with a long right tail. The kurtosis Ku is a high positive value of 50, which therefore suggests a distribution that is more greatly peaked than a normal distribution. Also, the normalized average Xnorm is a very low value of 0.01, which therefore suggests a distribution in which the average is inordinately biased leftward. In actuality, the shape of the histogram also indicates a distribution that is leftward and narrow. - In view of the specific examples above, it is apparent that the
diffraction patterns diffraction patterns - A sheet-shaped sample composed of unoriented polypropylene and a sheet-shaped sample composed of oriented propylene were measured as measurement examples of samples having different states of orientation, and two X-ray diffraction patterns having different uniformities in the circumferential direction were obtained.
FIG. 15A is a view showing an example of the diffraction pattern of a sheet-shaped sample composed of unoriented polypropylene.FIG. 15B is a view showing an example of the diffraction pattern of a sheet-shaped sample composed of oriented polypropylene. - Patterns obtained in the same 2θ position will be compared in relation to the sheet-shaped sample composed of unoriented polypropylene and a sheet-shaped sample composed of oriented propylene. A
diffraction pattern 5a of the sheet-shaped sample composed of unoriented polypropylene was a ring shape with uniform intensity in the circumferential direction. In contrast, adiffraction pattern 6a of the sheet-shaped sample composed of oriented polypropylene was a ring shape in which intensity varies periodically in the circumferential direction due to the effect of the oriented aggregate structure. Variation in the intensity of thediffraction pattern 6a was symmetrically depicted. -
FIG. 16A is a diagram showing the β-I profile ofdiffraction pattern 5a.FIG. 16B is a diagram showing the β-I profile ofdiffraction pattern 6a. The number of peaks was calculated using the peak-top method for detecting only peaks at 3σ (sigma) or greater from the β-I data of these diffraction patterns, and the number of peaks was found to be "0" in both diffraction patterns. In view of this fact, the ranges of intensity from "0" to the maximum value in the β-I data of the diffraction patterns were divided into 50 to create a histogram. -
FIG. 17A is a diagram showing a histogram created from the β-I data of thediffraction pattern 5a.FIG. 17B is a diagram showing a histogram created from the β-I data of thediffraction pattern 6a.FIG. 18 is a diagram showing the following values for thediffraction pattern 5a anddiffraction pattern 6a: the characteristics of the values of the number of peaks of the intensity distribution, the characteristics of the values of the skewness Sk of the intensity distribution, the characteristics of the values of the kurtosis Ku of the intensity distribution, the characteristics of the values of the normalized average Xnorm of the intensity distribution, and the characteristics of the values of the histogram. - The following can be said for the
diffraction pattern 5a in which the intensity is uniform in the circumferential direction. Namely, the skewness Sk is a positive value of 4, which suggests a distribution with a long right tail. The kurtosis Ku is a fairly low positive value of 13, which suggests a slightly more peaked distribution than a normal distribution. Also, the normalized average Xnorm is a very high value 0.91, which suggests a distribution in which the average is biased rightward. In actuality, the shape of the histogram was also rightward and slightly wide. - The following can be said for the
diffraction pattern 6a in which the intensity varies periodically in the circumferential direction. Namely, the skewness Sk is a positive value of 4, which suggests a distribution with a long right tail. The kurtosis Ku is a fairly high positive value of 20, which suggests a slightly more peaked distribution than a normal distribution. Also, the normalized average Xnorm is a low value of 0.23, which suggests a distribution in which the average is biased leftward. In actuality, the shape of the histogram was also leftward and slightly wide. - As described above, the diffraction patterns for which the number of peaks in the β-I profile is calculated to be "0" can be grouped based on the difference in the shapes of the histograms, as well as on the values of the skewness Sk, the kurtosis Ku, and the normalized average Xnorm in relation to the diffraction patterns in which the number of peaks are calculated to be "0".
- A mixed powder sample of a mineral was measured while being rotated in an in-plane direction, and X-ray diffraction patterns having a plurality of Debye-Scherrer rings differing in uniformity in the circumferential direction were obtained.
FIG. 19 is a view showing another example of the diffraction pattern of a mixed powder sample of a mineral.FIG. 19 contains 15 diffraction patterns numbered 1 to 15 in the range of 2θ = 25° to 40°, β = 115° to 165° enclosed by a gray outline.FIG. 20 is a diagram showing the 2θ-I profile of the diffraction pattern shown inFIG. 19 . -
FIG. 21 is a diagram illustrating an example of grouping using the normalized average Xnorm and standard deviation s as ring characteristic factors. The present example shows an example in which the normalized average Xnorm and the standard deviation s are calculated as the ring characteristic factors for thediffraction patterns 1 to 15, and grouping the diffraction patterns on the basis thereof. - The diffraction patterns numbered 1, 2, 7, 8, 9, 12, 15 had a normalized average Xnorm of 0.5 or more and were therefore grouped into the same cluster A. The diffraction patterns numbered 3 and 11 had a normalized average Xnorm of less than 0.5 and a standard deviation s of 300 or more, and were therefore grouped into the same cluster B. The diffraction patterns numbered 4 and 10 had a normalized average Xnorm of less than 0.5 and a standard deviation s of 100 or more and less than 300, and were therefore grouped into the same cluster C.
- The diffraction pattern numbered 13 had a normalized average Xnorm of less than 0.5 and a standard deviation s of 50 or more and less than 100, and was therefore grouped into cluster D. The diffraction patterns numbered 5, 6, and 14 had a normalized average Xnorm of less than 0.5 and a standard deviation s of less than 50, and were therefore grouped into the same cluster E.
- As described above, setting a suitable threshold value for each of the ring characteristic factors allows diffraction patterns having different uniformities in the circumferential direction to be grouped into a plurality of clusters.
-
FIG. 21 is an example showing that the normalized average Xnorm and the standard deviation s are useful in grouping diffraction patterns, and the grouping conditions of the clusters can be suitably determined in accordance with the numerical values obtained in individual analyses. -
FIG. 22 is a view showing the results of identifying crystalline phases by automatic searching on the basis of the grouping inFIG. 21 . Mullite was identified from the sets of peak positions and peak intensity ratios of the diffraction patterns grouped into cluster A. Quartz was identified from the sets of peak positions and peak intensity ratios of the diffraction patterns grouped into cluster B. - Rutile was identified from the sets of peak positions and peak intensity ratios of the diffraction patterns grouped into cluster C. Topaz was identified from the sets of peak positions and peak intensity ratios of the diffraction patterns grouped into cluster E.
- The following effects can be obtained in accordance with the first embodiment described above.
- (1) A search for crystalline phase candidates (step 106 of
FIG. 3 ) is carried out with good precision in the identification of a crystalline phase, and analysis precision can be enhanced. - (2) Furthermore, the ring characteristic factors indicating the homogeneity of the intensity in the diffraction patterns in the circumferential direction are determined from the β-I data of the diffraction patterns. Also, the diffraction patterns are grouped into a plurality of clusters in accordance with the ring characteristic factors thus determined. The grouping thereby clarifies the uniformity of the diffraction patterns in the circumferential direction. Clarifying the uniformity thereby allows diffraction patterns having different uniformities in the circumferential direction to be grouped in to a plurality of clusters.
- (3) Moreover, calculating the intensity range R, the standard variance s2, the standard deviation s, or the coefficient of variation CV as ring characteristic factors makes it possible to quantify the degree of uniformity of the diffraction patterns in the circumferential direction.
- (4) Furthermore, using the number of peaks and the peak width in the β-I profile as the ring characteristic factors allows diffraction patterns in which the intensity range R, standard variance s2, standard deviation s, or coefficient of variation CV are about the same value to be grouped into different clusters from differences in the number of peaks and the peak width in the β-I profile.
- (5) Moreover, using an intensity histogram as the ring characteristic factor allows diffraction patterns in which the intensity range R, standard variance s2, standard deviation s, or coefficient of variation CV are about the same value to be grouped into different clusters on the basis of differences in the histogram. Diffraction patterns in which the number of peaks in the β-I profile is calculated to be "0" can also be grouped on the basis of differences in the histogram.
- (6) Furthermore, using the skewness Sk, kurtosis Ku, or normalized average Xnorm of the intensity distribution as the ring characteristic factors allows characteristics of the intensity distribution to be quantified. The characteristics of the quantified intensity distribution can be used in clustering.
- The configuration of the crystalline
phase identification device 20 in a second embodiment of the present invention is similar to or is almost the same as the crystallinephase identification device 20 in the first embodiment described above.FIG. 23 is a flowchart showing an example of a grouping process using the number of peaks in a β-I profile, the peak width in a β-I profile, and the difference in intensity distribution in the second embodiment of the present invention. - The clustering means 26 of the
analysis unit 23 first assesses whether the number of peaks in the β-I profile calculated in step 104 ofFIG. 3 is equal to or greater than a predetermined value set in advance (step 201). In the case that the number of peaks is equal to or greater than a predetermined value, the clustering means 26 groups the diffraction patterns into a cluster containing ring-shaped diffraction patterns having intensity that varies irregularly in the circumferential direction (step 202). - When the number of peaks is not equal to or greater than a predetermined value ("No" in step 201), the clustering means 26 assesses whether the peak width in the β-I profile calculated in step 104 of
FIG. 3 is less than a predetermined set in advance (step 203). When the peak width is less than a predetermined value ("Yes" in step 203), the clustering means 26 groups the diffraction patterns into a cluster containing spot-shaped diffraction patterns (step 204). - When the peak width is not less than a predetermined value ("No" in step 203), the clustering means 26 assesses whether the intensity distribution is biased rightward on the basis of the histogram created in step 104 of
FIG. 3 or the calculated normalized average Xnorm of the intensity distribution (step 205). When the intensity distribution is biased rightward ("Yes" in step 205), the clustering means 26 groups the diffraction patterns into a cluster containing ring-shaped diffraction patterns in which the intensity is uniform in the circumferential direction (step 206). - When the intensity distribution is not biased rightward ("No" in step 205), the clustering means 26 groups the diffraction patterns into a cluster containing ring-shaped diffraction patterns in which the intensity varies intermittently in the circumferential direction (step 207).
- In accordance with the second embodiment described above, the
diffraction patterns 1a to 4a described as specific examples in the first embodiment can be grouped with good efficiency. - The number of peaks, peak width, and intensity distribution are not always required to be used for grouping in the sequence shown in
FIG. 23 . The priority order of these ring characteristic factors to be used in grouping can be modified. - The configuration of the crystalline
phase identification device 20 in a third embodiment of the present invention is also similar to or is also almost the same as the crystallinephase identification device 20 in the first embodiment described above.FIG. 24 is a flowchart illustrating the operation of theanalysis unit 23 in the third embodiment of the present invention. Steps 301 to 303 are the same as steps 101 to 103 ofFIG. 3 . Step 305 is the same asstep 106 ofFIG. 3 . Step 306 is the same asstep 107 ofFIG. 3 . - In step 304, the detection means 25 of the
analysis unit 23 calculates or creates ring characteristic factors on the basis of the β-I data. The clustering means 26 of theanalysis unit 23 groups the diffraction patterns into a plurality of clusters in accordance with the ring characteristic factors thus calculated or created. - In the present embodiment, the process of step 104 and the process of
step 105 ofFIG. 3 in the first embodiment are carried out in combination in the following manner. -
FIG. 25 is a flowchart illustrating an example of a grouping using differences of the number of peaks in a β-I profile, differences of the peak width in a β-I profile, and differences of the difference in intensity distribution in the third embodiment of the present invention. The detection means 25 calculates the number of peaks and the peak width in the β-I profile from the β-I data (step 401). - The clustering means 26 assesses whether the number of peaks in the β-I profile calculated in step 401 is equal to or greater than a predetermined value set in advance (step 402). When the number of peaks is equal to or greater than the predetermined value ("Yes" in step 402), the clustering means 26 groups the diffraction patterns into a cluster containing ring-shaped diffraction patterns in which the intensity varies irregularly in the circumferential direction (step 403).
- When the number of peaks is not equal to or greater than a predetermined value ("No" in step 402), the clustering means 26 assesses whether the peak width in the β-I profile calculated in step 401 is less than a predetermined value set in advance (step 404). When the peak width is less that the predetermined value ("Yes" in step 404), the clustering means 26 groups the diffraction patterns into a cluster containing spot-shaped diffraction patterns (step 405).
- When the peak width is not less than the predetermined value ("No" in step 404), the detection means 25 creates an intensity histogram on the basis of the β-I data, or calculates the normalized average Xnorm of the intensity distribution (step 406). The clustering means 26 assesses whether the intensity distribution is biased rightward on the basis of the histogram created in
step 406 or the calculated normalized average Xnorm of the intensity distribution (step 407). - When the intensity distribution is biased rightward ("Yes" in step 407) the clustering means 26 groups the diffraction patterns into a cluster containing ring-shaped diffraction patterns in which the intensity is uniformed in the circumferential direction (step 408). When the intensity distribution is not biased rightward ("No" in step 407), the clustering means 26 groups the diffraction patterns into a cluster containing ring-shaped diffraction patterns in which the intensity varies intermittently in the circumferential direction (step 409).
- In accordance with the third embodiment, the effects of the second embodiment described above can be obtained. Furthermore, in accordance with the third embodiment, a histogram or the normalized average Xnorm of the intensity distribution is not used as a ring characteristic factor. Moreover, in accordance with the third embodiment, creation or calculation of diffraction patterns that can be grouped is not required. Thus, in the third embodiment, diffraction pattern grouping can be carried out more rapidly because a histogram or the normalized average Xnorm of the intensity distribution is not used as a ring characteristic factor and there is no need to create or calculate diffraction patterns that can be grouped.
- In the present invention, other elements that express homogeneity of intensity of Debye-Scherrer rings in the circumferential direction may be used as ring characteristic factors in addition to those described above.
-
- 1a, 2a, 3a, 4a, 5a, 6a: diffraction patterns; 10: X-ray diffractometer; 11: sample; 12: goniometer; 13: X-ray generator; 14: collimator; 15: X-ray detector; 16: control unit; 17: input/output device; 20: crystalline phase identification device; 21: input means; 22: storage unit; 23: analysis unit; 24: output means; 25: detection means; 26; clustering means; 27: searching means; 30: display device.
Claims (13)
- A crystalline phase identification method for identifying a crystalline phase contained in a sample (11),
from X-ray diffraction data of the sample (11) which contain data of a plurality of ring-shaped diffraction patterns,
using a database (22) in which are registered data related to peak positions of X-ray diffraction patterns for a plurality of crystalline phases and data related to peak intensity ratios of X-ray diffraction patterns for a plurality of crystalline phases,
the crystalline phase identification method characterized in that:peak positions and peak intensities are detected for a plurality of the diffraction patterns from the X-ray diffraction data (S102);circumferential angle (β) versus intensity (I) data is created for a plurality of the diffraction patterns from the X-ray diffraction data (S103);the diffraction patterns are grouped into a plurality of clusters on the basis of the circumferential angle (β) versus intensity (I) data thus created (S104, S105); anda search is made for crystalline phase candidates contained in the sample (11) from the database (22) on the basis of sets of ratios of peak positions and peak intensities of the diffraction patterns grouped into the same cluster (S106). - The crystalline phase identification method according to claim 1, characterized in that
ring characteristic factors representing homogeneity of intensity in the circumferential direction of the diffraction patterns are determined from the circumferential angle (β) versus intensity (I) data of the diffraction patterns (S104), and
the diffraction patterns are grouped into a plurality of clusters in accordance with the ring characteristic factors thus determined (S105). - The crystalline phase identification method according to claim 2, characterized in that
an intensity range (R), a standard variance (s2), a standard deviation (s), or a coefficient of variation (CV), where intensity is a variate (x), are calculated as the ring characteristic factors from the circumferential angle (β) versus intensity (I) data of the diffraction patterns (S104). - The crystalline phase identification method according to claim 2 or 3, characterized in that
a number of peaks and a peak width in a circumferential angle (β) versus intensity (I) profile are calculated as the ring characteristic factors from the circumferential angle (β) versus intensity (I) data of the diffraction patterns (S104). - The crystalline phase identification method according to any of claims 2 to 4, characterized in that
an intensity histogram is created as the ring characteristic factor from the circumferential angle (β) versus intensity (I) data of the diffraction patterns (S104). - The crystalline phase identification method according to any of claims 2 to 5, characterized in that
a skewness, kurtosis, or normalized average Xnorm of the intensity distribution are calculated as the ring characteristic factors from the circumferential angle (β) versus intensity (I) data of the diffraction patterns (S104). - A crystalline phase identification device for identifying a crystalline phase contained in a sample (11), from X-ray diffraction data of the sample (11) which contain data of a plurality of ring-shaped diffraction patterns, using a database (22) in which are registered data related to peak positions of X-ray diffraction patterns for a plurality of crystalline phases and data related to peak intensity ratios of X-ray diffraction patterns for a plurality of crystalline phases,
the crystalline phase identification device characterized in comprising:detection means (25) for detecting peak positions and peak intensities for a plurality of the diffraction patterns from the X-ray diffraction data (S102), and creating circumferential angle (β) versus intensity (I) data (S103) of the diffraction patterns;clustering means (26) for grouping the diffraction patterns into a plurality of clusters on the basis of the circumferential angle (β) versus intensity (I) data thus created by the detection means (S104, S105); andsearching means (27) for searching for crystalline phase candidates contained in the sample (11) from the database (22) on the basis of sets of ratios of peak positions and peak intensities of the diffraction patterns grouped into the same cluster by the clustering means (S106). - The crystalline phase identification device according to claim 7, characterized in that
the detection means (25) determines ring characteristic factors representing homogeneity of intensity in the circumferential direction of the diffraction patterns, from the circumferential angle (β) versus intensity (I) data of the diffraction patterns (S104), and
the clustering means (26) groups the diffraction patterns into a plurality of clusters in accordance with the ring characteristic factors determined by the detection means (25) (S105). - The crystalline phase identification device according to claim 8, characterized in that
the detection means (25) calculates an intensity range (R), a standard variance (s2), a standard deviation (s), or a coefficient of variation (CV), where intensity is a variate (x), are calculated as the ring characteristic factors from the circumferential angle (β) versus intensity (I) data of the diffraction patterns (S104). - The crystalline phase identification device according to claim 8 or 9, characterized in that
the detection means (25) calculates a number of peaks and a peak width in a circumferential angle (β) versus intensity (I) profile as the ring characteristic factors from the circumferential angle (β) versus intensity (I) data of the diffraction patterns (S104). - The crystalline phase identification device according to any of claims 8 to 10, characterized in that
the detection means (25) creates an intensity histogram as the ring characteristic factor from the circumferential angle (β) versus intensity (I) data of the diffraction patterns (S104). - The crystalline phase identification device according to any of claims 8 to 11, characterized in that
the detection means (25) calculates a skewness, kurtosis, or normalized average Xnorm of the intensity distribution as the ring characteristic factors from the circumferential angle (β) versus intensity (I) data of the diffraction patterns (S104). - An X-ray diffraction measurement system characterized in comprising
an X-ray diffractometer (10) for measuring the X-ray diffraction data of a sample, and
the crystalline phase identification device specified in any of claims 7 to 12.
Applications Claiming Priority (1)
| Application Number | Priority Date | Filing Date | Title |
|---|---|---|---|
| JP2016103750A JP6497784B2 (en) | 2016-05-24 | 2016-05-24 | Crystal phase identification method, crystal phase identification apparatus, and X-ray diffraction measurement system |
Publications (2)
| Publication Number | Publication Date |
|---|---|
| EP3249392A1 true EP3249392A1 (en) | 2017-11-29 |
| EP3249392B1 EP3249392B1 (en) | 2021-10-13 |
Family
ID=58664500
Family Applications (1)
| Application Number | Title | Priority Date | Filing Date |
|---|---|---|---|
| EP17167900.4A Active EP3249392B1 (en) | 2016-05-24 | 2017-04-25 | Crystalline phase identification method, crystalline phase identification device, and x-ray diffraction measurement system |
Country Status (4)
| Country | Link |
|---|---|
| US (1) | US10161888B2 (en) |
| EP (1) | EP3249392B1 (en) |
| JP (1) | JP6497784B2 (en) |
| CN (1) | CN107421971B (en) |
Cited By (2)
| Publication number | Priority date | Publication date | Assignee | Title |
|---|---|---|---|---|
| EP3450968A1 (en) | 2017-08-29 | 2019-03-06 | Rigaku Corporation | Method for displaying measurement results from x-ray diffraction measurement |
| WO2021103368A1 (en) * | 2020-03-31 | 2021-06-03 | 深圳晶泰科技有限公司 | Powder x-ray diffraction pattern diffraction peak calibration method |
Families Citing this family (10)
| Publication number | Priority date | Publication date | Assignee | Title |
|---|---|---|---|---|
| JP2018205247A (en) * | 2017-06-08 | 2018-12-27 | 富士通株式会社 | X-ray diffraction analysis method and X-ray diffraction analysis apparatus |
| CN113447506B (en) * | 2020-03-26 | 2022-07-08 | 国标(北京)检验认证有限公司 | Rapid analysis method for phase ratio of two-phase titanium alloy |
| CN111595877B (en) * | 2020-05-27 | 2022-03-29 | 合肥工业大学 | Multi-contrast image extraction method for X-ray diffraction enhanced imaging |
| JP7414280B2 (en) * | 2020-12-11 | 2024-01-16 | 株式会社リガク | Mixture diffraction pattern analysis method, device, program and information storage medium |
| CN112782203B (en) * | 2021-02-22 | 2024-02-20 | 长江存储科技有限责任公司 | A method for judging crystal phase structure and crystal phase calibration template |
| CN113325016B (en) * | 2021-05-12 | 2022-05-06 | 西安交通大学 | Method for calibrating multiple subcrystals in Laue diffraction patterns with diffraction peak splitting |
| CN115479963A (en) * | 2021-06-16 | 2022-12-16 | 中国石油天然气股份有限公司 | A method for measuring euhedral degree of igneous rock minerals |
| CN115598157B (en) * | 2021-06-25 | 2025-04-11 | 中国兵器工业第五九研究所 | A short-wavelength characteristic X-ray diffraction device and method based on array detection |
| JP7833174B2 (en) * | 2022-03-02 | 2026-03-19 | 株式会社リガク | Diffraction pattern analyzer for mixtures, method, program, and information storage medium |
| JP7843497B2 (en) * | 2022-11-14 | 2026-04-10 | 株式会社リガク | Crystallinity measuring apparatus, crystallinity measuring method, and program |
Citations (2)
| Publication number | Priority date | Publication date | Assignee | Title |
|---|---|---|---|---|
| US6269144B1 (en) * | 1998-03-04 | 2001-07-31 | William P. Dube | Method and apparatus for diffraction measurement using a scanning x-ray source |
| JP2014178203A (en) | 2013-03-14 | 2014-09-25 | Rigaku Corp | Crystal phase identification method, crystal phase identification device and crystal phase identification program |
Family Cites Families (12)
| Publication number | Priority date | Publication date | Assignee | Title |
|---|---|---|---|---|
| JPH0961380A (en) * | 1995-08-23 | 1997-03-07 | Rigaku Corp | X-ray device using two-dimensional x-ray detector |
| JPH09281061A (en) * | 1996-04-17 | 1997-10-31 | Fujitsu Ltd | Crystal orientation evaluation system |
| US6326619B1 (en) * | 1998-07-01 | 2001-12-04 | Sandia Corporation | Crystal phase identification |
| JP4565774B2 (en) * | 2001-06-18 | 2010-10-20 | 株式会社リガク | Substance identification method and substance identification system |
| JP3731207B2 (en) * | 2003-09-17 | 2006-01-05 | 株式会社リガク | X-ray analyzer |
| JP4022512B2 (en) * | 2003-11-14 | 2007-12-19 | Tdk株式会社 | Crystal analysis method and crystal analysis apparatus |
| JP4003968B2 (en) * | 2004-02-27 | 2007-11-07 | 株式会社リガク | X-ray analyzer |
| US8932553B2 (en) * | 2009-03-09 | 2015-01-13 | Institut National De La Sante Et De La Recherche Medical (Inserm) | Method for manufacturing cubic diamond nanocrystals |
| US8111807B2 (en) * | 2009-09-16 | 2012-02-07 | Rigaku Corporation | Crystallite size analysis method and apparatus using powder X-ray diffraction |
| JP5160520B2 (en) * | 2009-09-25 | 2013-03-13 | 株式会社東芝 | Crystal lattice moire pattern acquisition method and scanning microscope |
| US8903150B2 (en) * | 2011-07-31 | 2014-12-02 | Varian Medical Systems, Inc. | Filtration imaging enhancement method and system |
| US9835570B2 (en) * | 2013-09-13 | 2017-12-05 | The United States Of America As Represented By The Administrator Of Nasa | X-ray diffraction (XRD) characterization methods for sigma=3 twin defects in cubic semiconductor (100) wafers |
-
2016
- 2016-05-24 JP JP2016103750A patent/JP6497784B2/en active Active
-
2017
- 2017-04-05 US US15/479,473 patent/US10161888B2/en active Active
- 2017-04-25 EP EP17167900.4A patent/EP3249392B1/en active Active
- 2017-05-24 CN CN201710373083.2A patent/CN107421971B/en active Active
Patent Citations (2)
| Publication number | Priority date | Publication date | Assignee | Title |
|---|---|---|---|---|
| US6269144B1 (en) * | 1998-03-04 | 2001-07-31 | William P. Dube | Method and apparatus for diffraction measurement using a scanning x-ray source |
| JP2014178203A (en) | 2013-03-14 | 2014-09-25 | Rigaku Corp | Crystal phase identification method, crystal phase identification device and crystal phase identification program |
Non-Patent Citations (3)
| Title |
|---|
| JAMES R. CONNOLLY: "Diffraction Basics, Part 2", 1 January 2012 (2012-01-01), XP055399560, Retrieved from the Internet <URL:http://epswww.unm.edu/media/pdf/06-Diffraction-II.pdf> [retrieved on 20170818] * |
| MARTIN ETTER ET AL: "A Century of Powder Diffraction: a Brief History : A Century of Powder Diffraction: a Brief History", ZEITSCHRIFT FUR ANORGANISCHE UND ALLGEMEINE CHEMIE., vol. 640, no. 15, 1 December 2014 (2014-12-01), DE, pages 3015 - 3028, XP055399545, ISSN: 0044-2313, DOI: 10.1002/zaac.201400526 * |
| PAUL F. FEWSTER: "A new theory for X-ray diffraction", ACTA CRYSTALLOGRAPHICA SECTION A FOUNDATIONS AND ADVANCES, vol. 70, no. 3, 27 March 2014 (2014-03-27), pages 257 - 282, XP055399548, DOI: 10.1107/S205327331400117X * |
Cited By (2)
| Publication number | Priority date | Publication date | Assignee | Title |
|---|---|---|---|---|
| EP3450968A1 (en) | 2017-08-29 | 2019-03-06 | Rigaku Corporation | Method for displaying measurement results from x-ray diffraction measurement |
| WO2021103368A1 (en) * | 2020-03-31 | 2021-06-03 | 深圳晶泰科技有限公司 | Powder x-ray diffraction pattern diffraction peak calibration method |
Also Published As
| Publication number | Publication date |
|---|---|
| US10161888B2 (en) | 2018-12-25 |
| CN107421971A (en) | 2017-12-01 |
| JP6497784B2 (en) | 2019-04-10 |
| CN107421971B (en) | 2020-05-12 |
| US20170343492A1 (en) | 2017-11-30 |
| JP2017211251A (en) | 2017-11-30 |
| EP3249392B1 (en) | 2021-10-13 |
Similar Documents
| Publication | Publication Date | Title |
|---|---|---|
| EP3249392B1 (en) | Crystalline phase identification method, crystalline phase identification device, and x-ray diffraction measurement system | |
| Palatinus et al. | Specifics of the data processing of precession electron diffraction tomography data and their implementation in the program PETS2. 0 | |
| US6326619B1 (en) | Crystal phase identification | |
| CN109425626B (en) | Method for displaying measurement result in X-ray diffraction measurement | |
| CN106030294B (en) | Method for calibrating crystallographic orientation of samples prepared from polycrystalline materials | |
| Morawiec | Automatic orientation determination from Kikuchi patterns | |
| EP3705877A1 (en) | Methods and apparatus for electron backscatter diffraction sample characterisation | |
| CN106959312B (en) | A scanning Laue diffraction pattern analysis method based on peak position comparison | |
| Dingley et al. | Determination of crystal phase from an electron backscatter diffraction pattern | |
| Sinha et al. | Electron diffraction characterization of nanocrystalline materials using a Rietveld-based approach. Part I. Methodology | |
| Schmidt et al. | Structural refinements of the individual grains within polycrystals and powders | |
| JP2016191562A (en) | Analysis method of crystal orientation and analysis device | |
| Rodriguez-Navarro et al. | Analysis of avian eggshell microstructure using X-ray area detectors | |
| JP2003532862A (en) | Method and apparatus for analyzing material composition | |
| Schwenzer et al. | Ensemble Kalman filtering for force model identification in milling | |
| Liu et al. | EDP2XRD: a computer program for converting electron diffraction patterns into X-ray diffraction patterns | |
| CN110927190B (en) | A Method for Identifying Diffraction Peaks of the Same Crystal Band Axis in Laue Diffraction Patterns | |
| Ball et al. | Implementing and evaluating far-field 3D X-ray diffraction at the I12 JEEP beamline, Diamond Light Source | |
| US12074072B2 (en) | Semiconductor manufacturing equipment and semiconductor manufacturing method | |
| CN113390908A (en) | Method for measuring interplanar spacing based on electron back scattering diffraction pattern | |
| CN116490765A (en) | Method for Classifying Unknown Particles on Semiconductor Wafer Surfaces | |
| CN120809025B (en) | Materials measurement methods, devices, electronic equipment and storage media | |
| CN115219391A (en) | Wafer surface particle size detector calibration method, device and terminal equipment | |
| Leake et al. | Cluster method for analysing surface X-ray diffraction data sets using area detectors | |
| Morawiec | Indexing of Electron Spot-Type Diffraction Patterns |
Legal Events
| Date | Code | Title | Description |
|---|---|---|---|
| PUAI | Public reference made under article 153(3) epc to a published international application that has entered the european phase |
Free format text: ORIGINAL CODE: 0009012 |
|
| STAA | Information on the status of an ep patent application or granted ep patent |
Free format text: STATUS: THE APPLICATION HAS BEEN PUBLISHED |
|
| AK | Designated contracting states |
Kind code of ref document: A1 Designated state(s): AL AT BE BG CH CY CZ DE DK EE ES FI FR GB GR HR HU IE IS IT LI LT LU LV MC MK MT NL NO PL PT RO RS SE SI SK SM TR |
|
| AX | Request for extension of the european patent |
Extension state: BA ME |
|
| STAA | Information on the status of an ep patent application or granted ep patent |
Free format text: STATUS: REQUEST FOR EXAMINATION WAS MADE |
|
| 17P | Request for examination filed |
Effective date: 20180529 |
|
| RBV | Designated contracting states (corrected) |
Designated state(s): AL AT BE BG CH CY CZ DE DK EE ES FI FR GB GR HR HU IE IS IT LI LT LU LV MC MK MT NL NO PL PT RO RS SE SI SK SM TR |
|
| GRAP | Despatch of communication of intention to grant a patent |
Free format text: ORIGINAL CODE: EPIDOSNIGR1 |
|
| STAA | Information on the status of an ep patent application or granted ep patent |
Free format text: STATUS: GRANT OF PATENT IS INTENDED |
|
| INTG | Intention to grant announced |
Effective date: 20210707 |
|
| GRAS | Grant fee paid |
Free format text: ORIGINAL CODE: EPIDOSNIGR3 |
|
| GRAA | (expected) grant |
Free format text: ORIGINAL CODE: 0009210 |
|
| STAA | Information on the status of an ep patent application or granted ep patent |
Free format text: STATUS: THE PATENT HAS BEEN GRANTED |
|
| AK | Designated contracting states |
Kind code of ref document: B1 Designated state(s): AL AT BE BG CH CY CZ DE DK EE ES FI FR GB GR HR HU IE IS IT LI LT LU LV MC MK MT NL NO PL PT RO RS SE SI SK SM TR |
|
| REG | Reference to a national code |
Ref country code: GB Ref legal event code: FG4D |
|
| REG | Reference to a national code |
Ref country code: CH Ref legal event code: EP |
|
| REG | Reference to a national code |
Ref country code: DE Ref legal event code: R096 Ref document number: 602017047457 Country of ref document: DE |
|
| REG | Reference to a national code |
Ref country code: IE Ref legal event code: FG4D |
|
| REG | Reference to a national code |
Ref country code: AT Ref legal event code: REF Ref document number: 1438525 Country of ref document: AT Kind code of ref document: T Effective date: 20211115 |
|
| REG | Reference to a national code |
Ref country code: NL Ref legal event code: FP |
|
| REG | Reference to a national code |
Ref country code: LT Ref legal event code: MG9D |
|
| REG | Reference to a national code |
Ref country code: AT Ref legal event code: MK05 Ref document number: 1438525 Country of ref document: AT Kind code of ref document: T Effective date: 20211013 |
|
| PG25 | Lapsed in a contracting state [announced via postgrant information from national office to epo] |
Ref country code: RS Free format text: LAPSE BECAUSE OF FAILURE TO SUBMIT A TRANSLATION OF THE DESCRIPTION OR TO PAY THE FEE WITHIN THE PRESCRIBED TIME-LIMIT Effective date: 20211013 Ref country code: LT Free format text: LAPSE BECAUSE OF FAILURE TO SUBMIT A TRANSLATION OF THE DESCRIPTION OR TO PAY THE FEE WITHIN THE PRESCRIBED TIME-LIMIT Effective date: 20211013 Ref country code: FI Free format text: LAPSE BECAUSE OF FAILURE TO SUBMIT A TRANSLATION OF THE DESCRIPTION OR TO PAY THE FEE WITHIN THE PRESCRIBED TIME-LIMIT Effective date: 20211013 Ref country code: BG Free format text: LAPSE BECAUSE OF FAILURE TO SUBMIT A TRANSLATION OF THE DESCRIPTION OR TO PAY THE FEE WITHIN THE PRESCRIBED TIME-LIMIT Effective date: 20220113 Ref country code: AT Free format text: LAPSE BECAUSE OF FAILURE TO SUBMIT A TRANSLATION OF THE DESCRIPTION OR TO PAY THE FEE WITHIN THE PRESCRIBED TIME-LIMIT Effective date: 20211013 |
|
| PG25 | Lapsed in a contracting state [announced via postgrant information from national office to epo] |
Ref country code: IS Free format text: LAPSE BECAUSE OF FAILURE TO SUBMIT A TRANSLATION OF THE DESCRIPTION OR TO PAY THE FEE WITHIN THE PRESCRIBED TIME-LIMIT Effective date: 20220213 Ref country code: SE Free format text: LAPSE BECAUSE OF FAILURE TO SUBMIT A TRANSLATION OF THE DESCRIPTION OR TO PAY THE FEE WITHIN THE PRESCRIBED TIME-LIMIT Effective date: 20211013 Ref country code: PT Free format text: LAPSE BECAUSE OF FAILURE TO SUBMIT A TRANSLATION OF THE DESCRIPTION OR TO PAY THE FEE WITHIN THE PRESCRIBED TIME-LIMIT Effective date: 20220214 Ref country code: PL Free format text: LAPSE BECAUSE OF FAILURE TO SUBMIT A TRANSLATION OF THE DESCRIPTION OR TO PAY THE FEE WITHIN THE PRESCRIBED TIME-LIMIT Effective date: 20211013 Ref country code: NO Free format text: LAPSE BECAUSE OF FAILURE TO SUBMIT A TRANSLATION OF THE DESCRIPTION OR TO PAY THE FEE WITHIN THE PRESCRIBED TIME-LIMIT Effective date: 20220113 Ref country code: LV Free format text: LAPSE BECAUSE OF FAILURE TO SUBMIT A TRANSLATION OF THE DESCRIPTION OR TO PAY THE FEE WITHIN THE PRESCRIBED TIME-LIMIT Effective date: 20211013 Ref country code: HR Free format text: LAPSE BECAUSE OF FAILURE TO SUBMIT A TRANSLATION OF THE DESCRIPTION OR TO PAY THE FEE WITHIN THE PRESCRIBED TIME-LIMIT Effective date: 20211013 Ref country code: GR Free format text: LAPSE BECAUSE OF FAILURE TO SUBMIT A TRANSLATION OF THE DESCRIPTION OR TO PAY THE FEE WITHIN THE PRESCRIBED TIME-LIMIT Effective date: 20220114 Ref country code: ES Free format text: LAPSE BECAUSE OF FAILURE TO SUBMIT A TRANSLATION OF THE DESCRIPTION OR TO PAY THE FEE WITHIN THE PRESCRIBED TIME-LIMIT Effective date: 20211013 |
|
| REG | Reference to a national code |
Ref country code: DE Ref legal event code: R097 Ref document number: 602017047457 Country of ref document: DE |
|
| PG25 | Lapsed in a contracting state [announced via postgrant information from national office to epo] |
Ref country code: SM Free format text: LAPSE BECAUSE OF FAILURE TO SUBMIT A TRANSLATION OF THE DESCRIPTION OR TO PAY THE FEE WITHIN THE PRESCRIBED TIME-LIMIT Effective date: 20211013 Ref country code: SK Free format text: LAPSE BECAUSE OF FAILURE TO SUBMIT A TRANSLATION OF THE DESCRIPTION OR TO PAY THE FEE WITHIN THE PRESCRIBED TIME-LIMIT Effective date: 20211013 Ref country code: RO Free format text: LAPSE BECAUSE OF FAILURE TO SUBMIT A TRANSLATION OF THE DESCRIPTION OR TO PAY THE FEE WITHIN THE PRESCRIBED TIME-LIMIT Effective date: 20211013 Ref country code: EE Free format text: LAPSE BECAUSE OF FAILURE TO SUBMIT A TRANSLATION OF THE DESCRIPTION OR TO PAY THE FEE WITHIN THE PRESCRIBED TIME-LIMIT Effective date: 20211013 Ref country code: DK Free format text: LAPSE BECAUSE OF FAILURE TO SUBMIT A TRANSLATION OF THE DESCRIPTION OR TO PAY THE FEE WITHIN THE PRESCRIBED TIME-LIMIT Effective date: 20211013 Ref country code: CZ Free format text: LAPSE BECAUSE OF FAILURE TO SUBMIT A TRANSLATION OF THE DESCRIPTION OR TO PAY THE FEE WITHIN THE PRESCRIBED TIME-LIMIT Effective date: 20211013 |
|
| PLBE | No opposition filed within time limit |
Free format text: ORIGINAL CODE: 0009261 |
|
| STAA | Information on the status of an ep patent application or granted ep patent |
Free format text: STATUS: NO OPPOSITION FILED WITHIN TIME LIMIT |
|
| 26N | No opposition filed |
Effective date: 20220714 |
|
| PG25 | Lapsed in a contracting state [announced via postgrant information from national office to epo] |
Ref country code: AL Free format text: LAPSE BECAUSE OF FAILURE TO SUBMIT A TRANSLATION OF THE DESCRIPTION OR TO PAY THE FEE WITHIN THE PRESCRIBED TIME-LIMIT Effective date: 20211013 |
|
| PG25 | Lapsed in a contracting state [announced via postgrant information from national office to epo] |
Ref country code: SI Free format text: LAPSE BECAUSE OF FAILURE TO SUBMIT A TRANSLATION OF THE DESCRIPTION OR TO PAY THE FEE WITHIN THE PRESCRIBED TIME-LIMIT Effective date: 20211013 |
|
| REG | Reference to a national code |
Ref country code: CH Ref legal event code: PL |
|
| GBPC | Gb: european patent ceased through non-payment of renewal fee |
Effective date: 20220425 |
|
| REG | Reference to a national code |
Ref country code: BE Ref legal event code: MM Effective date: 20220430 |
|
| PG25 | Lapsed in a contracting state [announced via postgrant information from national office to epo] |
Ref country code: MC Free format text: LAPSE BECAUSE OF FAILURE TO SUBMIT A TRANSLATION OF THE DESCRIPTION OR TO PAY THE FEE WITHIN THE PRESCRIBED TIME-LIMIT Effective date: 20211013 Ref country code: LU Free format text: LAPSE BECAUSE OF NON-PAYMENT OF DUE FEES Effective date: 20220425 Ref country code: LI Free format text: LAPSE BECAUSE OF NON-PAYMENT OF DUE FEES Effective date: 20220430 Ref country code: GB Free format text: LAPSE BECAUSE OF NON-PAYMENT OF DUE FEES Effective date: 20220425 Ref country code: FR Free format text: LAPSE BECAUSE OF NON-PAYMENT OF DUE FEES Effective date: 20220430 Ref country code: CH Free format text: LAPSE BECAUSE OF NON-PAYMENT OF DUE FEES Effective date: 20220430 |
|
| PG25 | Lapsed in a contracting state [announced via postgrant information from national office to epo] |
Ref country code: BE Free format text: LAPSE BECAUSE OF NON-PAYMENT OF DUE FEES Effective date: 20220430 |
|
| PG25 | Lapsed in a contracting state [announced via postgrant information from national office to epo] |
Ref country code: IE Free format text: LAPSE BECAUSE OF NON-PAYMENT OF DUE FEES Effective date: 20220425 |
|
| PG25 | Lapsed in a contracting state [announced via postgrant information from national office to epo] |
Ref country code: IT Free format text: LAPSE BECAUSE OF FAILURE TO SUBMIT A TRANSLATION OF THE DESCRIPTION OR TO PAY THE FEE WITHIN THE PRESCRIBED TIME-LIMIT Effective date: 20211013 |
|
| P01 | Opt-out of the competence of the unified patent court (upc) registered |
Effective date: 20230507 |
|
| PG25 | Lapsed in a contracting state [announced via postgrant information from national office to epo] |
Ref country code: HU Free format text: LAPSE BECAUSE OF FAILURE TO SUBMIT A TRANSLATION OF THE DESCRIPTION OR TO PAY THE FEE WITHIN THE PRESCRIBED TIME-LIMIT; INVALID AB INITIO Effective date: 20170425 |
|
| PG25 | Lapsed in a contracting state [announced via postgrant information from national office to epo] |
Ref country code: MK Free format text: LAPSE BECAUSE OF FAILURE TO SUBMIT A TRANSLATION OF THE DESCRIPTION OR TO PAY THE FEE WITHIN THE PRESCRIBED TIME-LIMIT Effective date: 20211013 Ref country code: CY Free format text: LAPSE BECAUSE OF FAILURE TO SUBMIT A TRANSLATION OF THE DESCRIPTION OR TO PAY THE FEE WITHIN THE PRESCRIBED TIME-LIMIT Effective date: 20211013 |
|
| PG25 | Lapsed in a contracting state [announced via postgrant information from national office to epo] |
Ref country code: MT Free format text: LAPSE BECAUSE OF FAILURE TO SUBMIT A TRANSLATION OF THE DESCRIPTION OR TO PAY THE FEE WITHIN THE PRESCRIBED TIME-LIMIT Effective date: 20211013 |
|
| PGFP | Annual fee paid to national office [announced via postgrant information from national office to epo] |
Ref country code: NL Payment date: 20250418 Year of fee payment: 9 |
|
| PGFP | Annual fee paid to national office [announced via postgrant information from national office to epo] |
Ref country code: DE Payment date: 20250422 Year of fee payment: 9 |
|
| PG25 | Lapsed in a contracting state [announced via postgrant information from national office to epo] |
Ref country code: TR Free format text: LAPSE BECAUSE OF FAILURE TO SUBMIT A TRANSLATION OF THE DESCRIPTION OR TO PAY THE FEE WITHIN THE PRESCRIBED TIME-LIMIT Effective date: 20211013 |