EP3206077B1 - Induced aperture lens and method - Google Patents
Induced aperture lens and method Download PDFInfo
- Publication number
- EP3206077B1 EP3206077B1 EP16170493.7A EP16170493A EP3206077B1 EP 3206077 B1 EP3206077 B1 EP 3206077B1 EP 16170493 A EP16170493 A EP 16170493A EP 3206077 B1 EP3206077 B1 EP 3206077B1
- Authority
- EP
- European Patent Office
- Prior art keywords
- lens
- power
- avg
- lenses
- design
- Prior art date
- Legal status (The legal status is an assumption and is not a legal conclusion. Google has not performed a legal analysis and makes no representation as to the accuracy of the status listed.)
- Active
Links
Images



Classifications
-
- G—PHYSICS
- G02—OPTICS
- G02C—SPECTACLES; SUNGLASSES OR GOGGLES INSOFAR AS THEY HAVE THE SAME FEATURES AS SPECTACLES; CONTACT LENSES
- G02C7/00—Optical parts
- G02C7/02—Lenses; Lens systems ; Methods of designing lenses
- G02C7/04—Contact lenses for the eyes
- G02C7/041—Contact lenses for the eyes bifocal; multifocal
-
- G—PHYSICS
- G02—OPTICS
- G02C—SPECTACLES; SUNGLASSES OR GOGGLES INSOFAR AS THEY HAVE THE SAME FEATURES AS SPECTACLES; CONTACT LENSES
- G02C7/00—Optical parts
- G02C7/02—Lenses; Lens systems ; Methods of designing lenses
- G02C7/04—Contact lenses for the eyes
- G02C7/041—Contact lenses for the eyes bifocal; multifocal
- G02C7/042—Simultaneous type
-
- G—PHYSICS
- G02—OPTICS
- G02C—SPECTACLES; SUNGLASSES OR GOGGLES INSOFAR AS THEY HAVE THE SAME FEATURES AS SPECTACLES; CONTACT LENSES
- G02C7/00—Optical parts
- G02C7/02—Lenses; Lens systems ; Methods of designing lenses
- G02C7/024—Methods of designing ophthalmic lenses
-
- G—PHYSICS
- G02—OPTICS
- G02C—SPECTACLES; SUNGLASSES OR GOGGLES INSOFAR AS THEY HAVE THE SAME FEATURES AS SPECTACLES; CONTACT LENSES
- G02C7/00—Optical parts
- G02C7/02—Lenses; Lens systems ; Methods of designing lenses
- G02C7/022—Ophthalmic lenses having special refractive features achieved by special materials or material structures
-
- G—PHYSICS
- G02—OPTICS
- G02C—SPECTACLES; SUNGLASSES OR GOGGLES INSOFAR AS THEY HAVE THE SAME FEATURES AS SPECTACLES; CONTACT LENSES
- G02C7/00—Optical parts
- G02C7/02—Lenses; Lens systems ; Methods of designing lenses
- G02C7/04—Contact lenses for the eyes
- G02C7/047—Contact lens fitting; Contact lenses for orthokeratology; Contact lenses for specially shaped corneae
-
- G—PHYSICS
- G02—OPTICS
- G02C—SPECTACLES; SUNGLASSES OR GOGGLES INSOFAR AS THEY HAVE THE SAME FEATURES AS SPECTACLES; CONTACT LENSES
- G02C7/00—Optical parts
- G02C7/02—Lenses; Lens systems ; Methods of designing lenses
- G02C7/04—Contact lenses for the eyes
- G02C7/049—Contact lenses having special fitting or structural features achieved by special materials or material structures
-
- A—HUMAN NECESSITIES
- A45—HAND OR TRAVELLING ARTICLES
- A45C—PURSES; LUGGAGE; HAND CARRIED BAGS
- A45C11/00—Receptacles for purposes not provided for in groups A45C1/00-A45C9/00
- A45C11/005—Contact lens cases
-
- G—PHYSICS
- G02—OPTICS
- G02C—SPECTACLES; SUNGLASSES OR GOGGLES INSOFAR AS THEY HAVE THE SAME FEATURES AS SPECTACLES; CONTACT LENSES
- G02C2202/00—Generic optical aspects applicable to one or more of the subgroups of G02C7/00
- G02C2202/24—Myopia progression prevention
-
- G—PHYSICS
- G02—OPTICS
- G02C—SPECTACLES; SUNGLASSES OR GOGGLES INSOFAR AS THEY HAVE THE SAME FEATURES AS SPECTACLES; CONTACT LENSES
- G02C7/00—Optical parts
- G02C7/02—Lenses; Lens systems ; Methods of designing lenses
- G02C7/04—Contact lenses for the eyes
- G02C7/041—Contact lenses for the eyes bifocal; multifocal
- G02C7/044—Annular configuration, e.g. pupil tuned
Definitions
- the present application relates generally to optical lenses. More particularly, the present application relates to methods for creating optical lenses with induced apertures and parameters for improving the vision of the wearer and comfort of the lenses.
- Myopia or short sightedness is a condition in which the far-point of the eye is less than infinite in distance from the surface of the eye.
- a myopic eye can see objects clearly only within a finite distance limited by the level of myopia in the eye.
- Advancing myopia is the result of the scleral ball of the eye elongating so that the retina that lies against the posterior inner wall of the eye moves behind the eye's distance image focal point.
- a light diverging or "minus" lens is conventionally used to move the focused light from in front of the retina backward to the retinal plane.
- the minus lens whether spectacle lens, intraocular lens, contact lens, or other light diverging ophthalmic device, allows the myopic eye to regain the clarity of objects at a longer distance.
- Presbyopia is generally accepted to be caused by the lack of elasticity of the crystalline lens in the eye.
- the eye accommodates the divergent, rather than parallel, light arriving from the near object.
- the eye will then perform the act of accommodation resulting in a physical change to steepen the shape of the crystalline lens within the eye.
- Accommodation increases the convergence of light waves by causing the eye's intraocular lens surfaces to be more steeply curved, which in turn adds focal power to the optical system of the eye. The closer an object is viewed, the greater the accommodative demand placed on the eye.
- a person's crystalline lens will stiffen as the person ages, losing its accommodative ability and likewise losing its ability to change shape. This stiffening therefore prevents the eye from focusing light properly when viewing objects at close range, leading to the condition known as presbyopia.
- Reading glasses are commonly provided to treat presbyopia.
- U.S. Patent Application No. 14/126,056 and U.S. Patent No. 7,178,918 describe a lens that includes a central zone of clear vision where the refractive power rises slowly and continuously from a central power to a limit of clear vision. This central zone is surrounded by a more rapidly increasing power distribution generating a perceivable blur to the user in the area surrounding the central power.
- Such a power distribution has a central or apex area having distance vision correcting power and a power distribution creating a blurred region outside of the apex area so as to cause an "induced aperture.”
- the lens is not a physical pinhole, it produces similar increased depth of focus effects to the user without suffering from the loss of light and increased diffraction inherent in physical pinholes. This lens increases the depth of focus, therefore requiring less from the eye's accommodation to see clearly at near distances, and reducing accommodative stress to thereby limit the progression of myopia and treat presbyopia.
- the induced aperture can be most advantageous when located near the center of the wearer's eye. Because of this, movement of the lens is permitted, but movement beyond a particular threshold can prevent the induced aperture from performing its intended function. Also, traditional American National Standards Institute (ANSI) methods of characterizing soft contact lens power profiles were inadequate to predict clinical performance for the induced aperture lenses. These standards were also inadequate to produce lenses of a single power profile for a wide range of presbyopia.
- ANSI American National Standards Institute
- the present application discloses, for example, lenses and methods for verifying a lens with an induced aperture.
- the induced aperture can include a clear power around a center point of the wearer's eye, and a blur region immediately surrounding the center point. The wearer will therefore not perceive an aperture in the middle of their vision but will have the optical benefits of an aperture without a physical aperture in the lens.
- the power rise about the distance power of the apical aperture is not seen by wearers while viewing distance objects through the aperture. This feature of the aperture allows for a wide range of presbyopia correction.
- the lenses can have a geometry that maintains a centered position about a wearer's eye to prevent more than a permissible amount of movement of the lens relative to the eye. Further disclosed is a method for verifying that the power profiles used with the lens correspond to labeled powers a user would normally wear with a lens not having an induced aperture.
- a lens according to the present application can include a continuous axi-symmetric power distribution that provides multiple functions.
- a central portion or apex of the lens can have a power distribution selected preferably for correcting a user's distance vision.
- the power distribution can increase in power quickly over a short radial dimension to produce a blur effect on the user's vision.
- This radial area of rapidly rising power is termed here for convenience a "blur" zone.
- the magnitude of blur in the blur zone can be selected so that the eye cannot resolve a level of detail in the distance.
- This induced optical aperture generates an increased depth of focus due in part to the user's cortical response to the blur of inhibition.
- the associated increased depth of focus of the lens will compensate, at least partially, for defocus occurring when the user attempts near vision.
- This compensatory or "pseudo" accommodation provides clearer vision for the presbyope and reduced accommodative stress and accommodative lag stress that are believed to be associated with myopia progression.
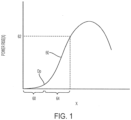
- FIG. 1 depicts a graph of the distribution 50 of the optical power rise as a function of radial dimension (x) from the apex of a lens according to the invention.
- the term "power rise” can mean the power above the distance corrective power at the apex of the lens (apical power).
- a centrally located distance vision region 60 has a power distribution that varies within a power range for distance vision correction.
- the distance correction power is that power providing clear vision when viewing objects infinitely distant from the user.
- the distribution power rise initially increases continuously but slowly as the radius moves away from the apical center. This continues to a design point D p at a radial dimension in the range of about 0.5 to 1.5 millimeters from the apex, for example.
- the power increases more quickly and continuously until a maximum power value 62 is reached.
- the portion of the lens and power distribution 50 between the design point D p and peak power 62 defines and creates a blur zone 64.
- the rapidly rising power in the blur zone 64 produces the unfocused light impinging peripherally on the retina to create a blur.
- the power distribution rises sufficiently quickly to create a blur and to reach a maximum power within the constraint of the pupillary dimension.
- the blur produced by the lens is inhibited or suppressed by the user's optical cortical system. Accordingly, the blur is not recognized by the user.
- the power distribution 50 is shown to continue beyond the peak power to illustrate that the power distribution 50 may be defined as a portion of a continuous power relationship.
- the optical power is the front surface tangential power, which may be somewhat different from the through lens sagittal power or average power at any point on a lens.
- lens parameters including base curve radius, diameter, and thickness profile, to minimize (although not necessarily prevent) lens movement about the eye.
- the lens parameters also allowed the lens to center about the visible iris.
- the inventors discovered induced aperture lenses to generally be neither too tight nor too loose when the base curve is a radius between 7.9 mm and 8.5 mm, preferably 8.1 mm to 8.3 mm.
- the inventors discovered a well-fitting lens with a back surface saggital depth (otherwise known by the abbreviation "sag") between 3.7 mm to 4.75 mm, preferably 3.9 mm to 4.75 mm, more preferably 4.05 mm to 4.50 mm ; the lens diameter defined in the claims is between 14.0 mm to 14.5 mm, preferably 14.3 mm to 14.5 mm. Outside of these ranges, the inventors discovered the performance and fit of the lens to decline unexpectedly, showing the criticality of these ranges.
- the present inventors discovered increased performance with lenses having an edge thickness of 0.145 mm at 0.30 mm radially in from the lens edge verifying that. Further, well-fitting lenses as defined in the claims have a thickness profile with a center thickness between 0.100-0.120mm and a peripheral thickness of 0.220-0.310 at a chord diameter of 12.30 mm. Below are tables illustrating the data collected by the inventors that contributed to the discovery of the above ranges.
- Table 1-A Base Curve Range Chart Base Curve Thickness-Center, Peripheral Test Number Movement With Blink Primary Gaze Lag Up Gaze Lag 7.9 0.120, 0.220 18 avg 0.10mm, 10% 0.0mm movement avg 0.07mm, 0% >0.3mm avg 0.22mm, 0% >0.3mm 7.9 0.120, 0.310 19 avg 0.08mm, 26% 0.0mm movement avg 0.06mm, 0% >0.3mm avg 0.19mm, 0% >0.3mm 8.1 0.120, 0.220 15 N/A avg 0.14mm, 0% >0.3mm avg 0.31mm, 39% >0.3mm 8.1 0.120, 0.310 17 avg 0.09mm, 16% 0.0mm movement avg 0.05mm, 0% >0.3mm avg 0.17mm, 2% >0.3mm 8.1 0.120, 0.310 21 avg 0.11mm, 0% 0.0mm movement avg 0.12mm, 0% >0.3mm
- Tables 1-A and 1-B include the tested "Base Curve” in mm, the results for each thickness “Thickness - Center, Peripheral” in mm, and the "Test Number” referring to the specific design version tested with these dimensions. It was determined that lenses providing an induced aperture, for example that shown in FIG. 1 , perform better when maintained generally in the center of the visible iris of the eye. For this reason, one design consideration was to position the center of the lens as close as practical to the pupil center or line of sight of the eye.
- a "perfectly-centered" soft contact lens is centered about the visible iris of the eye, and is normally not centered about the pupil center or the line of sight of the eye.
- the goal was therefore to reduce the primary gaze decentration relative to the visible iris.
- Tables 1-A and 1-B the vertical decentration reduced from an average of 0.1 mm for the 8.5 mm base curve to 0.00 mm for the 7.9 mm base curve.
- lens lag is considered as the decentration away (in the opposite direction) from the primary gaze centration when looking up (“Up Gaze Lag” as shown in the above tables) or looking left and right (horizontal gaze lag).
- Lens lag causes the center of the lens to temporarily deviate from the primary gaze centration position as the wearer looks up, down, and to the sides.
- a design goal was to reduce lens lag relative to the primary gaze centration position (referred to as "Primary Gaze Lag” and "Up Gaze Lag” in the above tables).
- the primary gaze lag reduced from an average of 0.19 mm for the 8.5 mm base curve to 0.03 mm for the 8.1 mm base curve samples.
- up gaze lag was minimal at an average of less than 0.22 mm with 0 to 8% of lenses showing a significant (>0.3mm) lag.
- Primary gaze lens movement with a blink is also a good indication of the "tightness" of the lens fitting. This tightness results from the suction between the lens and the eye. This suction holds the lens centered on the eye and can cause the edge of the lens to indent into the conjunctiva of the eye. Lens movement with a blink is believed to improve the physiology of the cornea, especially for repeated overnight lens wear (commonly referred to as “extended” or “continuous wear”). Lens movement with a blink also causes the center of the lens to temporarily deviate from the center of the visible iris after each blink.
- Another design goal of the above empirical study was therefore to reduce primary gaze lens movement (discussed in Table 1-A and 1-B as "Movement with Blink" and measured in mm) without having an apparently immobile or bound lens.
- An immobile lens would be considered a lens having no visible movement, or movement of less than clinical detection limit of 0.05 mm.
- Lens buckling or fluting results from excessive lens material being located toward the edge of the lens and is caused by the lens being too flat to conform to the curvature of the eye. Another design goal was therefore to avoid significant lens buckling or fluting, as shown in the "Lens Buckling/Fluting" column of the above tables. None of the lenses tested had lens buckling or fluting.
- Optical distortion results from excessive lens material existing near the center of the lens and is caused by the lens being too steep to conform to the curvature of the eye. Another design goal was therefore to avoid a significant amount of optical distortion, as shown in the column labeled "Optical Distortion.” Optical distortion was seen in 2% of the lenses for Design 18 with a 7.9 mm base curve lens, which is not preferable, but acceptable.
- the present inventors also discovered that thicker lens designs (0.120 mm/0.310 mm central/peripheral thickness) were best for both the 8.1 mm and 8.3 mm base curves. The less-optimal performance with the 7.9 mm and 8.5 mm base curves was also reduced with the thicker 0.310 mm peripheral thickness designs. None of the Design 9 lenses (8.5 mm base curve and 0.100/0.310 mm central/peripheral thickness) were summarized as "too loose" but they still exhibited degradation in centration and lag. None of the thicker Design 19 lenses (7.9 mm base curve, 0.120/0.310 mm central/peripheral thickness) exhibited optical distortion but a significant percentage showed the less desirable but still acceptable 0.0 mm primary gaze movement with a blink.
- Table 2 above shows the corresponding key vision and comfort subjective ratings from the wearers of the lenses discussed earlier in Tables 1-A and 1-B.
- Table 2 presents these subjective ratings as the percentage of wearers exceeding a cut-off value, for example, the percentage of wearers in which the near vision value equaled or exceeded 67.
- the numerical parameter of the cut-off value (for example, 67 for near vision) can be derived from any known or acceptable methodology, for example, that discussed in the publication Woods et.al., Visual Performance of a Multifocal Contact Lens versus Monovision in Established Prototypes, OPTOMETRY AND VISION SCIENCE, Vol. 92, No. 2, (February 2015 ) (see Table 4, page 5), the contents of which are incorporated by reference herein in their entirety.
- a Table 2 percentage of 50% would mean the average subjective scores for the lenses disclosed herein were the same as the commercial lenses tested in Woods. A percentage greater than 50% would mean more than 50% of the subjective scores for the disclosed lenses exceeded the average scores of the lenses tested in Woods. A Table 2 percentage close to 100% would mean almost all subjective scores for the disclosed lenses were higher than the average scores of the lenses tested in Woods. Table 2 therefore provides an indication of the change in success rate with each of the different designs tested in the above study, and compares those designs to a commercial lens to show the success of the disclosed lens.
- the preferable base curve was the 8.1 mm base curve based on the objective measures discussed above with respect to Table 1-A and 1-B.
- One unexpected finding was the subjective ratings in Table 2 were higher with Designs 11, 12 and 13 in the 8.5 mm base curve, reaching 76% for distance vision, close to 100% for near vision, and close to 76% overall.
- both the 8.3 mm and 8.1 mm base curves were preferable based on the objective measures discussed above with respect to Tables 1-A and 1-B.
- these ratings were highest with Design 24 having the 8.3 mm base curve and Design 21 having the 8.1 mm base curve.
- the subjective ratings were 90 to 95% for distance, near and overall ratings for these samples.
- One unexpected finding was how much better the performance was compared to the 0.220 mm peripheral thickness lens designs and compared to the commercial lens tested in Woods.
- Tables 1-A and 1-B, and Table 2 The results of the testing for Tables 1-A and 1-B, and Table 2, was the discovery of ranges for a lens geometry that can meet all the physical design criteria of a comfortable and well fitted soft contact lens on a wide range of eye shapes. Also, in some instances, the acceptable ranges of the lenses kept the center of the lens as close as practical to the pupil center or line of sight of the eye.
- Table 3-A Lens Diameter Range Chart Base Curve / Diameter Thickness-Center, Peripheral Test Number Movement With Blink Primary Gaze Lag Up Gaze Lag 8.5 / 14.3 0.100, 0.220 10 N/A avg 0.18mm, 0% >0.3mm avg 0.42mm, 76% >0.3mm 8.5 / 14.5 0.100, 0.220 12 N/A avg 0.18mm, 0% >0.3mm avg 0.41mm, 62% >0.3mm 8.3 / 14.5 0.120, 0.310 24 avg 0.19mm, 0% 0.0mm movement avg 0.11mm, 0% >0.3mm avg 0.20mm, 0% >0.3mm Table 3-B: Lens Diameter Range Chart Test Number Decentration - Vertical Decentration - Horizontal Lens Buckling/ Fluting Optical Distortion Result Summary Sample Size 10 avg 0.14mm, 0% >0.3mm avg 0.13mm, 5% >0.3mm 0 0 0% too loose or
- Tables 3-A and 3-B above are similar to Tables 1-A and 1-B and show the different base curve and diameter combinations that were fabricated, measured, verified, and tested clinically.
- the 8.5 mm base curve lenses having diameters of 14.3 mm (sag of 3.90 mm) and 14.5 mm (sag of 4.05 mm) were tested with respective center and peripheral thicknesses of 0.100 and 0.220 mm. These two designs performed similarly for lag and centration.
- the thicker 0.120/0.310 mm central/peripheral thickness lens with an 8.3 mm base curve and 14.5 mm diameter had less lag and decentration in all measures and no buckling, optical distortion or tightness problems.
- the designed sag of these lenses was just greater than 4.25 mm.
- Tables 5-A and 5-B are similar to Tables 1-A and 1-B, and 3-A and 3-B. Tables 5-A and 5-B highlight the contrast between the different thicknesses tested in each base curve.
- the peripheral region was chosen to thicken the lens.
- the lens is past the average horizontal visible iris diameter of 11.5 mm and over the anatomical limbus of the eye.
- This translation (x), thickness and modulus of the hydrated soft contact material (k), and the suction created under the lens can be understood by Hooke's law; the force required to stretch a spring is directly proportional to the amount of stretch.
- the thicker lenses reduced lens movement with a blink, reduced lens lag and reduced decentration in primary gaze when used with the 8.1 to 8.3 mm base curves. This is because the thicker lens had more stored energy in the form of suction under the lens when blinked onto the eye and this suction increased more, relative to the thinner profile, when the lens is blinked, lags, or is held by the eyelids further from the center of the visible iris. This "band" or annulus of increased thickness also helps improve centration purely by elastic deformation as the lens is displaced from the center of the cornea.
- the thicker lens design profiles are thicker in the center by 0.020 mm as compared to the thinner lenses in Table 6. This thickness difference is intended to reduce the slight central stress from the suction under the lens with some wearers finding the vision better. This is shown by the thicker Designs 17, 21 and 22 having an 8.1 mm base curve showing better vision ratings compared to the thinner Design 15 having an 8.1 mm base curve.
- edge thickness Another control point in the thickness profile is the edge thickness.
- a substantially spherical back surface geometry and a radial edge thickness of 0.145 mm at 0.3 mm in from the lens edge provided good comfort over a wider range of base curves.
- the comfort When the base curve is steeper (for example, in the 7.9 mm designs) or flatter (for example, in the 8.5 mm designs) the comfort reduces to just better than the commercial lenses benchmarked in the Woods publication discussed above. Outside the 7.9-8.5 mm base curve range, the comfort would decline to unacceptable levels. In the preferable 8.1 mm to 8.3 mm base curves the comfort is unexpectedly better at around 70% of lenses exceeding the average comfort in Woods.
- the tested lenses had a power profile similar to that shown in FIG. 1 , for example, having an induced aperture, and the disclosed ranges are not exact due to manufacturing tolerances and accepted optical performance at surrounding parameters.
- the base curve can be ⁇ 0.2 mm from the disclosed parameter without substantially affecting its performance as provided by the ANSI tolerance of 0.2 mm.
- the disclosed thicknesses can be ⁇ 0.010 mm, based on accepted scientific tolerances. These tolerances are one example of insubstantial differences between the disclosed ranges and a similar lens design.
- a lens having a base curve of 8.7 mm would be insubstantially different than the disclosed range of 7.9 mm to 8.5 mm given the ⁇ 0.2 mm base curve tolerance.
- the inventors discovered induced aperture lenses to generally be neither too tight nor too loose when the base curve is a radius between 7.9 mm and 8.5 mm, preferably 8.1 to 8.3 mm. Further, the inventors discovered a well-fitting lens with a diameter between 14.0-14.5 mm, preferably 14.3 to 14.5 mm, OR a sag of 3.7 mm to 4.75 mm, preferably 3.9 mm to 4.75 mm, and more preferably 4.05 mm to 4.50 mm. The claimed lens diameter is between 14.0 and 14.5 mm. Outside of these ranges, the inventors discovered the performance and fit of the lens to decline unexpectedly, showing the criticality of these ranges.
- Another aspect of the present disclosure utilizes optical power verification to ensure the function of the disclosed lens and to correct the measured clinical refractive error in the eyes of a user.
- the inventors performed clinical trials and determined an algorithm to best verify the function of induced aperture lenses and to correct the eye's measured clinical refractive error.
- This method involves a commercial optical power measurement instrument to measure soft contact lens power profiles in a saline solution. By submerging the lenses in a saline solution, the lenses are maintained in a uniform hydrated state to obtain more accurate power profiles. An algorithm was then developed using this procedure.
- the verification method and verified lens improve the correlation between the disclosed lenses with an induced aperture and a conventional ophthalmic lens having a labeled power.
- a lens can be measured and verified to correspond to a labeled power of -2.25 D for a typical lens.
- the power at the apex of the lens is not necessarily the same as the labeled power, so a method can be used to ensure a lens having an induced aperture can be used on a patient needing a lens having a specific labeled power, in the above example, -2.25 D.
- This verification method, and lens subjected to the verification method can communicate the necessary labeled power to a clinician, doctor, or wearer of the lens.
- the lens can be verified and the labeled power inscribed, printed, or otherwise written onto a container or package of the lens.
- "package” is not intended to be limited to the package directly enclosing the lens with solution therein, but any package, label, insert, or writing that accompanies the lens when distributed to a doctor, clinician, or wearer.
- the design of an induced aperture lens is developed by determining the amount of power change on the front surface required to induce an aperture. Verifying the front surface power change is a challenge because commercially available equipment for performing this measurement on contact lenses is not available. It was therefore helpful to re-define the design in terms of a through-lens power profile which could then be verified using commercially available equipment.
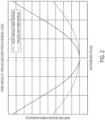
- FIG. 2 illustrates the curvature for a front surface vs. through lens power profile increase for a -3.00 diopter lens.
- the algorithm involves measuring the ramp up in power required to produce the optimized induced aperture.
- the algorithm was developed based on the difference between the reading at the central 2.0 mm region (i.e., about 2.0 mm from the apex) and the readings for the annular region between about 2.0 and 4.0 mm from the apex.
- the algorithm calculates a "distance power" or labeled power near the apex of the lens as the area weighted average radial sagittal power integrated over the central 2 mm diameter of the lens. This could be, for example, the power a doctor or clinician determines to be the appropriate power for a user to have clear vision.
- the aperture inducing power discussed below can be the power that produces a blur anywhere within the 2.0-4.0 mm radius.
- FIG. 3 illustrates a power profile 70 with respect to the aperture inducing power region 75 and the distance region 80 of the lens.
- the lens diameter 85 is also shown. Based on the calculations above, an exemplary zone diameter is 2 mm for the distance power and between 2-4 mm for the aperture inducing power. However, during clinical testing, the distance and aperture inducing zone diameters were adjusted according to the following rules without substantial deviation in success rate:
- determining the distance power and aperture inducing power in this manner produced a lens profile with great success that matched the target profile with great accuracy.
- the NIMO TR-1504 (NIMO) Power Measurement device was chosen for its accuracy in measuring the VTI lens design.
- the NIMO is a wavefront sensor manufactured by Lambda-X ® .
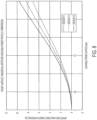
- FIGs. 4-7 illustrate the through lens sagittal power profiles for three separate lenses respectively representing low, medium, and high power lenses for which the present method is utilized.
- the calculations of distance power and aperture inducing power were performed within the central 4.0 mm (within 2.0 mm of the apex) on the graphs.
- the disclosed method resulted in excellent agreement between the designed and measured profiles for all three powers highlighting the precision of the disclosed method for ensuring a correct power profile.
- GR&R gage repeatability and reproducibility
- the power of a spherical (non-astigmatic correction) soft contact lens two corrections or calculations are accepted as standard clinical practice.
- the power can be adjusted from the spectacle plane to the corneal plane. This is called the vertex distance adjustment.
- the sphere and cylinder meridians of the vertex distance adjusted refraction are averaged to a single sphere equivalent power.
- the vertex distance adjusted sphere equivalent subjective refraction is the clinical estimate or starting point for selection of the soft contact lens power.
- eighteen patients 36 eyes were analyzed and conventional subjective refractions were performed.
- the vertex distance adjusted sphere equivalent subjective refractions were calculated and compared to the 2.0 mm average measured power algorithm using a Lambda-X NIMO instrument.
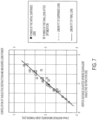
- FIG. 7 shows the linear regression comparing these two powers.
- the "DISPENSED" lens power plot is a linear regression of the best soft contact lens power after a short-term, in-office, evaluation.
- the "FINAL” lens power plot is a linear regression of the measure lenses after a period of 21 days of wearing the lens outside.
- the agreement between the "DISPENSED" clinical refraction estimate and the "FINAL” measured lens power is high.
- the relationship between the estimated DISPENSED lens and the actual FINAL lens is linear to 5 and 8% error with a standard deviation of the difference of 0.25 D.
- the algorithm is applied to the use of a specific type of optical lens, namely, one with an induced aperture.
- the algorithm is not an algorithm per se, but one applied in a meaningful way so as not to monopolize the entire algorithm.
- the algorithm is tied to a machine in that it is tied to a lens having an induced aperture. Further, it is not applied with respect to any sort of naturally occurring composition or natural phenomena, but rather with respect to a man-made optical lens having an induced aperture.
- the present invention also involves, in some embodiments, a single lens that can be applied to a wide range of presbyopes.
- the prior art lenses required a determination of which "add power" best fits the individual wearer's visual needs.
- the typical presbyope initially requires a low add power at a young age (45 years on average and +1.00D in spectacles) with a greater add power required at an older age until all accommodative ability is lost (at 65 years on average and +2.50D in spectacles).
- the present inventors unexpectedly discovered that a single power profile could induce a single optical aperture with enough depth of focus to satisfy a wide range of presbyopes. Rather than requiring different power profiles to produce different "add powers" in prior art contact lenses for wearers with different degrees of presbyopia, only one lens need be used for individuals with different degrees of presbyopia.
- the disclosed power rise ranges are for the aperture inducing power of the lens.
- the numerical values of ranges are the front surface tangential power rise at the 3 mm diameter (1.5 mm radius) measurement of the lens.
- the critical range is for a power rise , i.e., a power above and beyond the central power. This range is different for polymacon material contact lenses and cast molded etafilcon lenses.
- the critical range is between +2.00 to +2.75 diopters.
- the critical range is between +2.375 to +3.125 diopters.
- lens designs were tested in the lathe cut polymacon 38% lenses. They ranged from an 8.1 mm base curve with a 9.2 mm peripheral posterior bevel to an 8.3 mm base curve with a 9.2 mm bevel and a monocurve 8.3 mm spherical and aspherical curvatures.
- the design A1 with an aperture inducing power increase of +2.75D was acceptable but very high. This produced a smaller aperture having good depth of focus and near vision while the closely surrounding blur zone restricted more light entering the pupil, thereby reducing distance vision.
- the lower power profile tested was the design A2 at +2.00D power increase. This produced a larger induced aperture having less depth of focus and near vision while the further out surrounding blur zone restricted less light entering the pupil to thereby improve distance vision.
- the general basis of improving the power profile was discovered by changing the induced aperture size and its corresponding directional effect on visual performance.
- Tables 10-A and 10-B summarize some of the studies concerning power profiles using polymacon material contact lenses.
- the table references the Design Number and the aperture inducing power ("Inducing Power").
- the remaining cells summarize the comparative visual performance for different tests and the comparative overall satisfaction from the wearer's assessment.
- hybrid is meant to describe a power profile shape slightly different from others in this chart.
- Design A1 with an aperture inducing power increase of +2.75D was acceptable but not optimum.
- Design 13F included slight modifications to the A1 design and performed better, as did Designs 13F and 12F.
- Designs 10F and 11F with aperture inducing power increases of +2.375D were generally the best combination of distance and near vision performance.
- Designs A2 and A2PF had the lowest aperture inducing power increase of +2.00D and were generally the best for distance and less so for near vision performance. In one trial A2 performed well with wearers requiring a spectacle lower reading addition. To fit a wide range of the presbyopes, which have a wide range of reading additions, the lowest aperture inducing power increase of +2.00D had reduced near vision performance with wearers needing higher reading additions, but was still acceptable.
- FIG. 8 illustrates the designed front surface tangential aperture inducing power profiles for the disclosed lenses.
- the x-axis of FIG. 8 is the radial distance from the center in mm.
- the y-axis is the aperture inducing power increase in diopters.
- Three different aperture inducing power profiles are graphed, including Design 11 (the lowest power increase), Design 12 (the middle power increase), and Design 13 (the highest power increase).
- FIG. 9 illustrates the through lens sagittal aperture inducing power profile comparison for lenses with an apical power of -3.00D.
- the x-axis is the radial distance from the center in mm.
- the y-axis is the instantaneous sagittal power in diopters.
- the same three aperture inducing power increases are graphed in FIG. 9 as in FIG. 8 , that is, Designs 11-13.
- Table 11 Designs With Scotopic Rings Design Number Aperture Inducing Power Increase (D) 11 2.375 12 2.75 13 3.125 24 2.75
- Table 11 illustrates various design numbers from Tables 1-A and 1-B with optical designs based on Table 10 and a "scotopic ring.”
- a scotopic ring is an optical design where the power at, for example, a 3.0 mm radius reduces back to the power at the apex, and is described in more detail in U.S. Patent No. 7,178,918 , the contents of which are incorporated by reference herein in their entirety.
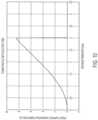
- An example of a power profile having a scotopic ring is shown in FIG. 10 .
- An unanticipated finding during the testing of A1 and A2 was a rapid power and thickness increase that would excessively increase the thickness of the lenses. This was increased for the high water content etafilcon 58% material due to its lower refractive index.
- Design 12 with an aperture inducing power increase of +2.75D performed best on the objective tests and ratings of distance, intermediate, and near vision.
- One unexpected finding was that the lower power profile Design 11 at +2.375 was not the best design as with the previous lathe-cut polymacon 38% material contact lenses, but it still provided good near vision.
- the next unexpected finding was that the higher power profile Design 13 at +3.125 was now the new upper acceptable limit as it reduced distance vision.
- Table 13 Subjective Testing of Lenses Subjective at Dispensing Average ⁇ SD (min - max), n VTI It11 VTI It12 VTI It13 Distance Vision 85.7 ⁇ 17.3 (30 -100), 21 89.6 ⁇ 10.7 (60 - 100), 21 80.4 ⁇ 22.1 (20 - 100), 21 Distance ghosting 90.8 ⁇ 11.2 (50 - 100), 21 89.0 ⁇ 12.2 (50 - 100), 21 83.5 ⁇ 15.2 (50 - 100), 21 Distance Haloes 90.1 ⁇ 12.4 (50 - 100), 21 87.7 ⁇ 23.3 (0 - 100), 21 86.3 ⁇ 20.3 (20 - 100), 21 Distance Fluctuation 84.2 ⁇ 18.0 (50 - 100), 20 90.1 ⁇ 12.6 (50 - 100), 21 83.0 ⁇ 18.8 (20 - 100), 21 Near Vision Good Lighting 90.2 ⁇ 10.3 (70 - 100), 21 92.0 ⁇ 9.3 (70 - 100), 21 88.0 ⁇ 15.3 (30 - 100
- Design 12 had better overall lens visual performance and other key components of good vision for presbyopic wearers, such as distance vision, distance fluctuation, near vision good lighting, near vision low lighting and using/viewing cell phone/PDA.
- Design 24 Combining Design 12 (+2.75D aperture inducing power increase with the scotopic ring) with lens geometry discussed above with respect to Tables 1A and 1B, the present inventors found further improvement in vision and lens performance as shown in Design 24. Overall success rate for Design 24 was 93-95% with 91% intent to continue wearing the lens. As used herein, "success rate" means the percentage of wearers in which the lens treated presbyopia and where the users could perform their daily tasks while wearing the lens.
- BCSV best-corrected spectacle vision
- both the high contrast high illumination and low contrast low illumination visual acuities for the Design 24 lens were within two letters of the BCSV. This was particularly impressive because of the difficulty for soft contact lenses, with their high water content, to achieve visual acuities similar to spectacles.
- Stereoacuity is considered the leading indicator of how well the two eyes are working together, and is a critical attribute for eye-hand coordination tasks, such as the use of a cell phone. Published information on competitive multifocals demonstrates that other multifocals are not able to achieve this level of stereoacuity.
- the areas of the greatest difference in favor of the Design 24 lens were seen for near and intermediate tasks such as the need to not use supplemental reading glasses, reading very small print, using a cell phone, working on a computer, writing, personal grooming, and reading books or newspaper. These attributes were found to be 20-40 points greater with the Design 24 lens than they were for the habitual correction in subjective testing.
- AirOptix Multifocal (Alcon, Ft Worth, TX), which is currently the leading brand of multifocal.
- AirOptix Multifocal (Alcon, Ft Worth, TX)
- the preference was 82% for the Design 24 lens versus 18% for the AirOptix Multifocal. This was determined to be a statistically significant difference in favor of the Design 24 lens.
- the comfort of the lenses was also rated very high at 92.5 out of 100, where 100 is considered extremely comfortable. This is notable given that almost 70% of the wearers typically wore a habitual silicone hydrogel lens material.
- the Design 24 lens performed very well in terms of both objective and subjective visual results.
- the performance of the Design 24 lens for near and intermediate tasks was especially notable as these are the areas in which many competitive multifocals struggle.
- the high preference rates and the high likelihood to continue wearing the lens are both excellent indicators that the lens demonstrated successful performance with its unique single physical and optical aperture inducing power profile lens design.
- the single lens optimized lens geometry can meet all the physical design criteria of a comfortable and well fitted soft contact lens on a wide range of eye shapes and meet the optical design objective of keeping the center of the lens as close as practical to the pupil center or line of sight of the eye.
- the single power profile creates an induced optical aperture and increased depth of focus that can provide good distance, intermediate, and near vision to a wide age range of presbyopes that need a low spectacle near addition powers when they are younger and high spectacle near addition powers when they are older.
- the optimized one design per distance correcting sphere power had a 93 to 95% success rate.
- the fitting characteristics were improved with respect to a design objective to keep the center of the lens, where the center of the induced aperture is, as close as practical to the pupil center or line of sight of the eye.
- some of the fitting characteristics were:
- a methodology can be used to determine the acceptable parameters of a lens regardless of material.
- the peripheral thickness of the lens can be increased until the lens decentration is minimized.
- the edge thickness can be reduced until the lens edge sensation is removed.
- the base curve can be reduced until movement is minimized or the lens stops moving or optically distorts on the eye. If the lens optically distorts on the eye and is still moving with a blink, the center thickness of the lens should be increased first.
- the optimum physical lens parameters will include a steeper base curve, a larger diameter, and a thicker thickness profile.
- the inventors of the present invention determined that a lens with an induced aperture would function with an aperture inducing power rise of +2.00 to +3.25 D, preferably +2.75 D.
- the present inventors determined that silicon hydrogel lenses would function within this range. Insubstantial differences from the above range would be based on scientifically and ANSI-accepted tolerances.
- the present invention can be directed to methods and devices including lenses. However, the invention is not so limited, and can include contact lenses, intraocular lenses, eyeglasses, other types of lenses, or any other optical device.
Landscapes
- Health & Medical Sciences (AREA)
- Ophthalmology & Optometry (AREA)
- Physics & Mathematics (AREA)
- General Health & Medical Sciences (AREA)
- General Physics & Mathematics (AREA)
- Optics & Photonics (AREA)
- Eyeglasses (AREA)
- Non-Silver Salt Photosensitive Materials And Non-Silver Salt Photography (AREA)
- Prostheses (AREA)
Description
- The present application relates generally to optical lenses. More particularly, the present application relates to methods for creating optical lenses with induced apertures and parameters for improving the vision of the wearer and comfort of the lenses.
- Myopia or short sightedness is a condition in which the far-point of the eye is less than infinite in distance from the surface of the eye. A myopic eye can see objects clearly only within a finite distance limited by the level of myopia in the eye. Advancing myopia is the result of the scleral ball of the eye elongating so that the retina that lies against the posterior inner wall of the eye moves behind the eye's distance image focal point. A light diverging or "minus" lens is conventionally used to move the focused light from in front of the retina backward to the retinal plane. The minus lens, whether spectacle lens, intraocular lens, contact lens, or other light diverging ophthalmic device, allows the myopic eye to regain the clarity of objects at a longer distance.
- Presbyopia is generally accepted to be caused by the lack of elasticity of the crystalline lens in the eye. When a person views near objects, the eye accommodates the divergent, rather than parallel, light arriving from the near object. The eye will then perform the act of accommodation resulting in a physical change to steepen the shape of the crystalline lens within the eye. By flexing in this manner, the lens re-converges and focuses the light from near objects on the retina. Accommodation increases the convergence of light waves by causing the eye's intraocular lens surfaces to be more steeply curved, which in turn adds focal power to the optical system of the eye. The closer an object is viewed, the greater the accommodative demand placed on the eye.
- Generally speaking, a person's crystalline lens will stiffen as the person ages, losing its accommodative ability and likewise losing its ability to change shape. This stiffening therefore prevents the eye from focusing light properly when viewing objects at close range, leading to the condition known as presbyopia. Reading glasses are commonly provided to treat presbyopia.
- To treat both presbyopia and the progression of myopia, lenses have been proposed that create an induced aperture. For example,
U.S. Patent Application No. 14/126,056 andU.S. Patent No. 7,178,918 describe a lens that includes a central zone of clear vision where the refractive power rises slowly and continuously from a central power to a limit of clear vision. This central zone is surrounded by a more rapidly increasing power distribution generating a perceivable blur to the user in the area surrounding the central power. Such a power distribution has a central or apex area having distance vision correcting power and a power distribution creating a blurred region outside of the apex area so as to cause an "induced aperture." Although the lens is not a physical pinhole, it produces similar increased depth of focus effects to the user without suffering from the loss of light and increased diffraction inherent in physical pinholes. This lens increases the depth of focus, therefore requiring less from the eye's accommodation to see clearly at near distances, and reducing accommodative stress to thereby limit the progression of myopia and treat presbyopia. - The induced aperture can be most advantageous when located near the center of the wearer's eye. Because of this, movement of the lens is permitted, but movement beyond a particular threshold can prevent the induced aperture from performing its intended function. Also, traditional American National Standards Institute (ANSI) methods of characterizing soft contact lens power profiles were inadequate to predict clinical performance for the induced aperture lenses. These standards were also inadequate to produce lenses of a single power profile for a wide range of presbyopia.
- Prior art documents include
EP1691741 ,US2005/068494 . - The scope of protection of this invention is defined in the claims.
- For the purpose of facilitating an understanding of the subject matter sought to be protected, there are illustrated in the accompanying drawings embodiments thereof, from an inspection of which, when considered in connection with the following description, the subject matter sought to be protected as defined in the claims, its construction and operation, and many of its advantages should be readily understood and appreciated.
-
FIG. 1 is a plot of the radial power distribution for embodiments of a lens according to the invention. -
FIG. 2 is a plot of a front surface vs. through lens power profile increase for a -3.00 diopter lens according to embodiments of the present application. -
FIG. 3 is a schematic illustration of a lens having a power profile projected onto an eye according to embodiments of the present application. -
FIGs. 4-6 are plots of through lens sagittal power profiles according to embodiments of the present application. -
FIG. 7 is a linear regression plot of the subjective refraction and measured lens powers according to embodiments of the present application. -
FIG. 8 is a plot of the front surface tangential aperture inducing power profile comparison for several designs according to embodiments of the present application. -
FIG. 9 is a plot of the through lens sagittal aperture inducing power profile comparison according to embodiments of the present application. -
FIG. 10 is a plot of an exemplary power profile with a scotopic ring. - While this invention is susceptible of embodiments in many different forms, there is shown in the drawings, and will herein be described in detail, a preferred embodiment of the invention with the understanding that the present disclosure is to be considered as an exemplification of the principles of the invention and is not intended to limit the broad aspect of the invention to embodiments illustrated. As used herein, the term "present invention" is not intended to limit the scope of the claimed invention and is instead a term used to discuss exemplary embodiments of the invention for explanatory purposes only, whereby the scope of protection is defined in the claims.
- The present application discloses, for example, lenses and methods for verifying a lens with an induced aperture. The induced aperture can include a clear power around a center point of the wearer's eye, and a blur region immediately surrounding the center point. The wearer will therefore not perceive an aperture in the middle of their vision but will have the optical benefits of an aperture without a physical aperture in the lens. The power rise about the distance power of the apical aperture is not seen by wearers while viewing distance objects through the aperture. This feature of the aperture allows for a wide range of presbyopia correction.
- The lenses can have a geometry that maintains a centered position about a wearer's eye to prevent more than a permissible amount of movement of the lens relative to the eye. Further disclosed is a method for verifying that the power profiles used with the lens correspond to labeled powers a user would normally wear with a lens not having an induced aperture.
- In some embodiments, a lens according to the present application can include a continuous axi-symmetric power distribution that provides multiple functions. A central portion or apex of the lens can have a power distribution selected preferably for correcting a user's distance vision. Surrounding the distance corrective power, the power distribution can increase in power quickly over a short radial dimension to produce a blur effect on the user's vision. This radial area of rapidly rising power is termed here for convenience a "blur" zone. For example, the magnitude of blur in the blur zone can be selected so that the eye cannot resolve a level of detail in the distance.
- This induced optical aperture generates an increased depth of focus due in part to the user's cortical response to the blur of inhibition. By properly specifying the distance vision power to the particular user, the associated increased depth of focus of the lens will compensate, at least partially, for defocus occurring when the user attempts near vision. This compensatory or "pseudo" accommodation provides clearer vision for the presbyope and reduced accommodative stress and accommodative lag stress that are believed to be associated with myopia progression.
-
FIG. 1 depicts a graph of thedistribution 50 of the optical power rise as a function of radial dimension (x) from the apex of a lens according to the invention. As used herein, the term "power rise" can mean the power above the distance corrective power at the apex of the lens (apical power). A centrally locateddistance vision region 60 has a power distribution that varies within a power range for distance vision correction. The distance correction power is that power providing clear vision when viewing objects infinitely distant from the user. The distribution power rise initially increases continuously but slowly as the radius moves away from the apical center. This continues to a design point Dp at a radial dimension in the range of about 0.5 to 1.5 millimeters from the apex, for example. - Beyond the design point Dp, the power increases more quickly and continuously until a
maximum power value 62 is reached. The portion of the lens andpower distribution 50 between the design point Dp andpeak power 62 defines and creates ablur zone 64. The rapidly rising power in theblur zone 64 produces the unfocused light impinging peripherally on the retina to create a blur. In some embodiments, immediately outside the design point Dp, the power distribution rises sufficiently quickly to create a blur and to reach a maximum power within the constraint of the pupillary dimension. The blur produced by the lens is inhibited or suppressed by the user's optical cortical system. Accordingly, the blur is not recognized by the user. - In
FIG. 1 , thepower distribution 50 is shown to continue beyond the peak power to illustrate that thepower distribution 50 may be defined as a portion of a continuous power relationship. As discussed herein, the optical power is the front surface tangential power, which may be somewhat different from the through lens sagittal power or average power at any point on a lens. - Clinical testing of lenses having induced apertures showed that the clinical visual performance degraded with lens movement and lens decentration. This was unexpected, as it is preferable for a soft contact lens to have movement with a blink to improve the physiology of the cornea. Through experimental testing, the present inventors discovered lens parameters, including base curve radius, diameter, and thickness profile, to minimize (although not necessarily prevent) lens movement about the eye. The lens parameters also allowed the lens to center about the visible iris.
- As shown below, the inventors discovered induced aperture lenses to generally be neither too tight nor too loose when the base curve is a radius between 7.9 mm and 8.5 mm, preferably 8.1 mm to 8.3 mm. Similarly, the inventors discovered a well-fitting lens with a back surface saggital depth (otherwise known by the abbreviation "sag") between 3.7 mm to 4.75 mm, preferably 3.9 mm to 4.75 mm, more preferably 4.05 mm to 4.50 mm ; the lens diameter defined in the claims is between 14.0 mm to 14.5 mm, preferably 14.3 mm to 14.5 mm. Outside of these ranges, the inventors discovered the performance and fit of the lens to decline unexpectedly, showing the criticality of these ranges. In exemplary embodiments, and to even further improve the fit and function of the lens, the present inventors discovered increased performance with lenses having an edge thickness of 0.145 mm at 0.30 mm radially in from the lens edge verifying that. Further, well-fitting lenses as defined in the claims have a thickness profile with a center thickness between 0.100-0.120mm and a peripheral thickness of 0.220-0.310 at a chord diameter of 12.30 mm. Below are tables illustrating the data collected by the inventors that contributed to the discovery of the above ranges.
Table 1-A: Base Curve Range Chart Base Curve Thickness-Center, Peripheral Test Number Movement With Blink Primary Gaze Lag Up Gaze Lag 7.9 0.120, 0.220 18 avg 0.10mm, 10% 0.0mm movement avg 0.07mm, 0% >0.3mm avg 0.22mm, 0% >0.3mm 7.9 0.120, 0.310 19 avg 0.08mm, 26% 0.0mm movement avg 0.06mm, 0% >0.3mm avg 0.19mm, 0% >0.3mm 8.1 0.120, 0.220 15 N/A avg 0.14mm, 0% >0.3mm avg 0.31mm, 39% >0.3mm 8.1 0.120, 0.310 17 avg 0.09mm, 16% 0.0mm movement avg 0.05mm, 0% >0.3mm avg 0.17mm, 2% >0.3mm 8.1 0.120, 0.310 21 avg 0.11mm, 0% 0.0mm movement avg 0.12mm, 0% >0.3mm avg 0.21mm, 8% >0.3mm 8.1 0.120, 0.310 22 avg 0.11mm, 0% 0.0mm movement avg 0.07mm, 0% >0.3mm avg 0.21mm, 8% >0.3mm 8.3 0.100, 0.220 14 N/A avg 0.14mm, 0% >0.3mm avg 0.34mm, 36% >0.3mm 8.3 0.120, 0.310 16 N/A avg 0.14mm, 0% >0.3mm avg 0.33mm, 39% >0.3mm 8.3 0.120, 0.310 24 avg 0.19mm, 0% 0.0mm movement avg 0.11mm, 0% >0.3mm avg 0.20mm, 0% >0.3mm 8.5 0.100, 0.310 9 N/A avg 0.14mm, 0% >0.3mm avg 0.37mm, 71 >0.3mm 8.5 0.100, 0.220 11 N/A avg 0.19mm, 7% >0.3mm avg 0.47mm, 64% >0.3mm 8.5 0.100, 0.220 12 N/A avg 0.18mm, 0% >0.3mm avg 0.41mm, 62% >0.3mm 8.5 0.100, 0.220 13 N/A avg 0.19mm, 0% >0.3mm avg 0.41mm, 52% >0.3mm Table 1-B: Base Curve Range Chart Test Number Decentration - Vertical Decentration - Horizontal Lens Buckling/ Fluting Optical Distortion Result Summary Sample Size 18 avg 0.00mm, 0% >0.3mm avg 0.17mm, 0% >0.3mm 0% 2% 4% too tight 50 eyes 19 avg 0.00mm, 0% >0.3mm avg 0.17mm, 0% >0.3mm 0% 0% 6% too tight 50 eyes 15 avg 0.06mm, 6% >0.3mm avg 0.16mm, 16% >0.3mm 0% 0% 0% too loose or tight 62 eyes 17 avg 0.00mm, 0% >0.3mm avg 0.16mm, 0% >0.3mm 0% 0% 0% too tight 50 eyes 21 avg 0.00mm, 0% >0.3mm avg 0.16mm, 0% >0.3mm 0% 0% 0% too tight 36 eyes 22 avg 0.00mm, 0% >0.3mm avg 0.12mm, 0% >0.3mm 0% 0% 0% too tight 36 eyes 14 avg 0.07mm, 3% >0.3mm avg 0.18mm, 13% >0.3mm 0% 0% 0% too loose ortight 76 eyes 16 avg 0.08mm, 6% avg 0.21mm, 19% >0.3mm 0% 0% 0% too loose ortight 62 eyes 24 avg 0.00mm, 0% >0.3mm avg 0.09mm, 0% >0.3mm 0% 0% 0% too loose or tight 52 eyes 9 avg 0.08mm, 0% >0.3mm avg 0.19mm, 11% >0.3mm 0% 0% 0% too loose ortight 38 eyes 11 avg 0.10mm, 5% >0.3mm avg 0.30mm,31% >0.3mm 0% 0% 7% too loose or decentered 42 eyes 12 avg 0.08mm, 5% >0.3mm avg0.20mm,21% >0.3mm 0% 0% 0% too loose or tight 42 eyes 13 avg 0.10mm, 5% >0.3mm avg 0.25mm,21% >0.3mm 0% 0% 2% decentered 42 eyes - Determining these critical ranges required the fabrication, measurement verification, and clinical testing of lenses from a base curve average of 7.9 mm to 8.5 mm, with base curves outside this range unexpectedly yielding poor results. As will be seen, because sag is a calculation based on base curve and diameter values, the data discussed herein was used to calculate various sag ranges that also showed unexpected results. During these exemplary experimental tests, curved lenses that were steeper in the center and flatter in the periphery did not perform better than substantially spherical geometries. For this reason, only the results of the substantially spherical back surface base curves are presented in Tables 1-A and 1-B above. For each tested lens, Tables 1-A and 1-B include the tested "Base Curve" in mm, the results for each thickness "Thickness - Center, Peripheral" in mm, and the "Test Number" referring to the specific design version tested with these dimensions. It was determined that lenses providing an induced aperture, for example that shown in
FIG. 1 , perform better when maintained generally in the center of the visible iris of the eye. For this reason, one design consideration was to position the center of the lens as close as practical to the pupil center or line of sight of the eye. - Conventionally speaking, a "perfectly-centered" soft contact lens is centered about the visible iris of the eye, and is normally not centered about the pupil center or the line of sight of the eye. In designing the lenses and performing the clinical tests discussed herein, the goal was therefore to reduce the primary gaze decentration relative to the visible iris. As shown in Tables 1-A and 1-B, the vertical decentration reduced from an average of 0.1 mm for the 8.5 mm base curve to 0.00 mm for the 7.9 mm base curve. For thicker designs (for example, Design 24 with an 8.3 mm base curve, Designs 17, 21 and 22 with an 8.1 mm base curve, and Designs 18 and 19 with a 7.9 mm base curve) the vertical decentration was minimal at an average of 0.00 mm with no lenses showing a significant (>0.3 mm) amount of decentration. The horizontal decentration reduced from averages of 0.25 to 0.30 mm for the 8.5 mm base curve to 0.12 mm for the 8.1 mm base curve. For the thicker designs (for example, Design 24 with an 8.3 mm base curve, Designs 17, 21 and 22 with an 8.1 mm base curve, and Designs 18 and 19 with a 7.9 mm base curve) the decentration was minimized at an average of 0.09 to 0.17 mm with no lenses showing a significant (>0.3 mm) amount of decentration.
- In general, lens lag is considered as the decentration away (in the opposite direction) from the primary gaze centration when looking up ("Up Gaze Lag" as shown in the above tables) or looking left and right (horizontal gaze lag). Lens lag causes the center of the lens to temporarily deviate from the primary gaze centration position as the wearer looks up, down, and to the sides. Because the disclosed lens performs better when centered about the eye, a design goal was to reduce lens lag relative to the primary gaze centration position (referred to as "Primary Gaze Lag" and "Up Gaze Lag" in the above tables). The primary gaze lag reduced from an average of 0.19 mm for the 8.5 mm base curve to 0.03 mm for the 8.1 mm base curve samples. For some of the thicker designs (for example, Designs 17 and 22 with an 8.1 mm base curve, and Designs 18 and 19 with a 7.9 mm base curve) primary gaze lag was minimal at an average of 0.05 to 0.07 mm with no lenses showing a significant ( >0.3 mm) lag. The up gaze lag reduced from an average of 0.47 mm for the 8.5 mm base curve to 0.17 mm for the 8.1 mm base curve. For some of the thicker designs (for example, Design 24 with an 8.3 mm base curve, Designs 17, 21 and 22 with an 8.1 mm base curve, and Designs 18 and 19 with a 7.9 mm base curve) up gaze lag was minimal at an average of less than 0.22 mm with 0 to 8% of lenses showing a significant (>0.3mm) lag.
- Primary gaze lens movement with a blink is also a good indication of the "tightness" of the lens fitting. This tightness results from the suction between the lens and the eye. This suction holds the lens centered on the eye and can cause the edge of the lens to indent into the conjunctiva of the eye. Lens movement with a blink is believed to improve the physiology of the cornea, especially for repeated overnight lens wear (commonly referred to as "extended" or "continuous wear"). Lens movement with a blink also causes the center of the lens to temporarily deviate from the center of the visible iris after each blink. Another design goal of the above empirical study was therefore to reduce primary gaze lens movement (discussed in Table 1-A and 1-B as "Movement with Blink" and measured in mm) without having an apparently immobile or bound lens. An immobile lens would be considered a lens having no visible movement, or movement of less than clinical detection limit of 0.05 mm. As discussed above, it is preferable for the lens to have some minimal movement with a blink to improve the physiology of the cornea.
- Primary gaze lens movement was observed to be more with a blink for the 8.5 mm base curves. However, precise measurements for the lens movement were not collected for these designs or any other with an "N/A" listed in this column. Primary gaze lens movement with a blink reduced from an average of 0.19 mm for the 8.3 mm base curve to 0.08 mm for the 7.9 mm base curve. For some of the thicker designs (Design 24 with an 8.3 mm base curve, and Designs 21 and 22 with an 8.1 mm base curve) primary gaze lens movement with a blink was minimal at averages of 0.11 to 0.19 mm with no lenses showing zero (0.0 mm) movement. For the thicker Design 17 with an 8.1 mm base curve, and Designs 18 and 19 with a 7.9 mm base curve, no primary gaze lens movement with a blink was seen in 10 to 26% of the tested lenses.
- Lens buckling or fluting results from excessive lens material being located toward the edge of the lens and is caused by the lens being too flat to conform to the curvature of the eye. Another design goal was therefore to avoid significant lens buckling or fluting, as shown in the "Lens Buckling/Fluting" column of the above tables. None of the lenses tested had lens buckling or fluting.
- Optical distortion results from excessive lens material existing near the center of the lens and is caused by the lens being too steep to conform to the curvature of the eye. Another design goal was therefore to avoid a significant amount of optical distortion, as shown in the column labeled "Optical Distortion." Optical distortion was seen in 2% of the lenses for Design 18 with a 7.9 mm base curve lens, which is not preferable, but acceptable.
- A clinician then assessed the lens fitting based on a combination of the above parameters and assessments from the wearer based on vision and comfort. Another design goal was therefore to have a single base curve where all lenses within that base curve have an acceptable fit. This is shown in the above tables in the column labeled "Result Summary." A minimal percentage of too loose lenses were observed with
Designs - The present inventors also discovered that thicker lens designs (0.120 mm/0.310 mm central/peripheral thickness) were best for both the 8.1 mm and 8.3 mm base curves. The less-optimal performance with the 7.9 mm and 8.5 mm base curves was also reduced with the thicker 0.310 mm peripheral thickness designs. None of the
Design 9 lenses (8.5 mm base curve and 0.100/0.310 mm central/peripheral thickness) were summarized as "too loose" but they still exhibited degradation in centration and lag. None of the thicker Design 19 lenses (7.9 mm base curve, 0.120/0.310 mm central/peripheral thickness) exhibited optical distortion but a significant percentage showed the less desirable but still acceptable 0.0 mm primary gaze movement with a blink.Table 2: Subjective Data for 7.9-8.5 mm Base Curve Base Curve Thickness - Center, Peripheral Test Number Distance Vision (% >= 84) Near Vision (% >=67) Overall Vision (% >= 76) Comfort (% >=92) Sample Size (subjects) 7.9 0.120, 0.220 18 60.0% 76.0% 2 56.0% 56.0% 25 7.9 0.120, 0.310 19 52.0% 60.0% 48.0% 52.0% 25 8.1 0.120, 0.220 15 58.1% 87.1% 61.3% 64.5% 31 8.1 0.120, 0.310 17 68.0% 100.0% 76.0% 64.0% 25 8.1 0.120, 0.310 21 94.4% 94.4% 88.9% 72.2% 18 8.1 0.120, 0.310 22 66.7% 83.3% 72.2% 66.7% 18 8.3 0.100, 0.220 14 67.7% 87.1% 71.0% 74.2% 31 8.3 0.120, 0.310 16 64.5% 90.3% 61.3% 67.7% 31 8.3 0.120, 0.310 24 95.7% 95.7% 95.7% 73.9% 23 8.5 0.100, 0.310 9 N/A N/A N/A N/A N/A 8.5 0.100, 0.220 11 76.2% 100.0% 76.2% 66.7% 21 8.5 0.100, 0.220 12 76.2% 100.0% 76.2% 52.4% 21 8.5 0.100, 0.220 13 76.2% 95.2% 66.7% 52.4% 21 - Table 2 above shows the corresponding key vision and comfort subjective ratings from the wearers of the lenses discussed earlier in Tables 1-A and 1-B. Table 2 presents these subjective ratings as the percentage of wearers exceeding a cut-off value, for example, the percentage of wearers in which the near vision value equaled or exceeded 67. The numerical parameter of the cut-off value (for example, 67 for near vision) can be derived from any known or acceptable methodology, for example, that discussed in the publication Woods et.al., Visual Performance of a Multifocal Contact Lens versus Monovision in Established Prototypes, OPTOMETRY AND VISION SCIENCE, Vol. 92, No. 2, (February 2015) (see Table 4, page 5), the contents of which are incorporated by reference herein in their entirety. For example, a Table 2 percentage of 50% would mean the average subjective scores for the lenses disclosed herein were the same as the commercial lenses tested in Woods. A percentage greater than 50% would mean more than 50% of the subjective scores for the disclosed lenses exceeded the average scores of the lenses tested in Woods. A Table 2 percentage close to 100% would mean almost all subjective scores for the disclosed lenses were higher than the average scores of the lenses tested in Woods. Table 2 therefore provides an indication of the change in success rate with each of the different designs tested in the above study, and compares those designs to a commercial lens to show the success of the disclosed lens.
- To summarize, for the base curves in the 0.220 mm peripheral thickness design, the preferable base curve was the 8.1 mm base curve based on the objective measures discussed above with respect to Table 1-A and 1-B. One unexpected finding was the subjective ratings in Table 2 were higher with
Designs - For the 0.310 mm designs, both the 8.3 mm and 8.1 mm base curves were preferable based on the objective measures discussed above with respect to Tables 1-A and 1-B. In the subjective ratings of Table 2, these ratings were highest with Design 24 having the 8.3 mm base curve and Design 21 having the 8.1 mm base curve. The subjective ratings were 90 to 95% for distance, near and overall ratings for these samples. One unexpected finding was how much better the performance was compared to the 0.220 mm peripheral thickness lens designs and compared to the commercial lens tested in Woods.
- The results of the testing for Tables 1-A and 1-B, and Table 2, was the discovery of ranges for a lens geometry that can meet all the physical design criteria of a comfortable and well fitted soft contact lens on a wide range of eye shapes. Also, in some instances, the acceptable ranges of the lenses kept the center of the lens as close as practical to the pupil center or line of sight of the eye.
Table 3-A; Lens Diameter Range Chart Base Curve / Diameter Thickness-Center, Peripheral Test Number Movement With Blink Primary Gaze Lag Up Gaze Lag 8.5 / 14.3 0.100, 0.220 10 N/A avg 0.18mm, 0% >0.3mm avg 0.42mm, 76% >0.3mm 8.5 / 14.5 0.100, 0.220 12 N/A avg 0.18mm, 0% >0.3mm avg 0.41mm, 62% >0.3mm 8.3 / 14.5 0.120, 0.310 24 avg 0.19mm, 0% 0.0mm movement avg 0.11mm, 0% >0.3mm avg 0.20mm, 0% >0.3mm Table 3-B: Lens Diameter Range Chart Test Number Decentration - Vertical Decentration - Horizontal Lens Buckling/ Fluting Optical Distortion Result Summary Sample Size 10 avg 0.14mm, 0% >0.3mm avg 0.13mm, 5% >0.3 mm 0 0 0% too loose ortight 38 eyes 12 avg 0.08mm, 5% >0.3mm avg 0.20mm,21% >0.3 mm 0% 0% 0% too loose ortight 42 eyes 24 avg 0.00mm, 0% >0.3mm avg 0.09mm, 0% >0.3 mm 0% 0% 0% too loose ortight 52 eyes - Tables 3-A and 3-B above are similar to Tables 1-A and 1-B and show the different base curve and diameter combinations that were fabricated, measured, verified, and tested clinically. The 8.5 mm base curve lenses having diameters of 14.3 mm (sag of 3.90 mm) and 14.5 mm (sag of 4.05 mm) were tested with respective center and peripheral thicknesses of 0.100 and 0.220 mm. These two designs performed similarly for lag and centration. By comparison, the thicker 0.120/0.310 mm central/peripheral thickness lens with an 8.3 mm base curve and 14.5 mm diameter had less lag and decentration in all measures and no buckling, optical distortion or tightness problems. The designed sag of these lenses was just greater than 4.25 mm. This combination of sagittal diameter and base curve, or sag, had an unexpected synergistic effect of improving the lens fitting and meeting one design objective to keep the center of the lens, where the center of the induced aperture is located, as close as practical to the pupil center or line of sight of the eye.
Table 4: Subjective Data for 8.3 mm and 8.5 mm Base Curve Base Curve / Diameter Thickness - Center, Peripheral Test Number Distance Vision (% >= 84) Near Vision (% >= 67) Overall Vision (% >=76) Comfort (% >=92) Sample Size (subjects) 8.5 / 14.3 0.100, 0.220 10 84.2% 89.5% 63.2% 63.2% 19 8.5 / 14.5 0.100, 0.220 12 76.2% 100.0% 76.2% 52.4% 21 8.3 / 14.5 0.120, 0.310 24 95.7% 95.7% 95.7% 73.9% 23 - The significance of the unexpected synergistic effect can be seen in Table 4 above. Moving from the 8.5 mm base curve having a 14.3 mm diameter to the 14.5 mm diameter had a mixed but somewhat positive effect. Distance vision and comfort were not as good for the 14.5 mm diameter samples but near vision and overall vision were better in the 14.5 mm diameter samples. Moving from the thinner lens having a 8.5 mm base curve and 14.5 mm diameter to the thicker lens having an 8.3 mm base curve and 14.5 mm diameter improved all but near vision, which was already optimal at close to 100%.
Table 5-A; Lens Thickness Range Chart Base Curve Thickness - Center, Peripheral Test Number Movement With Blink Primary Gaze Lag Up Gaze Lag 8.5 0.100, 0.220 11 N/A avg 0.19mm, 7% >0.3mm avg 0.47mm, 64% >0.3mm 8.5 0.100, 0.220 12 N/A avg 0.18mm, 0% >0.3mm avg 0.41mm, 62% >0.3mm 8.5 0.100, 0.220 13 N/A avg 0.19mm, 0% >0.3mm avg 0.41mm, 52% >0.3mm 8.5 0.100, 0.310 9 N/A avg 0.14mm, 0% >0.3mm avg0.37mm, 71 >0.3mm 8.3 0.100, 0.220 14 N/A avg 0.14mm, 0% >0.3mm avg 0.34mm, 36% >0.3mm 8.3 0.120, 0.310 16 N/A avg 0.14mm, 0% >0.3mm avg 0.33mm, 39% >0.3mm 8.3 0.120, 0.310 24 avg 0.19mm, 0% 0.0mm movement avg 0.11mm, 0% >0.3mm avg 0.20mm, 0% >0.3mm 8.1 0.120, 0.220 15 N/A avg 0.14mm, 0% >0.3mm avg 0.31mm, 39% >0.3mm 8.1 0.120, 0.310 17 avg 0.09mm, 16% 0.0mm movement avg 0.05mm, 0% >0.3mm avg 0.17mm, 2% >0.3mm 8.1 0.120, 0.310 21 avg 0.11mm, 0% 0.0mm movement avg 0.12mm, 0% >0.3mm avg 0.21mm, 8% >0.3mm 8.1 0.120, 0.310 22 avg 0.11mm, 0% 0.0mm movement avg 0.07mm, 0% >0.3mm avg 0.21mm, 8% >0.3mm 7.9 0.120, 0.220 18 avg 0.10mm, 10% 0.0mm movement avg 0.07mm, 0% >0.3mm avg 0.22mm, 0% >0.3mm 7.9 0.120, 0.310 19 avg 0.08mm, 26% 0.0mm movement avg0.06mm, 0% >0.3mm avg 0.19mm, 0% >0.3mm Table 5-B: Lens Thickness Range Chart Base Curve Decentration - Vertical Decentration-Horizontal Lens Buckling/ Fluting Optical Distortion Results Summary Sample Size 8.5 avg 0.10mm, 5% >0.3mm avg 0.30mm,31% >0.3mm 0% 0% 7% too loose or decentered 42 eyes 8.5 avg 0.08mm, 5% avg 0% 0% 0% too loose or tight 42 eyes 8.5 avg 0.10mm, 5% >0.3mm avg 0.25mm,21% >0.3mm 0% 0% 2% decentered 42 eyes 8.5 avg 0.08mm, 0% >0.3mm avg 0.19mm, 11% >0.3mm 0% 0% 0% too loose or tight 38 eyes 8.3 avg 0.07mm, 3% >0.3mm avg 0.18mm, 13% >0.3mm 0% 0% 0% too loose or tight 76 eyes 8.3 avg 0.08mm, 6% >0.3mm avg 0.21mm, 19% >0.3mm 0% 0% 0% too loose ortight 62 eyes 8.3 avg 0.00mm, 0% >0.3mm avg 0.09mm, 0% >0.3mm 0% 0% 0% too loose ortight 52 eyes 8.1 avg 0.06mm, 6% >0.3mm avg 0.16mm, 16% >0.3mm 0% 0% 0% too loose or tight 62 eyes 8.1 avg 0.00mm, 0% >0.3mm avg 0.16mm, 0% >0.3mm 0% 0% 0% too loose or tight 50 eyes 8.1 avg 0.00mm, 0% >0.3mm avg 0.16mm, 0% >0.3mm 0% 0% 0% too loose or tight 36 eyes 8.1 avg 0.00mm, 0% >0.3mm avg 0.12mm, 0% >0.3mm 0% 0% 0% too loose or tight 36 eyes 7.9 avg 0.00mm, 0% >0.3mm avg 0.17mm, 0% >0.3mm 0% 2% 4% too tight 50 eyes 7.9 avg 0.00mm, 0% >0.3mm avg 0.17mm, 0% >0.3mm 0 0 6% too tight 50 eyes - Tables 5-A and 5-B are similar to Tables 1-A and 1-B, and 3-A and 3-B. Tables 5-A and 5-B highlight the contrast between the different thicknesses tested in each base curve. The peripheral region was chosen to thicken the lens. At the chosen 12.3 mm sagittal diameter, the lens is past the average horizontal visible iris diameter of 11.5 mm and over the anatomical limbus of the eye. When a wearer blinks the lens onto their eye, this is the area of greatest translation (or "x") in Hooke's Law. This translation (x), thickness and modulus of the hydrated soft contact material (k), and the suction created under the lens can be understood by Hooke's law; the force required to stretch a spring is directly proportional to the amount of stretch. While the hydrated polymer in a soft contact lens material may not be perfectly elastic and linear, the basic proportional relationship holds. The force has the form of F = -k∗x where k is the spring constant which comes from the rigidity of the hydrated contact lens material and thickness, and x is the translation or displacement from before to after blinking onto the eye. The suction is the stored energy from the work done by the eyelids blinking the lens onto the eye and has the form W=-½ k∗x2. The result is small changes in the lens thickness profile in this peripheral region have the most significant change on the stored energy and lens fitting.
- In general, the thicker lenses reduced lens movement with a blink, reduced lens lag and reduced decentration in primary gaze when used with the 8.1 to 8.3 mm base curves. This is because the thicker lens had more stored energy in the form of suction under the lens when blinked onto the eye and this suction increased more, relative to the thinner profile, when the lens is blinked, lags, or is held by the eyelids further from the center of the visible iris. This "band" or annulus of increased thickness also helps improve centration purely by elastic deformation as the lens is displaced from the center of the cornea. The result is a lens design matched to the material properties of the molded etafilcon 58% lenses with reduced movement, yet still moving with a blink, that resists decentration in primary gaze and lens lag with change in gaze.
Table 6: Subjective Data for 7.9 mm-8.5 mm Base Curve Base Curve Thickness - Center, Peripheral Test Number Distance Vision (% >= 84) Near Vision (% >= 67) Overall Vision (% >= 76) Comfort (% >=92) Sample Size (subjects) 8.5 0.100, 0.220 11 76.2% 100.0% 76.2% 66.7% 21 8.5 0.100, 0.220 12 76.2% 100.0% 76.2% 52.4% 21 8.5 0.100, 0.220 13 76.2% 95.2% 66.7% 52.4% 21 8.5 0.100, 0.310 9 N/A N/A N/A N/A N/A 8.3 0.100, 0.220 14 67.7% 87.1% 71.0% 74.2% 31 8.3 0.120, 0.310 16 64.5% 90.3% 61.3% 67.7% 31 8.3 0.120, 0.310 24 95.7% 95.7% 95.7% 73.9% 23 8.1 0.120, 0.220 15 58.1% 87.1% 61.3% 64.5% 31 8.1 0.120, 0.310 17 68.0% 100.0% 76.0% 64.0% 25 8.1 0.120, 0.310 21 94.4% 94.4% 88.9% 72.2% 18 8.1 0.120, 0.310 22 66.7% 83.3% 72.2% 66.7% 18 7.9 0.120, 0.220 18 60.0% 76.0% 56.0% 56.0% 25 7.9 0.120, 0.310 19 52.0% 60.0% 48.0% 52.0% 25 - As shown above in Table 6, the thicker lens design profiles are thicker in the center by 0.020 mm as compared to the thinner lenses in Table 6. This thickness difference is intended to reduce the slight central stress from the suction under the lens with some wearers finding the vision better. This is shown by the thicker Designs 17, 21 and 22 having an 8.1 mm base curve showing better vision ratings compared to the thinner Design 15 having an 8.1 mm base curve.
- Another control point in the thickness profile is the edge thickness. In some examples, and without limitation, a substantially spherical back surface geometry and a radial edge thickness of 0.145 mm at 0.3 mm in from the lens edge provided good comfort over a wider range of base curves. By using a thin edge, which is not lifted from the conjunctiva of the eye, there is minimal physical interaction between the eye lids, lens edge and conjunctiva. This produces less mechanical discomfort for the wearer of the lens and further reduces the propensity of the eyelids to decenter and move the contact lens. When the base curve is steeper (for example, in the 7.9 mm designs) or flatter (for example, in the 8.5 mm designs) the comfort reduces to just better than the commercial lenses benchmarked in the Woods publication discussed above. Outside the 7.9-8.5 mm base curve range, the comfort would decline to unacceptable levels. In the preferable 8.1 mm to 8.3 mm base curves the comfort is unexpectedly better at around 70% of lenses exceeding the average comfort in Woods.
- The tested lenses had a power profile similar to that shown in
FIG. 1 , for example, having an induced aperture, and the disclosed ranges are not exact due to manufacturing tolerances and accepted optical performance at surrounding parameters. For example, the base curve can be ±0.2 mm from the disclosed parameter without substantially affecting its performance as provided by the ANSI tolerance of 0.2 mm. The disclosed thicknesses can be ±0.010 mm, based on accepted scientific tolerances. These tolerances are one example of insubstantial differences between the disclosed ranges and a similar lens design. For example, a lens having a base curve of 8.7 mm would be insubstantially different than the disclosed range of 7.9 mm to 8.5 mm given the ±0.2 mm base curve tolerance. - A single study was conducted with a silicone hydrogel material in a non-optimized geometry of an 8.4 mm base curve and a sagittal diameter of 14.0 mm. This equates to a sag of 3.7 mm. A preferable power profile found to work best on lathe-cut polymacon 38% lenses (11F, +2.375D) was used in this trial with silicon hydrogel material lenses. These lenses were assessed as fitting slightly loose; excessive movement with a blink and decentration. Lenses decentered from 0.11 to 1.05 mm from the pupil center with an average decentration of 0.42 to 0.49 mm. This is considerably more decentration than the lathe-cut polymacon 38% lenses, and the optimized molded etafilcon 58% lenses, the latter being an average of about 0.20 mm.
- This increased movement and decentration moved the induced aperture from the center of the pupil or line of sight too far and for too long a period of time. Vision was reduced compared to spectacle visual acuity by about one line on a letter chart as the lens moved too much on the eye. In this study, 45% (9 of the 20 wearers) said they would likely or very likely continue to wear the lenses if they were available. By comparison, in the preferable etafilcon 58% lenses, 91% (40 of the 44 wearers) said they would likely or very likely continue to wear the lenses if they were available.
- In this case the lenses with their fabricated thickness profiles and edge design using a combination of 8.4 mm base curve and diameter of 14.0 mm were too "loose" or "flat fitting" of a design. However, the present inventors discovered that neither the 8.4 mm base curve or the 14.0 mm diameter alone caused the negative results; rather, the combination of the two that yielded the lower 3.7 mm sag is why the lenses were too "loose" or "flat fitting."
- As shown above, the inventors discovered induced aperture lenses to generally be neither too tight nor too loose when the base curve is a radius between 7.9 mm and 8.5 mm, preferably 8.1 to 8.3 mm. Further, the inventors discovered a well-fitting lens with a diameter between 14.0-14.5 mm, preferably 14.3 to 14.5 mm, OR a sag of 3.7 mm to 4.75 mm, preferably 3.9 mm to 4.75 mm, and more preferably 4.05 mm to 4.50 mm. The claimed lens diameter is between 14.0 and 14.5 mm. Outside of these ranges, the inventors discovered the performance and fit of the lens to decline unexpectedly, showing the criticality of these ranges. Further claimed ranges were discovered, for example, a thickness profile having a center thickness between 0.100-0.120 mm and a peripheral thickness of 0.220-0.310. The above ranges are subject to accepted tolerances, for example, those accepted within the scientific community or provided by ANSI.
- Another aspect of the present disclosure utilizes optical power verification to ensure the function of the disclosed lens and to correct the measured clinical refractive error in the eyes of a user. The inventors performed clinical trials and determined an algorithm to best verify the function of induced aperture lenses and to correct the eye's measured clinical refractive error. This method involves a commercial optical power measurement instrument to measure soft contact lens power profiles in a saline solution. By submerging the lenses in a saline solution, the lenses are maintained in a uniform hydrated state to obtain more accurate power profiles. An algorithm was then developed using this procedure.
- The verification method and verified lens improve the correlation between the disclosed lenses with an induced aperture and a conventional ophthalmic lens having a labeled power. For example, by using the verification method disclosed herein, a lens can be measured and verified to correspond to a labeled power of -2.25 D for a typical lens. As shown in
FIGs. 4-6 , the power at the apex of the lens is not necessarily the same as the labeled power, so a method can be used to ensure a lens having an induced aperture can be used on a patient needing a lens having a specific labeled power, in the above example, -2.25 D. - This verification method, and lens subjected to the verification method, can communicate the necessary labeled power to a clinician, doctor, or wearer of the lens. For example, the lens can be verified and the labeled power inscribed, printed, or otherwise written onto a container or package of the lens. As used herein, "package" is not intended to be limited to the package directly enclosing the lens with solution therein, but any package, label, insert, or writing that accompanies the lens when distributed to a doctor, clinician, or wearer.
- The design of an induced aperture lens is developed by determining the amount of power change on the front surface required to induce an aperture. Verifying the front surface power change is a challenge because commercially available equipment for performing this measurement on contact lenses is not available. It was therefore helpful to re-define the design in terms of a through-lens power profile which could then be verified using commercially available equipment.
- To convert from a front surface tangential power profile to a through lens sagittal power profile, a ray tracing algorithm was developed to calculate the intersection of light rays refracted through the theoretical finished lens with the optical axis. This calculation, based on Snell's Law, is performed for several points along the diameter of the optical zone (in some examples, the step size is around 0.006 mm). The discrete focal lengths are then converted to power by calculating the inverse of the focal lengths. The power values can then be graphed to obtain the through lens sagittal power profile.
FIG. 2 illustrates the curvature for a front surface vs. through lens power profile increase for a -3.00 diopter lens. - The algorithm involves measuring the ramp up in power required to produce the optimized induced aperture. The algorithm was developed based on the difference between the reading at the central 2.0 mm region (i.e., about 2.0 mm from the apex) and the readings for the annular region between about 2.0 and 4.0 mm from the apex. As shown below, the algorithm calculates a "distance power" or labeled power near the apex of the lens as the area weighted average radial sagittal power integrated over the central 2 mm diameter of the lens. This could be, for example, the power a doctor or clinician determines to be the appropriate power for a user to have clear vision. The aperture inducing power discussed below can be the power that produces a blur anywhere within the 2.0-4.0 mm radius.
- Distance Power (Labeled Power) - Area weighted arithmetic average radial sagittal power integrated over, for example, the central 2 mm diameter of the lens

- Aperture Inducing Power - The difference between the area weighted arithmetic average radial sagittal power integrated over, for example, an annular region between 2 and 4 mm diameter, and the distance power.

- The distance power and aperture inducing power are also shown in
FIG. 3. FIG. 3 illustrates apower profile 70 with respect to the aperture inducingpower region 75 and thedistance region 80 of the lens. Thelens diameter 85 is also shown. Based on the calculations above, an exemplary zone diameter is 2 mm for the distance power and between 2-4 mm for the aperture inducing power. However, during clinical testing, the distance and aperture inducing zone diameters were adjusted according to the following rules without substantial deviation in success rate: - Range of distance zone diameter = 2-3 mm
- Exemplary minimum annular aperture inducing zone width = 1 mm
- Maximum diameter for power profile calculations = 6 mm
- As shown below, determining the distance power and aperture inducing power in this manner produced a lens profile with great success that matched the target profile with great accuracy.
- Many different contact lens power measurement devices were evaluated to determine suitability for measuring the through lens power profile of the disclosed lenses. The NIMO TR-1504 (NIMO) Power Measurement device was chosen for its accuracy in measuring the VTI lens design. The NIMO is a wavefront sensor manufactured by Lambda-X®.
-
FIGs. 4-7 illustrate the through lens sagittal power profiles for three separate lenses respectively representing low, medium, and high power lenses for which the present method is utilized. In these examples, the calculations of distance power and aperture inducing power were performed within the central 4.0 mm (within 2.0 mm of the apex) on the graphs. As shown, the disclosed method resulted in excellent agreement between the designed and measured profiles for all three powers highlighting the precision of the disclosed method for ensuring a correct power profile. - For example, a gage repeatability and reproducibility (GR&R) analysis was performed using the NIMO where ten lenses were measured three times each by three different operators in the low, mid, and high powers. The results of this study are summarized below.
Table 7: Power Tolerance: ±0.25 D (or 0.50 D total) -1.00 Avg Pwr -3.00 Avg Pwr -6.00 Avg Pwr Total Gage 45.14 34.43 44.13 Repeatability 45.14 33.43 42.50 Reproducibility 0.00 8.21 11.91 Table 8: Average Aperture Inducing Power Tolerance: ±0.13 D (or 0.26 D total) -1.00 Average Aperture Inducing Power -3.00 Average Aperture Inducing Power -6.00 Average Aperture Inducing Power Total Gage 62.39 48.69 36.25 Repeatability 62.39 47.42 36.25 Reproducibility 0.00 11.05 0.00 - Per ISO 18369-2:2012,
section 5, the reproducibility of the power measurement method should be "better than one-half the tolerance limit specified for the property." As shown above, the calculated reproducibility for all powers tested in this study was under 50% and therefore met the requirements of ISO 18369-2:2012. - To select the power of a spherical (non-astigmatic correction) soft contact lens, two corrections or calculations are accepted as standard clinical practice. First, the power can be adjusted from the spectacle plane to the corneal plane. This is called the vertex distance adjustment. Second, the sphere and cylinder meridians of the vertex distance adjusted refraction are averaged to a single sphere equivalent power.
- The vertex distance adjusted sphere equivalent subjective refraction is the clinical estimate or starting point for selection of the soft contact lens power. In clinical trials, eighteen patients (36 eyes) were analyzed and conventional subjective refractions were performed. The vertex distance adjusted sphere equivalent subjective refractions were calculated and compared to the 2.0 mm average measured power algorithm using a Lambda-X NIMO instrument.
FIG. 7 shows the linear regression comparing these two powers. The "DISPENSED" lens power plot is a linear regression of the best soft contact lens power after a short-term, in-office, evaluation. The "FINAL" lens power plot is a linear regression of the measure lenses after a period of 21 days of wearing the lens outside. - As shown in
FIG. 7 , the agreement between the "DISPENSED" clinical refraction estimate and the "FINAL" measured lens power is high. The "R" values for determining the agreement between a plot and its corresponding linear regression are greater than 0.97, which means that greater than 94% (R squared = 0.94) of the variation in the labelled lens power can be predicted from the subjective refraction. The relationship between the estimated DISPENSED lens and the actual FINAL lens is linear to 5 and 8% error with a standard deviation of the difference of 0.25 D. - As discussed above, the algorithm is applied to the use of a specific type of optical lens, namely, one with an induced aperture. The algorithm is not an algorithm per se, but one applied in a meaningful way so as not to monopolize the entire algorithm. For example, the algorithm is tied to a machine in that it is tied to a lens having an induced aperture. Further, it is not applied with respect to any sort of naturally occurring composition or natural phenomena, but rather with respect to a man-made optical lens having an induced aperture.
- As discussed above, the present invention also involves, in some embodiments, a single lens that can be applied to a wide range of presbyopes. The prior art lenses required a determination of which "add power" best fits the individual wearer's visual needs. The typical presbyope initially requires a low add power at a young age (45 years on average and +1.00D in spectacles) with a greater add power required at an older age until all accommodative ability is lost (at 65 years on average and +2.50D in spectacles). Through clinical testing, the present inventors unexpectedly discovered that a single power profile could induce a single optical aperture with enough depth of focus to satisfy a wide range of presbyopes. Rather than requiring different power profiles to produce different "add powers" in prior art contact lenses for wearers with different degrees of presbyopia, only one lens need be used for individuals with different degrees of presbyopia.
- The data for the single profile/aperture lenses is split between studies using polymacon material contact lenses (for example, lathe cut 38% polymacon) and etafilcon material contact lenses (for example, cast molded 58% etafilcon lenses). In general, the disclosed power rise ranges are for the aperture inducing power of the lens. For the exemplary lenses below, the numerical values of ranges are the front surface tangential power rise at the 3 mm diameter (1.5 mm radius) measurement of the lens. At that diameter/radius, the critical range is for a power rise, i.e., a power above and beyond the central power. This range is different for polymacon material contact lenses and cast molded etafilcon lenses. For polymacon material lenses, the critical range is between +2.00 to +2.75 diopters. For etafilcon lenses, the critical range is between +2.375 to +3.125 diopters.
- Establishing the range of acceptable profiles was first conducted using lathe-cut polymacon 38% material contact lenses with different fitting characteristics to the later molded etafilcon 58% material contact lenses. In general, less rigid soft contact lens materials and flatter fitting lens designs tend to move more on the eye, requiring a larger induced aperture to provide the intended effects over the center of the pupil or line of sight of the eye. More rigid contact lenses maintain their position better, therefore requiring only a small aperture to provide the intended optical effect.
Table 9: Lathed Polymacon Study Design # Aperture inducing power @ Ap Diam (Wet) Overall Summary A1 2.75 Lens has better near vision but distance vision is poor A2 2 Lens has better distance vision but near vision is poor - With the many variables affecting vision and the need to test lenses when worn on the eye, the clinical outcomes for vision could not be predicted or calculated by someone skilled in the art. Experimental clinical testing was required to discover the critical range of acceptable and unacceptable power profiles.
- Many different lens designs were tested in the lathe cut polymacon 38% lenses. They ranged from an 8.1 mm base curve with a 9.2 mm peripheral posterior bevel to an 8.3 mm base curve with a 9.2 mm bevel and a monocurve 8.3 mm spherical and aspherical curvatures.
- In the first study above, the design A1 with an aperture inducing power increase of +2.75D was acceptable but very high. This produced a smaller aperture having good depth of focus and near vision while the closely surrounding blur zone restricted more light entering the pupil, thereby reducing distance vision. The lower power profile tested was the design A2 at +2.00D power increase. This produced a larger induced aperture having less depth of focus and near vision while the further out surrounding blur zone restricted less light entering the pupil to thereby improve distance vision. Thus, the general basis of improving the power profile was discovered by changing the induced aperture size and its corresponding directional effect on visual performance.

Table 10-B Lathed Polymacon Summary of Data Design # Visual Tasks Overall Subjective Vision Low Illumination Subjective Vision Halo Disturbance Overall Satisfaction A1 Worst Worst Worst Worst Worst A2 Best Best 13F Best Middle Middle A1PF Best Best A2PF Middle Middle 10F Middle Middle 11F Best Middle Middle 12F Middle Best Middle - Tables 10-A and 10-B summarize some of the studies concerning power profiles using polymacon material contact lenses. The table references the Design Number and the aperture inducing power ("Inducing Power"). The remaining cells summarize the comparative visual performance for different tests and the comparative overall satisfaction from the wearer's assessment. The term "hybrid" is meant to describe a power profile shape slightly different from others in this chart.
- Design A1 with an aperture inducing power increase of +2.75D was acceptable but not optimum. Design 13F included slight modifications to the A1 design and performed better, as did Designs 13F and 12F. Designs 10F and 11F with aperture inducing power increases of +2.375D were generally the best combination of distance and near vision performance. Designs A2 and A2PF had the lowest aperture inducing power increase of +2.00D and were generally the best for distance and less so for near vision performance. In one trial A2 performed well with wearers requiring a spectacle lower reading addition. To fit a wide range of the presbyopes, which have a wide range of reading additions, the lowest aperture inducing power increase of +2.00D had reduced near vision performance with wearers needing higher reading additions, but was still acceptable. The conclusion from the above tests was the preferable aperture inducing power increase was +2.375, and the range of acceptable aperture inducing power increases was limited to +2.00 to +2.75 inclusive with slight modifications, and the unacceptable power profiles were ≤ +2.00D and ≥ +2.75D, for these polymacon lenses.
- The studies next established the range of acceptable profiles using the etafilcon material contact lenses. The fitting characteristics were better in these lenses as compared to the polymacon lenses, because the etafilcon lenses allowed for testing of different power profiles where the center of the induced aperture is closer to the pupil center or line of sight of the eye. Power profiles that induced smaller apertures could cover the pupil with reduced optical distortions based on the better fit of these lenses. The etafilcon material contact lenses had better fitting characteristics than the polymacon material contact lenses and worked better with higher aperture inducing powers that induced smaller apertures and better near vision with less reduction in distance vision.
-
FIG. 8 illustrates the designed front surface tangential aperture inducing power profiles for the disclosed lenses. The x-axis ofFIG. 8 is the radial distance from the center in mm. The y-axis is the aperture inducing power increase in diopters. Three different aperture inducing power profiles are graphed, including Design 11 (the lowest power increase), Design 12 (the middle power increase), and Design 13 (the highest power increase). -
FIG. 9 illustrates the through lens sagittal aperture inducing power profile comparison for lenses with an apical power of -3.00D. The x-axis is the radial distance from the center in mm. The y-axis is the instantaneous sagittal power in diopters. The same three aperture inducing power increases are graphed inFIG. 9 as inFIG. 8 , that is, Designs 11-13.Table 11: Designs With Scotopic Rings Design Number Aperture Inducing Power Increase (D) 11 2.375 12 2.75 13 3.125 24 2.75 - Table 11 illustrates various design numbers from Tables 1-A and 1-B with optical designs based on Table 10 and a "scotopic ring." A scotopic ring is an optical design where the power at, for example, a 3.0 mm radius reduces back to the power at the apex, and is described in more detail in
U.S. Patent No. 7,178,918 , the contents of which are incorporated by reference herein in their entirety. An example of a power profile having a scotopic ring is shown inFIG. 10 . An unanticipated finding during the testing of A1 and A2 was a rapid power and thickness increase that would excessively increase the thickness of the lenses. This was increased for the high water content etafilcon 58% material due to its lower refractive index. The scotopic ring design reduced this problem.Table 12: Molded Etafilcon Designs With Scotopic Rings Design # Aperture inducing power increase General Summary 11 +2.375 Reduced vision VA and subjective vision ratings 12 +2.75 Preferable vision VA and subjective vision ratings 13 +3.125 Reduced vision VA and subjective vision ratings - As discussed above, experimental clinical testing was required to discover the best range of acceptable and unacceptable power profiles. These ranges are simply not capable of being determined by a mere optimization of known parameters to achieve the end results. Indeed, the end results are not predictable based on the parameters being measured.
- As shown in Table 12,
Design 12 with an aperture inducing power increase of +2.75D performed best on the objective tests and ratings of distance, intermediate, and near vision. One unexpected finding was that the lowerpower profile Design 11 at +2.375 was not the best design as with the previous lathe-cut polymacon 38% material contact lenses, but it still provided good near vision. The next unexpected finding was that the higherpower profile Design 13 at +3.125 was now the new upper acceptable limit as it reduced distance vision. - The end result that was concluded by the above tests was that the best aperture inducing power increase for etafilcon lenses was +2.75, the range of acceptable aperture inducing power increases was limited to +2.375 to +3.125 and the unacceptable increases were ≤ +2.375D and ≥ +3.125D.
Table 13: Subjective Testing of Lenses Subjective at Dispensing Average ± SD (min - max), n VTI It11 VTI It12 VTI It13 Distance Vision 85.7 ± 17.3 (30 -100), 21 89.6 ± 10.7 (60 - 100), 21 80.4 ± 22.1 (20 - 100), 21 Distance Ghosting 90.8 ± 11.2 (50 - 100), 21 89.0 ± 12.2 (50 - 100), 21 83.5 ± 15.2 (50 - 100), 21 Distance Haloes 90.1 ± 12.4 (50 - 100), 21 87.7 ± 23.3 (0 - 100), 21 86.3 ± 20.3 (20 - 100), 21 Distance Fluctuation 84.2 ± 18.0 (50 - 100), 20 90.1 ± 12.6 (50 - 100), 21 83.0 ± 18.8 (20 - 100), 21 Near Vision Good Lighting 90.2 ± 10.3 (70 - 100), 21 92.0 ± 9.3 (70 - 100), 21 88.0 ± 15.3 (30 - 100), 21 Near Vision Low Lighting 76.6 ± 20.4 (20 - 100), 21 83.1 ± 14.3 (50 - 100), 21 75.0 ± 22.2 (20 - 100), 21 Near Ghosting 84.3 ± 13.5 (50 - 100), 21 83.3 ± 20.4 (25 - 100), 21 81.7 ± 17.8 (40 - 100), 21 Near Haloes/Glare 88.4 ± 13.0 (50 - 100), 21 86.2 ± 20.6 (30 - 100), 21 87.9 ± 14.2 (50 - 100), 21 Near Fluctuation 86.0 ± 14.4 (50 - 100), 21 87.9 ± 14.5 (50 - 100), 21 84.6 ± 13.1 (50 - 100), 21 Intermediate Vision 89.6 ± 11.0 (60 - 100), 21 88.1 ± 18.4 (20 - 100), 21 86.4 ± 12.1 (50 - 100), 21 Using/Viewing Cell Phone/PDA 89.4 ± 10.8 (60 - 100), 20 92.0 ± 8.4 (70 - 100), 21 86.9 ± 12.3 (50 - 100), 21 Overall Lens Visual Performance 83.0 ± 17.7 (25 - 100), 21 85.7 ± 14.5 (50 - 100), 21 81.5 ± 16.7 (40 - 100), 21 Overall Comfort 89.7 ± 20.2 (25 - 100), 21 91.8 ± 9.2 (70 - 100), 21 91.1 ± 13.8 (40 - 100), 21 - Table 13 shows that
Design 12 had better overall lens visual performance and other key components of good vision for presbyopic wearers, such as distance vision, distance fluctuation, near vision good lighting, near vision low lighting and using/viewing cell phone/PDA. - Combining Design 12 (+2.75D aperture inducing power increase with the scotopic ring) with lens geometry discussed above with respect to Tables 1A and 1B, the present inventors found further improvement in vision and lens performance as shown in Design 24. Overall success rate for Design 24 was 93-95% with 91% intent to continue wearing the lens. As used herein, "success rate" means the percentage of wearers in which the lens treated presbyopia and where the users could perform their daily tasks while wearing the lens.
- In clinical studies, sixty-one subjects were tested and fifty-nine subjects completed the trial, with their data being reported herein. The subjects were each provided with the Design 24 lens despite having different levels of presbyopia. Only the Design 24 lens was used because it included an 8.3 mm base curve, a midpoint of the critical 7.9 mm-8.5 mm base curve range. However, it was expected that all such lenses falling within the 7.9 mm - 8.5 mm base curve range would exhibit similar subjective results based on the data above.
- For high contrast high illumination visual acuities, no statistically significant differences were detected between best-corrected spectacle vision (BCSV) and the Design 24 lens. Also, for low contrast low illumination visual acuities, no statistically significant differences were detected between BCSV and Design 24 lens.
- At one week of wear, both the high contrast high illumination and low contrast low illumination visual acuities for the Design 24 lens were within two letters of the BCSV. This was particularly impressive because of the difficulty for soft contact lenses, with their high water content, to achieve visual acuities similar to spectacles.
- For stereoacuity, no statistically significant difference was detected between BCSV and the Design 24 lens. Stereoacuity is considered the leading indicator of how well the two eyes are working together, and is a critical attribute for eye-hand coordination tasks, such as the use of a cell phone. Published information on competitive multifocals demonstrates that other multifocals are not able to achieve this level of stereoacuity.
- All twenty subjective visual attributes tested in the trial were rated as higher after one week of wear with the Design 24 lens than the habitual correction. Nineteen of the twenty visual attributes (95%) were determined to be statistically significantly better with the Design 24 lens than the habitual correction, with "Driving During the Day" being the only attribute that was not determined to be significantly statistically different in favor of the Design 24 lens, even though it was rated higher than the habitual correction.
- The areas of the greatest difference in favor of the Design 24 lens were seen for near and intermediate tasks such as the need to not use supplemental reading glasses, reading very small print, using a cell phone, working on a computer, writing, personal grooming, and reading books or newspaper. These attributes were found to be 20-40 points greater with the Design 24 lens than they were for the habitual correction in subjective testing.
- 92.4% of subjects reported that they could meet all of their daily needs with just the Design 24 lens as compared 76.3% with their habitual corrections. This was determined to be a statistically significant difference in favor of the Design 24 lens.
- Subjects were asked the question "Was your vision acceptable with the lenses available and could you complete all or most of your needed visual tasks with few issues that interfered with your vision," and 95% responded "yes" for the Design 24 lens versus only 53% for the habitual correction, a difference that was statistically significant in favor of the Design 24 lens.
- Overall, among those 52 subjects who expressed a preference at the conclusion of the trial, the preference was 77% for the Design 24 lens versus 23% for all habitual corrections. This was determined to be a statistically significant difference in favor of the Design 24 lens.
- Among those 8 subjects who wore Monovision as their habitual correction and expressed a preference at the conclusion of the trial, the preference was 88% for the Design 24 lens versus 12% for the Habitual Monovision. This was determined to be a statistically significant difference in favor of the Design 24 lens.
- Among those twenty-four subjects who wore a competitive multifocal brand as their habitual correction and expressed a preference at the conclusion of the trial, the preference was 79% for the Design 24 lens versus 21% for the Habitual Multifocal brands combined as a group. This was determined to be a statistically significant difference in favor of the Design 24 lens.
- The only brand of competitive multifocal that had a large enough sample to be statistically tested was AirOptix Multifocal (Alcon, Ft Worth, TX), which is currently the leading brand of multifocal. Among those eleven subjects who wore AirOptix Multifocal as their habitual correction and expressed a preference at the conclusion of the trial, the preference was 82% for the Design 24 lens versus 18% for the AirOptix Multifocal. This was determined to be a statistically significant difference in favor of the Design 24 lens.
- Subjects were asked on a 5-point scale to rate how likely they were to continue wearing the lenses, with an average score of 4.11, where 4 represented likely and 5 represented very likely. Of the forty-four subjects who expressed intent to either continue wearing or not to continue wearing the lenses, 91% stated that were likely or very likely to continue wearing the Design 24 lens.
- The comfort of the lenses was also rated very high at 92.5 out of 100, where 100 is considered extremely comfortable. This is notable given that almost 70% of the wearers typically wore a habitual silicone hydrogel lens material.
- The Design 24 lens performed very well in terms of both objective and subjective visual results. The performance of the Design 24 lens for near and intermediate tasks was especially notable as these are the areas in which many competitive multifocals struggle. The high preference rates and the high likelihood to continue wearing the lens are both excellent indicators that the lens demonstrated successful performance with its unique single physical and optical aperture inducing power profile lens design.
- The conclusion is that the single lens optimized lens geometry can meet all the physical design criteria of a comfortable and well fitted soft contact lens on a wide range of eye shapes and meet the optical design objective of keeping the center of the lens as close as practical to the pupil center or line of sight of the eye. When fitted this way the single power profile creates an induced optical aperture and increased depth of focus that can provide good distance, intermediate, and near vision to a wide age range of presbyopes that need a low spectacle near addition powers when they are younger and high spectacle near addition powers when they are older. The optimized one design per distance correcting sphere power had a 93 to 95% success rate.
- While the above data relates to the optimum physical lens parameters for lathe cut 38% polymacon and cast molded etafilcon 58% lenses, other hydrogel, or more rigid or less rigid soft contact lens materials, could also be designed to optimize vision of lenses having an induced aperture. For example, the methodology discussed herein, and more explicitly set forth below, is applicable to other hydrogel materials and silicon hydrogel lenses to determine the appropriate parameters for comfort and fit, and the appropriate power profile for optical function.
- Establishing the range of acceptable profiles conducted using lathe-cut polymacon 38% material contact lenses with different fitting characteristics to the later molded etafilcon 58% material contact lenses worked better with lower aperture inducing power profile increases like +2.375D. The fitting characteristics were less optimal with respect to a design objective of the physical lens parameter optimization to keep the center of the lens, where the center of the induced aperture is, as close as practical to the pupil center or line of sight of the eye. Specifically the fitting characteristics were:
- 1. increased primary gaze decentration,
- 2. increased lens lag and
- 3. increased primary gaze lens movement with a blink.
- This reduced overall vision and comfort with the lenses and the final success rate. It also meant testing different power profiles where the center of the induced aperture is now further from the pupil center or line of sight of the eye. Lower power profiles that induce larger apertures helped to cover the pupil and reduce optical distortions in these more misaligned lens fittings.
- For the molded etafilcon 58% material contact lenses, the fitting characteristics were improved with respect to a design objective to keep the center of the lens, where the center of the induced aperture is, as close as practical to the pupil center or line of sight of the eye. For example, some of the fitting characteristics were:
- 1. decreased primary gaze decentration,
- 2. decreased lens lag and
- 3. decreased primary gaze lens movement with a blink.
- This meant testing different power profiles where the center of the induced aperture is closer to the pupil center or line of sight of the eye. Power profiles that induced smaller apertures could cover the pupil with reduced optical distortions in these less misaligned lens fittings. These smaller apertures produce more depth of focus and provide better near vision with older presbyopes which need higher reading addition powers in spectacles. These smaller apertures also have less optical effect on distance vision when close as practical to the pupil center or line of sight of the eye.
- A methodology can be used to determine the acceptable parameters of a lens regardless of material. Starting with a steep and large diameter lens of 8.1 mm to 8.5 mm base curve, and 14.0 mm to 15.0 diameter, the peripheral thickness of the lens can be increased until the lens decentration is minimized. Similarly, the edge thickness can be reduced until the lens edge sensation is removed. The base curve can be reduced until movement is minimized or the lens stops moving or optically distorts on the eye. If the lens optically distorts on the eye and is still moving with a blink, the center thickness of the lens should be increased first. Generally the more flexible the soft contact lens material, the optimum physical lens parameters will include a steeper base curve, a larger diameter, and a thicker thickness profile. For example, using the above methodology and the data from the etafilcon and polymacon lenses, the inventors of the present invention determined that a lens with an induced aperture would function with an aperture inducing power rise of +2.00 to +3.25 D, preferably +2.75 D. For example, based on the above methodology and data, the present inventors determined that silicon hydrogel lenses would function within this range. Insubstantial differences from the above range would be based on scientifically and ANSI-accepted tolerances. As discussed above, the present invention can be directed to methods and devices including lenses. However, the invention is not so limited, and can include contact lenses, intraocular lenses, eyeglasses, other types of lenses, or any other optical device.
- The matter set forth in the foregoing description and accompanying drawings is offered by way of illustration only and not as a limitation. While particular embodiments have been shown and described, it will be apparent to those skilled in the art that changes and modifications may be made without departing from the broader aspects of the inventors' contribution. The actual scope of the protection sought is intended to be defined in the following claims.
Claims (5)
- An ophthalmic lens comprising:an apex area having distance vision correcting power and a power distribution creating a blurred region outside of the apex area so as to cause an induced aperture;a base curve between 7.9 mm and 8.5 mm, preferably between 8.1 mm and 8.3 mm; anda lens diameter between 14.0 and 14.5 mm, whereina thickness profile having a center thickness of 100-120 microns, and a peripheral thickness of 220-310 microns at a chord diameter of 12.30 mm, andthe power distribution includes an aperture inducing power rise (a) between +2.00 to +2.75 diopters and the lens is made of polymacon, or (b) +2.375 to +3.125 and the lens is made of etafilcon, or (c) +2.00 to +3.25 diopters and the lens is made of silicon hydrogel,wherein the aperture inducing power rise is a front surface tangential power rise as determined at the 1.5 mm radius away from a center of the apex area.
- The ophthalmic lens of claim 1, wherein the lens diameter is between 14.3 mm to 14.5 mm.
- The ophthalmic lens of one of claims 1 to 2, wherein a sag of the lens is between about 3.7 mm to 4.75 mm, preferably between about 3.9 mm to 4.75 mm, more preferably between about 4.05 mm to 4.5 mm.
- The ophthalmic lens of one of claims 1 to 3, wherein an edge thickness is 145 microns as measured at 0.3 mm in from an edge of the lens.
- The ophthalmic lens of one of the claims 1 to 4, wherein the ophthalmic lens further comprising a scotopic ring outside of the apex area and blurred region, wherein the scotopic ring preferably begins at least 3.0 mm away from a center of the apex area.
Applications Claiming Priority (1)
| Application Number | Priority Date | Filing Date | Title |
|---|---|---|---|
| US15/040,518 US11567346B2 (en) | 2016-02-10 | 2016-02-10 | Induced aperture lens and method |
Publications (3)
| Publication Number | Publication Date |
|---|---|
| EP3206077A1 EP3206077A1 (en) | 2017-08-16 |
| EP3206077B1 true EP3206077B1 (en) | 2023-06-07 |
| EP3206077C0 EP3206077C0 (en) | 2023-06-07 |
Family
ID=56026726
Family Applications (1)
| Application Number | Title | Priority Date | Filing Date |
|---|---|---|---|
| EP16170493.7A Active EP3206077B1 (en) | 2016-02-10 | 2016-05-19 | Induced aperture lens and method |
Country Status (6)
| Country | Link |
|---|---|
| US (3) | US11567346B2 (en) |
| EP (1) | EP3206077B1 (en) |
| CN (1) | CN107065218B (en) |
| AU (1) | AU2016201071B2 (en) |
| ES (1) | ES2949209T3 (en) |
| SG (2) | SG10201603913SA (en) |
Families Citing this family (14)
| Publication number | Priority date | Publication date | Assignee | Title |
|---|---|---|---|---|
| TWI636296B (en) * | 2017-08-28 | 2018-09-21 | 精華光學股份有限公司 | Optical lenses for vision correction |
| US11947197B2 (en) | 2018-03-29 | 2024-04-02 | Reopia Optics, Inc. | Spectacles for presbyopia treatment and myopia progression control and associated methods |
| US11681161B2 (en) | 2018-03-29 | 2023-06-20 | Reopia Optics, Inc. | Anti-myopia-progression spectacles and associated methods |
| US10921612B2 (en) | 2018-03-29 | 2021-02-16 | Reopia Optics, Llc. | Spectacles and associated methods for presbyopia treatment and myopia progression control |
| EP3891553B1 (en) * | 2018-12-05 | 2024-11-06 | Hanita Lenses Ltd. | Contact lens with adaptable curvature |
| EP4006624B1 (en) | 2020-11-26 | 2024-04-24 | Carl Zeiss Vision International GmbH | Spectacle lens design, method of manufacturing a spectacle lens and method of providing a spectacle lens for at least retarding myopia progression |
| TWI813083B (en) * | 2021-12-01 | 2023-08-21 | 長庚醫療財團法人基隆長庚紀念醫院 | Method and lens for enhancing myopia control and method of manufacturing lens |
| WO2023147471A1 (en) * | 2022-01-28 | 2023-08-03 | Ohio State Innovation Foundation | Contact lens comprising an optical zone |
| EP4292798A1 (en) | 2022-06-14 | 2023-12-20 | Carl Zeiss Vision International GmbH | Method of providing refractive microstructures on a surface of a spectacle lens and spectacle lens design |
| US20240118560A1 (en) * | 2022-09-29 | 2024-04-11 | Coopervision International Limited | Contact lenses and methods relating thereto |
| US20240210729A1 (en) * | 2022-12-22 | 2024-06-27 | Johnson & Johnson Vision Care, Inc. | Opthalmic lens for myopia control |
| GB2640009A (en) * | 2023-03-31 | 2025-10-08 | Coopervision Int Ltd | Opthalmic lenses and methods relating thereto |
| AU2024368313A1 (en) * | 2023-10-27 | 2026-02-12 | Coopervision International Limited | Ophthalmic lenses and methods relating thereto |
| CN120703988B (en) * | 2025-08-22 | 2026-02-13 | 歌尔股份有限公司 | Optical adjustment method, optical adjustment device, head display device and storage medium |
Family Cites Families (40)
| Publication number | Priority date | Publication date | Assignee | Title |
|---|---|---|---|---|
| US4640595A (en) | 1984-05-02 | 1987-02-03 | David Volk | Aspheric contact lens |
| DE3516575A1 (en) | 1985-05-08 | 1986-11-13 | Hecht Contactlinsen GmbH, 7800 Freiburg | CONTACTLINSE |
| US5225858A (en) | 1987-06-01 | 1993-07-06 | Valdemar Portney | Multifocal ophthalmic lens |
| US5192317A (en) | 1988-07-26 | 1993-03-09 | Irvin Kalb | Multi focal intra-ocular lens |
| US5112351A (en) | 1990-10-12 | 1992-05-12 | Ioptex Research Inc. | Multifocal intraocular lenses |
| US5448312A (en) | 1992-12-09 | 1995-09-05 | Johnson & Johnson Vision Products, Inc. | Pupil-tuned multifocal ophthalmic lens |
| US5327181A (en) | 1993-01-12 | 1994-07-05 | Gentex Optics, Inc. | Progressive lens for specialty and occupational use |
| US5619289A (en) | 1993-03-31 | 1997-04-08 | Permeable Technologies, Inc. | Multifocal contact lens |
| US5436678A (en) | 1993-09-30 | 1995-07-25 | Wilmington Partners L.P. | Aspheric multifocal contact lens |
| BR9509477A (en) * | 1994-10-21 | 1997-09-30 | Sola Int Holdings | Enhanced ophthalmic lenses |
| IL118065A0 (en) | 1995-05-04 | 1996-08-04 | Johnson & Johnson Vision Prod | Aspheric toric lens designs |
| US5929969A (en) | 1995-05-04 | 1999-07-27 | Johnson & Johnson Vision Products, Inc. | Multifocal ophthalmic lens |
| US5650838A (en) | 1995-05-04 | 1997-07-22 | Johnson & Johnson Vision Products, Inc. | Programmable smooth junctions on lenses |
| US5684560A (en) | 1995-05-04 | 1997-11-04 | Johnson & Johnson Vision Products, Inc. | Concentric ring single vision lens designs |
| US5815237A (en) | 1996-07-01 | 1998-09-29 | Bausch & Lomb Incorporated | Contact lens and method for making the same |
| US5975694A (en) | 1996-07-01 | 1999-11-02 | Bausch & Lomb Incorporated | Contact lens and method for making the same |
| US5835187A (en) | 1996-11-22 | 1998-11-10 | Wilmington Partners L.P. | Aspheric multifocal contact lens having concentric front surface |
| US6260966B1 (en) | 1998-03-11 | 2001-07-17 | Menicon Co. Ltd. | Multifocal ocular lens |
| US6030077A (en) | 1998-03-11 | 2000-02-29 | Menicon Co., Ltd. | Multifocal ocular lens having intermediate region with continuously varying optical power |
| WO2000004414A1 (en) * | 1998-07-17 | 2000-01-27 | Sola International Holdings Ltd | Optical lens |
| US6286956B1 (en) | 1998-10-19 | 2001-09-11 | Mencion Co., Ltd. | Multifocal ocular lens including intermediate vision correction region between near and distant vision correction regions |
| US7178918B2 (en) * | 2000-09-08 | 2007-02-20 | Griffin Richard A | Ophthalmic lenses with induced aperture and redundant power regions |
| US6474814B1 (en) * | 2000-09-08 | 2002-11-05 | Florida Optical Engineering, Inc | Multifocal ophthalmic lens with induced aperture |
| US20040237971A1 (en) * | 2003-06-02 | 2004-12-02 | Hema Radhakrishnan | Methods and apparatuses for controlling optical aberrations to alter modulation transfer functions |
| US7503655B2 (en) | 2003-11-19 | 2009-03-17 | Vision Crc Limited | Methods and apparatuses for altering relative curvature of field and positions of peripheral, off-axis focal positions |
| CN1909860B (en) * | 2003-11-19 | 2012-03-21 | 视力Crc有限公司 | Method and apparatus for varying relative field curvature and peripheral off-axis focus position |
| JP2005202107A (en) * | 2004-01-15 | 2005-07-28 | Asahi Kasei Aimii Kk | Bifocal contact lens |
| NZ573194A (en) * | 2006-06-08 | 2011-12-22 | Vision Crc Ltd | A non-multifocal contact lens comprising a central optical zone and a peripheral optical zone |
| CA2657572A1 (en) | 2006-07-26 | 2008-03-13 | Menicon Co., Ltd. | Systems and methods for providing contact lenses to consumers |
| TWI487516B (en) | 2007-08-22 | 2015-06-11 | Novartis Ag | Presbyopic treatment system |
| MY155624A (en) * | 2008-04-18 | 2015-11-13 | Novartis Ag | Myopia control means |
| CN102119354B (en) * | 2008-08-11 | 2013-06-19 | 诺瓦提斯公司 | Lens designs and methods for preventing or delaying the progression of myopia |
| US8632187B1 (en) * | 2009-04-27 | 2014-01-21 | Dakota Sciences, Inc. | Progressive multifocal rigid gas permeable contact lens |
| MX2011011793A (en) | 2009-05-04 | 2012-01-30 | Coopervision Int Holding Co Lp | Ophthalmic lenses and reduction of accommodative error. |
| JP5369317B2 (en) * | 2009-12-09 | 2013-12-18 | 東海光学株式会社 | Manufacturing method of plastic spectacle lens, lens manufactured by the manufacturing method, and mother mold for spectacle lens |
| JP2012103669A (en) * | 2010-10-12 | 2012-05-31 | Seiko Epson Corp | Spectacle lens, spectacles, and manufacturing method of spectacle lens |
| JP5789108B2 (en) * | 2011-03-08 | 2015-10-07 | イーエイチエス レンズ フィリピン インク | Progressive power lens and design method thereof |
| JP6346088B2 (en) * | 2011-06-15 | 2018-06-20 | ビジョネーリング テクノロジーズ、インコーポレイテッド | Ophthalmic lens to treat the progression of myopia |
| CN202995164U (en) * | 2012-07-26 | 2013-06-12 | 苏州苏大明世光学股份有限公司 | Blind area-optimized progressive eye lens and mould thereof |
| CN106610535A (en) * | 2015-10-26 | 2017-05-03 | 鸿富锦精密工业(深圳)有限公司 | Ophthalmic lens and preparation method thereof |
-
2016
- 2016-02-10 US US15/040,518 patent/US11567346B2/en active Active
- 2016-02-22 AU AU2016201071A patent/AU2016201071B2/en active Active
- 2016-05-16 SG SG10201603913SA patent/SG10201603913SA/en unknown
- 2016-05-16 SG SG10201705911YA patent/SG10201705911YA/en unknown
- 2016-05-19 ES ES16170493T patent/ES2949209T3/en active Active
- 2016-05-19 EP EP16170493.7A patent/EP3206077B1/en active Active
- 2016-09-12 CN CN201610818780.XA patent/CN107065218B/en active Active
-
2018
- 2018-08-21 US US16/106,481 patent/US20180356651A1/en not_active Abandoned
-
2021
- 2021-09-22 US US17/481,621 patent/US11630326B2/en active Active
Also Published As
| Publication number | Publication date |
|---|---|
| US20180356651A1 (en) | 2018-12-13 |
| CN107065218B (en) | 2019-06-28 |
| CN107065218A (en) | 2017-08-18 |
| SG10201603913SA (en) | 2017-09-28 |
| US11567346B2 (en) | 2023-01-31 |
| US20220011597A1 (en) | 2022-01-13 |
| US11630326B2 (en) | 2023-04-18 |
| EP3206077C0 (en) | 2023-06-07 |
| US20170227788A1 (en) | 2017-08-10 |
| SG10201705911YA (en) | 2017-09-28 |
| EP3206077A1 (en) | 2017-08-16 |
| AU2016201071A1 (en) | 2017-08-24 |
| ES2949209T3 (en) | 2023-09-26 |
| AU2016201071B2 (en) | 2017-12-14 |
Similar Documents
| Publication | Publication Date | Title |
|---|---|---|
| US11630326B2 (en) | Induced aperture lens and method | |
| US10928654B2 (en) | Myopia controlling ophthalmic lenses | |
| US6582076B1 (en) | Ophthalmic lenses useful in correcting astigmatism and presbyopia | |
| TWI656378B (en) | Lens design that minimizes vision variation experienced by myopic deepening | |
| KR20160026725A (en) | Freeform lens design and method for preventing and/or slowing myopia progression | |
| KR20140098006A (en) | Asymmetric lens design and method for preventing and/or slowing myopia progression | |
| US20050068494A1 (en) | Ophthalmic lenses with induced aperture and redundant power regions | |
| EP2057501A1 (en) | Toric contact lenses with controlled optical power profile | |
| KR20130098929A (en) | Multi-axis lens design for astigmatism | |
| CN102171601B (en) | Fitting method of multifocal lens | |
| GB2288033A (en) | Contact lens having central aspherical and annular spherical lens | |
| HK1168658B (en) | Design of myopia control ophthalmic lenses | |
| HK1170027B (en) | Design of myopia control ophthalmic lenses |
Legal Events
| Date | Code | Title | Description |
|---|---|---|---|
| PUAI | Public reference made under article 153(3) epc to a published international application that has entered the european phase |
Free format text: ORIGINAL CODE: 0009012 |
|
| STAA | Information on the status of an ep patent application or granted ep patent |
Free format text: STATUS: THE APPLICATION HAS BEEN PUBLISHED |
|
| AK | Designated contracting states |
Kind code of ref document: A1 Designated state(s): AL AT BE BG CH CY CZ DE DK EE ES FI FR GB GR HR HU IE IS IT LI LT LU LV MC MK MT NL NO PL PT RO RS SE SI SK SM TR |
|
| AX | Request for extension of the european patent |
Extension state: BA ME |
|
| STAA | Information on the status of an ep patent application or granted ep patent |
Free format text: STATUS: REQUEST FOR EXAMINATION WAS MADE |
|
| RIN1 | Information on inventor provided before grant (corrected) |
Inventor name: DILLEHAY, SALLY M. Inventor name: PAYOR, RICK E. Inventor name: TYSON, MARK K. Inventor name: GRIFFIN, RICHARD A. |
|
| 17P | Request for examination filed |
Effective date: 20180124 |
|
| RBV | Designated contracting states (corrected) |
Designated state(s): AL AT BE BG CH CY CZ DE DK EE ES FI FR GB GR HR HU IE IS IT LI LT LU LV MC MK MT NL NO PL PT RO RS SE SI SK SM TR |
|
| STAA | Information on the status of an ep patent application or granted ep patent |
Free format text: STATUS: EXAMINATION IS IN PROGRESS |
|
| 17Q | First examination report despatched |
Effective date: 20210520 |
|
| GRAP | Despatch of communication of intention to grant a patent |
Free format text: ORIGINAL CODE: EPIDOSNIGR1 |
|
| STAA | Information on the status of an ep patent application or granted ep patent |
Free format text: STATUS: GRANT OF PATENT IS INTENDED |
|
| GRAS | Grant fee paid |
Free format text: ORIGINAL CODE: EPIDOSNIGR3 |
|
| INTG | Intention to grant announced |
Effective date: 20230328 |
|
| GRAA | (expected) grant |
Free format text: ORIGINAL CODE: 0009210 |
|
| STAA | Information on the status of an ep patent application or granted ep patent |
Free format text: STATUS: THE PATENT HAS BEEN GRANTED |
|
| AK | Designated contracting states |
Kind code of ref document: B1 Designated state(s): AL AT BE BG CH CY CZ DE DK EE ES FI FR GB GR HR HU IE IS IT LI LT LU LV MC MK MT NL NO PL PT RO RS SE SI SK SM TR |
|
| REG | Reference to a national code |
Ref country code: GB Ref legal event code: FG4D |
|
| REG | Reference to a national code |
Ref country code: CH Ref legal event code: EP Ref country code: AT Ref legal event code: REF Ref document number: 1576872 Country of ref document: AT Kind code of ref document: T Effective date: 20230615 |
|
| REG | Reference to a national code |
Ref country code: DE Ref legal event code: R096 Ref document number: 602016079799 Country of ref document: DE |
|
| RAP4 | Party data changed (patent owner data changed or rights of a patent transferred) |
Owner name: VISIONEERING TECHNOLOGIES, INC. |
|
| U01 | Request for unitary effect filed |
Effective date: 20230629 |
|
| U07 | Unitary effect registered |
Designated state(s): AT BE BG DE DK EE FI FR IT LT LU LV MT NL PT SE SI Effective date: 20230707 |
|
| REG | Reference to a national code |
Ref country code: NO Ref legal event code: T2 Effective date: 20230607 |
|
| REG | Reference to a national code |
Ref country code: LT Ref legal event code: MG9D |
|
| REG | Reference to a national code |
Ref country code: ES Ref legal event code: FG2A Ref document number: 2949209 Country of ref document: ES Kind code of ref document: T3 Effective date: 20230926 |
|
| PG25 | Lapsed in a contracting state [announced via postgrant information from national office to epo] |
Ref country code: RS Free format text: LAPSE BECAUSE OF FAILURE TO SUBMIT A TRANSLATION OF THE DESCRIPTION OR TO PAY THE FEE WITHIN THE PRESCRIBED TIME-LIMIT Effective date: 20230607 Ref country code: HR Free format text: LAPSE BECAUSE OF FAILURE TO SUBMIT A TRANSLATION OF THE DESCRIPTION OR TO PAY THE FEE WITHIN THE PRESCRIBED TIME-LIMIT Effective date: 20230607 Ref country code: GR Free format text: LAPSE BECAUSE OF FAILURE TO SUBMIT A TRANSLATION OF THE DESCRIPTION OR TO PAY THE FEE WITHIN THE PRESCRIBED TIME-LIMIT Effective date: 20230908 |
|
| PG25 | Lapsed in a contracting state [announced via postgrant information from national office to epo] |
Ref country code: SK Free format text: LAPSE BECAUSE OF FAILURE TO SUBMIT A TRANSLATION OF THE DESCRIPTION OR TO PAY THE FEE WITHIN THE PRESCRIBED TIME-LIMIT Effective date: 20230607 |
|
| PG25 | Lapsed in a contracting state [announced via postgrant information from national office to epo] |
Ref country code: IS Free format text: LAPSE BECAUSE OF FAILURE TO SUBMIT A TRANSLATION OF THE DESCRIPTION OR TO PAY THE FEE WITHIN THE PRESCRIBED TIME-LIMIT Effective date: 20231007 |
|
| PG25 | Lapsed in a contracting state [announced via postgrant information from national office to epo] |
Ref country code: SM Free format text: LAPSE BECAUSE OF FAILURE TO SUBMIT A TRANSLATION OF THE DESCRIPTION OR TO PAY THE FEE WITHIN THE PRESCRIBED TIME-LIMIT Effective date: 20230607 Ref country code: SK Free format text: LAPSE BECAUSE OF FAILURE TO SUBMIT A TRANSLATION OF THE DESCRIPTION OR TO PAY THE FEE WITHIN THE PRESCRIBED TIME-LIMIT Effective date: 20230607 Ref country code: RO Free format text: LAPSE BECAUSE OF FAILURE TO SUBMIT A TRANSLATION OF THE DESCRIPTION OR TO PAY THE FEE WITHIN THE PRESCRIBED TIME-LIMIT Effective date: 20230607 Ref country code: IS Free format text: LAPSE BECAUSE OF FAILURE TO SUBMIT A TRANSLATION OF THE DESCRIPTION OR TO PAY THE FEE WITHIN THE PRESCRIBED TIME-LIMIT Effective date: 20231007 Ref country code: CZ Free format text: LAPSE BECAUSE OF FAILURE TO SUBMIT A TRANSLATION OF THE DESCRIPTION OR TO PAY THE FEE WITHIN THE PRESCRIBED TIME-LIMIT Effective date: 20230607 |
|
| PG25 | Lapsed in a contracting state [announced via postgrant information from national office to epo] |
Ref country code: PL Free format text: LAPSE BECAUSE OF FAILURE TO SUBMIT A TRANSLATION OF THE DESCRIPTION OR TO PAY THE FEE WITHIN THE PRESCRIBED TIME-LIMIT Effective date: 20230607 |
|
| REG | Reference to a national code |
Ref country code: DE Ref legal event code: R097 Ref document number: 602016079799 Country of ref document: DE |
|
| PLBE | No opposition filed within time limit |
Free format text: ORIGINAL CODE: 0009261 |
|
| STAA | Information on the status of an ep patent application or granted ep patent |
Free format text: STATUS: NO OPPOSITION FILED WITHIN TIME LIMIT |
|
| 26N | No opposition filed |
Effective date: 20240308 |
|
| U20 | Renewal fee for the european patent with unitary effect paid |
Year of fee payment: 9 Effective date: 20240408 |
|
| PG25 | Lapsed in a contracting state [announced via postgrant information from national office to epo] |
Ref country code: MC Free format text: LAPSE BECAUSE OF FAILURE TO SUBMIT A TRANSLATION OF THE DESCRIPTION OR TO PAY THE FEE WITHIN THE PRESCRIBED TIME-LIMIT Effective date: 20230607 |
|
| PG25 | Lapsed in a contracting state [announced via postgrant information from national office to epo] |
Ref country code: MC Free format text: LAPSE BECAUSE OF FAILURE TO SUBMIT A TRANSLATION OF THE DESCRIPTION OR TO PAY THE FEE WITHIN THE PRESCRIBED TIME-LIMIT Effective date: 20230607 |
|
| U20 | Renewal fee for the european patent with unitary effect paid |
Year of fee payment: 10 Effective date: 20250407 |
|
| PGFP | Annual fee paid to national office [announced via postgrant information from national office to epo] |
Ref country code: ES Payment date: 20250606 Year of fee payment: 10 |
|
| PGFP | Annual fee paid to national office [announced via postgrant information from national office to epo] |
Ref country code: NO Payment date: 20250509 Year of fee payment: 10 |
|
| PGFP | Annual fee paid to national office [announced via postgrant information from national office to epo] |
Ref country code: CH Payment date: 20250601 Year of fee payment: 10 |
|
| PG25 | Lapsed in a contracting state [announced via postgrant information from national office to epo] |
Ref country code: CY Free format text: LAPSE BECAUSE OF FAILURE TO SUBMIT A TRANSLATION OF THE DESCRIPTION OR TO PAY THE FEE WITHIN THE PRESCRIBED TIME-LIMIT; INVALID AB INITIO Effective date: 20160519 |
|
| PG25 | Lapsed in a contracting state [announced via postgrant information from national office to epo] |
Ref country code: HU Free format text: LAPSE BECAUSE OF FAILURE TO SUBMIT A TRANSLATION OF THE DESCRIPTION OR TO PAY THE FEE WITHIN THE PRESCRIBED TIME-LIMIT; INVALID AB INITIO Effective date: 20160519 |
|
| PGFP | Annual fee paid to national office [announced via postgrant information from national office to epo] |
Ref country code: GB Payment date: 20260312 Year of fee payment: 11 |
|
| PGFP | Annual fee paid to national office [announced via postgrant information from national office to epo] |
Ref country code: IE Payment date: 20260310 Year of fee payment: 11 |