EP3196621A1 - Displacement sensor inspection device and inspection method for same - Google Patents
Displacement sensor inspection device and inspection method for same Download PDFInfo
- Publication number
- EP3196621A1 EP3196621A1 EP15841874.9A EP15841874A EP3196621A1 EP 3196621 A1 EP3196621 A1 EP 3196621A1 EP 15841874 A EP15841874 A EP 15841874A EP 3196621 A1 EP3196621 A1 EP 3196621A1
- Authority
- EP
- European Patent Office
- Prior art keywords
- sequence data
- displacement sensor
- point
- difference
- post
- Prior art date
- Legal status (The legal status is an assumption and is not a legal conclusion. Google has not performed a legal analysis and makes no representation as to the accuracy of the status listed.)
- Withdrawn
Links
Images


Classifications
-
- G—PHYSICS
- G01—MEASURING; TESTING
- G01L—MEASURING FORCE, STRESS, TORQUE, WORK, MECHANICAL POWER, MECHANICAL EFFICIENCY, OR FLUID PRESSURE
- G01L3/00—Measuring torque, work, mechanical power, or mechanical efficiency, in general
- G01L3/02—Rotary-transmission dynamometers
- G01L3/04—Rotary-transmission dynamometers wherein the torque-transmitting element comprises a torsionally-flexible shaft
- G01L3/10—Rotary-transmission dynamometers wherein the torque-transmitting element comprises a torsionally-flexible shaft involving electric or magnetic means for indicating
- G01L3/107—Rotary-transmission dynamometers wherein the torque-transmitting element comprises a torsionally-flexible shaft involving electric or magnetic means for indicating involving potentiometric means
-
- G—PHYSICS
- G01—MEASURING; TESTING
- G01L—MEASURING FORCE, STRESS, TORQUE, WORK, MECHANICAL POWER, MECHANICAL EFFICIENCY, OR FLUID PRESSURE
- G01L25/00—Testing or calibrating of apparatus for measuring force, torque, work, mechanical power, or mechanical efficiency
-
- G—PHYSICS
- G01—MEASURING; TESTING
- G01L—MEASURING FORCE, STRESS, TORQUE, WORK, MECHANICAL POWER, MECHANICAL EFFICIENCY, OR FLUID PRESSURE
- G01L3/00—Measuring torque, work, mechanical power, or mechanical efficiency, in general
- G01L3/02—Rotary-transmission dynamometers
- G01L3/04—Rotary-transmission dynamometers wherein the torque-transmitting element comprises a torsionally-flexible shaft
- G01L3/10—Rotary-transmission dynamometers wherein the torque-transmitting element comprises a torsionally-flexible shaft involving electric or magnetic means for indicating
-
- G—PHYSICS
- G01—MEASURING; TESTING
- G01D—MEASURING NOT SPECIALLY ADAPTED FOR A SPECIFIC VARIABLE; ARRANGEMENTS FOR MEASURING TWO OR MORE VARIABLES NOT COVERED IN A SINGLE OTHER SUBCLASS; TARIFF METERING APPARATUS; MEASURING OR TESTING NOT OTHERWISE PROVIDED FOR
- G01D5/00—Mechanical means for transferring the output of a sensing member; Means for converting the output of a sensing member to another variable where the form or nature of the sensing member does not constrain the means for converting; Transducers not specially adapted for a specific variable
- G01D5/12—Mechanical means for transferring the output of a sensing member; Means for converting the output of a sensing member to another variable where the form or nature of the sensing member does not constrain the means for converting; Transducers not specially adapted for a specific variable using electric or magnetic means
- G01D5/14—Mechanical means for transferring the output of a sensing member; Means for converting the output of a sensing member to another variable where the form or nature of the sensing member does not constrain the means for converting; Transducers not specially adapted for a specific variable using electric or magnetic means influencing the magnitude of a current or voltage
- G01D5/16—Mechanical means for transferring the output of a sensing member; Means for converting the output of a sensing member to another variable where the form or nature of the sensing member does not constrain the means for converting; Transducers not specially adapted for a specific variable using electric or magnetic means influencing the magnitude of a current or voltage by varying resistance
- G01D5/165—Mechanical means for transferring the output of a sensing member; Means for converting the output of a sensing member to another variable where the form or nature of the sensing member does not constrain the means for converting; Transducers not specially adapted for a specific variable using electric or magnetic means influencing the magnitude of a current or voltage by varying resistance by relative movement of a point of contact or actuation and a resistive track
Definitions
- the present invention relates to an inspection device for displacement sensor and an inspection method of the same.
- JP2008-114612A discloses an electric power steering device in which a steering torque given to a steering wheel is detected by a torque sensor.
- the torque sensor detects a torsion angle displacement of a torsion bar interposed between an input shaft and an output shaft by a potentiometer and detects the steering torque based on the detected value.
- the detected steering torque is used for a feedback control of a current supplied to an electric motor, which gives a steering assist power to a steering system.
- the potentiometer functions as a sensor for feedback.
- a voltage as an output value increases in proportion to an increase in torsion angle displacement as an input value. That is, the potentiometer has linearity output characteristics.
- the output characteristics of the potentiometer actually include a non-linearity error. Due to this non-linearity error, the potentiometer outputs a value shifted from an ideal approximate straight line as the output value.
- the non-linearity error possibly includes periodic variations
- a component in a specific period possibly causes a system oscillation
- An object of the present invention is to provide an inspection device for displacement sensor that can inspect a specific periodic variation included in output characteristics of a displacement sensor at a low cost and an inspection method thereof.
- an inspection device for a displacement sensor for inspecting a periodic variation included in an output characteristic of the displacement sensor includes a sequence data obtaining unit configured to obtain sequence data as an output value of the displacement sensor caused by input continuously changing in a constant temporal gradient to the displacement sensor; a difference calculation unit configured to obtain a difference between a value at a certain point in the sequence data and a value at a point advancing from the point by a predetermined evaluation pitch regarding each point in the sequence data to calculate difference sequence data ; a moving average calculation unit configured to obtain a moving average of a predetermined number of data centered at a certain point in the difference sequence data regarding each point in the difference sequence data to calculate post-averaged sequence data ; and a determining unit configured to determine that the displacement sensor is normal when an amplitude of an output value of the post-averaged sequence data is smaller than a determination threshold for amplitude.
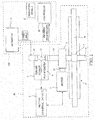
- FIG. 1 is a block diagram illustrating a state where an inspection device 100 for a potentiometer 1 according to the embodiment is coupled to an electric power steering device 20.
- the electric power steering device 20 includes a steering mechanism 2, a torque sensor 3, an electric motor 4, and a motor control device 5.
- the steering mechanism 2 is coupled to a steering wheel (not illustrated) to steer wheels (not illustrated).
- the torque sensor 3 detects an input torque.
- the electric motor 4 gives an assist torque to the steering mechanism 2.
- a detection signal by the torque sensor 3 is input to the motor control device 5.
- the motor control device 5 is configured to control an output from the electric motor 4.
- the steering mechanism 2 includes a steering shaft 6 coupled to the steering wheel, a pinion 7 formed on the steering shaft 6, and a rack 8 meshing with the pinion 7.
- a rotation of the steering shaft 6 rotates the pinion 7, and the rack 8, which meshes with the pinion 7, moves in an axial direction (a right-left direction of a vehicle). Then, the wheels are steered via a tie rod (not illustrated) coupled to the rack 8.
- the steering mechanism 2 further includes a worm wheel 9 coupled to the steering shaft 6 and a worm 10 meshing with the worm wheel 9.
- the worm 10 is coupled to an output shaft of the electric motor 4. Rotatably driving the worm 10 by the electric motor 4 rotatably drives the worm wheel 9. Thus, the assist torque is given to the steering shaft 6.
- the torque sensor 3 is interposed in the middle of the steering shaft 6 to detect the input torque given to the steering shaft 6 by a driver via the steering wheel.
- the steering shaft 6 is constituted of an input shaft 11 coupled to the steering wheel, a torsion bar 12 whose one end is coupled to the input shaft 11, and an output shaft 13 coupled to the other end of the torsion bar 12.
- the torque sensor 3 is constituted of the potentiometer 1 as a displacement sensor.
- the torque sensor 3 detects a torsion angle displacement of the torsion bar 12 caused by the steering torque given to the steering shaft 6 via the steering wheel.
- the potentiometer 1 outputs a voltage signal according to the torsion angle displacement of the torsion bar 12 to the motor control device 5.
- the motor control device 5 calculates the appropriate assist torque based on the voltage signal input from the torque sensor 3 and performs a feedback control on a current applied to the electric motor 4.
- the inspection device 100 for the potentiometer 1 includes an actuator 31 and a controller 32.
- the actuator 31 is configured to give the steering torque for inspection to the input shaft 11.
- the controller 32 is configured to receive the signal output from the potentiometer 1 and perform an arithmetic operation of the signal.
- the inspection device 100 for the potentiometer 1 is used to inspect the potentiometer 1 for normal operation before the electric power steering device 20 is produced and shipped at a plant.
- the controller 32 is coupled to the potentiometer 1 of the electric power steering device 20. Furthermore, the actuator 31 is coupled to the input shaft 11 so as to ensure giving the input torque.
- the actuator 31 gives the input torque to the input shaft 11 and the controller 32 performs the arithmetic operation.
- the actuator 31 provides a sweep input that continuously changes in a constant temporal gradient to the input shaft 11.
- FIG. 2 is a flowchart illustrating a processing content by the controller 32.
- Step S1 serving as a sequence data obtaining unit, the controller 32 obtains sequence data Vm (T) of an output value as a voltage value output according to the sweep input.
- a sampling frequency Fs (time/Nm) of the sweep input is set to a value sufficiently higher than a frequency used for normal determination by the potentiometer 1.
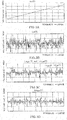
- FIG. 3A is a chart plotting the sequence data Vm (T) with the input torque (T) as the horizontal axis and the output voltage (V) as the vertical axis.
- the potentiometer 1 is a primary linear output sensor.
- the sequence data Vm (T) has linearity where the output voltage increases in proportion to the increase in input torque.
- the sequence data Vm (T) has the almost perfect linearity.
- a value of the output voltage at a certain input torque is actually output higher or lower than an ideal value.
- the chart in FIG. 3A includes a slight displacement of amplitude in a vertical direction (This is hereinafter referred to as a "non-linearity error").
- the non-linearity error alone leads to deterioration in accuracy of sensing of the output value at each point by the potentiometer 1. Furthermore, when the non-linearity error has periodicity, the following problem occurs. That is, the motor control device 5 performs the feedback control on the current applied to the electric motor 4 based on the voltage signal input from the torque sensor 3. Accordingly, the periodic variations of the voltage signal possibly cause a system oscillation in the feedback control system. Especially, to improve steering feeling or responsiveness during an assist control of a steering assist torque, in the case where a gain of the torque sensor 3 is increased to increase sensitivity of the feedback control system, the system oscillation possibly occurs.
- the inspection device 100 extracts a periodic variation component included in the sequence data Vm (T) and determines whether the non-linearity error is within an allowable range, thus a quality management of the potentiometer 1 is performed.
- Step S2 serving as a difference calculation unit, the controller 32 performs an evaluation for local linearity.
- the evaluation for local linearity is processing to extract an inclination of output at a certain output evaluation point with a point away by an evaluation pitch N LIN .
- Lm n Vm n + N LIN ⁇ Vm n
- a ramp component of the sequence data Vm (T) is superimposed as an offset, when the linearity evaluation sequence Lm (T) is calculated. Because of this, an average value of the sequence data obtained after the difference calculation is subtracted from each point of the data obtained after the difference calculation. Thus obtained values is set as the linearity evaluation sequence Lm (T).
- the evaluation pitch N LIN is a value smaller than the sampling frequency Fs and is, for example, set to 1/10 of the sampling frequency Fs.
- FIG. 3B is a chart plotting the linearity evaluation sequence Lm (T) with the input torque (T) as the horizontal axis and the output voltage (mV) as the vertical axis. If the sequence data Vm (T) is the ideal ramp property, the chart in FIG. 3B is drawn as the constant straight line. However, since the sequence data Vm (T) actually includes the non-linearity error, the sequence data Vm (T) draws the chart varying vertically as illustrated in FIG. 3B .
- FIG. 4A is a chart plotting the sequence data for linearity evaluation sequence Lm (T) with the frequency (time/Nm) as the horizontal axis and the amplitude (dB) as the vertical axis, and illustrates the frequency property of the chart in FIG. 3B .
- the sequence data for the linearity evaluation sequence Lm (T) is expressed as a property having amplification peaks at predetermined periods.
- a frequency region A illustrated in FIG. 4A is set to a frequency for an evaluation target of the potentiometer 1.
- the frequency region A to be the evaluation target needs to be set as necessary according to an oscillation phenomenon caused by a combination of the type of the potentiometer 1 and the type of the electric power steering device 20 to which the potentiometer 1 is mounted. Therefore, input-output characteristics of the potentiometer 1 are analyzed by another analysis device and the frequency region A to be the evaluation target by the inspection device 100 is set preliminary based on the result.
- the evaluation pitch N LIN is set such that a primary amplification peak frequency falls within the frequency region A in FIG. 4A .
- Lm LPF n Lm n ⁇ N LPF / 2 + ... + Lm n + ... + Lm n + N LPF / 2 ⁇ 1 / N LPF
- the predetermined number N LPF is set to a value to the extent that the high-frequency components of the linearity evaluation sequence Lm (T) can be efficiently attenuated.
- FIG. 3C is a chart plotting the low-frequency component extraction sequence Lm LPF (T) with the input torque (T) as the horizontal axis and the output voltage (mV) as the vertical axis.
- the low-frequency component extraction sequence Lm LPF (T) lowers the high-frequency components compared with the linearity evaluation sequence Lm (T), which is illustrated in FIG. 3B , by the LPF processing by the moving average.
- FIG. 4B is a chart plotting the sequence data for the low-frequency component extraction sequence Lm LPF (T) with the frequency (time/Nm) as the horizontal axis and the amplitude (dB) as the vertical axis.
- FIG. 4B illustrates the frequency property of the chart for the low-frequency component extraction sequence Lm LPF (T) in FIG. 3C .
- the low-frequency component extraction sequence Lm LPF (T) substantially lowers the high-frequency components compared with the linearity evaluation sequence Lm (T), which is illustrated in FIG. 4A .
- Lm VLPF n Lm LPF n ⁇ N VLPF / 2 + ... + Lm LPF n + ... + Lm LPF n + N VLPF / 2 ⁇ 1 / N VLPF
- the predetermined number N VLPF is a value larger than the predetermined number N LPF and set to a value to the extent that the high-frequency components of the low-frequency component extraction sequence Lm LPF (T) can be efficiently attenuated.
- the extremely low-frequency component sequence Lm VLPF (T) further lowers the high-frequency components compared with the low-frequency component extraction sequence Lm LPF (T).
- FIG. 4C is a chart illustrating a multiplication of the evaluation for local linearity processing illustrated in FIG. 4A and the LPF processing illustrated in FIG. 4B .
- the low-frequency components are superimposed at a comparatively larger amplitude compared with the frequency region A as the evaluation target. Since the low-frequency components become the noise in the local linearity inspection of the potentiometer 1, processing at Step S5, which will be described later, to remove the low-frequency components is performed.
- Step S5 serving as a moving average subtraction unit, the controller 32 performs pseudo-high-pass filter (HPF) processing by waveform calculation. Specifically, the controller 32 subtracts the extremely low-frequency component sequence Lm VLPF (T) from the low-frequency component extraction sequence Lm LPF (T) based on the following formula (4) to derive a target frequency extraction sequence Lm BPF (T).
- Lm BPF n Lm LPF n ⁇ Lm VLPF n
- FIG. 3D is a chart plotting the target frequency extraction sequence Lm BFF (T) with the input torque (T) as the horizontal axis and the output voltage (mV) as the vertical axis.
- FIG. 4D is a chart plotting the sequence data for the extremely low-frequency component sequence Lm VLPF (T) with the frequency (time/Nm) as the horizontal axis and the amplitude (dB) as the vertical axis.
- FIG. 4D illustrates the frequency property of the chart for the target frequency extraction sequence Lm BPF (T) in FIG. 3D .
- the target frequency extraction sequence Lm BPF (T) has the smaller amplitude on the low-frequency side with respect to the frequency region A by the pseudo-HPF processing compared with the frequency property of the extremely low-frequency component sequence Lm VLPF (T) illustrated in FIG. 4C .
- the processing at Steps S3 to S5 performs band pass filter processing on the linearity evaluation sequence Lm (T) to extract an inspection target waveform where the component other than the frequency region A as the inspection target is attenuated.
- Step S6 serving as a determining unit, the controller 32 performs the waveform evaluation. Specifically, in the chart for the target frequency extraction sequence Lm BPF (T), which is illustrated in FIG. 3D , the controller 32 calculates a peak-to-peak value, a difference between a maximum value and a minimum value of the amplitude. In the case where the peak-to-peak value is smaller than a predetermined threshold, the controller 32 determines that the operation of the potentiometer 1 is normal.
- the predetermined threshold is preset to a value to the extent that the system oscillation does not occur in the feedback control system.
- the controller 32 gives the sweep input to the input shaft 11 and performs the linearity evaluation of the sequence data for the output voltage obtained from the potentiometer 1. Then, the controller 32 performs the filtering processing of the low-frequency component and the high-frequency component to extract the frequency components in the frequency region A, the inspection target, among the non-linearity error. Furthermore, the controller 32 inspects whether the potentiometer 1 is normal based on the peak-to-peak value of the inspection target waveform remaining the last.
- a linearity evaluation is performed on the sequence data for output voltage of the potentiometer 1 by calculating, for every point, the difference between the data at the points separated by the predetermined evaluation pitch N LIN . Further, performing the moving average processing reduces the frequency components outside the frequency region A, the inspection target, among the non-linearity errors. This allows the extraction of the inspection target waveform in combination with the difference and the moving average. That is, this allows a detection of the specific periodic variation among the sequence data for output values from the displacement sensor in combination with the difference and the moving average, thereby ensuring determining abnormality of the displacement sensor by simple arithmetic operation. This eliminates the need for advanced device and software for analysis, ensuring the inspection of the potentiometer 1 at a low price.
- the moving average of the predetermined number N LPF points in the linearity evaluation sequence Lm (T) obtained after the difference calculation is operated to derive the low-frequency component extraction sequence Lm LPF (T). This ensures removing the high-frequency components from the frequency region A, the inspection target, with more certainty. This allows preventing an erroneous determination of the waveform evaluation due to the noise.
- the extremely low-frequency component sequence Lm VLPF (T) obtained after the second moving average processing at Step S4 is subtracted from the low-frequency component extraction sequence Lm LPF (T) obtained after the first moving average processing at Step S3 to derive the target frequency extraction sequence Lm BPF (T). This ensures removing the low-frequency components from the frequency region A, the inspection target, ensuring preventing the erroneous determination of the waveform evaluation due to the noise.
- the linearity evaluation sequence Lm (T) in addition to the calculation, for every point, the difference between the data at the points separated the predetermined evaluation pitch N LIN , the average value of the sequence data obtained after the difference calculation is subtracted from the data at each point.
- the value is set as the linearity evaluation sequence Lm (T). This ensures canceling the ramp component superimposed as the offset to the sequence data Vm (T). Accordingly, accuracy of the inspection target waveform extracted by the subsequent LPF processing and HPF processing can be improved. This allows the inspection accuracy of the potentiometer 1 to be improved.
- the operation of the potentiometer 1 is determined as normal. Accordingly, even if the potentiometer 1 has the non-linear property where the output voltage becomes locally prominent at a specific input torque, the non-linear property can be reflected to the waveform evaluation. This ensures improving the inspection accuracy of the potentiometer 1.
- the embodiment describes the potentiometer 1 as the example of the displacement sensor.
- the embodiment is applicable to another displacement sensor such as a linear encoder.
- the embodiment performs the HPF processing at Step S5.
- the HPF processing may be omitted.
- the embodiment performs the LPF processing by the moving average once from Steps S3 to S4 to remove the high frequencies.
- the LPF processing may be performed twice or more to remove the high-frequency components with more certainty.
- the embodiment determines whether the potentiometer 1 is normal based on the peak-to-peak value, which is the difference between the maximum value and the minimum value of the amplitude, in the chart for the target frequency extraction sequence Lm BPF (T) at Step S6.
- the embodiment may perform the determination based on a value other than the peak-to-peak value, for example, an average value of absolute values of the amplitude in the chart for the target frequency extraction sequence Lm BPF (T).
- the embodiment subtracts the average value of the sequence data obtained after the difference calculation from the data at each point and sets the average value as the linearity evaluation sequence Lm (T) to cancel the ramp component superimposed as the offset to the sequence data Vm (T).
- this subtraction processing may not be performed in the case where the ramp component needs not to be canceled.
- the embodiment determines whether the potentiometer 1 is normal with the potentiometer 1 mounted to the electric power steering device 20; however, the similar inspection may be performed on the potentiometer 1 alone.
Landscapes
- Physics & Mathematics (AREA)
- General Physics & Mathematics (AREA)
- Power Steering Mechanism (AREA)
- Measurement Of Length, Angles, Or The Like Using Electric Or Magnetic Means (AREA)
- Length Measuring Devices With Unspecified Measuring Means (AREA)
Abstract
Description
- The present invention relates to an inspection device for displacement sensor and an inspection method of the same.
-
JP2008-114612A - With the conventional technique, the potentiometer functions as a sensor for feedback. In the potentiometer, a voltage as an output value increases in proportion to an increase in torsion angle displacement as an input value. That is, the potentiometer has linearity output characteristics.
- However, due to an influence from, for example, a noise caused by a sliding resistance of the potentiometer, the output characteristics of the potentiometer actually include a non-linearity error. Due to this non-linearity error, the potentiometer outputs a value shifted from an ideal approximate straight line as the output value.
- Since the non-linearity error possibly includes periodic variations, when the potentiometer is used as the sensor for feedback, a component in a specific period possibly causes a system oscillation.
- In contrast to this, it is considered that, using a Fast Fourier Transform (FFT) or a similar transformation, an inspection device to analyze the specific periodic variations included in the output characteristics of the potentiometer inspects the potentiometer. However, since the device and the software for analysis are advanced, a cost for this inspection device is expensive and therefore is not easily performed.
- An object of the present invention is to provide an inspection device for displacement sensor that can inspect a specific periodic variation included in output characteristics of a displacement sensor at a low cost and an inspection method thereof.
- According to one aspect of the present invention, an inspection device for a displacement sensor for inspecting a periodic variation included in an output characteristic of the displacement sensor, the inspection device for the displacement sensor includes a sequence data obtaining unit configured to obtain sequence data as an output value of the displacement sensor caused by input continuously changing in a constant temporal gradient to the displacement sensor; a difference calculation unit configured to obtain a difference between a value at a certain point in the sequence data and a value at a point advancing from the point by a predetermined evaluation pitch regarding each point in the sequence data to calculate difference sequence data ; a moving average calculation unit configured to obtain a moving average of a predetermined number of data centered at a certain point in the difference sequence data regarding each point in the difference sequence data to calculate post-averaged sequence data ; and a determining unit configured to determine that the displacement sensor is normal when an amplitude of an output value of the post-averaged sequence data is smaller than a determination threshold for amplitude.
-
-
FIG. 1 is a block diagram illustrating a state where an inspection device for potentiometer according to an embodiment of the present invention is coupled to an electric power steering device. -
FIG. 2 is a flowchart illustrating a processing content of a controller. -
FIG. 3A is a chart plotting sequence data. -
FIG. 3B is a chart plotting a linearity evaluation sequence. -
FIG. 3C is a chart plotting a low-frequency component extraction sequence and an extremely low-frequency component sequence. -
FIG. 3D is a chart plotting a target frequency extraction sequence. -
FIG. 4A is a chart illustrating a frequency property of the sequence data. -
FIG. 4B is a chart illustrating a frequency property of the extremely low-frequency component sequence. -
FIG. 4C is a chart illustrating a multiplication of the charts inFIG. 4A and FIG. 4B . -
FIG. 4D is a chart illustrating the frequency property of the target frequency extraction sequence. - The following describes an embodiment of the present invention with reference to the accompanying drawings.
-
FIG. 1 is a block diagram illustrating a state where aninspection device 100 for apotentiometer 1 according to the embodiment is coupled to an electricpower steering device 20. - The electric
power steering device 20 includes asteering mechanism 2, atorque sensor 3, anelectric motor 4, and amotor control device 5. Thesteering mechanism 2 is coupled to a steering wheel (not illustrated) to steer wheels (not illustrated). Thetorque sensor 3 detects an input torque. Theelectric motor 4 gives an assist torque to thesteering mechanism 2. A detection signal by thetorque sensor 3 is input to themotor control device 5. Themotor control device 5 is configured to control an output from theelectric motor 4. - The
steering mechanism 2 includes asteering shaft 6 coupled to the steering wheel, apinion 7 formed on thesteering shaft 6, and arack 8 meshing with thepinion 7. A rotation of thesteering shaft 6 rotates thepinion 7, and therack 8, which meshes with thepinion 7, moves in an axial direction (a right-left direction of a vehicle). Then, the wheels are steered via a tie rod (not illustrated) coupled to therack 8. - The
steering mechanism 2 further includes aworm wheel 9 coupled to thesteering shaft 6 and aworm 10 meshing with theworm wheel 9. Theworm 10 is coupled to an output shaft of theelectric motor 4. Rotatably driving theworm 10 by theelectric motor 4 rotatably drives theworm wheel 9. Thus, the assist torque is given to thesteering shaft 6. - The
torque sensor 3 is interposed in the middle of thesteering shaft 6 to detect the input torque given to thesteering shaft 6 by a driver via the steering wheel. Thesteering shaft 6 is constituted of aninput shaft 11 coupled to the steering wheel, atorsion bar 12 whose one end is coupled to theinput shaft 11, and anoutput shaft 13 coupled to the other end of thetorsion bar 12. - The
torque sensor 3 is constituted of thepotentiometer 1 as a displacement sensor. Thetorque sensor 3 detects a torsion angle displacement of thetorsion bar 12 caused by the steering torque given to thesteering shaft 6 via the steering wheel. Thepotentiometer 1 outputs a voltage signal according to the torsion angle displacement of thetorsion bar 12 to themotor control device 5. - The
motor control device 5 calculates the appropriate assist torque based on the voltage signal input from thetorque sensor 3 and performs a feedback control on a current applied to theelectric motor 4. - The
inspection device 100 for thepotentiometer 1 includes anactuator 31 and acontroller 32. Theactuator 31 is configured to give the steering torque for inspection to theinput shaft 11. Thecontroller 32 is configured to receive the signal output from thepotentiometer 1 and perform an arithmetic operation of the signal. Theinspection device 100 for thepotentiometer 1 is used to inspect thepotentiometer 1 for normal operation before the electricpower steering device 20 is produced and shipped at a plant. - Next, the following describes an inspection procedure by the
inspection device 100 for thepotentiometer 1. - First, the
controller 32 is coupled to thepotentiometer 1 of the electricpower steering device 20. Furthermore, theactuator 31 is coupled to theinput shaft 11 so as to ensure giving the input torque. - Subsequently, the
actuator 31 gives the input torque to theinput shaft 11 and thecontroller 32 performs the arithmetic operation. Theactuator 31 provides a sweep input that continuously changes in a constant temporal gradient to theinput shaft 11. -
FIG. 2 is a flowchart illustrating a processing content by thecontroller 32. - At Step S1 serving as a sequence data obtaining unit, the
controller 32 obtains sequence data Vm (T) of an output value as a voltage value output according to the sweep input. A sampling frequency Fs (time/Nm) of the sweep input is set to a value sufficiently higher than a frequency used for normal determination by thepotentiometer 1. -
FIG. 3A is a chart plotting the sequence data Vm (T) with the input torque (T) as the horizontal axis and the output voltage (V) as the vertical axis. Thepotentiometer 1 is a primary linear output sensor. The sequence data Vm (T) has linearity where the output voltage increases in proportion to the increase in input torque. - With the scale in
FIG. 3A , it seems that the sequence data Vm (T) has the almost perfect linearity. However, due to an influence from, for example, a noise generated in a slider inside thepotentiometer 1, a value of the output voltage at a certain input torque is actually output higher or lower than an ideal value. In view of this, the chart inFIG. 3A includes a slight displacement of amplitude in a vertical direction (This is hereinafter referred to as a "non-linearity error"). - The non-linearity error alone leads to deterioration in accuracy of sensing of the output value at each point by the
potentiometer 1. Furthermore, when the non-linearity error has periodicity, the following problem occurs. That is, themotor control device 5 performs the feedback control on the current applied to theelectric motor 4 based on the voltage signal input from thetorque sensor 3. Accordingly, the periodic variations of the voltage signal possibly cause a system oscillation in the feedback control system. Especially, to improve steering feeling or responsiveness during an assist control of a steering assist torque, in the case where a gain of thetorque sensor 3 is increased to increase sensitivity of the feedback control system, the system oscillation possibly occurs. - Therefore, in this embodiment, the
inspection device 100 extracts a periodic variation component included in the sequence data Vm (T) and determines whether the non-linearity error is within an allowable range, thus a quality management of thepotentiometer 1 is performed. - Returning to
FIG. 2 , at Step S2 serving as a difference calculation unit, thecontroller 32 performs an evaluation for local linearity. The evaluation for local linearity is processing to extract an inclination of output at a certain output evaluation point with a point away by an evaluation pitch NLIN. Specifically, based on the following formula (1), thecontroller 32 calculates a difference between Vm (n), an n-th (n = 1, 2, 3, and so on) value of the sequence data Vm (T), and Vm (n+NLIN), a value at a point advancing from the n-th point by the predetermined evaluation pitch NLIN, to derive a linearity evaluation sequence Lm (T).
- A ramp component of the sequence data Vm (T) is superimposed as an offset, when the linearity evaluation sequence Lm (T) is calculated. Because of this, an average value of the sequence data obtained after the difference calculation is subtracted from each point of the data obtained after the difference calculation. Thus obtained values is set as the linearity evaluation sequence Lm (T). It should be noted that, the evaluation pitch NLIN is a value smaller than the sampling frequency Fs and is, for example, set to 1/10 of the sampling frequency Fs.
-
FIG. 3B is a chart plotting the linearity evaluation sequence Lm (T) with the input torque (T) as the horizontal axis and the output voltage (mV) as the vertical axis. If the sequence data Vm (T) is the ideal ramp property, the chart inFIG. 3B is drawn as the constant straight line. However, since the sequence data Vm (T) actually includes the non-linearity error, the sequence data Vm (T) draws the chart varying vertically as illustrated inFIG. 3B . -
FIG. 4A is a chart plotting the sequence data for linearity evaluation sequence Lm (T) with the frequency (time/Nm) as the horizontal axis and the amplitude (dB) as the vertical axis, and illustrates the frequency property of the chart inFIG. 3B . As illustrated inFIG. 4A , the sequence data for the linearity evaluation sequence Lm (T) is expressed as a property having amplification peaks at predetermined periods. - Here, a frequency region A illustrated in
FIG. 4A is set to a frequency for an evaluation target of thepotentiometer 1. The frequency region A to be the evaluation target needs to be set as necessary according to an oscillation phenomenon caused by a combination of the type of thepotentiometer 1 and the type of the electricpower steering device 20 to which thepotentiometer 1 is mounted. Therefore, input-output characteristics of thepotentiometer 1 are analyzed by another analysis device and the frequency region A to be the evaluation target by theinspection device 100 is set preliminary based on the result. Furthermore, the evaluation pitch NLIN is set such that a primary amplification peak frequency falls within the frequency region A inFIG. 4A . - Returning to
FIG. 2 , at Step S3 serving as a first moving average calculation unit, thecontroller 32 performs low-pass filter (LPF) processing by moving average. Specifically, thecontroller 32 calculates the moving average of predetermined number NLPF points about the n-th (n = 1, 2, 3, and so on) data Lm (n) based on the following formula (2) to derive a low-frequency component extraction sequence LmLPF (T).
- It should be noted that, the predetermined number NLPF is set to a value to the extent that the high-frequency components of the linearity evaluation sequence Lm (T) can be efficiently attenuated.
-
FIG. 3C is a chart plotting the low-frequency component extraction sequence LmLPF (T) with the input torque (T) as the horizontal axis and the output voltage (mV) as the vertical axis. As illustrated inFIG. 3C , the low-frequency component extraction sequence LmLPF (T) lowers the high-frequency components compared with the linearity evaluation sequence Lm (T), which is illustrated inFIG. 3B , by the LPF processing by the moving average. -
FIG. 4B is a chart plotting the sequence data for the low-frequency component extraction sequence LmLPF (T) with the frequency (time/Nm) as the horizontal axis and the amplitude (dB) as the vertical axis.FIG. 4B illustrates the frequency property of the chart for the low-frequency component extraction sequence LmLPF (T) inFIG. 3C . As illustrated inFIG. 4B , the low-frequency component extraction sequence LmLPF (T) substantially lowers the high-frequency components compared with the linearity evaluation sequence Lm (T), which is illustrated inFIG. 4A . - Returning to
FIG. 2 , at Step S4 serving as a second moving average calculation unit, thecontroller 32 performs extraction processing of an extremely low-frequency component by the moving average. Specifically, thecontroller 32 calculates the moving average of predetermined number NVLPF points about the n-th (n = 1, 2, 3, and so on) data LmLPF (n) based on the following formula (3) to derive an extremely low-frequency component sequence LmVLPF (T).
- It should be noted that, the predetermined number NVLPF is a value larger than the predetermined number NLPF and set to a value to the extent that the high-frequency components of the low-frequency component extraction sequence LmLPF (T) can be efficiently attenuated.
- As illustrated in
FIG. 3C , the extremely low-frequency component sequence LmVLPF (T) further lowers the high-frequency components compared with the low-frequency component extraction sequence LmLPF (T). -
FIG. 4C is a chart illustrating a multiplication of the evaluation for local linearity processing illustrated inFIG. 4A and the LPF processing illustrated inFIG. 4B . In the chart illustrated inFIG. 4C , the low-frequency components are superimposed at a comparatively larger amplitude compared with the frequency region A as the evaluation target. Since the low-frequency components become the noise in the local linearity inspection of thepotentiometer 1, processing at Step S5, which will be described later, to remove the low-frequency components is performed. - Returning to
FIG. 2 , at Step S5 serving as a moving average subtraction unit, thecontroller 32 performs pseudo-high-pass filter (HPF) processing by waveform calculation. Specifically, thecontroller 32 subtracts the extremely low-frequency component sequence LmVLPF (T) from the low-frequency component extraction sequence LmLPF (T) based on the following formula (4) to derive a target frequency extraction sequence LmBPF (T).
-
FIG. 3D is a chart plotting the target frequency extraction sequence LmBFF (T) with the input torque (T) as the horizontal axis and the output voltage (mV) as the vertical axis.FIG. 4D is a chart plotting the sequence data for the extremely low-frequency component sequence LmVLPF (T) with the frequency (time/Nm) as the horizontal axis and the amplitude (dB) as the vertical axis.FIG. 4D illustrates the frequency property of the chart for the target frequency extraction sequence LmBPF (T) inFIG. 3D . - As illustrated in
FIG. 4D , the target frequency extraction sequence LmBPF (T) has the smaller amplitude on the low-frequency side with respect to the frequency region A by the pseudo-HPF processing compared with the frequency property of the extremely low-frequency component sequence LmVLPF (T) illustrated inFIG. 4C . - That is, the processing at Steps S3 to S5 performs band pass filter processing on the linearity evaluation sequence Lm (T) to extract an inspection target waveform where the component other than the frequency region A as the inspection target is attenuated.
- Returning to
FIG. 2 , at Step S6 serving as a determining unit, thecontroller 32 performs the waveform evaluation. Specifically, in the chart for the target frequency extraction sequence LmBPF (T), which is illustrated inFIG. 3D , thecontroller 32 calculates a peak-to-peak value, a difference between a maximum value and a minimum value of the amplitude. In the case where the peak-to-peak value is smaller than a predetermined threshold, thecontroller 32 determines that the operation of thepotentiometer 1 is normal. The predetermined threshold is preset to a value to the extent that the system oscillation does not occur in the feedback control system. - Summarizing the above-described controls, the
controller 32 gives the sweep input to theinput shaft 11 and performs the linearity evaluation of the sequence data for the output voltage obtained from thepotentiometer 1. Then, thecontroller 32 performs the filtering processing of the low-frequency component and the high-frequency component to extract the frequency components in the frequency region A, the inspection target, among the non-linearity error. Furthermore, thecontroller 32 inspects whether thepotentiometer 1 is normal based on the peak-to-peak value of the inspection target waveform remaining the last. - The above-described embodiment provides the following effects.
- A linearity evaluation is performed on the sequence data for output voltage of the
potentiometer 1 by calculating, for every point, the difference between the data at the points separated by the predetermined evaluation pitch NLIN. Further, performing the moving average processing reduces the frequency components outside the frequency region A, the inspection target, among the non-linearity errors. This allows the extraction of the inspection target waveform in combination with the difference and the moving average. That is, this allows a detection of the specific periodic variation among the sequence data for output values from the displacement sensor in combination with the difference and the moving average, thereby ensuring determining abnormality of the displacement sensor by simple arithmetic operation. This eliminates the need for advanced device and software for analysis, ensuring the inspection of thepotentiometer 1 at a low price. - Furthermore, the moving average of the predetermined number NLPF points in the linearity evaluation sequence Lm (T) obtained after the difference calculation is operated to derive the low-frequency component extraction sequence LmLPF (T). This ensures removing the high-frequency components from the frequency region A, the inspection target, with more certainty. This allows preventing an erroneous determination of the waveform evaluation due to the noise.
- Furthermore, the extremely low-frequency component sequence LmVLPF (T) obtained after the second moving average processing at Step S4 is subtracted from the low-frequency component extraction sequence LmLPF (T) obtained after the first moving average processing at Step S3 to derive the target frequency extraction sequence LmBPF (T). This ensures removing the low-frequency components from the frequency region A, the inspection target, ensuring preventing the erroneous determination of the waveform evaluation due to the noise.
- Furthermore, regarding the linearity evaluation sequence Lm (T), in addition to the calculation, for every point, the difference between the data at the points separated the predetermined evaluation pitch NLIN, the average value of the sequence data obtained after the difference calculation is subtracted from the data at each point. Thus, the value is set as the linearity evaluation sequence Lm (T). This ensures canceling the ramp component superimposed as the offset to the sequence data Vm (T). Accordingly, accuracy of the inspection target waveform extracted by the subsequent LPF processing and HPF processing can be improved. This allows the inspection accuracy of the
potentiometer 1 to be improved. - Furthermore, in the chart for the target frequency extraction sequence LmBPF (T), in the case where the peak-to-peak value, the difference between the maximum value and the minimum value of the amplitude, is smaller than the predetermined threshold, the operation of the
potentiometer 1 is determined as normal. Accordingly, even if thepotentiometer 1 has the non-linear property where the output voltage becomes locally prominent at a specific input torque, the non-linear property can be reflected to the waveform evaluation. This ensures improving the inspection accuracy of thepotentiometer 1. - Embodiments of this invention were described above, but the above embodiments are merely examples of applications of this invention, and the technical scope of this invention is not limited to the specific constitutions of the above embodiments.
- For example, the embodiment describes the
potentiometer 1 as the example of the displacement sensor. However, the embodiment is applicable to another displacement sensor such as a linear encoder. - Furthermore, the embodiment performs the HPF processing at Step S5. However, when the low-frequency components need not to be eliminated from the frequency region A, the inspection target, the HPF processing may be omitted.
- Furthermore, the embodiment performs the LPF processing by the moving average once from Steps S3 to S4 to remove the high frequencies. However, the LPF processing may be performed twice or more to remove the high-frequency components with more certainty.
- Furthermore, the embodiment determines whether the
potentiometer 1 is normal based on the peak-to-peak value, which is the difference between the maximum value and the minimum value of the amplitude, in the chart for the target frequency extraction sequence LmBPF (T) at Step S6. However, for example, the embodiment may perform the determination based on a value other than the peak-to-peak value, for example, an average value of absolute values of the amplitude in the chart for the target frequency extraction sequence LmBPF (T). - Furthermore, the embodiment subtracts the average value of the sequence data obtained after the difference calculation from the data at each point and sets the average value as the linearity evaluation sequence Lm (T) to cancel the ramp component superimposed as the offset to the sequence data Vm (T). However, this subtraction processing may not be performed in the case where the ramp component needs not to be canceled.
- Furthermore, the embodiment determines whether the
potentiometer 1 is normal with thepotentiometer 1 mounted to the electricpower steering device 20; however, the similar inspection may be performed on thepotentiometer 1 alone. - This application claims priority based on Japanese Patent Application No.
2014-189111
Claims (6)
- An inspection device for a displacement sensor for inspecting a periodic variation included in an output characteristic of the displacement sensor, the inspection device for the displacement sensor comprising:a sequence data obtaining unit configured to obtain sequence data as an output value of the displacement sensor according to input continuously changing in a constant temporal gradient;a difference calculation unit configured to obtain a difference between a value at a certain point in the sequence data and a value at a point advancing from the point by a predetermined evaluation pitch regarding each point in the sequence data to calculate difference sequence data;a moving average calculation unit configured to obtain a moving average of a predetermined number of data centered at a certain point in the difference sequence data regarding each point in the difference sequence data to calculate post-averaged sequence data ; anda determining unit configured to determine that the displacement sensor is normal when an amplitude of an output value of the post-averaged sequence data is smaller than a determination threshold for amplitude.
- The inspection device for displacement sensor according to claim 1, wherein:the moving average calculation unit includes:a first moving average calculation unit configured to obtain a moving average of a first number of data about a certain point in the difference sequence data at each point in the difference sequence data to calculate first post-averaged sequence data; anda second moving average calculation unit configured to obtain a moving average of a second number of data about a certain point in the first post-averaged sequence data at each point in the first post-averaged sequence data to calculate second post-averaged sequence data, the second number of data being larger than the first number of data,a moving average subtraction unit is further provided, the moving average subtraction unit being configured to subtract each point in the second post-averaged sequence data from each point in the first post-averaged sequence data to calculate post-subtraction sequence data, andthe post-subtraction sequence data is set as the post-averaged sequence data.
- The inspection device for displacement sensor according to claim 1, wherein
the difference calculation unit is configured to newly set sequence data obtained by a subtracting an average value of the difference sequence data from each point in the difference sequence data as the difference sequence data. - The inspection device for displacement sensor according to claim 1, wherein
when a difference between a maximum value and a minimum value of the amplitude of the output value in the post-averaged sequence data is smaller than a determination threshold for peak, the determining unit is configured to determine that the displacement sensor is normal. - The inspection device for displacement sensor according to claim 1, wherein
the displacement sensor is a potentiometer configured to output a voltage in response to a torque input. - An inspection method for displacement sensor for inspecting a periodic variation included in an output characteristic of a displacement sensor, the inspection method for displacement sensor comprising:obtaining sequence data as an output value of the displacement sensor according to input continuously changing in a constant temporal gradient;obtaining a difference between a value at a certain point in the sequence data and a value at a point advancing from the point by a predetermined evaluation pitch regarding each point in the sequence data to calculate difference sequence data;obtaining a moving average of a predetermined number of data centered at a certain point in the difference sequence data regarding each point in the difference sequence data to calculate post-averaged sequence data; anddetermining that the displacement sensor is normal when a peak-to-peak value of an output value of the post-averaged sequence data is smaller than a normal determination threshold.
Applications Claiming Priority (2)
| Application Number | Priority Date | Filing Date | Title |
|---|---|---|---|
| JP2014189111A JP5906295B1 (en) | 2014-09-17 | 2014-09-17 | Displacement sensor inspection apparatus and inspection method thereof |
| PCT/JP2015/075353 WO2016043085A1 (en) | 2014-09-17 | 2015-09-07 | Displacement sensor inspection device and inspection method for same |
Publications (2)
| Publication Number | Publication Date |
|---|---|
| EP3196621A1 true EP3196621A1 (en) | 2017-07-26 |
| EP3196621A4 EP3196621A4 (en) | 2018-05-30 |
Family
ID=55533124
Family Applications (1)
| Application Number | Title | Priority Date | Filing Date |
|---|---|---|---|
| EP15841874.9A Withdrawn EP3196621A4 (en) | 2014-09-17 | 2015-09-07 | Displacement sensor inspection device and inspection method for same |
Country Status (6)
| Country | Link |
|---|---|
| US (1) | US20170261389A1 (en) |
| EP (1) | EP3196621A4 (en) |
| JP (1) | JP5906295B1 (en) |
| CN (1) | CN106716096A (en) |
| CA (1) | CA2961534A1 (en) |
| WO (1) | WO2016043085A1 (en) |
Families Citing this family (8)
| Publication number | Priority date | Publication date | Assignee | Title |
|---|---|---|---|---|
| CN106154966A (en) * | 2016-08-24 | 2016-11-23 | 四川科泰智能电子有限公司 | A kind of vehicle-mounted Internet of things system |
| CN110553770B (en) * | 2019-07-17 | 2021-03-26 | 哈尔滨工程大学 | Fault diagnosis method for large drift abnormal value of sensor of ship structure stress monitoring system |
| CN110505596B (en) * | 2019-07-22 | 2022-03-29 | 金陵科技学院 | Sensor data self-adaptive acquisition real-time reporting method |
| JP7683239B2 (en) * | 2021-02-26 | 2025-05-27 | セイコーエプソン株式会社 | MEASUREMENT METHOD, MEASUREMENT DEVICE, MEASUREMENT SYSTEM, AND MEASUREMENT PROGRAM |
| JP7643083B2 (en) * | 2021-02-26 | 2025-03-11 | セイコーエプソン株式会社 | MEASUREMENT METHOD, MEASUREMENT DEVICE, MEASUREMENT SYSTEM, AND MEASUREMENT PROGRAM |
| JP7643082B2 (en) * | 2021-02-26 | 2025-03-11 | セイコーエプソン株式会社 | MEASUREMENT METHOD, MEASUREMENT DEVICE, MEASUREMENT SYSTEM, AND MEASUREMENT PROGRAM |
| JP7683240B2 (en) * | 2021-02-26 | 2025-05-27 | セイコーエプソン株式会社 | MEASUREMENT METHOD, MEASUREMENT DEVICE, MEASUREMENT SYSTEM, AND MEASUREMENT PROGRAM |
| TWI882368B (en) * | 2023-06-27 | 2025-05-01 | 盟立自動化股份有限公司 | Diagnosis method and diagnosis system for position transducer |
Family Cites Families (13)
| Publication number | Priority date | Publication date | Assignee | Title |
|---|---|---|---|---|
| DE19955475A1 (en) * | 1999-11-18 | 2001-06-07 | Bayerische Motoren Werke Ag | Device to measure torque; has element with known torsional elasticity connected between at least two rotation angle sensors and calculates digital difference signal from analogue sensor signals |
| JP2002079952A (en) * | 2000-06-20 | 2002-03-19 | Koyo Seiko Co Ltd | Electric power steering device |
| JP2002236062A (en) * | 2000-12-06 | 2002-08-23 | Koyo Seiko Co Ltd | Torque detection method, torque detector and steering device |
| US7159440B2 (en) * | 2003-06-26 | 2007-01-09 | The Boeing Company | Tool evaluation calibrator and method |
| JP2005324622A (en) * | 2004-05-13 | 2005-11-24 | Nsk Ltd | Power steering control device, method, and program |
| GB2440753A (en) * | 2006-08-04 | 2008-02-13 | Univ Sussex | Force sensor and programmable spring emulator |
| US8026808B2 (en) * | 2007-07-03 | 2011-09-27 | 3M Innovative Properties Company | Display of information related to data collected via wireless network sensors |
| US20090009339A1 (en) * | 2007-07-03 | 2009-01-08 | 3M Innovative Properties Company | Apparatus and method for locally processing data on wireless network sensors |
| US8098485B2 (en) * | 2007-07-03 | 2012-01-17 | 3M Innovative Properties Company | Wireless network sensors for detecting events occurring proximate the sensors |
| US8013731B2 (en) * | 2007-07-03 | 2011-09-06 | 3M Innovative Properties Company | Apparatus and method for processing data collected via wireless network sensors |
| US20130191681A1 (en) * | 2010-10-11 | 2013-07-25 | General Electric Company | Systems, methods, and apparatus for signal processing-based fault detection, isolation and remediation |
| JP5883706B2 (en) * | 2012-03-30 | 2016-03-15 | 株式会社ショーワ | Relative angle detection device and electric power steering device |
| JP5911455B2 (en) * | 2013-06-11 | 2016-04-27 | エスペック株式会社 | ENVIRONMENTAL TEST DEVICE AND METHOD FOR CONTROLLING ENVIRONMENTAL TEST DEVICE |
-
2014
- 2014-09-17 JP JP2014189111A patent/JP5906295B1/en active Active
-
2015
- 2015-09-07 EP EP15841874.9A patent/EP3196621A4/en not_active Withdrawn
- 2015-09-07 CA CA2961534A patent/CA2961534A1/en not_active Abandoned
- 2015-09-07 US US15/511,725 patent/US20170261389A1/en not_active Abandoned
- 2015-09-07 CN CN201580050436.4A patent/CN106716096A/en active Pending
- 2015-09-07 WO PCT/JP2015/075353 patent/WO2016043085A1/en not_active Ceased
Also Published As
| Publication number | Publication date |
|---|---|
| CN106716096A (en) | 2017-05-24 |
| JP5906295B1 (en) | 2016-04-20 |
| WO2016043085A1 (en) | 2016-03-24 |
| CA2961534A1 (en) | 2016-03-24 |
| EP3196621A4 (en) | 2018-05-30 |
| US20170261389A1 (en) | 2017-09-14 |
| JP2016061643A (en) | 2016-04-25 |
Similar Documents
| Publication | Publication Date | Title |
|---|---|---|
| US20170261389A1 (en) | Inspection device for displacement sensor and inspection method of the same | |
| KR101528670B1 (en) | Steering control apparatus and method | |
| DE102017126074B4 (en) | System and method for evaluating a steering wheel torque sensor | |
| US11009372B2 (en) | Steering angle sensor with functional security | |
| JP6615173B2 (en) | A method to calculate the force acting on the tie rod in the power steering mechanism in real time | |
| US20070107978A1 (en) | Control unit for electric power steering apparatus | |
| EP2976249B1 (en) | Motor vehicle, system and method for determining a steering angle of a steering column of a vehicle | |
| JP5425027B2 (en) | Random noise signal detection and filtering method | |
| WO2015018713A1 (en) | Position sensor device to determine a position of a moving device | |
| KR102794029B1 (en) | How to cancel your vehicle's autonomous driving mode | |
| CN109664936B (en) | Driver warning in electric power steering | |
| JP7124449B2 (en) | Hands-on-off detection device, electric power steering device, external torque estimation method, and hands-on-off detection device control program | |
| US20200249206A1 (en) | Inspection device and inspection learning model generation device | |
| US11186310B2 (en) | Frequency tracking based friction detection using accelerometer | |
| US20170015349A1 (en) | Filtering method for the detection of the transitions of a power steering signal | |
| US9296416B2 (en) | Method for operating a steering apparatus of a motor vehicle comprising an electromechanical steering-assistance device | |
| US20140244113A1 (en) | Velocity signal filter with reduced lag | |
| EP2455273A2 (en) | Harmonic pinion torque correction | |
| US12497102B2 (en) | Method for processing a measurement signal | |
| CN115219249A (en) | Vehicle steering system aging detection method and device and vehicle | |
| US10173718B2 (en) | Motor position filter for estimation of velocity using moving linear regression | |
| KR20100091770A (en) | Method and apparatus for controlling motor | |
| EP2489574B1 (en) | Electric power steering simulated travel stops | |
| DE102014200426B4 (en) | Method for robust detection of high-frequency signal interference | |
| WO2020110354A1 (en) | Material testing machine and method of controlling material testing machine |
Legal Events
| Date | Code | Title | Description |
|---|---|---|---|
| PUAI | Public reference made under article 153(3) epc to a published international application that has entered the european phase |
Free format text: ORIGINAL CODE: 0009012 |
|
| 17P | Request for examination filed |
Effective date: 20170407 |
|
| AK | Designated contracting states |
Kind code of ref document: A1 Designated state(s): AL AT BE BG CH CY CZ DE DK EE ES FI FR GB GR HR HU IE IS IT LI LT LU LV MC MK MT NL NO PL PT RO RS SE SI SK SM TR |
|
| AX | Request for extension of the european patent |
Extension state: BA ME |
|
| DAV | Request for validation of the european patent (deleted) | ||
| DAX | Request for extension of the european patent (deleted) | ||
| A4 | Supplementary search report drawn up and despatched |
Effective date: 20180502 |
|
| RIC1 | Information provided on ipc code assigned before grant |
Ipc: G01L 3/10 20060101ALI20180424BHEP Ipc: G01L 25/00 20060101AFI20180424BHEP |
|
| STAA | Information on the status of an ep patent application or granted ep patent |
Free format text: STATUS: THE APPLICATION HAS BEEN WITHDRAWN |
|
| 18W | Application withdrawn |
Effective date: 20181217 |