EP3188038A1 - Evaluation of a training set - Google Patents
Evaluation of a training set Download PDFInfo
- Publication number
- EP3188038A1 EP3188038A1 EP15307193.1A EP15307193A EP3188038A1 EP 3188038 A1 EP3188038 A1 EP 3188038A1 EP 15307193 A EP15307193 A EP 15307193A EP 3188038 A1 EP3188038 A1 EP 3188038A1
- Authority
- EP
- European Patent Office
- Prior art keywords
- observations
- computer
- query
- observation
- implemented method
- Prior art date
- Legal status (The legal status is an assumption and is not a legal conclusion. Google has not performed a legal analysis and makes no representation as to the accuracy of the status listed.)
- Granted
Links
Images

Classifications
-
- G—PHYSICS
- G06—COMPUTING OR CALCULATING; COUNTING
- G06N—COMPUTING ARRANGEMENTS BASED ON SPECIFIC COMPUTATIONAL MODELS
- G06N20/00—Machine learning
-
- G—PHYSICS
- G06—COMPUTING OR CALCULATING; COUNTING
- G06F—ELECTRIC DIGITAL DATA PROCESSING
- G06F18/00—Pattern recognition
- G06F18/20—Analysing
- G06F18/21—Design or setup of recognition systems or techniques; Extraction of features in feature space; Blind source separation
- G06F18/217—Validation; Performance evaluation; Active pattern learning techniques
- G06F18/2193—Validation; Performance evaluation; Active pattern learning techniques based on specific statistical tests
-
- G—PHYSICS
- G06—COMPUTING OR CALCULATING; COUNTING
- G06F—ELECTRIC DIGITAL DATA PROCESSING
- G06F16/00—Information retrieval; Database structures therefor; File system structures therefor
- G06F16/20—Information retrieval; Database structures therefor; File system structures therefor of structured data, e.g. relational data
- G06F16/24—Querying
- G06F16/245—Query processing
- G06F16/2455—Query execution
- G06F16/24564—Applying rules; Deductive queries
-
- G—PHYSICS
- G06—COMPUTING OR CALCULATING; COUNTING
- G06F—ELECTRIC DIGITAL DATA PROCESSING
- G06F16/00—Information retrieval; Database structures therefor; File system structures therefor
- G06F16/20—Information retrieval; Database structures therefor; File system structures therefor of structured data, e.g. relational data
- G06F16/24—Querying
- G06F16/245—Query processing
- G06F16/2455—Query execution
-
- G—PHYSICS
- G06—COMPUTING OR CALCULATING; COUNTING
- G06F—ELECTRIC DIGITAL DATA PROCESSING
- G06F16/00—Information retrieval; Database structures therefor; File system structures therefor
- G06F16/30—Information retrieval; Database structures therefor; File system structures therefor of unstructured textual data
- G06F16/35—Clustering; Classification
-
- G—PHYSICS
- G06—COMPUTING OR CALCULATING; COUNTING
- G06F—ELECTRIC DIGITAL DATA PROCESSING
- G06F18/00—Pattern recognition
- G06F18/20—Analysing
- G06F18/21—Design or setup of recognition systems or techniques; Extraction of features in feature space; Blind source separation
- G06F18/214—Generating training patterns; Bootstrap methods, e.g. bagging or boosting
Definitions
- the invention relates to the field of computer programs and systems, and more specifically to a method, system and program for assessing a potential divergence of an outcome predicted by a machine learning system.
- prediction error may occur because the trained model is inappropriate, the choice of input variables is ineffective, or the choice of training samples is not representative of the new data.
- the choice of models is limited (e.g. to the models known to perform well for the problem at hand) and the choice of input variables is limited (e.g. to the variables that can be collected).
- a problem that occurs for analysts is therefore how to assess the risk of error due to the choice of training samples or the availability of the set of observations for which the target value is known (this set is also referred to as tagged data), for a given model and a given set of input variables.
- a first method is called delta and Gamma test.
- the gamma test presented in Stefánsson, Adoalbjörn, N. Kon ⁇ ar, and Antonia J. Jones. "A note on the gamma test.”
- Neural Computing & Applications 5.3 (1997): 131-133 estimates the error of a smooth model based solely of the training samples.
- a smooth model is a model (such as a neural network) whose output is a smooth function of the input.
- a smooth function is a function with bounded partial first and second order derivatives. Intuitively this means that the curve of the function across any direction is smooth and does not make angles.
- the delta test does not require a smooth model but a continuous model.
- a continuous model is a model whose output is a continuous function of the input.
- a continuous function is a function whose value on a series S of points tends to its value on a point P if S converges to P.
- the Delta test is anterior to the Gamma test. It makes a weaker assumption on the model, but requires a greater data set density to estimate the error of the model with similar quality.
- the Delta and Gamma test estimates an error between the actual target value of the observations and the target values that can be generated by a smooth function.
- the output is not a smooth function of the input in every model. It is the case for some types of artificial neural networks but not for ensemble methods based on decision trees or stubs, which are currently chosen as highest performing approaches to many machine learning problems.
- the tagged data is split in K sets of approximatively the same size (it is approximate because the size of the tagged data set may be different from a multiple of K).
- test data set is made with samples not previously used in the test set (in previous runs), and the training data at each run is the remainder of the tagged data set.
- Performance of the model is measured for each run. The final performance measure is typically the average of all runs.
- a third method is a particular case of cross validation where the error rate is plotted for different sizes of the training set. More specifically this third method consists in plotting two error rate curves. One corresponds to the errors of the model on observations from the training set, and the other corresponds to the errors of the model on observations of the test set.
- the error rate on observations of the training set should decrease continuously with regards to the training set size, while the error rate on observations of the test set should decrease at least for lower training set sizes. There can be a point after which it starts to increase. This inflection point is the optimal size of the training set, before which underfitting occurs, and after which overfitting occurs. If this point does not exist, there is no overfitting, and the optimal training set is the largest.
- cross validation only allows to assess the risk of errors on observations similar to the ones of the test set, that is, similar to observations found in the available tagged data.
- the problem of comparing error rates on the training set and the test set while varying the size of the training set is precisely that we only vary the size of the training set, not the choice of the observations in the training set.
- the Delta and Gamma tests do not require to split the available tagged data into a training set and a test set. But they still suppose that the available tagged data is representative of all possible input data (including future input data).
- the lack of risk assessment with these methods is an issue because phenomena typically evolve with time. So the distribution of the training data becomes obsolete at some point. For instance, the prediction of when to make a pit stop in a car race typically relies on input data that describe the circuit and car behavior. For example, with climate change, extreme temperatures may occur for the first time on Formula One circuits. Extreme temperatures may affect tyre adherence, as well as engine and brake pads behaviors. However, the consequence of extreme temperatures might not be learnt by the model. Such situations might not have been captured in the available tagged data, especially if these temperatures were never before seen the current circuit. A machine learning model used to help determine the optimal moment to do a pit stop could lead to inappropriate recommendations in situations very different from the usual. Inappropriate operations made on a Formula One car in a pit stop, or inappropriate timing, can not only decrease the performance of the team, but also lead to dangerous situations.
- the method comprises:
- the method may comprise one or more of the following:
- a system comprising a processor coupled to a memory, the memory having recorded thereon the computer program.
- the method comprises training a model on a first set of observations, each observation being associated with a target value.
- the method further comprises randomly generating a second set of observations.
- the trained model is then applied to the second set of observation.
- a target value is obtained and associated with each observation of the second set.
- the method comprises indexing the first sets of observations and the second sets of observations and their associated target values into an index.
- a first query is received; the first query allows a selection of a subset of the first and second sets of observations.
- a second query is generated from the first one and comprises the first query and an additional constraint that is to return only observation(s) of the first set.
- a third query is also generated from the first one and comprises the first query and an additional constraint that is to return only observation(s) of the second set.
- the index is queried using the second and third queries.
- a response to the second and third queries is returned.
- Such a method improves the assessment of a potential divergence of an outcome predicted by a machine learning system.
- assessing the risks associated to the available tagged data consists in comparing the available tagged data with future data. Since future data is not available, the invention solves this problem by comparing available tagged data with theoretically possible data. At least future data is theoretically possible, so the worst-case scenario for future data is included in theoretically possible data.
- the risk can be related to (a) the accuracy of the model: if the model is wrong then some incorrect decisions could be taken based on output from the model. However, there is no way to predict the accuracy of the model at a given observation (in the set of possible or future observations) if there is no tagged data corresponding to similar observations.
- the invention solves this problem by providing a rough estimate of the model accuracy at all possible observations.
- the estimate is the density of available tagged observations around that point. Basically, the denser the training data around a point, the better trained the model will be, and the better it will perform around that point.
- providing this rough estimate consists in providing a response to a query on synthetic data (which allows to represent any possible observation) and a response to a query on available tagged data (which allows to represent the density of tagged data around that point).
- the risk can be related to the value returned by the model: if one decides to act based on outputs from the model, then the output of the model determines the decisions that will be taken. There is a risk associated to these decisions, so there is a risk associated to the output of the model.
- a decision can be a force applied to a mechanical part as part of an adjustment made during a pit stop in a car race, and the risk is for the mechanical part to break during the remaining laps of the car race.
- the invention reveals the value of the model at theoretically possible points not covered by tagged data because according to the invention the model is run even on synthetic samples, and the output of the model is indexed along with the corresponding inputs.
- the invention solves this by means of queries.
- the user specifies their query in terms of specifications on one or several variables that describe the data. For instance, if prior to the race the team realizes that temperatures on the circuit are anticipated to reach extreme values during the race, they can question the accuracy of the model for the race by issuing a query specifying the expected temperatures. Furthermore, if during the race a new situation unfolds such as unanticipated shower rains, the team can also issue a query specifying a number of values that describe the current situation, including the occurrence of shower rains, in order to understand what credit to give to the recommendations provided by use of the machine learning model and given the data that was used to train it. That query is then used to generate two queries, one on the available tagged data and one on the synthetic samples, to obtain the benefits listed above, even on that specific question.
- the invention applies in the same way to any kind of model, e.g. a machine learning model. It does not make any assumption on the model.
- the invention allows to use the full available tagged data to train the model, and then uses synthetic samples to test it.
- the invention does not rely on the assumption that available tagged data is perfectly representative of all possible data, or that the order of data in those sets is perfectly random. This is because it does not rely on the available tagged data to represent all possible observations. Instead it generates synthetic samples based on the theoretical distributions of the possible observations. Because the test samples are synthetic, we do not have an associated value of the target variables prior to applying the model to these samples. The synthetic samples are not tagged. As a consequence, the method does not return an error rate on the samples.
- the method allows providing if there is a risk (if the training data is not representative of the theoretically possible data), to understand how the risk could happen (on what dimensions the difference exists), and to assess the risk associated to the theoretical variability of the predictions (in areas not covered by the training data).
- the method is computer-implemented. This means that the steps (or substantially all the steps) of the method are executed by at least one computer, or any system alike. Thus, steps of the method are performed by the computer, possibly fully automatically, or, semi-automatically. In examples, the triggering of at least some of the steps of the method may be performed through user-computer interaction.
- the level of user-computer interaction required may depend on the level of automatism foreseen and put in balance with the need to implement user's wishes. In examples, this level may be user-defined and/or pre-defined.
- a typical example of computer-implementation of the method is to perform the method with a system adapted for this purpose.
- the system may comprise a processor coupled to a memory and a graphical user interface (GUI), the memory having recorded thereon a computer program comprising instructions for performing the method.
- GUI graphical user interface
- the memory may also store a database.
- the memory is any hardware adapted for such storage, possibly comprising several physical distinct parts (e.g. one for the program, and possibly one for the database).
- database any collection of data (i.e. information) organized for search and retrieval (e.g. a relational database, e.g. based on a predetermined structured language, e.g. SQL).
- search and retrieval e.g. a relational database, e.g. based on a predetermined structured language, e.g. SQL.
- databases are indeed structured to facilitate storage, retrieval, modification, and deletion of data in conjunction with various data-processing operations.
- the database may consist of a file or set of files that can be broken down into records, each of which consists of one or more fields. Fields are the basic units of data storage. Users may retrieve data primarily through queries. Using keywords and sorting commands, users can rapidly search, rearrange, group, and select the field in many records to retrieve or create reports on particular aggregates of data according to the rules of the database management system being used.
- indexing it is meant storing observations including their target values in a way that is meant to optimize queries by values on a predefined set of variables (these variables are said to be 'indexed').
- Variables with a finite number of possible values should be stored in inverted lists. For instance, if the occurrence of rain during a given lap of a car race is represented with zero for "no rain” and one for "rain", there is only two possible values for this variable.
- An inverted list is a list of values, with for each value a list of pointers. Each pointer points to the stored observations for which this value occurs. Inverted lists allow for quick query by value. In some variables the notion of order and the difference between values is important.
- L1 and L2 are more similar than L2 and L3 with regards to the temperature.
- query by segment is meaningful.
- these values are typically stored in (in memory) structures that make query by segment quick.
- these variables are typically stored on the supported physical memories that provide the fastest read access. This is to allow for the quick query of all observations for which the value of the given variable may fall into the segment.
- One approach for querying by segment is to index discretized values (rounded to a certain level of precision) and to query all the discrete values comprised in the segment.
- An index stores data as documents with associated metadata.
- a document is an observation and the associated input and target values are metadata.
- the metadata of the documents should be sufficient to determine if the document represents an observation from available tagged data or a synthetic sample. For example, a specific metadata can be set to contain this information.
- the method generally manipulates sets of observations.
- An observation is a set of variables, wherein each variable is associated with a value.
- a variable represents a state of a system or of a part of it, or the state of an element in relation with or which has an influence on the system or a part of it.
- the variables of an observation of a car can be the temperature of the car, the oil pressure, instant fuel consumption, average fuel consumption during a race, the kind of tyres, the temperature of the air, the weather (rain, sun, snow),...
- the variable is associated with a value that quantifies the state of the variable.
- An observation represents a state of the system at a given point in time. A set of observations is thus the value of the variables at different points in time.
- the system can belong in various and unlimited industrial fields, including: aerospace, architecture, construction, consumer goods, high-tech devices, industrial equipment, transportation, marine, and/or offshore oil/gas production or transportation.
- the set of observations used by the method may thus comprise the variables related to an industrial system which may be any mechanical system, such as system of a terrestrial vehicles or a part of it (including e.g. car and light truck equipment, racing cars, motorcycles, truck and motor equipment, trucks and buses, trains), a system of an aerial vehicle or a part of it (including e.g. airframe equipment, aerospace equipment, propulsion equipment, defense products, airline equipment, space equipment), a system of a naval vehicle or a part of it (including e.g.
- FIG. 1 shows an example of observations.
- Each line 12 represents an observation
- each column 14 (only one is represented with a dotted line in FIG. 1 for clarity reason) corresponds to a variable
- each rectangle 18 represents the value of a variable for an observation.
- the set of observations is stored on a matrix 10.
- Each observations is described with its values on so-called « descriptive variables » also known as « input variables » (because they are provided as input of a trained model to describe an observation).
- each observation of the set comprises the same variables as the other observations of the set. It is to be understood that for each observation, one or more variable can empty, that is, not associated with a value.
- Each observation is associated with corresponding values on so-called « target variables » also known as « output variableslitis
- the target variables are the variables that trained models must evaluate for new observations.
- Target variables are meaningful for the user of the model in the sense that they may provide information that help the user of the model understand and/or predict and/or react to the behavior of the system.
- the target variables are also stored in a matrix 16. It is to be understood that the values and the target variables of each observation can be stored in a single matrix comprising the matrices 10 and 16.
- the observations and the target variables form (and are referred to as) a set of tagged data. It is to be understood that each target variable is accompanied of a value so-called target value for each observation.
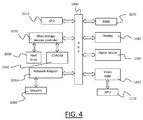
- FIG. 4 shows an example of the system, wherein the system is a client computer system, e.g . a workstation of a user.
- the system is a client computer system, e.g . a workstation of a user.
- the client computer of the example comprises a central processing unit (CPU) 1010 connected to an internal communication BUS 1000, a random access memory (RAM) 1070 also connected to the BUS.
- the client computer is further provided with a graphical processing unit (GPU) 1110 which is associated with a video random access memory 1100 connected to the BUS.
- Video RAM 1100 is also known in the art as frame buffer.
- a mass storage device controller 1020 manages accesses to a mass memory device, such as hard drive 1030.
- Mass memory devices suitable for tangibly embodying computer program instructions and data include all forms of nonvolatile memory, including by way of example semiconductor memory devices, such as EPROM, EEPROM, and flash memory devices; magnetic disks such as internal hard disks and removable disks; magneto-optical disks; and CD-ROM disks 1040. Any of the foregoing may be supplemented by, or incorporated in, specially designed ASICs (application-specific integrated circuits).
- a network adapter 1050 manages accesses to a network 1060.
- the client computer may also include a haptic device 1090 such as cursor control device, a keyboard or the like.
- a cursor control device is used in the client computer to permit the user to selectively position a cursor at any desired location on display 1080.
- the cursor control device allows the user to select various commands, and input control signals.
- the cursor control device includes a number of signal generation devices for input control signals to system.
- a cursor control device may be a mouse, the button of the mouse being used to generate the signals.
- the client computer system may comprise a sensitive pad, and/or a sensitive screen.
- the computer program may comprise instructions executable by a computer, the instructions comprising means for causing the above system to perform the method.
- the program may be recordable on any data storage medium, including the memory of the system.
- the program may for example be implemented in digital electronic circuitry, or in computer hardware, firmware, software, or in combinations of them.
- the program may be implemented as an apparatus, for example a product tangibly embodied in a machine-readable storage device for execution by a programmable processor. Method steps may be performed by a programmable processor executing a program of instructions to perform functions of the method by operating on input data and generating output.
- the processor may thus be programmable and coupled to receive data and instructions from, and to transmit data and instructions to, a data storage system, at least one input device, and at least one output device.
- the application program may be implemented in a high-level procedural or object-oriented programming language, or in assembly or machine language if desired. In any case, the language may be a compiled or interpreted language.
- the program may be a full installation program or an update program. Application of the program on the system results in any case in instructions for performing the method.
- Assessing a potential divergence of the behavior of a system predicted by a machine learning algorithm designates an action which is at least part of a process of ensuring proper use of, or interaction with the system.
- the method may comprise programming regular actions in response to predicted behaviors of the system, and fallback actions in cases where a potential divergence is detected between the actual behavior of the system and its predicted behavior.
- a potential divergence will be detected if empirical data (tagged data) fails to adequately represent a new situation. Therefore fallback may be based on a decision system based on theoretical considerations or experts rule, which do not rely on empirical data.
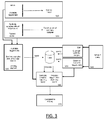
- FIG. 3 it is discussed an example of the invention.
- a trained model is obtained by training a first set of observations.
- the set of observation is the one discussed in reference to FIG. 1 : each observation of the set of observations is associated with a target value.
- the model is trained on tagged data, in the sense that it is trained using observations associated ('tagged') with the corresponding value of the target variable. These observations form the so-called training set.
- the training of the model is performed as known in the field of machine learning.
- the trained model is typically stored on a storage, e.g. on Random Access Memory for execution and on a filesystem for persistence.
- the first set of observations can be referred to as natural samples in reference to the fact that the value associated with each variable of an observation is a value observed (or measured) from the real world. For instance, the rotation speed of a rotating machine that is measured at a given point in time is a natural value of the variable "rotation speed".
- a second set of observations is generated using a random variate generation algorithm.
- This second set of observation has the same structure as the first one, that is, each observation of the second set has the same variables; only the values associated with variable may be different.
- the second set of observation is also referred to as synthetic samples; here the term synthetic is opposed to the term natural samples: the values of the variables have not been observed, but they have been computed.
- the generation of the synthetic observations may be carried out as follows.
- An observation is described by a number of values associated to variables that characterize the observations of a set of observations.
- the trained model when given these values in input, generate the target value associated with the corresponding observation of the set.
- a model may take in input the rotation speed of the rotating machine, the material of the part to be machined, the cutting coolant, the cutting fluid, the depth of cut, the cutting speed, the insert shape, the insert size, etc.
- Some models work by numerical (matrix) computations and expect numerical input. So any of these input data can be converted into numerical values before being inputted to the model, both for training and for prediction.
- variable “cutting coolant” may be water, mineral oil, air... Cutting coolant can be converted in 0 for water, 1 for mineral oil, 2 for air.
- the variable “cutting coolant” can be converted into a number of binary variables such as “cutting coolant includes water”, “cutting coolant includes mineral”, “cutting coolant includes air”. Each of these variables takes a binary value that can be represented as 1 for True and 0 for False.
- variables may be defined on an infinite set.
- physical observations can be restricted to intervals of realistic values. For example in practice rotation speed of a rotating machine can be restricted to interval [10, 2000] rotations per minute (rpm); a rotation above 2000 rpm is theoretically acceptable but is not used in practice.
- the variables of the first set of observation may be defined on continuous segments or on discrete sets; this depends of the variable.
- the trained model at step S10 can therefore be trained with the first set of observations with variables defined on continuous segments or on discrete sets. This first set of observations defined on continuous segments or on discrete sets will be used for generating the second set.
- the descriptive variables are now defined on continuous segments or discrete sets, it is possible to associate a theoretical probability distribution on each variable.
- the choice of a probability distribution thus depends on the variable.
- the theoretical probability associated with rotation speed of the rotating machine can be based on a uniform distribution on segment [10 rpm, 2000 rpm] if no information other than those minimal and maximal rotation speeds are known.
- the uniform probability distribution specifies that all values of the segment or the set are equiprobable.
- Non uniform distributions might be used when one knows that the metric is the result of a process that generates a non-uniform distribution, for instance, a normal distribution, a Poisson distribution, a Pareto distribution, etc.
- the values of the first variable can be generated by generating values for the other variables and calculating the corresponding value of the first variable each time.
- a random variate generator is a program that generates particular outcomes of random variables according to their probability distributions on their range of definition.
- the second set all the combinations of the random samples have been computed.
- observations that are not realistic that is, that would not be observed in the practice
- This may be performed by determining if dependencies exist between variables of the set of observations. It is to be understood that these dependencies are known a priori.
- the dependencies can be used to prevent computations of combinations of the random samples that do not satisfy the dependencies, or they can be used for removing combinations of random samples that do not satisfy the dependencies. For example, an insert shape released in the current year cannot have been used for machining a part in an observation older than the release date.
- a second set of observations have been randomly generated.
- this second set is not associated with target values: available tagged data (the first set) include a target value, which synthetic data does not.
- the trained model is applied on the second set randomly generated, at step S20 .
- Each synthetic observation is inputted to the trained model and the target value is set to the output of the model.
- a target value is obtained and associated with each observation of the second set.
- Applying the trained model on the second set is performed as known in the art.
- the second set and its target values can preferably be stored as the first set, that is, by use of a matrix as discussed in reference to FIG. 1 .
- two sets of observations are available. These two sets may be merged in the matrices 10 and 16 (or also in a single matrix), as shown in FIG. 2 .
- the observations represented in plain lines are the observations (and variables) of the first set
- the observations represented in dotted lines are the observations (and variables) of the second set.
- the matrices 10, 16 can be associated with a supplementary matrix 20 that comprises, for each observation, information of whether or not the observation is natural or has been generated. Each observation is therefore marked as natural or generated, e.g. a value 0 for natural and a value 1 for generated.
- an index is built from the two sets of observations and their associated target values.
- the index has been discussed above.
- the term index is used here without constraint as to the number of processes, storage devices, servers, or addresses.
- a particular case is an index where separate processes serve to access data located on different servers.
- one process may respond to requests of natural observations, another process may respond to requests of generated observations, the two sets of observations may be stored on different locations, and the two processes may be accessible using different addresses (URLs).
- URLs addresses
- index two indexes may be built instead of one: an index for each set of information, that is, the index comprises a first index for the first set of observations, and a second index for the second set of observations.
- the matrices of the two set are preferably not merged.
- the supplementary matrix 20 is not necessary, as the constraint that an observation belongs to the first or second set is specified by the choice of the URL of the query.
- a first query is received by the index.
- the query is specified in terms of one or several variables that describe a data.
- the query may be written by a user.
- the query may be automatically written by a system that expects an answer.
- a system that commands operations of a rotating machine may request on the results of drilling with new rotation speeds.
- the query might be "what if an aluminum part were drilled with a water as cooler, for a depth of cut 0.5mm, and insert shape of type B?"
- the expected answer by the command system a measure of the expected quality of the result of the drilling, for instance, a measure of smoothness of the result.
- a query is therefore a sum of constraints on the documents indexed.
- the query described above could take the following form (but is not limited to): '128.0.0.1:10000 / q?cooler:water AND cut_depth:0.5 AND insert_shape:B'.
- the process listening to port 10000 on host 128.0.0.1 will be queried with query string 'cooler:water AND cut_depth:0.5 AND insert_shape:B' and will respond by retrieving all documents associated to value 'water' in the inverted list corresponding to variable 'cooler' and associated to value ' 0.5 ' in the inverted list corresponding to variable 'cut_depth' and associated to value ' B ' in the inverted list corresponding to variable ' insert _ shape '.
- two queries are generated from the first query of step S40.
- Generating means that the first query is transformed into two queries, namely a second and a third query. They may be generated in the same time, or one after the other, no matter the second is generated before the third one or the third request is generated before the second one.
- the second query is generated (S50) by the server and comprises the first query of step S40 and an additional constraint that is to return only one or more observation of the first set.
- the third query is generated (S52) by the server and comprises the first query of step S40 and an additional constraint that is to return only one or more observation of the second set.
- the index is queried using both the second and third generated queries.
- the queried index therefore returns two results (step S60).
- the first result is provided by the second query and comprises the available observations of the first set that match the query.
- a response to the second query provides available tagged data of the first set: this allows to represent the density of tagged data.
- the second result is provided by the third query and comprises the available observations of the second set that match the query.
- the query on synthetic data allows to represent samples representative of any possible observation.
- a comparison can be performed between the two results.
- the comparison may be performed for each neighborhood of N observations. Within this neighborhood, one counts the number of observations of the first set: the higher the number of observations of the first set, the better the model. On the contrary, the lower the number of observations of the first set, the worse the model.
- K is the number of observations of the first set in the neighborhood
- N-K the number of observations of the second set
- K/N is the density of the natural observations in the neighborhood.
- the percentile of the density of natural observations in a neighborhood of size N around a given new observation is a new metric that describes the relative potential divergence of the model for the new observation. It can serve as a measure of relative confidence in the prediction provided by the model.
- the percentile at which one chooses to rely or not rely on the model depends on the cost of divergence and the expected quality of the alternative fallback decision systems, among other things.
- the steps S10, S20, S30, S50, S52 , S60 and S70 are preferable carried out by a server that stores the first set of observations.
- the step S40 is typically performed on a client that is connected to the server. Both the server and the client can be a system as represented in reference to FIG. 4 . It is to be understood that other implementations may be contemplated. For instance, the steps S50 and S52 may be performed on the client side instead of the server side. In another alternative, the comparison may be performed on the client.
Landscapes
- Engineering & Computer Science (AREA)
- Theoretical Computer Science (AREA)
- Data Mining & Analysis (AREA)
- Physics & Mathematics (AREA)
- General Physics & Mathematics (AREA)
- General Engineering & Computer Science (AREA)
- Software Systems (AREA)
- Evolutionary Computation (AREA)
- Computer Vision & Pattern Recognition (AREA)
- Artificial Intelligence (AREA)
- Computing Systems (AREA)
- Databases & Information Systems (AREA)
- Mathematical Physics (AREA)
- Medical Informatics (AREA)
- Computational Linguistics (AREA)
- Bioinformatics & Computational Biology (AREA)
- Life Sciences & Earth Sciences (AREA)
- Bioinformatics & Cheminformatics (AREA)
- Evolutionary Biology (AREA)
- Probability & Statistics with Applications (AREA)
- Information Retrieval, Db Structures And Fs Structures Therefor (AREA)
- Management, Administration, Business Operations System, And Electronic Commerce (AREA)
Abstract
Description
- The invention relates to the field of computer programs and systems, and more specifically to a method, system and program for assessing a potential divergence of an outcome predicted by a machine learning system.
- In machine learning, prediction error may occur because the trained model is inappropriate, the choice of input variables is ineffective, or the choice of training samples is not representative of the new data. Sometimes the choice of models is limited (e.g. to the models known to perform well for the problem at hand) and the choice of input variables is limited (e.g. to the variables that can be collected).
- A problem that occurs for analysts is therefore how to assess the risk of error due to the choice of training samples or the availability of the set of observations for which the target value is known (this set is also referred to as tagged data), for a given model and a given set of input variables.
- Methods have been developed for testing a trained model. A first method is called delta and Gamma test. The gamma test presented in Stefánsson, Adoalbjörn, N. Končar, and Antonia J. Jones. "A note on the gamma test." Neural Computing & Applications 5.3 (1997): 131-133, estimates the error of a smooth model based solely of the training samples. A smooth model is a model (such as a neural network) whose output is a smooth function of the input. A smooth function is a function with bounded partial first and second order derivatives. Intuitively this means that the curve of the function across any direction is smooth and does not make angles. The delta test does not require a smooth model but a continuous model. A continuous model is a model whose output is a continuous function of the input. A continuous function is a function whose value on a series S of points tends to its value on a point P if S converges to P. The Delta test is anterior to the Gamma test. It makes a weaker assumption on the model, but requires a greater data set density to estimate the error of the model with similar quality.
- However, this first method suffers drawbacks. Notably, it applies to a restricted class of models. The Delta and Gamma test estimates an error between the actual target value of the observations and the target values that can be generated by a smooth function. The output is not a smooth function of the input in every model. It is the case for some types of artificial neural networks but not for ensemble methods based on decision trees or stubs, which are currently chosen as highest performing approaches to many machine learning problems.
- A second method is the cross-validation discussed in Kohavi, Ron. "A study of cross-validation and bootstrap for accuracy estimation and model selection." Ijcai. Vol. 14. No. 2. 1995. Cross validation consists in breaking the available tagged data into training data and test data. The model is trained based on the training data and then tested on the test data. When tested, the output of the trained model is compared to the actual value of the target data. K-fold consists in multiple (K, e.g. K = 5) cross-validations to make better use of the available tagged data. In the first cross-validation, the tagged data is split in K sets of approximatively the same size (it is approximate because the size of the tagged data set may be different from a multiple of K). Then, for each successive run, the test data set is made with samples not previously used in the test set (in previous runs), and the training data at each run is the remainder of the tagged data set. Performance of the model is measured for each run. The final performance measure is typically the average of all runs.
- A third method is a particular case of cross validation where the error rate is plotted for different sizes of the training set. More specifically this third method consists in plotting two error rate curves. One corresponds to the errors of the model on observations from the training set, and the other corresponds to the errors of the model on observations of the test set. The error rate on observations of the training set should decrease continuously with regards to the training set size, while the error rate on observations of the test set should decrease at least for lower training set sizes. There can be a point after which it starts to increase. This inflection point is the optimal size of the training set, before which underfitting occurs, and after which overfitting occurs. If this point does not exist, there is no overfitting, and the optimal training set is the largest.
- These second and third methods do not allow to use all available tagged data to train the model. In ideal cases (when the model does not overfit), it is beneficial to use as much data as possible to train the model, so in practice a model is typically trained on all available tagged data. In these cases those methods do not exactly measure the performance of the trained model as it will run in production. This is a problem when there is little tagged data.
- None of these methods account for risk of errors associated to the choice of the training data. Even when all tagged data available at time of training is used for training, the methods do not account for the risk of errors associated to the distribution of the tagged data available at the time of training. In practice, this is an important problem as tagged data is only representative of the situations that occurred when the tagged data was collected, which may be different from the situations that may occur in the future. In some cases where data cannot always be collected, the available tagged data is only representative of a subset of the situations that occurred, that is, the situations that occurred when it was possible to collect data, which may not be representative of the entire set of possible situations.
- For example, cross validation only allows to assess the risk of errors on observations similar to the ones of the test set, that is, similar to observations found in the available tagged data.
- The problem of comparing error rates on the training set and the test set while varying the size of the training set, is precisely that we only vary the size of the training set, not the choice of the observations in the training set. This means that the observations in the training set are supposed to be representative of all possible observations, and that they are supposed to be taken in a perfectly random order. If one considers for example the training set of a two-class classification model where all observations are localized in a small area of the space of possible observations. The model will learn the minute details of how to distinguish between the two classes in that particular sub-space. It will not learn how to distinguish between the two classes in other areas of the space of observations. The model will overfit, not because of the size of the training set, but because of the distribution of the observations in the training set.
- The Delta and Gamma tests do not require to split the available tagged data into a training set and a test set. But they still suppose that the available tagged data is representative of all possible input data (including future input data).
- Hence, the lack of risk assessment with these methods is an issue because phenomena typically evolve with time. So the distribution of the training data becomes obsolete at some point. For instance, the prediction of when to make a pit stop in a car race typically relies on input data that describe the circuit and car behavior. For example, with climate change, extreme temperatures may occur for the first time on Formula One circuits. Extreme temperatures may affect tyre adherence, as well as engine and brake pads behaviors. However, the consequence of extreme temperatures might not be learnt by the model. Such situations might not have been captured in the available tagged data, especially if these temperatures were never before seen the current circuit. A machine learning model used to help determine the optimal moment to do a pit stop could lead to inappropriate recommendations in situations very different from the usual. Inappropriate operations made on a Formula One car in a pit stop, or inappropriate timing, can not only decrease the performance of the team, but also lead to dangerous situations.
- Within this context, there is still a need for assessing a potential divergence of an outcome predicted by a machine learning system.
- It is therefore provided a computer-implemented method for assessing a potential divergence of an outcome predicted by a machine learning system. The method comprises:
- training a model on a first set of observations, each observation being associated with a target value;
- generating a second set of observations;
- applying the trained model to the second set thereby obtaining a target value associated with each observation of the second set;
- indexing the first and second sets of observations and their associated target values into an index;
- receiving a first query allowing a selection of a subset of the first and second sets of observations;
- generating a second query that comprises the first query and an additional constraint that is to return only observation(s) of the first set;
- generating a third query that comprises the first query and an additional constraint that is to return only observation(s) of the second set;
- querying the index using the second and third queries; and
- returning a response to the second and third queries.
- The method may comprise one or more of the following:
- each observation of the first set of observations is associated with one or more variables, each variable being associated with a value;
- before the step of training a model on a first set of observations: defining the one or more variables of the first set on continuous segments or on discrete sets;
- the random generation of the second set of observations comprises: associating, on each variable of the first set, a probability distribution;
- the probability distribution is determined according to the said each variable of the first set;
- the probability distribution function is a uniform probability distribution;
- generating values across the continuous segments or on discrete sets by using at least one random variate generator; computing combinations of the values obtained from the at least one random variate generator;
- determining dependencies between the variables; removing combinations among the computed combinations that do not satisfy the determined dependencies;
- computing combinations of the random variate comprises computing all the combinations of the random variates;
- the first set of observations is stored on a first matrix and second set of observations is stored on a second matrix;
- the second set of observations is marked as being randomly generated.
- at the step of indexing, the indexed second set of observations is associated with a metadata indicating that the observations have been randomly generated.
- before the step of returning: comparing the results of the second and third queries.
- It is further provided a computer program comprising instructions for performing the method.
- It is further provided a computer readable storage medium having recorded thereon the computer program.
- It is further provided a system comprising a processor coupled to a memory, the memory having recorded thereon the computer program.
- Embodiments of the invention will now be described, by way of non-limiting example, and in reference to the accompanying drawings, where:
-
FIG. 1 shows an example of a matrix of observations for training a model; -
FIG. 2 shows an example of a matrix of observations comprising natural observation and synthetic observations; -
FIG. 3 shows an example of the method; -
FIG. 4 shows an example of a system for performing the method. - With reference to the flowchart of
FIG. 3 , it is proposed a computer-implemented method for assessing a potential divergence of an outcome predicted by a machine learning system. The method comprises training a model on a first set of observations, each observation being associated with a target value. The method further comprises randomly generating a second set of observations. The trained model is then applied to the second set of observation. As a result, a target value is obtained and associated with each observation of the second set. Then, the method comprises indexing the first sets of observations and the second sets of observations and their associated target values into an index. Next, a first query is received; the first query allows a selection of a subset of the first and second sets of observations. A second query is generated from the first one and comprises the first query and an additional constraint that is to return only observation(s) of the first set. A third query is also generated from the first one and comprises the first query and an additional constraint that is to return only observation(s) of the second set. Next, the index is queried using the second and third queries. A response to the second and third queries is returned. - Such a method improves the assessment of a potential divergence of an outcome predicted by a machine learning system. Indeed assessing the risks associated to the available tagged data (the tagged data are a set of observations for which the target value is known) consists in comparing the available tagged data with future data. Since future data is not available, the invention solves this problem by comparing available tagged data with theoretically possible data. At least future data is theoretically possible, so the worst-case scenario for future data is included in theoretically possible data.
- The risk can be related to (a) the accuracy of the model: if the model is wrong then some incorrect decisions could be taken based on output from the model. However, there is no way to predict the accuracy of the model at a given observation (in the set of possible or future observations) if there is no tagged data corresponding to similar observations.
- The invention solves this problem by providing a rough estimate of the model accuracy at all possible observations. The estimate is the density of available tagged observations around that point. Basically, the denser the training data around a point, the better trained the model will be, and the better it will perform around that point. In the invention, providing this rough estimate consists in providing a response to a query on synthetic data (which allows to represent any possible observation) and a response to a query on available tagged data (which allows to represent the density of tagged data around that point).
- The risk can be related to the value returned by the model: if one decides to act based on outputs from the model, then the output of the model determines the decisions that will be taken. There is a risk associated to these decisions, so there is a risk associated to the output of the model. For example, a decision can be a force applied to a mechanical part as part of an adjustment made during a pit stop in a car race, and the risk is for the mechanical part to break during the remaining laps of the car race.
- The invention reveals the value of the model at theoretically possible points not covered by tagged data because according to the invention the model is run even on synthetic samples, and the output of the model is indexed along with the corresponding inputs.
- Assessing risks usually involves "what-if" questions. The invention solves this by means of queries. The user specifies their query in terms of specifications on one or several variables that describe the data. For instance, if prior to the race the team realizes that temperatures on the circuit are anticipated to reach extreme values during the race, they can question the accuracy of the model for the race by issuing a query specifying the expected temperatures. Furthermore, if during the race a new situation unfolds such as unanticipated shower rains, the team can also issue a query specifying a number of values that describe the current situation, including the occurrence of shower rains, in order to understand what credit to give to the recommendations provided by use of the machine learning model and given the data that was used to train it. That query is then used to generate two queries, one on the available tagged data and one on the synthetic samples, to obtain the benefits listed above, even on that specific question.
- The invention applies in the same way to any kind of model, e.g. a machine learning model. It does not make any assumption on the model. The invention allows to use the full available tagged data to train the model, and then uses synthetic samples to test it. The invention does not rely on the assumption that available tagged data is perfectly representative of all possible data, or that the order of data in those sets is perfectly random. This is because it does not rely on the available tagged data to represent all possible observations. Instead it generates synthetic samples based on the theoretical distributions of the possible observations. Because the test samples are synthetic, we do not have an associated value of the target variables prior to applying the model to these samples. The synthetic samples are not tagged. As a consequence, the method does not return an error rate on the samples. Instead, it provides the variability of the predictions on samples similar or dissimilar to the samples in the training set. The method allows providing if there is a risk (if the training data is not representative of the theoretically possible data), to understand how the risk could happen (on what dimensions the difference exists), and to assess the risk associated to the theoretical variability of the predictions (in areas not covered by the training data).
- The method is computer-implemented. This means that the steps (or substantially all the steps) of the method are executed by at least one computer, or any system alike. Thus, steps of the method are performed by the computer, possibly fully automatically, or, semi-automatically. In examples, the triggering of at least some of the steps of the method may be performed through user-computer interaction. The level of user-computer interaction required may depend on the level of automatism foreseen and put in balance with the need to implement user's wishes. In examples, this level may be user-defined and/or pre-defined.
- A typical example of computer-implementation of the method is to perform the method with a system adapted for this purpose. The system may comprise a processor coupled to a memory and a graphical user interface (GUI), the memory having recorded thereon a computer program comprising instructions for performing the method. The memory may also store a database. The memory is any hardware adapted for such storage, possibly comprising several physical distinct parts (e.g. one for the program, and possibly one for the database).
- By "database", it is meant any collection of data (i.e. information) organized for search and retrieval (e.g. a relational database, e.g. based on a predetermined structured language, e.g. SQL). When stored on a memory, the database allows a rapid search and retrieval by a computer. Databases are indeed structured to facilitate storage, retrieval, modification, and deletion of data in conjunction with various data-processing operations. The database may consist of a file or set of files that can be broken down into records, each of which consists of one or more fields. Fields are the basic units of data storage. Users may retrieve data primarily through queries. Using keywords and sorting commands, users can rapidly search, rearrange, group, and select the field in many records to retrieve or create reports on particular aggregates of data according to the rules of the database management system being used.
- By indexing, it is meant storing observations including their target values in a way that is meant to optimize queries by values on a predefined set of variables (these variables are said to be 'indexed'). Variables with a finite number of possible values, should be stored in inverted lists. For instance, if the occurrence of rain during a given lap of a car race is represented with zero for "no rain" and one for "rain", there is only two possible values for this variable. An inverted list is a list of values, with for each value a list of pointers. Each pointer points to the stored observations for which this value occurs. Inverted lists allow for quick query by value. In some variables the notion of order and the difference between values is important. For instance If lap L1 occurs with temperature T1 = 22C, lap L2 occurs with temperature T2 = 23C, lap L3 occurs with temperature T3 = 30C, L1 and L2 are more similar than L2 and L3 with regards to the temperature. For these variables, query by segment is meaningful. On an index, these values are typically stored in (in memory) structures that make query by segment quick. When indexed, these variables are typically stored on the supported physical memories that provide the fastest read access. This is to allow for the quick query of all observations for which the value of the given variable may fall into the segment. One approach for querying by segment is to index discretized values (rounded to a certain level of precision) and to query all the discrete values comprised in the segment. An index stores data as documents with associated metadata. A document is an observation and the associated input and target values are metadata. The metadata of the documents should be sufficient to determine if the document represents an observation from available tagged data or a synthetic sample. For example, a specific metadata can be set to contain this information.
- The method generally manipulates sets of observations. An observation is a set of variables, wherein each variable is associated with a value. A variable represents a state of a system or of a part of it, or the state of an element in relation with or which has an influence on the system or a part of it. For instance, the variables of an observation of a car can be the temperature of the car, the oil pressure, instant fuel consumption, average fuel consumption during a race, the kind of tyres, the temperature of the air, the weather (rain, sun, snow),... The variable is associated with a value that quantifies the state of the variable. An observation represents a state of the system at a given point in time. A set of observations is thus the value of the variables at different points in time. In practice, the system can belong in various and unlimited industrial fields, including: aerospace, architecture, construction, consumer goods, high-tech devices, industrial equipment, transportation, marine, and/or offshore oil/gas production or transportation. The set of observations used by the method may thus comprise the variables related to an industrial system which may be any mechanical system, such as system of a terrestrial vehicles or a part of it (including e.g. car and light truck equipment, racing cars, motorcycles, truck and motor equipment, trucks and buses, trains), a system of an aerial vehicle or a part of it (including e.g. airframe equipment, aerospace equipment, propulsion equipment, defense products, airline equipment, space equipment), a system of a naval vehicle or a part of it (including e.g. navy equipment, commercial ships, offshore equipment, yachts and workboats, marine equipment), a general mechanical system or a part of the mechanical system (including e.g. industrial manufacturing machinery, heavy mobile machinery or equipment, installed equipment, industrial equipment product, fabricated metal product, tire manufacturing product), an electro-mechanical or electronic system or a part of it (including e.g. consumer electronics, security and/or control and/or instrumentation products, computing and communication equipment, semiconductors, medical devices and equipment), a consumer good (including e.g. furniture, home and garden products, leisure goods, fashion products, hard goods retailers' products, soft goods retailers' products), a packaging (including e.g. food and beverage and tobacco, beauty and personal care, household product packaging).
-
FIG. 1 shows an example of observations. Eachline 12 represents an observation, each column 14 (only one is represented with a dotted line inFIG. 1 for clarity reason) corresponds to a variable, and eachrectangle 18 represents the value of a variable for an observation. In this example, the set of observations is stored on amatrix 10. Each observations is described with its values on so-called « descriptive variables » also known as « input variables » (because they are provided as input of a trained model to describe an observation). Interestingly, each observation of the set comprises the same variables as the other observations of the set. It is to be understood that for each observation, one or more variable can empty, that is, not associated with a value. Each observation is associated with corresponding values on so-called « target variables » also known as « output variables ». The target variables are the variables that trained models must evaluate for new observations. Target variables are meaningful for the user of the model in the sense that they may provide information that help the user of the model understand and/or predict and/or react to the behavior of the system. In this example, the target variables are also stored in amatrix 16. It is to be understood that the values and the target variables of each observation can be stored in a single matrix comprising thematrices -
FIG. 4 shows an example of the system, wherein the system is a client computer system, e.g. a workstation of a user. - The client computer of the example comprises a central processing unit (CPU) 1010 connected to an
internal communication BUS 1000, a random access memory (RAM) 1070 also connected to the BUS. The client computer is further provided with a graphical processing unit (GPU) 1110 which is associated with a videorandom access memory 1100 connected to the BUS.Video RAM 1100 is also known in the art as frame buffer. A massstorage device controller 1020 manages accesses to a mass memory device, such ashard drive 1030. Mass memory devices suitable for tangibly embodying computer program instructions and data include all forms of nonvolatile memory, including by way of example semiconductor memory devices, such as EPROM, EEPROM, and flash memory devices; magnetic disks such as internal hard disks and removable disks; magneto-optical disks; and CD-ROM disks 1040. Any of the foregoing may be supplemented by, or incorporated in, specially designed ASICs (application-specific integrated circuits). Anetwork adapter 1050 manages accesses to anetwork 1060. The client computer may also include ahaptic device 1090 such as cursor control device, a keyboard or the like. A cursor control device is used in the client computer to permit the user to selectively position a cursor at any desired location ondisplay 1080. In addition, the cursor control device allows the user to select various commands, and input control signals. The cursor control device includes a number of signal generation devices for input control signals to system. Typically, a cursor control device may be a mouse, the button of the mouse being used to generate the signals. Alternatively or additionally, the client computer system may comprise a sensitive pad, and/or a sensitive screen. - The computer program may comprise instructions executable by a computer, the instructions comprising means for causing the above system to perform the method. The program may be recordable on any data storage medium, including the memory of the system. The program may for example be implemented in digital electronic circuitry, or in computer hardware, firmware, software, or in combinations of them. The program may be implemented as an apparatus, for example a product tangibly embodied in a machine-readable storage device for execution by a programmable processor. Method steps may be performed by a programmable processor executing a program of instructions to perform functions of the method by operating on input data and generating output. The processor may thus be programmable and coupled to receive data and instructions from, and to transmit data and instructions to, a data storage system, at least one input device, and at least one output device. The application program may be implemented in a high-level procedural or object-oriented programming language, or in assembly or machine language if desired. In any case, the language may be a compiled or interpreted language. The program may be a full installation program or an update program. Application of the program on the system results in any case in instructions for performing the method.
- Assessing a potential divergence of the behavior of a system predicted by a machine learning algorithm designates an action which is at least part of a process of ensuring proper use of, or interaction with the system. Thus the method may comprise programming regular actions in response to predicted behaviors of the system, and fallback actions in cases where a potential divergence is detected between the actual behavior of the system and its predicted behavior. A potential divergence will be detected if empirical data (tagged data) fails to adequately represent a new situation. Therefore fallback may be based on a decision system based on theoretical considerations or experts rule, which do not rely on empirical data.
- Referring now to
FIG. 3 , it is discussed an example of the invention. - At step S10, a trained model is obtained by training a first set of observations. The set of observation is the one discussed in reference to
FIG. 1 : each observation of the set of observations is associated with a target value. Hence, the model is trained on tagged data, in the sense that it is trained using observations associated ('tagged') with the corresponding value of the target variable. These observations form the so-called training set. The training of the model is performed as known in the field of machine learning. The trained model is typically stored on a storage, e.g. on Random Access Memory for execution and on a filesystem for persistence. The first set of observations can be referred to as natural samples in reference to the fact that the value associated with each variable of an observation is a value observed (or measured) from the real world. For instance, the rotation speed of a rotating machine that is measured at a given point in time is a natural value of the variable "rotation speed". - Next, at step S20, a second set of observations is generated using a random variate generation algorithm. This second set of observation has the same structure as the first one, that is, each observation of the second set has the same variables; only the values associated with variable may be different. The second set of observation is also referred to as synthetic samples; here the term synthetic is opposed to the term natural samples: the values of the variables have not been observed, but they have been computed.
- The generation of the synthetic observations may be carried out as follows. An observation is described by a number of values associated to variables that characterize the observations of a set of observations. The trained model, when given these values in input, generate the target value associated with the corresponding observation of the set. For example to predict the probability of failure of a rotating machine, a model may take in input the rotation speed of the rotating machine, the material of the part to be machined, the cutting coolant, the cutting fluid, the depth of cut, the cutting speed, the insert shape, the insert size, etc. Some models work by numerical (matrix) computations and expect numerical input. So any of these input data can be converted into numerical values before being inputted to the model, both for training and for prediction. For instance, the variable "cutting coolant" may be water, mineral oil, air... Cutting coolant can be converted in 0 for water, 1 for mineral oil, 2 for air. Alternatively, the variable "cutting coolant" can be converted into a number of binary variables such as "cutting coolant includes water", "cutting coolant includes mineral", "cutting coolant includes air". Each of these variables takes a binary value that can be represented as 1 for True and 0 for False.
- Some variables may be defined on an infinite set. However, physical observations can be restricted to intervals of realistic values. For example in practice rotation speed of a rotating machine can be restricted to interval [10, 2000] rotations per minute (rpm); a rotation above 2000 rpm is theoretically acceptable but is not used in practice. Thus, the variables of the first set of observation (descriptive variables) may be defined on continuous segments or on discrete sets; this depends of the variable. The trained model at step S10 can therefore be trained with the first set of observations with variables defined on continuous segments or on discrete sets. This first set of observations defined on continuous segments or on discrete sets will be used for generating the second set.
- As the descriptive variables are now defined on continuous segments or discrete sets, it is possible to associate a theoretical probability distribution on each variable. The choice of a probability distribution thus depends on the variable. For instance, the theoretical probability associated with rotation speed of the rotating machine can be based on a uniform distribution on segment [10 rpm, 2000 rpm] if no information other than those minimal and maximal rotation speeds are known. The uniform probability distribution specifies that all values of the segment or the set are equiprobable. Non uniform distributions might be used when one knows that the metric is the result of a process that generates a non-uniform distribution, for instance, a normal distribution, a Poisson distribution, a Pareto distribution, etc. Alternatively, if a first variable is known to be a function of other variables, the values of the first variable can be generated by generating values for the other variables and calculating the corresponding value of the first variable each time.
- From now, it is possible to generate random samples across the segments or sets of possible values of the variables and according to the associated probability distributions previously associated with each variable. This is performed by use of known techniques. In practice, they consist in random variate generators that are typically used in Monte Carlo methods. The random variate generators thus return theoretically possible values for each variable of the observations.
- For the sake of explanation a random variate generator is a program that generates particular outcomes of random variables according to their probability distributions on their range of definition.
- Once the random samples of each variable have been computed, the random observations are generated. To this aim values generated for each variable are combined: the second set of observations that is randomly generated thus cover all the possible combinations of these random values.
- At this step of the generation of the synthetic set of observations (the second set), all the combinations of the random samples have been computed. In order to reduce the size of the second set of observations, observations that are not realistic (that is, that would not be observed in the practice) are suppressed. This may be performed by determining if dependencies exist between variables of the set of observations. It is to be understood that these dependencies are known a priori. The dependencies can be used to prevent computations of combinations of the random samples that do not satisfy the dependencies, or they can be used for removing combinations of random samples that do not satisfy the dependencies. For example, an insert shape released in the current year cannot have been used for machining a part in an observation older than the release date.
- At this step, a second set of observations have been randomly generated. However, this second set is not associated with target values: available tagged data (the first set) include a target value, which synthetic data does not. In order to compute target data of the second set, the trained model is applied on the second set randomly generated, at step S20. Each synthetic observation is inputted to the trained model and the target value is set to the output of the model. A target value is obtained and associated with each observation of the second set. Applying the trained model on the second set is performed as known in the art. The second set and its target values can preferably be stored as the first set, that is, by use of a matrix as discussed in reference to
FIG. 1 . - At this step of the method, two sets of observations are available. These two sets may be merged in the
matrices 10 and 16 (or also in a single matrix), as shown inFIG. 2 . InFIG. 2 , the observations represented in plain lines are the observations (and variables) of the first set, while the observations represented in dotted lines are the observations (and variables) of the second set. Interestingly, thematrices supplementary matrix 20 that comprises, for each observation, information of whether or not the observation is natural or has been generated. Each observation is therefore marked as natural or generated, e.g. a value 0 for natural and a value 1 for generated. - Next, at step S30, an index is built from the two sets of observations and their associated target values. The index has been discussed above. The term index is used here without constraint as to the number of processes, storage devices, servers, or addresses. A particular case is an index where separate processes serve to access data located on different servers. In one implementation, one process may respond to requests of natural observations, another process may respond to requests of generated observations, the two sets of observations may be stored on different locations, and the two processes may be accessible using different addresses (URLs). This could be advantageous as the hardware servers that best support the incoming flow of natural observations may not be the same as the hardware servers that best support the incoming flow of generated observations. This could also be advantageous to protect the process of collecting natural observations to alter the stored generated observations, or vice versa.
- As an example of index, two indexes may be built instead of one: an index for each set of information, that is, the index comprises a first index for the first set of observations, and a second index for the second set of observations. In this example, the matrices of the two set are preferably not merged. And the
supplementary matrix 20 is not necessary, as the constraint that an observation belongs to the first or second set is specified by the choice of the URL of the query. - Then, at step S40, a first query is received by the index. The query is specified in terms of one or several variables that describe a data. The query may be written by a user. The query may be automatically written by a system that expects an answer. For instance, a system that commands operations of a rotating machine may request on the results of drilling with new rotation speeds. For instance, the query might be "what if an aluminum part were drilled with a water as cooler, for a depth of cut 0.5mm, and insert shape of type B?" The expected answer by the command system a measure of the expected quality of the result of the drilling, for instance, a measure of smoothness of the result. By issuing multiple such queries corresponding to different rotation speeds, the command system can therefore select the rotation speed that gives the best result. A query is therefore a sum of constraints on the documents indexed. For example the query described above could take the following form (but is not limited to): '128.0.0.1:10000/q?cooler:water AND cut_depth:0.5 AND insert_shape:B'. The process listening to port 10000 on host 128.0.0.1 will be queried with query string 'cooler:water AND cut_depth:0.5 AND insert_shape:B' and will respond by retrieving all documents associated to value 'water' in the inverted list corresponding to variable 'cooler' and associated to value '0.5' in the inverted list corresponding to variable 'cut_depth' and associated to value 'B' in the inverted list corresponding to variable 'insert_shape'.
- As a result of this query, two queries are generated from the first query of step S40. Generating means that the first query is transformed into two queries, namely a second and a third query. They may be generated in the same time, or one after the other, no matter the second is generated before the third one or the third request is generated before the second one.
- The second query is generated (S50) by the server and comprises the first query of step S40 and an additional constraint that is to return only one or more observation of the first set.
- The third query is generated (S52) by the server and comprises the first query of step S40 and an additional constraint that is to return only one or more observation of the second set.
- As a result of the generation of the second and third queries, the index is queried using both the second and third generated queries.
- The queried index therefore returns two results (step S60). The first result is provided by the second query and comprises the available observations of the first set that match the query. Thus, a response to the second query provides available tagged data of the first set: this allows to represent the density of tagged data. The second result is provided by the third query and comprises the available observations of the second set that match the query. Thus, the query on synthetic data allows to represent samples representative of any possible observation.
- From these two results, a comparison can be performed between the two results. The comparison may be performed for each neighborhood of N observations. Within this neighborhood, one counts the number of observations of the first set: the higher the number of observations of the first set, the better the model. On the contrary, the lower the number of observations of the first set, the worse the model. If K is the number of observations of the first set in the neighborhood, N-K the number of observations of the second set, K/N is the density of the natural observations in the neighborhood. The percentile of the density of natural observations in a neighborhood of size N around a given new observation (compared to the density of natural observations in other neighborhoods of size N) is a new metric that describes the relative potential divergence of the model for the new observation. It can serve as a measure of relative confidence in the prediction provided by the model. The percentile at which one chooses to rely or not rely on the model depends on the cost of divergence and the expected quality of the alternative fallback decision systems, among other things.
- The steps S10, S20, S30, S50, S52, S60 and S70 are preferable carried out by a server that stores the first set of observations. The step S40 is typically performed on a client that is connected to the server. Both the server and the client can be a system as represented in reference to
FIG. 4 . It is to be understood that other implementations may be contemplated. For instance, the steps S50 and S52 may be performed on the client side instead of the server side. In another alternative, the comparison may be performed on the client.
Claims (15)
- Computer-implemented method for assessing a potential divergence of an outcome predicted by a machine learning system, comprising:- training (S10) a model on a first set of observations, each observation being associated with a target value;- generating a second set of observations;- applying (S20) the trained model to the second set thereby obtaining a target value associated with each observation of the second set;- indexing (S30) the first and second sets of observations and their associated target values into an index;- receiving (S40) a first query allowing a selection of a subset of the first and second sets of observations;- generating (S50) a second query that comprises the first query and an additional constraint that is to return only observation(s) of the first set;- generating (S52) a third query that comprises the first query and an additional constraint that is to return only observation(s) of the second set;- querying the index using the second and third queries; and- returning (S60) a response to the second and third queries.
- The computer-implemented method of claim 1, wherein each observation of the first set of observations is associated with one or more variables, each variable being associated with a value.
- The computer-implemented method of claim 2, further comprising, before the step of training a model on a first set of observations:- defining the one or more variables of the first set on continuous segments or on discrete sets.
- The computer-implemented method of claim 3, wherein the random generation of the second set of observations comprises:- associating, on each variable of the first set, a probability distribution.
- The computer-implemented method of claim 4, wherein the probability distribution is determined according to the said each variable of the first set.
- The computer-implemented method of one of claims 3 to 5, wherein the probability distribution function is a uniform probability distribution.
- The computer-implemented method of one of claims 3 to 6, further comprising:- generating values across the continuous segments or on discrete sets by using at least one random variate generator;- computing combinations of the values obtained from the at least one random variate generator.
- The computer-implemented method of claim 7, further comprising:- determining dependencies between the variables;- removing combinations among the computed combinations that do not satisfy the determined dependencies.
- The computer-implemented method of claim 7 or 8, wherein computing combinations of the random variates comprises computing all the combinations of the random variates.
- The computer-implemented method of one of claims 1 to 9, wherein the first set of observations is stored on a first matrix and second set of observations is stored on a second matrix.
- The computer-implemented method of claims 1 to 10 wherein the second set of observations is marked as being randomly generated.
- The computer-implemented method of claim 11, wherein, at the step of indexing, the indexed second set of observations is associated with a metadata indicating that the observations of the second set have been randomly generated.
- The computer-implemented method of one of claims 1 to 12, further comprising, before the step of returning:- comparing the results of the second and third queries.
- A computer program comprising instructions for performing the method of any of claims 1 to 13.
- A system comprising a processor coupled to a memory, the memory having recorded thereon the computer program of claim 14.
Priority Applications (4)
| Application Number | Priority Date | Filing Date | Title |
|---|---|---|---|
| EP15307193.1A EP3188038B1 (en) | 2015-12-31 | 2015-12-31 | Evaluation of a training set |
| JP2016255137A JP6888953B2 (en) | 2015-12-31 | 2016-12-28 | Training set evaluation |
| CN201611273107.9A CN107016400B (en) | 2015-12-31 | 2016-12-30 | Evaluation of training set |
| US15/395,261 US11176481B2 (en) | 2015-12-31 | 2016-12-30 | Evaluation of a training set |
Applications Claiming Priority (1)
| Application Number | Priority Date | Filing Date | Title |
|---|---|---|---|
| EP15307193.1A EP3188038B1 (en) | 2015-12-31 | 2015-12-31 | Evaluation of a training set |
Publications (2)
| Publication Number | Publication Date |
|---|---|
| EP3188038A1 true EP3188038A1 (en) | 2017-07-05 |
| EP3188038B1 EP3188038B1 (en) | 2020-11-04 |
Family
ID=55699281
Family Applications (1)
| Application Number | Title | Priority Date | Filing Date |
|---|---|---|---|
| EP15307193.1A Active EP3188038B1 (en) | 2015-12-31 | 2015-12-31 | Evaluation of a training set |
Country Status (4)
| Country | Link |
|---|---|
| US (1) | US11176481B2 (en) |
| EP (1) | EP3188038B1 (en) |
| JP (1) | JP6888953B2 (en) |
| CN (1) | CN107016400B (en) |
Cited By (1)
| Publication number | Priority date | Publication date | Assignee | Title |
|---|---|---|---|---|
| CN113553044A (en) * | 2021-07-20 | 2021-10-26 | 同济大学 | Generation method of time automaton model combining PAC learning theory and active learning |
Families Citing this family (10)
| Publication number | Priority date | Publication date | Assignee | Title |
|---|---|---|---|---|
| JP7378112B2 (en) * | 2018-04-10 | 2023-11-13 | 株式会社ライナロジクス | Information processing device and information processing program |
| KR102075715B1 (en) * | 2018-05-29 | 2020-02-10 | 국방과학연구소 | Apparatus for classifying attack groups and method therefor |
| KR102357475B1 (en) * | 2018-11-14 | 2022-02-04 | 가톨릭대학교 산학협력단 | Energy Theft Detecting System And Method Using Improved GBTD Algorithm |
| US11562225B2 (en) | 2018-11-26 | 2023-01-24 | International Business Machines Corporation | Automatic monitoring and adjustment of machine learning model training |
| JP7268402B2 (en) * | 2019-02-28 | 2023-05-08 | 富士通株式会社 | Extraction program, extraction method and extraction device |
| US12585968B2 (en) * | 2020-04-09 | 2026-03-24 | Royal Bank Of Canada | System and method for testing machine learning |
| CN112418304B (en) * | 2020-11-19 | 2021-10-29 | 北京云从科技有限公司 | OCR (optical character recognition) model training method, system and device |
| JP2023061477A (en) * | 2021-10-20 | 2023-05-02 | 富士通株式会社 | Program, data processing method, and data processing device |
| US20230196091A1 (en) * | 2021-12-21 | 2023-06-22 | Paypal, Inc. | Feature deprecation architectures for neural networks |
| US11921692B1 (en) * | 2022-09-16 | 2024-03-05 | Capital One Services, Llc | Computer-based systems configured for automatically updating a database based on an initiation of a dynamic machine-learning verification and methods of use thereof |
Citations (3)
| Publication number | Priority date | Publication date | Assignee | Title |
|---|---|---|---|---|
| US20120284213A1 (en) * | 2011-05-04 | 2012-11-08 | Google Inc. | Predictive Analytical Modeling Data Selection |
| US20150006442A1 (en) * | 2013-06-28 | 2015-01-01 | Linkedln Corporation | Facilitating machine learning in an online social network |
| EP2940606A1 (en) * | 2014-05-02 | 2015-11-04 | Google, Inc. | Searchable index |
Family Cites Families (72)
| Publication number | Priority date | Publication date | Assignee | Title |
|---|---|---|---|---|
| US722127A (en) | 1901-12-02 | 1903-03-03 | Doctor Franklin Morgan | Steam-heating plant. |
| US5742806A (en) * | 1994-01-31 | 1998-04-21 | Sun Microsystems, Inc. | Apparatus and method for decomposing database queries for database management system including multiprocessor digital data processing system |
| WO2002006953A1 (en) * | 2000-07-06 | 2002-01-24 | Yamatake Corporation | Soft sensor device and device for evaluating the same |
| JP3946562B2 (en) | 2002-04-08 | 2007-07-18 | 本田技研工業株式会社 | Behavior control apparatus and method |
| JP2004326200A (en) | 2003-04-21 | 2004-11-18 | Mitsubishi Heavy Ind Ltd | Automatic machine, and system and method for automatically operating same |
| US7197497B2 (en) * | 2003-04-25 | 2007-03-27 | Overture Services, Inc. | Method and apparatus for machine learning a document relevance function |
| US7231375B2 (en) * | 2003-10-10 | 2007-06-12 | Microsoft Corporation | Computer aided query to task mapping |
| US7664734B2 (en) * | 2004-03-31 | 2010-02-16 | Google Inc. | Systems and methods for generating multiple implicit search queries |
| US7707220B2 (en) * | 2004-07-06 | 2010-04-27 | Icosystem Corporation | Methods and apparatus for interactive searching techniques |
| JP2006252333A (en) | 2005-03-11 | 2006-09-21 | Nara Institute Of Science & Technology | Data processing method, data processing apparatus and program thereof |
| KR100544514B1 (en) * | 2005-06-27 | 2006-01-24 | 엔에이치엔(주) | Method and system for determining search query relevance |
| JP2007041950A (en) | 2005-08-04 | 2007-02-15 | Sharp Corp | Production simulation management device |
| US7599893B2 (en) * | 2005-10-13 | 2009-10-06 | Aureon Laboratories, Inc. | Methods and systems for feature selection in machine learning based on feature contribution and model fitness |
| US7818315B2 (en) * | 2006-03-13 | 2010-10-19 | Microsoft Corporation | Re-ranking search results based on query log |
| US7262722B1 (en) * | 2006-06-26 | 2007-08-28 | Intel Corporation | Hardware-based CABAC decoder with parallel binary arithmetic decoding |
| US7496568B2 (en) | 2006-11-30 | 2009-02-24 | International Business Machines Corporation | Efficient multifaceted search in information retrieval systems |
| US20100030647A1 (en) | 2008-07-31 | 2010-02-04 | Yahoo! Inc. | Advertisement selection for internet search and content pages |
| US8671093B2 (en) * | 2008-11-18 | 2014-03-11 | Yahoo! Inc. | Click model for search rankings |
| US8359282B2 (en) * | 2009-01-12 | 2013-01-22 | Nec Laboratories America, Inc. | Supervised semantic indexing and its extensions |
| CN101860449B (en) * | 2009-04-09 | 2014-02-19 | 华为技术有限公司 | Data query method, device and system |
| US20100306235A1 (en) * | 2009-05-28 | 2010-12-02 | Yahoo! Inc. | Real-Time Detection of Emerging Web Search Queries |
| US8234295B2 (en) * | 2009-06-03 | 2012-07-31 | International Business Machines Corporation | Managing uncertain data using Monte Carlo techniques |
| US9684741B2 (en) * | 2009-06-05 | 2017-06-20 | Microsoft Technology Licensing, Llc | Presenting search results according to query domains |
| WO2010144608A1 (en) * | 2009-06-10 | 2010-12-16 | Ab Initio Technology Llc | Generating test data |
| CN101840430B (en) * | 2010-04-28 | 2012-02-29 | 北京握奇数据系统有限公司 | Intelligent card database multi-list operation method and device |
| US20110295897A1 (en) * | 2010-06-01 | 2011-12-01 | Microsoft Corporation | Query correction probability based on query-correction pairs |
| KR20120010433A (en) * | 2010-07-26 | 2012-02-03 | 엘지전자 주식회사 | Operation method of video display device |
| US8498950B2 (en) * | 2010-10-15 | 2013-07-30 | Yahoo! Inc. | System for training classifiers in multiple categories through active learning |
| US8738549B2 (en) * | 2010-12-21 | 2014-05-27 | International Business Machines Corporation | Predictive modeling |
| DE102011076780B4 (en) * | 2011-05-31 | 2021-12-09 | Airbus Operations Gmbh | Method and device for condition monitoring, computer program product |
| US8762299B1 (en) | 2011-06-27 | 2014-06-24 | Google Inc. | Customized predictive analytical model training |
| US8843427B1 (en) | 2011-07-01 | 2014-09-23 | Google Inc. | Predictive modeling accuracy |
| FR2978585B1 (en) * | 2011-07-26 | 2013-08-16 | Airbus Operations Sas | METHOD AND DEVICE FOR AUTOMATICALLY ESTIMATING A FLIGHT PARAMETER VECTOR OF AN AIRCRAFT, AND METHOD AND ASSEMBLY FOR DETECTING FAILURE AFFECTING SUCH A VECTOR |
| US8768866B2 (en) | 2011-10-21 | 2014-07-01 | Sas Institute Inc. | Computer-implemented systems and methods for forecasting and estimation using grid regression |
| US8538946B1 (en) * | 2011-10-28 | 2013-09-17 | Google Inc. | Creating model or list to identify queries |
| US9147129B2 (en) * | 2011-11-18 | 2015-09-29 | Honeywell International Inc. | Score fusion and training data recycling for video classification |
| US9298693B2 (en) * | 2011-12-16 | 2016-03-29 | Microsoft Technology Licensing, Llc | Rule-based generation of candidate string transformations |
| JP2013143009A (en) | 2012-01-11 | 2013-07-22 | Hitachi Ltd | Equipment state monitoring method and device using the same |
| US8983991B2 (en) * | 2012-07-27 | 2015-03-17 | Facebook, Inc. | Generating logical expressions for search queries |
| US8756241B1 (en) * | 2012-08-06 | 2014-06-17 | Google Inc. | Determining rewrite similarity scores |
| US20140046879A1 (en) | 2012-08-13 | 2014-02-13 | Predixion Software, Inc. | Machine learning semantic model |
| US9524473B2 (en) | 2012-08-31 | 2016-12-20 | Nutonian, Inc. | System and method for auto-query generation |
| EP2895970B1 (en) | 2012-09-14 | 2018-11-07 | InteraXon Inc. | Systems and methods for collecting, analyzing, and sharing bio-signal and non-bio-signal data |
| JP5983333B2 (en) * | 2012-11-13 | 2016-08-31 | 富士通株式会社 | Search processing method, data generation method, and information processing apparatus |
| US10013477B2 (en) * | 2012-11-19 | 2018-07-03 | The Penn State Research Foundation | Accelerated discrete distribution clustering under wasserstein distance |
| US20140188768A1 (en) | 2012-12-28 | 2014-07-03 | General Electric Company | System and Method For Creating Customized Model Ensembles On Demand |
| EP2750056A1 (en) * | 2012-12-31 | 2014-07-02 | Facebook, Inc. | Structuring ambiguous structured search queries on online social networks |
| US9135567B2 (en) * | 2013-01-18 | 2015-09-15 | International Business Machines Corporation | Transductive lasso for high-dimensional data regression problems |
| US20140358828A1 (en) * | 2013-05-29 | 2014-12-04 | Purepredictive, Inc. | Machine learning generated action plan |
| US20150032609A1 (en) * | 2013-07-29 | 2015-01-29 | International Business Machines Corporation | Correlation of data sets using determined data types |
| CN104516910B (en) | 2013-09-26 | 2018-01-12 | Sap欧洲公司 | The content recommendation in client server environment |
| US20160239756A1 (en) * | 2013-10-10 | 2016-08-18 | Ge Intelligent Platforms, Inc. | Correlation and annotation of time series data sequences to extracted or existing discrete data |
| JP6109037B2 (en) * | 2013-10-23 | 2017-04-05 | 本田技研工業株式会社 | Time-series data prediction apparatus, time-series data prediction method, and program |
| CN104636389B (en) * | 2013-11-14 | 2018-03-27 | 博雅网络游戏开发(深圳)有限公司 | Realize the method and system of Hbase database real-time queries |
| CN104679771B (en) | 2013-11-29 | 2018-09-18 | 阿里巴巴集团控股有限公司 | A kind of individuation data searching method and device |
| US10628748B2 (en) * | 2013-12-03 | 2020-04-21 | University Of Massachusetts | System and methods for predicting probable relationships between items |
| CN104765731B (en) * | 2014-01-02 | 2018-05-18 | 国际商业机器公司 | Database inquiry optimization method and apparatus |
| US20150242760A1 (en) | 2014-02-21 | 2015-08-27 | Microsoft Corporation | Personalized Machine Learning System |
| CN105095614A (en) * | 2014-04-18 | 2015-11-25 | 国际商业机器公司 | Method and device for updating prediction model |
| JP6444494B2 (en) * | 2014-05-23 | 2018-12-26 | データロボット, インコーポレイテッド | Systems and techniques for predictive data analysis |
| US10963810B2 (en) * | 2014-06-30 | 2021-03-30 | Amazon Technologies, Inc. | Efficient duplicate detection for machine learning data sets |
| CN104239212B (en) * | 2014-09-28 | 2017-04-12 | 北京国双科技有限公司 | Query method and device of test case and establishment method and device of test case |
| US9630318B2 (en) * | 2014-10-02 | 2017-04-25 | Brain Corporation | Feature detection apparatus and methods for training of robotic navigation |
| US9818242B2 (en) * | 2014-12-16 | 2017-11-14 | University Of Southern California | Gas turbine engine anomaly detections and fault identifications |
| US10176253B2 (en) * | 2015-01-28 | 2019-01-08 | International Business Machines Corporation | Fusion of cluster labeling algorithms by analyzing sub-clusters |
| FR3032273B1 (en) * | 2015-01-30 | 2019-06-21 | Safran Aircraft Engines | METHOD, SYSTEM AND COMPUTER PROGRAM FOR LEARNING PHASE OF ACOUSTIC OR VIBRATORY ANALYSIS OF A MACHINE |
| US9135559B1 (en) * | 2015-03-20 | 2015-09-15 | TappingStone Inc. | Methods and systems for predictive engine evaluation, tuning, and replay of engine performance |
| CA2993824A1 (en) * | 2015-07-29 | 2017-02-02 | Illinois Tool Works Inc. | System and method to facilitate welding software as a service |
| US9865101B2 (en) * | 2015-10-30 | 2018-01-09 | Wipro Limited | Methods for detecting one or more aircraft anomalies and devices thereof |
| US20170124152A1 (en) * | 2015-11-02 | 2017-05-04 | LeapYear Technologies, Inc. | Differentially private processing and database storage |
| US10839302B2 (en) * | 2015-11-24 | 2020-11-17 | The Research Foundation For The State University Of New York | Approximate value iteration with complex returns by bounding |
| US20170185913A1 (en) * | 2015-12-29 | 2017-06-29 | International Business Machines Corporation | System and method for comparing training data with test data |
-
2015
- 2015-12-31 EP EP15307193.1A patent/EP3188038B1/en active Active
-
2016
- 2016-12-28 JP JP2016255137A patent/JP6888953B2/en active Active
- 2016-12-30 US US15/395,261 patent/US11176481B2/en active Active
- 2016-12-30 CN CN201611273107.9A patent/CN107016400B/en active Active
Patent Citations (3)
| Publication number | Priority date | Publication date | Assignee | Title |
|---|---|---|---|---|
| US20120284213A1 (en) * | 2011-05-04 | 2012-11-08 | Google Inc. | Predictive Analytical Modeling Data Selection |
| US20150006442A1 (en) * | 2013-06-28 | 2015-01-01 | Linkedln Corporation | Facilitating machine learning in an online social network |
| EP2940606A1 (en) * | 2014-05-02 | 2015-11-04 | Google, Inc. | Searchable index |
Non-Patent Citations (2)
| Title |
|---|
| KOHAVI, RON.: "A study of cross-validation and bootstrap for accuracy estimation and model selection", IJCAI, vol. 14, no. 2, 1995 |
| STEFANSSON; ADOALBJORN; N. KONCAR; ANTONIA J. JONES.: "A note on the gamma test", NEURAL COMPUTING & APPLICATIONS, vol. 5.3, 1997, pages 131 - 133 |
Cited By (2)
| Publication number | Priority date | Publication date | Assignee | Title |
|---|---|---|---|---|
| CN113553044A (en) * | 2021-07-20 | 2021-10-26 | 同济大学 | Generation method of time automaton model combining PAC learning theory and active learning |
| CN113553044B (en) * | 2021-07-20 | 2022-06-21 | 同济大学 | A Generating Method of Temporal Automata Model Combining PAC Learning Theory and Active Learning |
Also Published As
| Publication number | Publication date |
|---|---|
| CN107016400B (en) | 2023-01-24 |
| EP3188038B1 (en) | 2020-11-04 |
| US20170193052A1 (en) | 2017-07-06 |
| JP2017126329A (en) | 2017-07-20 |
| CN107016400A (en) | 2017-08-04 |
| JP6888953B2 (en) | 2021-06-18 |
| US11176481B2 (en) | 2021-11-16 |
Similar Documents
| Publication | Publication Date | Title |
|---|---|---|
| US11176481B2 (en) | Evaluation of a training set | |
| US9026550B2 (en) | Temporal pattern matching in large collections of log messages | |
| EP3188040B1 (en) | Retrieval of outcomes of precomputed models | |
| US8145623B1 (en) | Query ranking based on query clustering and categorization | |
| JP7495777B2 (en) | Predicting events that affect physical systems | |
| JP6299596B2 (en) | Query similarity evaluation system, evaluation method, and program | |
| US20090327266A1 (en) | Index Optimization for Ranking Using a Linear Model | |
| Hamed et al. | Fuel consumption prediction model using machine learning | |
| CN106294595A (en) | A kind of document storage, search method and device | |
| JP2017151970A (en) | Method and apparatus for processing service requests | |
| US20100042610A1 (en) | Rank documents based on popularity of key metadata | |
| CN103793439A (en) | Real-time retrieval information acquisition method, real-time retrieval device, and real-time retrieval server | |
| Shu et al. | Metamodel-based design optimization employing a novel sequential sampling strategy | |
| CN111915184A (en) | Early warning method for quality of parts in automobile industry and storage medium | |
| US20170017684A1 (en) | System and method for predicate pushdown and partition pruning in a distributed database | |
| JP2005267025A (en) | Area extraction system for analysis model, method, program and program medium | |
| Girija et al. | Retrieving System Performance | |
| KR102755297B1 (en) | Apparatus and method for analyzing data contained in the database | |
| Kiseleva | Using contextual information to understand searching and browsing behavior | |
| US11741154B2 (en) | 3D clustering navigation | |
| Graening et al. | Flow field data mining based on a compact streamline representation | |
| Fu et al. | SQE-gan: A supervised query expansion scheme via GAN | |
| CN111339127A (en) | Patent database processing method and device for continuous iterative retrieval | |
| JP7200577B2 (en) | Information processing device, information processing system, information processing method, and program. | |
| Heidari et al. | A presmooth estimator of unbiased distributions with length-biased data |
Legal Events
| Date | Code | Title | Description |
|---|---|---|---|
| PUAI | Public reference made under article 153(3) epc to a published international application that has entered the european phase |
Free format text: ORIGINAL CODE: 0009012 |
|
| STAA | Information on the status of an ep patent application or granted ep patent |
Free format text: STATUS: THE APPLICATION HAS BEEN PUBLISHED |
|
| AK | Designated contracting states |
Kind code of ref document: A1 Designated state(s): AL AT BE BG CH CY CZ DE DK EE ES FI FR GB GR HR HU IE IS IT LI LT LU LV MC MK MT NL NO PL PT RO RS SE SI SK SM TR |
|
| AX | Request for extension of the european patent |
Extension state: BA ME |
|
| STAA | Information on the status of an ep patent application or granted ep patent |
Free format text: STATUS: REQUEST FOR EXAMINATION WAS MADE |
|
| 17P | Request for examination filed |
Effective date: 20180105 |
|
| RBV | Designated contracting states (corrected) |
Designated state(s): AL AT BE BG CH CY CZ DE DK EE ES FI FR GB GR HR HU IE IS IT LI LT LU LV MC MK MT NL NO PL PT RO RS SE SI SK SM TR |
|
| STAA | Information on the status of an ep patent application or granted ep patent |
Free format text: STATUS: EXAMINATION IS IN PROGRESS |
|
| 17Q | First examination report despatched |
Effective date: 20190321 |
|
| REG | Reference to a national code |
Ref country code: DE Ref legal event code: R079 Ref document number: 602015061435 Country of ref document: DE Free format text: PREVIOUS MAIN CLASS: G06F0017300000 Ipc: G06F0016350000 |
|
| GRAP | Despatch of communication of intention to grant a patent |
Free format text: ORIGINAL CODE: EPIDOSNIGR1 |
|
| STAA | Information on the status of an ep patent application or granted ep patent |
Free format text: STATUS: GRANT OF PATENT IS INTENDED |
|
| RIC1 | Information provided on ipc code assigned before grant |
Ipc: G06F 16/2455 20190101ALI20200430BHEP Ipc: G06N 20/00 20190101ALI20200430BHEP Ipc: G06F 16/35 20190101AFI20200430BHEP |
|
| INTG | Intention to grant announced |
Effective date: 20200514 |
|
| GRAS | Grant fee paid |
Free format text: ORIGINAL CODE: EPIDOSNIGR3 |
|
| GRAA | (expected) grant |
Free format text: ORIGINAL CODE: 0009210 |
|
| STAA | Information on the status of an ep patent application or granted ep patent |
Free format text: STATUS: THE PATENT HAS BEEN GRANTED |
|
| AK | Designated contracting states |
Kind code of ref document: B1 Designated state(s): AL AT BE BG CH CY CZ DE DK EE ES FI FR GB GR HR HU IE IS IT LI LT LU LV MC MK MT NL NO PL PT RO RS SE SI SK SM TR |
|
| REG | Reference to a national code |
Ref country code: GB Ref legal event code: FG4D |
|
| REG | Reference to a national code |
Ref country code: CH Ref legal event code: EP |
|
| REG | Reference to a national code |
Ref country code: AT Ref legal event code: REF Ref document number: 1331712 Country of ref document: AT Kind code of ref document: T Effective date: 20201115 |
|
| REG | Reference to a national code |
Ref country code: DE Ref legal event code: R096 Ref document number: 602015061435 Country of ref document: DE |
|
| REG | Reference to a national code |
Ref country code: IE Ref legal event code: FG4D |
|
| REG | Reference to a national code |
Ref country code: SE Ref legal event code: TRGR |
|
| REG | Reference to a national code |
Ref country code: NL Ref legal event code: MP Effective date: 20201104 |
|
| REG | Reference to a national code |
Ref country code: AT Ref legal event code: MK05 Ref document number: 1331712 Country of ref document: AT Kind code of ref document: T Effective date: 20201104 |
|
| PG25 | Lapsed in a contracting state [announced via postgrant information from national office to epo] |
Ref country code: GR Free format text: LAPSE BECAUSE OF FAILURE TO SUBMIT A TRANSLATION OF THE DESCRIPTION OR TO PAY THE FEE WITHIN THE PRESCRIBED TIME-LIMIT Effective date: 20210205 Ref country code: NO Free format text: LAPSE BECAUSE OF FAILURE TO SUBMIT A TRANSLATION OF THE DESCRIPTION OR TO PAY THE FEE WITHIN THE PRESCRIBED TIME-LIMIT Effective date: 20210204 Ref country code: PT Free format text: LAPSE BECAUSE OF FAILURE TO SUBMIT A TRANSLATION OF THE DESCRIPTION OR TO PAY THE FEE WITHIN THE PRESCRIBED TIME-LIMIT Effective date: 20210304 Ref country code: FI Free format text: LAPSE BECAUSE OF FAILURE TO SUBMIT A TRANSLATION OF THE DESCRIPTION OR TO PAY THE FEE WITHIN THE PRESCRIBED TIME-LIMIT Effective date: 20201104 Ref country code: RS Free format text: LAPSE BECAUSE OF FAILURE TO SUBMIT A TRANSLATION OF THE DESCRIPTION OR TO PAY THE FEE WITHIN THE PRESCRIBED TIME-LIMIT Effective date: 20201104 |
|
| PG25 | Lapsed in a contracting state [announced via postgrant information from national office to epo] |
Ref country code: LV Free format text: LAPSE BECAUSE OF FAILURE TO SUBMIT A TRANSLATION OF THE DESCRIPTION OR TO PAY THE FEE WITHIN THE PRESCRIBED TIME-LIMIT Effective date: 20201104 Ref country code: IS Free format text: LAPSE BECAUSE OF FAILURE TO SUBMIT A TRANSLATION OF THE DESCRIPTION OR TO PAY THE FEE WITHIN THE PRESCRIBED TIME-LIMIT Effective date: 20210304 Ref country code: PL Free format text: LAPSE BECAUSE OF FAILURE TO SUBMIT A TRANSLATION OF THE DESCRIPTION OR TO PAY THE FEE WITHIN THE PRESCRIBED TIME-LIMIT Effective date: 20201104 Ref country code: BG Free format text: LAPSE BECAUSE OF FAILURE TO SUBMIT A TRANSLATION OF THE DESCRIPTION OR TO PAY THE FEE WITHIN THE PRESCRIBED TIME-LIMIT Effective date: 20210204 Ref country code: AT Free format text: LAPSE BECAUSE OF FAILURE TO SUBMIT A TRANSLATION OF THE DESCRIPTION OR TO PAY THE FEE WITHIN THE PRESCRIBED TIME-LIMIT Effective date: 20201104 Ref country code: ES Free format text: LAPSE BECAUSE OF FAILURE TO SUBMIT A TRANSLATION OF THE DESCRIPTION OR TO PAY THE FEE WITHIN THE PRESCRIBED TIME-LIMIT Effective date: 20201104 |
|
| REG | Reference to a national code |
Ref country code: LT Ref legal event code: MG9D |
|
| PG25 | Lapsed in a contracting state [announced via postgrant information from national office to epo] |
Ref country code: HR Free format text: LAPSE BECAUSE OF FAILURE TO SUBMIT A TRANSLATION OF THE DESCRIPTION OR TO PAY THE FEE WITHIN THE PRESCRIBED TIME-LIMIT Effective date: 20201104 |
|
| PG25 | Lapsed in a contracting state [announced via postgrant information from national office to epo] |
Ref country code: SK Free format text: LAPSE BECAUSE OF FAILURE TO SUBMIT A TRANSLATION OF THE DESCRIPTION OR TO PAY THE FEE WITHIN THE PRESCRIBED TIME-LIMIT Effective date: 20201104 Ref country code: RO Free format text: LAPSE BECAUSE OF FAILURE TO SUBMIT A TRANSLATION OF THE DESCRIPTION OR TO PAY THE FEE WITHIN THE PRESCRIBED TIME-LIMIT Effective date: 20201104 Ref country code: LT Free format text: LAPSE BECAUSE OF FAILURE TO SUBMIT A TRANSLATION OF THE DESCRIPTION OR TO PAY THE FEE WITHIN THE PRESCRIBED TIME-LIMIT Effective date: 20201104 Ref country code: SM Free format text: LAPSE BECAUSE OF FAILURE TO SUBMIT A TRANSLATION OF THE DESCRIPTION OR TO PAY THE FEE WITHIN THE PRESCRIBED TIME-LIMIT Effective date: 20201104 Ref country code: EE Free format text: LAPSE BECAUSE OF FAILURE TO SUBMIT A TRANSLATION OF THE DESCRIPTION OR TO PAY THE FEE WITHIN THE PRESCRIBED TIME-LIMIT Effective date: 20201104 Ref country code: CZ Free format text: LAPSE BECAUSE OF FAILURE TO SUBMIT A TRANSLATION OF THE DESCRIPTION OR TO PAY THE FEE WITHIN THE PRESCRIBED TIME-LIMIT Effective date: 20201104 |
|
| REG | Reference to a national code |
Ref country code: CH Ref legal event code: PL |
|
| REG | Reference to a national code |
Ref country code: DE Ref legal event code: R097 Ref document number: 602015061435 Country of ref document: DE |
|
| PG25 | Lapsed in a contracting state [announced via postgrant information from national office to epo] |
Ref country code: DK Free format text: LAPSE BECAUSE OF FAILURE TO SUBMIT A TRANSLATION OF THE DESCRIPTION OR TO PAY THE FEE WITHIN THE PRESCRIBED TIME-LIMIT Effective date: 20201104 Ref country code: MC Free format text: LAPSE BECAUSE OF FAILURE TO SUBMIT A TRANSLATION OF THE DESCRIPTION OR TO PAY THE FEE WITHIN THE PRESCRIBED TIME-LIMIT Effective date: 20201104 |
|
| REG | Reference to a national code |
Ref country code: BE Ref legal event code: MM Effective date: 20201231 |
|
| PLBE | No opposition filed within time limit |
Free format text: ORIGINAL CODE: 0009261 |
|
| STAA | Information on the status of an ep patent application or granted ep patent |
Free format text: STATUS: NO OPPOSITION FILED WITHIN TIME LIMIT |
|
| 26N | No opposition filed |
Effective date: 20210805 |
|
| PG25 | Lapsed in a contracting state [announced via postgrant information from national office to epo] |
Ref country code: NL Free format text: LAPSE BECAUSE OF FAILURE TO SUBMIT A TRANSLATION OF THE DESCRIPTION OR TO PAY THE FEE WITHIN THE PRESCRIBED TIME-LIMIT Effective date: 20201104 Ref country code: LU Free format text: LAPSE BECAUSE OF NON-PAYMENT OF DUE FEES Effective date: 20201231 Ref country code: AL Free format text: LAPSE BECAUSE OF FAILURE TO SUBMIT A TRANSLATION OF THE DESCRIPTION OR TO PAY THE FEE WITHIN THE PRESCRIBED TIME-LIMIT Effective date: 20201104 Ref country code: IE Free format text: LAPSE BECAUSE OF NON-PAYMENT OF DUE FEES Effective date: 20201231 |
|
| PG25 | Lapsed in a contracting state [announced via postgrant information from national office to epo] |
Ref country code: SI Free format text: LAPSE BECAUSE OF FAILURE TO SUBMIT A TRANSLATION OF THE DESCRIPTION OR TO PAY THE FEE WITHIN THE PRESCRIBED TIME-LIMIT Effective date: 20201104 Ref country code: CH Free format text: LAPSE BECAUSE OF NON-PAYMENT OF DUE FEES Effective date: 20201231 Ref country code: LI Free format text: LAPSE BECAUSE OF NON-PAYMENT OF DUE FEES Effective date: 20201231 |
|
| PG25 | Lapsed in a contracting state [announced via postgrant information from national office to epo] |
Ref country code: IS Free format text: LAPSE BECAUSE OF FAILURE TO SUBMIT A TRANSLATION OF THE DESCRIPTION OR TO PAY THE FEE WITHIN THE PRESCRIBED TIME-LIMIT Effective date: 20210304 Ref country code: TR Free format text: LAPSE BECAUSE OF FAILURE TO SUBMIT A TRANSLATION OF THE DESCRIPTION OR TO PAY THE FEE WITHIN THE PRESCRIBED TIME-LIMIT Effective date: 20201104 Ref country code: MT Free format text: LAPSE BECAUSE OF FAILURE TO SUBMIT A TRANSLATION OF THE DESCRIPTION OR TO PAY THE FEE WITHIN THE PRESCRIBED TIME-LIMIT Effective date: 20201104 Ref country code: CY Free format text: LAPSE BECAUSE OF FAILURE TO SUBMIT A TRANSLATION OF THE DESCRIPTION OR TO PAY THE FEE WITHIN THE PRESCRIBED TIME-LIMIT Effective date: 20201104 |
|
| PG25 | Lapsed in a contracting state [announced via postgrant information from national office to epo] |
Ref country code: MK Free format text: LAPSE BECAUSE OF FAILURE TO SUBMIT A TRANSLATION OF THE DESCRIPTION OR TO PAY THE FEE WITHIN THE PRESCRIBED TIME-LIMIT Effective date: 20201104 |
|
| PG25 | Lapsed in a contracting state [announced via postgrant information from national office to epo] |
Ref country code: BE Free format text: LAPSE BECAUSE OF NON-PAYMENT OF DUE FEES Effective date: 20201231 |
|
| P01 | Opt-out of the competence of the unified patent court (upc) registered |
Effective date: 20230527 |
|
| PGFP | Annual fee paid to national office [announced via postgrant information from national office to epo] |
Ref country code: DE Payment date: 20251211 Year of fee payment: 11 |
|
| PGFP | Annual fee paid to national office [announced via postgrant information from national office to epo] |
Ref country code: GB Payment date: 20251219 Year of fee payment: 11 |
|
| PGFP | Annual fee paid to national office [announced via postgrant information from national office to epo] |
Ref country code: IT Payment date: 20251223 Year of fee payment: 11 |
|
| PGFP | Annual fee paid to national office [announced via postgrant information from national office to epo] |
Ref country code: FR Payment date: 20251223 Year of fee payment: 11 |
|
| PGFP | Annual fee paid to national office [announced via postgrant information from national office to epo] |
Ref country code: SE Payment date: 20251219 Year of fee payment: 11 |