EP3153883A1 - Detection apparatus, underwater detection apparatus, radar apparatus, and detection method - Google Patents
Detection apparatus, underwater detection apparatus, radar apparatus, and detection method Download PDFInfo
- Publication number
- EP3153883A1 EP3153883A1 EP16192088.9A EP16192088A EP3153883A1 EP 3153883 A1 EP3153883 A1 EP 3153883A1 EP 16192088 A EP16192088 A EP 16192088A EP 3153883 A1 EP3153883 A1 EP 3153883A1
- Authority
- EP
- European Patent Office
- Prior art keywords
- echo intensity
- reception signal
- fish
- high frequency
- value
- Prior art date
- Legal status (The legal status is an assumption and is not a legal conclusion. Google has not performed a legal analysis and makes no representation as to the accuracy of the status listed.)
- Granted
Links
Images







Classifications
-
- G—PHYSICS
- G01—MEASURING; TESTING
- G01S—RADIO DIRECTION-FINDING; RADIO NAVIGATION; DETERMINING DISTANCE OR VELOCITY BY USE OF RADIO WAVES; LOCATING OR PRESENCE-DETECTING BY USE OF THE REFLECTION OR RERADIATION OF RADIO WAVES; ANALOGOUS ARRANGEMENTS USING OTHER WAVES
- G01S13/00—Systems using the reflection or reradiation of radio waves, e.g. radar systems; Analogous systems using reflection or reradiation of waves whose nature or wavelength is irrelevant or unspecified
- G01S13/88—Radar or analogous systems specially adapted for specific applications
-
- G—PHYSICS
- G01—MEASURING; TESTING
- G01S—RADIO DIRECTION-FINDING; RADIO NAVIGATION; DETERMINING DISTANCE OR VELOCITY BY USE OF RADIO WAVES; LOCATING OR PRESENCE-DETECTING BY USE OF THE REFLECTION OR RERADIATION OF RADIO WAVES; ANALOGOUS ARRANGEMENTS USING OTHER WAVES
- G01S15/00—Systems using the reflection or reradiation of acoustic waves, e.g. sonar systems
- G01S15/02—Systems using the reflection or reradiation of acoustic waves, e.g. sonar systems using reflection of acoustic waves
- G01S15/06—Systems determining the position data of a target
- G01S15/08—Systems for measuring distance only
- G01S15/10—Systems for measuring distance only using transmission of interrupted, pulse-modulated waves
- G01S15/102—Systems for measuring distance only using transmission of interrupted, pulse-modulated waves using transmission of pulses having some particular characteristics
- G01S15/108—Systems for measuring distance only using transmission of interrupted, pulse-modulated waves using transmission of pulses having some particular characteristics using more than one pulse per sonar period
-
- G—PHYSICS
- G01—MEASURING; TESTING
- G01S—RADIO DIRECTION-FINDING; RADIO NAVIGATION; DETERMINING DISTANCE OR VELOCITY BY USE OF RADIO WAVES; LOCATING OR PRESENCE-DETECTING BY USE OF THE REFLECTION OR RERADIATION OF RADIO WAVES; ANALOGOUS ARRANGEMENTS USING OTHER WAVES
- G01S15/00—Systems using the reflection or reradiation of acoustic waves, e.g. sonar systems
- G01S15/88—Sonar systems specially adapted for specific applications
- G01S15/96—Sonar systems specially adapted for specific applications for locating fish
-
- G—PHYSICS
- G01—MEASURING; TESTING
- G01S—RADIO DIRECTION-FINDING; RADIO NAVIGATION; DETERMINING DISTANCE OR VELOCITY BY USE OF RADIO WAVES; LOCATING OR PRESENCE-DETECTING BY USE OF THE REFLECTION OR RERADIATION OF RADIO WAVES; ANALOGOUS ARRANGEMENTS USING OTHER WAVES
- G01S13/00—Systems using the reflection or reradiation of radio waves, e.g. radar systems; Analogous systems using reflection or reradiation of waves whose nature or wavelength is irrelevant or unspecified
- G01S13/02—Systems using reflection of radio waves, e.g. primary radar systems; Analogous systems
- G01S13/06—Systems determining position data of a target
- G01S13/08—Systems for measuring distance only
- G01S13/10—Systems for measuring distance only using transmission of interrupted, pulse modulated waves
- G01S13/26—Systems for measuring distance only using transmission of interrupted, pulse modulated waves wherein the transmitted pulses use a frequency- or phase-modulated carrier wave
- G01S13/28—Systems for measuring distance only using transmission of interrupted, pulse modulated waves wherein the transmitted pulses use a frequency- or phase-modulated carrier wave with time compression of received pulses
-
- G—PHYSICS
- G01—MEASURING; TESTING
- G01S—RADIO DIRECTION-FINDING; RADIO NAVIGATION; DETERMINING DISTANCE OR VELOCITY BY USE OF RADIO WAVES; LOCATING OR PRESENCE-DETECTING BY USE OF THE REFLECTION OR RERADIATION OF RADIO WAVES; ANALOGOUS ARRANGEMENTS USING OTHER WAVES
- G01S13/00—Systems using the reflection or reradiation of radio waves, e.g. radar systems; Analogous systems using reflection or reradiation of waves whose nature or wavelength is irrelevant or unspecified
- G01S13/02—Systems using reflection of radio waves, e.g. primary radar systems; Analogous systems
- G01S13/06—Systems determining position data of a target
- G01S13/08—Systems for measuring distance only
- G01S13/10—Systems for measuring distance only using transmission of interrupted, pulse modulated waves
- G01S13/30—Systems for measuring distance only using transmission of interrupted, pulse modulated waves using more than one pulse per radar period
Definitions
- the present disclosure relates to a detection apparatus, an underwater detection apparatus, a radar apparatus and a detection method for determining whether a reception wave received from a target is from a target of interest.
- the present invention has particular, but not exclusive, application in the detection of aquatic species such as fish.
- Conventional detection apparatus determines whether a reception wave is from a single fish (target) based on rising and falling edges of a waveform of the reception wave.
- An object of the disclosure is to accurately detect a target.
- one aspect of the present disclosure is to provide a detection apparatus that comprises a transducer configured to transmit a transmission wave, a first echo intensity calculator configured to calculate a first echo intensity of a first reception signal generated from a reception wave resulting from a reflection of said transmission wave on a reflection object, a second echo intensity calculator configured to calculate a second echo intensity of a second reception signal generated from a reception wave resulting from a reflection of said transmission wave on said reflection object, a signal duration of said second reception signal being shorter than that of said first reception signal, and a target detector configured to detect a target from a relative intensity comparison of said first echo intensity and said second echo intensity.
- the detection apparatus further comprises a compressor configured to compress said first reception signal to generate said second reception signal, wherein said second echo intensity calculator calculates said second echo intensity from said second reception signal compressed by said compressor.
- said transducer transmits a first transmission wave and a second transmission wave as said transmission wave, a pulse width of the second transmission wave being shorter than that of the first transmission wave
- said first echo intensity calculator calculates said first echo intensity based on a reception wave resulting from a reflection of said first transmission wave on said reflection object
- said second echo intensity calculator calculates said second echo intensity based on a reception wave resulting from a reflection of said second transmission wave on said reflection object.
- said target detector detects said target on a condition that said second echo intensity is bigger than said first echo intensity.
- said target detector detects said target on a condition that said second echo intensity is bigger than said first echo intensity by at least a given value.
- said first echo intensity calculator calculates said first echo intensity by compensating for a beam width in which said transmission wave is transmitted by the transducer by reducing a value obtained based on a voltage of said first reception signal with a value obtained based on said beam width
- said second echo intensity calculator calculates said second echo intensity by compensating for said beam width in which said transmission wave is transmitted by the transducer by reducing a value obtained based on a voltage of said second reception signal with said value obtained based on said beam width.
- said first echo intensity calculator calculates said first echo intensity by compensating for a beam width in which said first transmission wave is transmitted by the transducer by reducing a value obtained based on a voltage of said first reception signal with a value obtained based on said beam width in which said first transmission wave is transmitted
- said second echo intensity calculator calculates said second echo intensity by compensating for a beam width in which said second transmission wave is transmitted by the transducer by reducing a value obtained based on a voltage of said second reception signal with a value obtained based on said beam width in which said second transmission wave is transmitted.
- said first echo intensity calculator calculates said first echo intensity by compensating for the duration of said first reception signal by reducing a value obtained based on a voltage of said first reception signal with a value obtained based on the duration of said first reception signal
- said second echo intensity calculator calculates said second echo intensity by compensating for the duration of said second reception signal by reducing a value obtained based on a voltage of said second reception signal with a value obtained based on the duration of said second reception signal.
- said first echo intensity calculator calculates volume backscattering strength of said first reception signal as said first echo intensity
- said second echo intensity calculator calculates volume backscattering strength of said second reception signal as said second echo intensity
- the detection apparatus further comprises a high frequency component reducer configured to reduce a high frequency component of said first echo intensity, wherein said target detector compares the relative intensity of said first echo intensity from which high frequency component is reduced by said high frequency component reducer and said second echo intensity.
- a high frequency component reducer configured to reduce a high frequency component of said first echo intensity
- said high frequency component reducer reduces the high frequency component of said first echo intensity by performing a moving average of the first echo intensity.
- the detection apparatus further comprises a first high frequency component reducer configured to reduce a high frequency component of said first echo intensity, a second high frequency component reducer configured to reduce a high frequency component of said second echo intensity, and a validity evaluator configured to evaluate a validity of a detection result of said target detector based on a ratio of said first echo intensity from which high frequency component is reduced by said first high frequency component reducer and said second echo intensity from which high frequency component is reduced by said second high frequency component reducer.
- a first high frequency component reducer configured to reduce a high frequency component of said first echo intensity
- a second high frequency component reducer configured to reduce a high frequency component of said second echo intensity
- a validity evaluator configured to evaluate a validity of a detection result of said target detector based on a ratio of said first echo intensity from which high frequency component is reduced by said first high frequency component reducer and said second echo intensity from which high frequency component is reduced by said second high frequency component reducer.
- one aspect of the present disclosure is to provide a detection apparatus that comprises a transducer configured to transmit a first transmission wave and a second transmission wave, a beam width of the second transmission wave being smaller than that of the first transmission wave, a first echo intensity calculator configured to calculate a first echo intensity of a first reception signal generated from a reception wave resulting from a reflection of said first transmission wave on a reflection object, a second echo intensity calculator configured to calculate a second echo intensity of a second reception signal generated from a reception wave resulting from a reflection of said second transmission wave on said reflection object, and a target detector configured to detect a target from a relative intensity comparison of said first echo intensity and said second echo intensity.
- said first echo intensity calculator calculates said first echo intensity by compensating for the beam width of said first transmission wave by reducing a value obtained based on a voltage of said first reception signal with a value obtained based on said beam width of said first transmission wave
- said second echo intensity calculator calculates said second echo intensity by compensating for the beam width of said second transmission wave by reducing a value obtained based on a voltage of said second reception signal with a value obtained based on said beam width of said second transmission wave.
- said first echo intensity calculator calculates said first echo intensity by compensating for a duration of said first reception signal by reducing a value obtained based on a voltage of said first reception signal with a value obtained based on the duration of said first reception signal
- said second echo intensity calculator calculates said second echo intensity by compensating for a duration of said second reception signal by reducing a value obtained based on a voltage of said second reception signal with a value obtained based on the duration of said second reception signal.
- one aspect of the present disclosure is to provide an underwater detection apparatus that comprises any of the detection apparatus described above, wherein the target is at least one of a fish school, a single fish or a single aquatic species, said target detector is provided as a single aquatic species detector configured to detect a single fish or a single aquatic species as a single target, and the underwater detection apparatus further comprises a single target size calculator configured to calculate a size of said single target detected by said single aquatic species detector.
- said single target size calculator calculates said size of said single target based on an echo intensity of a reception signal generated from a reception wave reflected on said single target.
- one aspect of the present disclosure is to provide a radar apparatus that comprises any of the detection apparatus described above.
- one aspect of the present disclosure is to provide a detection method that comprises transmitting a transmission wave, calculating a first echo intensity of a first reception signal generated from a reception wave resulting from a reflection of said transmission wave on a reflection object, calculating a second echo intensity of a second reception signal generated from a reception wave resulting from a reflection of said transmission wave on said reflection object, a signal duration of said second reception signal being shorter than that of said first reception signal, and detecting a target from a relative intensity comparison of said first echo intensity and said second echo intensity.
- the present disclosure can accurately detect a target.
- Fig. 1 shows a block diagram of an arrangement of a fish finder 1 (detection apparatus, underwater detection apparatus) according to one embodiment of the present disclosure.
- fish finder 1 according to one embodiment of the present disclosure.
- Fish finder 1 shown in Fig. 1 is arranged to estimate the number of fish within a detection area in water.
- Fish finder 1 is for example installed on a ship such as a fishing vessel.
- fish finder 1 uses single fish as an example of target of interest but other single aquatic species may also be used as target of interest.
- fish finder 1 comprises a transducer 2, a transceiver unit 3, a signal processing module 10 and an operation/display unit 4.
- Transducer 2 transforms electrical signal into ultrasonic wave and transmits ultrasonic wave into the water, repeatedly at given timings (namely, at a given cycle). Transducer 2 also transforms received ultrasonic wave into electrical signal. A chirp wave whose frequency is gradually changing as time passes is repeatedly transmitted at given timings and for a given duration from transducer 2 of the present embodiment.
- the transceiver unit 3 is comprised of a transmission and reception switching unit 5, a transmission module 6, and a reception module 7.
- the transmission and reception switching unit 5 connects the transmission module 6 and transducer 2 to supply a transmission signal from the transmission module 6 to transducer 2.
- the transmission and reception switching unit 5 connects transducer 2 and reception module 7 so that reception wave transformed into electrical signal by transducer 2 is supplied to the reception module 7.
- the transmission module 6 generates a transmission signal based on the conditions set via the operation/display unit 4 and supplies the transmission signal to transducer 2 via the transmission and reception switching unit 5.
- the transmission module 6 of the present embodiment supplies a chirp signal to transducer 2 as the source of said chirp wave.
- the reception module 7 amplifies the electrical signal supplied from transducer 2 and performs an Analog to Digital conversion of the amplified reception signal. The reception module 7 then supplies the converted digital reception signal to the signal processing module 10.
- the signal processing module 10 processes the reception signal outputted by the reception module 7 and generates a video signal of the target. With reference to the ship on which fish finder 1 is installed, the signal processing module 10 also generates a frequency distribution graph that shows in a given area of water the number of fish of a given fish length. The arrangement of the signal processing module 10 will be explained in detail later.
- Fig. 2 shows schematically an example of a display screen 4a of the operation/display unit 4 of the fish finder 1 shown in Fig. 1 .
- the operation/display unit 4 displays on the display screen 4a an image P that corresponds to the video signal outputted by the signal processing module 10.
- image P By looking at image P on display screen 4a, a user can estimate a situation of the sea below the ship (presence or absence of fish, position of fish relative to own ship etc).
- the operation/display unit 4 also comprises a variety of input means such as input buttons so that various settings or parameters related to transmission and reception of ultrasonic wave, signal processing or image display can be inputted.
- the vertical axis of the display screen 4a shown in Fig. 2 corresponds to depth. Numerical values on the horizontal axis of display screen 4a shown in Fig. 2 represent ping numbers, one ping corresponding to one chirp wave transmission.
- the frequency distribution graph D generated by the signal processing module 10 is also displayed on the display screen 4a of the operation/display unit 4.
- the number of fish detected as single fish is represented in percentage for every fish length on the frequency distribution graph D.
- the total number of fish detected is also displayed on the right-upper part of the frequency distribution graph D.
- Fig. 3 shows a block diagram of an arrangement of the signal processing module 10 of fish finder 1 shown in Fig. 1 .
- the signal processing module 10 is comprised of a pulse compression module 11 (compression means, compressor), a first SV calculation module 12 (first echo intensity calculation means, first echo intensity calculator), a second SV calculation module 13 (second echo intensity calculation means, second echo intensity calculator), a TS calculation module 14, a single fish detection module 20 (target detection means, target detector), a fish length calculation module 15 (single target size calculation means , single target size calculator), and a frequency distribution generation module 16.
- the signal processing module 10 is for example implemented on a processor (CPU, FPGA) and a memory (not shown on the figures).
- the processor read a program from the memory and execute the program, it is possible to implement the functions of the pulse compression module 11, the first SV calculation module 12, the second SV calculation module 13, the TS calculation module 14, the single fish detection module 20, the fish length calculation module 15, and the frequency distribution generation module 16.
- the pulse compression module 11 performs a pulse compression of the reception signal (first reception signal) outputted by the reception module 7. Specifically, the pulse compression module 11 uses for example a matched filter (not shown). The matched filter correlates the reception signal acquired from the reception wave received by transducer 2 and a reference signal set in advance based on a transmission wave (chirp wave) to perform pulse compression of the reception signal. As a result, the duration of the reception signal in the depth direction is shortened and a second reception signal is generated.
- the first SV calculation module 12 calculates as echo intensity (first echo intensity) the volume backscattering strength (SV value) based on the reception signal (first reception signal) outputted by the reception module 7.
- SV value can be expressed with the following equation (1) and the first SV calculation module 12 calculates SV value for each position along the depth. Note that, hereinafter, the SV value calculated by the first SV calculation module 12 may be called first SV value.
- SV EL ⁇ SL ⁇ ME + Cb + Cd
- EL is a received voltage of the echo signal (EL unit is dB with reference set to 1V)
- SL is a source level of the ultrasound transmission wave
- ME is a wave-receiving sensitivity of the transducer (ME unit is dB with reference to 1 V/ ⁇ Pa).
- c is a speed of sound (expressed in m/s)
- ⁇ is a length (which may also be referred to as a duration and is expressed in s) of the reception signal (specifically, a length ⁇ 1 of the first reception signal and a length ⁇ 2 of the second reception signal)
- ⁇ is a half angle (which may also be referred to as a half beam width) of the transmission beam (expressed in deg)
- r is a distance to a target (expressed in m)
- ⁇ is an underwater absorption loss coefficient (expressed in dB/km).
- the length ⁇ 1 of the first reception signal is set to a duration (which may also be referred to as a pulse width) of the transmission signal (for example the chirp signal) generated by the transmission module 6.
- the second SV calculation module 13 calculates as echo intensity (second echo intensity) the SV value using the above equation (1) based on the reception signal (second reception signal) pulse compressed by the pulse compression module 11.
- the second SV calculation module 13 also calculates SV value for each position along the depth, as performed by the first SV calculation module 12.
- the SV value calculated by the second SV calculation module 13 may be called second SV value.
- the length ⁇ 2 of the second reflection signal in equation (1) is set to the duration the chirp signal generated by the transmission module 6 would have after being compressed by the pulse compression module 11. This can be calculated theoretically.
- Fig. 4 shows schematically an example of relative position in the sea of a plurality of fish detected by fish finder 1 and a shape of the beam formed by transducer 2.
- Fig. 4 illustrates two fish relatively closely separated in the depth direction.
- Fig. 5 shows an example of a first SV value graph and a second SV value graph, the dotted line being the first SV value graph and the solid line being the second SV value graph.
- the first SV value graph shows a variation of the first SV value with depth
- the second SV value graph shows a variation of the second SV value with depth.
- the two fish of Fig. 4 are illustrated in a situation where they are relatively closely separated in the depth direction.
- a resolution in the depth direction is relatively high as it is generated based on the pulse compressed reception signal (second reception signal).
- second reception signal pulse compressed reception signal
- the falling edge portion of the left peak waveform overlaps the rising edge portion of the right peak waveform.
- the TS calculation module 14 calculates for each ping and for each echo returning from each depth position an echo intensity, such as target strength (hereinafter also called TS value) for example.
- TS value target strength
- the single fish detection module 20 compares a relative intensity of the first SV value calculated by the first SV calculation module 12 and the second SV value calculated by the second SV calculation module 13 and detects single fish (single target) according to the result of the comparison. As shown in Fig. 3 , the single fish detection module 20 is comprised of a ⁇ SV calculation module 21 and a comparison module 22.
- the ⁇ SV calculation module 21 calculates for each depth position the difference between the first SV value and the second SV value ( ⁇ SV value). Specifically, the ⁇ SV calculation module 21 calculates the ⁇ SV value by subtracting the first SV value from the second SV value for each depth position. Note that in the present embodiment, the explanation is based on the first SV value and second SV value being expressed in logarithmic scale. In the case the first SV value and the second SV value are expressed in linear scale, the ⁇ SV calculation module 21 calculates the ratio of the first SV value and the second SV value for each depth position.
- the comparison module 22 compares the ⁇ SV value calculated by the ⁇ SV calculation module 21 with a given threshold Thrl and determines whether the ⁇ SV value is above threshold Thr1.
- the comparison module 22 also comprises a counter 22a to count a count value N of continuous positions where the ⁇ SV value is above threshold Thrl in the depth direction. Then, the comparison module 22 determines whether the count value N stored in counter 22a is above a lower limit value N min and below an upper limit value N max . When the count value N is above the lower limit value N min and below the upper limit value N max , the comparison module 22 determines that the peak waveform is a waveform of a single fish and detects it as a single fish.
- the fish length calculation module 15 calculates fish length of single fish (size of single target) based on the TS value of single fish detected by the single fish detection module 20. Calculating fish length of single fish based on TS value being a well known method in the art, further detail is omitted.
- the frequency distribution generation module 16 generates the frequency distribution graph D (refer to Fig. 2 ) by segmentation of the fish length calculated by the fish length calculation module 15 for each single fish detected by the single fish detection module 20 into fish length intervals.
- Fig. 6 shows a flow chart of operation of fish finder 1.
- Fig. 6 an operation of fish finder 1.
- a chirp wave is transmitted from transducer 2. Then, at S2, the reflection wave returning from said chirp wave reflecting on a target is received by transducer 2.
- the reception signal generated from the reflection wave (chirp wave) received by transducer 2 is pulse compressed. As a result, the duration of the reception signal in the depth direction is shortened.
- the first SV value is calculated based on equation (1).
- S4 can be performed before, after or at the same time as S3.
- steps S5 and S6 can be performed.
- the second SV value is calculated based on equation (1).
- the TS value of the pulse compressed signal is calculated for each ping and for each depth position.
- single fish detection is performed based on the first SV value calculated at S4 and the second SV value calculated at S5.
- Fig. 7 shows a flow chart illustrating each step involved in S10 (single fish detection processing). At S10, by performing the steps explained below, single fish are more accurately detected that with conventional fish finders.
- the ⁇ SV value is calculated. Specifically, at S11, the ⁇ SV calculation module 21 calculates the ⁇ SV value by subtracting the first SV value calculated at S4 from the second SV value calculated at S5. The ⁇ SV calculation module 21 calculates the ⁇ SV value for each depth position.
- the count value N stored at that point in time in counter 22a is incremented by one (S 13). Then, the sample that is one sample deeper than the latest sample for which the ⁇ SV value has been compared with threshold Thrl is then selected for a comparison of its ⁇ SV value with Thrl (S16) and the ⁇ SV value and Thrl comparison is once again performed (S12).
- the comparison module 22 determines that the peak waveform is a waveform of a single fish and detects it as a single fish (S 17). Then, by performing the above explained single fish detection processing (S10, including steps S11 to S17) to all echo signals returned from the detection area of fish finder 1, all single fish contained in the detection area can be detected.
- fish length of all single fish detected at S10 is calculated based on the TS value calculated at S6.
- the fish length calculated at S7 for all single fish detected at S10 is segmented into fish length intervals and the fish length frequency distribution graph D is generated for single fish within the detection area.
- the frequency distribution graph D generated in this manner is displayed along with the echo image P of the sea on the display screen 4a of the operation/display unit 4 (refer to Fig. 2 ).
- fish finder 1 of the present embodiment can more accurately detect single fish than conventional fish finders. Hereinafter, the reason is explained.
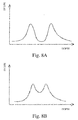
- Figs. 8A and 8B show a second SV value graph.
- Fig. 8A shows the graph when two single fish are relatively well separated in the depth direction and
- Fig. 8B shows the graph when two single fish are closer in the depth direction than in Fig. 8A .
- a conventional fish finder detects a single fish based on the characteristic of the rising and falling edges of a waveform originating from a single fish. Specifically, a conventional fish finder determines that a waveform originates from a single fish on the condition that the inclination of the rising edge and falling edge of said waveform is sharp. Based on this, as shown for example in Fig. 8A , when the waveforms of two single fish do not mutually interfere, it is determined that both waveforms originate from a single fish. However, when two single fish are closely separated in the depth direction, as shown in Fig. 8B , the rising and falling edges of the waveforms that originate from the fish overlap. As a result, as the characteristic of the rising edge portion and the falling edge portion are altered, accurate single fish detection cannot be performed.
- fish finder 1 of the present embodiment detects target (single fish) by performing a relative intensity comparison of as first echo intensity a first volume backscattering strength (first SV value) based on the first reception signal and as second echo intensity a second volume backscattering strength (second SV value) based on the second reception signal.
- first SV value a first volume backscattering strength
- second SV value a second volume backscattering strength
- the second SV value graph has a relatively high resolution in the depth direction as it is generated based on the pulse compressed reception signal (second reception signal). Therefore, compared to the first SV value graph, the peak waveform of each single fish of the second SV value graph has a thinner width and a higher peak value. Therefore, as explained above, by performing a relative intensity comparison in the depth direction of the value of the first SV value graph and the value of second SV value graph, single fish is detected from the characteristic around the peak of the second SV value graph. Namely, there is no more need to check the rising edge portion and falling edge portion characteristics of each peak waveform of each fish to detect single fish as it has been conventionally done. Therefore, even with densely distributed fish that create peak waveforms with overlapped rising and falling edge portions, each single fish can be accurately detected regardless of said rising and falling edge portion situation.
- fish finder 1 detects single fish based on a relative intensity comparison of two values (the first SV value as the first echo intensity and the second SV value as the second echo intensity) each obtained from two reception signals having mutually different signal durations.
- fish finder 1 can accurately detect target.
- fish finder 1 is performing pulse compression processing. Accordingly, in order to make the duration of the second reception signal shorter than the first reception signal, there is no need for example to generate two different transmission waves having two different pulse widths. Namely, as there is no need to generate a plurality of different transmission waves, the arrangement of for example the transmission module 6 is simplified.
- the single fish detection module 20 of fish finder 1 detects single fish on a condition that the second SV value is bigger than the first SV value. Accordingly, single fish can be appropriately detected.
- the single fish detection module 20 of fish finder 1 detects single fish on a condition that the second SV value is bigger than the first SV value by at least threshold Thr1.
- fish finder 1 calculates the echo intensity of each reception signal by compensating for the duration of each reception signal. Accordingly, the first echo intensity and the second echo intensity can be appropriately calculated.
- fish finder 1 calculates the echo intensity of each reception signal by compensating for the beam width in which the transmission wave is transmitted by the transducer. Accordingly, a more appropriate first echo intensity and second echo intensity can be calculated.
- fish finder 1 calculates the volume backscattering strength as first echo intensity and second echo intensity. Accordingly, the well known volume backscattering strength is used to calculate the first echo intensity and the second echo intensity.
- fish finder 1 detects single fish or single aquatic species as single target of interest and estimates quantity.
- fish finder 1 calculates fish length of single fish based on the TS value of said single fish. Accordingly, fish length of single fish can be appropriately calculated.
- fish finder 1 detects single fish on a condition that the ⁇ SV value keeps above threshold Thrl in the depth direction continuously for at least a given number of times (lower limit value N min ). Accordingly, false detection of ⁇ SV value as single fish due to a sudden increase of the ⁇ SV value not related to single fish echo can be prevented.
- fish finder 1 detects single fish on a condition that the ⁇ SV value keeps above threshold Thrl in the depth direction continuously for at the most a given number of times (upper limit value N max ). Accordingly, false detection of gently-sloping waveform as single fish can be prevented.
- the fish finder of the present embodiment having a first high frequency component reduction module 18 (first high frequency component reducer), a second high frequency component reduction module 19 (second high frequency component reducer) and a validity evaluation module 25 (validity evaluator) is different from fish finder 1 of the foregoing embodiment.
- a fish length calculation module 15a single target size calculation means, single target size calculator
- the fish length calculation module 15 of the foregoing embodiment have also operations that slightly differ.
- differences with fish finder 1 of the foregoing embodiment will be mainly explained, other explanations will be omitted.
- the first high frequency component reduction module 18 performs a high frequency component reduction of the first SV value in the depth direction in the same way as the high frequency component reduction module 17 of the fish finder shown in Fig. 9 . Specifically, as performed by the high frequency component reduction module 17 shown in Fig. 9 , the first high frequency component reduction module 18 performs moving average processing to reduce high frequency components of the first SV value. Note that the lower limit of the frequency that can be reduced by the first high frequency component reduction module 18 of the present embodiment is set so that it is lower than the lower limit of the frequency that can be reduced by the high frequency component reduction module 17 shown in Fig. 9 .
- the second high frequency component reduction module 19 performs a high frequency component reduction of the second SV value in the depth direction. Specifically, as performed by the first high frequency component reduction module 18, the second high frequency component reduction module 19 performs moving average processing.
- the validity evaluation module 25 is arranged to evaluate the validity of the single fish detection result from the single fish detection module 20. Specifically, the validity evaluation module 25 evaluates the validity of the detection result of the single fish detection module 20 based on a relative intensity comparison result of the first SV value graph processed by moving averaging by the first high frequency component reduction module 18 and the second SV value graph processed by moving averaging by the second high frequency component reduction module 19.
- Figs. 12A and 12B show the first SV value graph and the second SV value graph on top of each other when a plurality of single fish are relatively well separated in the depth direction, the waveform shown in a dotted line being the first SV value graph, and the waveform shown in a solid line being the second SV value graph.
- Fig. 12A shows the waveforms before high frequency component reduction processing and Fig. 12B shows the waveforms after high frequency component reduction processing.
- the validity evaluation module 25 compares the first SV value processed by moving averaging and the second SV value processed by moving averaging at each depth position Z1 to Z3 where peaks P1 to P3 have been estimated as single fish waveforms by the single fish detection module 20. Specifically, the validity evaluation module 25 subtracts the second SV value processed by moving averaging from the first SV value processed by moving averaging at depth positions Z1 to Z3 that correspond to single fish waveform peaks P1 to P3. Then, the validity evaluation module 25 determines whether each subtraction value ⁇ SV_1 to ⁇ SV_3 is above a given threshold Thr2.
- the validity evaluation module 25 determines that the detection result that detected single fish at depth positions Z1 to Z3 is valid and notifies the verification result to the fish length calculation module 15a. On the other hand, if the subtraction value is below Thr2, the validity evaluation module 25 determines that the detection result that detected single fish at depth positions Z1 to Z3 is not valid and notifies the verification result to the fish length calculation module 15a.
- the fish length calculation module 15a calculates only the fish length of single fish whose detection result has been determined as valid by the validity evaluation module 25. Namely, the fish length calculation module 15a does not calculate the fish length of single fish whose detection result has not been determined as valid by the validity evaluation module 25.
- the frequency distribution generation module 16 generates the frequency distribution graph by segmentation of the fish length calculated by the fish length calculation module 15a for each single fish. Namely, the frequency distribution generation module 16 generates the frequency distribution graph by only considering the detected single fish whose detection result has been determined as valid.
- the validity evaluation module 25 evaluates the validity of the detection result of the single fish detection module 20 based on first and second SV values processed by high frequency component reduction processing (moving average in the present embodiment).
- Figs. 12A, 12B , 13A and 13B are used to explain the validity evaluation of the current method.
- the single fish detection of the single fish detection module 20 can be relatively accurately performed. Also, when such a plurality of fish are relatively well separated in the depth direction, it can be seen as a characteristic of the first SV graph and second SV graph that there are relatively fewer high fluctuations in the depth direction. In this case, the differences ⁇ SV_1 to ⁇ SV_3 between the first SV value processed by moving averaging and the second SV value processed by moving averaging become relatively bigger.
- ⁇ SV_1 to ⁇ SV_8 values are calculated for each peak waveform of single fish and by comparing those values to threshold Thr2 the validity of the detection result of the single fish detection module 20 can be appropriately evaluated.
- the frequency distribution graph is generated by only considering single fish data whose detection result has been determined as valid by the validity evaluation module 25, but this should not be a limitation.
- the display can switch between a frequency distribution graph generated with all detected single fish data (total frequency distribution graph) and a frequency distribution graph generated only with single fish data whose detection result has been determined as valid (frequency distribution graph after validity evaluation).
- the total frequency distribution graph and the frequency distribution graph after validity evaluation explained above can also be displayed simultaneously.
Landscapes
- Engineering & Computer Science (AREA)
- Radar, Positioning & Navigation (AREA)
- Remote Sensing (AREA)
- Physics & Mathematics (AREA)
- Computer Networks & Wireless Communication (AREA)
- General Physics & Mathematics (AREA)
- Acoustics & Sound (AREA)
- Electromagnetism (AREA)
- Measurement Of Velocity Or Position Using Acoustic Or Ultrasonic Waves (AREA)
- Radar Systems Or Details Thereof (AREA)
Abstract
Description
- The present disclosure relates to a detection apparatus, an underwater detection apparatus, a radar apparatus and a detection method for determining whether a reception wave received from a target is from a target of interest. The present invention has particular, but not exclusive, application in the detection of aquatic species such as fish.
- Conventional detection apparatus (for example the detection apparatus disclosed in
U.S. patent application publication number 2008/0080317 ) determines whether a reception wave is from a single fish (target) based on rising and falling edges of a waveform of the reception wave. - However, with the above explained method, when for example several targets are closely separated in distance, the rising and falling edges of the waveforms of each target overlap. As a result, as the characteristic of the rising and falling edges of the waveforms is altered, it is not possible to accurately determine if each waveform is from a target of interest.
- Accordingly, the present disclosure is to solve the aforementioned problem. An object of the disclosure is to accurately detect a target.
- In order to solve the foregoing problem, one aspect of the present disclosure is to provide a detection apparatus that comprises a transducer configured to transmit a transmission wave, a first echo intensity calculator configured to calculate a first echo intensity of a first reception signal generated from a reception wave resulting from a reflection of said transmission wave on a reflection object, a second echo intensity calculator configured to calculate a second echo intensity of a second reception signal generated from a reception wave resulting from a reflection of said transmission wave on said reflection object, a signal duration of said second reception signal being shorter than that of said first reception signal, and a target detector configured to detect a target from a relative intensity comparison of said first echo intensity and said second echo intensity.
- Preferably, the detection apparatus further comprises a compressor configured to compress said first reception signal to generate said second reception signal, wherein said second echo intensity calculator calculates said second echo intensity from said second reception signal compressed by said compressor.
- Preferably, said transducer transmits a first transmission wave and a second transmission wave as said transmission wave, a pulse width of the second transmission wave being shorter than that of the first transmission wave, said first echo intensity calculator calculates said first echo intensity based on a reception wave resulting from a reflection of said first transmission wave on said reflection object, and said second echo intensity calculator calculates said second echo intensity based on a reception wave resulting from a reflection of said second transmission wave on said reflection object.
- Preferably, said target detector detects said target on a condition that said second echo intensity is bigger than said first echo intensity.
- Preferably, said target detector detects said target on a condition that said second echo intensity is bigger than said first echo intensity by at least a given value.
- Preferably, said first echo intensity calculator calculates said first echo intensity by compensating for a beam width in which said transmission wave is transmitted by the transducer by reducing a value obtained based on a voltage of said first reception signal with a value obtained based on said beam width, and said second echo intensity calculator calculates said second echo intensity by compensating for said beam width in which said transmission wave is transmitted by the transducer by reducing a value obtained based on a voltage of said second reception signal with said value obtained based on said beam width.
- Preferably, said first echo intensity calculator calculates said first echo intensity by compensating for a beam width in which said first transmission wave is transmitted by the transducer by reducing a value obtained based on a voltage of said first reception signal with a value obtained based on said beam width in which said first transmission wave is transmitted, and said second echo intensity calculator calculates said second echo intensity by compensating for a beam width in which said second transmission wave is transmitted by the transducer by reducing a value obtained based on a voltage of said second reception signal with a value obtained based on said beam width in which said second transmission wave is transmitted.
- Preferably, said first echo intensity calculator calculates said first echo intensity by compensating for the duration of said first reception signal by reducing a value obtained based on a voltage of said first reception signal with a value obtained based on the duration of said first reception signal, and said second echo intensity calculator calculates said second echo intensity by compensating for the duration of said second reception signal by reducing a value obtained based on a voltage of said second reception signal with a value obtained based on the duration of said second reception signal.
- Preferably, said first echo intensity calculator calculates volume backscattering strength of said first reception signal as said first echo intensity, and said second echo intensity calculator calculates volume backscattering strength of said second reception signal as said second echo intensity.
- Preferably, the detection apparatus further comprises a high frequency component reducer configured to reduce a high frequency component of said first echo intensity, wherein said target detector compares the relative intensity of said first echo intensity from which high frequency component is reduced by said high frequency component reducer and said second echo intensity.
- Preferably, said high frequency component reducer reduces the high frequency component of said first echo intensity by performing a moving average of the first echo intensity.
- Preferably, the detection apparatus further comprises a first high frequency component reducer configured to reduce a high frequency component of said first echo intensity, a second high frequency component reducer configured to reduce a high frequency component of said second echo intensity, and a validity evaluator configured to evaluate a validity of a detection result of said target detector based on a ratio of said first echo intensity from which high frequency component is reduced by said first high frequency component reducer and said second echo intensity from which high frequency component is reduced by said second high frequency component reducer.
- In order to solve the foregoing problem, one aspect of the present disclosure is to provide a detection apparatus that comprises a transducer configured to transmit a first transmission wave and a second transmission wave, a beam width of the second transmission wave being smaller than that of the first transmission wave, a first echo intensity calculator configured to calculate a first echo intensity of a first reception signal generated from a reception wave resulting from a reflection of said first transmission wave on a reflection object, a second echo intensity calculator configured to calculate a second echo intensity of a second reception signal generated from a reception wave resulting from a reflection of said second transmission wave on said reflection object, and a target detector configured to detect a target from a relative intensity comparison of said first echo intensity and said second echo intensity.
- Preferably, said first echo intensity calculator calculates said first echo intensity by compensating for the beam width of said first transmission wave by reducing a value obtained based on a voltage of said first reception signal with a value obtained based on said beam width of said first transmission wave, and said second echo intensity calculator calculates said second echo intensity by compensating for the beam width of said second transmission wave by reducing a value obtained based on a voltage of said second reception signal with a value obtained based on said beam width of said second transmission wave.
- Preferably, said first echo intensity calculator calculates said first echo intensity by compensating for a duration of said first reception signal by reducing a value obtained based on a voltage of said first reception signal with a value obtained based on the duration of said first reception signal, and said second echo intensity calculator calculates said second echo intensity by compensating for a duration of said second reception signal by reducing a value obtained based on a voltage of said second reception signal with a value obtained based on the duration of said second reception signal.
- In order to solve the foregoing problem, one aspect of the present disclosure is to provide an underwater detection apparatus that comprises any of the detection apparatus described above, wherein the target is at least one of a fish school, a single fish or a single aquatic species, said target detector is provided as a single aquatic species detector configured to detect a single fish or a single aquatic species as a single target, and the underwater detection apparatus further comprises a single target size calculator configured to calculate a size of said single target detected by said single aquatic species detector.
- Preferably, said single target size calculator calculates said size of said single target based on an echo intensity of a reception signal generated from a reception wave reflected on said single target.
- In order to solve the foregoing problem, one aspect of the present disclosure is to provide a radar apparatus that comprises any of the detection apparatus described above.
- In order to solve the foregoing problem, one aspect of the present disclosure is to provide a detection method that comprises transmitting a transmission wave, calculating a first echo intensity of a first reception signal generated from a reception wave resulting from a reflection of said transmission wave on a reflection object, calculating a second echo intensity of a second reception signal generated from a reception wave resulting from a reflection of said transmission wave on said reflection object, a signal duration of said second reception signal being shorter than that of said first reception signal, and detecting a target from a relative intensity comparison of said first echo intensity and said second echo intensity.
- Accordingly, the present disclosure can accurately detect a target.
- The present disclosure is illustrated by way of example and not by way of limitation in the figures of the accompanying drawings, in which the like reference numerals indicate like elements and in which:
-
Fig. 1 shows a block diagram of an arrangement of a fish finder, according to an embodiment of the present disclosure; -
Fig. 2 shows schematically an example of a display screen of an operation/display unit of the fish finder shown inFig. 1 ; -
Fig. 3 shows a block diagram of an arrangement of a signal processing module of the fish finder shown inFig. 1 ; -
Fig. 4 shows schematically an example of relative position in the sea of a plurality of fish detected by the fish finder and a shape of a beam formed by a transducer; -
Fig. 5 shows an example of a first SV value graph and a second SV value graph, the dotted line being the first SV value graph and the solid line being the second SV value graph; -
Fig. 6 shows a flow chart of operation of the fish finder shown inFig. 1 ; -
Fig. 7 shows a flow chart illustrating each step involved in step S10 ofFig. 6 ; -
Figs. 8A and 8B show a second SV value graph,Fig. 8A showing the graph when two single fish are relatively well separated in a depth direction,Fig. 8B showing the graph when two single fish are closer in a depth direction than inFig. 8A ; -
Fig. 9 shows a block diagram of an arrangement of a signal processing module of a fish finder according to another embodiment of the present disclosure; -
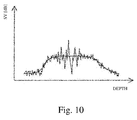
Fig. 10 shows first SV value graphs, the waveform shown in a dotted line being a graph before a high frequency component reduction processing is performed, and the waveform shown in a solid line being a graph after a high frequency component reduction processing is performed; -
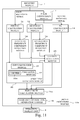
Fig. 11 shows a block diagram of an arrangement of a signal processing module of a fish finder according to another embodiment of the present disclosure; -
Figs. 12A and 12B show first SV value graph and second SV value graph when a plurality of single fish are relatively well separated in a depth direction, the waveform shown in a dotted line being the first SV value graph, and the waveform shown in a solid line being the second SV value graph.Fig. 12A shows the waveform before high frequency component reduction processing andFig. 12B shows the waveform after high frequency component reduction processing; -
Figs. 13A and 13B show first SV value graph and second SV value graph when a plurality of single fish are relatively closely separated in a depth direction, the waveform shown in a dotted line being the first SV value graph, and the waveform shown in a solid line being the second SV value graph.Fig. 13A shows the waveform before high frequency component reduction processing andFig. 13B shows the waveform after high frequency component reduction processing; -
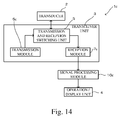
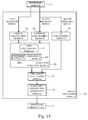
Fig. 14 shows a block diagram of an arrangement of a fish finder according to another embodiment of the present disclosure; -
Fig. 15 shows a block diagram of an arrangement of the signal processing module shown inFig. 14 ; -
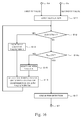
Fig. 16 shows a flow chart of operation of a fish finder according to another embodiment of the present disclosure; -
Fig. 17 shows a block diagram of an arrangement of a radar according to another embodiment of the present disclosure; -
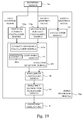
Fig. 18 shows a block diagram of an arrangement of a fish finder according to another embodiment of the present disclosure; and -
Fig. 19 shows a block diagram of an arrangement of a signal processing module of the fish finder shown inFig. 18 . -
Fig. 1 shows a block diagram of an arrangement of a fish finder 1 (detection apparatus, underwater detection apparatus) according to one embodiment of the present disclosure. Hereinafter, there will be explained, referring to the drawings,fish finder 1 according to one embodiment of the present disclosure.Fish finder 1 shown inFig. 1 is arranged to estimate the number of fish within a detection area in water.Fish finder 1 is for example installed on a ship such as a fishing vessel. Note that, hereinafter,fish finder 1 uses single fish as an example of target of interest but other single aquatic species may also be used as target of interest. - As shown in
Fig. 1 ,fish finder 1 comprises atransducer 2, atransceiver unit 3, asignal processing module 10 and an operation/display unit 4. -
Transducer 2 transforms electrical signal into ultrasonic wave and transmits ultrasonic wave into the water, repeatedly at given timings (namely, at a given cycle).Transducer 2 also transforms received ultrasonic wave into electrical signal. A chirp wave whose frequency is gradually changing as time passes is repeatedly transmitted at given timings and for a given duration fromtransducer 2 of the present embodiment. - The
transceiver unit 3 is comprised of a transmission andreception switching unit 5, atransmission module 6, and areception module 7. During transmission, the transmission andreception switching unit 5 connects thetransmission module 6 andtransducer 2 to supply a transmission signal from thetransmission module 6 totransducer 2. During reception, the transmission andreception switching unit 5 connectstransducer 2 andreception module 7 so that reception wave transformed into electrical signal bytransducer 2 is supplied to thereception module 7. - The
transmission module 6 generates a transmission signal based on the conditions set via the operation/display unit 4 and supplies the transmission signal totransducer 2 via the transmission andreception switching unit 5. In order to have a chirp wave transmitted fromtransducer 2 as explained above, thetransmission module 6 of the present embodiment supplies a chirp signal totransducer 2 as the source of said chirp wave. - The
reception module 7 amplifies the electrical signal supplied fromtransducer 2 and performs an Analog to Digital conversion of the amplified reception signal. Thereception module 7 then supplies the converted digital reception signal to thesignal processing module 10. - The
signal processing module 10 processes the reception signal outputted by thereception module 7 and generates a video signal of the target. With reference to the ship on whichfish finder 1 is installed, thesignal processing module 10 also generates a frequency distribution graph that shows in a given area of water the number of fish of a given fish length. The arrangement of thesignal processing module 10 will be explained in detail later. -
Fig. 2 shows schematically an example of a display screen 4a of the operation/display unit 4 of thefish finder 1 shown inFig. 1 . As shown inFig. 2 , the operation/display unit 4 displays on the display screen 4a an image P that corresponds to the video signal outputted by thesignal processing module 10. By looking at image P on display screen 4a, a user can estimate a situation of the sea below the ship (presence or absence of fish, position of fish relative to own ship etc...). The operation/display unit 4 also comprises a variety of input means such as input buttons so that various settings or parameters related to transmission and reception of ultrasonic wave, signal processing or image display can be inputted. The vertical axis of the display screen 4a shown inFig. 2 corresponds to depth. Numerical values on the horizontal axis of display screen 4a shown inFig. 2 represent ping numbers, one ping corresponding to one chirp wave transmission. - As shown in
Fig. 2 , the frequency distribution graph D generated by thesignal processing module 10 is also displayed on the display screen 4a of the operation/display unit 4. The number of fish detected as single fish is represented in percentage for every fish length on the frequency distribution graph D. On the example shown inFig. 2 , the total number of fish detected is also displayed on the right-upper part of the frequency distribution graph D. -
Fig. 3 shows a block diagram of an arrangement of thesignal processing module 10 offish finder 1 shown inFig. 1 . As shown inFig. 3 , thesignal processing module 10 is comprised of a pulse compression module 11 (compression means, compressor), a first SV calculation module 12 (first echo intensity calculation means, first echo intensity calculator), a second SV calculation module 13 (second echo intensity calculation means, second echo intensity calculator), aTS calculation module 14, a single fish detection module 20 (target detection means, target detector), a fish length calculation module 15 (single target size calculation means , single target size calculator), and a frequencydistribution generation module 16. Thesignal processing module 10 is for example implemented on a processor (CPU, FPGA) and a memory (not shown on the figures). For example, by having the processor read a program from the memory and execute the program, it is possible to implement the functions of thepulse compression module 11, the firstSV calculation module 12, the secondSV calculation module 13, theTS calculation module 14, the singlefish detection module 20, the fishlength calculation module 15, and the frequencydistribution generation module 16. - The
pulse compression module 11 performs a pulse compression of the reception signal (first reception signal) outputted by thereception module 7. Specifically, thepulse compression module 11 uses for example a matched filter (not shown). The matched filter correlates the reception signal acquired from the reception wave received bytransducer 2 and a reference signal set in advance based on a transmission wave (chirp wave) to perform pulse compression of the reception signal. As a result, the duration of the reception signal in the depth direction is shortened and a second reception signal is generated. - The first
SV calculation module 12 calculates as echo intensity (first echo intensity) the volume backscattering strength (SV value) based on the reception signal (first reception signal) outputted by thereception module 7. SV value can be expressed with the following equation (1) and the firstSV calculation module 12 calculates SV value for each position along the depth. Note that, hereinafter, the SV value calculated by the firstSV calculation module 12 may be called first SV value.
- In the above equation (1), EL is a received voltage of the echo signal (EL unit is dB with reference set to 1V), SL is a source level of the ultrasound transmission wave (SL unit is dB with reference set to 1µPa), and ME is a wave-receiving sensitivity of the transducer (ME unit is dB with reference to 1 V/µPa).
- Cb (=-10log(c τ /2) - 20log( θ ) + 31.6) is a correction term based on the characteristics of an ultrasound beam and Cd (=20log(r) + 2 α r/1000) is a correction term relating to attenuation in distance direction (depth direction). Here, c is a speed of sound (expressed in m/s), τ is a length (which may also be referred to as a duration and is expressed in s) of the reception signal (specifically, a length τ1 of the first reception signal and a length τ2 of the second reception signal), θ is a half angle (which may also be referred to as a half beam width) of the transmission beam (expressed in deg), r is a distance to a target (expressed in m) and α is an underwater absorption loss coefficient (expressed in dB/km). Specifically, as an approximation, the length τ1 of the first reception signal is set to a duration (which may also be referred to as a pulse width) of the transmission signal (for example the chirp signal) generated by the
transmission module 6. - The second
SV calculation module 13 calculates as echo intensity (second echo intensity) the SV value using the above equation (1) based on the reception signal (second reception signal) pulse compressed by thepulse compression module 11. The secondSV calculation module 13 also calculates SV value for each position along the depth, as performed by the firstSV calculation module 12. Note that, hereinafter, the SV value calculated by the secondSV calculation module 13 may be called second SV value. Specifically, as an approximation, the length τ2 of the second reflection signal in equation (1) is set to the duration the chirp signal generated by thetransmission module 6 would have after being compressed by thepulse compression module 11. This can be calculated theoretically. -
Fig. 4 shows schematically an example of relative position in the sea of a plurality of fish detected byfish finder 1 and a shape of the beam formed bytransducer 2.Fig. 4 illustrates two fish relatively closely separated in the depth direction.Fig. 5 shows an example of a first SV value graph and a second SV value graph, the dotted line being the first SV value graph and the solid line being the second SV value graph. The first SV value graph shows a variation of the first SV value with depth, and the second SV value graph shows a variation of the second SV value with depth. - As explained above, the two fish of
Fig. 4 are illustrated in a situation where they are relatively closely separated in the depth direction. In the second SV value graph, a resolution in the depth direction is relatively high as it is generated based on the pulse compressed reception signal (second reception signal). However, there is resolution limitation; for example when the two fish are close, a portion of the peak waveform of each fish overlap. Specifically, on the example shown inFig. 5 , the falling edge portion of the left peak waveform overlaps the rising edge portion of the right peak waveform. In such situation, compared to the situation where both peaks are well separated, as the characteristics of the rising edge portion of the waveform and the falling edge portion of the waveform are altered, the two fish cannot be distinguished with a conventional method (for example the method disclosed inUS2008/0080317 explained above). As a result, the number of single fish cannot be accurately estimated. Withfish finder 1 according to the present embodiment, as explained below in detail in the singlefish detection module 20, closely separated fish can each be detected as single fish. - The
TS calculation module 14 calculates for each ping and for each echo returning from each depth position an echo intensity, such as target strength (hereinafter also called TS value) for example. - The single
fish detection module 20 compares a relative intensity of the first SV value calculated by the firstSV calculation module 12 and the second SV value calculated by the secondSV calculation module 13 and detects single fish (single target) according to the result of the comparison. As shown inFig. 3 , the singlefish detection module 20 is comprised of a ΔSV calculation module 21 and acomparison module 22. - The
ΔSV calculation module 21 calculates for each depth position the difference between the first SV value and the second SV value (Δ SV value). Specifically, the ΔSV calculation module 21 calculates the Δ SV value by subtracting the first SV value from the second SV value for each depth position. Note that in the present embodiment, the explanation is based on the first SV value and second SV value being expressed in logarithmic scale. In the case the first SV value and the second SV value are expressed in linear scale, the ΔSV calculation module 21 calculates the ratio of the first SV value and the second SV value for each depth position. - The
comparison module 22 compares the Δ SV value calculated by the ΔSV calculation module 21 with a given threshold Thrl and determines whether the Δ SV value is above threshold Thr1. Thecomparison module 22 also comprises acounter 22a to count a count value N of continuous positions where the Δ SV value is above threshold Thrl in the depth direction. Then, thecomparison module 22 determines whether the count value N stored incounter 22a is above a lower limit value Nmin and below an upper limit value Nmax. When the count value N is above the lower limit value Nmin and below the upper limit value Nmax, thecomparison module 22 determines that the peak waveform is a waveform of a single fish and detects it as a single fish. - The fish
length calculation module 15 calculates fish length of single fish (size of single target) based on the TS value of single fish detected by the singlefish detection module 20. Calculating fish length of single fish based on TS value being a well known method in the art, further detail is omitted. - The frequency
distribution generation module 16 generates the frequency distribution graph D (refer toFig. 2 ) by segmentation of the fish length calculated by the fishlength calculation module 15 for each single fish detected by the singlefish detection module 20 into fish length intervals. -
Fig. 6 shows a flow chart of operation offish finder 1. Hereinafter, there will be explained, referring toFig. 6 , an operation offish finder 1. - First, at S1, a chirp wave is transmitted from
transducer 2. Then, at S2, the reflection wave returning from said chirp wave reflecting on a target is received bytransducer 2. - Next, at S3, the reception signal generated from the reflection wave (chirp wave) received by
transducer 2 is pulse compressed. As a result, the duration of the reception signal in the depth direction is shortened. - On the other hand, at S4, the first SV value is calculated based on equation (1). S4 can be performed before, after or at the same time as S3.
- Once the pulse compression processing S3 is completed, steps S5 and S6 can be performed. At S5, the second SV value is calculated based on equation (1). At S6, the TS value of the pulse compressed signal is calculated for each ping and for each depth position.
- Next, at S10, single fish detection is performed based on the first SV value calculated at S4 and the second SV value calculated at S5.
-
Fig. 7 shows a flow chart illustrating each step involved in S10 (single fish detection processing). At S10, by performing the steps explained below, single fish are more accurately detected that with conventional fish finders. - First, at S11, the Δ SV value is calculated. Specifically, at S11, the Δ
SV calculation module 21 calculates the Δ SV value by subtracting the first SV value calculated at S4 from the second SV value calculated at S5. The ΔSV calculation module 21 calculates the Δ SV value for each depth position. - Next, at
S 12, it is determined whether the Δ SV value is above threshold Thr1. - If the Δ SV value is above threshold Thrl (S12: YES), the count value N stored at that point in time in
counter 22a is incremented by one (S 13). Then, the sample that is one sample deeper than the latest sample for which the Δ SV value has been compared with threshold Thrl is then selected for a comparison of its Δ SV value with Thrl (S16) and the Δ SV value and Thrl comparison is once again performed (S12). - On the other hand, if the Δ SV value is below threshold Thrl (S12: NO), it is determined whether the count value N stored at that point in time in
counter 22a is above the lower limit value Nmin and below the upper limit value Nmax. At initialization time, as the count value N is set to 0, the count value N is below the lower limit value Nmin (S14: NO) and count value N is reset (S15). Then, the sample that is one sample deeper than the latest sample for which the Δ SV value has been compared with threshold Thrl is then selected for a comparison of its Δ SV value with Thrl (S16) and the Δ SV value and Thrl comparison is once again performed (S12). - Then, after the Δ SV value has to some extent kept above threshold Thrl in the depth direction for some time (i.e. after the S12, S13, S16 loop has repeated itself to some extent), at S12 when the Δ SV value becomes below threshold Thrl and at S14 when the count value N is determined as being above the lower limit value Nmin and below the upper limit value Nmax (S14: YES), the
comparison module 22 determines that the peak waveform is a waveform of a single fish and detects it as a single fish (S 17). Then, by performing the above explained single fish detection processing (S10, including steps S11 to S17) to all echo signals returned from the detection area offish finder 1, all single fish contained in the detection area can be detected. - On the other hand, when the Δ SV value has kept above threshold Thrl in the depth direction for a too long time (i.e. when the S12, S13, S16 loop has repeated itself too many times), at S12 when the Δ SV value becomes below threshold Thrl, at S14 the count value N is determined as being above the upper limit value Nmax (S14: NO). In this case, count value N is reset (S15), then the sample that is one sample deeper than the latest sample for which the Δ SV value has been compared with threshold Thrl is then selected for a comparison of its Δ SV value with Thrl (S16) and the Δ SV value and Thrl comparison is once again performed (S12).
- Then, when the Δ SV value has kept above threshold Thrl in the depth direction for a too short time (i.e. when the S12, S13, S16 loop has repeated itself too few times), at S12 when the Δ SV value becomes below threshold Thrl, at S14 the count value N is determined as being below the lower limit value Nmin (S14: NO). In this case too, as explained in the case above, count value N is reset (S15), then the sample that is one sample deeper than the latest sample for which the Δ SV value has been compared with threshold Thrl is then selected for a comparison of its Δ SV value with Thrl (S16) and the Δ SV value and Thrl comparison is once again performed (S12).
- Next, at S7, fish length of all single fish detected at S10 is calculated based on the TS value calculated at S6.
- Then, at S8, the fish length calculated at S7 for all single fish detected at S10 is segmented into fish length intervals and the fish length frequency distribution graph D is generated for single fish within the detection area. The frequency distribution graph D generated in this manner is displayed along with the echo image P of the sea on the display screen 4a of the operation/display unit 4 (refer to
Fig. 2 ). - By performing the single fish detection explained above,
fish finder 1 of the present embodiment can more accurately detect single fish than conventional fish finders. Hereinafter, the reason is explained. -
Figs. 8A and 8B show a second SV value graph.Fig. 8A shows the graph when two single fish are relatively well separated in the depth direction andFig. 8B shows the graph when two single fish are closer in the depth direction than inFig. 8A . - A conventional fish finder detects a single fish based on the characteristic of the rising and falling edges of a waveform originating from a single fish. Specifically, a conventional fish finder determines that a waveform originates from a single fish on the condition that the inclination of the rising edge and falling edge of said waveform is sharp. Based on this, as shown for example in
Fig. 8A , when the waveforms of two single fish do not mutually interfere, it is determined that both waveforms originate from a single fish. However, when two single fish are closely separated in the depth direction, as shown inFig. 8B , the rising and falling edges of the waveforms that originate from the fish overlap. As a result, as the characteristic of the rising edge portion and the falling edge portion are altered, accurate single fish detection cannot be performed. - In contrast with conventional fish finders, as explained above
fish finder 1 of the present embodiment detects target (single fish) by performing a relative intensity comparison of as first echo intensity a first volume backscattering strength (first SV value) based on the first reception signal and as second echo intensity a second volume backscattering strength (second SV value) based on the second reception signal. - As shown in
Fig. 5 , the second SV value graph has a relatively high resolution in the depth direction as it is generated based on the pulse compressed reception signal (second reception signal). Therefore, compared to the first SV value graph, the peak waveform of each single fish of the second SV value graph has a thinner width and a higher peak value. Therefore, as explained above, by performing a relative intensity comparison in the depth direction of the value of the first SV value graph and the value of second SV value graph, single fish is detected from the characteristic around the peak of the second SV value graph. Namely, there is no more need to check the rising edge portion and falling edge portion characteristics of each peak waveform of each fish to detect single fish as it has been conventionally done. Therefore, even with densely distributed fish that create peak waveforms with overlapped rising and falling edge portions, each single fish can be accurately detected regardless of said rising and falling edge portion situation. - As in the foregoing,
fish finder 1 according to the present embodiment detects single fish based on a relative intensity comparison of two values (the first SV value as the first echo intensity and the second SV value as the second echo intensity) each obtained from two reception signals having mutually different signal durations. With this arrangement, as there is no need to detect single fish based on the characteristic of the rising edge portion and falling edge portion of the peak waveform of each single fish as it has been conventionally done, even when single fish are closely separated in the depth direction, each single fish can be accurately detected. - Accordingly,
fish finder 1 can accurately detect target. - In order to have the duration of one of the reception signal (the second reception signal of the present embodiment) to be shorter than the duration of the first reception signal,
fish finder 1 is performing pulse compression processing. Accordingly, in order to make the duration of the second reception signal shorter than the first reception signal, there is no need for example to generate two different transmission waves having two different pulse widths. Namely, as there is no need to generate a plurality of different transmission waves, the arrangement of for example thetransmission module 6 is simplified. - Moreover, the single
fish detection module 20 offish finder 1 detects single fish on a condition that the second SV value is bigger than the first SV value. Accordingly, single fish can be appropriately detected. - Moreover, the single
fish detection module 20 offish finder 1 detects single fish on a condition that the second SV value is bigger than the first SV value by at least threshold Thr1. - Moreover,
fish finder 1 calculates the echo intensity of each reception signal by compensating for the duration of each reception signal. Accordingly, the first echo intensity and the second echo intensity can be appropriately calculated. - Moreover,
fish finder 1 calculates the echo intensity of each reception signal by compensating for the beam width in which the transmission wave is transmitted by the transducer. Accordingly, a more appropriate first echo intensity and second echo intensity can be calculated. - Moreover,
fish finder 1 calculates the volume backscattering strength as first echo intensity and second echo intensity. Accordingly, the well known volume backscattering strength is used to calculate the first echo intensity and the second echo intensity. - Moreover,
fish finder 1 detects single fish or single aquatic species as single target of interest and estimates quantity. - Moreover,
fish finder 1 calculates fish length of single fish based on the TS value of said single fish. Accordingly, fish length of single fish can be appropriately calculated. - Moreover,
fish finder 1 detects single fish on a condition that the Δ SV value keeps above threshold Thrl in the depth direction continuously for at least a given number of times (lower limit value Nmin). Accordingly, false detection of Δ SV value as single fish due to a sudden increase of the Δ SV value not related to single fish echo can be prevented. - Moreover,
fish finder 1 detects single fish on a condition that the Δ SV value keeps above threshold Thrl in the depth direction continuously for at the most a given number of times (upper limit value Nmax). Accordingly, false detection of gently-sloping waveform as single fish can be prevented. - In the foregoing, an embodiment of the present disclosure has been explained. Other embodiments thereof will be explained.
- (1)
Fig. 9 shows a block diagram of an arrangement of asignal processing module 10a of a fish finder according to another embodiment. The fish finder of the present embodiment having a high frequency component reduction module 17 (high frequency component reducer) is different fromfish finder 1 of the foregoing embodiment. Hereinafter, differences withfish finder 1 of the foregoing embodiment will be mainly explained, other explanations will be omitted.
Fig. 10 shows graphs showing an example of variation of the first SV value with depth. The waveform in the dotted line shows a graph before high frequency component reduction is performed by the high frequencycomponent reduction module 17, and the waveform in the solid line shows a graph after high frequency component reduction is performed. The graph illustrated inFig. 10 shows a situation where two single fish are closely separated in the depth direction and the rising edge portion and the falling edge portion of the two graphs are overlapping. Then, as the two graphs (waveforms) are overlapping, they are mutually interfering with each other and as shown with the dotted line ofFig. 10 the first SV values are highly fluctuating in the overlapping area. In such case, as the result of the comparison of said first SV value with the second SV value differs from desired result, in some cases comparison cannot be accurately performed and therefore single fish detection cannot be accurately performed.
As a countermeasure, thesignal processing module 10a of the fish finder of the present embodiment performs with the high frequency component reduction module 17 a high frequency component reduction of the first SV value in the depth direction. With such measure, the high fluctuations of the first SV value explained above are smoothed and a graph as shown with the solid line ofFig. 10 can be obtained. As a result, as an appropriate first SV value graph with high fluctuation removed can be obtained, single fish can be more accurately detected.
Furthermore, as noise of the first SV value graph can also be reduced with the high frequencycomponent reduction module 17 of thesignal processing module 10a of the present embodiment, single fish can be detected more accurately.
Moreover, thesignal processing 10a of the present embodiment performs moving average processing as a processing to reduce high frequency components of the first SV value. As a result, the high frequency components of the first SV value can be appropriately reduced. - (2)
Fig. 11 shows a block diagram of an arrangement of asignal processing module 10b of a fish finder according to another embodiment of the present disclosure. As will be explained in detail later, the fish finder of the present embodiment is arranged to determine the validity of the detection result from the singlefish detection module 20 for each detected single fish and to generate the frequency distribution graph D with only the single fish whose detection result is determined as valid. Namely, the fish finder of the present embodiment eliminates from the frequency distribution graph D single fish whose detection result is not determined as valid. As a result, a frequency distribution graph that uses only single fish data with a high degree of accuracy can be generated. - The fish finder of the present embodiment having a first high frequency component reduction module 18 (first high frequency component reducer), a second high frequency component reduction module 19 (second high frequency component reducer) and a validity evaluation module 25 (validity evaluator) is different from
fish finder 1 of the foregoing embodiment. Moreover, a fishlength calculation module 15a (single target size calculation means, single target size calculator) of the present embodiment and the fishlength calculation module 15 of the foregoing embodiment have also operations that slightly differ. Hereinafter, differences withfish finder 1 of the foregoing embodiment will be mainly explained, other explanations will be omitted. - The first high frequency
component reduction module 18 performs a high frequency component reduction of the first SV value in the depth direction in the same way as the high frequencycomponent reduction module 17 of the fish finder shown inFig. 9 . Specifically, as performed by the high frequencycomponent reduction module 17 shown inFig. 9 , the first high frequencycomponent reduction module 18 performs moving average processing to reduce high frequency components of the first SV value. Note that the lower limit of the frequency that can be reduced by the first high frequencycomponent reduction module 18 of the present embodiment is set so that it is lower than the lower limit of the frequency that can be reduced by the high frequencycomponent reduction module 17 shown inFig. 9 . - The second high frequency
component reduction module 19 performs a high frequency component reduction of the second SV value in the depth direction. Specifically, as performed by the first high frequencycomponent reduction module 18, the second high frequencycomponent reduction module 19 performs moving average processing. - The
validity evaluation module 25 is arranged to evaluate the validity of the single fish detection result from the singlefish detection module 20. Specifically, thevalidity evaluation module 25 evaluates the validity of the detection result of the singlefish detection module 20 based on a relative intensity comparison result of the first SV value graph processed by moving averaging by the first high frequencycomponent reduction module 18 and the second SV value graph processed by moving averaging by the second high frequencycomponent reduction module 19. -
Figs. 12A and 12B show the first SV value graph and the second SV value graph on top of each other when a plurality of single fish are relatively well separated in the depth direction, the waveform shown in a dotted line being the first SV value graph, and the waveform shown in a solid line being the second SV value graph.Fig. 12A shows the waveforms before high frequency component reduction processing andFig. 12B shows the waveforms after high frequency component reduction processing. - Using
Figs. 12A and 12B for explanation purposes, thevalidity evaluation module 25 compares the first SV value processed by moving averaging and the second SV value processed by moving averaging at each depth position Z1 to Z3 where peaks P1 to P3 have been estimated as single fish waveforms by the singlefish detection module 20. Specifically, thevalidity evaluation module 25 subtracts the second SV value processed by moving averaging from the first SV value processed by moving averaging at depth positions Z1 to Z3 that correspond to single fish waveform peaks P1 to P3. Then, thevalidity evaluation module 25 determines whether each subtraction value Δ SV_1 to Δ SV_3 is above a given threshold Thr2. If the subtraction value is above Thr2, thevalidity evaluation module 25 determines that the detection result that detected single fish at depth positions Z1 to Z3 is valid and notifies the verification result to the fishlength calculation module 15a. On the other hand, if the subtraction value is below Thr2, thevalidity evaluation module 25 determines that the detection result that detected single fish at depth positions Z1 to Z3 is not valid and notifies the verification result to the fishlength calculation module 15a. - Among the single fish detected by the single
fish detection module 20, the fishlength calculation module 15a calculates only the fish length of single fish whose detection result has been determined as valid by thevalidity evaluation module 25. Namely, the fishlength calculation module 15a does not calculate the fish length of single fish whose detection result has not been determined as valid by thevalidity evaluation module 25. - The frequency
distribution generation module 16 generates the frequency distribution graph by segmentation of the fish length calculated by the fishlength calculation module 15a for each single fish. Namely, the frequencydistribution generation module 16 generates the frequency distribution graph by only considering the detected single fish whose detection result has been determined as valid. - As explained above, the
validity evaluation module 25 evaluates the validity of the detection result of the singlefish detection module 20 based on first and second SV values processed by high frequency component reduction processing (moving average in the present embodiment). Hereinafter,Figs. 12A, 12B ,13A and 13B are used to explain the validity evaluation of the current method. - As shown in
Fig. 12A , when a plurality of fish are relatively well separated in the depth direction, the mutual interference of each waveform being relatively small, the single fish detection of the singlefish detection module 20 can be relatively accurately performed. Also, when such a plurality of fish are relatively well separated in the depth direction, it can be seen as a characteristic of the first SV graph and second SV graph that there are relatively fewer high fluctuations in the depth direction. In this case, the differences Δ SV_1 to Δ SV_3 between the first SV value processed by moving averaging and the second SV value processed by moving averaging become relatively bigger. - On the other hand, as shown in
Fig. 13A , when a plurality of fish are relatively closely separated in the depth direction, the mutual interference of each waveform being relatively big, the single fish detection of the singlefish detection module 20 cannot be accurately performed in some cases. Also, when such a plurality of fish are relatively closely separated in the depth direction, it can be seen as a characteristic of the first SV graph and second SV graph that there are relatively bigger fluctuations in the depth direction. In this case, the differences Δ SV_4 to Δ SV_8 between the first SV value processed by moving averaging and the second SV value processed by moving averaging become relatively smaller. - Namely, with the
validity evaluation module 25 of the present embodiment, Δ SV_1 to Δ SV_8 values are calculated for each peak waveform of single fish and by comparing those values to threshold Thr2 the validity of the detection result of the singlefish detection module 20 can be appropriately evaluated. - Note that in the present embodiment, the frequency distribution graph is generated by only considering single fish data whose detection result has been determined as valid by the
validity evaluation module 25, but this should not be a limitation. Specifically, as an example, the display can switch between a frequency distribution graph generated with all detected single fish data (total frequency distribution graph) and a frequency distribution graph generated only with single fish data whose detection result has been determined as valid (frequency distribution graph after validity evaluation). The total frequency distribution graph and the frequency distribution graph after validity evaluation explained above can also be displayed simultaneously. - (3) In
fish finder 1 of the foregoing embodiment, threshold Thrl is a constant value, but this should not be a limitation. Specifically, as an example, the fish finder according to the embodiment shown inFig. 11 can calculate an index value representative of fish school density from the result of thevalidity evaluation module 25, and threshold Thrl value can be set based on said index value. Accordingly, threshold Thrl can be set appropriately according to fish density. - (4)
Fig. 14 shows a block diagram of an arrangement of afish finder 1c according to another embodiment of the present disclosure. Compared tofish finder 1 of the foregoing embodiment, atransmission module 6c, areception module 7c and asignal processing module 10c offish finder 1c according to the present embodiment have different arrangements. Hereinafter, differences withfish finder 1 of the foregoing embodiment will be mainly explained, other explanations will be omitted.
Transmission module 6c according to the present embodiment supplies in alternation two transmission signals of mutually different pulse widths totransducer 2 so that two pulse waves (first ultrasonic wave and second ultrasonic wave) of mutually different pulse widths are transmitted fromtransducer 2. Accordingly, first ultrasonic wave and second ultrasonic wave having mutually different pulse widths are alternately transmitted fromtransducer 2. In the present embodiment, the pulse width of the second ultrasonic wave is set to be shorter that the pulse width of the first ultrasonic wave.Transducer 2 alternates between transmission/reception of the first ultrasonic wave and transmission/reception of the second ultrasonic wave. Note that, the frequency of the first ultrasonic wave and the second ultrasonic wave can be made identical or can be made mutually different.
Thereception module 7c amplifies the signal obtained from a reception wave being received bytransducer 2, performs an Analog to Digital conversion of the amplified reception signal, and supplies the converted digital reception signal to thesignal processing module 10c, in the same way as it is done in the foregoing embodiment explained above. Thereception module 7c according to the present embodiment then outputs the reception signal (first reception signal) obtained from a reflection wave of the first ultrasonic wave to the firstSV calculation module 12 and outputs the reception signal (second reception signal) obtained from a reflection wave of the second ultrasonic wave to the secondSV calculation module 13 and to theTS calculation module 14.
Fig. 15 shows a block diagram of an arrangement ofsignal processing module 10c offish finder 1c according to the present embodiment. Insignal processing module 10c according to the present embodiment, the pulse compression module is omitted compared to signalprocessing module 10 according to the foregoing embodiment. Insignal processing module 10c according to the present embodiment, on one hand the firstSV calculation module 12 calculates the first SV value based on a first reception signal whose signal duration is relatively long, and on the other hand the secondSV calculation module 13 calculates the second SV value based on a second reception signal whose signal duration is shorter than the first reception signal. TheTS calculation module 14 also calculates based on the second reception signal the TS value of the reflection wave returned from each depth position.
Therefore, as it is done infish finder 1 of the foregoing embodiment, withfish finder 1c of the present embodiment reception signals having mutually different signal durations can be each inputted to the firstSV calculation module 12 and the secondSV calculation module 13. Therefore, as withfish finder 1 of the foregoing embodiment, withfish finder 1c of the present embodiment single target can be accurately detected.
Note that, in the present embodiment, the transmission module and the transducer can be arranged so that the first ultrasonic wave and the second ultrasonic wave are transmitted simultaneously. In this case, the frequency of the first ultrasonic wave and the second ultrasonic wave need to be set to mutually different frequency values so that the ultrasonic waves are mutually separable. - (5) In
fish finder 1 of the foregoing embodiment,pulse compression module 11 has been used to shorten the signal duration of the reception signal, but this should not be a limitation. Specifically, inverse filtering, adaptive beamforming or other methods to compress the signal duration of the reception signal can be used. - (6) In the fish finder of the embodiment shown in
Fig. 9 , as high frequency component reduction processing performed by the high frequencycomponent reduction module 17 moving average processing has been used as an example but this should not be a limitation, other processing such as low pass filtering to reduce high frequency components can be performed. Similarly, in the fish finder of the embodiment shown inFig. 11 , as high frequency component reduction processing performed by the first high frequencycomponent reduction module 18 and the second high frequencycomponent reduction module 19 moving average processing has been used as an example but this should not be a limitation, other processing such as low pass filtering explained above to reduce high frequency components can be performed. - (7) In the fish finder of the foregoing embodiment and the fish finders of the other embodiments above, the signal processing module can be used for example as an abnormal value detection module (illustration omitted). The abnormal value detection module compares the Δ SV value with a given threshold and when said Δ SV value is above the threshold, said Δ SV value is not considered when single fish detection is performed. In this case, said threshold is set to a value so that inappropriate Δ SV value can be removed. As a result, by not considering abnormal Δ SV value when performing single fish detection, a more accurate single fish detection can be performed.
- (8)
Fig. 16 shows a flow chart of operation of a fish finder according to another embodiment. In the foregoing embodiment, as shown in S14 ofFig. 7 , when the Δ SV value keeps above threshold Thrl in the depth direction continuously for at least a given number of times (lower limit value Nmin) and for at the most a given number of times (upper limit value Nmax), a single fish is detected based on the waveform, but this should not be a limitation. Specifically, as shown in S14a ofFig. 16 , when the Δ SV value keeps above threshold Thrl in the depth direction continuously for at least a given number of times (lower limit value Nmin), a single fish can be detected based on the waveform. - (9) In the foregoing embodiment and other embodiments, as an example of detection apparatus a fish finder has been explained but this should not be a limitation; it can be applied to a radar apparatus.
Fig. 17 shows a block diagram of an arrangement of aradar apparatus 1d according to another embodiment of the present disclosure.Radar apparatus 1d is used to detect target above sea level (for example other vessels).Radar apparatus 1d is for example installed on a ship such as a fishing vessel.
Hereinafter, differences ofradar apparatus 1d withfish finder 1 of the foregoing embodiment will be mainly explained. Arrangements similar or identical to those infish finder 1 are referred to in the drawings with the same reference numerals and the detailed description thereof is omitted.
As shown inFig. 17 ,radar apparatus 1d is comprised of an antenna 2a,transceiver unit 3,signal processing module 10 and operation/display unit 4.
Antenna 2a is for example installed on a vessel and used to transmit and receive electromagnetic waves. Antenna 2a of the present embodiment operates both as a transmitting element array and a receiving element array. Antenna 2a comprises a plurality of antenna elements (illustration omitted) operated both as transmitting elements and receiving elements. Said antenna elements are for example linearly arranged. However, such arrangement should not be a limitation; antenna elements can be 2 dimensionally or 3 dimensionally arranged.
Apart from the fact that the transmission and reception waves are electromagnetic waves and that other vessel or aircraft are single targets to be detected,transceiver unit 3,signal processing module 10 and operation/display unit 4 ofradar apparatus 1d operate in the same way as infish finder 1 of the foregoing embodiment.
For example, when it rains, when a conventional radar detects targets such as other vessel, it happens that single target cannot accurately be detected due to rain. However, with theradar apparatus 1d of the present embodiment single target can be detected without being affected by rain. Therefore, asfish finder 1 of the foregoing embodiment, theradar apparatus 1d can accurately detect single target. - (10) In the foregoing embodiment, a chirp wave is transmitted from
transducer 2 but it should not a limitation as other waveforms can also be used. - (11) In the foregoing embodiment, volume backscattering strength is used as first echo intensity and second echo intensity, but this should not be a limitation. Specifically, echo intensity can be calculated for example by compensating for the duration of the reception signal or by compensating for the beam width in which the transmission wave is transmitted by the transducer.
- (12)
Fig. 18 shows a block diagram of an arrangement of afish finder 1e according to another embodiment of the present disclosure. Moreover,Fig. 19 shows a block diagram of an arrangement of asignal processing module 10e of thefish finder 1e shown inFig. 18 . Compared to the arrangements of thefish finder 1c shown inFig. 14 , the arrangement oftransmission module 6e,reception module 7e andsignal processing module 10e of thefish finder 1e according to the present embodiment differ. Hereinafter, differences withfish finder 1c shown inFig. 14 will be explained, other explanations will be omitted.
Transmission module 6e supplies in alternation two transmission signals of mutually different frequencies totransducer 2 so that two pulse waves (first transmission wave and second transmission wave) of mutually different beam widths are transmitted fromtransducer 2. Accordingly, first ultrasonic wave (first transmission wave) and second ultrasonic wave (second transmission wave) having mutually different beam widths are alternately transmitted fromtransducer 2. In the present embodiment, the beam width of the second ultrasonic wave is set to be smaller than the beam width of the first ultrasonic wave.Transducer 2 alternates between transmission/reception of the first ultrasonic wave and transmission/reception of the second ultrasonic wave.
Thereception module 7e amplifies the signal obtained from a reception wave being received bytransducer 2, performs an Analog to Digital conversion of the amplified reception signal, and supplies the converted digital reception signal to thesignal processing module 10e, in the same way as it is done in the foregoing embodiment. Thereception module 7e according to the present embodiment then outputs the reception signal (first reception signal) obtained from a reflection wave of the first ultrasonic wave to a first echointensity calculation module 12e (first echo intensity calculation means, first echo intensity calculator) of thesignal processing module 10e and outputs the reception signal (second reception signal) obtained from a reflection wave of the second ultrasonic wave to a second echointensity calculation module 13e (second echo intensity calculation means, second echo intensity calculator) of thesignal processing module 10e.
Thesignal processing 10e is arranged so that the firstSV calculation module 12 of thesignal processing module 10c shown inFig. 15 is replaced by the first echointensity calculation module 12e, the secondSV calculation module 13 is replaced by the second echointensity calculation module 13e, and ΔSV calculation module 21 is replaced by the intensitydifference calculation module 21e. The first echointensity calculation module 12e uses the echo intensity of the first reception signal compensated with the beam width of the first ultrasonic wave as the first echo intensity. The second echointensity calculation module 13e uses the echo intensity of the second reception signal compensated with the beam width of the second ultrasonic wave as the second echo intensity. The intensitydifference calculation module 21e calculates for each depth position a difference between the first echo intensity and the second echo intensity (intensity difference). Specifically, the intensitydifference calculation module 21e calculates the intensity difference by subtracting the first echo intensity from the second echo intensity for each depth position.
As in the foregoing embodiment, thecomparison module 22 of thesignal processing module 10e of the present embodiment detects single fish based on a comparison result of the intensity difference calculated by the intensitydifference calculation module 21e with a given threshold, and a count value counted bycounter 22a of saidcomparison module 22. As the remaining processing ofsignal processing module 10e is identical to the foregoing embodiment, explanation is omitted.
Asfish finder 1 of the foregoing embodiment,fish finder 1e of the present embodiment can accurately detect single fish (target).
Moreover,fish finder 1e calculates the echo intensity of each reception signal by compensating for the beam width of each transmission signal. Accordingly, the first echo intensity and the second echo intensity can be appropriately calculated.
Note that in the present embodiment, the echo intensity of the first reception signal compensated with the beam width of the first ultrasonic wave is used as the first echo intensity, and the echo intensity of the second reception signal compensated with the beam width of the second ultrasonic wave is used as the second echo intensity. However, without any limitation to this, the echo intensity of the first reception signal compensated with a duration of the first reception signal can be used as the first echo intensity, and the echo intensity of the second reception signal compensated with a duration of the second reception signal can be used as the second echo intensity. Still without any limitation to this, volume backscattering strength can be used as the first echo intensity and the second echo intensity.
Moreover, in the present embodiment, in order to form two transmission waves having mutually different beam widths, transmission waves having mutually different frequencies are formed but this should not be a limitation. Specifically, as an example, it is possible to adjust the beam width of the transmission wave transmitted by each transducer by having transducers with mutually different shapes or transducers containing mutually a different number of ultrasonic elements, or transducers containing an ultrasonic element of mutually different size.
Moreover, in the present embodiment,transducer 2 transmits in alternation and repeatedly first transmission wave and second transmission wave, but this should not be a limitation as it is possible to simultaneously transmit first and second transmission waves. In this case, the frequency of the first transmission wave and the frequency of the second transmission wave need to be set to mutually different frequencies. - (13) In the foregoing embodiment, when calculating the echo intensity using equation (1), as an approximation, the length of the first reception signal is set to the duration of the transmission signal (for example the chirp signal) generated by the transmission module, and as an approximation, the length of the second reflection signal is set to the duration the chirp signal generated by the transmission module would have after being compressed by the pulse compression module, but it should not be a limitation. Without performing any approximation, the actual length of each reception signal can be measured. For example, the length of each reception signal can be simply measured by calculating the time difference between the rising and falling edges of the reception signal.
- 1. A detection apparatus (1, 1c, 1d, 1e), comprising:
- a first echo intensity calculation means (12, 12e) configured to calculate a first echo intensity of a first reception signal generated from a reception wave reflected on a reflection object;
- a second echo intensity calculation means (13, 13e) configured to calculate a second echo intensity of a second reception signal generated from a reception wave reflected on said reflection object, a signal duration of said second reception signal being shorter than that of said first reception signal; and
- a target detection means (20) configured to detect a target from a comparison of said first echo intensity and said second echo intensity.
- 2. The detection apparatus (1, 1c, 1d, 1e) of
statement 1, further comprising:- a transducer (2, 2a) configured to transmit a transmission wave; and
- a compression means (11) configured to compress said first reception signal generated from said reception wave resulting from a reflection of said transmission wave on said reflection object to generate said second reception signal, wherein
- said second echo intensity calculation means (13, 13e) calculates said second echo intensity from said second reception signal compressed by said compression means (11).
- 3. The detection apparatus (1, 1c, 1d, 1e) of
statement 1, further comprising:- a transducer (2, 2a) configured to transmit a first transmission wave and a second transmission wave, a pulse width of the second transmission wave being shorter than that of the first transmission wave, wherein
- said first echo intensity calculation means (12, 12e) calculates said first echo intensity based on a reception wave resulting from a reflection of said first transmission wave on said reflection object; and
- said second echo intensity calculation means (13, 13e) calculates said second echo intensity based on a reception wave resulting from a reflection of said second transmission wave on said reflection object.
- 4. The detection apparatus (1, 1c, 1d, 1e) of any of the preceding statements, wherein
said target detection means (20) detects said target on a condition that said second echo intensity is bigger than said first echo intensity. - 5. The detection apparatus (1, 1c, 1d, 1e) of
statement 4, wherein
said target detection means (20) detects said target on a condition that said second echo intensity is bigger than said first echo intensity by at least a given value. - 6. The detection apparatus (1, 1c, 1d, 1e) of any of the preceding statements, wherein
said first echo intensity calculation means (12, 12e) calculates said first echo intensity by compensating for the duration of said first reception signal; and
said second echo intensity calculation means (13, 13e) calculates said second echo intensity by compensating for the duration of said second reception signal. - 7. The detection apparatus (1, 1c, 1d, 1e) of
statement 6, wherein
said first echo intensity calculation means (12, 12e) calculates said first echo intensity by compensating for a volume of said first reception signal, said volume of the first reception signal corresponding to the duration of said first reception signal; and
said second echo intensity calculation means (13, 13e) calculates said second echo intensity by compensating for a volume of said second reception signal, said volume of the second reception signal corresponding to the duration of said second reception signal. - 8. The detection apparatus (1, 1c, 1d, 1e) of any of the preceding statements, wherein
said first echo intensity calculation means (12, 12e) calculates volume backscattering strength of said first reception signal as said first echo intensity; and
said second echo intensity calculation means (13, 13e) calculates volume backscattering strength of said second reception signal as said second echo intensity. - 9. The detection apparatus (1, 1c, 1d, 1e) of any of the preceding statements, further comprising:
- a high frequency component reduction means (17) configured to reduce a high frequency component of said first echo intensity, wherein
- said target detection means (20) compares said first echo intensity from which high frequency component is reduced by said high frequency component reduction means (17) and said second echo intensity.
- 10. The detection apparatus (1, 1c, 1d, 1e) of statement 9, wherein
said high frequency component reduction means (17) reduces the high frequency component of said first echo intensity by performing a moving average of the first echo intensity. - 11. The detection apparatus (1, 1c, 1d, 1e) of any of the preceding statements, further comprising:
- a first high frequency component reduction means (18) configured to reduce a high frequency component of said first echo intensity;
- a second high frequency component reduction means (19) configured to reduce a high frequency component of said second echo intensity; and
- a validity evaluation means (25) configured to evaluate a validity of a detection result of said target detection means (20) based on a ratio of said first echo intensity from which high frequency component is reduced by said first high frequency component reduction means (18) and said second echo intensity from which high frequency component is reduced by said second high frequency component reduction means (19).
- 12. An underwater detection apparatus (1, 1c, 1e), comprising the detection apparatus of any of the preceding statements, wherein said target is at least one of a fish school, a single fish or a single aquatic species.
- 13. A radar apparatus (1d) comprising the detection apparatus of any one of
statements 1 to 11. - 14. The underwater detection (1, 1c, 1e) apparatus of
statement 12, wherein
said target detection means (20) is provided as a single aquatic species detection means configured to detect a single fish or a single aquatic species as a single target;
the underwater detection apparatus further comprising:- a single target size calculation means (15, 15a) configured to calculate a size of said single target detected by said single aquatic species detection means.
- 15. A detection method, comprising:
- calculating a first echo intensity (S4) of a first reception signal generated from a reception wave reflected on a reflection object;
- calculating a second echo intensity (S5) of a second reception signal generated from a reception wave reflected on said reflection object, a signal duration of said second reception signal being shorter than that of said first reception signal; and
- detecting a target (S10) from a comparison of said first echo intensity and said second echo intensity.
- Features of one aspect of the invention may be applied to any other aspect.
Claims (15)
- A detection apparatus (1, 1c, 1d, 1e), comprising:a transducer (2, 2a) configured to transmit a transmission wave;a first echo intensity calculation means (12, 12e) configured to calculate a first echo intensity of a first reception signal generated from a reception wave resulting from a reflection of said transmission wave on a reflection object;a second echo intensity calculation means (13, 13e) configured to calculate a second echo intensity of a second reception signal generated from a reception wave resulting from a reflection of said transmission wave on said reflection object, a signal duration of said second reception signal being shorter than that of said first reception signal; anda target detection means (20) configured to detect a target from a relative intensity comparison of said first echo intensity and said second echo intensity.
- The detection apparatus (1, 1c, 1d, 1e) of claim 1, further comprising:a compression means (11) configured to compress said first reception signal to generate said second reception signal, whereinsaid second echo intensity calculation means (13, 13e) calculates said second echo intensity from said second reception signal compressed by said compression means (11).
- The detection apparatus (1, 1c, 1d, 1e) of claim 1, wherein:said transducer (2, 2a) transmits a first transmission wave and a second transmission wave as said transmission wave, a pulse width of the second transmission wave being shorter than that of the first transmission wave;said first echo intensity calculation means (12, 12e) calculates said first echo intensity based on a reception wave resulting from a reflection of said first transmission wave on said reflection object; andsaid second echo intensity calculation means (13, 13e) calculates said second echo intensity based on a reception wave resulting from a reflection of said second transmission wave on said reflection object.
- The detection apparatus (1, 1c, 1d, 1e) of any of the preceding claims, wherein
said target detection means (20) detects said target on a condition that said second echo intensity is bigger than said first echo intensity. - The detection apparatus (1, 1c, 1d, 1e) of claim 4, wherein
said target detection means (20) detects said target on a condition that said second echo intensity is bigger than said first echo intensity by at least a given value. - The detection apparatus (1, 1c, 1d, 1e) of claim 2, wherein
said first echo intensity calculation means (12, 12e) calculates said first echo intensity by compensating for a beam width in which said transmission wave is transmitted by the transducer by reducing a value obtained based on a voltage of said first reception signal with a value obtained based on said beam width; and
said second echo intensity calculation means (13, 13e) calculates said second echo intensity by compensating for said beam width in which said transmission wave is transmitted by the transducer by reducing a value obtained based on a voltage of said second reception signal with said value obtained based on said beam width. - The detection apparatus (1, 1c, 1d, 1e) of claim 3, wherein
said first echo intensity calculation means (12, 12e) calculates said first echo intensity by compensating for a beam width in which said first transmission wave is transmitted by the transducer by reducing a value obtained based on a voltage of said first reception signal with a value obtained based on said beam width in which said first transmission wave is transmitted; and
said second echo intensity calculation means (13, 13e) calculates said second echo intensity by compensating for a beam width in which said second transmission wave is transmitted by the transducer by reducing a value obtained based on a voltage of said second reception signal with a value obtained based on said beam width in which said second transmission wave is transmitted. - The detection apparatus (1, 1c, 1d, 1e) of any of the preceding claims, wherein
said first echo intensity calculation means (12, 12e) calculates said first echo intensity by compensating for the duration of said first reception signal by reducing a value obtained based on a voltage of said first reception signal with a value obtained based on the duration of said first reception signal; and
said second echo intensity calculation means (13, 13e) calculates said second echo intensity by compensating for the duration of said second reception signal by reducing a value obtained based on a voltage of said second reception signal with a value obtained based on the duration of said second reception signal. - The detection apparatus (1, 1c, 1d, 1e) of any of the preceding claims, wherein
said first echo intensity calculation means (12, 12e) calculates volume backscattering strength of said first reception signal as said first echo intensity; and
said second echo intensity calculation means (13, 13e) calculates volume backscattering strength of said second reception signal as said second echo intensity. - The detection apparatus (1, 1c, 1d, 1e) of any of the preceding claims, further comprising:a high frequency component reduction means (17) configured to reduce a high frequency component of said first echo intensity, whereinsaid target detection means (20) compares the relative intensity of said first echo intensity from which high frequency component is reduced by said high frequency component reduction means (17) and said second echo intensity.
- The detection apparatus (1, 1c, 1d, 1e) of claim 10, wherein
said high frequency component reduction means (17) reduces the high frequency component of said first echo intensity by performing a moving average of the first echo intensity. - The detection apparatus (1, 1c, 1d, 1e) of any of the preceding claims, further comprising:a first high frequency component reduction means (18) configured to reduce a high frequency component of said first echo intensity;a second high frequency component reduction means (19) configured to reduce a high frequency component of said second echo intensity; anda validity evaluation means (25) configured to evaluate a validity of a detection result of said target detection means (20) based on a ratio of said first echo intensity from which high frequency component is reduced by said first high frequency component reduction means (18) and said second echo intensity from which high frequency component is reduced by said second high frequency component reduction means (19).
- An underwater detection apparatus (1, 1c, 1e), comprising the detection apparatus of any of the preceding claims, wherein
said target is at least one of a fish school, a single fish or a single aquatic species; and
said target detection means (20) is provided as a single aquatic species detection means configured to detect a single fish or a single aquatic species as a single target,
the underwater detection apparatus further comprising:a single target size calculation means (15, 15a) configured to calculate a size of said single target detected by said single aquatic species detection means. - A radar apparatus (1d) comprising the detection apparatus of any one of claims 1 to 12.
- A detection method, comprising:transmitting a transmission wave (S1);calculating a first echo intensity (S4) of a first reception signal generated from a reception wave resulting from a reflection of said transmission wave on a reflection object;calculating a second echo intensity (S5) of a second reception signal generated from a reception wave resulting from a reflection of said transmission wave on said reflection object, a signal duration of said second reception signal being shorter than that of said first reception signal; anddetecting a target (S10) from a relative intensity comparison of said first echo intensity and said second echo intensity.
Applications Claiming Priority (1)
| Application Number | Priority Date | Filing Date | Title |
|---|---|---|---|
| EP15188493.9A EP3153882A1 (en) | 2015-10-06 | 2015-10-06 | Detection apparatus, underwater detection apparatus, radar apparatus, and detection method |
Publications (2)
| Publication Number | Publication Date |
|---|---|
| EP3153883A1 true EP3153883A1 (en) | 2017-04-12 |
| EP3153883B1 EP3153883B1 (en) | 2019-12-11 |
Family
ID=54260686
Family Applications (2)
| Application Number | Title | Priority Date | Filing Date |
|---|---|---|---|
| EP15188493.9A Withdrawn EP3153882A1 (en) | 2015-10-06 | 2015-10-06 | Detection apparatus, underwater detection apparatus, radar apparatus, and detection method |
| EP16192088.9A Active EP3153883B1 (en) | 2015-10-06 | 2016-10-03 | Detection apparatus, underwater detection apparatus, radar apparatus, and detection method |
Family Applications Before (1)
| Application Number | Title | Priority Date | Filing Date |
|---|---|---|---|
| EP15188493.9A Withdrawn EP3153882A1 (en) | 2015-10-06 | 2015-10-06 | Detection apparatus, underwater detection apparatus, radar apparatus, and detection method |
Country Status (3)
| Country | Link |
|---|---|
| US (1) | US10156632B2 (en) |
| EP (2) | EP3153882A1 (en) |
| JP (1) | JP6809861B2 (en) |
Families Citing this family (3)
| Publication number | Priority date | Publication date | Assignee | Title |
|---|---|---|---|---|
| CN108761428B (en) * | 2018-06-07 | 2022-07-05 | 北京理工大学 | Pulse laser fuse aerosol interference resisting method based on echo characteristic identification |
| JP7051625B2 (en) * | 2018-07-12 | 2022-04-11 | 古野電気株式会社 | Underwater detector and underwater detection method |
| CN110720926A (en) * | 2019-10-16 | 2020-01-24 | 谢灏 | Shower stall falling detection system and detection method |
Citations (6)
| Publication number | Priority date | Publication date | Assignee | Title |
|---|---|---|---|---|
| JPH05196733A (en) * | 1992-10-26 | 1993-08-06 | Kaijo Corp | Single fish discriminating circuit of fish finder |
| JPH05223936A (en) * | 1992-02-14 | 1993-09-03 | Furuno Electric Co Ltd | Fish-finder |
| JPH08101271A (en) * | 1994-09-29 | 1996-04-16 | Japan Radio Co Ltd | Single / group signal detector and various devices using the same |
| US20080080317A1 (en) * | 2006-10-02 | 2008-04-03 | Furuno Electric Company, Ltd. | Fishfinder |
| US20120139773A1 (en) * | 2010-12-03 | 2012-06-07 | Furuno Electric Co., Ltd. | Detection device, detecting method and detection program |
| EP2518528A2 (en) * | 2011-04-26 | 2012-10-31 | Furuno Electric Company Limited | Method and apparatus for measuring target length, and computer readable media storing target length measurement program |
Family Cites Families (4)
| Publication number | Priority date | Publication date | Assignee | Title |
|---|---|---|---|---|
| JP3088174B2 (en) * | 1992-02-06 | 2000-09-18 | 古野電気株式会社 | Underwater detector |
| US7039505B1 (en) * | 2002-07-19 | 2006-05-02 | Avidyne Corporation | Method for digital transmission and display of weather imagery |
| JP2012225651A (en) * | 2011-04-14 | 2012-11-15 | Furuno Electric Co Ltd | Underwater detection device, fish finder, underwater detection method and program |
| JP5798150B2 (en) * | 2013-05-30 | 2015-10-21 | 本田技研工業株式会社 | Object detection device |
-
2015
- 2015-10-06 EP EP15188493.9A patent/EP3153882A1/en not_active Withdrawn
-
2016
- 2016-05-20 US US15/160,732 patent/US10156632B2/en active Active
- 2016-10-03 EP EP16192088.9A patent/EP3153883B1/en active Active
- 2016-10-03 JP JP2016195377A patent/JP6809861B2/en active Active
Patent Citations (6)
| Publication number | Priority date | Publication date | Assignee | Title |
|---|---|---|---|---|
| JPH05223936A (en) * | 1992-02-14 | 1993-09-03 | Furuno Electric Co Ltd | Fish-finder |
| JPH05196733A (en) * | 1992-10-26 | 1993-08-06 | Kaijo Corp | Single fish discriminating circuit of fish finder |
| JPH08101271A (en) * | 1994-09-29 | 1996-04-16 | Japan Radio Co Ltd | Single / group signal detector and various devices using the same |
| US20080080317A1 (en) * | 2006-10-02 | 2008-04-03 | Furuno Electric Company, Ltd. | Fishfinder |
| US20120139773A1 (en) * | 2010-12-03 | 2012-06-07 | Furuno Electric Co., Ltd. | Detection device, detecting method and detection program |
| EP2518528A2 (en) * | 2011-04-26 | 2012-10-31 | Furuno Electric Company Limited | Method and apparatus for measuring target length, and computer readable media storing target length measurement program |
Non-Patent Citations (1)
| Title |
|---|
| M KANG: "Effective and accurate use of difference in mean volume backscattering strength to identify fish and plankton", ICES JOURNAL OF MARINE SCIENCE, vol. 59, no. 4, 1 August 2002 (2002-08-01), pages 794 - 804, XP055259656, ISSN: 1054-3139, DOI: 10.1006/jmsc.2002.1229 * |
Also Published As
| Publication number | Publication date |
|---|---|
| US10156632B2 (en) | 2018-12-18 |
| US20170097415A1 (en) | 2017-04-06 |
| EP3153882A1 (en) | 2017-04-12 |
| JP6809861B2 (en) | 2021-01-06 |
| EP3153883B1 (en) | 2019-12-11 |
| JP2017072589A (en) | 2017-04-13 |
Similar Documents
| Publication | Publication Date | Title |
|---|---|---|
| EP3153884B1 (en) | Detection apparatus, fish finder, and radar | |
| EP2677341B1 (en) | Apparatus and method for detecting target object | |
| EP2383584B1 (en) | Method and device for detecting ultrasound wave, and method and device for detecting school of fish | |
| JP4475982B2 (en) | Weighing fish finder and fish length measuring method | |
| US9268021B2 (en) | Detection device and computer readable media storing detection program | |
| EP3086137B1 (en) | Underwater detection apparatus | |
| US9541645B2 (en) | Detecting device, fish finder and detecting method | |
| EP3153883B1 (en) | Detection apparatus, underwater detection apparatus, radar apparatus, and detection method | |
| CN110840488B (en) | Imaging method, system and device based on shear wave | |
| GB2506995A (en) | Fish type distinguishing device, signal processing apparatus, and underwater detector | |
| JP6347660B2 (en) | Fish finder, single fish detection method, and single fish detection program | |
| JP5423713B2 (en) | Active sonar device and signal processing method thereof | |
| JP7745260B2 (en) | Method and device for counting fish | |
| KR102391935B1 (en) | Apparatus and method for estimating angle of the low velocity target in the radar | |
| RU2559310C2 (en) | Method of estimating distance to noisy object at sea | |
| JP7242243B2 (en) | Distance/speed measuring device and distance/speed measuring program | |
| EP3610290B1 (en) | Robust and accurate close range detection for ultrasonic level measurement | |
| EP2369367A1 (en) | A method for measuring the distance to a near target | |
| JP6340086B2 (en) | Ultrasonic body tissue detection device, ultrasonic body tissue detection method, and ultrasonic body tissue detection program | |
| JP2015165245A (en) | Apparatus and method for target detection | |
| RU2791163C1 (en) | Method for detecting probing signals | |
| RU2789812C1 (en) | Echo sounder | |
| RU2758586C1 (en) | Automatic detection and classification system | |
| RU2660081C1 (en) | Method of processing sonar information | |
| RU2603831C1 (en) | Method of determination of iceberg lowest point immersion depth |
Legal Events
| Date | Code | Title | Description |
|---|---|---|---|
| PUAI | Public reference made under article 153(3) epc to a published international application that has entered the european phase |
Free format text: ORIGINAL CODE: 0009012 |
|
| STAA | Information on the status of an ep patent application or granted ep patent |
Free format text: STATUS: THE APPLICATION HAS BEEN PUBLISHED |
|
| AK | Designated contracting states |
Kind code of ref document: A1 Designated state(s): AL AT BE BG CH CY CZ DE DK EE ES FI FR GB GR HR HU IE IS IT LI LT LU LV MC MK MT NL NO PL PT RO RS SE SI SK SM TR |
|
| AX | Request for extension of the european patent |
Extension state: BA ME |
|
| STAA | Information on the status of an ep patent application or granted ep patent |
Free format text: STATUS: REQUEST FOR EXAMINATION WAS MADE |
|
| 17P | Request for examination filed |
Effective date: 20171003 |
|
| RBV | Designated contracting states (corrected) |
Designated state(s): AL AT BE BG CH CY CZ DE DK EE ES FI FR GB GR HR HU IE IS IT LI LT LU LV MC MK MT NL NO PL PT RO RS SE SI SK SM TR |
|
| GRAP | Despatch of communication of intention to grant a patent |
Free format text: ORIGINAL CODE: EPIDOSNIGR1 |
|
| STAA | Information on the status of an ep patent application or granted ep patent |
Free format text: STATUS: GRANT OF PATENT IS INTENDED |
|
| INTG | Intention to grant announced |
Effective date: 20190711 |
|
| GRAS | Grant fee paid |
Free format text: ORIGINAL CODE: EPIDOSNIGR3 |
|
| GRAA | (expected) grant |
Free format text: ORIGINAL CODE: 0009210 |
|
| STAA | Information on the status of an ep patent application or granted ep patent |
Free format text: STATUS: THE PATENT HAS BEEN GRANTED |
|
| AK | Designated contracting states |
Kind code of ref document: B1 Designated state(s): AL AT BE BG CH CY CZ DE DK EE ES FI FR GB GR HR HU IE IS IT LI LT LU LV MC MK MT NL NO PL PT RO RS SE SI SK SM TR |
|
| REG | Reference to a national code |
Ref country code: GB Ref legal event code: FG4D |
|
| REG | Reference to a national code |
Ref country code: CH Ref legal event code: EP |
|
| REG | Reference to a national code |
Ref country code: AT Ref legal event code: REF Ref document number: 1212750 Country of ref document: AT Kind code of ref document: T Effective date: 20191215 |
|
| REG | Reference to a national code |
Ref country code: DE Ref legal event code: R096 Ref document number: 602016025908 Country of ref document: DE |
|
| REG | Reference to a national code |
Ref country code: IE Ref legal event code: FG4D |
|
| REG | Reference to a national code |
Ref country code: NL Ref legal event code: MP Effective date: 20191211 |
|
| REG | Reference to a national code |
Ref country code: LT Ref legal event code: MG4D |
|
| PG25 | Lapsed in a contracting state [announced via postgrant information from national office to epo] |
Ref country code: GR Free format text: LAPSE BECAUSE OF FAILURE TO SUBMIT A TRANSLATION OF THE DESCRIPTION OR TO PAY THE FEE WITHIN THE PRESCRIBED TIME-LIMIT Effective date: 20200312 Ref country code: FI Free format text: LAPSE BECAUSE OF FAILURE TO SUBMIT A TRANSLATION OF THE DESCRIPTION OR TO PAY THE FEE WITHIN THE PRESCRIBED TIME-LIMIT Effective date: 20191211 Ref country code: LT Free format text: LAPSE BECAUSE OF FAILURE TO SUBMIT A TRANSLATION OF THE DESCRIPTION OR TO PAY THE FEE WITHIN THE PRESCRIBED TIME-LIMIT Effective date: 20191211 Ref country code: BG Free format text: LAPSE BECAUSE OF FAILURE TO SUBMIT A TRANSLATION OF THE DESCRIPTION OR TO PAY THE FEE WITHIN THE PRESCRIBED TIME-LIMIT Effective date: 20200311 Ref country code: SE Free format text: LAPSE BECAUSE OF FAILURE TO SUBMIT A TRANSLATION OF THE DESCRIPTION OR TO PAY THE FEE WITHIN THE PRESCRIBED TIME-LIMIT Effective date: 20191211 Ref country code: LV Free format text: LAPSE BECAUSE OF FAILURE TO SUBMIT A TRANSLATION OF THE DESCRIPTION OR TO PAY THE FEE WITHIN THE PRESCRIBED TIME-LIMIT Effective date: 20191211 Ref country code: NO Free format text: LAPSE BECAUSE OF FAILURE TO SUBMIT A TRANSLATION OF THE DESCRIPTION OR TO PAY THE FEE WITHIN THE PRESCRIBED TIME-LIMIT Effective date: 20200311 |
|
| PG25 | Lapsed in a contracting state [announced via postgrant information from national office to epo] |
Ref country code: RS Free format text: LAPSE BECAUSE OF FAILURE TO SUBMIT A TRANSLATION OF THE DESCRIPTION OR TO PAY THE FEE WITHIN THE PRESCRIBED TIME-LIMIT Effective date: 20191211 Ref country code: HR Free format text: LAPSE BECAUSE OF FAILURE TO SUBMIT A TRANSLATION OF THE DESCRIPTION OR TO PAY THE FEE WITHIN THE PRESCRIBED TIME-LIMIT Effective date: 20191211 |
|
| PG25 | Lapsed in a contracting state [announced via postgrant information from national office to epo] |
Ref country code: AL Free format text: LAPSE BECAUSE OF FAILURE TO SUBMIT A TRANSLATION OF THE DESCRIPTION OR TO PAY THE FEE WITHIN THE PRESCRIBED TIME-LIMIT Effective date: 20191211 |
|
| PG25 | Lapsed in a contracting state [announced via postgrant information from national office to epo] |
Ref country code: PT Free format text: LAPSE BECAUSE OF FAILURE TO SUBMIT A TRANSLATION OF THE DESCRIPTION OR TO PAY THE FEE WITHIN THE PRESCRIBED TIME-LIMIT Effective date: 20200506 Ref country code: RO Free format text: LAPSE BECAUSE OF FAILURE TO SUBMIT A TRANSLATION OF THE DESCRIPTION OR TO PAY THE FEE WITHIN THE PRESCRIBED TIME-LIMIT Effective date: 20191211 Ref country code: CZ Free format text: LAPSE BECAUSE OF FAILURE TO SUBMIT A TRANSLATION OF THE DESCRIPTION OR TO PAY THE FEE WITHIN THE PRESCRIBED TIME-LIMIT Effective date: 20191211 Ref country code: NL Free format text: LAPSE BECAUSE OF FAILURE TO SUBMIT A TRANSLATION OF THE DESCRIPTION OR TO PAY THE FEE WITHIN THE PRESCRIBED TIME-LIMIT Effective date: 20191211 Ref country code: ES Free format text: LAPSE BECAUSE OF FAILURE TO SUBMIT A TRANSLATION OF THE DESCRIPTION OR TO PAY THE FEE WITHIN THE PRESCRIBED TIME-LIMIT Effective date: 20191211 Ref country code: EE Free format text: LAPSE BECAUSE OF FAILURE TO SUBMIT A TRANSLATION OF THE DESCRIPTION OR TO PAY THE FEE WITHIN THE PRESCRIBED TIME-LIMIT Effective date: 20191211 |
|
| PG25 | Lapsed in a contracting state [announced via postgrant information from national office to epo] |
Ref country code: SM Free format text: LAPSE BECAUSE OF FAILURE TO SUBMIT A TRANSLATION OF THE DESCRIPTION OR TO PAY THE FEE WITHIN THE PRESCRIBED TIME-LIMIT Effective date: 20191211 Ref country code: SK Free format text: LAPSE BECAUSE OF FAILURE TO SUBMIT A TRANSLATION OF THE DESCRIPTION OR TO PAY THE FEE WITHIN THE PRESCRIBED TIME-LIMIT Effective date: 20191211 Ref country code: IS Free format text: LAPSE BECAUSE OF FAILURE TO SUBMIT A TRANSLATION OF THE DESCRIPTION OR TO PAY THE FEE WITHIN THE PRESCRIBED TIME-LIMIT Effective date: 20200411 |
|
| REG | Reference to a national code |
Ref country code: DE Ref legal event code: R097 Ref document number: 602016025908 Country of ref document: DE |
|
| REG | Reference to a national code |
Ref country code: AT Ref legal event code: MK05 Ref document number: 1212750 Country of ref document: AT Kind code of ref document: T Effective date: 20191211 |
|
| PLBE | No opposition filed within time limit |
Free format text: ORIGINAL CODE: 0009261 |
|
| STAA | Information on the status of an ep patent application or granted ep patent |
Free format text: STATUS: NO OPPOSITION FILED WITHIN TIME LIMIT |
|
| PG25 | Lapsed in a contracting state [announced via postgrant information from national office to epo] |
Ref country code: DK Free format text: LAPSE BECAUSE OF FAILURE TO SUBMIT A TRANSLATION OF THE DESCRIPTION OR TO PAY THE FEE WITHIN THE PRESCRIBED TIME-LIMIT Effective date: 20191211 |
|
| 26N | No opposition filed |
Effective date: 20200914 |
|
| PG25 | Lapsed in a contracting state [announced via postgrant information from national office to epo] |
Ref country code: SI Free format text: LAPSE BECAUSE OF FAILURE TO SUBMIT A TRANSLATION OF THE DESCRIPTION OR TO PAY THE FEE WITHIN THE PRESCRIBED TIME-LIMIT Effective date: 20191211 Ref country code: AT Free format text: LAPSE BECAUSE OF FAILURE TO SUBMIT A TRANSLATION OF THE DESCRIPTION OR TO PAY THE FEE WITHIN THE PRESCRIBED TIME-LIMIT Effective date: 20191211 |
|
| PG25 | Lapsed in a contracting state [announced via postgrant information from national office to epo] |
Ref country code: IT Free format text: LAPSE BECAUSE OF FAILURE TO SUBMIT A TRANSLATION OF THE DESCRIPTION OR TO PAY THE FEE WITHIN THE PRESCRIBED TIME-LIMIT Effective date: 20191211 |
|
| PG25 | Lapsed in a contracting state [announced via postgrant information from national office to epo] |
Ref country code: PL Free format text: LAPSE BECAUSE OF FAILURE TO SUBMIT A TRANSLATION OF THE DESCRIPTION OR TO PAY THE FEE WITHIN THE PRESCRIBED TIME-LIMIT Effective date: 20191211 |
|
| REG | Reference to a national code |
Ref country code: CH Ref legal event code: PL |
|
| PG25 | Lapsed in a contracting state [announced via postgrant information from national office to epo] |
Ref country code: MC Free format text: LAPSE BECAUSE OF FAILURE TO SUBMIT A TRANSLATION OF THE DESCRIPTION OR TO PAY THE FEE WITHIN THE PRESCRIBED TIME-LIMIT Effective date: 20191211 Ref country code: LU Free format text: LAPSE BECAUSE OF NON-PAYMENT OF DUE FEES Effective date: 20201003 |
|
| REG | Reference to a national code |
Ref country code: BE Ref legal event code: MM Effective date: 20201031 |
|
| PG25 | Lapsed in a contracting state [announced via postgrant information from national office to epo] |
Ref country code: BE Free format text: LAPSE BECAUSE OF NON-PAYMENT OF DUE FEES Effective date: 20201031 Ref country code: CH Free format text: LAPSE BECAUSE OF NON-PAYMENT OF DUE FEES Effective date: 20201031 Ref country code: LI Free format text: LAPSE BECAUSE OF NON-PAYMENT OF DUE FEES Effective date: 20201031 |
|
| PG25 | Lapsed in a contracting state [announced via postgrant information from national office to epo] |
Ref country code: IE Free format text: LAPSE BECAUSE OF NON-PAYMENT OF DUE FEES Effective date: 20201003 |
|
| PG25 | Lapsed in a contracting state [announced via postgrant information from national office to epo] |
Ref country code: TR Free format text: LAPSE BECAUSE OF FAILURE TO SUBMIT A TRANSLATION OF THE DESCRIPTION OR TO PAY THE FEE WITHIN THE PRESCRIBED TIME-LIMIT Effective date: 20191211 Ref country code: MT Free format text: LAPSE BECAUSE OF FAILURE TO SUBMIT A TRANSLATION OF THE DESCRIPTION OR TO PAY THE FEE WITHIN THE PRESCRIBED TIME-LIMIT Effective date: 20191211 Ref country code: CY Free format text: LAPSE BECAUSE OF FAILURE TO SUBMIT A TRANSLATION OF THE DESCRIPTION OR TO PAY THE FEE WITHIN THE PRESCRIBED TIME-LIMIT Effective date: 20191211 |
|
| PG25 | Lapsed in a contracting state [announced via postgrant information from national office to epo] |
Ref country code: MK Free format text: LAPSE BECAUSE OF FAILURE TO SUBMIT A TRANSLATION OF THE DESCRIPTION OR TO PAY THE FEE WITHIN THE PRESCRIBED TIME-LIMIT Effective date: 20191211 |
|
| P01 | Opt-out of the competence of the unified patent court (upc) registered |
Effective date: 20230523 |
|
| PGFP | Annual fee paid to national office [announced via postgrant information from national office to epo] |
Ref country code: GB Payment date: 20250904 Year of fee payment: 10 |
|
| PGFP | Annual fee paid to national office [announced via postgrant information from national office to epo] |
Ref country code: FR Payment date: 20250908 Year of fee payment: 10 |
|
| PGFP | Annual fee paid to national office [announced via postgrant information from national office to epo] |
Ref country code: DE Payment date: 20250902 Year of fee payment: 10 |