EP3019697B1 - Characterizing wellbore depth interval from rock fragments - Google Patents
Characterizing wellbore depth interval from rock fragments Download PDFInfo
- Publication number
- EP3019697B1 EP3019697B1 EP14823207.7A EP14823207A EP3019697B1 EP 3019697 B1 EP3019697 B1 EP 3019697B1 EP 14823207 A EP14823207 A EP 14823207A EP 3019697 B1 EP3019697 B1 EP 3019697B1
- Authority
- EP
- European Patent Office
- Prior art keywords
- rock fragment
- individual
- sample
- rock
- bulk
- Prior art date
- Legal status (The legal status is an assumption and is not a legal conclusion. Google has not performed a legal analysis and makes no representation as to the accuracy of the status listed.)
- Not-in-force
Links
Images



Classifications
-
- G—PHYSICS
- G16—INFORMATION AND COMMUNICATION TECHNOLOGY [ICT] SPECIALLY ADAPTED FOR SPECIFIC APPLICATION FIELDS
- G16Z—INFORMATION AND COMMUNICATION TECHNOLOGY [ICT] SPECIALLY ADAPTED FOR SPECIFIC APPLICATION FIELDS, NOT OTHERWISE PROVIDED FOR
- G16Z99/00—Subject matter not provided for in other main groups of this subclass
-
- E—FIXED CONSTRUCTIONS
- E21—EARTH OR ROCK DRILLING; MINING
- E21B—EARTH OR ROCK DRILLING; OBTAINING OIL, GAS, WATER, SOLUBLE OR MELTABLE MATERIALS OR A SLURRY OF MINERALS FROM WELLS
- E21B49/00—Testing the nature of borehole walls; Formation testing; Methods or apparatus for obtaining samples of soil or well fluids, specially adapted to earth drilling or wells
-
- E—FIXED CONSTRUCTIONS
- E21—EARTH OR ROCK DRILLING; MINING
- E21B—EARTH OR ROCK DRILLING; OBTAINING OIL, GAS, WATER, SOLUBLE OR MELTABLE MATERIALS OR A SLURRY OF MINERALS FROM WELLS
- E21B49/00—Testing the nature of borehole walls; Formation testing; Methods or apparatus for obtaining samples of soil or well fluids, specially adapted to earth drilling or wells
- E21B49/02—Testing the nature of borehole walls; Formation testing; Methods or apparatus for obtaining samples of soil or well fluids, specially adapted to earth drilling or wells by mechanically taking samples of the soil
-
- G—PHYSICS
- G01—MEASURING; TESTING
- G01N—INVESTIGATING OR ANALYSING MATERIALS BY DETERMINING THEIR CHEMICAL OR PHYSICAL PROPERTIES
- G01N21/00—Investigating or analysing materials by the use of optical means, i.e. using sub-millimetre waves, infrared, visible or ultraviolet light
- G01N21/17—Systems in which incident light is modified in accordance with the properties of the material investigated
- G01N21/25—Colour; Spectral properties, i.e. comparison of effect of material on the light at two or more different wavelengths or wavelength bands
- G01N21/31—Investigating relative effect of material at wavelengths characteristic of specific elements or molecules, e.g. atomic absorption spectrometry
- G01N21/35—Investigating relative effect of material at wavelengths characteristic of specific elements or molecules, e.g. atomic absorption spectrometry using infrared light
-
- G—PHYSICS
- G01—MEASURING; TESTING
- G01N—INVESTIGATING OR ANALYSING MATERIALS BY DETERMINING THEIR CHEMICAL OR PHYSICAL PROPERTIES
- G01N21/00—Investigating or analysing materials by the use of optical means, i.e. using sub-millimetre waves, infrared, visible or ultraviolet light
- G01N21/62—Systems in which the material investigated is excited whereby it emits light or causes a change in wavelength of the incident light
- G01N21/63—Systems in which the material investigated is excited whereby it emits light or causes a change in wavelength of the incident light optically excited
- G01N21/65—Raman scattering
-
- G—PHYSICS
- G01—MEASURING; TESTING
- G01N—INVESTIGATING OR ANALYSING MATERIALS BY DETERMINING THEIR CHEMICAL OR PHYSICAL PROPERTIES
- G01N21/00—Investigating or analysing materials by the use of optical means, i.e. using sub-millimetre waves, infrared, visible or ultraviolet light
- G01N21/62—Systems in which the material investigated is excited whereby it emits light or causes a change in wavelength of the incident light
- G01N21/71—Systems in which the material investigated is excited whereby it emits light or causes a change in wavelength of the incident light thermally excited
- G01N21/718—Laser microanalysis, i.e. with formation of sample plasma
-
- G—PHYSICS
- G01—MEASURING; TESTING
- G01N—INVESTIGATING OR ANALYSING MATERIALS BY DETERMINING THEIR CHEMICAL OR PHYSICAL PROPERTIES
- G01N23/00—Investigating or analysing materials by the use of wave or particle radiation, e.g. X-rays or neutrons, not covered by groups G01N3/00 – G01N17/00, G01N21/00 or G01N22/00
- G01N23/20—Investigating or analysing materials by the use of wave or particle radiation, e.g. X-rays or neutrons, not covered by groups G01N3/00 – G01N17/00, G01N21/00 or G01N22/00 by using diffraction of the radiation by the materials, e.g. for investigating crystal structure; by using scattering of the radiation by the materials, e.g. for investigating non-crystalline materials; by using reflection of the radiation by the materials
-
- G—PHYSICS
- G01—MEASURING; TESTING
- G01N—INVESTIGATING OR ANALYSING MATERIALS BY DETERMINING THEIR CHEMICAL OR PHYSICAL PROPERTIES
- G01N23/00—Investigating or analysing materials by the use of wave or particle radiation, e.g. X-rays or neutrons, not covered by groups G01N3/00 – G01N17/00, G01N21/00 or G01N22/00
- G01N23/22—Investigating or analysing materials by the use of wave or particle radiation, e.g. X-rays or neutrons, not covered by groups G01N3/00 – G01N17/00, G01N21/00 or G01N22/00 by measuring secondary emission from the material
- G01N23/223—Investigating or analysing materials by the use of wave or particle radiation, e.g. X-rays or neutrons, not covered by groups G01N3/00 – G01N17/00, G01N21/00 or G01N22/00 by measuring secondary emission from the material by irradiating the sample with X-rays or gamma-rays and by measuring X-ray fluorescence
-
- G—PHYSICS
- G01—MEASURING; TESTING
- G01N—INVESTIGATING OR ANALYSING MATERIALS BY DETERMINING THEIR CHEMICAL OR PHYSICAL PROPERTIES
- G01N33/00—Investigating or analysing materials by specific methods not covered by groups G01N1/00 - G01N31/00
- G01N33/26—Oils; Viscous liquids; Paints; Inks
- G01N33/28—Oils, i.e. hydrocarbon liquids
- G01N33/2823—Raw oil, drilling fluid or polyphasic mixtures
-
- G—PHYSICS
- G01—MEASURING; TESTING
- G01N—INVESTIGATING OR ANALYSING MATERIALS BY DETERMINING THEIR CHEMICAL OR PHYSICAL PROPERTIES
- G01N21/00—Investigating or analysing materials by the use of optical means, i.e. using sub-millimetre waves, infrared, visible or ultraviolet light
- G01N21/17—Systems in which incident light is modified in accordance with the properties of the material investigated
- G01N21/25—Colour; Spectral properties, i.e. comparison of effect of material on the light at two or more different wavelengths or wavelength bands
- G01N21/31—Investigating relative effect of material at wavelengths characteristic of specific elements or molecules, e.g. atomic absorption spectrometry
- G01N21/35—Investigating relative effect of material at wavelengths characteristic of specific elements or molecules, e.g. atomic absorption spectrometry using infrared light
- G01N2021/3595—Investigating relative effect of material at wavelengths characteristic of specific elements or molecules, e.g. atomic absorption spectrometry using infrared light using FTIR
Definitions
- Oilfield operators drill wellbores to access subterranean reservoirs. Often they desire to characterize the formations that are penetrated by the wellbores. For example, such characterization facilitates estimation of the amount and accessibility of hydrocarbons in reservoir rocks. However, it can be difficult to perform such characterization, particularly when it is infeasible to insert appropriate tools in the wellbore and/or to obtain core samples.
- FIG. 1 shows an illustrative drilling environment.
- a drilling platform 2 supports a derrick 4 having a traveling block 6 for raising and lowering a drill string 8.
- a top drive 10 supports and rotates the drill string 8 as it is lowered through the wellhead 12.
- a drill bit 14 is driven by a downhole motor and/or rotation of the drill string 8. As bit 14 rotates, it creates a wellbore 16 that passes through various formation layers.
- a pump 18 circulates drilling fluid 20 through a feed pipe 22, through the interior of the drill string 8 to drill bit 14.
- the fluid exits through orifices in the drill bit 14 and flows upward through the annulus around the drill string 8 to transport rock fragments or "cuttings" to the surface.
- the drilling fluid is filtered to remove the rock fragments and the drilling fluid is recirculated back down the drill string 8 to repeat the process.
- the rock fragments filtered out from the drilling fluid are representative of the rock formation depth interval from which they originate from.
- the disclosed methods identify one or more rock fragments that best represent the depth interval of the thousands of rock fragments transported to the surface.
- the disclosed methods provide a cost-effective way to investigate and characterize a formation that provides a valid representation of the intervals of interest.
- the rock fragments are delivered to a lab still mixed with the drilling fluid, which is removed from the rock fragments so that they can be analyzed more accurately.
- the rock fragments from the interval are divided into at least two fractions (e.g., divisions A & B). These fractions are maintained consistent with each other so that the analysis performed on each fraction and the corresponding results are also consistent (since they are from the same depth interval).
- This consistency is achieved by using a sample splitter for unbiased splitting (e.g. Gilson Universal Stainless Steel Mini-Splitter; many other splitters are known in the art and are not discussed further), such as splitter 200 shown in FIG. 2 .
- additional divisions e.g., division C, division D, etc.
- a sample is prepared for analysis, for example, for XRF analysis by pulverizing the sample and pressing the resulting powder into a pellet that is analyzed using a handheld micro-XRF device such as XRF device 300 shown in FIG. 3 , though other non-handheld devices may also be used.
- XRF analysis a sample is exposed to short-wavelength X-rays, ionizing the sample's atoms. This ionization results from the ejection of one or more inner orbital electrons of the atoms. This creates instability in the atom and electrons in higher orbitals drop down into the lower orbitals, releasing energy in the form of a photon. This absorption and subsequent re-emission of radiation in this manner is referred to as fluorescence.
- the XRF device analyzes the fluorescent radiation by sorting the energies of the photons (energy-dispersive analysis) and/or by separating the wavelengths of the radiation (wavelength-dispersive analysis).
- the composition of a sample can be determined from this analysis because the intensity of each element's characteristic radiation is directly related to the amount of that element in the sample.
- XRD X-ray diffraction
- FTIR Fourier transform infrared spectroscopy
- LIBS laser-induced breakdown spectroscopy
- Raman spectroscopy any other type of electromagnetic spectroscopy
- the division A sample is pulverized and placed into a sample die and then covered with a binding powder (e.g., boric acid, cellulose, etc.).
- the die is placed under a press that compresses the sample using significant pressure (e.g., 20 tons of pressure), yielding a uniform pellet.
- significant pressure e.g. 20 tons of pressure
- fused beads or pellets may also or instead be produced.
- the resulting pellet is analyzed using, for example, XRF 300 of FIG. 3 to determine the sample's elemental composition.
- the XRF device 300 is pointed at the sample and activated to expose the sample to radiation and measure the resulting re-emissions.
- the result is displayed on the device as show, and may also be transferred to a computing system for further processing as discussed in more detail below. Results from the elemental analysis of this pellet are now considered representative of the rock composition throughout the sample interval and are referred to as the bulk analysis results.
- the division B sample (which is from the same depth interval as the division A sample) is repeatedly subdivided with the sample splitter (a device that provides an unbiased segregation of rock fragments within a sample) until the desired amount of rock fragments remain (e.g., 20-30 rock fragments).
- the remaining rock fragments are placed on a flat surface and mounted in epoxy. In at least some illustrative embodiments, this mounting is performed under vacuum.
- the resulting epoxy chip containing the rock fragments is ground down until at least one face of each rock fragment is exposed with rough polish. This enables each rock fragment's surface to be analyzed utilizing XRF techniques. As with the bulk sample, other measurement and analysis techniques, such as those previously described, may be applied to the exposed rock fragment.
- the measurements are processed and converted into a concentration percent such as weight percent or volume percent.
- concentration percent such as weight percent or volume percent.
- the XRF counts are processed using an appropriate calibration so that the counts can be converted into elemental weight percent.
- An example of such a calibration is described in Rowe, Loucks, Ruppel, and Rimmer, "Mississippian Barnett Formation, Ft Worth Basin, Texas: Bulk Geochemical Inferences and Mo-TOC Constraints on the Severity of Hydrographic Restriction", Chemical Geology 257 (2008) 16-25 . Certain elements may be emphasized more than others based on expected formation properties.
- the individual rock fragment sample (division B) can be compared to the bulk analysis sample (division A).
- a normalized deviation of the elemental weight percent of the division B samples vs. the bulk elemental weight percent is computed by selecting a base element using descriptive statistics based on weight percentage from the bulk analysis. The individual rock fragments are ranked based on this normalized deviation, and one or more of these rock fragments are selected based on their ranking.
- the selected rock fragments are imaged using any one of numerous techniques, including but not limited to white light, X-ray projection and X-Ray computerized tomography.
- the resulting images, along with the sample rankings are used to select the final rock fragments measured to determine rock properties such as, e.g., porosity, absolute and relative permeability, elasticity, electrical properties, etc. Such properties may be evaluated based on the normalized deviation, with a smaller deviation rock fragment considered representative of the typical rock properties for the interval and the larger deviation rock fragments defining the range of rock properties for the interval.
- FIG. 4 shows an illustrative flowchart for the above-described method
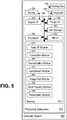
- FIG. 5 shows a block diagram of a computer system 5.
- Both hardware and software components of computer system 500 are shown, which in at least some illustrative embodiments implement at least part of the wellbore depth interval characterization shown as method 400 in FIG. 4 (described in detail below).
- a user may interact with computer system 500 via keyboard 534, pointing device 535 (e.g., a mouse) and display 536 to configure, control and monitor the execution of the wellbore depth interval characterization.
- a display interface 552 Located within processing subsystem 530 of computer system 500 is a display interface 552, a processor 556, a peripheral interface 558, an information storage device 560, a network interface 562 and a memory 570.
- Bus 564 couples each of these elements to each other and transports their communications.
- Network interface 562 enables communications with other systems (e.g., via the Internet with a central database server housing well logging data).
- processor 556 processes input from the user and applies it to the well logging data to perform the disclosed methods and present the results to the user.
- Storage device 560 may be implemented using any number of known non-transitory information storage media, including but not limited to magnetic disks, solid-state storage devices and optical storage disks.
- Various software modules are shown loaded into memory 570 of FIG. 5 , where they are each accessed by processor 556 for execution. These modules include: User Interface Module 572, which interacts with the input/output devices utilized by the user to interact with processing system 530; analysis module 574, which calibrates and analyzes the data for both bulk samples (division A) and individual rock fragment samples (division B); normalization module 576, which performs the normalization computations; ranking and selection module 578, which ranks and selects individual rock fragment samples based on normalization values; image evaluation module 580, which evaluates images of selected individual rock fragment samples; rock property module 582, which determines representative rock properties and a range of rock properties based on selected individual rock fragment samples; and presentations module 584, which present to a user the results of method 500. In at least some illustrative embodiments, the results are presented in graphical form (e.g., as an image of the various bed layers of a formation within a wellbore depth range).
- method 400 begins by obtaining rock fragments for a given depth interval from the drilling fluid expelled during drilling of a wellbore (block 402).
- the drilling fluid is removed from the rock fragments, which are then split into two, unbiased sample divisions (block 404) using a sample splitter as previously described (e.g., 5 grams of division A and 5 grams of division B).
- the sample for division A is pulverized and formed into a pellet to prepare it for bulk analysis (block 406), and a bulk analysis is performed on the pressed pellet (block 408).
- a sample splitter is repeatedly used to produce an unbiased reduction of the number of individual rock fragments in the sample for division B until the desired number of rock fragments is achieved (e.g., 20-30 rock fragments), with the resulting rock fragments being encased in epoxy to form a wafer with exposed rock fragment faces as previously described (block 410).
- An individual analysis similar to that performed on the pressed pellet is then performed on each of the rock fragments within the epoxy wafer (block 412).
- the analysis data collected in blocks 408 and 412 is processed by a computer system such as computer system 500 of FIG. 5 .
- the bulk and individual data is converted into concentration percent, e.g., a weight percent using a calibration technique as previously described (block 414; Conversion Module 574).
- concentration percent e.g., a weight percent using a calibration technique as previously described (block 414; Conversion Module 574).
- the resulting weight percent values are subsequently used to compute for each individual rock fragment within sample division B a normalized deviation of weight percent versus the bulk weight percent of sample division A (block 416; Normalization Module 576).
- ⁇ i 1 N
- the computed normalized deviations provide a basis for ranking the rock fragments within sample division B (block 416; Rank/Select Module 578) and selecting one or more of the rock fragments based on the rankings (block 418; Rank/Select Module 578). For example, in at least some illustrative embodiments one or more of the rock fragments with the smallest normalized deviations (relative to the bulk sample division) are selected as representative of the rock present in the wellbore depth interval from which the rock fragments originated during drilling.
- the selected rock fragments are subsequently imaged using any of a number of imaging techniques (e.g. white light, X-ray projection, X-ray computerized tomography, etc.) so as to ascertain the suitability of the rock fragments for measuring various properties of the rock (block 420; Image Evaluation Module 580).
- imaging techniques e.g. white light, X-ray projection, X-ray computerized tomography, etc.
- properties include, but are not limited to porosity, absolute and relative permeability, elasticity and electrical properties.
- the suitability of the selected rock fragments may be ascertained based upon, for example, the number of fractures observed, as well as the size and color of the sample. Damaged samples with a high number of fractures can present issues when imaging such samples with a scanning electron microscope (SEM).
- SEM scanning electron microscope
- the size/aspect ratio of a sample can have an effect on sample preparation, and as a result larger samples are preferred.
- color may also be used to identify statistical outliers, thus providing additional criteria for determining the suitability of the selected rock fragments for measuring the properties of interest.
- Rock fragments identified as suitable are selected and their properties measured (block 422; Rock Property Module 582).
- the properties of the suitable rock fragment with the smallest normalized deviation are treated as representative of the rock properties of the depth interval from which the rock fragment originated, and the properties of suitable rock fragments with larger normalized deviations are used to characterize the range of rock properties with said depth interval (block 424; Rock Property Module 582).
- the resulting properties are presented to a user of the system (block 426; Presentation Module 584), for example, by graphically representing the formation bed layering traversed by the wellbore to illustrate the various rock types and/or rock properties on a display or image log, or by presenting a well log of one or more of the properties of the wellbore (e.g., as shown in FIG.
- ending method 400 (block 428).
- the method thus enables the properties of a rock formation to be characterized through judicious selection of rock fragments that are identified as being most representative of the depth interval from which they originate, allowing the analysis of the samples to be scaled up and applied to the entire interval with a high degree of confidence.
- the disclosed methods and systems provides data describing the properties of formation rock that can be used to assist with validation of the target zone for a pilot well and, for horizontal wells, to confirm containment within a target zone before making completion decisions.
- the disclosed methods and systems can provide such information for wells where LWD or wireline data is not available, and can provide additional data points for determining reserve estimations (e.g., when utilizing SEM data).
Landscapes
- Life Sciences & Earth Sciences (AREA)
- Physics & Mathematics (AREA)
- Engineering & Computer Science (AREA)
- Chemical & Material Sciences (AREA)
- Health & Medical Sciences (AREA)
- Mining & Mineral Resources (AREA)
- Geology (AREA)
- Biochemistry (AREA)
- Pathology (AREA)
- Immunology (AREA)
- General Physics & Mathematics (AREA)
- General Health & Medical Sciences (AREA)
- Analytical Chemistry (AREA)
- Fluid Mechanics (AREA)
- General Life Sciences & Earth Sciences (AREA)
- Geochemistry & Mineralogy (AREA)
- Environmental & Geological Engineering (AREA)
- Soil Sciences (AREA)
- Spectroscopy & Molecular Physics (AREA)
- Nuclear Medicine, Radiotherapy & Molecular Imaging (AREA)
- Medicinal Chemistry (AREA)
- Food Science & Technology (AREA)
- Oil, Petroleum & Natural Gas (AREA)
- General Chemical & Material Sciences (AREA)
- Chemical Kinetics & Catalysis (AREA)
- Crystallography & Structural Chemistry (AREA)
- Optics & Photonics (AREA)
- Plasma & Fusion (AREA)
- Analysing Materials By The Use Of Radiation (AREA)
- Testing Or Calibration Of Command Recording Devices (AREA)
- Investigating, Analyzing Materials By Fluorescence Or Luminescence (AREA)
Description
- This application claims priority to Provisional
U.S. Application Ser. No. 61/845,272 - Oilfield operators drill wellbores to access subterranean reservoirs. Often they desire to characterize the formations that are penetrated by the wellbores. For example, such characterization facilitates estimation of the amount and accessibility of hydrocarbons in reservoir rocks. However, it can be difficult to perform such characterization, particularly when it is infeasible to insert appropriate tools in the wellbore and/or to obtain core samples.
- It would be desirable to characterize the penetrated formations based on the rock fragments obtained from the drilling process itself. Such a process preferably would overcome certain obstacles, e.g., the fragments are necessarily much smaller than core samples, only statistically associated with given wellbore intervals, and subject to contamination by the drilling fluid used to flush them from the wellbore.
- Currently, it is known method and a system to characterize subterranean formations, described by the document
US2017/073207 . This document includes extracting drill cuttings from a drilling fluid, and grouping the drill cuttings into a group of cuttings based on a time of arrival of the drill cuttings at the Earth's surface, wherein these steps can be repeated at least once to provide a plurality of groups of drill cuttings that arrive sequentially at different recorded times that correspond to different downhole locations. However this method requires a high number of individual measurements in order to achieve a desirable characterization. - A better understanding of the various disclosed embodiments can be obtained when the following detailed description is considered in conjunction with the attached drawings, in which:
-
FIG. 1 is a schematic diagram of an illustrative drilling environment. -
FIG. 2 is an image of an illustrative sample splitter. -
FIG. 3 is an image of an illustrative handheld micro X-ray fluorescence device. -
FIG. 4 is a flowchart showing an illustrative method for characterizing a wellbore depth interval from rock fragments. -
FIG. 5 is a block diagram of a computer system suitable for implementing at least part of the disclosed methods in software. -
FIG. 6 shows an example of several illustrative well logs of properties of the wellbore. - It should be understood that the drawings and corresponding detailed description do not limit the disclosure, but on the contrary, they provide the foundation for understanding all modifications, equivalents, and alternatives falling within the scope of the appended claims.
- The paragraphs that follow describe illustrative methods and systems for characterizing a wellbore depth interval from rock fragments. Illustrative drilling environments are first described, followed by a description of the separation of rock fragments produced by drilling operations into at least two samples. The preparation of the rock fragment samples is then described, followed by a description of several methods that process and combine measurements of the samples to produce a characterization of the rock for the depth interval from which the samples originated. The disclosed methods are also presented within the context of an illustrative system and a software-based implementation by said system. Together, the system and software may perform at least part of the disclosed methods to characterize the depth interval of interest.
- The disclosed methods and systems are best understood in the context of the larger systems in which they operate. Accordingly,
FIG. 1 shows an illustrative drilling environment. A drilling platform 2 supports a derrick 4 having atraveling block 6 for raising and lowering a drill string 8. Atop drive 10 supports and rotates the drill string 8 as it is lowered through thewellhead 12. Adrill bit 14 is driven by a downhole motor and/or rotation of the drill string 8. Asbit 14 rotates, it creates awellbore 16 that passes through various formation layers. Apump 18 circulates drillingfluid 20 through afeed pipe 22, through the interior of the drill string 8 to drillbit 14. The fluid exits through orifices in thedrill bit 14 and flows upward through the annulus around the drill string 8 to transport rock fragments or "cuttings" to the surface. At the surface, the drilling fluid is filtered to remove the rock fragments and the drilling fluid is recirculated back down the drill string 8 to repeat the process. - The rock fragments filtered out from the drilling fluid are representative of the rock formation depth interval from which they originate from. The disclosed methods identify one or more rock fragments that best represent the depth interval of the thousands of rock fragments transported to the surface. The disclosed methods provide a cost-effective way to investigate and characterize a formation that provides a valid representation of the intervals of interest.
- In at least some illustrative embodiments, the rock fragments are delivered to a lab still mixed with the drilling fluid, which is removed from the rock fragments so that they can be analyzed more accurately. Once they have been cleaned, the rock fragments from the interval are divided into at least two fractions (e.g., divisions A & B). These fractions are maintained consistent with each other so that the analysis performed on each fraction and the corresponding results are also consistent (since they are from the same depth interval). This consistency is achieved by using a sample splitter for unbiased splitting (e.g. Gilson Universal Stainless Steel Mini-Splitter; many other splitters are known in the art and are not discussed further), such as
splitter 200 shown inFIG. 2 . In other illustrative embodiments, additional divisions (e.g., division C, division D, etc.) may be produce for additional bulk and individual cuttings analysis performed in addition to the analysis of divisions A & B described below. - The division A sample is prepared for analysis, for example, for XRF analysis by pulverizing the sample and pressing the resulting powder into a pellet that is analyzed using a handheld micro-XRF device such as
XRF device 300 shown inFIG. 3 , though other non-handheld devices may also be used. In XRF analysis a sample is exposed to short-wavelength X-rays, ionizing the sample's atoms. This ionization results from the ejection of one or more inner orbital electrons of the atoms. This creates instability in the atom and electrons in higher orbitals drop down into the lower orbitals, releasing energy in the form of a photon. This absorption and subsequent re-emission of radiation in this manner is referred to as fluorescence. The XRF device analyzes the fluorescent radiation by sorting the energies of the photons (energy-dispersive analysis) and/or by separating the wavelengths of the radiation (wavelength-dispersive analysis). The composition of a sample can be determined from this analysis because the intensity of each element's characteristic radiation is directly related to the amount of that element in the sample. - It should be noted that although the examples described herein are presented within the context of XRF measurements and analysis, the disclosed combination of bulk sample analysis and individual cuttings sample analysis is not limited to XRF measurements and analysis. Many other sample measurement and analysis techniques such as X-ray diffraction (XRD), Fourier transform infrared spectroscopy (FTIR), laser-induced breakdown spectroscopy (LIBS), Raman spectroscopy and/or any other type of electromagnetic spectroscopy, are suitable for use within the methods and systems described, and all such measurement and analysis techniques are within the scope of the present disclosure.
- For illustrative embodiments utilizing XRF analysis, the division A sample is pulverized and placed into a sample die and then covered with a binding powder (e.g., boric acid, cellulose, etc.). The die is placed under a press that compresses the sample using significant pressure (e.g., 20 tons of pressure), yielding a uniform pellet. In other illustrative embodiments, fused beads or pellets may also or instead be produced. The resulting pellet is analyzed using, for example, XRF 300 of
FIG. 3 to determine the sample's elemental composition. TheXRF device 300 is pointed at the sample and activated to expose the sample to radiation and measure the resulting re-emissions. The result is displayed on the device as show, and may also be transferred to a computing system for further processing as discussed in more detail below. Results from the elemental analysis of this pellet are now considered representative of the rock composition throughout the sample interval and are referred to as the bulk analysis results. - The division B sample (which is from the same depth interval as the division A sample) is repeatedly subdivided with the sample splitter (a device that provides an unbiased segregation of rock fragments within a sample) until the desired amount of rock fragments remain (e.g., 20-30 rock fragments). The remaining rock fragments are placed on a flat surface and mounted in epoxy. In at least some illustrative embodiments, this mounting is performed under vacuum. The resulting epoxy chip containing the rock fragments is ground down until at least one face of each rock fragment is exposed with rough polish. This enables each rock fragment's surface to be analyzed utilizing XRF techniques. As with the bulk sample, other measurement and analysis techniques, such as those previously described, may be applied to the exposed rock fragment.
- After measurements are performed on both division A and division B samples, the measurements are processed and converted into a concentration percent such as weight percent or volume percent. For the illustrative XRF embodiment presented, the XRF counts are processed using an appropriate calibration so that the counts can be converted into elemental weight percent. An example of such a calibration is described in Rowe, Loucks, Ruppel, and Rimmer, "Mississippian Barnett Formation, Ft Worth Basin, Texas: Bulk Geochemical Inferences and Mo-TOC Constraints on the Severity of Hydrographic Restriction", Chemical Geology 257 (2008) 16-25. Certain elements may be emphasized more than others based on expected formation properties. After both the bulk analysis sample (division A) and the individual rock fragment sample (division B) are converted into elemental weight percent, the individual rock fragment sample (division B) can be compared to the bulk analysis sample (division A). In at least some illustrative embodiments, a normalized deviation of the elemental weight percent of the division B samples vs. the bulk elemental weight percent (see examples below) is computed by selecting a base element using descriptive statistics based on weight percentage from the bulk analysis. The individual rock fragments are ranked based on this normalized deviation, and one or more of these rock fragments are selected based on their ranking.
- Once ranked, the selected rock fragments are imaged using any one of numerous techniques, including but not limited to white light, X-ray projection and X-Ray computerized tomography. In at least some illustrative embodiments, the resulting images, along with the sample rankings, are used to select the final rock fragments measured to determine rock properties such as, e.g., porosity, absolute and relative permeability, elasticity, electrical properties, etc. Such properties may be evaluated based on the normalized deviation, with a smaller deviation rock fragment considered representative of the typical rock properties for the interval and the larger deviation rock fragments defining the range of rock properties for the interval.
-
FIG. 4 shows an illustrative flowchart for the above-described method, whileFIG. 5 shows a block diagram of a computer system 5. Both hardware and software components ofcomputer system 500 are shown, which in at least some illustrative embodiments implement at least part of the wellbore depth interval characterization shown asmethod 400 inFIG. 4 (described in detail below). A user may interact withcomputer system 500 viakeyboard 534, pointing device 535 (e.g., a mouse) anddisplay 536 to configure, control and monitor the execution of the wellbore depth interval characterization. - Located within
processing subsystem 530 ofcomputer system 500 is adisplay interface 552, aprocessor 556, aperipheral interface 558, aninformation storage device 560, anetwork interface 562 and amemory 570.Bus 564 couples each of these elements to each other and transports their communications.Network interface 562 enables communications with other systems (e.g., via the Internet with a central database server housing well logging data). In accordance with user input received viaperipheral interface 558 and program instructions frommemory 570 and/orinformation storage device 560,processor 556 processes input from the user and applies it to the well logging data to perform the disclosed methods and present the results to the user.Storage device 560 may be implemented using any number of known non-transitory information storage media, including but not limited to magnetic disks, solid-state storage devices and optical storage disks. - Various software modules are shown loaded into
memory 570 ofFIG. 5 , where they are each accessed byprocessor 556 for execution. These modules include:User Interface Module 572, which interacts with the input/output devices utilized by the user to interact withprocessing system 530;analysis module 574, which calibrates and analyzes the data for both bulk samples (division A) and individual rock fragment samples (division B);normalization module 576, which performs the normalization computations; ranking andselection module 578, which ranks and selects individual rock fragment samples based on normalization values;image evaluation module 580, which evaluates images of selected individual rock fragment samples;rock property module 582, which determines representative rock properties and a range of rock properties based on selected individual rock fragment samples; andpresentations module 584, which present to a user the results ofmethod 500. In at least some illustrative embodiments, the results are presented in graphical form (e.g., as an image of the various bed layers of a formation within a wellbore depth range). - Referring now to both
FIGS. 4 and5 ,method 400 begins by obtaining rock fragments for a given depth interval from the drilling fluid expelled during drilling of a wellbore (block 402). The drilling fluid is removed from the rock fragments, which are then split into two, unbiased sample divisions (block 404) using a sample splitter as previously described (e.g., 5 grams of division A and 5 grams of division B). The sample for division A is pulverized and formed into a pellet to prepare it for bulk analysis (block 406), and a bulk analysis is performed on the pressed pellet (block 408). Similarly, a sample splitter is repeatedly used to produce an unbiased reduction of the number of individual rock fragments in the sample for division B until the desired number of rock fragments is achieved (e.g., 20-30 rock fragments), with the resulting rock fragments being encased in epoxy to form a wafer with exposed rock fragment faces as previously described (block 410). An individual analysis similar to that performed on the pressed pellet is then performed on each of the rock fragments within the epoxy wafer (block 412). - It at least some illustrative embodiments, the analysis data collected in
blocks computer system 500 ofFIG. 5 . The bulk and individual data is converted into concentration percent, e.g., a weight percent using a calibration technique as previously described (block 414; Conversion Module 574). The resulting weight percent values are subsequently used to compute for each individual rock fragment within sample division B a normalized deviation of weight percent versus the bulk weight percent of sample division A (block 416; Normalization Module 576). The following equations are examples of normalized deviations that in at least some illustrative embodiments are based on elemental weight percent:


- N = a number of elements or minerals under consideration,
- Wi = an individual rock fragment sample's weight percent for element or mineral i,
- Wib = the bulk rock fragment sample's weight percent for the element or mineral i,
- WY = a weight percent of the highest weighted element or mineral in the bulk rock fragment sample, and
- WX = a weight percent of an individual rock fragment sample of the plurality of individual rock fragment samples that corresponding to the highest element or mineral weight percent in the bulk rock fragment sample.
- The computed normalized deviations provide a basis for ranking the rock fragments within sample division B (block 416; Rank/Select Module 578) and selecting one or more of the rock fragments based on the rankings (block 418; Rank/Select Module 578). For example, in at least some illustrative embodiments one or more of the rock fragments with the smallest normalized deviations (relative to the bulk sample division) are selected as representative of the rock present in the wellbore depth interval from which the rock fragments originated during drilling.
- The selected rock fragments are subsequently imaged using any of a number of imaging techniques (e.g. white light, X-ray projection, X-ray computerized tomography, etc.) so as to ascertain the suitability of the rock fragments for measuring various properties of the rock (block 420; Image Evaluation Module 580). Examples of such properties include, but are not limited to porosity, absolute and relative permeability, elasticity and electrical properties. The suitability of the selected rock fragments may be ascertained based upon, for example, the number of fractures observed, as well as the size and color of the sample. Damaged samples with a high number of fractures can present issues when imaging such samples with a scanning electron microscope (SEM). Also, the size/aspect ratio of a sample can have an effect on sample preparation, and as a result larger samples are preferred. When imaging using white light, color may also be used to identify statistical outliers, thus providing additional criteria for determining the suitability of the selected rock fragments for measuring the properties of interest.
- Rock fragments identified as suitable are selected and their properties measured (block 422; Rock Property Module 582). The properties of the suitable rock fragment with the smallest normalized deviation are treated as representative of the rock properties of the depth interval from which the rock fragment originated, and the properties of suitable rock fragments with larger normalized deviations are used to characterize the range of rock properties with said depth interval (block 424; Rock Property Module 582). The resulting properties are presented to a user of the system (block 426; Presentation Module 584), for example, by graphically representing the formation bed layering traversed by the wellbore to illustrate the various rock types and/or rock properties on a display or image log, or by presenting a well log of one or more of the properties of the wellbore (e.g., as shown in
FIG. 6 ), ending method 400 (block 428). The method thus enables the properties of a rock formation to be characterized through judicious selection of rock fragments that are identified as being most representative of the depth interval from which they originate, allowing the analysis of the samples to be scaled up and applied to the entire interval with a high degree of confidence. - The disclosed methods and systems provides data describing the properties of formation rock that can be used to assist with validation of the target zone for a pilot well and, for horizontal wells, to confirm containment within a target zone before making completion decisions. The disclosed methods and systems can provide such information for wells where LWD or wireline data is not available, and can provide additional data points for determining reserve estimations (e.g., when utilizing SEM data).
Claims (13)
- A method (400) for characterizing a wellbore depth interval from rock fragments, the method comprising:obtaining the rock fragments for a given depth interval (402) from a drilling fluid (20) expelled during drilling of the wellbore,splitting the rock fragments into a bulk rock fragment sample and a plurality of individual rock fragment samples, andanalyzing the bulk rock fragment sample and the plurality of individual rock fragment samples to obtain measurements of the bulk rock fragment sample and of the plurality of individual rock fragment samples, wherein the method is characterized by comprising:converting, by a calibration technique, the measurements of the bulk rock fragment sample and of the plurality of individual rock fragment samples to a concentration percent (414) that comprises a volume percent or a weight percent of the bulk and individual rock fragment samples, wherein the weight percent comprises an elemental weight percent, a mineralogical weight percent or total organic carbon (TOC);computing a normalized deviation for each of the plurality of individual rock fragment samples relative to the bulk rock fragment sample, said normalized deviation being derived from the concentration percent of the bulk and individual rock fragment samples; wherein the measurements of the bulk rock fragment sample are considered representative of the rock composition and the plurality of individual rock fragment samples is compared to the bulk rock fragment sample,ranking the plurality of individual rock fragment samples based on the corresponding normalized deviation;selecting, as representative of the rock present in the wellbore depth interval, one or more individual rock fragment samples of the plurality of individual rock fragment samples based on the corresponding ranking;characterizing the rock properties of the wellbore depth interval (424) from which the bulk and individual rock fragment samples originated using measured properties of at least some of the selected one or more individual rock fragment samples; andpresenting to a user the characterized wellbore depth interval.
- The method (400) of claim 1, further comprising identifying the at least some of the one or more individual rock fragment samples by imaging each of the one or more individual rock fragment samples and analyzing the resulting images.
- The method (400) of claim 2, wherein the imaging is performed using an imaging technique selected from the group consisting of white light imaging, X-ray projection imaging and X-ray computerized tomography imaging.
- The method (400) of claim 1, further comprising:cleaning rock fragments originating from a wellbore depth interval and splitting the cleaned rock fragments into at least two unbiased sample divisions (404), a first division of the two unbiased sample divisions comprising the bulk rock fragment sample and a second division of the two unbiased sample divisions comprising the plurality of individual rock fragment samples;pulverizing the rock fragments of the bulk rock fragment sample and compressing the pulverized rock fragments into a pellet (406);encasing the plurality of individual rock fragment samples in epoxy to form a wafer and removing some of the epoxy and exposing a portion of each of the plurality of individual rock fragment samples (410); andacquiring the measurements of the pellet (408) and of the exposed portion of each of the plurality of individual rock fragment samples (412).
- The method (400) of claim 1, wherein the normalized deviation is computed using an equation selected from the group consisting of
 N = a number of elements or minerals under consideration,Wi = an individual rock fragment sample's weight percent for element or mineral i,Wib = the bulk rock fragment sample's weight percent for the element or mineral I,WY = a weight percent of the highest weighted element or mineral in the bulk rock fragment sample, andWX = a weight percent of an individual rock fragment sample of the plurality of individual rock fragment samples that corresponding to the highest element or mineral weight percent in the bulk rock fragment sample.
 - The method (400) of claim 1, wherein the characterized wellbore depth interval is presented to a user (426) as part of a graphical representation of formation bed layers traversed by the wellbore or as part of a well log of one or more of the properties of the wellbore.
- The method (400) of claim 1, wherein the measurements performed are selected from a group of measurement techniques consisting X-ray florescence (XRF), X-ray diffraction (XRD), Fourier transform infrared spectroscopy (FTIR), laser-induced breakdown spectroscopy (LIBS), Raman spectroscopy and electromagnetic spectroscopy.
- A wellbore depth interval characterization computer system (500), arranged to perform at least part of the method (400) described in any of the previous claims 1-7, wherein the wellbore depth interval characterization computer system (500) is characterized by comprising:a memory (570) having tubular string centralization software; andone or more processors (556) coupled to the memory (570), the software causing the one or more processors (556) to:convert measurements of a bulk rock fragment sample and of a plurality of individual rock fragment samples to a concentration percent;compute a normalized deviation for each of the plurality of individual rock fragment samples relative to the bulk rock fragment sample, said normalized deviation being derived from the concentration percent of the bulk and individual rock fragment samples wherein the concentration percent comprises a weight percent that comprises an elemental weight percent, a mineralogical weight percent or total organic carbon (TOC);rank the plurality of individual rock fragment samples based on a corresponding normalized deviation;select one or more individual rock fragment samples of the plurality of individual rock fragment samples based on a corresponding ranking;characterize the properties of the wellbore depth interval from which the bulk and individual rock fragment samples originated using measured properties of at least some of the selected one ormore individual rock fragment samples; and present to a user the characterized wellbore depth interval.
- The system (500) of claim 8, wherein the software further causes the one or more processors to identify the at least some of the one or more individual rock fragment samples by analysing images of the one or more individual rock fragment samples.
- The system (500) of claim 9, wherein the images are images obtained using an imaging technique selected from the group consisting of white light imaging, X-ray projection imaging and X-ray computerized tomography imaging.
- The system (500) of claim 8, wherein the normalized deviation is computed using an equation selected from the group consisting of
 N = a number of elements or minerals under consideration,Wi = an individual rock fragment sample's weight percent for element or mineral i,Wib = the bulk rock fragment sample's weight percent for the element or mineral i,WY = a weight percent of the highest weighted element or mineral in the bulk rock fragment sample, andWX = a weight percent of an individual rock fragment sample of the plurality of individual rock fragment samples that corresponding to the highest element or mineral weight percent In the bulk rock fragment sample.
 - The system (500) of claim 8, wherein the characterized wellbore depth interval is presented to a user as part of a graphical representation of formation bed layers traversed by the wellbore or as part of a well log of one or more of the properties of the wellbore.
- The system (500) of claim 8, wherein the measurements are selected from a group of measurement techniques consisting X-ray florescence (XRF), X-ray diffraction (XRD), Fourier transform infrared spectroscopy (FTIR), laser-induced breakdown spectroscopy (LIBS), Raman spectroscopy and electromagnetic spectroscopy.
Applications Claiming Priority (2)
| Application Number | Priority Date | Filing Date | Title |
|---|---|---|---|
| US201361845272P | 2013-07-11 | 2013-07-11 | |
| PCT/US2014/046311 WO2015006670A1 (en) | 2013-07-11 | 2014-07-11 | Characterizing wellbore depth interval from rock fragments |
Publications (3)
| Publication Number | Publication Date |
|---|---|
| EP3019697A1 EP3019697A1 (en) | 2016-05-18 |
| EP3019697A4 EP3019697A4 (en) | 2016-12-21 |
| EP3019697B1 true EP3019697B1 (en) | 2018-05-23 |
Family
ID=52280635
Family Applications (1)
| Application Number | Title | Priority Date | Filing Date |
|---|---|---|---|
| EP14823207.7A Not-in-force EP3019697B1 (en) | 2013-07-11 | 2014-07-11 | Characterizing wellbore depth interval from rock fragments |
Country Status (9)
| Country | Link |
|---|---|
| US (1) | US10669844B2 (en) |
| EP (1) | EP3019697B1 (en) |
| CN (1) | CN105378219B (en) |
| AU (1) | AU2014287028B2 (en) |
| BR (1) | BR112016000573B1 (en) |
| MX (1) | MX2016000372A (en) |
| RU (1) | RU2657055C2 (en) |
| SA (1) | SA516370377B1 (en) |
| WO (1) | WO2015006670A1 (en) |
Families Citing this family (13)
| Publication number | Priority date | Publication date | Assignee | Title |
|---|---|---|---|---|
| US8070574B2 (en) | 2007-06-06 | 2011-12-06 | Shuffle Master, Inc. | Apparatus, system, method, and computer-readable medium for casino card handling with multiple hand recall feature |
| MX2016000372A (en) | 2013-07-11 | 2016-08-17 | Ingrain Inc | Characterizing wellbore depth interval from rock fragments. |
| EP3509907B1 (en) * | 2016-09-09 | 2022-06-15 | Bly IP Inc. | Systems and methods for analyzing core using x-ray fluorescence |
| US10339765B2 (en) | 2016-09-26 | 2019-07-02 | Shuffle Master Gmbh & Co Kg | Devices, systems, and related methods for real-time monitoring and display of related data for casino gaming devices |
| GB2555137B (en) * | 2016-10-21 | 2021-06-30 | Schlumberger Technology Bv | Method and system for determining depths of drill cuttings |
| CN107620593A (en) * | 2017-08-08 | 2018-01-23 | 中国科学院地质与地球物理研究所 | Scanning system and method are considered to be worth doing with rock drilling in a kind of oil gas field scene |
| RU197194U1 (en) * | 2020-01-15 | 2020-04-10 | Федеральное государственное бюджетное учреждение науки Тихоокеанский океанологический институт им. В.И. Ильичева Дальневосточного отделения Российской академии наук (ТОИ ДВО РАН) | SCANNING DEVICE EXPRESS ANALYSIS OF CORES |
| CN115943302B (en) * | 2020-03-13 | 2026-04-28 | 贝克休斯油田作业有限责任公司 | Surface logging using rock cuttings-based rock physics analysis |
| US12253508B2 (en) | 2020-04-24 | 2025-03-18 | Schlumberger Technology Corporation | Methods and systems for estimating properties of organic matter in geological rock formations |
| US11237295B1 (en) | 2020-10-13 | 2022-02-01 | Saudi Arabian Oil Company | Method for intelligent automatic rock fragments depth determination while drilling |
| US11719092B2 (en) | 2020-10-13 | 2023-08-08 | Saudi Arabian Oil Company | Systems and methods for drilling a wellbore using taggant analysis |
| US12535424B2 (en) | 2021-10-18 | 2026-01-27 | Foss Analytical A/S | Method of analysing foodstuff samples using laser-induced breakdown spectroscopy |
| CN114483025B (en) * | 2021-12-17 | 2024-07-05 | 山东大学 | Tunnel advanced lithology recognition system and method based on ground characteristic while-drilling test |
Family Cites Families (13)
| Publication number | Priority date | Publication date | Assignee | Title |
|---|---|---|---|---|
| US7363158B2 (en) | 2006-04-07 | 2008-04-22 | Chevron U.S.A. Inc. | Method for creating a stratigraphic model using pseudocores created from borehole images |
| CN101082277A (en) | 2007-07-05 | 2007-12-05 | 北京奥能瑞科石油技术有限公司重庆分公司 | Oil well drilling geological X-ray fluorescent debris logging method |
| US8725477B2 (en) * | 2008-04-10 | 2014-05-13 | Schlumberger Technology Corporation | Method to generate numerical pseudocores using borehole images, digital rock samples, and multi-point statistics |
| US20090260883A1 (en) | 2008-04-16 | 2009-10-22 | Terratek Inc. | Continuous measurement of heterogeneity of geomaterials |
| US8331626B2 (en) * | 2008-05-21 | 2012-12-11 | Ingrain, Inc. | Method for estimating material properties of porous media using computer tomographic images thereof |
| WO2010057931A1 (en) | 2008-11-19 | 2010-05-27 | Mærsk Olie Og Gas A/S | Sealing of thief zones |
| US8155377B2 (en) * | 2008-11-24 | 2012-04-10 | Ingrain, Inc. | Method for determining rock physics relationships using computer tomographic images thereof |
| DE102011008878A1 (en) | 2011-01-18 | 2012-07-19 | Khs Gmbh | Filling element for container treatment machines in the form of filling machines, container treatment machine and method for cleaning machine elements on container treatment machines |
| US8678096B2 (en) * | 2011-01-25 | 2014-03-25 | Halliburton Energy Services, Inc. | Composite bow centralizer |
| WO2012118866A2 (en) * | 2011-02-28 | 2012-09-07 | Schlumberger Technology Corporation | Methods to build 3d digital models of porous media using a combination of high- and low-resolution data and multi-point statistics |
| US9329122B2 (en) * | 2011-08-15 | 2016-05-03 | Schlumberger Technology Corporation | Diffuse reflectance infrared fourier transform spectroscopy for characterization of earth materials |
| US9372162B2 (en) * | 2011-09-16 | 2016-06-21 | Ingrain, Inc. | Characterization of subterranean formation properties derived from quantitative X-Ray CT scans of drill cuttings |
| MX2016000372A (en) | 2013-07-11 | 2016-08-17 | Ingrain Inc | Characterizing wellbore depth interval from rock fragments. |
-
2014
- 2014-07-11 MX MX2016000372A patent/MX2016000372A/en unknown
- 2014-07-11 CN CN201480039660.9A patent/CN105378219B/en not_active Expired - Fee Related
- 2014-07-11 WO PCT/US2014/046311 patent/WO2015006670A1/en not_active Ceased
- 2014-07-11 RU RU2016103323A patent/RU2657055C2/en not_active IP Right Cessation
- 2014-07-11 EP EP14823207.7A patent/EP3019697B1/en not_active Not-in-force
- 2014-07-11 US US14/904,392 patent/US10669844B2/en active Active
- 2014-07-11 AU AU2014287028A patent/AU2014287028B2/en not_active Ceased
- 2014-07-11 BR BR112016000573-2A patent/BR112016000573B1/en active IP Right Grant
-
2016
- 2016-01-10 SA SA516370377A patent/SA516370377B1/en unknown
Non-Patent Citations (1)
| Title |
|---|
| None * |
Also Published As
| Publication number | Publication date |
|---|---|
| AU2014287028B2 (en) | 2018-11-15 |
| EP3019697A1 (en) | 2016-05-18 |
| US10669844B2 (en) | 2020-06-02 |
| AU2014287028A1 (en) | 2016-02-04 |
| CN105378219A (en) | 2016-03-02 |
| WO2015006670A1 (en) | 2015-01-15 |
| BR112016000573B1 (en) | 2021-10-05 |
| MX2016000372A (en) | 2016-08-17 |
| BR112016000573A2 (en) | 2017-07-25 |
| CN105378219B (en) | 2019-05-10 |
| RU2016103323A3 (en) | 2018-04-02 |
| EP3019697A4 (en) | 2016-12-21 |
| SA516370377B1 (en) | 2020-03-15 |
| RU2016103323A (en) | 2017-08-15 |
| US20160146002A1 (en) | 2016-05-26 |
| RU2657055C2 (en) | 2018-06-08 |
Similar Documents
| Publication | Publication Date | Title |
|---|---|---|
| US10669844B2 (en) | Characterizing a wellbore depth interval from rock fragments | |
| US9791431B2 (en) | Cuttings-based well logging | |
| US11732572B2 (en) | Method and system for determining depths of drill cuttings | |
| AU2018220193B2 (en) | Rock mechanical properties from drill cuttings | |
| US9372162B2 (en) | Characterization of subterranean formation properties derived from quantitative X-Ray CT scans of drill cuttings | |
| CA2673637C (en) | Method and apparatus for multi-dimensional data analysis to identify rock heterogeneity | |
| US9234980B2 (en) | Mining systems and methods | |
| US10761003B2 (en) | Method and system for analyzing cuttings coming from a wellbore | |
| US10428642B2 (en) | Transposition of logs onto horizontal wells | |
| WO2013162400A1 (en) | Determining physical properties of solid materials suspended in a drilling fluid | |
| US12253508B2 (en) | Methods and systems for estimating properties of organic matter in geological rock formations | |
| US11543557B2 (en) | Organic carbon concentration using LIBS and autocalcimeter | |
| Kolbjørnsen et al. | Norwegian Released Wells Project: Study Design, Material Preparation, Measurements and Data Analysis | |
| CN113719278A (en) | Oil reservoir identification method, device, equipment and medium | |
| Loermans | AML (Advanced Mud Logging): First Among Equals | |
| Liborius et al. | Maximizing Value from Drill Cuttings. A Case Study in the Eagle Ford Using Robotic XRF Logging | |
| CN121090431A (en) | Rock core lithology recognition method, device, equipment, medium and program product | |
| Ghadernejad et al. | Citation: Akbar, S.; Abdolmaleki, M. |
Legal Events
| Date | Code | Title | Description |
|---|---|---|---|
| PUAI | Public reference made under article 153(3) epc to a published international application that has entered the european phase |
Free format text: ORIGINAL CODE: 0009012 |
|
| 17P | Request for examination filed |
Effective date: 20160119 |
|
| AK | Designated contracting states |
Kind code of ref document: A1 Designated state(s): AL AT BE BG CH CY CZ DE DK EE ES FI FR GB GR HR HU IE IS IT LI LT LU LV MC MK MT NL NO PL PT RO RS SE SI SK SM TR |
|
| AX | Request for extension of the european patent |
Extension state: BA ME |
|
| DAX | Request for extension of the european patent (deleted) | ||
| A4 | Supplementary search report drawn up and despatched |
Effective date: 20161121 |
|
| RIC1 | Information provided on ipc code assigned before grant |
Ipc: E21B 49/02 20060101AFI20161115BHEP Ipc: G01N 33/28 20060101ALI20161115BHEP |
|
| STAA | Information on the status of an ep patent application or granted ep patent |
Free format text: STATUS: EXAMINATION IS IN PROGRESS |
|
| RIC1 | Information provided on ipc code assigned before grant |
Ipc: G01N 33/28 20060101ALI20170705BHEP Ipc: E21B 49/02 20060101AFI20170705BHEP |
|
| 17Q | First examination report despatched |
Effective date: 20170802 |
|
| GRAP | Despatch of communication of intention to grant a patent |
Free format text: ORIGINAL CODE: EPIDOSNIGR1 |
|
| STAA | Information on the status of an ep patent application or granted ep patent |
Free format text: STATUS: GRANT OF PATENT IS INTENDED |
|
| INTG | Intention to grant announced |
Effective date: 20180110 |
|
| GRAS | Grant fee paid |
Free format text: ORIGINAL CODE: EPIDOSNIGR3 |
|
| GRAA | (expected) grant |
Free format text: ORIGINAL CODE: 0009210 |
|
| STAA | Information on the status of an ep patent application or granted ep patent |
Free format text: STATUS: THE PATENT HAS BEEN GRANTED |
|
| AK | Designated contracting states |
Kind code of ref document: B1 Designated state(s): AL AT BE BG CH CY CZ DE DK EE ES FI FR GB GR HR HU IE IS IT LI LT LU LV MC MK MT NL NO PL PT RO RS SE SI SK SM TR |
|
| REG | Reference to a national code |
Ref country code: GB Ref legal event code: FG4D |
|
| REG | Reference to a national code |
Ref country code: CH Ref legal event code: EP |
|
| REG | Reference to a national code |
Ref country code: IE Ref legal event code: FG4D |
|
| REG | Reference to a national code |
Ref country code: AT Ref legal event code: REF Ref document number: 1001671 Country of ref document: AT Kind code of ref document: T Effective date: 20180615 |
|
| REG | Reference to a national code |
Ref country code: DE Ref legal event code: R096 Ref document number: 602014025954 Country of ref document: DE |
|
| REG | Reference to a national code |
Ref country code: FR Ref legal event code: PLFP Year of fee payment: 5 |
|
| REG | Reference to a national code |
Ref country code: NL Ref legal event code: MP Effective date: 20180523 |
|
| REG | Reference to a national code |
Ref country code: LT Ref legal event code: MG4D |
|
| PG25 | Lapsed in a contracting state [announced via postgrant information from national office to epo] |
Ref country code: FI Free format text: LAPSE BECAUSE OF FAILURE TO SUBMIT A TRANSLATION OF THE DESCRIPTION OR TO PAY THE FEE WITHIN THE PRESCRIBED TIME-LIMIT Effective date: 20180523 Ref country code: BG Free format text: LAPSE BECAUSE OF FAILURE TO SUBMIT A TRANSLATION OF THE DESCRIPTION OR TO PAY THE FEE WITHIN THE PRESCRIBED TIME-LIMIT Effective date: 20180823 Ref country code: SE Free format text: LAPSE BECAUSE OF FAILURE TO SUBMIT A TRANSLATION OF THE DESCRIPTION OR TO PAY THE FEE WITHIN THE PRESCRIBED TIME-LIMIT Effective date: 20180523 Ref country code: NO Free format text: LAPSE BECAUSE OF FAILURE TO SUBMIT A TRANSLATION OF THE DESCRIPTION OR TO PAY THE FEE WITHIN THE PRESCRIBED TIME-LIMIT Effective date: 20180823 Ref country code: ES Free format text: LAPSE BECAUSE OF FAILURE TO SUBMIT A TRANSLATION OF THE DESCRIPTION OR TO PAY THE FEE WITHIN THE PRESCRIBED TIME-LIMIT Effective date: 20180523 Ref country code: LT Free format text: LAPSE BECAUSE OF FAILURE TO SUBMIT A TRANSLATION OF THE DESCRIPTION OR TO PAY THE FEE WITHIN THE PRESCRIBED TIME-LIMIT Effective date: 20180523 |
|
| PG25 | Lapsed in a contracting state [announced via postgrant information from national office to epo] |
Ref country code: LV Free format text: LAPSE BECAUSE OF FAILURE TO SUBMIT A TRANSLATION OF THE DESCRIPTION OR TO PAY THE FEE WITHIN THE PRESCRIBED TIME-LIMIT Effective date: 20180523 Ref country code: RS Free format text: LAPSE BECAUSE OF FAILURE TO SUBMIT A TRANSLATION OF THE DESCRIPTION OR TO PAY THE FEE WITHIN THE PRESCRIBED TIME-LIMIT Effective date: 20180523 Ref country code: HR Free format text: LAPSE BECAUSE OF FAILURE TO SUBMIT A TRANSLATION OF THE DESCRIPTION OR TO PAY THE FEE WITHIN THE PRESCRIBED TIME-LIMIT Effective date: 20180523 Ref country code: NL Free format text: LAPSE BECAUSE OF FAILURE TO SUBMIT A TRANSLATION OF THE DESCRIPTION OR TO PAY THE FEE WITHIN THE PRESCRIBED TIME-LIMIT Effective date: 20180523 Ref country code: GR Free format text: LAPSE BECAUSE OF FAILURE TO SUBMIT A TRANSLATION OF THE DESCRIPTION OR TO PAY THE FEE WITHIN THE PRESCRIBED TIME-LIMIT Effective date: 20180824 |
|
| REG | Reference to a national code |
Ref country code: AT Ref legal event code: MK05 Ref document number: 1001671 Country of ref document: AT Kind code of ref document: T Effective date: 20180523 |
|
| REG | Reference to a national code |
Ref country code: GB Ref legal event code: 732E Free format text: REGISTERED BETWEEN 20181213 AND 20181219 |
|
| PG25 | Lapsed in a contracting state [announced via postgrant information from national office to epo] |
Ref country code: PL Free format text: LAPSE BECAUSE OF FAILURE TO SUBMIT A TRANSLATION OF THE DESCRIPTION OR TO PAY THE FEE WITHIN THE PRESCRIBED TIME-LIMIT Effective date: 20180523 Ref country code: EE Free format text: LAPSE BECAUSE OF FAILURE TO SUBMIT A TRANSLATION OF THE DESCRIPTION OR TO PAY THE FEE WITHIN THE PRESCRIBED TIME-LIMIT Effective date: 20180523 Ref country code: AT Free format text: LAPSE BECAUSE OF FAILURE TO SUBMIT A TRANSLATION OF THE DESCRIPTION OR TO PAY THE FEE WITHIN THE PRESCRIBED TIME-LIMIT Effective date: 20180523 Ref country code: DK Free format text: LAPSE BECAUSE OF FAILURE TO SUBMIT A TRANSLATION OF THE DESCRIPTION OR TO PAY THE FEE WITHIN THE PRESCRIBED TIME-LIMIT Effective date: 20180523 Ref country code: CZ Free format text: LAPSE BECAUSE OF FAILURE TO SUBMIT A TRANSLATION OF THE DESCRIPTION OR TO PAY THE FEE WITHIN THE PRESCRIBED TIME-LIMIT Effective date: 20180523 Ref country code: RO Free format text: LAPSE BECAUSE OF FAILURE TO SUBMIT A TRANSLATION OF THE DESCRIPTION OR TO PAY THE FEE WITHIN THE PRESCRIBED TIME-LIMIT Effective date: 20180523 Ref country code: SK Free format text: LAPSE BECAUSE OF FAILURE TO SUBMIT A TRANSLATION OF THE DESCRIPTION OR TO PAY THE FEE WITHIN THE PRESCRIBED TIME-LIMIT Effective date: 20180523 |
|
| REG | Reference to a national code |
Ref country code: DE Ref legal event code: R097 Ref document number: 602014025954 Country of ref document: DE |
|
| PG25 | Lapsed in a contracting state [announced via postgrant information from national office to epo] |
Ref country code: SM Free format text: LAPSE BECAUSE OF FAILURE TO SUBMIT A TRANSLATION OF THE DESCRIPTION OR TO PAY THE FEE WITHIN THE PRESCRIBED TIME-LIMIT Effective date: 20180523 Ref country code: IT Free format text: LAPSE BECAUSE OF FAILURE TO SUBMIT A TRANSLATION OF THE DESCRIPTION OR TO PAY THE FEE WITHIN THE PRESCRIBED TIME-LIMIT Effective date: 20180523 |
|
| REG | Reference to a national code |
Ref country code: CH Ref legal event code: PL |
|
| PG25 | Lapsed in a contracting state [announced via postgrant information from national office to epo] |
Ref country code: LU Free format text: LAPSE BECAUSE OF NON-PAYMENT OF DUE FEES Effective date: 20180711 Ref country code: MC Free format text: LAPSE BECAUSE OF FAILURE TO SUBMIT A TRANSLATION OF THE DESCRIPTION OR TO PAY THE FEE WITHIN THE PRESCRIBED TIME-LIMIT Effective date: 20180523 |
|
| PLBE | No opposition filed within time limit |
Free format text: ORIGINAL CODE: 0009261 |
|
| STAA | Information on the status of an ep patent application or granted ep patent |
Free format text: STATUS: NO OPPOSITION FILED WITHIN TIME LIMIT |
|
| REG | Reference to a national code |
Ref country code: BE Ref legal event code: MM Effective date: 20180731 |
|
| REG | Reference to a national code |
Ref country code: IE Ref legal event code: MM4A |
|
| PG25 | Lapsed in a contracting state [announced via postgrant information from national office to epo] |
Ref country code: CH Free format text: LAPSE BECAUSE OF NON-PAYMENT OF DUE FEES Effective date: 20180731 Ref country code: LI Free format text: LAPSE BECAUSE OF NON-PAYMENT OF DUE FEES Effective date: 20180731 Ref country code: IE Free format text: LAPSE BECAUSE OF NON-PAYMENT OF DUE FEES Effective date: 20180711 |
|
| 26N | No opposition filed |
Effective date: 20190226 |
|
| PG25 | Lapsed in a contracting state [announced via postgrant information from national office to epo] |
Ref country code: SI Free format text: LAPSE BECAUSE OF FAILURE TO SUBMIT A TRANSLATION OF THE DESCRIPTION OR TO PAY THE FEE WITHIN THE PRESCRIBED TIME-LIMIT Effective date: 20180523 Ref country code: BE Free format text: LAPSE BECAUSE OF NON-PAYMENT OF DUE FEES Effective date: 20180731 |
|
| REG | Reference to a national code |
Ref country code: DE Ref legal event code: R082 Ref document number: 602014025954 Country of ref document: DE Representative=s name: WITHERS & ROGERS LLP, DE |
|
| PGFP | Annual fee paid to national office [announced via postgrant information from national office to epo] |
Ref country code: DE Payment date: 20190730 Year of fee payment: 6 Ref country code: GB Payment date: 20190610 Year of fee payment: 6 Ref country code: FR Payment date: 20190730 Year of fee payment: 6 |
|
| PG25 | Lapsed in a contracting state [announced via postgrant information from national office to epo] |
Ref country code: AL Free format text: LAPSE BECAUSE OF FAILURE TO SUBMIT A TRANSLATION OF THE DESCRIPTION OR TO PAY THE FEE WITHIN THE PRESCRIBED TIME-LIMIT Effective date: 20180523 |
|
| PG25 | Lapsed in a contracting state [announced via postgrant information from national office to epo] |
Ref country code: MT Free format text: LAPSE BECAUSE OF NON-PAYMENT OF DUE FEES Effective date: 20180711 |
|
| PG25 | Lapsed in a contracting state [announced via postgrant information from national office to epo] |
Ref country code: TR Free format text: LAPSE BECAUSE OF FAILURE TO SUBMIT A TRANSLATION OF THE DESCRIPTION OR TO PAY THE FEE WITHIN THE PRESCRIBED TIME-LIMIT Effective date: 20180523 |
|
| PG25 | Lapsed in a contracting state [announced via postgrant information from national office to epo] |
Ref country code: PT Free format text: LAPSE BECAUSE OF FAILURE TO SUBMIT A TRANSLATION OF THE DESCRIPTION OR TO PAY THE FEE WITHIN THE PRESCRIBED TIME-LIMIT Effective date: 20180523 |
|
| PG25 | Lapsed in a contracting state [announced via postgrant information from national office to epo] |
Ref country code: CY Free format text: LAPSE BECAUSE OF FAILURE TO SUBMIT A TRANSLATION OF THE DESCRIPTION OR TO PAY THE FEE WITHIN THE PRESCRIBED TIME-LIMIT Effective date: 20180523 Ref country code: MK Free format text: LAPSE BECAUSE OF NON-PAYMENT OF DUE FEES Effective date: 20180523 Ref country code: HU Free format text: LAPSE BECAUSE OF FAILURE TO SUBMIT A TRANSLATION OF THE DESCRIPTION OR TO PAY THE FEE WITHIN THE PRESCRIBED TIME-LIMIT; INVALID AB INITIO Effective date: 20140711 |
|
| PG25 | Lapsed in a contracting state [announced via postgrant information from national office to epo] |
Ref country code: IS Free format text: LAPSE BECAUSE OF FAILURE TO SUBMIT A TRANSLATION OF THE DESCRIPTION OR TO PAY THE FEE WITHIN THE PRESCRIBED TIME-LIMIT Effective date: 20180923 |
|
| REG | Reference to a national code |
Ref country code: DE Ref legal event code: R119 Ref document number: 602014025954 Country of ref document: DE |
|
| GBPC | Gb: european patent ceased through non-payment of renewal fee |
Effective date: 20200711 |
|
| PG25 | Lapsed in a contracting state [announced via postgrant information from national office to epo] |
Ref country code: FR Free format text: LAPSE BECAUSE OF NON-PAYMENT OF DUE FEES Effective date: 20200731 Ref country code: GB Free format text: LAPSE BECAUSE OF NON-PAYMENT OF DUE FEES Effective date: 20200711 |
|
| PG25 | Lapsed in a contracting state [announced via postgrant information from national office to epo] |
Ref country code: DE Free format text: LAPSE BECAUSE OF NON-PAYMENT OF DUE FEES Effective date: 20210202 |