EP3013372B1 - Methods for treating urea cycle disorders to prevent hyperammonemic crises by controlling blood ammonia levels - Google Patents
Methods for treating urea cycle disorders to prevent hyperammonemic crises by controlling blood ammonia levels Download PDFInfo
- Publication number
- EP3013372B1 EP3013372B1 EP15803069.2A EP15803069A EP3013372B1 EP 3013372 B1 EP3013372 B1 EP 3013372B1 EP 15803069 A EP15803069 A EP 15803069A EP 3013372 B1 EP3013372 B1 EP 3013372B1
- Authority
- EP
- European Patent Office
- Prior art keywords
- ammonia
- hac
- uln
- subject
- gpb
- Prior art date
- Legal status (The legal status is an assumption and is not a legal conclusion. Google has not performed a legal analysis and makes no representation as to the accuracy of the status listed.)
- Active
Links
Images







Classifications
-
- A—HUMAN NECESSITIES
- A61—MEDICAL OR VETERINARY SCIENCE; HYGIENE
- A61K—PREPARATIONS FOR MEDICAL, DENTAL OR TOILETRY PURPOSES
- A61K31/00—Medicinal preparations containing organic active ingredients
- A61K31/21—Esters, e.g. nitroglycerine, selenocyanates
- A61K31/215—Esters, e.g. nitroglycerine, selenocyanates of carboxylic acids
- A61K31/216—Esters, e.g. nitroglycerine, selenocyanates of carboxylic acids of acids having aromatic rings, e.g. benactizyne, clofibrate
-
- A—HUMAN NECESSITIES
- A61—MEDICAL OR VETERINARY SCIENCE; HYGIENE
- A61K—PREPARATIONS FOR MEDICAL, DENTAL OR TOILETRY PURPOSES
- A61K31/00—Medicinal preparations containing organic active ingredients
- A61K31/185—Acids; Anhydrides, halides or salts thereof, e.g. sulfur acids, imidic, hydrazonic or hydroximic acids
- A61K31/19—Carboxylic acids, e.g. valproic acid
- A61K31/192—Carboxylic acids, e.g. valproic acid having aromatic groups, e.g. sulindac, 2-aryl-propionic acids, ethacrynic acid
-
- A—HUMAN NECESSITIES
- A61—MEDICAL OR VETERINARY SCIENCE; HYGIENE
- A61K—PREPARATIONS FOR MEDICAL, DENTAL OR TOILETRY PURPOSES
- A61K31/00—Medicinal preparations containing organic active ingredients
- A61K31/21—Esters, e.g. nitroglycerine, selenocyanates
- A61K31/215—Esters, e.g. nitroglycerine, selenocyanates of carboxylic acids
- A61K31/25—Esters, e.g. nitroglycerine, selenocyanates of carboxylic acids with polyoxyalkylated alcohols, e.g. esters of polyethylene glycol
-
- A—HUMAN NECESSITIES
- A61—MEDICAL OR VETERINARY SCIENCE; HYGIENE
- A61K—PREPARATIONS FOR MEDICAL, DENTAL OR TOILETRY PURPOSES
- A61K49/00—Preparations for testing in vivo
- A61K49/0004—Screening or testing of compounds for diagnosis of disorders, assessment of conditions, e.g. renal clearance, gastric emptying, testing for diabetes, allergy, rheuma, pancreas functions
-
- G—PHYSICS
- G01—MEASURING; TESTING
- G01N—INVESTIGATING OR ANALYSING MATERIALS BY DETERMINING THEIR CHEMICAL OR PHYSICAL PROPERTIES
- G01N33/00—Investigating or analysing materials by specific methods not covered by groups G01N1/00 - G01N31/00
- G01N33/48—Biological material, e.g. blood, urine; Haemocytometers
- G01N33/50—Chemical analysis of biological material, e.g. blood, urine; Testing involving biospecific ligand binding methods; Immunological testing
- G01N33/84—Chemical analysis of biological material, e.g. blood, urine; Testing involving biospecific ligand binding methods; Immunological testing involving inorganic compounds or pH
-
- G—PHYSICS
- G01—MEASURING; TESTING
- G01N—INVESTIGATING OR ANALYSING MATERIALS BY DETERMINING THEIR CHEMICAL OR PHYSICAL PROPERTIES
- G01N2800/00—Detection or diagnosis of diseases
- G01N2800/04—Endocrine or metabolic disorders
Definitions
- Urea cycle disorders are inborn errors of metabolism involving deficiencies of enzymes required for ureagenesis. They are manifested by acute and chronic hyperammonemia and medical management is aimed at reducing waste nitrogen through the restriction of protein intake and the use of alternate pathway drugs, historically sodium phenylbutyrate (NaPBA, also referred to by the US trade name BUPHENYL® and the EU trade name AMMONAPS®) and more recently glycerol phenylbutyrate (GPB; also referred to as RAVICTI® or HPN-100).
- UCDs include several inherited deficiencies of enzymes or transporters necessary for the synthesis of urea from ammonia, including enzymes involved in the urea cycle.
- HAC hyperammonemic crises
- NaPBA and GPB are ammonia-lowering agents that have been approved for the management of high blood levels of ammonia caused by UCDs not manageable by diet alone.
- Control of blood ammonia is a central management objective for UCD patients, but current guidelines do not specify the optimal target levels of ammonia to prevent HACs (Berry 2001). More information is needed to understand how ammonia levels relate to outcome in UCD patients to identify the optimal target levels of ammonia to treat UCDs and prevent HACs for optimal treatment management.
- HACs Hypochloridel
- FDA Medical Review Application Number 20-645 discusses the drug "Ammonul” (sodium phenylacetate and sodium benzoate 10%/10% for injection) which is indicated for the treatment of acute hyperammonemia in patients with UCDs.
- “Hyperion Therapeutics Announces Presentation of Long Term Data on Ammonia Control in Pediatric Patients Treated with RAVICTI® at the 12th International Congress of Inborn Errors of Metabolism and the Urea Cycle Disorder Satellite Symposium” (3rd September 2013) highlights long term data regarding ammonia control in pediatric patients with UCDs who were treated with RAVICTI® oral liquid.
- US 2013/0085179 A1 discloses methods for evaluating daily ammonia exposure based on a single fasting ammonia blood level measurement, as well as methods that utilize this technique to adjust the dosage of a nitrogen scavenging drug, determine whether to administer a nitrogen scavenging drug, and treat nitrogen retention disorders.
- the invention provides GPB for use in novel methods for preventing an HAC in a subject with a UCD who has been previously treated with a nitrogen scavenging drug and who has a glutamine level greater than 649 ⁇ m ⁇ l/L.
- These methods comprise (a) measuring a fasting blood ammonia level; (b) comparing the fasting blood ammonia level to the upper limit of normal (ULN) for blood ammonia; and (c) administering an effective dose of GPB to the subject if the fasting blood ammonia level is above 0.5 times the ULN for fasting blood ammonia.
- the effective dosage of GPB results in the fasting blood ammonia level being ⁇ 0.5 times the ULN for blood ammonia.
- the subject is aged 6 years or older.
- the nitrogen scavenging drug is selected from the group consisting of sodium benzoate, GPB, phenylbutyric acid (PBA), NaPBA, and a combination of two or more of GPB, PBA, and NaPBA
- the subject has previously been administered a first dosage of GPB.
- the dosage of GPB administered in step (c) is greater than the first dosage.
- the HAC is a first HAC.
- the subject has been treated with GPB
- the subject has been previously treated with GPB for an amount of time to maintain a steady state level of the drug in the subject.
- the PAA prodrug used in the invention is GPB.
- GPB also referred to as RAVICTI® or HPN-100
- RAVICTI® is an ammonia-lowering agent that was approved on February 1, 2013 in the United States for use as a nitrogen-binding agent for chronic management of adult and pediatric patients ⁇ 2 years of age with UCDs that cannot be managed by dietary protein restriction and/or amino acid supplementation alone.
- Current UCD treatment guidelines indicate that ammonia should be kept within normal limits but otherwise provide little guidance on the specific target levels or quantifies the risk of HAC based on ammonia exposure (Berry 2001).
- HACs long-term safety studies evaluated the occurrence of HACs during treatment with GPB for up to 1 year.
- the purpose of the analyses provided herein was to assess the predictive value of blood ammonia in the evaluation of long-term outcomes. Additionally, the utility of glutamine as a predictor of HACs was also assessed.
- Protocols UP1204-003, HPN-100-005SO, and HPN-100-012SO were short-term, open-label, fixed sequence SO studies that evaluated ammonia control during equivalent dosing of GPB versus NaPBA (Lee 2010), (Lichter-Konecki 2011), (Smith 2013).
- Study HPN-100-006 was a pivotal, randomized, double-blind, active-controlled, crossover study that established non-inferiority of GPB to NaPBA as assessed by venous ammonia (Diaz 2013). Most patients completing these protocols plus additional patients (a total of 100 of whom 49 were pediatric) were enrolled into safety extension studies and received GPB for 12 months (Diaz 2013), (Mokhatarani 2013), (Berry 2014).
- HAC baseline ammonia was defined as the screening or month 0 value when the patient was on NaPBA prior to receiving GPB.
- An HAC was defined as compatible clinical symptoms associated with one or more ammonia levels ⁇ 100 ⁇ mol/L.
- Ammonia and HAC data were also collected retrospectively for up to 12 months prior to enrollment in each study while patients were receiving NaPBA. Ammonia and glutamine concentrations were measured by an accredited hospital laboratory at each study site and ammonia values were normalized to a standard range of 9 to 35 ⁇ mol/L.
- Fasting ammonia values were divided into three categories: 0 to ⁇ 0.5, 0.5 to ⁇ 1.0, and ⁇ 1.0 relative to the ULN. Except for fasting ammonia, all other baseline characteristics such as age, gender, UCD subtypes, and glutamine were similar across these three groups, although there was a slightly higher proportion of patients aged 6 to 11 years in the 0.5 to ⁇ 1.0 ULN group than in the other two groups.
- the present application provides practical applications of this finding in the form of GPB for use in methods for preventing an HAC in a subject with UCD. Also disclosed herein is: treating a UCD to prevent an HAC, optimally administering a nitrogen scavenging drug for the treatment of a UCD to prevent an HAC, adjusting and optimizing the dosage of a nitrogen scavenging drug for the treatment of a UCD to prevent an HAC, evaluating the efficacy of a nitrogen scavenging drug for the treatment of a UCD to prevent an HAC, determining whether to administer a nitrogen scavenging drug for the treatment of a UCD to prevent an HAC, minimizing the risk of HACs, predicting the likelihood or risk of an HAC, evaluating and monitoring ammonia exposure, and other related embodiments.
- An effective dosage of GPB refers to a dosage that results in a fasting blood ammonia level falling at or below a specified threshold level or within a specified target range after one or more administrations.
- the effective dosage results in a fasting blood ammonia level falling at or below a specified threshold level or within a specified target range after multiple administrations, and in certain of these embodiments the effective dosage results in a fasting blood ammonia level falling at or below a specified threshold level or within a specified target range after the drug has reached steady state.
- steady state for a particular dosage of GPB is reached at around three days after the initial administration of that dosage. In other embodiments, steady state may be reached at two, three, four, or five days after the initial administration.
- Threshold levels and target ranges for fasting blood ammonia are based on the ULN for blood ammonia.
- the specified target range for fasting blood ammonia is ⁇ 0.5 times the ULN for blood ammonia.
- the specified threshold level is ⁇ 0.5 times the ULN for blood ammonia.
- a fasting blood ammonia level that is at or above the specified threshold level or above the specified target range indicates that a subject needs to be administered GPB or, where the subject has received a nitrogen scavenging drug previously, that the subject needs to be administered a different nitrogen scavenging drug or a higher dosage of the original nitrogen scavenging drug.
- a fasting blood ammonia level that is at or below the specified threshold level or within the specified target range indicates that the subject does not need to be administered GPB or, where the subject has received GPB previously, that the subject should continue to be administered GPB and/or the same dosage.
- the optimal range for fasting blood ammonia includes the specified threshold level.
- a fasting blood ammonia level at or below the specified threshold level is considered acceptable or optimal.
- An effective dosage of GPB may be an initial dosage, subsequent/maintenance dosage, improved dosage, or a dosage determined in combination with other factors.
- the effective dosage may be the same as or different than an initial dosage. In other embodiments, the effective dosage may be higher or lower than an initial dosage.
- HACs Disclosed herein are methods of treating a UCD to prevent an HAC in a subject in need thereof.
- the terms "prevent,” “preventing,” and “prevention” as used herein with regard to HACs may refer to averting an HAC entirely, reducing the number or frequency of an HAC, decreasing the likelihood of experiencing an HAC, averting, delaying, reducing, or ending symptoms associated with an HAC, or some combination thereof.
- treat may refer to averting a UCD, slowing the onset or rate of development of a UCD, reducing the risk of developing a UCD, preventing or delaying the development of symptoms associated with a UCD, reducing or ending symptoms associated with a UCD, generating a complete or partial regression of a UCD, or some combination thereof.
- UCD refers to urea cycle disorders which are inborn errors of metabolism involving deficiencies of enzymes and/or mitochondrial transporters required for ureagenesis. UCDs are manifested by acute and chronic hyperammonemia.
- HAC refers to an episode of high ammonia associated with clinical symptoms such as vomiting, nausea, somnolence and confusion that requires immediate intervention aiming at reducing blood ammonia.
- a "subject in need thereof' as used herein refers to a human subject who is prone to or deemed at risk of experiencing an HAC based on one or more genetic and/or environmental factors, or a subject who has previously experienced or is suspected of having experienced an HAC.
- the subject has been previously diagnosed with a UCD, is currently experiencing or suspected of having a UCD, is prone to or has been deemed at risk of experiencing an HAC.
- the fasting ammonia categories used herein are: 0 to ⁇ 0.5 times the ULN (or 0 to ⁇ 0.5 ULN or ⁇ 0.5 ULN), 0.5 to ⁇ 1.0 times the ULN (or 0.5 to ⁇ 1.0 ULN), and ⁇ 1.0 times the ULN (or ⁇ 1.0 ULN).
- the subject has been previously treated with one or more nitrogen scavenging drugs.
- the subject has been previously treated with NaPBA.
- the subject has been previously treated with NaPBA, but has not been treated with GPB.
- the subject has been treated with one or more nitrogen scavenging drugs.
- the subject has been treated with one or more nitrogen scavenging drugs for an amount of time to maintain a steady state level of the drug in the subject. For example, in certain embodiments, the subject has been treated with one or more nitrogen scavenging drug for at least 3, 4 or 5 days. In certain embodiments, the subject has been treated with one or more nitrogen scavenging drugs for about one year. In certain embodiments, the subject has been treated with GPB.
- ammonia levels as a function of ULN can be a useful predictor of the risk of experiencing an HAC.
- the subject's risk of experiencing an HAC may be about 10% if the subject's fasting blood ammonia level is less than 0.5 ULN; about 15% if the subject's fasting blood ammonia level is between 0.5 to less than 1.0 ULN; or about 37% if the subject's fasting blood ammonia level is greater than or equal to 1.0 ULN.
- the subject has been previously treated with GPB, for an amount of time to maintain a steady state level of GPB in the subject.
- the subject may have been treated with a GPB for at least 3, 4, or 5 days.
- the subject has been treated with GPB for about one year.
- the subject's risk of experiencing an HAC is about 23% if the subject's fasting blood ammonia level is less than 0.5 ULN; about 26% if the subject's fasting blood ammonia level is between 0.5 to less than 1.0 ULN; or about 44% if the subject's fasting blood ammonia level is greater than or equal to 1.0 ULN.
- the subject may have been previously treated with NaPBA.
- ammonia levels as a function of ULN can also be a useful predictor of the risk of experiencing a first HAC for a subject.
- Subjects with higher baseline ammonia levels relative to ULN were found to be at greater risk of HAC compared to patients in lower ULN categories.
- the subject has about a 4.5 times higher risk of experiencing a first HAC compared to subjects with a fasting blood ammonia level of less than 0.5 ULN.
- the subject after adjusting for age, gender and race, for a subject that has been treated with a nitrogen scavenging GPB and has a fasting blood ammonia level of greater than or equal to 1.0 ULN, the subject has about a 5.7 times higher risk of experiencing a first HAC compared to subjects with a fasting blood ammonia level of ⁇ 0.5 ULN.
- the subject has been previously treated with GPB, for an amount of time to maintain a steady state level of the drug in the subject.
- the subject has been treated with GPB for at least 3, 4, or 5 days.
- the subject has been treated with GPB for about one year.
- ammonia levels as a function of ULN can be used to predict the relative incidence for HAC over twelve months or per year. Additionally, subjects that were treated with GPB had a roughly 50% lower incidence rate of HAC compared to those subjects not treated with GPB. In certain disclosures, if the subject has not been previously treated with GPB, then the subject's overall relative incidence of HAC per year may be about 0.581. For example, this means that if 100 subjects that were not treated with GPB were followed for one year, the expected number of HACs would be about 58.
- the subject's relative incidence of HAC per year may be about 0.433. In certain disclosures, if the subject has not been previously treated with GPB and the subject's fasting blood ammonia level is between 0.5 to less than 1.0 ULN, then the subject's relative incidence of HAC per year may be about 0.389. In certain disclosures, if the subject has not been previously treated with GPB and the subject's fasting blood ammonia level is greater than or equal to 1.0 ULN, then the subject's relative incidence of HAC per year may be about 1.071. In certain embodiments, the subject may have been previously treated with NaPBA.
- the subject's overall relative incidence of HAC per year may be about 0.288. For example, this means that if 100 subjects that were treated with GPB were followed for one year, the expected number of HACs would be about 29.
- the subject's relative incidence of HAC per year may be about 0.135.
- the subject's relative incidence of HAC per year may be about 0.150.
- the subject's relative incidence of HAC per year may be about 0.711.
- the subject has been previously treated with GPB for an amount of time to maintain a steady state level of the drug in the subject.
- the subject has been treated with a GPB for at least 3, 4, or 5 days.
- the subject has been treated with GPB for about one year.
- age can also be useful for predicting a subject's relative incidence rate of HAC.
- the incidence rate of HAC may be 2.6 times higher for the subject than for a subject that is eighteen years of age or older.
- the subject has been treated with GPB for an amount of time to maintain a steady state level of the drug in the subject.
- the subject has been treated with a GPB for at least 3, 4, or 5 days.
- the subject has been treated with GPB for about one year.
- ammonia exposure can be useful for predicting the duration of an HAC.
- the subject may have a higher likelihood of experiencing a short HAC duration compared to subjects with a fasting ammonia level greater than or equal to 1.0 ULN.
- the subject has been treated with GPB for an amount of time to maintain a steady state level of the drug in the subject.
- the subject has been treated with a GPB for at least3, 4, or 5 days.
- the subject has been treated with GPB for about one year.
- a short HAC duration is less than two days.
- age can be useful for predicting a subject's risk of having an HAC.
- fasting ammonia ULN categories and time from baseline to first HAC for patients who were at least 6 years of age.
- the time to first HAC was significantly shorter in patients with a fasting ammonia level greater than or equal to 1.0 ULN compared to those patients with a fasting ammonia level less than 0.5 ULN.
- the subject may have about a three times higher rate of HAC compared to a subject with a fasting ammonia level less than 0.5 ULN.
- the subject may have about a twenty times higher rate of HAC compared to a subject with a fasting ammonia level less than 0.5 ULN.
- the HAC is a first HAC.
- the subject has been treated with GPB for an amount of time to maintain a steady state level of the drug in the subject. For example, the subject has been treated with a GPB for at least 3, 4, or 5 days. In some embodiments, the subject has been treated with GPB for about one year.
- Example 6 below demonstrates the relative risk of experiencing an HAC based on incremental increases in blood ammonia.
- Total ammonia exposure expressed as 12 month time normalized under the curve (TNAUC 12months ) was significantly lower in patients who experienced an HAC compared to those who did not.
- a fasting ammonia level of a subject is taken and compared with a fasting blood ammonia level taken when the subject did not experience an HAC.
- the subject's fasting ammonia level may be compared to a control level of blood ammonia level from other subjects who did not experience an HAC.
- a subject's fasting blood ammonia level is 5 ⁇ mol/L greater than the baseline ammonia level, the subject is administered a nitrogen scavenging drug.
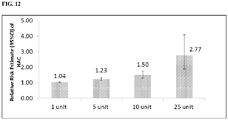
- the risk of an HAC is about 23%. In certain disclosures, if a subject's fasting blood ammonia level is 10 ⁇ mol/L greater than the baseline ammonia level, the risk of an HAC is about 50%. In certain disclosures, if a subject's fasting blood ammonia level is 25 ⁇ mol/L greater than the baseline ammonia level, the risk of an HAC is about 270%. In certain disclosures, the subject is administered a nitrogen scavenging drug if the risk of HAC is greater than about 23%.
- the subject has been treated with GPB, for an amount of time to maintain a steady state level of the drug in the subject.
- the subject has been treated with a GPB for at least 3, 4, or 5 days.
- the subject has been treated with GPB for about one year.
- Example 8 shows that glutamine levels were generally higher in patients in the higher baseline ammonia ULN groups and had decreased in the patients with the highest baseline glutamine at baseline by three months of treatment. Additionally, there was a statistically significant but comparatively weak correlation between baseline ammonia and glutamine levels at the time of enrollment as well as between fasting glutamine levels and daily ammonia exposure on GPB or NaPBA. An analysis of the relationship between glutamine and ammonia categories with respect to ULN categories showed that the overall correlation appeared to be driven by patients whose a baseline ammonia exceeded 1.0 ULN. Further, patients with OTC and CPS showed a stronger correlation between glutamine and ammonia.
- glutamine levels were slightly higher at baseline in patients who experienced an HAC compared to patients who did not experience an HAC during the study.
- a subject has been previously treated with a nitrogen scavenging drug and has a glutamine level between about 649 ⁇ mol/L to 808 ⁇ mol/L, then the subject has a greater likelihood of risk of HAC compared to subjects with a glutamine level less than about 649 ⁇ mol/L.
- the risk of HAC may be about a 2.5 times higher rate of risk.
- a subject has been previously treated with a nitrogen scavenging drug and has a glutamine level greater than or equal to about 809 ⁇ mol/L, then the subject has a greater likelihood of risk of HAC compared to subjects with a glutamine level less than about 649 ⁇ mol/L.
- the risk of HAC may be about a 2.8 times higher rate of risk.
- the subject has been treated with GPB, for an amount of time to maintain a steady state level of the drug in the subject. For example, the subject has been treated with a GPB for at least 3, 4, or 5 days. In some embodiments, the subject has been treated with GPB for about one year.
- the glutamine upper limit normal values are: for patients 4 months to 2 years of age (709 ⁇ mol/L), 2 to 10 years of age (709 ⁇ mol/L), 10 to 18 years of age (740 ⁇ mol/L), older than 18 years of age (721 ⁇ mol/L) (Blau 2008).
- the ULN for blood ammonia typically represents the highest level in the range of normal values, which may be influenced by a variety of factors such as the assay method, types of regents, standard reference samples used, and specifications and calibration of equipment used to perform the measurement.
- the ULN for blood ammonia is determined for a subject individually.
- the ULN for blood ammonia may be based on measurements obtained across a set of subjects (e.g., healthy subjects or subjects with UCD).
- the ULN for blood ammonia may represent a standard reference value disclosed in the art, such as a mean ULN developed across a particular subset of subjects.
- the ULN for blood ammonia may represent a standard measurement that has been developed by a particular entity that performs blood draws and/or blood evaluations, such as a particular clinical laboratory.
- the ULN is a standard reference value utilized by the same entity that measures the fasting blood ammonia level.
- the units of ammonia measurement may also vary from lab to lab (e.g., ⁇ g/mL or ⁇ moI/L), emphasizing the importance of interpreting the subject's ammonia levels relative to the ULN at the laboratory in which the measurement was performed.
- the ULN for blood ammonia may be about 12 to 70 ⁇ mol/L.
- the ULN for blood ammonia may be about 11 to 64 ⁇ mol/L, 20 to 50 ⁇ mol/L, 30 to 40 ⁇ mol/L, 32 to 38 ⁇ mol/L, or 34 to 36 ⁇ mol/L, and in certain of these embodiments the ULN for blood ammonia is about 35 ⁇ mol/L. In certain embodiments, the ULN for blood ammonia may be about 20 to 120 ⁇ g/dL.
- the ULN for blood ammonia may be about 50 to 65 ⁇ g/dL, 55 to 63 ⁇ g/dL, or 57 to 61 ⁇ g/dL, and in certain of these embodiments the ULN for blood ammonia is about 59 ⁇ g/dL.
- a nitrogen scavenging drug as used herein refers to any drug that decreases blood nitrogen and/or ammonia levels.
- a nitrogen scavenging drug may remove nitrogen in the form of PAGN, and in certain of these embodiments the nitrogen scavenging drug may be an orally administrable drug that contains or is metabolized to PAA.
- a nitrogen scavenging drug may be a PAA prodrug such as PBA or GPB, a pharmaceutically acceptable salt of PBA such as NaPBA, or a pharmaceutically acceptable ester, acid, or derivative of a PAA prodrug.
- a nitrogen scavenging drug may remove nitrogen via hippuric acid.
- a nitrogen scavenging drug may be benzoic acid, a pharmaceutically acceptable salt of benzoic acid such as sodium benzoate, or a pharmaceutically acceptable ester, acid, or derivative of benzoic acid.
- the nitrogen scavenging drug used in the invention is GPB.
- Increasing the dosage of a nitrogen scavenging drug may refer to increasing the amount of drug per administration (e.g., an increase from a 3 mL dosage to a 6 mL dosage), increasing the number of administrations of the drug (e.g., an increase from once-a-day dosing to twice- or three-times-a-day), or any combination thereof.
- a subject that has previously been administered a nitrogen scavenging drug has been administered the drug for a duration of time sufficient to reach steady state.
- the measurement may be carried out after the drug has had sufficient time to reach steady state at that dosage.
- the subject may have been administered the drug over a period of about 2 to 7 days, 1 week to 2 weeks, 2 weeks to 4 weeks, 4 weeks to 8 weeks, 8 weeks to 16 weeks, or longer than 16 weeks.
- the fasting period for obtaining a fasting blood ammonia level is overnight.
- the fasting period is 4 hours or more, 5 hours or more, 6 hours or more, 7 hours or more, 8 hours or more, 9 hours or more, 10 hours or more, 11 hours or more, or 12 hours or more, and in certain embodiments the fasting period is 4 to 8 hours, 6 to 8 hours, or 8 to 12 hours.
- the subject preferably does not ingest any food.
- the subject may also refrain from ingesting certain non-food substances during the fasting period. For example, in certain embodiments the subject does not ingest any supplements and/or nitrogen scavenging drugs during the fasting period.
- the subject may nonetheless ingest one or more drugs other than nitrogen scavenging drugs during the fasting period. In certain embodiments, the subject does not ingest any high calorie liquids during the fasting period. In certain of these embodiments, the subject does not ingest any liquids other than water during the fasting period. In other embodiments, the subject may ingest small amounts of low calorie beverages, such as tea, coffee, or diluted juices.
- blood samples used for measuring fasting blood ammonia levels and/or ULN blood ammonias are venous blood samples.
- a blood sample is a plasma blood sample. Any methods known in the art may be used to obtain a plasma blood sample. For example, blood from a subject may be drawn into a tube containing heparin or ethylenediaminetetraacetic acid (EDTA). In certain embodiments, the sample can be placed on ice and centrifuged to obtain plasma within 15 minutes of collection, stored at 2 to 8°C (36 to 46°F) and analyzed within 3 hours of collection.
- EDTA ethylenediaminetetraacetic acid
- the blood plasma sample is snap frozen, stored at ⁇ -18°C ( ⁇ 0°F) and analyzed at a later time.
- the sample may be analyzed at 0 to 12 hours, 12 to 24 hours, 24 to 48, 48 to 96 hours after freezing, or within any other timeframe over which the sample has demonstrated stability.
- blood samples are taken in a laboratory or hospital setting.
- a single fasting blood sample is used to measure fasting blood ammonia level.
- multiple fasting blood samples may be obtained.
- a subject's blood ammonia level may be monitored throughout the day.
- the methods disclosed herein comprise an additional step of obtaining one or more blood samples from a subject prior to or after measuring fasting blood ammonia level.
- a blood sample is analyzed immediately after collection.
- the blood sample is stored for some period between collection and analysis.
- the sample may be stored for less than 1 hour, 1 hour to 6 hours, 1 hour to 12 hours, 1 hour to 24 hours, or 1 hour to 48 hours.
- the blood sample is stored at a temperature between 0 to 15°C, such as 2 to 8°C. In other embodiments, the blood sample is stored below 0°C or below -18°C.
- Measurement of ammonia levels in a fasting blood sample may be carried out using any technique known in the art.
- ammonia levels may be measured using a colorimetric reaction or an enzymatic reaction.
- a colorimetric reaction may involve the use of bromophenol blue as an ammonia indicator.
- ammonia may react with bromophenol blue to yield a blue dye.
- an enzymatic reaction may involve glutamate dehydrogenase catalyzing the reductive amination of 2-oxoglutarate with NH 4+ and NADPH to form glutamate and NADP + .
- the formation of NADP + formed is directly proportional to the amount of ammonia present in the blood sample. Therefore, the concentration of ammonia is measured based on a decrease in absorbance.
- GPB GPB
- factors such as diet (e.g., protein intake) and endogenous waste nitrogen removal capacity (e.g., urea synthesis capacity) may be considered.
- Example 1 Relationship between fasting ammonia levels and HAC during long-term (1 year) treatment of UCD patients.
- Subjects were divided into three groups based on their fasting ammonia levels: 0 to less than 0.5 (0 to ⁇ 0.5 ULN) times the upper limit normal (ULN) (39 subjects), 0.5 to less than 1.0 (0.5 to ⁇ 1.0 ULN) times ULN (34 subjects), and 1.0 times ULN or greater ( ⁇ 1.0 ULN) (27 subjects).
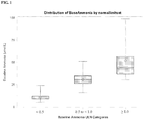
- boxplots of ammonia for upper limit normal categories were developed as shown in FIG. 1 . There was very little overlap in raw baseline ammonia values across baseline ammonia upper limit normal categories.
- the descriptive statistics of baseline ammonia categories are provided in Table 2.
- Table 2 Descriptive statistics of baseline ammonia ( ⁇ mol/L) stratified by the baseline ammonia categorized in relation to ULN.
- Table 4 Descriptive statistics of subjects who experienced an HAC and those that did not experience an HAC during the study period.
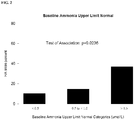
- HACs for subjects with fasting ammonia levels of ⁇ 0.5 ULN, 0.5 to ⁇ 1 ULN, and equal to or greater than 1.0 ULN is summarized in FIGs. 2 , 3 , and 4 .
- fasting ammonia categories provide a useful predictor of HAC likelihood, and subjects falling in the fasting ammonia category of ⁇ 0.5 ULN have a significantly lower likelihood of experiencing an HAC.
- Example 2 Relationship between fasting ammonia levels and time to first HAC.
- Subjects were monitored over 400 days and factors that may influence a subject's time to first HAC were analyzed.
- the probability of experiencing an HAC for the whole population and those falling in each ULN category is plotted using the Kaplan Meier (KM) (Kaplan 1958).
- the y-axis of the KM plot is the survival probability (HAC-free survival) and the x-axis is time in days.
- the study population begins at 100% HAC free and the KM plot describes the probability of not having an HAC over time and "+" denotes a censored value.
- a censored value denotes that the subject is no longer being followed in the study.
- Log rank tests were computed to compare the survival distributions between the covariant values (Peto 1972).
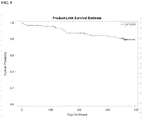
- FIG. 5 Crisis-free survival for the entire study population is depicted in FIG. 5 .
- 80% of subjects had not experienced an HAC during treatment with GPB ( FIG. 5 ).
- the KM plot was relatively flat until about day 150 when the curve experienced a significant drop. This suggested that a good number of subjects experienced an HAC around 150 days after which the KM plot begins to level off.
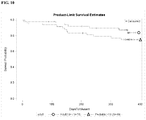
- subjects diagnosed with UCD were divided into three groups based on their fasting ammonia levels: ⁇ 0.5 ULN, 0.5 to ⁇ 1.0 ULN, ⁇ 1.0 ULN. Results are set forth in FIG. 6 .
- Subjects with higher baseline ammonia levels relative to ULN were found to be at greater risk of HAC compared to patients in lower ULN categories, and exhibited a lower survival probability.
- Patients with higher baseline ammonia by quartiles or ULN category were at greater risk of HAC than patients with lower baseline ammonia ( FIG. 6 ).
- Example 3 Relationship between fasting ammonia levels and cumulative HACs.
- the pre-enrollment HAC incidence rate was 0.581, suggesting that if 100 subjects were followed for a year, the expected number of HACs would be around 58.
- the study HAC incidence rate was 0.288, i.e., roughly 50% lower than the pre-enrollment rate.
- the risk of HAC was about five times higher for subjects with baseline ammonia levels of 1.0 ULN or greater versus subjects with baseline ammonia levels at ⁇ 0.5 ULN.
- the incidence rate ratios for different baseline ammonia categories are set forth in FIG. 7 . These results further illustrate the large gap in outcomes between subjects in the first two categories ( ⁇ 0.5 ULN and 0.5- ⁇ 1.0 ULN) and subjects in the third category (equal to or greater than 1.0 ULN).
- Example 4 Relationship between ammonia exposure and duration of HAC.
- ammonia exposure was characterized three different ways: peak ammonia during crisis, total ammonia during crisis and ammonia at time of admission.
- the distribution of duration of HAC in subjects with HACs is shown in FIG. 8 .
- the majority of the HACs typically lasted a day, and a steep drop off in the distribution was seen after 2 days. (Note: two subjects were excluded with 20 days of duration of HAC in this analyses).
- the descriptive statistics of the duration of HAC are presented in Table 9.
- Table 9 Descriptive statistics of the duration of HAC for study population.
- Table 10 GEE logistic regression model of the odds of having an HAC less than 2 days.
- Example 5 Relationship between different subsets of age and time to first HAC.
- FIG. 11 A KM plot illustrating time to first HAC in the 6 years and older subpopulation is shown in FIG. 11 .
- This data showed a highly significant association between baseline fasting ammonia ULN categories and time to first HAC.
- a multivariate Cox proportional hazards model was generated that adjusted for age, gender, and race in the 6 years and older subpopulation. The results of this model are summarized in Table 12.
- Table 12 KM plot of time to first HAC by ULN baseline ammonia categories for subjects ages 6 years and older. Risk factor N Hazard ratio p-value Age in years Pediatric (6-10 years) 17 Ref Pediatric (11-18 years) 9 0.21 0.192 Adult ( ⁇ 18 years) 51 0.17 0.055 Baseline ammonia (vs.
- Example 6 Relationship between ammonia exposure and relative risk of HAC.
- TNAUC 12months time normalized area under the curve
- TNAUC time normalized area under the curve of ammonia
- Example 7 Relationship between study site and baseline ammonia levels within each ULN category.
- Glutamine levels were slightly higher at baseline in patients who experienced an HAC compared to those who did not experience an HAC during the study. Glutamine correlated modestly with fasting ammonia at baseline and decreased during GPB treatment in patients with the highest baseline glutamine levels. Interestingly, the correlation between fasting ammonia and glutamine seemed to be primarily driven by patients with the highest ammonia. This may explain the apparent discrepancy between the present findings and those reported by Maestri et al, whose patient exhibited higher ammonia values than did those patients in the present analyses (Maestri 1992).
Landscapes
- Health & Medical Sciences (AREA)
- Life Sciences & Earth Sciences (AREA)
- Chemical & Material Sciences (AREA)
- General Health & Medical Sciences (AREA)
- Medicinal Chemistry (AREA)
- Engineering & Computer Science (AREA)
- Epidemiology (AREA)
- Animal Behavior & Ethology (AREA)
- Public Health (AREA)
- Veterinary Medicine (AREA)
- Pharmacology & Pharmacy (AREA)
- Biomedical Technology (AREA)
- Urology & Nephrology (AREA)
- Hematology (AREA)
- Molecular Biology (AREA)
- Immunology (AREA)
- Pathology (AREA)
- Emergency Medicine (AREA)
- Biochemistry (AREA)
- General Physics & Mathematics (AREA)
- Inorganic Chemistry (AREA)
- Food Science & Technology (AREA)
- Physics & Mathematics (AREA)
- Analytical Chemistry (AREA)
- Biotechnology (AREA)
- Microbiology (AREA)
- Cell Biology (AREA)
- Diabetes (AREA)
- Endocrinology (AREA)
- Gastroenterology & Hepatology (AREA)
- Rheumatology (AREA)
- Toxicology (AREA)
- Acyclic And Carbocyclic Compounds In Medicinal Compositions (AREA)
- Pharmaceuticals Containing Other Organic And Inorganic Compounds (AREA)
Description
- Urea cycle disorders (UCDs) are inborn errors of metabolism involving deficiencies of enzymes required for ureagenesis. They are manifested by acute and chronic hyperammonemia and medical management is aimed at reducing waste nitrogen through the restriction of protein intake and the use of alternate pathway drugs, historically sodium phenylbutyrate (NaPBA, also referred to by the US trade name BUPHENYL® and the EU trade name AMMONAPS®) and more recently glycerol phenylbutyrate (GPB; also referred to as RAVICTI® or HPN-100). UCDs include several inherited deficiencies of enzymes or transporters necessary for the synthesis of urea from ammonia, including enzymes involved in the urea cycle.
- Most UCD patients are at a lifelong risk of hyperammonemic crises (HAC), sometimes several per year, in which ammonia levels rise in their blood and brain, and cause symptoms ranging from nausea, vomiting, and headache to coma and death (Haberle 2011). These crises can be triggered by infections, postsurgery, or pregnancy (Haberle 2012).
- NaPBA and GPB are ammonia-lowering agents that have been approved for the management of high blood levels of ammonia caused by UCDs not manageable by diet alone. Control of blood ammonia is a central management objective for UCD patients, but current guidelines do not specify the optimal target levels of ammonia to prevent HACs (Berry 2001). More information is needed to understand how ammonia levels relate to outcome in UCD patients to identify the optimal target levels of ammonia to treat UCDs and prevent HACs for optimal treatment management. Thus, there is a need in the art for improved methods for achieving ammonia control and fewer HACs in patients with UCDs. FDA Medical Review Application Number 20-645 discusses the drug "Ammonul" (sodium phenylacetate and
sodium benzoate 10%/10% for injection) which is indicated for the treatment of acute hyperammonemia in patients with UCDs. "Hyperion Therapeutics Announces Presentation of Long Term Data on Ammonia Control in Pediatric Patients Treated with RAVICTI® at the 12th International Congress of Inborn Errors of Metabolism and the Urea Cycle Disorder Satellite Symposium" (3rd September 2013) highlights long term data regarding ammonia control in pediatric patients with UCDs who were treated with RAVICTI® oral liquid.US 2013/0085179 A1 discloses methods for evaluating daily ammonia exposure based on a single fasting ammonia blood level measurement, as well as methods that utilize this technique to adjust the dosage of a nitrogen scavenging drug, determine whether to administer a nitrogen scavenging drug, and treat nitrogen retention disorders. - The invention, which is defined in the appended claims, provides GPB for use in novel methods for preventing an HAC in a subject with a UCD who has been previously treated with a nitrogen scavenging drug and who has a glutamine level greater than 649 µmοl/L. These methods comprise (a) measuring a fasting blood ammonia level; (b) comparing the fasting blood ammonia level to the upper limit of normal (ULN) for blood ammonia; and (c) administering an effective dose of GPB to the subject if the fasting blood ammonia level is above 0.5 times the ULN for fasting blood ammonia. In these methods, the effective dosage of GPB results in the fasting blood ammonia level being <0.5 times the ULN for blood ammonia. In these methods, the subject is aged 6 years or older. In these methods, the nitrogen scavenging drug is selected from the group consisting of sodium benzoate, GPB, phenylbutyric acid (PBA), NaPBA, and a combination of two or more of GPB, PBA, and NaPBA In certain embodiments, the subject has previously been administered a first dosage of GPB. In certain embodiments, the dosage of GPB administered in step (c) is greater than the first dosage. In certain embodiments, the HAC is a first HAC. In certain embodiments, the subject has been treated with GPB In certain embodiments, the subject has been previously treated with GPB for an amount of time to maintain a steady state level of the drug in the subject.
- The PAA prodrug used in the invention is GPB.
-
-
FIG. 1 : A boxplot of baseline ammonia for ULN baseline categories, < 0.5 ULN, 0.5 to < 1.0 ULN, and ≥ 1.0 ULN. -
FIG. 2 : A bar graph showing the percentage of patients whom experienced an HAC as categorical baseline ammonia increased. -
FIG. 3 : A bar graph of HAC and non HAC events between baseline ammonia quartiles. -
FIG. 4 : A bar graph showing the percentage of patients with no HAC and the percentage of patients whom experienced an HAC across different baseline ammonia level categories. Black bars represent patients whom experienced an HAC and gray bars represent patients with no HAC. -
FIG. 5 : A Kaplan-Meier (KM) plot of time to first HAC. -
FIG. 6 : A KM plot of HAC-free survival in relation to baseline ammonia categorized in relation to ULN. Log-rank test p-value=0.0077. The open circle represents < 0.5 ULN data, the open square represents 0.5 to < 1.0 ULN data, and the open triangle represents ≥ 1.0 ULN data. -
FIG. 7 : A bar graph showing HAC incidence rate ratios based on negative binomial regression for baseline ammonia ULN categories. -
FIG. 8 : A histogram of duration of HAC in days. Note the steep drop off in the distribution after two days. -
FIG. 9 : A KM plot of time to first HAC by age categories. The open circle represents data from patients ages 11-18 years old (N=9); the open square represents data frompatients age 18 and older (N=51); the open triangle represents data from patients ages 6-11 years old (N=17); and the black circle represents data from patients less than 6 years old (N=23). -
FIG. 10 : A KM plot of time to first HAC by binary age category (adult vs. pediatric). The open circle represents data frompatients 18 years and older (N=51) and the open triangle represents data from patients less than 18 years old (N=49). -
FIG. 11 : KM plots of time to first HAC insubjects 6 years of age and older categorized by ULN baseline ammonia category. Log-rank test p-value=0.0058. The open circle represents 0 to < 0.5 ULN data, the open triangle represents 0.5 to < 1.0 ULN data, and the open square represents ≥ 1.0 ULN data. -
FIG. 12 : A bar graph showing relative risk of HAC by incremental increase in ammonia exposure. 1.50 indicates 50% increased risk of having HAC with each 10 units ammonia increase relative to patients with no increase in ammonia. -
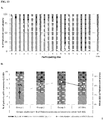
FIG. 13 : Ammonia levels and HAC rate by study site. A: A graph shows the percentage of patients at each study site with baseline ammonia <0.5 ULN (black and white stripes), 0.5 - < 1.0 ULN (light gray), and ≥ 1.0 ULN (dark gray). B: A bar graph shows the percentage of patients in each ammonia ULN category by sites grouped in relation to ammonia levels among patients enrolled at the site. Group 1 (6 study sites; 33 patients, of whom >50% had baseline ammonia levels < 0.5 ULN); Group 2 (3 study sites; 29 patients, of whom 25%-50% had baseline ammonia levels < 0.5 ULN); and Group 3 (11 sites; 38 patients, of whom < 25% had baseline ammonia < 0.5 ULN). The black and white striped bar represents 0 to < 0.5 ULN data, the light gray bar represents 0.5 to < 1.0 ULN data, and the dark gray bar represents ≥ 1.0 ULN data. -
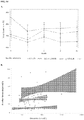
FIG. 14 : Relationship between glutamine and ammonia levels by baseline ammonia categories. A: A line graph showing glutamine levels during 12-months of treatment with GPB. The mean (± SE) monthly glutamine levels (y-axis) for baseline ammonia ULN categories are shown formonths -
FIG. 15 : A box plot of glutamine at baseline by categories of ULN baseline ammonia. -
FIG. 16 : Relationship between glutamine and ammonia levels by UCD subtype. There was a strong correlation between ammonia and glutamine with proximal defects (OTC, CPS), but not distal defects (ASL, ASS). - The following description of the invention is merely intended to illustrate various embodiments of the invention, which is defined in the appended claims.
- Medical management of UCDs is aimed at reducing waste nitrogen through the restriction of protein intake and the use of prodrugs such as phenylbutyrate.
GPB (also referred to as RAVICTI® or HPN-100) is an ammonia-lowering agent that was approved on February 1, 2013 in the United States for use as a nitrogen-binding agent for chronic management of adult and pediatric patients ≥2 years of age with UCDs that cannot be managed by dietary protein restriction and/or amino acid supplementation alone. Current UCD treatment guidelines indicate that ammonia should be kept within normal limits but otherwise provide little guidance on the specific target levels or quantifies the risk of HAC based on ammonia exposure (Berry 2001). As set forth in the examples below, long-term safety studies evaluated the occurrence of HACs during treatment with GPB for up to 1 year. The purpose of the analyses provided herein was to assess the predictive value of blood ammonia in the evaluation of long-term outcomes. Additionally, the utility of glutamine as a predictor of HACs was also assessed. - To identify the optimal target level for ammonia in UCD patients and to assess the long term effects of tight ammonia control, post-hoc statistical analyses were performed as provided herein to interrogate clinical trial data obtained from patients treated for 12 months with GPB. The objective of these analyses was to examine the relationship between fasting ammonia levels and HACs in patients treated with GPB for 12 months. The examples provided herein demonstrate that tight ammonia control results in lower systemic ammonia exposure and better outcome in terms of lower rate of HAC. For example, the findings herein demonstrate that ammonia is a reliable surrogate for assessing adequacy of disease control, as it correlates
strongly with HACs. Additionally, even mildly elevated ammonia over long periods of time may put patients at risk of HAC, and UCD patients, especially thoseages 6 years and above, benefit from maintaining fasting ammonia less than 0.5 ULN. Further, fasting ammonia levels less than 0.5 ULN are associated with a lower likelihood of experiencing HACs in the long term. - Data from four short-term switchover (SO) studies and three 12-month safety extension (SE) studies in adult and pediatric UCD patients were included in the analyses; all have been previously described. Protocols UP1204-003, HPN-100-005SO, and HPN-100-012SO were short-term, open-label, fixed sequence SO studies that evaluated ammonia control during equivalent dosing of GPB versus NaPBA (Lee 2010), (Lichter-Konecki 2011), (Smith 2013). Study HPN-100-006 was a pivotal, randomized, double-blind, active-controlled, crossover study that established non-inferiority of GPB to NaPBA as assessed by venous ammonia (Diaz 2013). Most patients completing these protocols plus additional patients (a total of 100 of whom 49 were pediatric) were enrolled into safety extension studies and received GPB for 12 months (Diaz 2013), (Mokhatarani 2013), (Berry 2014).
- All protocols and informed consents were reviewed and approved by the Investigational Review Board of each participating institution prior to initiation. Eligible subjects had a confirmed or clinically suspected UCD and had been receiving NaPBA prior to enrollment. In all studies, patients received GPB three times daily (or more frequently in small children to match their prior NaPBA schedule) at a daily dose equivalent to their previously prescribed NaPBA dose. Data regarding HACs were collected for up to 12 months pre-enrollment while patients were on NaPBA, and also during the 12 months of GPB treatment. Fasting ammonia and glutamine levels were analyzed as a predictor of HACs during long-term treatment.
- For the long-term studies provided herein, the relationship between ammonia levels and cumulative HAC, time to first HAC, duration of HAC, and relative risk of HAC was analyzed. Age was also analyzed as a predictor of HAC. Since younger children are fed more frequently and obtaining fasting ammonia is often not as practical as it would be for older children, supplemental analyses were performed to examine the rate of HAC and time to first HAC in patients at least 6 years old at baseline. Further analyses were performed to evaluate glutamine levels during the 12 months of GPB treatment.
- During the 12 month studies, blood samples for ammonia and glutamine analyses were collected monthly and information on HACs was recorded. Baseline ammonia was defined as the screening or
month 0 value when the patient was on NaPBA prior to receiving GPB. An HAC was defined as compatible clinical symptoms associated with one or more ammonia levels ≥ 100 µmol/L. Ammonia and HAC data were also collected retrospectively for up to 12 months prior to enrollment in each study while patients were receiving NaPBA. Ammonia and glutamine concentrations were measured by an accredited hospital laboratory at each study site and ammonia values were normalized to a standard range of 9 to 35 µmol/L. - Fasting ammonia values were divided into three categories: 0 to < 0.5, 0.5 to < 1.0, and ≥ 1.0 relative to the ULN. Except for fasting ammonia, all other baseline characteristics such as age, gender, UCD subtypes, and glutamine were similar across these three groups, although there was a slightly higher proportion of patients aged 6 to 11 years in the 0.5 to < 1.0 ULN group than in the other two groups.
- As set forth in the examples below, the relationship between fasting ammonia levels and the likelihood of patients experiencing an HAC was evaluated in UCD patients. It was found that increased fasting ammonia levels correlated strongly with the likelihood of experiencing an HAC. The relationship between ammonia levels and cumulative rate of HAC, time to first HAC, duration of HAC, and relative risk of HAC was analyzed. Based on these results, a comparison of fasting ammonia levels to a specified threshold or target range with respect to the ULN for blood ammonia represents a novel, clinically useful, and practical predictor of HAC risk.
- The present application provides practical applications of this finding in the form of GPB for use in methods for preventing an HAC in a subject with UCD. Also disclosed herein is: treating a UCD to prevent an HAC, optimally administering a nitrogen scavenging drug for the treatment of a UCD to prevent an HAC, adjusting and optimizing the dosage of a nitrogen scavenging drug for the treatment of a UCD to prevent an HAC, evaluating the efficacy of a nitrogen scavenging drug for the treatment of a UCD to prevent an HAC, determining whether to administer a nitrogen scavenging drug for the treatment of a UCD to prevent an HAC, minimizing the risk of HACs, predicting the likelihood or risk of an HAC, evaluating and monitoring ammonia exposure, and other related embodiments.
- Provided herein are threshold levels and target ranges for fasting blood ammonia upon which an effective dosage of GPB for the treatment of a UCD to prevent HACs can be based. An effective dosage of GPB as used herein refers to a dosage that results in a fasting blood ammonia level falling at or below a specified threshold level or within a specified target range after one or more administrations. In certain embodiments, the effective dosage results in a fasting blood ammonia level falling at or below a specified threshold level or within a specified target range after multiple administrations, and in certain of these embodiments the effective dosage results in a fasting blood ammonia level falling at or below a specified threshold level or within a specified target range after the drug has reached steady state. In certain embodiments, steady state for a particular dosage of GPB is reached at around three days after the initial administration of that dosage. In other embodiments, steady state may be reached at two, three, four, or five days after the initial administration.
- Threshold levels and target ranges for fasting blood ammonia are based on the ULN for blood ammonia. In the invention, the specified target range for fasting blood ammonia is <0.5 times the ULN for blood ammonia. The specified threshold level is <0.5 times the ULN for blood ammonia. In certain disclosures a fasting blood ammonia level that is at or above the specified threshold level or above the specified target range indicates that a subject needs to be administered GPB or, where the subject has received a nitrogen scavenging drug previously, that the subject needs to be administered a different nitrogen scavenging drug or a higher dosage of the original nitrogen scavenging drug. Similarly, in certain embodiments a fasting blood ammonia level that is at or below the specified threshold level or within the specified target range indicates that the subject does not need to be administered GPB or, where the subject has received GPB previously, that the subject should continue to be administered GPB and/or the same dosage. In certain embodiments, the optimal range for fasting blood ammonia includes the specified threshold level. In these embodiments, a fasting blood ammonia level at or below the specified threshold level is considered acceptable or optimal.. An effective dosage of GPB may be an initial dosage, subsequent/maintenance dosage, improved dosage, or a dosage determined in combination with other factors. In certain embodiments, the effective dosage may be the same as or different than an initial dosage. In other embodiments, the effective dosage may be higher or lower than an initial dosage.
- Disclosed herein are methods of treating a UCD to prevent an HAC in a subject in need thereof. The terms "prevent," "preventing," and "prevention" as used herein with regard to HACs may refer to averting an HAC entirely, reducing the number or frequency of an HAC, decreasing the likelihood of experiencing an HAC, averting, delaying, reducing, or ending symptoms associated with an HAC, or some combination thereof. The terms "treat," "treating," and "treatment" as used herein with regard to UCDs may refer to averting a UCD, slowing the onset or rate of development of a UCD, reducing the risk of developing a UCD, preventing or delaying the development of symptoms associated with a UCD, reducing or ending symptoms associated with a UCD, generating a complete or partial regression of a UCD, or some combination thereof.
- As used herein, the term "UCD" refers to urea cycle disorders which are inborn errors of metabolism involving deficiencies of enzymes and/or mitochondrial transporters required for ureagenesis. UCDs are manifested by acute and chronic hyperammonemia.
- As used herein, the term "HAC" refers to an episode of high ammonia associated with clinical symptoms such as vomiting, nausea, somnolence and confusion that requires immediate intervention aiming at reducing blood ammonia.
- A "subject in need thereof' as used herein refers to a human subject who is prone to or deemed at risk of experiencing an HAC based on one or more genetic and/or environmental factors, or a subject who has previously experienced or is suspected of having experienced an HAC. In certain embodiments, the subject has been previously diagnosed with a UCD, is currently experiencing or suspected of having a UCD, is prone to or has been deemed at risk of experiencing an HAC.
- The phrases "patient" and "subject" are used interchangeably herein.
- The term "about" as used herein means within 10% of a stated value or range of values.
- The fasting ammonia categories used herein are: 0 to < 0.5 times the ULN (or 0 to < 0.5 ULN or < 0.5 ULN), 0.5 to < 1.0 times the ULN (or 0.5 to < 1.0 ULN), and ≥ 1.0 times the ULN (or ≥ 1.0 ULN).
- The subject has been previously treated with one or more nitrogen scavenging drugs. In certain embodiments, the subject has been previously treated with NaPBA. In certain embodiments, the subject has been previously treated with NaPBA, but has not been treated with GPB. In certain embodiments, the subject has been treated with one or more nitrogen scavenging drugs. In certain embodiments, the subject has been treated with one or more nitrogen scavenging drugs for an amount of time to maintain a steady state level of the drug in the subject. For example, in certain embodiments, the subject has been treated with one or more nitrogen scavenging drug for at least 3, 4 or 5 days. In certain embodiments, the subject has been treated with one or more nitrogen scavenging drugs for about one year. In certain embodiments, the subject has been treated with GPB.
- As shown in Example 1 below, ammonia levels as a function of ULN can be a useful predictor of the risk of experiencing an HAC. For example, the association between ULN categories and HAC was significant so that the percentage of patients who experienced an HAC was lowest in those with a baseline ammonia of less than 0.5 ULN and increased in a step-wise fashion to those with less than 1.0 ULN and was highest in patients with the greater than or equal to 1.0 ULN ammonia value at baseline (p=0.024). In certain embodiments, for a subject that has been previously treated with a nitrogen scavenging drug, the subject's risk of experiencing an HAC may be about 10% if the subject's fasting blood ammonia level is less than 0.5 ULN; about 15% if the subject's fasting blood ammonia level is between 0.5 to less than 1.0 ULN; or about 37% if the subject's fasting blood ammonia level is greater than or equal to 1.0 ULN. In certain embodiments, the subject has been previously treated with GPB, for an amount of time to maintain a steady state level of GPB in the subject. For example, the subject may have been treated with a GPB for at least 3, 4, or 5 days. In some embodiments, the subject has been treated with GPB for about one year. In certain embodiments, for a subject that has been treated with GPB, but has been treated with other nitrogen scavengers such as NaPBA, the subject's risk of experiencing an HAC is about 23% if the subject's fasting blood ammonia level is less than 0.5 ULN; about 26% if the subject's fasting blood ammonia level is between 0.5 to less than 1.0 ULN; or about 44% if the subject's fasting blood ammonia level is greater than or equal to 1.0 ULN. In certain embodiments, the subject may have been previously treated with NaPBA.
- As shown in Example 2 below, ammonia levels as a function of ULN can also be a useful predictor of the risk of experiencing a first HAC for a subject. Subjects with higher baseline ammonia levels relative to ULN were found to be at greater risk of HAC compared to patients in lower ULN categories. In certain disclosures, for a subject that has been previously treated with a nitrogen scavenging drug and has a fasting blood ammonia level of greater than or equal to 1.0 ULN, the subject has about a 4.5 times higher risk of experiencing a first HAC compared to subjects with a fasting blood ammonia level of less than 0.5 ULN. In certain disclosures, after adjusting for age, gender and race, for a subject that has been treated with a nitrogen scavenging GPB and has a fasting blood ammonia level of greater than or equal to 1.0 ULN, the subject has about a 5.7 times higher risk of experiencing a first HAC compared to subjects with a fasting blood ammonia level of < 0.5 ULN. In certain disclosures, the subject has been previously treated with GPB, for an amount of time to maintain a steady state level of the drug in the subject. For example, the subject has been treated with GPB for at least 3, 4, or 5 days. In some disclosures, the subject has been treated with GPB for about one year.
- As shown in Example 3 below, ammonia levels as a function of ULN can be used to predict the relative incidence for HAC over twelve months or per year. Additionally, subjects that were treated with GPB had a roughly 50% lower incidence rate of HAC compared to those subjects not treated with GPB. In certain disclosures, if the subject has not been previously treated with GPB, then the subject's overall relative incidence of HAC per year may be about 0.581. For example, this means that if 100 subjects that were not treated with GPB were followed for one year, the expected number of HACs would be about 58. In certain disclosures, if the subject has not been previously treated with GPB and the subject's fasting blood ammonia level is less than 0.5 ULN, then the subject's relative incidence of HAC per year may be about 0.433. In certain disclosures, if the subject has not been previously treated with GPB and the subject's fasting blood ammonia level is between 0.5 to less than 1.0 ULN, then the subject's relative incidence of HAC per year may be about 0.389. In certain disclosures, if the subject has not been previously treated with GPB and the subject's fasting blood ammonia level is greater than or equal to 1.0 ULN, then the subject's relative incidence of HAC per year may be about 1.071. In certain embodiments, the subject may have been previously treated with NaPBA.
- According to other disclosures, if the subject has been previously treated with GPB, then the subject's overall relative incidence of HAC per year may be about 0.288. For example, this means that if 100 subjects that were treated with GPB were followed for one year, the expected number of HACs would be about 29. In certain disclosures, if the subject has been previously treated with GPB and the subject's fasting blood ammonia level is less than 0.5 ULN, then the subject's relative incidence of HAC per year may be about 0.135. In certain disclosures, if the subject has been previously treated with a dosage of GPB and the subject's fasting blood ammonia level is between 0.5 to less than 1.0 ULN, then the subject's relative incidence of HAC per year may be about 0.150. In certain disclosures, if the subject has been previously treated with a dosage of GPB and the subject's fasting blood ammonia level is greater than or equal to 1.0 ULN, then the subject's relative incidence of HAC per year may be about 0.711. In certain embodiments, the subject has been previously treated with GPB for an amount of time to maintain a steady state level of the drug in the subject. For example, the subject has been treated with a GPB for at least 3, 4, or 5 days. In some embodiments, the subject has been treated with GPB for about one year.
- Additionally, age can also be useful for predicting a subject's relative incidence rate of HAC. Insome disclosures, if the subject has been treated with a nitrogen scavenging drug and the subject is less than eighteen years of age, then the incidence rate of HAC may be 2.6 times higher for the subject than for a subject that is eighteen years of age or older. In certain embodiments, the subject has been treated with GPB for an amount of time to maintain a steady state level of the drug in the subject. For example, the subject has been treated with a GPB for at least 3, 4, or 5 days.
In certain embodiments, the subject has been treated with GPB
for about one year. - As shown in Example 4 below, ammonia exposure can be useful for predicting the duration of an HAC. For example, in some disclosures, if the subject has a fasting ammonia level less than 1.0 ULN, the subject may have a higher likelihood of experiencing a short HAC duration compared to subjects with a fasting ammonia level greater than or equal to 1.0 ULN. In certain embodiments, the subject has been treated with GPB for an amount of time to maintain a steady state level of the drug in the subject. For example, the subject has been treated with a GPB for at least3, 4, or 5 days. In some embodiments, the subject has been treated with GPB for about one year. In certain disclosures, a short HAC duration is less than two days.
- As shown in Example 5 below, age can be useful for predicting a subject's risk of having an HAC. For example, there was a significant association between fasting ammonia ULN categories and time from baseline to first HAC for patients who were at least 6 years of age. The time to first HAC was significantly shorter in patients with a fasting ammonia level greater than or equal to 1.0 ULN compared to those patients with a fasting ammonia level less than 0.5 ULN. In some disclosures, if a subject's fasting ammonia level is between 0.5 and less than 1.0 ULN and the subject is 6 years or older, the subject may have about a three times higher rate of HAC compared to a subject with a fasting ammonia level less than 0.5 ULN. In certain disclosures, if a subject's fasting ammonia level is equal to or greater than 1.0 ULN and the subject is 6 years or older, the subject may have about a twenty times higher rate of HAC compared to a subject with a fasting ammonia level less than 0.5 ULN. In certain disclosures, the HAC is a first HAC. In certain embodiments, the subject has been treated with GPB for an amount of time to maintain a steady state level of the drug in the subject. For example, the subject has been treated with a GPB for at least 3, 4, or 5 days. In some embodiments, the subject has been treated with GPB for about one year.
- Example 6 below demonstrates the relative risk of experiencing an HAC based on incremental increases in blood ammonia. Total ammonia exposure expressed as 12 month time normalized under the curve (TNAUC12months) was significantly lower in patients who experienced an HAC compared to those who did not. In certain disclosures, a fasting ammonia level of a subject is taken and compared with a fasting blood ammonia level taken when the subject did not experience an HAC. In certain disclosures, the subject's fasting ammonia level may be compared to a control level of blood ammonia level from other subjects who did not experience an HAC. In certain disclosures, if a subject's fasting blood ammonia level is 5 µmol/L greater than the baseline ammonia level, the subject is administered a nitrogen scavenging drug.
- In certain disclosures, if a subject's fasting blood ammonia level is 5 µmol/L greater than the baseline ammonia level, the risk of an HAC is about 23%. In certain disclosures, if a subject's fasting blood ammonia level is 10 µmol/L greater than the baseline ammonia level, the risk of an HAC is about 50%. In certain disclosures, if a subject's fasting blood ammonia level is 25 µmol/L greater than the baseline ammonia level, the risk of an HAC is about 270%. In certain disclosures, the subject is administered a nitrogen scavenging drug if the risk of HAC is greater than about 23%. In certain disclosures, the subject has been treated with GPB, for an amount of time to maintain a steady state level of the drug in the subject. For example, the subject has been treated with a GPB for at least 3, 4, or 5 days. In some disclosures, the subject has been treated with GPB for about one year.
- Example 8 shows that glutamine levels were generally higher in patients in the higher baseline ammonia ULN groups and had decreased in the patients with the highest baseline glutamine at baseline by three months of treatment. Additionally, there was a statistically significant but comparatively weak correlation between baseline ammonia and glutamine levels at the time of enrollment as well as between fasting glutamine levels and daily ammonia exposure on GPB or NaPBA. An analysis of the relationship between glutamine and ammonia categories with respect to ULN categories showed that the overall correlation appeared to be driven by patients whose a baseline ammonia exceeded 1.0 ULN. Further, patients with OTC and CPS showed a stronger correlation between glutamine and ammonia.
- Moreover, glutamine levels were slightly higher at baseline in patients who experienced an HAC compared to patients who did not experience an HAC during the study. In certain embodiments, if a subject has been previously treated with a nitrogen scavenging drug and has a glutamine level between about 649 µmol/L to 808 µmol/L, then the subject has a greater likelihood of risk of HAC compared to subjects with a glutamine level less than about 649 µmol/L. In certain embodiments, the risk of HAC may be about a 2.5 times higher rate of risk. According to certain embodiments, if a subject has been previously treated with a nitrogen scavenging drug and has a glutamine level greater than or equal to about 809 µmol/L, then the subject has a greater likelihood of risk of HAC compared to subjects with a glutamine level less than about 649 µmol/L. In certain embodiments, the risk of HAC may be about a 2.8 times higher rate of risk. In certain embodiments, the subject has been treated with GPB, for an amount of time to maintain a steady state level of the drug in the subject. For example, the subject has been treated with a GPB for at least 3, 4, or 5 days. In some embodiments, the subject has been treated with GPB for about one year. In certain embodiments, the glutamine upper limit normal values are: for
patients 4 months to 2 years of age (709 µmol/L), 2 to 10 years of age (709 µmol/L), 10 to 18 years of age (740 µmol/L), older than 18 years of age (721 µmol/L) (Blau 2008). - The ULN for blood ammonia typically represents the highest level in the range of normal values, which may be influenced by a variety of factors such as the assay method, types of regents, standard reference samples used, and specifications and calibration of equipment used to perform the measurement. In certain embodiments of the methods disclosed herein, the ULN for blood ammonia is determined for a subject individually. In other embodiments, the ULN for blood ammonia may be based on measurements obtained across a set of subjects (e.g., healthy subjects or subjects with UCD). In certain embodiments, the ULN for blood ammonia may represent a standard reference value disclosed in the art, such as a mean ULN developed across a particular subset of subjects. In other embodiments, the ULN for blood ammonia may represent a standard measurement that has been developed by a particular entity that performs blood draws and/or blood evaluations, such as a particular clinical laboratory. In certain embodiments, the ULN is a standard reference value utilized by the same entity that measures the fasting blood ammonia level. In these embodiments, one skilled in the art will recognize that the units of ammonia measurement may also vary from lab to lab (e.g., µg/mL or µmoI/L), emphasizing the importance of interpreting the subject's ammonia levels relative to the ULN at the laboratory in which the measurement was performed. In certain embodiments, the ULN for blood ammonia may be about 12 to 70 µmol/L. In certain of these embodiments, the ULN for blood ammonia may be about 11 to 64 µmol/L, 20 to 50 µmol/L, 30 to 40 µmol/L, 32 to 38 µmol/L, or 34 to 36 µmol/L, and in certain of these embodiments the ULN for blood ammonia is about 35 µmol/L. In certain embodiments, the ULN for blood ammonia may be about 20 to 120 µg/dL. In certain of these embodiments, the ULN for blood ammonia may be about 50 to 65 µg/dL, 55 to 63 µg/dL, or 57 to 61 µg/dL, and in certain of these embodiments the ULN for blood ammonia is about 59 µg/dL.
- A nitrogen scavenging drug as used herein refers to any drug that decreases blood nitrogen and/or ammonia levels. In certain embodiments, a nitrogen scavenging drug may remove nitrogen in the form of PAGN, and in certain of these embodiments the nitrogen scavenging drug may be an orally administrable drug that contains or is metabolized to PAA. For example, a nitrogen scavenging drug may be a PAA prodrug such as PBA or GPB, a pharmaceutically acceptable salt of PBA such as NaPBA, or a pharmaceutically acceptable ester, acid, or derivative of a PAA prodrug. In other embodiments, a nitrogen scavenging drug may remove nitrogen via hippuric acid. In certain of these embodiments, a nitrogen scavenging drug may be benzoic acid, a pharmaceutically acceptable salt of benzoic acid such as sodium benzoate, or a pharmaceutically acceptable ester, acid, or derivative of benzoic acid. The nitrogen scavenging drug used in the invention is GPB.
- Increasing the dosage of a nitrogen scavenging drug may refer to increasing the amount of drug per administration (e.g., an increase from a 3 mL dosage to a 6 mL dosage), increasing the number of administrations of the drug (e.g., an increase from once-a-day dosing to twice- or three-times-a-day), or any combination thereof.
- In certain embodiments, a subject that has previously been administered a nitrogen scavenging drug has been administered the drug for a duration of time sufficient to reach steady
state. Similarly, in those methods where fasting blood ammonia level is measured following a first, second, third, or subsequent dosage of nitrogen scavenging drug, the measurement may be carried out after the drug has had sufficient time to reach steady state at that dosage. For example, the subject may have been administered the drug over a period of about 2 to 7 days, 1 week to 2 weeks, 2 weeks to 4 weeks, 4 weeks to 8 weeks, 8 weeks to 16 weeks, or longer than 16 weeks. - In certain embodiments of the methods disclosed herein, the fasting period for obtaining a fasting blood ammonia level is overnight. In certain embodiments, the fasting period is 4 hours or more, 5 hours or more, 6 hours or more, 7 hours or more, 8 hours or more, 9 hours or more, 10 hours or more, 11 hours or more, or 12 hours or more, and in certain embodiments the fasting period is 4 to 8 hours, 6 to 8 hours, or 8 to 12 hours. During the fasting period, the subject preferably does not ingest any food. In certain embodiments, the subject may also refrain from ingesting certain non-food substances during the fasting period. For example, in certain embodiments the subject does not ingest any supplements and/or nitrogen scavenging drugs during the fasting period. In certain of these embodiments, the subject may nonetheless ingest one or more drugs other than nitrogen scavenging drugs during the fasting period. In certain embodiments, the subject does not ingest any high calorie liquids during the fasting period. In certain of these embodiments, the subject does not ingest any liquids other than water during the fasting period. In other embodiments, the subject may ingest small amounts of low calorie beverages, such as tea, coffee, or diluted juices.
- In certain embodiments of the methods disclosed herein, blood samples used for measuring fasting blood ammonia levels and/or ULN blood ammonias are venous blood samples. In certain embodiments, a blood sample is a plasma blood sample. Any methods known in the art may be used to obtain a plasma blood sample. For example, blood from a subject may be drawn into a tube containing heparin or ethylenediaminetetraacetic acid (EDTA). In certain embodiments, the sample can be placed on ice and centrifuged to obtain plasma within 15 minutes of collection, stored at 2 to 8°C (36 to 46°F) and analyzed within 3 hours of collection. In other embodiments, the blood plasma sample is snap frozen, stored at ≤-18°C (≤0°F) and analyzed at a later time. For example, the sample may be analyzed at 0 to 12 hours, 12 to 24 hours, 24 to 48, 48 to 96 hours after freezing, or within any other timeframe over which the sample has demonstrated stability. In certain embodiments, blood samples are taken in a laboratory or hospital setting. In certain embodiments, a single fasting blood sample is used to measure fasting blood ammonia level. However, in other embodiments, multiple fasting blood samples may be obtained. In certain embodiments, a subject's blood ammonia level may be monitored throughout the day. Further, in certain embodiments, the methods disclosed herein comprise an additional step of obtaining one or more blood samples from a subject prior to or after measuring fasting blood ammonia level.
- In certain embodiments, a blood sample is analyzed immediately after collection. In other embodiments, the blood sample is stored for some period between collection and analysis. In these embodiments, the sample may be stored for less than 1 hour, 1 hour to 6 hours, 1 hour to 12 hours, 1 hour to 24 hours, or 1 hour to 48 hours. In certain of these embodiments, the blood sample is stored at a temperature between 0 to 15°C, such as 2 to 8°C. In other embodiments, the blood sample is stored below 0°C or below -18°C.
- Measurement of ammonia levels in a fasting blood sample may be carried out using any technique known in the art. For example, ammonia levels may be measured using a colorimetric reaction or an enzymatic reaction. In certain embodiments, a colorimetric reaction may involve the use of bromophenol blue as an ammonia indicator. In these embodiments, ammonia may react with bromophenol blue to yield a blue dye. In certain embodiments, an enzymatic reaction may involve glutamate dehydrogenase catalyzing the reductive amination of 2-oxoglutarate with NH4+ and NADPH to form glutamate and NADP+. The formation of NADP+ formed is directly proportional to the amount of ammonia present in the blood sample. Therefore, the concentration of ammonia is measured based on a decrease in absorbance.
- One skilled in the art will recognize that a variety of other factors may be taken into consideration when determining the effective dosage of GPB. For example, factors such as diet (e.g., protein intake) and endogenous waste nitrogen removal capacity (e.g., urea synthesis capacity) may be considered.
- One of ordinary skill in the art will recognize that the various embodiments described herein can be combined. For example, steps from the various methods of treatment disclosed herein may be combined in order to achieve a satisfactory or improved level of treatment.
- The following examples are provided to better illustrate the claimed invention. The scope of the invention is defined in the appended claims.
- Data for 100 UCD subjects from three clinical trials (HPN-100-005, HPN-100-007, and HPN-100-012) were analyzed to evaluate the correlation between fasting ammonia levels and HAC (Table 1). Patients were treated for 12 months with GPB during the study. There was an almost equal split in the number of subjects who were adults (51%) and children (49%), defined as age <18 years at the time of enrollment. In this population, 30 patients had experienced a total of 54 HACs in the 12 months prior to the study and 19 patients experienced a total of 27 HACs during the study (Table 1). Baseline ammonia was defined as the subject's fasting ammonia level taken either at month zero or at the screening visit depending on which study the subject was enrolled in and whether the subject was enrolled in previous studies.
Table 1. Descriptive statistics of the study population. STUDY TOTAL 005 007 012 N 100 17 60 23 # of HA events Pre-study 54 8 17 29 Study 27 3 12 12 N with ≥1 HA events Pre-study 30 5 10 15 Study 19 3 9 7 Age at baseline Mean in years 19.6 10.0 28.8 2.8 (SD) (15.9) (3.5) (13.9) (1.7) Dichotomous age (%) Pediatric (<18 years) 49.0 100.0 15.0 100.0 Adult (≥18 years) 51.0 0.0 85.0 0.0 Baseline ammonia (µmol/L) Mean 28.8 27.7 27.5 32.8 (SD) (19.9) (12.4) (19.6) (24.9) 25th percentile 11.0 14.0 10.0 11.0 50th percentile 28.9 29.0 26.5 25.0 75th percentile 37.5 37.0 36.7 51.0 0 to <0.5 normal limit 39.0% 29.4% 40.0% 43.5% 0.5 to <1.0 normal limit 34.0% 58.8% 30.0% 26.1% ≥1 normal limit 27.0% 11.8% 30.0% 30.4% Gender (%) Male 33.0 17.7 31.7 47.8 Female 67.0 82.3 68.3 52.2 Race (%) White 81.0 82.4 80.0 82.6 Non-white 19.0 17.6 20.0 17.4 - Subjects were divided into three groups based on their fasting ammonia levels: 0 to less than 0.5 (0 to <0.5 ULN) times the upper limit normal (ULN) (39 subjects), 0.5 to less than 1.0 (0.5 to <1.0 ULN) times ULN (34 subjects), and 1.0 times ULN or greater (≥1.0 ULN) (27 subjects). To characterize the distribution of baseline ammonia for the upper limit normal categories of baseline ammonia, boxplots of ammonia for upper limit normal categories were developed as shown in
FIG. 1 . There was very little overlap in raw baseline ammonia values across baseline ammonia upper limit normal categories. The descriptive statistics of baseline ammonia categories are provided in Table 2. An increasing trend was observed across the ULN baseline ammonia categories in mean, median and range. No substantial differences between categories were observed at baseline among the different groups in terms of age, gender or UCD subtype, although there was a slightly higher proportion of patients aged 6 to 11 years in the 0.5 to <1.0 ULN group than the other two groups. Additionally, glutamine levels increased with increasing baseline ammonia. Seven patients were less than 2 years old, with a similar proportion of these patients in each of the baseline ammonia categories. Patients with ornithine transcabamylase (OTC) deficiency, the most common UCD subtype and one frequently associated with milder disease, were also evenly distributed among the subgroups.Table 2: Descriptive statistics of baseline ammonia (µmol/L) stratified by the baseline ammonia categorized in relation to ULN. Variable Baseline Ammonia Category < 0.5 ULN 0.5 to < 1.0 ULN ≥ 1.0 ULN (N = 39) (N = 34) (N = 27) Age Mean in years 22.9 17.4 18.6 (SD) (17.7) (15.0) (12.8) Number of patients Adult (≥ 18 years) 22 14 15 (%) (56.4) (41.2) (55.6) Pediatric (<18 years) 17 20 12 (%) (43.6) (58.8) (44.4) <2 years 3 2 2 (%) (7.7) (5.9) (7.4) 2 to 5 years 7 4 5 (%) (17.9) (11.8) (18.5) 6 to 11 years 5 10 2 (%) (12.8) (29.4) (7.4) 12 to 17 years 2 4 3 (%) (5.1) (11.8) (11.1) Gender Male 15 9 9 (%) (38.5) (26.5) (33.3) Female 24 25 18 (%) (61.5) (73.5) (66.7) Fasting Baseline Ammonia (µmol/L) Mean 11 30.8 51.9 (SD) (3.7) (7.7) (19.5) Glutamine at Baseline Mean 694 710 857 (SD) (199.0) (183.3) (306.0) UCD Subtype ARG 1 0 1 (%) (2.6) (3.7) ASL 7 5 1 (%) (18.0) (14.7) (3.7) ASS 4 3 5 (%) (10.3) (8.8) (18.5) CPS 1 0 0 (%) (2.6) HHH 2 1 0 (%) (5.1) (2.9) OTC 24 25 20 (%) (61.5) (73.5) (74.1) - Next, the subjects were analyzed according to whether or not they had experienced an HAC prior to enrollment and those that experienced an HAC during the clinical trials. Nineteen patients (19.0%) experienced a total of 27 HACs during study treatment. The proportion of patients who experienced an HAC during the study increased with increasing baseline ammonia. The proportion of patients experiencing an HAC was also higher for pediatric than adult patients and for male patients than female patients (Table 3).
- The proportion of patients who experienced an HAC on NaPBA treatment prior to enrollment (30.0%), based on retrospectively collected data, was higher than the proportion of patients who experienced an HAC during the study. A total of 54 HACs were reported during the pre-study period. Similar to the on-study data, the pre-study data showed that the proportion of patients with HAC increased with increasing baseline ammonia and that HAC were experienced by a higher proportion of pediatric than adult patients and a higher proportion of male than female patients (Table 3). The most common UCD subtype in this study was ornithine transcabamylase (OTC) deficiency (n = 69). The proportion of patients who experienced an HAC during the study was similar for those with OTC deficiency (18.8%) and those with non-OTC deficiencies (19.4%).
Table 3: Proportion of patients who experienced an HAC. Pre-Study During Study Number of patients with HAC 30 19 (%) (30.0) (19.0) Total no. of HAC 54 27 Age (% of patients) Pediatric (< 18 years) 42.9 24.5 Adult (≥ 18 years) 17.7 13.7 Baseline Ammonia (µmol/L) 0 to <0.5 ULN 23.1 10.3 0.5 to <1.0 ULN 26.5 14.7 ≥ 1.0 ULN 44.4 37.0 Gender (% of patients) Male 42.4 24.2 Female 23.9 16.4 Race (% of patients) White 28.4 18.5 Non-white 36.8 21.1 - Next, the subjects were analyzed according to whether or not they had experienced an HAC during the clinical trials compared with those that did not experience an HAC. The characteristics of the HAC and non-HAC groups are summarized in Table 4.
Table 4: Descriptive statistics of subjects who experienced an HAC and those that did not experience an HAC during the study period. HAC No HAC (N=19) (N=81) Overall % 19.0 81.0 Mean age in years 12.9 21.2 (SD) (11.7) (16.3) Age ranges (%) <6 years 30.4 69.6 6-11 years 23.5 76.5 12-17 years 11.1 88.9 ≥18 years 13.7 86.3 Dichotomous age (%) Pediatric: <18 years 24.5 75.5 Adult: >vears 13.7 86.3 Mean baseline ammonia (µmol/L) 41.8 µmol/L 25.7 µmol/L (SD) (23.7) (17.8) Baseline ammonia (vs. ULN) 0 - <0.5 ULN 10.3 89.7 0.5 - <1.0 ULN 14.7 85.3 ≥1 ULN 37.0 63.0 Gender Male 24.2 75.8 (%) Female 16.4 83.6 Race White 18.5 81.5 (%) Non-white 21.1 78.9 - Nineteen of the subjects had experienced an HAC during the clinical trials, while 81 had not. The mean age of subjects who experienced an HAC was lower than the subjects who did not have an HAC (12.9 years versus 21.5 years). The mean baseline ammonia was about two times higher for subjects who experienced an HAC verses those who did not. Additionally, the percentage of subjects who experienced an HAC during the study increased as baseline ammonia levels increased, with subjects experiencing HACs exhibiting baseline ammonia levels approximately 1.5 times higher than subjects who did not experience HAC (10%, 15%, and 37% for patients with baseline ammonia < 0.5 ULN, 0.5 to <1.0 ULN, ≥ 1.0 ULN, respectively). The occurrence of HACs for subjects with fasting ammonia levels of <0.5 ULN, 0.5 to <1 ULN, and equal to or greater than 1.0 ULN is summarized in
FIGs. 2 ,3 , and4 . The association between ULN categories and HAC was significant so that the percentage of patients who experienced an HAC was lowest in those with a baseline ammonia of <0.5 ULN and increased in a step-wise fashion to those with <1.0 ULN and was highest in patients with the ≥ 1.0 ULN ammonia value at baseline (p=0.024). Thus, fasting ammonia categories provide a useful predictor of HAC likelihood, and subjects falling in the fasting ammonia category of <0.5 ULN have a significantly lower likelihood of experiencing an HAC. - Subjects were monitored over 400 days and factors that may influence a subject's time to first HAC were analyzed. The probability of experiencing an HAC for the whole population and those falling in each ULN category is plotted using the Kaplan Meier (KM) (Kaplan 1958). The y-axis of the KM plot is the survival probability (HAC-free survival) and the x-axis is time in days. The study population begins at 100% HAC free and the KM plot describes the probability of not having an HAC over time and "+" denotes a censored value. A censored value denotes that the subject is no longer being followed in the study. Log rank tests were computed to compare the survival distributions between the covariant values (Peto 1972).
- Crisis-free survival for the entire study population is depicted in
FIG. 5 . As shown, after about one year of follow-up, 80% of subjects had not experienced an HAC during treatment with GPB (FIG. 5 ). The KM plot was relatively flat until about day 150 when the curve experienced a significant drop. This suggested that a good number of subjects experienced an HAC around 150 days after which the KM plot begins to level off. - Next, subjects diagnosed with UCD were divided into three groups based on their fasting ammonia levels: < 0.5 ULN, 0.5 to <1.0 ULN, ≥ 1.0 ULN. Results are set forth in
FIG. 6 . Subjects with higher baseline ammonia levels relative to ULN were found to be at greater risk of HAC compared to patients in lower ULN categories, and exhibited a lower survival probability. There were statistically significant associations between the time to first HAC and baseline ammonia quartiles (p=0.0088) and between time to first HAC and baseline ammonia by ULN category (p=0.0077). Patients with higher baseline ammonia by quartiles or ULN category were at greater risk of HAC than patients with lower baseline ammonia (FIG. 6 ). - In order to quantify the relative risk of time to first HAC, univariable Cox proportional hazard model regressions were generated. These results are set forth in Table 5.
Table 5: Univariable Cox regression results for time to first HAC. Risk factor N Hazard ratio p-value Age in years Pediatric (<18 years) 49 1.84 0.200 Adult (≥18 years) 51 Ref Baseline ammonia (vs. ULN) 0 - <0.5 ULN 39 Ref Ref 0.5 - <1.0 ULN 34 1.43 0.598 ≥1.0 ULN 27 4.51 0.011 Gender Male 33 1.58 0.327 (%) Female 67 Ref Ref Race White 81 Ref Ref (%) Non-white 19 1.19 0.760 - The data suggested that the risk of HAC was about 4.5 times higher in subjects with baseline ammonia levels of 1.0 times ULN or greater versus subjects with baseline ammonia levels at <0.5 times ULN. This result was statistically significant (p=0.011).
- A multivariable cox regression model for each of the risk factors in Table 6 was generated to account for potential cofounders. The hazard ratios are presented in Table 6.
Table 6: Multivariable Cox regression results for time to first HAC during the study. Risk Factor N Hazard Ratio p-value Age in years Pediatric: <18 49 2.60 0.062 Adult: ≥18 51 Ref Baseline Ammonia (µmol/L) 0 - <0.5 ULN 39 Ref Ref 0.5 - <1.0 ULN 34 1.49 0.562 ≥1.0 ULN 27 5.67 0.005 Gender (%) Male 33 2.05 0.153 Female 67 Ref Ref Race (%) White 81 Ref Ref Non-white 19 0.81 0.713 - After adjusting for age, gender and race, there was still a significant effect of baseline ammonia on the risk of HAC. Specifically, subjects with a baseline ammonia of one or more of their upper limit normal value have about 5.7 times the risk of having an HAC compared to subjects with <0.5 ULN baseline ammonia values (p=0.005). This further supports earlier findings showing that determining baseline ammonia levels as a function of ULN is a useful diagnostic tool.
- Some subjects experienced more than one HAC during follow-up treatment. Thus, the rate of HAC over 12 months was examined in relation to baseline characteristics. The majority of subjects had at least 12 months of follow up information as the median time a subject was followed during the study was about one year (i.e., 361.0 days). To estimate HAC rates and compare the differences between covariates of interest, a univariable negative binomial regression model was generated. These results are set forth in Table 7.
Table 7: Univariable Negative Binomial regression results showing relative incidence for HAC in relation to potential risk factors. Risk factor Pre-enrollment During study 12-month incidence HAC incidence rate ratio (IRR) p-value 12-month incidence HAC incidence rate ratio (IRR) p-value Overall 0.581 0.288 Age in years Pediatric (<18 years) 0.338 Ref 0.209 Ref Adult (≥18 years) 0.832 2.46 0.346 0.371 1.78 0.2539 Baseline ammonia (vs. ULN) 0 - <0.5 ULN 0.433 Ref 0.135 Ref 0.5 - <1.0 ULN 0.389 0.90 0.8161 0.150 1.11 0.8674 ≥1.0 ULN 1.071 2.47 0.0457 0.711 5.28 0.0057 Gender (%) Male 0.516 Ref 0.275 Ref Female 0.712 1.38 0.3949 0.314 1.14 0.7832 Race (%) White 0.564 Ref 0.296 Ref Non-white 0.660 1.17 0.7246 0.248 0.838 0.7456 - The pre-enrollment HAC incidence rate was 0.581, suggesting that if 100 subjects were followed for a year, the expected number of HACs would be around 58. The study HAC incidence rate was 0.288, i.e., roughly 50% lower than the pre-enrollment rate. The risk of HAC was about five times higher for subjects with baseline ammonia levels of 1.0 ULN or greater versus subjects with baseline ammonia levels at <0.5 ULN. The incidence rate ratios for different baseline ammonia categories are set forth in
FIG. 7 . These results further illustrate the large gap in outcomes between subjects in the first two categories (<0.5 ULN and 0.5- < 1.0 ULN) and subjects in the third category (equal to or greater than 1.0 ULN). - To adjust for potential cofounders, a multivariable Negative Binomial regression of HAC rate on baseline ammonia ULN categories and subject demographics was developed as presented in Table 8.
Table 8: Multivariable Negative Binomial regression results for rates of HAC during the study. Risk Factor Incidence Rate Ratio p-value Age in years Adult: ≥18 ref Pediatric: <18 2.62 0.0543 Baseline Ammonia (µmol/L) 0 - <0.5 ULN ref 0.5 - <1.0 ULN 1.11 0.8648 ≥1.0 ULN 7.38 0.0004 Gender (%) Female ref Male 1.79 0.2229 Race (%) White ref Non-white 0.53 0.2444 - After adjusting for age, gender and race, a significant difference in HAC incidence was observed between baseline ammonia categories (p= 0.0004). Age showed a marginally significant difference in HAC incidence after controlling for baseline ammonia, gender and race. Notably, pediatric subjects showed a higher incidence of HAC compared to adult subjects (p= 0.0543).
- The relationship between ammonia exposure and duration of HAC was analyzed. Ammonia exposure was characterized three different ways: peak ammonia during crisis, total ammonia during crisis and ammonia at time of admission. The distribution of duration of HAC in subjects with HACs is shown in
FIG. 8 . The majority of the HACs typically lasted a day, and a steep drop off in the distribution was seen after 2 days. (Note: two subjects were excluded with 20 days of duration of HAC in this analyses). The descriptive statistics of the duration of HAC are presented in Table 9.Table 9: Descriptive statistics of the duration of HAC for study population. Study TOTAL 005 007 012 N 25 2 12 11 Duration of HA crisis Mean (days) 1.71 1.27 1.95 1.53 Median (days) 1.00 1.27 1.36 0.92 < 1 days (%) 48.0 50.0 41.7 54.6 1 -1.99 days (%) 16.0 0.0 16.7 18.2 2 - 2.99 days (%) 28.0 50.0 33.3 18.2 > 3 days (%) 8.0 0.0 8.3 9.1 - Overall, about 48% of subjects experienced an HAC that lasted less than a day and about 64% of subjects had a duration of HAC that lasted less than 2 days.
- To assess the association between duration of HAC and admission ammonia during HAC, a generalized estimation equation (GEE) logistic regression model was implemented with robust empirical standard errors that accounts for the clustering of HACs in some subjects (Hardin 2005). A linear mixed model could not be implemented because of convergence problems with such a small sample and outlier observations of admission ammonia. Instead, the duration of HAC was dichotomized to take on a value of 0 when the subject experienced an HAC that lasted 2 days or longer and 1 when the subject experienced an HA crisis of less than 2 days. The odds of experiencing an HAC of 2 days or less (Short HAC duration) on admission, peak and discharge ammonia as well as patient characteristics are modeled in Table 10.
Table 10: GEE logistic regression model of the odds of having an HAC less than 2 days. Risk Factor Odds Ratio p- value Admission Ammonia 100 µmol/L increase 1.46 0.269 Peak Ammonia 100 µmol/L increase 1.06 0.805 TNAUC Ammonia 100 µmol/L increase 1.00 0.958 Age in years Pediatric: <18 Ref Adult: ≥18 1.74 0.565 Baseline Ammonia 0-38.0 µmol/L 3.06 0.279 38.0+ µmol/L Ref Baseline Ammonia 0 - <1.0 ULN 3.06 0.279 ≥1.0 ULN Ref Gender (%) Male 3.06 0.279 Female Ref Race (%) White DNC DNC Non-white DNC DNC GEE: Generalized estimation equation DNC: Did not converge - As shown in Table 10, subjects with low baseline ammonia levels (0 to <1 ULN) had higher odds of experiencing short HAC duration compared to subjects with high baseline ammonia levels (≥1 ULN). These results support the data presented herein that ammonia levels influence HAC.
- To analyze the relationship between age and HAC, characteristics of HAC were evaluated for subsets of subjects from different age groups. The effect of age on a subject's first HAC was investigated by generating KM plots that depict crisis-free survival in relation to four different subsets of age. A KM plot of time to first HAC for subsets of different ages (i.e., <6 years, 6-11 years, 11-18 years, and 18 years and older) showed that the younger patients seemed to have shorter time to the first HAC although no statistically significant association between these subsets of age and time to first HAC was observed as depicted in
FIG. 9 . In general, there was a separation in the survival curves after 150 days, with subjects ≤ 18 years of age experiencing a directionally higher risk of HAC as compared to adults. Next, a KM plot of time to first HAC by binary age subsets (adults: 18 years and older (N=51) vs pediatric: <18 years (N=49)) showed that children experienced a directionally higher risk of HAC. The KM plot is illustrated inFIG. 10 . - To further investigate the relationship between age and time to first HAC, characteristics of HA crisis were evaluated for those patients in clinical studies HPN-100-005 and HPN-100-007 who were at least 6 years old at baseline (n = 77). The rationale for this analysis is that the fasting ammonia measurement is less reliable in very young children as infants and young children feed more frequently and were not in a true state of fasting like older patients at the time of ammonia measurement. Similar analyses were performed to analyze HAC risk in subjects six years of age or older. The characteristics of this subpopulation are set forth in Table 11.
Table 11: Descriptive statistics of subjects who are ages 6 years or higher.Total Study 005 007 Number of subjects 77 17 60 # of HACs Pre-study 25 8 17 Post-study 15 3 12 Subjects with 1 or more HACs Pre-study 15 5 10 Post-study 12 3 9 Mean age at baseline (SD) 24.7 (14.7) 10.0 (3.5) 28.9 (13.9) Mean baseline ammonia (µmol/L) (SD) 27.6 (18.2) 27.7 (12.4) 27.5 (19.6) Baseline ammonia (µmol/L) 0 - <0.5 ULN (% of subjects) 29 (37.7%) 5 (29.4%) 24 (40.0%) 0.5 - <1.0 ULN (% of subjects) 28 (36.3%) 10 (58.8%) 18 (30.0%) ≥1.0 ULN (% of subjects) 20 (26.0%) 2 (11.8%) 18 (30.0%) Baseline blood urea nitrogen N 74 17 57 Mean (SD) 2.84 (1.36) 2.71 (1.04) 2.87 (1.45) Baseline glutamine N 73 17 56 Mean (SD) 759.4 (250.2) 694.9 (220.5) 779.0 (257.1) Gender % Male 28.6 17.7 31.7 Female 71.4 82.3 68.3 Race % White 80.5 82.4 80.0 Non-white 19.5 17.6 20.0 - A KM plot illustrating time to first HAC in the 6 years and older subpopulation is shown in
FIG. 11 . This data showed a highly significant association between baseline fasting ammonia ULN categories and time to first HAC. A multivariate Cox proportional hazards model was generated that adjusted for age, gender, and race in the 6 years and older subpopulation. The results of this model are summarized in Table 12.Table 12: KM plot of time to first HAC by ULN baseline ammonia categories for subjects ages 6 years and older.Risk factor N Hazard ratio p-value Age in years Pediatric (6-10 years) 17 Ref Pediatric (11-18 years) 9 0.21 0.192 Adult (≥18 years) 51 0.17 0.055 Baseline ammonia (vs. ULN) 0 - <0.5 ULN 29 Ref Ref 0.5 - <1.0 ULN 28 2.97 0.337 ≥1.0 ULN 20 20.3 0.009 Gender (%) Male 22 2.14 0.283 Female 55 Ref Ref Race (%) White 62 2.04 0.380 Non-white 15 Ref Ref - There was a significant association between baseline ammonia ULN categories and time from baseline to first HAC for patients who were at least 6 years of age at baseline (p = 0.0058) (
FIG. 11 ). - After adjusting for age, gender, and race, a significant effect was still observed between baseline ammonia versus ULN and HAC risk. When patients < 6 years old at baseline (who experienced the highest rate of HACs and for whom measurement of fasting ammonia is problematic) were excluded, the increased risk of HAC with high baseline ammonia levels was even more apparent. Specifically, subjects
age 6 and older had 3 times higher rate of HAC if their baseline fasting ammonia was between 0.5 to < 1 ULN and 20 times higher rate if their baseline ammonia levels were at or above 1.0 ULN than subjects with baseline ammonia levels < 0.5 (p=0.009). These results suggest that patients whose fasting ammonia levels are kept below 0.5 ULN are at the lowest risk of having a HAC and that fasting ammonia insubjects age 6 and older can be used as a predictor of risk of HAC. - The relationship between total ammonia exposure over time and the risk of HAC occurrence was explored by calculating time normalized area under the curve (TNAUC12months) for ammonia for patients with and without an HAC during the 12-month treatment with GPB (Table 13). The AUC for ammonia, measured monthly, was calculated for each patient using the trapezoid rule over the course of the 12 month study. To normalize the AUC, TNAUCxmonth, AUC was divided by the final study month of an ammonia assessment. The ammonia exposure considered either during the entire 12 months follow up or at any 3-months interval was higher in patients who experienced an HAC than those who did not.
Table 13: TNAUC 12months ammonia by HAC event. HAC No HAC P-value Month 0-3 N 19 81 Mean (SD) 33.3 (15.23) 23.5 (13.62) 0.0071 # HAC (% of Total HAC) 5 (18.5%) Incidence Rate/month 0.0170 Month 0-6 N 19 81 Mean (SD) 33.0 (12.17) 24.0 (13.85) 0.0100 # HAC (% of Total HAC) 13 (48.1%) Incidence Rate/month 0.0224 Month 0-9 N 19 81 Mean (SD) 33.4 (13.03) 23.7 (12.56) 0.0032 # HAC (% of Total HAC) 20 (74.1%) Incidence Rate/month 0.0234 Month 0-12 N 19 81 Mean (SD) 35.0 (14.99) 23.6 (11.94) 0.0006 # HAC (% of Total HAC) 27 (100%) Incidence Rate/month 0.0240 Note: Cumulative Incidence=# HAC/persons at risk at beginning of interval. - To further quantify the association of occurrence of HAC with the increase in ammonia level, the relative risk of experiencing an HAC per incremental increase in total ammonia exposure over 12 months (time normalized area under the curve of ammonia (TNAUC)) was also explored by using a Poisson regression method with a robust error variance (see Table 14 and
FIG. 12 ). TNAUC over 12-months is correlated with the risk of experiencing an HAC at any time during that period.Table 14: Relative Risk (RR) of HAC events based on TNAUC ammonia. TNAUC12months Relative Risk Estimate Standard Error Relative Risk Pvalue Confidence Limits 1 unit increase 1.0416 0.0082 1.0257 1.0578 <0.0001 5 unit increase 1.2263 0.0482 1.1354 1.3245 10 unit increase 1.5039 0.1182 1.2892 1.7544 25 unit increase 2.7736 0.5450 1.8870 4.0766 HAC: hyperammonemic crisis; TNAUC: time-normalized area under the curve. - For a 1-unit increase in ammonia, the relative risk (95% CI) was 1.0416 (1.0257-1.0578) and increased to 1.2263 (1.1354-1.325) for a 5-unit increase, which reflects a 4% and 23%, respectively, increase in risk of experiencing a HAC. Similarly increases of 10 and 25 µmol/L increased the relative risk of HAC by 50% and 270%, respectively (p<0.0001 for all comparisons) (Table 14).
- The proportion of patients with baseline ammonia levels within each ULN category varied considerably among study sites (
FIG. 13A ), which were therefore grouped into three categories based on the percentage of patients enrolled whose baseline fasting ammonia was < 0.5 of the ULN at baseline: Group 1 (6 study sites; 33 patients, of whom >50% had baseline ammonia levels < 0.5 ULN); Group 2 (3 study sites; 29 patients, of whom 25%-50% had baseline ammonia levels < 0.5 ULN); and Group 3 (11 sites; 38 patients, of whom < 25% had baseline ammonia < 0.5 ULN) (FIG. 13B and Table 15).Table 15: Demographics of patients among study sites in relation to ammonia control. Grouping of study sites based on % of subjects whose ammonia at baseline was less than half ULN Group 1 Group 2 Group 3 Number of sites 6 3 11 Number of subjects 33 29 38 Age at baseline Mean in years (SD) 24.5 (19.8) 20.5 (13.2) 14.7 (12.4) Age at baseline, N (%) <=2 years 2(6.1) 3 (10.3) 5 (13.2) >2 years 31 (93.9) 26 (89.7) 33 (86.8) Baseline Ammonia (µmol/L) Mean (SD) 19.9 (20.3) 26.9 (16.0) 37.9 (18.8) % 0-<0.5 normal limit 72.7 37.9 10.5 % 0.5-<1.0normal limit 18.2 24.2 55.3 % ≥1 normal limit 9.1 37.9 34.2 Gender (%) Male 42.4 27.6 29.0 Female 57.6 72.4 71.0 Among Females only, N (%) OTC subtype Any other subtype 16 (84.2) 3 (15.2) 17 (81.0) 4 (19.0) 20 (74.1) 7 (25.9) Binary Subtype, N (%) OTC+Female 16 (48.8) 17 (58.6) 20 (52.6) Any other 17 (51.2) 12(41.4) 18(47.4) Subtype (%) OTC 66.7 69.0 71.1 ARG 0.0 3.5 2.6 ASL 21.2 10.3 7.9 ASS 9.1 6.9 18.4 CPS 0.0 3.5 0.0 HHH 3.0 6.9 0.0 Prescribed Protein (g/kg/day) Mean (SD) 0.92 (0.42) 0.86 (0.47) 0.97 (0.41) *Study sites were grouped in relation to ammonia levels among patients enrolled at that site: Group 1(6 study sites; 33 patients, of whom > 50% had baseline ammonia levels < 0.5 ULN); Group 2 (3 study sites; 29 patients, of whom 25%-50% had baseline ammonia levels < 0.5 ULN); and Group 3 (11 sites; 38 patients, of whom < 25% had baseline ammonia < 0.5 ULN) - The proportion of patients who experienced an HAC was lowest (12%) among
Group 1 sites and increased progressively to 21% and 24% inGroup FIG. 13B ). Although the mean age of patients inGroup 3 was lower compared to Group 1 (14.7 vs 24.5yrs), other markers of disease severity including the proportion of females with OTC deficiency and restriction of dietary protein were similar among the groups. Baseline characteristics including age, gender, and UCD subtype were similar across the ULN groups. Thus, the fact that lower fasting ammonia levels correlate strongly with lower risk and frequency of HAC does not likely reflect intrinsic differences in disease severity. Instead, the data pertaining to ammonia levels and frequency of HAC among patients enrolled at more than 20 sites in North America, even allowing for possible differences in compliance among patients at different sites, appear to be explained by different responses to management or differing management approaches rather than regional difference in severity of illness. - The relationship between glutamine levels and ammonia categories was also analyzed. Published data from Blau et al. indicates that the upper limit of normal glutamine values for different age categories is as follows: 4 months to 2 years of age (709 µmol/L), 2 to 10 years of age (709 µmol/L), 10 to 18 years of age (740 µmol/L), older than 18 years of age (721 µmol/L) (Blau 2008). Glutamine levels were analyzed over the 12 month study period in patients treated for 12 months with GPB. Monthly glutamine levels were generally higher in patients in the higher baseline ammonia ULN groups and, by three months of treatment, had decreased in the patients with the highest baseline glutamine at baseline (
FIG. 14A ). - There was a statistically significant but comparatively weak correlation between baseline ammonia and glutamine levels at the time of enrollment (r = 0.27; p = 0.008) as well as between fasting glutamine levels and daily ammonia exposure on GPB or NaPBA during the switchover studies (r = 0.292, p<0.001). However, when the relationship between glutamine and ammonia categories with respect to the ULN was analyzed, glutamine values varied substantially for patients in each category and the overall correlation appeared to be driven by patients whose a baseline ammonia exceeded 1.0 ULN (
FIGs. 14A and B ). The descriptive statistics of baseline glutamine by upper limit categories are presented inFIG. 15 and Table 16.Table 16: Descriptive statistics of glutamine by ULN categories. ULN Category N Mean (µmol/L) SD Minimum Maximum 0.0 - < 0.5 37 693.6 199.0 257.0 1378.0 0.5 - < 1.0 33 709.7 183.3 419.0 1135.0 ≥ 1.0 25 856.5 306.0 483.0 1857.0 - Additionally, patients with proximal deficiencies (OTC and CPS) showed a stronger correlation between glutamine and ammonia (
FIG. 16 ). There was no correlation, however, between baseline ammonia and UCD subtype or levels of either citrulline (r=0.04; p=0.414) or argininoosuccinic acid (r=0.14; p=0.158). - An analysis was also performed to determine mean differences in glutamine levels in patients who experienced an HAC and those who did not (Table 17).
Table 17: Mean comparison of glutamine by HAC. HAC N Mean (µmol/L) SD Minimum Maximum No 76 732.0 245.9 257.0 1857.0 Yes 19 782.4 186.2 433.0 1184.0 - A multivariable Cox regression analysis with baseline ULN ammonia values, baseline glutamine values, sex, age, and race was performed and is provided in Table 18.
Table 18: Multivariable Cox regression results for time to first HAC during the study with the inclusion of glutamine. Risk Factor N Hazard Ratio p-value Age in years Pediatric: <18 46 3.12 0.034 Adult: ≥18 49 Ref Ref Baseline Ammonia (µmol/L) 0- < 0.5 ULN 37 Ref Ref 0.5- < 1.0 ULN 33 1.27 0.728 ≥ 1.0 ULN 25 4.29 0.020 Glutamine Levels 0- < 649 µmol/L 32 Ref Ref 649-808 µmol/L 31 2.59 0.177 ≥ 809 µmol/L 32 2.79 0.140 Gender (%) Male 31 2.21 0.121 Female 64 Ref Ref Race (%) White 77 1.34 0.623 Non-white 18 Ref Ref Note, that N= 95 because 5 subjects did not have glutamine values at baseline. - As shown in Table 18, after controlling for the addition of glutamine levels, ULN ammonia categories continued to have a significant association with the risk of HAC. Additionally, an elevated risk of HAC was observed with an increase in glutamine levels. Specifically, patients had about a 2.5 times higher rate of risk of first HAC if their glutamine levels were between 649 µmol/L to 808 µmol/L and about a 2.8 times higher rate of risk of first HAC if their glutamine levels were ≥ 809 µmol/L compared to patients with glutamine levels less than 649 µmol/L.
- Glutamine levels were slightly higher at baseline in patients who experienced an HAC compared to those who did not experience an HAC during the study. Glutamine correlated modestly with fasting ammonia at baseline and decreased during GPB treatment in patients with the highest baseline glutamine levels. Interestingly, the correlation between fasting ammonia and glutamine seemed to be primarily driven by patients with the highest ammonia. This may explain the apparent discrepancy between the present findings and those reported by Maestri et al, whose patient exhibited higher ammonia values than did those patients in the present analyses (Maestri 1992).
-
- 1. Blau Laboratory Guide to the Methods in Biochemical Genetics 71 (2008)
- 2. Brusilow Science 207:659 (1980)
- 3. Brusilow Pediatr Res 29:147 (1991)
- 4. Diaz Mol Genet Metab 102:276 (2011)
- 5. Ghabril Gastroenterology 142:S918 (2012)
- 6. Haberle Eur. J. Pediatr. 170:21 (2011)
- 7. Haberle Orphanet J Rare Dis 7:1750 (2012)
- 8. Lee Mol Genet Metab 100:221 (2010)
- 9. Lichter-Konecki Mol Genet Metab 103:323 (2011)
- 10. McGuire Hepatology 51:2077 (2010)
- 11. Maestri J. Pediatr. 121:259 (1992)
- 12. Rockey Hepatology 56:248 (2012)
- 13. Kaplan Journal of the American Statistical Association 53: 457 (1958)
- 14. Peto Journal of the Royal Statistical Society 185 (1972)
- 15. Hardin Generalized Estimating Equations (2005)
Claims (7)
- Glycerol phenylbutyrate (GPB) for use in a method of preventing a hyperammonemic crisis (HAC) in a subject with a urea cycle disorder (UCD) who has been previously treated with a nitrogen scavenging drug and who has a glutamine level greater than or equal to 649 µmol/L, wherein the method comprises:(a) measuring a fasting blood ammonia level;(b) comparing the fasting blood ammonia level to the upper limit of normal (ULN) for blood ammonia; and(c) administering an effective dosage of GPB to the subject if the fasting blood ammonia level is above 0.5 times the ULN for fasting blood ammonia,wherein the effective dosage of GPB results in the fasting blood ammonia level being <0.5 times the ULN for blood ammonia,
wherein the subject is aged 6 years or older, and
wherein the nitrogen scavenging drug is selected from the group consisting of sodium benzoate, GPB, phenylbutyric acid (PBA), NaPBA, and a combination of two or more of GPB, PBA, and NaPBA. - GPB for use as in claim 1, wherein the effective dosage of GPB results in the fasting blood ammonia level being <0.5 times the ULN for blood ammonia after multiple administrations.
- GPB for use as in claim 1, wherein the subject has previously been administered a first dosage of GPB, preferably
wherein the dosage of GPB administered in step (c) is greater than the first dosage. - GPB for use as in claim 1, wherein the effective dosage of GPB is administered to the subject if the fasting blood ammonia level is equal to or greater than 1.0 ULN and the patient is older than 6 years old.
- GPB for use as in any of claims 1-3, wherein the HAC is a first HAC.
- GBP for use as in any one of claims 1-5, wherein the subject has been previously treated with GPB for an amount of time to maintain a steady state level of the drug in the subject.
- GBP for use as in claim 1, wherein the subject has not been previously treated with GPB, preferably
wherein the subject has been previously treated with sodium phenylbutyrate (NaPBA).
Applications Claiming Priority (2)
| Application Number | Priority Date | Filing Date | Title |
|---|---|---|---|
| US201462007894P | 2014-06-04 | 2014-06-04 | |
| PCT/US2015/033700 WO2015187641A1 (en) | 2014-06-04 | 2015-06-02 | Methods for treating urea cycle disorders to prevent hyperammonemic crises by controlling blood ammonia levels |
Publications (3)
| Publication Number | Publication Date |
|---|---|
| EP3013372A1 EP3013372A1 (en) | 2016-05-04 |
| EP3013372A4 EP3013372A4 (en) | 2016-05-11 |
| EP3013372B1 true EP3013372B1 (en) | 2019-07-10 |
Family
ID=54767264
Family Applications (1)
| Application Number | Title | Priority Date | Filing Date |
|---|---|---|---|
| EP15803069.2A Active EP3013372B1 (en) | 2014-06-04 | 2015-06-02 | Methods for treating urea cycle disorders to prevent hyperammonemic crises by controlling blood ammonia levels |
Country Status (4)
| Country | Link |
|---|---|
| US (1) | US20170087113A1 (en) |
| EP (1) | EP3013372B1 (en) |
| ES (1) | ES2748294T3 (en) |
| WO (1) | WO2015187641A1 (en) |
Families Citing this family (3)
| Publication number | Priority date | Publication date | Assignee | Title |
|---|---|---|---|---|
| SI2760479T1 (en) | 2011-09-30 | 2017-07-31 | Horizon Therapeutics, Llc | Nitrogen scavenging drug for use in a method of treating a nitrogen retention disorder |
| US9914692B2 (en) | 2016-05-25 | 2018-03-13 | Horizon Therapeutics, Llc | Procedure for the preparation of 4-phenyl butyrate and uses thereof |
| US10668040B2 (en) | 2017-09-11 | 2020-06-02 | Horizon Therapeutics, Llc | Treatment of urea cycle disorders in neonates and infants |
Family Cites Families (3)
| Publication number | Priority date | Publication date | Assignee | Title |
|---|---|---|---|---|
| PL3133396T3 (en) * | 2008-04-29 | 2019-03-29 | Horizon Therapeutics, Llc | METHOD OF TREATMENT WITH THE USE OF DRUGS FOR AMMONIA |
| SI2760479T1 (en) * | 2011-09-30 | 2017-07-31 | Horizon Therapeutics, Llc | Nitrogen scavenging drug for use in a method of treating a nitrogen retention disorder |
| RS55870B1 (en) * | 2012-04-20 | 2017-08-31 | Horizon Therapeutics Llc | HPN-100 FOR USE IN TREATMENT OF NITROGEN DISCOVERY |
-
2015
- 2015-06-02 WO PCT/US2015/033700 patent/WO2015187641A1/en not_active Ceased
- 2015-06-02 ES ES15803069T patent/ES2748294T3/en active Active
- 2015-06-02 US US15/316,049 patent/US20170087113A1/en not_active Abandoned
- 2015-06-02 EP EP15803069.2A patent/EP3013372B1/en active Active
Non-Patent Citations (1)
| Title |
|---|
| None * |
Also Published As
| Publication number | Publication date |
|---|---|
| EP3013372A1 (en) | 2016-05-04 |
| EP3013372A4 (en) | 2016-05-11 |
| WO2015187641A1 (en) | 2015-12-10 |
| US20170087113A1 (en) | 2017-03-30 |
| ES2748294T3 (en) | 2020-03-16 |
Similar Documents
| Publication | Publication Date | Title |
|---|---|---|
| US10617665B2 (en) | Methods of therapeutic monitoring of nitrogen scavenging drugs | |
| EP2922576B1 (en) | Methods of administering and evaluating nitrogen scavenging drugs for the treatment of hepatic encephalopathy | |
| AU2018200163B2 (en) | Methods of therapeutic monitoring of phenylacetic acid prodrugs | |
| US20170087113A1 (en) | Methods for treating urea cycle disorders to prevent hyperammonemic crises by controlling blood ammonia levels | |
| HK1208380B (en) | Hpn-100 for use in the treatment of nitrogen retention disorders | |
| HK1213778B (en) | Methods of administering and evaluating nitrogen scavenging drugs for the treatment of hepatic encephalopathy |
Legal Events
| Date | Code | Title | Description |
|---|---|---|---|
| PUAI | Public reference made under article 153(3) epc to a published international application that has entered the european phase |
Free format text: ORIGINAL CODE: 0009012 |
|
| 17P | Request for examination filed |
Effective date: 20160127 |
|
| AK | Designated contracting states |
Kind code of ref document: A1 Designated state(s): AL AT BE BG CH CY CZ DE DK EE ES FI FR GB GR HR HU IE IS IT LI LT LU LV MC MK MT NL NO PL PT RO RS SE SI SK SM TR |
|
| AX | Request for extension of the european patent |
Extension state: BA ME |
|
| A4 | Supplementary search report drawn up and despatched |
Effective date: 20160413 |
|
| RIC1 | Information provided on ipc code assigned before grant |
Ipc: A61K 31/25 20060101ALI20160407BHEP Ipc: G01N 33/84 20060101ALI20160407BHEP Ipc: A61K 31/192 20060101ALI20160407BHEP Ipc: A61K 49/00 20060101AFI20160407BHEP |
|
| 17Q | First examination report despatched |
Effective date: 20160428 |
|
| RAP1 | Party data changed (applicant data changed or rights of an application transferred) |
Owner name: HORIZON THERAPEUTICS, LLC |
|
| STAA | Information on the status of an ep patent application or granted ep patent |
Free format text: STATUS: EXAMINATION IS IN PROGRESS |
|
| DAV | Request for validation of the european patent (deleted) | ||
| RIC1 | Information provided on ipc code assigned before grant |
Ipc: G01N 33/84 20060101ALI20180524BHEP Ipc: A61K 31/216 20060101ALI20180524BHEP Ipc: A61K 31/192 20060101ALI20180524BHEP Ipc: A61K 49/00 20060101AFI20180524BHEP Ipc: A61K 31/25 20060101ALI20180524BHEP |
|
| GRAP | Despatch of communication of intention to grant a patent |
Free format text: ORIGINAL CODE: EPIDOSNIGR1 |
|
| STAA | Information on the status of an ep patent application or granted ep patent |
Free format text: STATUS: GRANT OF PATENT IS INTENDED |
|
| INTG | Intention to grant announced |
Effective date: 20180806 |
|
| GRAJ | Information related to disapproval of communication of intention to grant by the applicant or resumption of examination proceedings by the epo deleted |
Free format text: ORIGINAL CODE: EPIDOSDIGR1 |
|
| STAA | Information on the status of an ep patent application or granted ep patent |
Free format text: STATUS: EXAMINATION IS IN PROGRESS |
|
| GRAP | Despatch of communication of intention to grant a patent |
Free format text: ORIGINAL CODE: EPIDOSNIGR1 |
|
| STAA | Information on the status of an ep patent application or granted ep patent |
Free format text: STATUS: GRANT OF PATENT IS INTENDED |
|
| INTC | Intention to grant announced (deleted) | ||
| INTG | Intention to grant announced |
Effective date: 20190122 |
|
| GRAJ | Information related to disapproval of communication of intention to grant by the applicant or resumption of examination proceedings by the epo deleted |
Free format text: ORIGINAL CODE: EPIDOSDIGR1 |
|
| STAA | Information on the status of an ep patent application or granted ep patent |
Free format text: STATUS: EXAMINATION IS IN PROGRESS |
|
| GRAR | Information related to intention to grant a patent recorded |
Free format text: ORIGINAL CODE: EPIDOSNIGR71 |
|
| GRAS | Grant fee paid |
Free format text: ORIGINAL CODE: EPIDOSNIGR3 |
|
| STAA | Information on the status of an ep patent application or granted ep patent |
Free format text: STATUS: GRANT OF PATENT IS INTENDED |
|
| GRAA | (expected) grant |
Free format text: ORIGINAL CODE: 0009210 |
|
| STAA | Information on the status of an ep patent application or granted ep patent |
Free format text: STATUS: THE PATENT HAS BEEN GRANTED |
|
| INTC | Intention to grant announced (deleted) | ||
| RAP1 | Party data changed (applicant data changed or rights of an application transferred) |
Owner name: IMMEDICA PHARMA AB |
|
| AK | Designated contracting states |
Kind code of ref document: B1 Designated state(s): AL AT BE BG CH CY CZ DE DK EE ES FI FR GB GR HR HU IE IS IT LI LT LU LV MC MK MT NL NO PL PT RO RS SE SI SK SM TR |
|
| AX | Request for extension of the european patent |
Extension state: BA ME |
|
| INTG | Intention to grant announced |
Effective date: 20190603 |
|
| REG | Reference to a national code |
Ref country code: GB Ref legal event code: FG4D |
|
| REG | Reference to a national code |
Ref country code: CH Ref legal event code: EP Ref country code: AT Ref legal event code: REF Ref document number: 1152825 Country of ref document: AT Kind code of ref document: T Effective date: 20190715 |
|
| REG | Reference to a national code |
Ref country code: DE Ref legal event code: R096 Ref document number: 602015033652 Country of ref document: DE |
|
| REG | Reference to a national code |
Ref country code: IE Ref legal event code: FG4D |
|
| REG | Reference to a national code |
Ref country code: NL Ref legal event code: MP Effective date: 20190710 |
|
| REG | Reference to a national code |
Ref country code: LT Ref legal event code: MG4D |
|
| REG | Reference to a national code |
Ref country code: AT Ref legal event code: MK05 Ref document number: 1152825 Country of ref document: AT Kind code of ref document: T Effective date: 20190710 |
|
| PG25 | Lapsed in a contracting state [announced via postgrant information from national office to epo] |
Ref country code: HR Free format text: LAPSE BECAUSE OF FAILURE TO SUBMIT A TRANSLATION OF THE DESCRIPTION OR TO PAY THE FEE WITHIN THE PRESCRIBED TIME-LIMIT Effective date: 20190710 Ref country code: LT Free format text: LAPSE BECAUSE OF FAILURE TO SUBMIT A TRANSLATION OF THE DESCRIPTION OR TO PAY THE FEE WITHIN THE PRESCRIBED TIME-LIMIT Effective date: 20190710 Ref country code: SE Free format text: LAPSE BECAUSE OF FAILURE TO SUBMIT A TRANSLATION OF THE DESCRIPTION OR TO PAY THE FEE WITHIN THE PRESCRIBED TIME-LIMIT Effective date: 20190710 Ref country code: BG Free format text: LAPSE BECAUSE OF FAILURE TO SUBMIT A TRANSLATION OF THE DESCRIPTION OR TO PAY THE FEE WITHIN THE PRESCRIBED TIME-LIMIT Effective date: 20191010 Ref country code: NL Free format text: LAPSE BECAUSE OF FAILURE TO SUBMIT A TRANSLATION OF THE DESCRIPTION OR TO PAY THE FEE WITHIN THE PRESCRIBED TIME-LIMIT Effective date: 20190710 Ref country code: PT Free format text: LAPSE BECAUSE OF FAILURE TO SUBMIT A TRANSLATION OF THE DESCRIPTION OR TO PAY THE FEE WITHIN THE PRESCRIBED TIME-LIMIT Effective date: 20191111 Ref country code: FI Free format text: LAPSE BECAUSE OF FAILURE TO SUBMIT A TRANSLATION OF THE DESCRIPTION OR TO PAY THE FEE WITHIN THE PRESCRIBED TIME-LIMIT Effective date: 20190710 Ref country code: NO Free format text: LAPSE BECAUSE OF FAILURE TO SUBMIT A TRANSLATION OF THE DESCRIPTION OR TO PAY THE FEE WITHIN THE PRESCRIBED TIME-LIMIT Effective date: 20191010 Ref country code: AT Free format text: LAPSE BECAUSE OF FAILURE TO SUBMIT A TRANSLATION OF THE DESCRIPTION OR TO PAY THE FEE WITHIN THE PRESCRIBED TIME-LIMIT Effective date: 20190710 |
|
| PG25 | Lapsed in a contracting state [announced via postgrant information from national office to epo] |
Ref country code: RS Free format text: LAPSE BECAUSE OF FAILURE TO SUBMIT A TRANSLATION OF THE DESCRIPTION OR TO PAY THE FEE WITHIN THE PRESCRIBED TIME-LIMIT Effective date: 20190710 Ref country code: IS Free format text: LAPSE BECAUSE OF FAILURE TO SUBMIT A TRANSLATION OF THE DESCRIPTION OR TO PAY THE FEE WITHIN THE PRESCRIBED TIME-LIMIT Effective date: 20191110 Ref country code: LV Free format text: LAPSE BECAUSE OF FAILURE TO SUBMIT A TRANSLATION OF THE DESCRIPTION OR TO PAY THE FEE WITHIN THE PRESCRIBED TIME-LIMIT Effective date: 20190710 Ref country code: AL Free format text: LAPSE BECAUSE OF FAILURE TO SUBMIT A TRANSLATION OF THE DESCRIPTION OR TO PAY THE FEE WITHIN THE PRESCRIBED TIME-LIMIT Effective date: 20190710 Ref country code: GR Free format text: LAPSE BECAUSE OF FAILURE TO SUBMIT A TRANSLATION OF THE DESCRIPTION OR TO PAY THE FEE WITHIN THE PRESCRIBED TIME-LIMIT Effective date: 20191011 |
|
| REG | Reference to a national code |
Ref country code: ES Ref legal event code: FG2A Ref document number: 2748294 Country of ref document: ES Kind code of ref document: T3 Effective date: 20200316 |
|
| PG25 | Lapsed in a contracting state [announced via postgrant information from national office to epo] |
Ref country code: TR Free format text: LAPSE BECAUSE OF FAILURE TO SUBMIT A TRANSLATION OF THE DESCRIPTION OR TO PAY THE FEE WITHIN THE PRESCRIBED TIME-LIMIT Effective date: 20190710 |
|
| PG25 | Lapsed in a contracting state [announced via postgrant information from national office to epo] |
Ref country code: RO Free format text: LAPSE BECAUSE OF FAILURE TO SUBMIT A TRANSLATION OF THE DESCRIPTION OR TO PAY THE FEE WITHIN THE PRESCRIBED TIME-LIMIT Effective date: 20190710 Ref country code: EE Free format text: LAPSE BECAUSE OF FAILURE TO SUBMIT A TRANSLATION OF THE DESCRIPTION OR TO PAY THE FEE WITHIN THE PRESCRIBED TIME-LIMIT Effective date: 20190710 Ref country code: DK Free format text: LAPSE BECAUSE OF FAILURE TO SUBMIT A TRANSLATION OF THE DESCRIPTION OR TO PAY THE FEE WITHIN THE PRESCRIBED TIME-LIMIT Effective date: 20190710 Ref country code: PL Free format text: LAPSE BECAUSE OF FAILURE TO SUBMIT A TRANSLATION OF THE DESCRIPTION OR TO PAY THE FEE WITHIN THE PRESCRIBED TIME-LIMIT Effective date: 20190710 |
|
| PG25 | Lapsed in a contracting state [announced via postgrant information from national office to epo] |
Ref country code: CZ Free format text: LAPSE BECAUSE OF FAILURE TO SUBMIT A TRANSLATION OF THE DESCRIPTION OR TO PAY THE FEE WITHIN THE PRESCRIBED TIME-LIMIT Effective date: 20190710 Ref country code: SK Free format text: LAPSE BECAUSE OF FAILURE TO SUBMIT A TRANSLATION OF THE DESCRIPTION OR TO PAY THE FEE WITHIN THE PRESCRIBED TIME-LIMIT Effective date: 20190710 Ref country code: IS Free format text: LAPSE BECAUSE OF FAILURE TO SUBMIT A TRANSLATION OF THE DESCRIPTION OR TO PAY THE FEE WITHIN THE PRESCRIBED TIME-LIMIT Effective date: 20200224 Ref country code: SM Free format text: LAPSE BECAUSE OF FAILURE TO SUBMIT A TRANSLATION OF THE DESCRIPTION OR TO PAY THE FEE WITHIN THE PRESCRIBED TIME-LIMIT Effective date: 20190710 |
|
| REG | Reference to a national code |
Ref country code: DE Ref legal event code: R097 Ref document number: 602015033652 Country of ref document: DE |
|
| PLBE | No opposition filed within time limit |
Free format text: ORIGINAL CODE: 0009261 |
|
| STAA | Information on the status of an ep patent application or granted ep patent |
Free format text: STATUS: NO OPPOSITION FILED WITHIN TIME LIMIT |
|
| PG2D | Information on lapse in contracting state deleted |
Ref country code: IS |
|
| 26N | No opposition filed |
Effective date: 20200603 |
|
| PG25 | Lapsed in a contracting state [announced via postgrant information from national office to epo] |
Ref country code: SI Free format text: LAPSE BECAUSE OF FAILURE TO SUBMIT A TRANSLATION OF THE DESCRIPTION OR TO PAY THE FEE WITHIN THE PRESCRIBED TIME-LIMIT Effective date: 20190710 |
|
| PG25 | Lapsed in a contracting state [announced via postgrant information from national office to epo] |
Ref country code: MC Free format text: LAPSE BECAUSE OF FAILURE TO SUBMIT A TRANSLATION OF THE DESCRIPTION OR TO PAY THE FEE WITHIN THE PRESCRIBED TIME-LIMIT Effective date: 20190710 |
|
| REG | Reference to a national code |
Ref country code: CH Ref legal event code: PL |
|
| PG25 | Lapsed in a contracting state [announced via postgrant information from national office to epo] |
Ref country code: LU Free format text: LAPSE BECAUSE OF NON-PAYMENT OF DUE FEES Effective date: 20200602 |
|
| REG | Reference to a national code |
Ref country code: BE Ref legal event code: MM Effective date: 20200630 |
|
| PG25 | Lapsed in a contracting state [announced via postgrant information from national office to epo] |
Ref country code: CH Free format text: LAPSE BECAUSE OF NON-PAYMENT OF DUE FEES Effective date: 20200630 Ref country code: IE Free format text: LAPSE BECAUSE OF NON-PAYMENT OF DUE FEES Effective date: 20200602 Ref country code: LI Free format text: LAPSE BECAUSE OF NON-PAYMENT OF DUE FEES Effective date: 20200630 |
|
| PG25 | Lapsed in a contracting state [announced via postgrant information from national office to epo] |
Ref country code: BE Free format text: LAPSE BECAUSE OF NON-PAYMENT OF DUE FEES Effective date: 20200630 |
|
| PG25 | Lapsed in a contracting state [announced via postgrant information from national office to epo] |
Ref country code: MT Free format text: LAPSE BECAUSE OF FAILURE TO SUBMIT A TRANSLATION OF THE DESCRIPTION OR TO PAY THE FEE WITHIN THE PRESCRIBED TIME-LIMIT Effective date: 20190710 Ref country code: CY Free format text: LAPSE BECAUSE OF FAILURE TO SUBMIT A TRANSLATION OF THE DESCRIPTION OR TO PAY THE FEE WITHIN THE PRESCRIBED TIME-LIMIT Effective date: 20190710 |
|
| PG25 | Lapsed in a contracting state [announced via postgrant information from national office to epo] |
Ref country code: MK Free format text: LAPSE BECAUSE OF FAILURE TO SUBMIT A TRANSLATION OF THE DESCRIPTION OR TO PAY THE FEE WITHIN THE PRESCRIBED TIME-LIMIT Effective date: 20190710 |
|
| P01 | Opt-out of the competence of the unified patent court (upc) registered |
Effective date: 20230525 |
|
| PGFP | Annual fee paid to national office [announced via postgrant information from national office to epo] |
Ref country code: DE Payment date: 20250618 Year of fee payment: 11 |
|
| PGFP | Annual fee paid to national office [announced via postgrant information from national office to epo] |
Ref country code: GB Payment date: 20250416 Year of fee payment: 11 |
|
| PGFP | Annual fee paid to national office [announced via postgrant information from national office to epo] |
Ref country code: FR Payment date: 20250415 Year of fee payment: 11 |
|
| PGFP | Annual fee paid to national office [announced via postgrant information from national office to epo] |
Ref country code: ES Payment date: 20250718 Year of fee payment: 11 |
|
| PGFP | Annual fee paid to national office [announced via postgrant information from national office to epo] |
Ref country code: IT Payment date: 20250630 Year of fee payment: 11 |