EP2984983B1 - Visual-field-test assistance device - Google Patents
Visual-field-test assistance device Download PDFInfo
- Publication number
- EP2984983B1 EP2984983B1 EP13876498.0A EP13876498A EP2984983B1 EP 2984983 B1 EP2984983 B1 EP 2984983B1 EP 13876498 A EP13876498 A EP 13876498A EP 2984983 B1 EP2984983 B1 EP 2984983B1
- Authority
- EP
- European Patent Office
- Prior art keywords
- test
- inference
- visual field
- result
- visual
- Prior art date
- Legal status (The legal status is an assumption and is not a legal conclusion. Google has not performed a legal analysis and makes no representation as to the accuracy of the status listed.)
- Active
Links
Images

Classifications
-
- A—HUMAN NECESSITIES
- A61—MEDICAL OR VETERINARY SCIENCE; HYGIENE
- A61B—DIAGNOSIS; SURGERY; IDENTIFICATION
- A61B3/00—Apparatus for testing the eyes; Instruments for examining the eyes
- A61B3/0016—Operational features thereof
- A61B3/0025—Operational features thereof characterised by electronic signal processing, e.g. eye models
-
- A—HUMAN NECESSITIES
- A61—MEDICAL OR VETERINARY SCIENCE; HYGIENE
- A61B—DIAGNOSIS; SURGERY; IDENTIFICATION
- A61B3/00—Apparatus for testing the eyes; Instruments for examining the eyes
- A61B3/02—Subjective types, i.e. testing apparatus requiring the active assistance of the patient
- A61B3/024—Subjective types, i.e. testing apparatus requiring the active assistance of the patient for determining the visual field, e.g. perimeter types
-
- A—HUMAN NECESSITIES
- A61—MEDICAL OR VETERINARY SCIENCE; HYGIENE
- A61B—DIAGNOSIS; SURGERY; IDENTIFICATION
- A61B3/00—Apparatus for testing the eyes; Instruments for examining the eyes
- A61B3/0091—Fixation targets for viewing direction
-
- A—HUMAN NECESSITIES
- A61—MEDICAL OR VETERINARY SCIENCE; HYGIENE
- A61B—DIAGNOSIS; SURGERY; IDENTIFICATION
- A61B3/00—Apparatus for testing the eyes; Instruments for examining the eyes
- A61B3/02—Subjective types, i.e. testing apparatus requiring the active assistance of the patient
- A61B3/06—Subjective types, i.e. testing apparatus requiring the active assistance of the patient for testing light sensitivity, e.g. adaptation; for testing colour vision
- A61B3/063—Subjective types, i.e. testing apparatus requiring the active assistance of the patient for testing light sensitivity, e.g. adaptation; for testing colour vision for testing light sensitivity, i.e. adaptation
-
- G—PHYSICS
- G16—INFORMATION AND COMMUNICATION TECHNOLOGY [ICT] SPECIALLY ADAPTED FOR SPECIFIC APPLICATION FIELDS
- G16H—HEALTHCARE INFORMATICS, i.e. INFORMATION AND COMMUNICATION TECHNOLOGY [ICT] SPECIALLY ADAPTED FOR THE HANDLING OR PROCESSING OF MEDICAL OR HEALTHCARE DATA
- G16H50/00—ICT specially adapted for medical diagnosis, medical simulation or medical data mining; ICT specially adapted for detecting, monitoring or modelling epidemics or pandemics
- G16H50/20—ICT specially adapted for medical diagnosis, medical simulation or medical data mining; ICT specially adapted for detecting, monitoring or modelling epidemics or pandemics for computer-aided diagnosis, e.g. based on medical expert systems
Definitions
- the present disclosure relates to a visual field test assistance apparatus which assists a visual field test of eyesight.
- a visual field test performed for diagnosing diseases such as glaucoma, etc.
- a known testing method of arranging a plurality of test points within an assumed visual field lighting each of the test points at a designated luminance, and asking the patient as to whether or not he/she can see the light.
- Such a testing method may be the Humphrey visual field test.
- US patent application US 2010/0007851 A1 relates to methods for efficient adaptive measurement and classification of contrast sensitivity functions and spatiotemporal contrast sensitivity surface by selecting the most informative stimulus before each trial.
- a quick contrast sensitivity function (qCSF) method is described, the method comprising providing a prior probability density p( ⁇ ), selecting a grating stimulus, s, that minimises the expected entropy of the Bayesian posterior, displaying s to a subject, receiving a response to s from the subject, updating the prior p( ⁇ ) according to the Bayes rule and the response, reiterating the preceding steps and terminating the process according to a stopping criterion.
- qCSF quick contrast sensitivity function
- Embodiments provide methods and systems for measuring and quantifying the volume of the Hill of Vision for an individual subject.
- a method for mapping a Hill of Vision for a subject is described, wherein the method comprises importing threshold data from an input source, converting the threshold data to constraints on a spline surface with an algorithm to create a three-dimensional representation of the Hill of Vision, and displaying one or more three-dimensional representations of the Hill of Vision.
- US patent US 6 033 076 A relates to visual field testing via telemedicine.
- a method and an apparatus are described for the performance and autointerpretation via the Internet, or other telemetric vehicle, of the visual function test parameters obtained during interactive, visual field screening utilising a local display screen.
- Such interactive testing and instantaneous autointerpretation of visual field performance utilising a local display screen, via telemedicine, are utilised to screen for glaucoma and other neurological disorders affecting the visual system.
- Telemedicine such as via the Internet, allows the system to be employed on a world-wide basis, including areas where physicians are not present.
- a visual field test assistance apparatus capable of inferring the status of the current visual field at each test point has been desired.
- the present disclosure has been made in view of the above, and one of the objectives of the present disclosure is to provide a visual field test assistance apparatus capable of estimating the status of the current visual field at each test point.
- the invention is defined in claim 1 and the dependent claims 2 - 5.
- the present disclosure provides an apparatus which assists a visual field test testing visual sensitivity at each of a plurality of test points arranged within a predetermined previously assumed visual field range, the apparatus comprising, an acquisition device which acquires parameters regarding a predetermined mixture distribution, the parameters being learned with reference to time-series information of visual field test results obtained in the past regarding a plurality of cases using said mixture distribution as a prior-distribution for learning parameters, an inference calculation device which calculates an inference test result vector representing an inference result of visual sensitivity to be obtained by the visual field test at each test point, by Bayesian inference, by applying said mixture distribution using the acquired parameters as a prior-distribution for inference calculation, and an output device which performs an information output process on the basis of the inference test result vector obtained by the inference calculation device, wherein, during the visual field test, when a visual sensitivity is obtained at a test point by the time of an inference process, the inference calculation device performs a process
- an inference result of the current visual sensitivity can be obtained.
- a visual field test assistance apparatus 1 can be realized by a computer, and specifically, comprises a control unit 11, a storage unit 12, an operation unit 13, a display unit 14, and an input/output unit 15, as exemplified in FIG. 1 .
- control unit 11 is a program controlled device such as a CPU, etc., and operates in accordance with a program stored in the storage unit 12. According to the present embodiment, the control unit 11 executes a current visual field inference process assisting a visual field test testing visual sensitivity at each of a plurality of test points arranged within a previously assumed visual field range, and a future visual field inference process.
- a current visual field inference process assisting a visual field test testing visual sensitivity at each of a plurality of test points arranged within a previously assumed visual field range, and a future visual field inference process.
- a predetermined mixture distribution is employed as the prior-distribution
- time-series information of visual field test results regarding a plurality of cases obtained in the past is referred to, and parameters regarding the applied mixture distribution is learned and stored.
- control unit 11 uses a mixture distribution using the learned parameters as a prior-distribution, performs Bayesian inference (specifically, inference by Bayesian linear regression) to calculate an inference test result vector expressing the inference results of visual sensitivities at the respective test points, i.e., the results assumed to be obtained through the visual field tests, and executes an information output process on the basis of the inference test result vector obtained through the Bayesian inference.
- Bayesian inference specifically, inference by Bayesian linear regression
- the control unit 11 updates the prior-distribution by the obtained partial visual sensitivity information, and performs inference by Bayesian linear regression to obtain a partial inference test result vector expressing the inference results of visual sensitivities at the test points at which the visual sensitivities have not been obtained at the time of the inference process. Then, the control unit 11 executes the information output process on the basis of the obtained partial inference test result vector.
- the control unit 11 also performs a future visual field inference process which includes acquiring time-variable information of visual sensitivities at respective test points, and executing a regression analysis process regarding the acquired time-varied information of visual sensitivities at respective test points.
- the control unit 11 counts the number of the test points at which the p value for the slope obtained by the regression analysis process is lower than a predetermined analysis threshold value, with respect each of the analysis threshold values, performs a binomial test regarding each of the counted numbers of the test points, and calculates binomial test p values which are the results of the binomial tests.
- the control unit 11 subjects the calculated binomial test p values to an averaging process, and calculates an averaged binomial test p value, determines presence or absence of a change in the visual sensitivity by referring to whether or not the averaged binomial test p value is lower than a predetermined binominal test threshold value, and outputs a result of the determination.
- the processes of the control unit 11 will also be described later below.
- the storage unit 12 is a memory device, a disk device, etc., which holds a program to be executed by the control unit 11.
- the program may be provided by being stored in a computer-readable non-transitory medium, and copied to the storage unit 12. Further, the storage unit 12 stores information, such as a parameter value, which is necessary for the processes by the control unit 11.
- the storage unit 12 also functions as a work memory for the control unit 11.
- the operation unit 13 includes a keyboard, a mouse, and the like.
- the operation unit 13 receives a user's instruction operation, and outputs the content of the instruction operation to the control unit 11.
- the display unit 14 is a display, a printer, and the like, which outputs information in accordance with the instruction input from the control unit 11.
- the input/output unit 15 is a serial or parallel interface which performs data input/output.
- the input/output unit 15 receives information from an external apparatus, and outputs the received information to the control unit 11. Also, in accordance with instructions input from the control unit 11, the input/output unit 15 outputs information to an external apparatus.
- the current visual field inference process by the control unit 11 will be explained.
- wm is a vector with an intercept and a slope expressing the visual field progression
- L represents a precision matrix (inverse matrix of a variance-covariance matrix)
- ⁇ represents a scalar value determining a degree of precision.
- the symbol of the encircled x represents a Kronecker product.
- . represents a multivariate normal distribution.
- xn represents time which has passed from the initial test
- IDt represents the identity matrix having dimensions of Dt ⁇ Dt.
- the precision matrix L is also described using a predetermined mixture distribution.
- the precision matrix L can be described by a mixture of Wishart distributions as represented by Formulae (4) and (5).
- the scalar value ⁇ representing a degree of precision can be described by, for example, a mixture gamma distribution, as represented by Formulae (6) and (7).
- a mixture gamma distribution as represented by Formulae (6) and (7).
- Such mixture distributions are applied, taking into account the experimental knowledge that visual field loss does not always occur at one location, but may occur at a plurality of locations.
- likelihood including latent variables i.e., P T w ⁇ L ⁇ z ⁇ is described as the product of a sequence of the products of these mixture distributions, the number of the products in the sequence being the number of eyes, specifically, as represented by Formula (*).
- the control unit 11 uses a formula obtained by assigning Formulae (1) to (6) to Formula (*), to infer the following parameters (hyperparameters). ⁇ , W , ⁇ , ⁇ , a , b , ⁇ , ⁇ , ⁇ Specifically, the EM Algorithm can be used for this inference for parameters.
- Nm represents the number of tests regarding the eye m
- Dw represents the dimension of the vector ⁇ m.
- each optimal posterior distribution is represented as below.
- q ⁇ w m N w m
- hyperparameter re-estimating equations with respect to W , ⁇ , ⁇ , b , ⁇ , ⁇ , ⁇ are as follows.
- the new a is described as a g new
- ⁇ ( ⁇ ) represents a digamma function
- control unit 11 alternately executes the above E-step and the M-step, and calculates the optimal hyperparameters.
- the lower bound of the likelihood P(T) can be calculated as below.
- the control unit 11 stores the optimal hyperparameter values calculated from above, in the storage unit 12.
- the control unit 11 executes the following inference process.
- the inference process is different between (1) the inference process for a patient who has undergone the visual field test for N times before, and (2) the inference process for a patient who undergoes the visual field test for the first time. Therefore, these cases are described separately.
- the control unit 11 receives instructions indicating the case (1) or the case (2), and executes ether of the following processes.
- the control unit 11 executes Bayesian inference calculation, provided that the inference test result vector tN+1 indicates an inference result of visual sensitivity at each test point in the current visual field test, that each of the test result vectors t1, t2, ..., tN indicates each of the past N-time actual measurement results of the visual sensitivity at the each test point, and that the full likelihood of the inference test result vector tN+1 is represented as below.
- parameters which have been previously calculated and stored in the storage unit 12 are used for ⁇ , W , ⁇ , ⁇ , a , b , ⁇ , ⁇ , ⁇
- the control unit 11 obtains the inference test result vector tN+1 which indicates an inference result of visual sensitivity at each test point in the current visual field test. Then, the control unit 11 executes an information output process on the basis of the obtained inference result vector tN+1. The information output process will be described below.
- control unit 11 updates the content of the information output during the actual visual field test. Namely, when the visual field test is performed and a part of the actual test results (visual sensitivity information of a part of the test points) is input through the input/output unit 15, the control unit 11 updates the prior-distribution with reference to the visual sensitivity information of the test points which has already been obtained by the time of the inference process. Specifically, the control unit 11 divides the test result vector tN+1 into the visual sensitivity information (vector) ta indicating the visual sensitivity information of the test points which has not been obtained by time of the process, and the visual sensitivity information (vector) tb indicating the visual sensitivity information of the test points which has already been obtained by the time of the process.
- control unit 11 calculates the inference result ta of the unmeasured test points as a partial inference test result vector, using the following equation.
- t b N t a
- each of a plurality of unmeasured test points is a selected test point, the inference test result information at the selected test point can be obtained.
- the control unit 11 executes an information output process, on the basis of the thus obtained inference result ta(P(ta
- the information output process will be explained later below.
- control unit 11 In case of a patient who undergoes the visual field test for the first time, no past information is present. Therefore, upon receiving instructions to perform inference regarding a patient who undergoes the visual field test for the first time, the control unit 11 infers the posterior distribution which should be the inference result of the visual sensitivity information at each test point, by performing approximate inference using a mixture normal distribution.
- the full likelihood at the time point 0 is set as the following equation.
- the control unit 11 obtains a mixture normal distribution to minimize Kullback-Leibler divergence represented by the formula below. ⁇ ⁇ q t 0
- the control unit 11 uses a predetermined mixture normal distribution function, and appropriately (for example, randomly) sets initial values for the parameters of the function.
- the control unit 11 repeats the process of calculating the Kullback-Leibler divergence of the mixture normal distribution function, updating the parameters to minimize the Kullback-Leibler divergence, and calculating the Kullback-Leibler divergence again, until the Kullback-Leibler divergence converges.
- the specific embodiment for this calculation can be a widely known method.
- control unit 11 obtains q t 0
- control unit 11 marginalizes the above regarding w and z, to obtain "t0". Specifically, the control unit 11 calculates the following equation to obtain "t0". ⁇ z ⁇ q t 0
- control unit 11 uses parameter values stored in the storage unit 12. Further, the Kullback-Leibler divergence at this time can be represented as follows.
- the control unit 11 executes an information output process on the basis of the thus obtained t0.
- the information output process will be described later below.
- control unit 11 updates the content of the information output during the actual visual field test for a patient who undergoes the visual field test for the first time. Namely, when the visual field test is performed and a part of the actual test results (visual sensitivity information of a part of the test points) is input through the input/output unit 15, the control unit 11 updates the prior-distribution with reference to the visual sensitivity information of the test points which has already been obtained by the time of inference process.
- the control unit 11 divides the test result vector t into the visual sensitivity information (vector) ta indicating the visual sensitivity information of the test points which has not been obtained by time of the process, and visual sensitivity information (vector) tb indicating the visual sensitivity information of the test points which has already been obtained by the time of the process.
- the corresponding p and ⁇ are represented as below.
- the control unit 11 calculates the inference result ta of a part of the test points as a partial inference test result vector, using the following equation.
- each of a plurality of unmeasured test points is a selected test point, the inference test result information at the selected test point can be obtained.
- the control unit 11 executes an information output process, on the basis of the thus obtained inference result ta(P(ta
- the information output process will be explained below.
- the control unit 11 executes an information output process, after obtaining an inference test result vector or a partial inference test result vector, including the inference results of the visual sensitivity at unmeasured test points, as described above.
- the control unit 11 may display a list including information for specifying respective test points as well as the visual sensitivity inference results of at least a part of the relevant test points (unmeasured test points) included in the inference test result vector or the partial inference test result vector, as they are.
- a testing personnel can obtain information regarding the luminance which is inferred to be visible for a patient at a predetermined probability, and can select a luminance to be initially presented to the patient at each test point, with reference to the luminance indicated by the information as probably visible. Accordingly, the number of trials to present a luminance which is definitely visible for the patient, can be decreased, resulting in decreasing the number of repetitions at each test point, and reducing the burden of the test for both the testing personnel and the patient.
- the control unit 11 may execute the following process. Namely, the control unit 11 calculates a difference between the inference result at the selected test point and the inference result or the measurement result (actual test result) of the visual sensitivity at a test point neighboring to the selected test point, and when the calculated difference exceeds a predetermined threshold value for spatial change, the control unit 11 outputs information for specifying a neighbor space of the selected test point.
- test points Pi-1,j, Pi,j-1, Pi+1,j, Pi,j+1 (usually referred to as 4-neighbor test points) which have been previously set adjacent to the test point Pi, j, and that inferred visual sensitivity values for these test points are V[Pi,j], V[Pi-1,j], V[Pi,j-1], V[Pi+1,j], V[Pi,j+1], respectively
- , ⁇ i,j-1
- , ⁇ i+1,j
- , ⁇ i,j+1
- the control unit 11 When any of the calculated differences exceeds a predetermined threshold value (referred to as spatial change threshold value), the control unit 11 outputs information which specifies a neighbor space of the selected test point Pi,j, to the display unit 14. At this time, the control unit 11 may also display, on the display unit 14, a suggestion to arrange more test points within the specified space.
- the neighbor space of the selected test point Pi,j may be the position of the selected test point Pi,j itself.
- the neighbor space of the selected test point Pi,j may also be a range of space within a predetermined distance r from the selected test point Pi,j, and the like.
- the testing personnel may arrange more test points within the displayed range or around the displayed position, in accordance with need, and perform the measurement at these test points. Thereby, more accurate testing becomes possible.
- the visual field test assistance apparatus 1 may infer the result of a future visual field test, and output the inference result thereof, as described below.
- the control unit 11 receives the results of the tests undergone by the patient in the past.
- the received test results include the visual sensitivity information of a plurality of time points in the past, regarding each test point.
- the control unit 11 executes a regression analysis process regarding the change in the visual sensitivity over time indicated by the information acquired as above, to thereby obtain values for an intercept and a slope as well as p values therefor, regarding the change.
- the control unit 11 counts the number of test points where the p value for the slope is lower than a predetermined analysis threshold value (where the change of test result over time progresses) .
- the control unit 11 executes a one-sided binomial test regarding the counted number of test points, to calculate a result of the binomial test, i.e., a binomial test p value (a probability that the number of test points is not significant) .
- a binomial test p value a probability that the number of test points is not significant
- the control unit 11 sets the analysis threshold value to a plurality of values which are different from each other, and repeats the above process regarding the plurality of analysis threshold values .
- the analysis threshold values are set to, for example, four values, i.e., 0.025, 0.5, 0.075, and 0.1.
- the control unit 11 calculates an averaged binomial test p value, by averaging the binomial test p values obtained corresponding to the respective analysis threshold values (specifically, the median of the binomial test p values may be used) .
- the control unit 11 determines that the visual sensitivity change over time is significant (the change in the test result (visual sensitivity) progresses over time). Then, the control unit 11 outputs the determination result regarding the presence/absence of the change in the visual sensitivity over time, to the display unit 14.
- the control unit 11 determines the visual sensitivity change over time is present, the control unit 11 displays a position, within the visual field space, of a test point having a p value (p value relating to the slope of the regression analysis result) lower than a predetermined analysis threshold value. Thereby, the location of the test point inferred as having a visual sensitivity change over time is provided. Then, on the basis of the regression analysis result with respect to each test point determined as having a visual sensitivity change over time, the control unit 11 obtains an inference result of the visual field at a designated time point in the future, and outputs the obtained inference result. This process is performed by assigning the regression analysis result and time until the designated time point to a regression formula, with respect to each test point determined as having a visual sensitivity change over time, and obtaining and displaying the visual sensitivity information at each test point.
- p value p value relating to the slope of the regression analysis result
- a portion where progression in visual sensitivity occurs, and a future visual sensitivity at the relevant portion can be provided.
- the testing personnel and the patient can obtain an inference result regarding a visual field test result to be obtained in the future.
- a medical staff can specifically point out the future situation while taking the living conditions of the patient into account, resulting in contributing the decision on treatment, etc.
- the visual field test assistance apparatus 1 has a structure as above, and operates as follows. Namely, the visual field test assistance apparatus 1 performs Bayesian inference using a predetermined mixture distribution for the prior-distribution, and infers a result of a current or future visual field test as a posterior distribution. At this time, parameters relating to the mixture distribution have been obtained in advance, through a learning process using known information, i.e., measurement results of a plurality of occasions (time-series information measured with time intervals), regarding a plurality of patients measured in the past.
- known information i.e., measurement results of a plurality of occasions (time-series information measured with time intervals)
- the visual field test assistance apparatus 1 performs Bayesian inference using information of the patient's past test result and the mixture distribution using the previously obtained parameters, and infers a visual field test result of the current test (information of luminance which is inferred to be visible for a patient at a predetermined probability at each test point) . Then, the visual field test assistance apparatus 1 provides the inference result to the testing personnel.
- the testing personnel refers to the luminance information, and determines a luminance to be initially presented to the patient regarding each unmeasured test point.
- the testing personnel inputs luminance information obtained at each test point through the test, to the visual field test assistance apparatus 1 (or the device used for the test may be set to input the relevant information, without requiring any human-made operations).
- the visual field test assistance apparatus 1 receives the luminance information obtained during the test at a test point
- the visual field test assistance apparatus 1 updates the prior-distribution using the received information, and infers a visual field test result at an unmeasured test point by Bayesian inference.
- the visual field test assistance apparatus 1 provides a newly inferred result to the testing personnel.
- the testing personnel refers to the newly inferred result and determines a luminance which should be initially presented to the patient at the unmeasured test point.
- test results can be obtained in a comparatively short time.
- the visual field test assistance apparatus 1 calculates a difference between an inference result of visual sensitivity at a test point (selected test point) and an inference result or a measurement result (actual test result) of visual sensitivity at a neighbour test point, and when the calculated difference exceeds a predetermined spatial change threshold value, the visual field test assistance apparatus 1 outputs information specifying a neighbour space of the selected test point.
- the spatial change threshold value does not have to be the same value over the entirety of the visual field space.
- the space change threshold value to be used for the comparison with the difference ⁇ between the pair of test points may be set greater, compared to the space change threshold value to be used for the comparison for the test points located in other part.
- parameters may be divided into a plurality of groups on the basis of race, sex, residence, etc., and parameters may be obtained for respective groups through learning using test results of patients belonging to respective groups.
- the visual field test assistance apparatus 1 infers the test result regarding a patient to be inferred, by selecting parameters obtained through learning on the basis of patient information belonging to a group, the same as the group to which the relevant patient to be inferred belongs.
Landscapes
- Health & Medical Sciences (AREA)
- Life Sciences & Earth Sciences (AREA)
- Engineering & Computer Science (AREA)
- Biomedical Technology (AREA)
- Public Health (AREA)
- Medical Informatics (AREA)
- General Health & Medical Sciences (AREA)
- Heart & Thoracic Surgery (AREA)
- Ophthalmology & Optometry (AREA)
- Molecular Biology (AREA)
- Surgery (AREA)
- Animal Behavior & Ethology (AREA)
- Physics & Mathematics (AREA)
- Biophysics (AREA)
- Veterinary Medicine (AREA)
- Data Mining & Analysis (AREA)
- Databases & Information Systems (AREA)
- Pathology (AREA)
- Epidemiology (AREA)
- Primary Health Care (AREA)
- Signal Processing (AREA)
- Eye Examination Apparatus (AREA)
- Image Processing (AREA)
- Management, Administration, Business Operations System, And Electronic Commerce (AREA)
- Measuring And Recording Apparatus For Diagnosis (AREA)
- Measurement Of The Respiration, Hearing Ability, Form, And Blood Characteristics Of Living Organisms (AREA)
Description
- The present disclosure relates to a visual field test assistance apparatus which assists a visual field test of eyesight.
- As a visual field test performed for diagnosing diseases such as glaucoma, etc., there is a known testing method of arranging a plurality of test points within an assumed visual field, lighting each of the test points at a designated luminance, and asking the patient as to whether or not he/she can see the light. Such a testing method may be the Humphrey visual field test.
- In such a visual field test method, the processes of changing luminance and obtaining the patient's reactions thereto, must be performed at each of a large number of test points. Therefore, a great burden is imposed not only on the patient, but also on the testing personnel.
- A technology for inferring the change of the visual field of a glaucoma patient is disclosed in Viswanathan AC, Fitzke FW, Hitchings RA. Early Detection of Visual Field Progression in Glaucoma: A Comparison of PROGRESSOR and Statpac2. Br J Ophthalmol 1997; 81(12): 1037-1042.
- US patent application
US 2010/0007851 A1 relates to methods for efficient adaptive measurement and classification of contrast sensitivity functions and spatiotemporal contrast sensitivity surface by selecting the most informative stimulus before each trial. A quick contrast sensitivity function (qCSF) method is described, the method comprising providing a prior probability density p(θ), selecting a grating stimulus, s, that minimises the expected entropy of the Bayesian posterior, displaying s to a subject, receiving a response to s from the subject, updating the prior p(θ) according to the Bayes rule and the response, reiterating the preceding steps and terminating the process according to a stopping criterion. - International patent application
WO 2010/053800 A2 describes methods and systems for the modeling and analysis of visual fields. Methods for global and regional measurement of visual sensitivity and quantification of field loss are provided. Embodiments provide methods and systems for measuring and quantifying the volume of the Hill of Vision for an individual subject. A method for mapping a Hill of Vision for a subject is described, wherein the method comprises importing threshold data from an input source, converting the threshold data to constraints on a spline surface with an algorithm to create a three-dimensional representation of the Hill of Vision, and displaying one or more three-dimensional representations of the Hill of Vision. - US patent
US 6 033 076 A relates to visual field testing via telemedicine. A method and an apparatus are described for the performance and autointerpretation via the Internet, or other telemetric vehicle, of the visual function test parameters obtained during interactive, visual field screening utilising a local display screen. Such interactive testing and instantaneous autointerpretation of visual field performance utilising a local display screen, via telemedicine, are utilised to screen for glaucoma and other neurological disorders affecting the visual system. Telemedicine, such as via the Internet, allows the system to be employed on a world-wide basis, including areas where physicians are not present. - As mentioned above, decreasing the burden in the visual field test has been desired. Specifically, a visual field test assistance apparatus capable of inferring the status of the current visual field at each test point has been desired.
- The present disclosure has been made in view of the above, and one of the objectives of the present disclosure is to provide a visual field test assistance apparatus capable of estimating the status of the current visual field at each test point. The invention is defined in
claim 1 and the dependent claims 2 - 5. - In order to solve the above drawbacks of the prior arts, the present disclosure provides an apparatus which assists a visual field test testing visual sensitivity at each of a plurality of test points arranged within a predetermined previously assumed visual field range, the apparatus comprising, an acquisition device which acquires parameters regarding a predetermined mixture distribution, the parameters being learned with reference to time-series information of visual field test results obtained in the past regarding a plurality of cases using said mixture distribution as a prior-distribution for learning parameters, an inference calculation device which calculates an inference test result vector representing an inference result of visual sensitivity to be obtained by the visual field test at each test point, by Bayesian inference, by applying said mixture distribution using the acquired parameters as a prior-distribution for inference calculation, and an output device which performs an information output process on the basis of the inference test result vector obtained by the inference calculation device, wherein, during the visual field test, when a visual sensitivity is obtained at a test point by the time of an inference process, the inference calculation device performs a process of updating the prior-distribution for inference calculation by acquiring the visual sensitivity at the test point, and executing Bayesian inference regarding a partial inference test result vector representing an inference result of visual sensitivity at a test point at which no test result has been obtained at the time of the process, and the output device performs an information output process on the basis of the partial inference test result vector.
- According to the present disclosure, an inference result of the current visual sensitivity can be obtained.
-
-
FIG. 1 is a block diagram showing a constitutional example of a visual field test assistance apparatus according to the present disclosure. -
FIG. 2 is an explanatory view showing an example of arranging test points used in the process of a visual field test assistance apparatus according to the present disclosure. - An embodiment of the present disclosure will be explained with reference to the drawings. A visual field
test assistance apparatus 1 according to an embodiment of the present disclosure can be realized by a computer, and specifically, comprises a control unit 11, astorage unit 12, anoperation unit 13, adisplay unit 14, and an input/output unit 15, as exemplified inFIG. 1 . - Here, the control unit 11 is a program controlled device such as a CPU, etc., and operates in accordance with a program stored in the
storage unit 12. According to the present embodiment, the control unit 11 executes a current visual field inference process assisting a visual field test testing visual sensitivity at each of a plurality of test points arranged within a previously assumed visual field range, and a future visual field inference process. In the current visual field inference process, a predetermined mixture distribution is employed as the prior-distribution, time-series information of visual field test results regarding a plurality of cases obtained in the past is referred to, and parameters regarding the applied mixture distribution is learned and stored. Then, the control unit 11 uses a mixture distribution using the learned parameters as a prior-distribution, performs Bayesian inference (specifically, inference by Bayesian linear regression) to calculate an inference test result vector expressing the inference results of visual sensitivities at the respective test points, i.e., the results assumed to be obtained through the visual field tests, and executes an information output process on the basis of the inference test result vector obtained through the Bayesian inference. The process will be described in detail later below. - Further, during the visual field test, when the visual sensitivity information obtained at a test point by the time of the inference process is input through the input/
output unit 15, the control unit 11 updates the prior-distribution by the obtained partial visual sensitivity information, and performs inference by Bayesian linear regression to obtain a partial inference test result vector expressing the inference results of visual sensitivities at the test points at which the visual sensitivities have not been obtained at the time of the inference process. Then, the control unit 11 executes the information output process on the basis of the obtained partial inference test result vector. - The control unit 11 also performs a future visual field inference process which includes acquiring time-variable information of visual sensitivities at respective test points, and executing a regression analysis process regarding the acquired time-varied information of visual sensitivities at respective test points. Here, the control unit 11 counts the number of the test points at which the p value for the slope obtained by the regression analysis process is lower than a predetermined analysis threshold value, with respect each of the analysis threshold values, performs a binomial test regarding each of the counted numbers of the test points, and calculates binomial test p values which are the results of the binomial tests. The control unit 11 subjects the calculated binomial test p values to an averaging process, and calculates an averaged binomial test p value, determines presence or absence of a change in the visual sensitivity by referring to whether or not the averaged binomial test p value is lower than a predetermined binominal test threshold value, and outputs a result of the determination. The processes of the control unit 11 will also be described later below.
- The
storage unit 12 is a memory device, a disk device, etc., which holds a program to be executed by the control unit 11. The program may be provided by being stored in a computer-readable non-transitory medium, and copied to thestorage unit 12. Further, thestorage unit 12 stores information, such as a parameter value, which is necessary for the processes by the control unit 11. Thestorage unit 12 also functions as a work memory for the control unit 11. - The
operation unit 13 includes a keyboard, a mouse, and the like. Theoperation unit 13 receives a user's instruction operation, and outputs the content of the instruction operation to the control unit 11. Thedisplay unit 14 is a display, a printer, and the like, which outputs information in accordance with the instruction input from the control unit 11. - The input/
output unit 15 is a serial or parallel interface which performs data input/output. The input/output unit 15 receives information from an external apparatus, and outputs the received information to the control unit 11. Also, in accordance with instructions input from the control unit 11, the input/output unit 15 outputs information to an external apparatus. - Here, the current visual field inference process by the control unit 11 will be explained. In the following explanation, the current visual field inference result is modelled as a probability variable (random variable) which is shown in Formula (1) below, using the matrix Tm (m representing an identifier identifying an eye to be tested, and satisfying m=1, 2, ..., M), the matrix Tm representing the result of the visual field test, and being a matrix of the number of test points Dt by the number of tests Nm.
[Numerical Formula 1]

- In Formula (1), wm is a vector with an intercept and a slope expressing the visual field progression, L represents a precision matrix (inverse matrix of a variance-covariance matrix), and λ represents a scalar value determining a degree of precision. The symbol of the encircled x represents a Kronecker product.

- Further, the vector wm with an intercept and a slope expressing the visual field progression is described by a mixture normal distribution represented by Formulae (2) and (3).
[Numerical Formula 3]

- The precision matrix L is also described using a predetermined mixture distribution. For example, the precision matrix L can be described by a mixture of Wishart distributions as represented by Formulae (4) and (5).
[Numerical Formula 4]

- The scalar value λ representing a degree of precision can be described by, for example, a mixture gamma distribution, as represented by Formulae (6) and (7).
[Numerical Formula 5]

- In the above explanation,

- Such mixture distributions are applied, taking into account the experimental knowledge that visual field loss does not always occur at one location, but may occur at a plurality of locations.
- Based on the above, likelihood including latent variables, i.e.,


- Prior to the current visual field test result inference process, the control unit 11 uses a formula obtained by assigning Formulae (1) to (6) to Formula (*), to infer the following parameters (hyperparameters).
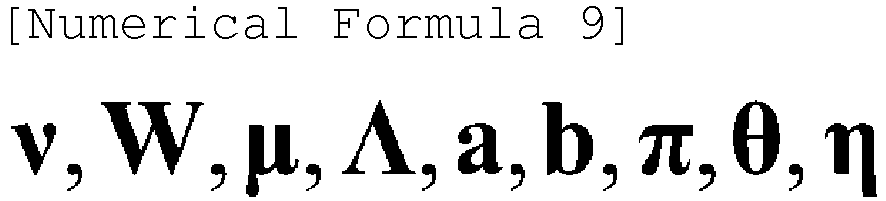
- When using the EM Algorithm, calculating


- The optimal posterior distribution in the mean field approximation is represented by applying an asterisk (*) as upper index of each symbol. Nm represents the number of tests regarding the eye m, and Dw represents the dimension of the vector µm.
- Thus, each optimal posterior distribution is represented as below.


- Here, the following equations are satisfied.

- Further, in the M-step (maximization step), hyperparameter re-estimating equations with respect to


- With respect to vh, the solution of the following equation is determined as new vh.

- The new vh is described as

- With respect to a, the solution of the following equation is determined as new a.

- The new a is described as

- In the above equation, ψ(·) represents a digamma function.
- As an example, the control unit 11 alternately executes the above E-step and the M-step, and calculates the optimal hyperparameters. The lower bound of the likelihood P(T) can be calculated as below.


- The control unit 11 stores the optimal hyperparameter values calculated from above, in the
storage unit 12. - In response to the instruction, from the
operation unit 13, to infer the result of the current visual field test, the control unit 11 executes the following inference process. The inference process is different between (1) the inference process for a patient who has undergone the visual field test for N times before, and (2) the inference process for a patient who undergoes the visual field test for the first time. Therefore, these cases are described separately. The control unit 11 receives instructions indicating the case (1) or the case (2), and executes ether of the following processes. - In case of a patient who has undergone the visual field test for N times before, the control unit 11 executes Bayesian inference calculation, provided that the inference test result vector tN+1 indicates an inference result of visual sensitivity at each test point in the current visual field test, that each of the test result vectors t1, t2, ..., tN indicates each of the past N-time actual measurement results of the visual sensitivity at the each test point, and that the full likelihood of the inference test result vector tN+1 is represented as below.

- Specifically, the posterior distribution after tn (n=1, 2, ..., N) is obtained, is inferred as below, using the mean field approximation

- Specifically, the optimal variational posterior distributions are as shown in Formula (8) to Formula (14) below.
[Numerical Formula 41]


- With this respect, the following are satisfied.

- Further, parameters which have been previously calculated and stored in the
storage unit 12 are used for
- The inference result of tN+1 that the control unit 11 should obtain, is obtained by Formula (15).
[Numerical Formula 55]
- According to the multivariate normal distribution represented by Formula (15), the control unit 11 obtains the inference test result vector tN+1 which indicates an inference result of visual sensitivity at each test point in the current visual field test. Then, the control unit 11 executes an information output process on the basis of the obtained inference result
vector tN+ 1. The information output process will be described below. - In the above calculation, the lower bound of the likelihood P(T) is represented as follows.

- The sum of the 1st and 9th terms is represented as follows.

- Other terms of the expectation values can be represented as follows.


- Further, the control unit 11 updates the content of the information output during the actual visual field test. Namely, when the visual field test is performed and a part of the actual test results (visual sensitivity information of a part of the test points) is input through the input/
output unit 15, the control unit 11 updates the prior-distribution with reference to the visual sensitivity information of the test points which has already been obtained by the time of the inference process. Specifically, the control unit 11 divides the test result vector tN+1 into the visual sensitivity information (vector) ta indicating the visual sensitivity information of the test points which has not been obtained by time of the process, and the visual sensitivity information (vector) tb indicating the visual sensitivity information of the test points which has already been obtained by the time of the process. For convenience, the divided elements are represented as

- Then, the control unit 11 calculates the inference result ta of the unmeasured test points as a partial inference test result vector, using the following equation.

- Thereby, provided that each of a plurality of unmeasured test points is a selected test point, the inference test result information at the selected test point can be obtained.
- The control unit 11 executes an information output process, on the basis of the thus obtained inference result ta(P(ta|tb)). The information output process will be explained later below.
- In case of a patient who undergoes the visual field test for the first time, no past information is present. Therefore, upon receiving instructions to perform inference regarding a patient who undergoes the visual field test for the first time, the control unit 11 infers the posterior distribution which should be the inference result of the visual sensitivity information at each test point, by performing approximate inference using a mixture normal distribution.
- Specifically, similar to the case of a patient which has already undergone the visual field test for N times, the full likelihood at the time point 0 is set as the following equation.

- This equation is approximated as

- The control unit 11 obtains a mixture normal distribution to minimize Kullback-Leibler divergence represented by the formula below.

- In the mixture normal distribution,


- The control unit 11 uses a predetermined mixture normal distribution function, and appropriately (for example, randomly) sets initial values for the parameters of the function. The control unit 11 repeats the process of calculating the Kullback-Leibler divergence of the mixture normal distribution function, updating the parameters to minimize the Kullback-Leibler divergence, and calculating the Kullback-Leibler divergence again, until the Kullback-Leibler divergence converges. The specific embodiment for this calculation can be a widely known method.
- With respect to "t0" which has become the optimal distribution by the above process, the control unit 11 obtains

- Further, the control unit 11 marginalizes the above regarding w and z, to obtain "t0". Specifically, the control unit 11 calculates the following equation to obtain "t0".

- For these calculations, the control unit 11 uses parameter values stored in the
storage unit 12. Further, the Kullback-Leibler divergence at this time can be represented as follows.
- Here, the 3rd term and 10th term cancel to each other. The sum of the 1st term and the 8th term is represented as

- The sum of the 2nd term and the 9th term is represented as

- The expectation values for the 4th term to the 7th term, the 11th term, and the 12th term can be represented as below, respectively.

- The control unit 11 executes an information output process on the basis of the thus obtained t0. The information output process will be described later below.
- Further, the control unit 11 updates the content of the information output during the actual visual field test for a patient who undergoes the visual field test for the first time. Namely, when the visual field test is performed and a part of the actual test results (visual sensitivity information of a part of the test points) is input through the input/
output unit 15, the control unit 11 updates the prior-distribution with reference to the visual sensitivity information of the test points which has already been obtained by the time of inference process. Specifically, the control unit 11 divides the test result vector t into the visual sensitivity information (vector) ta indicating the visual sensitivity information of the test points which has not been obtained by time of the process, and visual sensitivity information (vector) tb indicating the visual sensitivity information of the test points which has already been obtained by the time of the process. For convenience, the divided elements are represented as

- Then, the control unit 11 calculates the inference result ta of a part of the test points as a partial inference test result vector, using the following equation.


- Thereby, provided that each of a plurality of unmeasured test points is a selected test point, the inference test result information at the selected test point can be obtained.
- The control unit 11 executes an information output process, on the basis of the thus obtained inference result ta(P(ta|tb)). The information output process will be explained below.
- The control unit 11 executes an information output process, after obtaining an inference test result vector or a partial inference test result vector, including the inference results of the visual sensitivity at unmeasured test points, as described above. In the information output process, for example, the control unit 11 may display a list including information for specifying respective test points as well as the visual sensitivity inference results of at least a part of the relevant test points (unmeasured test points) included in the inference test result vector or the partial inference test result vector, as they are.
- Thereby, a testing personnel can obtain information regarding the luminance which is inferred to be visible for a patient at a predetermined probability, and can select a luminance to be initially presented to the patient at each test point, with reference to the luminance indicated by the information as probably visible. Accordingly, the number of trials to present a luminance which is definitely visible for the patient, can be decreased, resulting in decreasing the number of repetitions at each test point, and reducing the burden of the test for both the testing personnel and the patient.
- Further, selecting a test result at a selected test point, the selected test point being one of the unmeasured test points, from the test results included in the inference test result vector or the partial inference test result vector, the control unit 11 may execute the following process. Namely, the control unit 11 calculates a difference between the inference result at the selected test point and the inference result or the measurement result (actual test result) of the visual sensitivity at a test point neighboring to the selected test point, and when the calculated difference exceeds a predetermined threshold value for spatial change, the control unit 11 outputs information for specifying a neighbor space of the selected test point.
- As shown in
FIG. 2 , for example, provided that there are an unmeasured test point Pi,j, and test points Pi-1,j, Pi,j-1, Pi+1,j, Pi,j+1 (usually referred to as 4-neighbor test points) which have been previously set adjacent to the test point Pi, j, and that inferred visual sensitivity values for these test points are V[Pi,j], V[Pi-1,j], V[Pi,j-1], V[Pi+1,j], V[Pi,j+1], respectively, the control unit 11 calculates the difference between the value at the test point Pi,j and each of the values at the 4-neighbor test points, the differences being Δi-1,j=|V[Pi-1,j]-Pi,j|, Δi,j-1=|V[Pi,j-1]-Pi,j|, Δi+1,j=|V[Pi+1,j]-Pi,j|, Δi,j+1=|V[Pi,j+1]-Pi,j| (wherein, |*| refers to an absolute value of *). - When any of the calculated differences exceeds a predetermined threshold value (referred to as spatial change threshold value), the control unit 11 outputs information which specifies a neighbor space of the selected test point Pi,j, to the
display unit 14. At this time, the control unit 11 may also display, on thedisplay unit 14, a suggestion to arrange more test points within the specified space. Here, specifically, the neighbor space of the selected test point Pi,j may be the position of the selected test point Pi,j itself. The neighbor space of the selected test point Pi,j may also be a range of space within a predetermined distance r from the selected test point Pi,j, and the like. - Referring to the display, the testing personnel may arrange more test points within the displayed range or around the displayed position, in accordance with need, and perform the measurement at these test points. Thereby, more accurate testing becomes possible.
- The visual field
test assistance apparatus 1 according to the present embodiment may infer the result of a future visual field test, and output the inference result thereof, as described below. In this case, with respect to a designated patient, the control unit 11 receives the results of the tests undergone by the patient in the past. The received test results include the visual sensitivity information of a plurality of time points in the past, regarding each test point. - With respect to each test point, the control unit 11 executes a regression analysis process regarding the change in the visual sensitivity over time indicated by the information acquired as above, to thereby obtain values for an intercept and a slope as well as p values therefor, regarding the change. The control unit 11 counts the number of test points where the p value for the slope is lower than a predetermined analysis threshold value (where the change of test result over time progresses) . Also, the control unit 11 executes a one-sided binomial test regarding the counted number of test points, to calculate a result of the binomial test, i.e., a binomial test p value (a probability that the number of test points is not significant) . With respect to the number of test points where the progression occurs, the prior ratio of such test points should be obtained in advance.
- The control unit 11 sets the analysis threshold value to a plurality of values which are different from each other, and repeats the above process regarding the plurality of analysis threshold values . Here, the analysis threshold values are set to, for example, four values, i.e., 0.025, 0.5, 0.075, and 0.1. The control unit 11 calculates an averaged binomial test p value, by averaging the binomial test p values obtained corresponding to the respective analysis threshold values (specifically, the median of the binomial test p values may be used) . When the averaged binomial test p value is lower than a predetermined test threshold value, the control unit 11 determines that the visual sensitivity change over time is significant (the change in the test result (visual sensitivity) progresses over time). Then, the control unit 11 outputs the determination result regarding the presence/absence of the change in the visual sensitivity over time, to the
display unit 14. - When the control unit 11 determines the visual sensitivity change over time is present, the control unit 11 displays a position, within the visual field space, of a test point having a p value (p value relating to the slope of the regression analysis result) lower than a predetermined analysis threshold value. Thereby, the location of the test point inferred as having a visual sensitivity change over time is provided. Then, on the basis of the regression analysis result with respect to each test point determined as having a visual sensitivity change over time, the control unit 11 obtains an inference result of the visual field at a designated time point in the future, and outputs the obtained inference result. This process is performed by assigning the regression analysis result and time until the designated time point to a regression formula, with respect to each test point determined as having a visual sensitivity change over time, and obtaining and displaying the visual sensitivity information at each test point.
- Accordingly, a portion where progression in visual sensitivity occurs, and a future visual sensitivity at the relevant portion, can be provided. Thus, the testing personnel and the patient can obtain an inference result regarding a visual field test result to be obtained in the future. In this case, for example, a medical staff can specifically point out the future situation while taking the living conditions of the patient into account, resulting in contributing the decision on treatment, etc.
- The visual field
test assistance apparatus 1 according to the present embodiment has a structure as above, and operates as follows. Namely, the visual fieldtest assistance apparatus 1 performs Bayesian inference using a predetermined mixture distribution for the prior-distribution, and infers a result of a current or future visual field test as a posterior distribution. At this time, parameters relating to the mixture distribution have been obtained in advance, through a learning process using known information, i.e., measurement results of a plurality of occasions (time-series information measured with time intervals), regarding a plurality of patients measured in the past. - At the time of the test, in case of a patient who underwent the test in the past, the visual field
test assistance apparatus 1 performs Bayesian inference using information of the patient's past test result and the mixture distribution using the previously obtained parameters, and infers a visual field test result of the current test (information of luminance which is inferred to be visible for a patient at a predetermined probability at each test point) . Then, the visual fieldtest assistance apparatus 1 provides the inference result to the testing personnel. The testing personnel refers to the luminance information, and determines a luminance to be initially presented to the patient regarding each unmeasured test point. - During the test, the testing personnel inputs luminance information obtained at each test point through the test, to the visual field test assistance apparatus 1 (or the device used for the test may be set to input the relevant information, without requiring any human-made operations). When the visual field
test assistance apparatus 1 receives the luminance information obtained during the test at a test point, the visual fieldtest assistance apparatus 1 updates the prior-distribution using the received information, and infers a visual field test result at an unmeasured test point by Bayesian inference. Then, the visual fieldtest assistance apparatus 1 provides a newly inferred result to the testing personnel. The testing personnel refers to the newly inferred result and determines a luminance which should be initially presented to the patient at the unmeasured test point. - In case of a patient who undergoes the test for the first time, a similar processes are performed by executing inference using a predetermined mixture normal distribution. Thereby, unlike the case where test results are obtained through trials and errors, the testing personnel can set initial conditions on the basis of a test result having a predetermined probability, and thus, test results can be obtained in a comparatively short time.
- In the above explanation, the visual field
test assistance apparatus 1 calculates a difference between an inference result of visual sensitivity at a test point (selected test point) and an inference result or a measurement result (actual test result) of visual sensitivity at a neighbour test point, and when the calculated difference exceeds a predetermined spatial change threshold value, the visual fieldtest assistance apparatus 1 outputs information specifying a neighbour space of the selected test point. With this respect, the spatial change threshold value does not have to be the same value over the entirety of the visual field space. - For example, it is well known that the test result values of the test points arranged in the upper half of the visual field space are little related to the test result values of the test points arranged in the lower half of the visual field space. With respect to a pair of test points respectively arranged on the upper half and the lower half of the visual field space, the space change threshold value to be used for the comparison with the difference Δ between the pair of test points may be set greater, compared to the space change threshold value to be used for the comparison for the test points located in other part.
- Further, in the visual field
test assistance apparatus 1 explained above, one set of parameters is used for the Bayesian inference. However, parameters may be divided into a plurality of groups on the basis of race, sex, residence, etc., and parameters may be obtained for respective groups through learning using test results of patients belonging to respective groups. - In this case, the visual field
test assistance apparatus 1 infers the test result regarding a patient to be inferred, by selecting parameters obtained through learning on the basis of patient information belonging to a group, the same as the group to which the relevant patient to be inferred belongs.
Claims (5)
- An apparatus which assists a visual field test testing visual sensitivity at each of a plurality of test points arranged within a predetermined previously assumed visual field range,
the apparatus comprising,
an acquisition device which acquires hyperparameters regarding a predetermined mixture distribution, the predetermined mixture distribution being defined by using a mixture distribution describing visual field progression, the hyperparameters being learned with reference to time-series information of visual field test results obtained in the past for a plurality of cases using said predetermined mixture distribution as a prior-distribution for learning hyperparameters,
an inference calculation device which calculates an inference test result vector representing an inference result of visual sensitivity to be obtained by the visual field test at each test point, by Bayesian inference, by applying said mixture distribution using the acquired hyperparameters as a prior-distribution for inference calculation, and
an output device which performs an information output process on the basis of the inference test result vector obtained by the inference calculation device,
wherein, during the visual field test, when a visual sensitivity is obtained at a test point by the time of an inference process, the inference calculation device performs a process of updating the prior-distribution for inference calculation by acquiring the visual sensitivity at the test point, and executing Bayesian inference regarding a partial inference test result vector representing an inference result of visual sensitivity at a test point at which no test result has been obtained at the time of the process, and
the output device performs an information output process on the basis of the partial inference test result vector. - A visual field test assistance apparatus according to claim 1, wherein,
as an information output process on the basis of the inference test result vector inferred by the inference calculation device, or an information output process on the basis of the partial inference test result vector representing the inference result of the visual sensitivity at the test point where no test result has been obtained at the time of the process,
provided that an unmeasured test point is selected as a selected test point,
the output device calculates information of a luminance inferred to be visible for a patient at a predetermined probability at the selected test point, on the basis of the test results included in the inference test result vector or the partial inference test result vector, and outputs information for specifying the selected test point and inference information regarding the specified selected test point. - A visual field test assistance apparatus according to claim 1, wherein,
as an information output process on the basis of the inference test result vector inferred by the inference calculation device, or an information output process on the basis of the partial inference test result vector representing the inference result of the visual sensitivity at the test point where no test result has been obtained at the time of the process,
provided that an unmeasured test point is selected as a selected test point,
the output device calculates a difference between an inference result of visual sensitivity at the selected test point and an inference result or a measurement result of visual sensitivity at a test point neighboring to the selected test point, on the basis of the test results included in the inference test result vector or the partial inference test result vector, and outputs information for specifying a neighboring space of the selected test point to a display unit when the calculated difference exceeds a predetermined spatial change threshold value. - A visual field test assistance apparatus according to claim 1 comprising,
a device which acquires visual sensitivity change information over time at each test point,
a device which performs a regression analysis process regarding the acquired visual sensitivity change over time at each test point,
a device which counts the number of test points at which a p value for a slope obtained by the regression analysis process is lower than a predetermined analysis threshold value,
a device which sets a plurality of mutually different values as analysis threshold values for the execution of the regression analysis process and the counting process, executes a binomial test regarding the number of test points relative to the respective analysis threshold values, and calculates binomial test p values as results of the binomial tests corresponding to the respective analysis threshold values,
a device which executes an averaging process regarding the calculated binomial test p values corresponding to the respective analysis threshold values to calculate an averaged binomial test p value, and determines presence/absence of a visual sensitivity change on the basis of whether or not the averaged binomial test p value is lower than a predetermined test threshold value, wherein, when the averaged binomial test p value is lower than a predetermined test threshold value, the device determines that the visual sensitivity change over time is significant, and
a device which outputs the determination result. - A visual field test assistance apparatus according to claim 4, further comprising,
a device which obtains a visual field inference result at a designated time point in the future on the basis of a spatial arrangement of test points determined to have a visual sensitivity change, and a slope obtained by the regression analysis process, and
which outputs the visual field inference result obtained.
Applications Claiming Priority (2)
| Application Number | Priority Date | Filing Date | Title |
|---|---|---|---|
| JP2013039796A JP6053574B2 (en) | 2013-02-28 | 2013-02-28 | Visual field inspection support device |
| PCT/JP2013/073426 WO2014132470A1 (en) | 2013-02-28 | 2013-08-30 | Visual-field-test assistance device |
Publications (3)
| Publication Number | Publication Date |
|---|---|
| EP2984983A1 EP2984983A1 (en) | 2016-02-17 |
| EP2984983A4 EP2984983A4 (en) | 2016-11-02 |
| EP2984983B1 true EP2984983B1 (en) | 2020-09-30 |
Family
ID=51427764
Family Applications (1)
| Application Number | Title | Priority Date | Filing Date |
|---|---|---|---|
| EP13876498.0A Active EP2984983B1 (en) | 2013-02-28 | 2013-08-30 | Visual-field-test assistance device |
Country Status (5)
| Country | Link |
|---|---|
| US (1) | US11291360B2 (en) |
| EP (1) | EP2984983B1 (en) |
| JP (1) | JP6053574B2 (en) |
| CN (1) | CN105188515B (en) |
| WO (1) | WO2014132470A1 (en) |
Cited By (1)
| Publication number | Priority date | Publication date | Assignee | Title |
|---|---|---|---|---|
| US20200178789A1 (en) * | 2016-08-15 | 2020-06-11 | Ucl Business Plc | Method and apparatus for performing a visual field test |
Families Citing this family (8)
| Publication number | Priority date | Publication date | Assignee | Title |
|---|---|---|---|---|
| JP6532299B2 (en) | 2015-05-28 | 2019-06-19 | 国立大学法人 東京大学 | Vision inspection system |
| US11696928B2 (en) | 2017-11-03 | 2023-07-11 | Universite De Montreal | Compounds and use thereof in the expansion of stem cells and/or progenitor cells |
| WO2019169166A1 (en) * | 2018-03-01 | 2019-09-06 | The Schepens Eye Research Institute, Inc. | Visual field progression |
| JP7082889B2 (en) | 2018-03-19 | 2022-06-09 | 株式会社クリュートメディカルシステムズ | Visual field inspection device, its control method and visual field inspection program |
| CN209404742U (en) * | 2018-04-03 | 2019-09-20 | 林臣 | A kind of visual field meter |
| JP7459623B2 (en) * | 2020-03-31 | 2024-04-02 | 株式会社ニコン | Visual field testing method, visual field testing device, and program |
| JP7562992B2 (en) * | 2020-06-01 | 2024-10-08 | 株式会社ニコン | Visual field testing method, visual field testing device, and visual field testing program |
| JP7632630B2 (en) * | 2021-06-16 | 2025-02-19 | 株式会社ニコン | Visual field testing method, visual field testing device, and visual field testing program |
Family Cites Families (12)
| Publication number | Priority date | Publication date | Assignee | Title |
|---|---|---|---|---|
| US4818091A (en) * | 1985-12-31 | 1989-04-04 | University Of Southern California | System and method of detecting visual field defects |
| US6033076A (en) * | 1996-07-31 | 2000-03-07 | Virtual-Eye.Com, Inc. | Visual field testing via telemedicine |
| JP4171995B2 (en) * | 1997-10-16 | 2008-10-29 | 潤 福原 | Flicker sensitivity distribution measuring device and computer-readable recording medium recording flicker sensitivity distribution measuring program |
| WO2009010291A1 (en) | 2007-07-17 | 2009-01-22 | Heidelberg Engineering Gmbh | Method and device for assessing the field of vision |
| US7938538B2 (en) | 2008-05-09 | 2011-05-10 | University Of Southern California | Methods and devices for rapid measurement of visual sensitivity |
| JP4187227B1 (en) * | 2008-07-28 | 2008-11-26 | 知博 蔦 | Static visual field scanning device |
| WO2010053800A2 (en) * | 2008-10-28 | 2010-05-14 | Oregon Health & Science University | Method and apparatus for visual field monitoring |
| JP4888579B2 (en) | 2010-04-21 | 2012-02-29 | パナソニック電工株式会社 | Visual function inspection device |
| CN101966075A (en) * | 2010-11-16 | 2011-02-09 | 天津滨海华医光电技术有限公司 | Portable glaucoma rapid-screening analyzer |
| CN102499623B (en) * | 2011-09-28 | 2013-08-21 | 北京工业大学 | Self-correction area array source visual field measuring instrument |
| WO2013170091A1 (en) * | 2012-05-09 | 2013-11-14 | The Schepens Eye Research Institute, Inc. | Rapid measurement of visual sensitivity |
| CN102793530A (en) * | 2012-08-31 | 2012-11-28 | 天津滨海华医光电技术有限公司 | Portable static multipoint synchronous threshold value screening and single point threshold value detection perimeter |
-
2013
- 2013-02-28 JP JP2013039796A patent/JP6053574B2/en active Active
- 2013-08-30 WO PCT/JP2013/073426 patent/WO2014132470A1/en not_active Ceased
- 2013-08-30 CN CN201380074073.9A patent/CN105188515B/en active Active
- 2013-08-30 US US14/771,150 patent/US11291360B2/en active Active
- 2013-08-30 EP EP13876498.0A patent/EP2984983B1/en active Active
Non-Patent Citations (1)
| Title |
|---|
| None * |
Cited By (2)
| Publication number | Priority date | Publication date | Assignee | Title |
|---|---|---|---|---|
| US20200178789A1 (en) * | 2016-08-15 | 2020-06-11 | Ucl Business Plc | Method and apparatus for performing a visual field test |
| US11723530B2 (en) * | 2016-08-15 | 2023-08-15 | Ucl Business Ltd | Method and apparatus for performing a visual field test |
Also Published As
| Publication number | Publication date |
|---|---|
| CN105188515A (en) | 2015-12-23 |
| WO2014132470A1 (en) | 2014-09-04 |
| US20160015263A1 (en) | 2016-01-21 |
| EP2984983A1 (en) | 2016-02-17 |
| JP6053574B2 (en) | 2016-12-27 |
| US11291360B2 (en) | 2022-04-05 |
| EP2984983A4 (en) | 2016-11-02 |
| CN105188515B (en) | 2017-04-05 |
| JP2014166250A (en) | 2014-09-11 |
Similar Documents
| Publication | Publication Date | Title |
|---|---|---|
| US11291360B2 (en) | Visual field test assistance apparatus | |
| EP3704666B1 (en) | Deep-learning based processing of motion artifacts in magnetic resonance imaging data | |
| Fific et al. | Information-processing architectures in multidimensional classification: a validation test of the systems factorial technology. | |
| Miller et al. | Overlooked tertiary sulci serve as a meso-scale link between microstructural and functional properties of human lateral prefrontal cortex | |
| Vaidya et al. | Testing necessary regional frontal contributions to value assessment and fixation-based updating | |
| Dimitriadis et al. | Altered temporal correlations in resting-state connectivity fluctuations in children with reading difficulties detected via MEG | |
| JP5847735B2 (en) | Visual function inspection method, visual function inspection system, and software | |
| Qin et al. | Electroencephalogram-based mental workload prediction for using Augmented Reality head mounted display in construction assembly: A deep learning approach | |
| Chen et al. | Automatic and continuous user task analysis via eye activity | |
| Liu et al. | Learning brain effective connectivity network structure using ant colony optimization combining with voxel activation information | |
| Zhang et al. | A perceptually relevant channelized joint observer (PCJO) for the detection-localization of parametric signals | |
| Ibáñez-Gijón et al. | Experimental validation of COMETA model of mental workload in air traffic control | |
| JP2020170252A (en) | Image processing device, image processing method, and program | |
| Berchuck et al. | Diagnosing glaucoma progression with visual field data using a spatiotemporal boundary detection method | |
| WO2014009758A1 (en) | Device to determine visuo-spatial ability | |
| Piekar et al. | Application of region growing method to brain tumor segmentation-preliminary results | |
| EP3496590B1 (en) | Method and apparatus for performing a visual field test | |
| Berthon et al. | Multi-dimensional measurement of mental workload in industrial context: an experiment in the field of helicopter maintenance | |
| CA2869695C (en) | Method and system for improving the visual exploration of an image during a target search | |
| Tremel et al. | Neural signatures of experience-based improvements in deterministic decision-making | |
| Ju et al. | Risk awareness assessment of construction workers wearing AR head-mounted displays using EEG signals | |
| Huygelier et al. | Post-stroke cognitive impairment: More than a lesion-symptom model | |
| Emoto et al. | Effect‐Size Estimation Using Semiparametric Hierarchical Mixture Models in Disease‐Association Studies with Neuroimaging Data | |
| Ren et al. | Automatic and fast encoding of representational uncertainty underlies probability distortion | |
| Berchuck et al. | Spatial Statistics |
Legal Events
| Date | Code | Title | Description |
|---|---|---|---|
| PUAI | Public reference made under article 153(3) epc to a published international application that has entered the european phase |
Free format text: ORIGINAL CODE: 0009012 |
|
| PUAB | Information related to the publication of an a document modified or deleted |
Free format text: ORIGINAL CODE: 0009199EPPU |
|
| PUAI | Public reference made under article 153(3) epc to a published international application that has entered the european phase |
Free format text: ORIGINAL CODE: 0009012 |
|
| 17P | Request for examination filed |
Effective date: 20150910 |
|
| AK | Designated contracting states |
Kind code of ref document: A1 Designated state(s): AL AT BE BG CH CY CZ DE DK EE ES FI FR GB GR HR HU IE IS IT LI LT LU LV MC MK MT NL NO PL PT RO RS SE SI SK SM TR |
|
| AX | Request for extension of the european patent |
Extension state: BA ME |
|
| A4 | Supplementary search report drawn up and despatched |
Effective date: 20160930 |
|
| RIC1 | Information provided on ipc code assigned before grant |
Ipc: A61B 3/00 20060101ALI20160926BHEP Ipc: G06F 19/00 20110101ALI20160926BHEP Ipc: A61B 3/024 20060101AFI20160926BHEP Ipc: A61B 3/06 20060101ALI20160926BHEP |
|
| STAA | Information on the status of an ep patent application or granted ep patent |
Free format text: STATUS: EXAMINATION IS IN PROGRESS |
|
| 17Q | First examination report despatched |
Effective date: 20170922 |
|
| GRAP | Despatch of communication of intention to grant a patent |
Free format text: ORIGINAL CODE: EPIDOSNIGR1 |
|
| STAA | Information on the status of an ep patent application or granted ep patent |
Free format text: STATUS: GRANT OF PATENT IS INTENDED |
|
| RIC1 | Information provided on ipc code assigned before grant |
Ipc: A61B 3/024 20060101AFI20200102BHEP |
|
| INTG | Intention to grant announced |
Effective date: 20200205 |
|
| GRAJ | Information related to disapproval of communication of intention to grant by the applicant or resumption of examination proceedings by the epo deleted |
Free format text: ORIGINAL CODE: EPIDOSDIGR1 |
|
| GRAP | Despatch of communication of intention to grant a patent |
Free format text: ORIGINAL CODE: EPIDOSNIGR1 |
|
| INTG | Intention to grant announced |
Effective date: 20200327 |
|
| GRAS | Grant fee paid |
Free format text: ORIGINAL CODE: EPIDOSNIGR3 |
|
| GRAA | (expected) grant |
Free format text: ORIGINAL CODE: 0009210 |
|
| STAA | Information on the status of an ep patent application or granted ep patent |
Free format text: STATUS: THE PATENT HAS BEEN GRANTED |
|
| AK | Designated contracting states |
Kind code of ref document: B1 Designated state(s): AL AT BE BG CH CY CZ DE DK EE ES FI FR GB GR HR HU IE IS IT LI LT LU LV MC MK MT NL NO PL PT RO RS SE SI SK SM TR |
|
| AX | Request for extension of the european patent |
Extension state: BA ME |
|
| REG | Reference to a national code |
Ref country code: CH Ref legal event code: EP Ref country code: GB Ref legal event code: FG4D |
|
| REG | Reference to a national code |
Ref country code: DE Ref legal event code: R096 Ref document number: 602013073003 Country of ref document: DE Ref country code: AT Ref legal event code: REF Ref document number: 1317906 Country of ref document: AT Kind code of ref document: T Effective date: 20201015 |
|
| REG | Reference to a national code |
Ref country code: IE Ref legal event code: FG4D |
|
| PG25 | Lapsed in a contracting state [announced via postgrant information from national office to epo] |
Ref country code: FI Free format text: LAPSE BECAUSE OF FAILURE TO SUBMIT A TRANSLATION OF THE DESCRIPTION OR TO PAY THE FEE WITHIN THE PRESCRIBED TIME-LIMIT Effective date: 20200930 Ref country code: HR Free format text: LAPSE BECAUSE OF FAILURE TO SUBMIT A TRANSLATION OF THE DESCRIPTION OR TO PAY THE FEE WITHIN THE PRESCRIBED TIME-LIMIT Effective date: 20200930 Ref country code: SE Free format text: LAPSE BECAUSE OF FAILURE TO SUBMIT A TRANSLATION OF THE DESCRIPTION OR TO PAY THE FEE WITHIN THE PRESCRIBED TIME-LIMIT Effective date: 20200930 Ref country code: NO Free format text: LAPSE BECAUSE OF FAILURE TO SUBMIT A TRANSLATION OF THE DESCRIPTION OR TO PAY THE FEE WITHIN THE PRESCRIBED TIME-LIMIT Effective date: 20201230 Ref country code: GR Free format text: LAPSE BECAUSE OF FAILURE TO SUBMIT A TRANSLATION OF THE DESCRIPTION OR TO PAY THE FEE WITHIN THE PRESCRIBED TIME-LIMIT Effective date: 20201231 Ref country code: BG Free format text: LAPSE BECAUSE OF FAILURE TO SUBMIT A TRANSLATION OF THE DESCRIPTION OR TO PAY THE FEE WITHIN THE PRESCRIBED TIME-LIMIT Effective date: 20201230 |
|
| REG | Reference to a national code |
Ref country code: AT Ref legal event code: MK05 Ref document number: 1317906 Country of ref document: AT Kind code of ref document: T Effective date: 20200930 |
|
| PG25 | Lapsed in a contracting state [announced via postgrant information from national office to epo] |
Ref country code: LV Free format text: LAPSE BECAUSE OF FAILURE TO SUBMIT A TRANSLATION OF THE DESCRIPTION OR TO PAY THE FEE WITHIN THE PRESCRIBED TIME-LIMIT Effective date: 20200930 Ref country code: RS Free format text: LAPSE BECAUSE OF FAILURE TO SUBMIT A TRANSLATION OF THE DESCRIPTION OR TO PAY THE FEE WITHIN THE PRESCRIBED TIME-LIMIT Effective date: 20200930 |
|
| REG | Reference to a national code |
Ref country code: NL Ref legal event code: MP Effective date: 20200930 |
|
| REG | Reference to a national code |
Ref country code: LT Ref legal event code: MG4D |
|
| PG25 | Lapsed in a contracting state [announced via postgrant information from national office to epo] |
Ref country code: EE Free format text: LAPSE BECAUSE OF FAILURE TO SUBMIT A TRANSLATION OF THE DESCRIPTION OR TO PAY THE FEE WITHIN THE PRESCRIBED TIME-LIMIT Effective date: 20200930 Ref country code: CZ Free format text: LAPSE BECAUSE OF FAILURE TO SUBMIT A TRANSLATION OF THE DESCRIPTION OR TO PAY THE FEE WITHIN THE PRESCRIBED TIME-LIMIT Effective date: 20200930 Ref country code: LT Free format text: LAPSE BECAUSE OF FAILURE TO SUBMIT A TRANSLATION OF THE DESCRIPTION OR TO PAY THE FEE WITHIN THE PRESCRIBED TIME-LIMIT Effective date: 20200930 Ref country code: NL Free format text: LAPSE BECAUSE OF FAILURE TO SUBMIT A TRANSLATION OF THE DESCRIPTION OR TO PAY THE FEE WITHIN THE PRESCRIBED TIME-LIMIT Effective date: 20200930 Ref country code: PT Free format text: LAPSE BECAUSE OF FAILURE TO SUBMIT A TRANSLATION OF THE DESCRIPTION OR TO PAY THE FEE WITHIN THE PRESCRIBED TIME-LIMIT Effective date: 20210201 Ref country code: RO Free format text: LAPSE BECAUSE OF FAILURE TO SUBMIT A TRANSLATION OF THE DESCRIPTION OR TO PAY THE FEE WITHIN THE PRESCRIBED TIME-LIMIT Effective date: 20200930 Ref country code: SM Free format text: LAPSE BECAUSE OF FAILURE TO SUBMIT A TRANSLATION OF THE DESCRIPTION OR TO PAY THE FEE WITHIN THE PRESCRIBED TIME-LIMIT Effective date: 20200930 |
|
| PG25 | Lapsed in a contracting state [announced via postgrant information from national office to epo] |
Ref country code: ES Free format text: LAPSE BECAUSE OF FAILURE TO SUBMIT A TRANSLATION OF THE DESCRIPTION OR TO PAY THE FEE WITHIN THE PRESCRIBED TIME-LIMIT Effective date: 20200930 Ref country code: AT Free format text: LAPSE BECAUSE OF FAILURE TO SUBMIT A TRANSLATION OF THE DESCRIPTION OR TO PAY THE FEE WITHIN THE PRESCRIBED TIME-LIMIT Effective date: 20200930 Ref country code: AL Free format text: LAPSE BECAUSE OF FAILURE TO SUBMIT A TRANSLATION OF THE DESCRIPTION OR TO PAY THE FEE WITHIN THE PRESCRIBED TIME-LIMIT Effective date: 20200930 Ref country code: PL Free format text: LAPSE BECAUSE OF FAILURE TO SUBMIT A TRANSLATION OF THE DESCRIPTION OR TO PAY THE FEE WITHIN THE PRESCRIBED TIME-LIMIT Effective date: 20200930 Ref country code: IS Free format text: LAPSE BECAUSE OF FAILURE TO SUBMIT A TRANSLATION OF THE DESCRIPTION OR TO PAY THE FEE WITHIN THE PRESCRIBED TIME-LIMIT Effective date: 20210130 |
|
| PG25 | Lapsed in a contracting state [announced via postgrant information from national office to epo] |
Ref country code: SK Free format text: LAPSE BECAUSE OF FAILURE TO SUBMIT A TRANSLATION OF THE DESCRIPTION OR TO PAY THE FEE WITHIN THE PRESCRIBED TIME-LIMIT Effective date: 20200930 |
|
| REG | Reference to a national code |
Ref country code: DE Ref legal event code: R097 Ref document number: 602013073003 Country of ref document: DE |
|
| PLBE | No opposition filed within time limit |
Free format text: ORIGINAL CODE: 0009261 |
|
| STAA | Information on the status of an ep patent application or granted ep patent |
Free format text: STATUS: NO OPPOSITION FILED WITHIN TIME LIMIT |
|
| PG25 | Lapsed in a contracting state [announced via postgrant information from national office to epo] |
Ref country code: DK Free format text: LAPSE BECAUSE OF FAILURE TO SUBMIT A TRANSLATION OF THE DESCRIPTION OR TO PAY THE FEE WITHIN THE PRESCRIBED TIME-LIMIT Effective date: 20200930 |
|
| 26N | No opposition filed |
Effective date: 20210701 |
|
| PG25 | Lapsed in a contracting state [announced via postgrant information from national office to epo] |
Ref country code: SI Free format text: LAPSE BECAUSE OF FAILURE TO SUBMIT A TRANSLATION OF THE DESCRIPTION OR TO PAY THE FEE WITHIN THE PRESCRIBED TIME-LIMIT Effective date: 20200930 |
|
| REG | Reference to a national code |
Ref country code: CH Ref legal event code: PL |
|
| PG25 | Lapsed in a contracting state [announced via postgrant information from national office to epo] |
Ref country code: MC Free format text: LAPSE BECAUSE OF FAILURE TO SUBMIT A TRANSLATION OF THE DESCRIPTION OR TO PAY THE FEE WITHIN THE PRESCRIBED TIME-LIMIT Effective date: 20200930 |
|
| REG | Reference to a national code |
Ref country code: BE Ref legal event code: MM Effective date: 20210831 |
|
| PG25 | Lapsed in a contracting state [announced via postgrant information from national office to epo] |
Ref country code: LI Free format text: LAPSE BECAUSE OF NON-PAYMENT OF DUE FEES Effective date: 20210831 Ref country code: CH Free format text: LAPSE BECAUSE OF NON-PAYMENT OF DUE FEES Effective date: 20210831 |
|
| PG25 | Lapsed in a contracting state [announced via postgrant information from national office to epo] |
Ref country code: IS Free format text: LAPSE BECAUSE OF FAILURE TO SUBMIT A TRANSLATION OF THE DESCRIPTION OR TO PAY THE FEE WITHIN THE PRESCRIBED TIME-LIMIT Effective date: 20210130 Ref country code: LU Free format text: LAPSE BECAUSE OF NON-PAYMENT OF DUE FEES Effective date: 20210830 |
|
| PG25 | Lapsed in a contracting state [announced via postgrant information from national office to epo] |
Ref country code: IE Free format text: LAPSE BECAUSE OF NON-PAYMENT OF DUE FEES Effective date: 20210830 Ref country code: FR Free format text: LAPSE BECAUSE OF NON-PAYMENT OF DUE FEES Effective date: 20210831 Ref country code: BE Free format text: LAPSE BECAUSE OF NON-PAYMENT OF DUE FEES Effective date: 20210831 |
|
| PG25 | Lapsed in a contracting state [announced via postgrant information from national office to epo] |
Ref country code: HU Free format text: LAPSE BECAUSE OF FAILURE TO SUBMIT A TRANSLATION OF THE DESCRIPTION OR TO PAY THE FEE WITHIN THE PRESCRIBED TIME-LIMIT; INVALID AB INITIO Effective date: 20130830 |
|
| PG25 | Lapsed in a contracting state [announced via postgrant information from national office to epo] |
Ref country code: CY Free format text: LAPSE BECAUSE OF FAILURE TO SUBMIT A TRANSLATION OF THE DESCRIPTION OR TO PAY THE FEE WITHIN THE PRESCRIBED TIME-LIMIT Effective date: 20200930 |
|
| PG25 | Lapsed in a contracting state [announced via postgrant information from national office to epo] |
Ref country code: MK Free format text: LAPSE BECAUSE OF FAILURE TO SUBMIT A TRANSLATION OF THE DESCRIPTION OR TO PAY THE FEE WITHIN THE PRESCRIBED TIME-LIMIT Effective date: 20200930 |
|
| PG25 | Lapsed in a contracting state [announced via postgrant information from national office to epo] |
Ref country code: MT Free format text: LAPSE BECAUSE OF FAILURE TO SUBMIT A TRANSLATION OF THE DESCRIPTION OR TO PAY THE FEE WITHIN THE PRESCRIBED TIME-LIMIT Effective date: 20200930 |
|
| PGFP | Annual fee paid to national office [announced via postgrant information from national office to epo] |
Ref country code: DE Payment date: 20250819 Year of fee payment: 13 |
|
| PGFP | Annual fee paid to national office [announced via postgrant information from national office to epo] |
Ref country code: IT Payment date: 20250829 Year of fee payment: 13 |
|
| PGFP | Annual fee paid to national office [announced via postgrant information from national office to epo] |
Ref country code: GB Payment date: 20250822 Year of fee payment: 13 |
|
| PG25 | Lapsed in a contracting state [announced via postgrant information from national office to epo] |
Ref country code: TR Free format text: LAPSE BECAUSE OF FAILURE TO SUBMIT A TRANSLATION OF THE DESCRIPTION OR TO PAY THE FEE WITHIN THE PRESCRIBED TIME-LIMIT Effective date: 20200930 |