EP2965690A1 - Brain function activity evaluation device and evaluation system using same - Google Patents
Brain function activity evaluation device and evaluation system using same Download PDFInfo
- Publication number
- EP2965690A1 EP2965690A1 EP14759461.8A EP14759461A EP2965690A1 EP 2965690 A1 EP2965690 A1 EP 2965690A1 EP 14759461 A EP14759461 A EP 14759461A EP 2965690 A1 EP2965690 A1 EP 2965690A1
- Authority
- EP
- European Patent Office
- Prior art keywords
- brain
- subject
- brain function
- function activity
- values
- Prior art date
- Legal status (The legal status is an assumption and is not a legal conclusion. Google has not performed a legal analysis and makes no representation as to the accuracy of the status listed.)
- Withdrawn
Links
Images




Classifications
-
- A—HUMAN NECESSITIES
- A61—MEDICAL OR VETERINARY SCIENCE; HYGIENE
- A61B—DIAGNOSIS; SURGERY; IDENTIFICATION
- A61B5/00—Measuring for diagnostic purposes; Identification of persons
- A61B5/24—Detecting, measuring or recording bioelectric or biomagnetic signals of the body or parts thereof
- A61B5/316—Modalities, i.e. specific diagnostic methods
- A61B5/369—Electroencephalography [EEG]
- A61B5/372—Analysis of electroencephalograms
- A61B5/374—Detecting the frequency distribution of signals, e.g. detecting delta, theta, alpha, beta or gamma waves
-
- A—HUMAN NECESSITIES
- A61—MEDICAL OR VETERINARY SCIENCE; HYGIENE
- A61B—DIAGNOSIS; SURGERY; IDENTIFICATION
- A61B5/00—Measuring for diagnostic purposes; Identification of persons
- A61B5/24—Detecting, measuring or recording bioelectric or biomagnetic signals of the body or parts thereof
- A61B5/316—Modalities, i.e. specific diagnostic methods
- A61B5/369—Electroencephalography [EEG]
- A61B5/372—Analysis of electroencephalograms
-
- A—HUMAN NECESSITIES
- A61—MEDICAL OR VETERINARY SCIENCE; HYGIENE
- A61B—DIAGNOSIS; SURGERY; IDENTIFICATION
- A61B5/00—Measuring for diagnostic purposes; Identification of persons
- A61B5/24—Detecting, measuring or recording bioelectric or biomagnetic signals of the body or parts thereof
- A61B5/316—Modalities, i.e. specific diagnostic methods
- A61B5/369—Electroencephalography [EEG]
- A61B5/384—Recording apparatus or displays specially adapted therefor
-
- A—HUMAN NECESSITIES
- A61—MEDICAL OR VETERINARY SCIENCE; HYGIENE
- A61B—DIAGNOSIS; SURGERY; IDENTIFICATION
- A61B2576/00—Medical imaging apparatus involving image processing or analysis
- A61B2576/02—Medical imaging apparatus involving image processing or analysis specially adapted for a particular organ or body part
- A61B2576/026—Medical imaging apparatus involving image processing or analysis specially adapted for a particular organ or body part for the brain
-
- A—HUMAN NECESSITIES
- A61—MEDICAL OR VETERINARY SCIENCE; HYGIENE
- A61B—DIAGNOSIS; SURGERY; IDENTIFICATION
- A61B6/00—Apparatus or devices for radiation diagnosis; Apparatus or devices for radiation diagnosis combined with radiation therapy equipment
- A61B6/02—Arrangements for diagnosis sequentially in different planes; Stereoscopic radiation diagnosis
- A61B6/03—Computed tomography [CT]
- A61B6/037—Emission tomography
-
- G—PHYSICS
- G16—INFORMATION AND COMMUNICATION TECHNOLOGY [ICT] SPECIALLY ADAPTED FOR SPECIFIC APPLICATION FIELDS
- G16H—HEALTHCARE INFORMATICS, i.e. INFORMATION AND COMMUNICATION TECHNOLOGY [ICT] SPECIALLY ADAPTED FOR THE HANDLING OR PROCESSING OF MEDICAL OR HEALTHCARE DATA
- G16H30/00—ICT specially adapted for the handling or processing of medical images
- G16H30/40—ICT specially adapted for the handling or processing of medical images for processing medical images, e.g. editing
Definitions
- the present invention relates to a device that evaluates a brain function activity level by measuring the brain function activity level and an evaluation system using the device.
- the present invention is concerned with a device that evaluates the state of a brain function activity so as to discriminate a brain disease such as senile cognitive impairment, and a system using the device.
- AD Alzheimer's dementia
- a ratio by which increasing medical expenses and care expenses, which are needed to address AD, occupy a national budget is gradually augmenting.
- the augmentation has become a socially serious problem.
- prophylaxis cannot help depending on early recognition and rehabilitation for activating the brain function. For example, in Japan, the population of elderly persons who are sixty-five years of age or older has reached thirty million.
- a diagnostic modality that assists in deciding whether an elderly person suffers from dementia is getting more significant. For prophylactic diagnosis aiming at the elderly, development of a novel diagnostic modality satisfying seven conditions listed below is expected.
- Brain function activity measuring devices based on scalp potential analysis which are devised by the present inventor are disclosed in Patent Documents 1 and 2 ( Japanese Patent No. 4145344 and Japanese Patent No. 5118230 ).
- a scalp potential hereinafter, a brain potential
- brain potential components ranging from 2 Hz to 40 Hz are divided into frequency bands.
- a normalized power variance hereinafter, NPV is obtained from each of the frequency bands.
- NPV normalized power variance
- a set of these variables is used as a marker to characterize an activity of encephalic neurons and gliacytes or the like (generically referred to as a brain function activity).
- a region in which a state of an activity is abnormal compared with a mean value of a group of normal controls is obtained.
- a set of newly obtained NPVs of a subject is compared with templates representing characteristics of respective diseases in order to quantize likelihoods to the brain function diseases.
- An object of the present invention is to provide a brain function activity level evaluation device and brain function activity level evaluation system capable of highly precisely discriminating different diseases from one another and displaying the discrimination between diseases.
- NPV neurode activity
- NLc NLc
- jm NLc
- NPV neurode function activity
- NLc NLc
- jm NLc
- a brain function activity level is a degree of the brain function activity.
- a brain function activity level evaluation device of the present invention includes plural sensors that are mounted on the head of a subject in order to measure a brain potential of the subject.
- the brain function activity level evaluation device further includes arithmetic means that: divides a brain potential, which is outputted from each of the sensors, into segments, which have a predetermined time width, on a time base; performs discrete Fourier transform for each of the segments so as to obtain a discrete Fourier coefficient that has a frequency component, which is an integral multiple of a fundamental frequency that is an inverse number of the predetermined time width, within a predetermined frequency band; obtains a mean value of squares of absolute values of the Fourier coefficients in all the segments, normalizes the obtained mean value of the squares of the absolute values of the Fourier coefficients so as to obtain a normalized power spectrum (NPS;j,m) that is a first parameter; and normalizes a product of mean values of squares of absolute values of Fourier coefficients of adjoin
- the arithmetic means obtains a first marker sNAT;j,m and a second marker vNAT;j,m by subtracting a mean value of values of the frequency component, which are derived from all the sensors, in each of the normalized power spectrum (NPS;j,m) that is the first parameter, and the normalized power ratio (NPV;j,m) that is the second parameter.
- Each of the markers is characterized by a position in a multidimensional sNAT space or vNAT space in which sub-markers determined with the number of sensors and the number of discrete frequencies respectively are expressed.
- the arithmetic means calculates an sZ score (sZ;j,m;x:NLc) using the first marker (sNAT;x,jm) relevant to a subject x, a template state (sNAT;NLc,jm) of normal controls that is a mean value of the first markers obtained in advance from a predetermined group of normal controls in the same manner as the aforementioned one, and a standard deviation thereof (s ⁇ ;NLc,jm).
- the arithmetic means further calculates a vZ score (vZ;j,m;x:NLc) using the state of the subject x (vNAT;x,jm) determined with the second marker, a template state (vNAT;NLc,jm) determined with a mean value of the second markers obtained in advance in the same manner from the predetermined group of normal controls, and a standard deviation thereof (v ⁇ ;NLc,jm).
- the arithmetic means visualizes or displays the state of the activity of the brain at an associated position in a brain surface image on the basis of the values of the sZ score (sZ;j,m;x:NLc) and vZ score (vZ;j,m;x:NLc).
- a normalized distance for example, Maharanobis distance
- a template state for example, a mean state of a group of numerous AD patients
- likelihoods of the subject to the disease are determined.
- a brain function activity level evaluation system as another embodiment of the present invention includes at least a brain function activity measuring terminal including plural sensors that are mounted on the head of a subject in order to measure a brain potential of the subject, an interface via which the brain potential outputted from each of the sensors is transmitted to outside, and an arithmetic unit, and a calculation center connected to the brain function activity measuring terminal over a communication line.
- the calculation center is characterized in that:
- the arithmetic means of the calculation center obtains a first marker and a second marker by subtracting a mean value of values of the frequency component, which are derived from all the sensors, in each of the normalized power spectrum that is the first parameter, and the normalized power ratio that is the second parameter.
- the arithmetic means of the calculation center calculates an sZ score using the value of the first marker relevant to a subject, a template state regarded as a mean value of the first markers obtained in advance in the same manner from a predetermined group of normal controls, and a standard deviation thereof, and further calculates a vZ score using the value of the second marker relevant to the subject, a template state regarded as a mean value of the second markers obtained in advance from the predetermined group of normal controls, and a standard deviation thereof.
- the brain function activity measuring terminal includes a unit that receives the calculated sZ score and vZ score over the communication line, and visualizes or displays a brain function activity level at associated positions in a brain surface image on the basis of the sZ score and vZ score.
- the arithmetic means of the calculation center calculates likelihoods of the subject to the template state of the group of normal controls on the basis of the calculated sZ score and vZ score, uses the likelihoods to calculate difference likelihoods signifying to which of the template state of the group of normal controls and a template state of a group of AD patients the subject is more similar, and visualizes or displays the state of a brain function activity of the subject.
- a program that is another embodiment of the present invention allows a computer to execute a procedure of: dividing a brain potential, which is outputted from each of plural sensors that are mounted on the head of a subject in order to measure the brain potential of the subject, into segments, which have a predetermined time width, on a time base; performing discrete Fourier transform for each of the segments so as to obtain a discrete Fourier coefficient that has a frequency component, which is an integral multiple of a fundamental frequency that is an inverse number of the predetermined time width, within a predetermined frequency band; obtaining a mean value of squares of absolute values of the Fourier coefficients in all the segments; normalizing the obtained mean value of the squares of the absolute values of the discrete Fourier coefficients so as to obtain a normalized power spectrum (NPS;j,m) that is a first marker; normalizing a product of mean values of squares of absolute values of discrete Fourier coefficients of adjoining frequency components using a square value of the sum of the mean values of the adjoining frequency components so as to obtain
- a power spectrum of a brain potential is normalized with a mean value of a power spectrum within a given frequency band in order to obtain a normalized power spectrum NPS.
- a recorded brain potential signal is divided into segments, and an inverse number of a segment length is regarded as a fundamental frequency.
- a power distribution with respect to a frequency that is a positive integral multiple of the fundamental frequency is used as a raw material of a first parameter.
- a normalized power ratio NPV obtained by normalizing a ratio of discretized power spectral components with a mean power of the powers of the spectral components is adopted.
- the parameters NPS and NPV are obtained by performing normalization on a frequency axis.
- a mean value of values of the frequency component derived from all channels is subtracted from the values of the frequency component in each of the parameters NPS and NPV, whereby a zero level is reset. This results in two markers sNAT and vNAT.
- a state in which mean values (sZ;j,m;x:NLc)m and (vZ;j,m;x:NLc)m of Z scores of the two markers with respect to a frequency m are positive or negative is referred to as a hyperactive and under-synchronous state in which a brain function activity associated with the markers sNAT and vNAT is hyperactive and under-synchronous.
- a state in which the mean values are smaller is referred to as a hypoactive and over-synchronous state.
- the state of the brain function activity can be classified into four combinational states of a hyperactive and over-synchronous state, hyperactive and under-synchronous state, hypoactive and over-synchronous state, and hypoactive and under-synchronous state.
- the brain function activity can be characterized in more detail.
- a distance between a template AD state which is a mean of a group of numerous patients suffering from a certain disease, for example, AD patients
- a subject state is represented by a normalized distance expressed with quotients by standard deviations of the template AD state.
- Likelihoods are expressed based on the shortness of the distance. Accordingly, the meaning of the likelihoods becomes apparent and separation between diseases can be achieved.
- two newly introduced markers are used to display an abnormal region, in which a brain function activity is abnormal, on a brain surface in more detail.
- Various brain diseases can be detected in an early stage, and likelihoods to a template state characterizing any of the various brain diseases can be quantized.
- Different brain diseases can be highly precisely identified and discriminated from a normal control state.
- the states of the brain diseases can be imaged and displayed on a standard brain surface. Therefore, brain disease diagnosis can be realized inexpensively, noninvasively, highly sensitively, and highly reliably. This modality is expected to prevail in medium- and small-scale medical institutions.
- Fig. 1 is a block diagram showing a configuration of a brain function activity level evaluation device that is an example of the present invention.
- the brain function activity level evaluation device that is an example of the present invention includes brain potential sensors or magnetoencephalographic sensors (which may be called electrodes and may hereinafter be generically called sensors) 2, an amplifier 3 that amplifies a brain potential measured by each of the sensors 2, a multiplexer 4, an analog-to-digital converter (A/D converter) 5, a computer 10, an input unit 24 such as a keyboard, an external storage unit 25 in which programs and others are stored, a display unit 31 such as a CRT, and a printer 32.
- the computer 10 includes an interface (I/F) 15 via which digitized measured brain potential data is inputted, a CPU 11, a ROM 13, a RAM 14, an output interface (I/F) 16, and a bus 12 over which the components are interconnected.
- I/F interface
- the ROM 13 is a read-only storage medium
- the RAM 14 is a memory in which brain potential data sent from the input unit 24 such as a keyboard or the A/D converter 5 is stored during computation.
- the CPU 11 is an arithmetic unit that reads a program out of the external storage unit 25 or ROM 13, and performs various computations on the brain potential data sent from the A/D converter 5 and read from the RAM 14. The results of computation are displayed on the display unit 31 (CRT) via the output interface 16.
- the printer 32 prints out data or a waveform displayed on the display unit 31.
- the external storage unit 25 may not be used but the programs and others may all be stored in advance in the ROM 13.
- the sensors 2 are formed with plural electrodes, for example, about twenty-one electrodes, and mounted on the head 1 in order to measure a brain potential based on a brain function activity. Otherwise, a cap or helmet in which the about twenty-one electrodes are included in advance may be mounted on the head 1 in order to measure the brain potential. Needless to say, any technique other than the use of the cap or helmet may be adopted as long as it can measure the brain potential based on the brain function activity.
- the sensors 2 are disposed at positions stipulated in or determined in conformity with the International 10-20 Standard, and a sensor (not shown) is disposed at, for example, the right earlobe regarded as the position of a reference potential.
- the brain potential measured by the sensor 2 is fed to the analog-to-digital converter (A/D converter) 5 via the amplifier 3 and multiplexer 4. Digitized measured brain potential data is fed to the computer 10 via the input interface (I/F) 15. The measured brain potential data may be passed through the input interface 15 as it is. Alternatively, only components falling within a pre-defined frequency band (for example, a predetermined frequency band wider than the frequency band of alpha waves) may be subjected to digital filtering processing and then outputted.
- a pre-defined frequency band for example, a predetermined frequency band wider than the frequency band of alpha waves
- the brain function activity level evaluation device may be configured as a stand-alone device.
- a physician can immediately obtain diagnosis assistive information even at a clinical site in an isolated island in which an Internet environment is unavailable. As far as the Internet environment is available, more appropriate diagnosis assistance can be attained over the Internet using the external storage unit as a server.
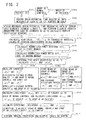
- Fig. 2 is a flowchart describing processing of the brain function activity level evaluation device that is an example of the present invention.
- the processing of the brain function activity level evaluation device is performed on each of a subject, a group of normal controls, and a group of AD patients.
- a group of normal controls including a predetermined number of persons is determined in advance by conducting the mini mental state examination (MMSE), the magnetic resonance imaging (MRI) for image examination, the single photon emission computing tomography (SPECT), or the like which is an existing method intended to evaluate a cognitive function.
- MMSE mini mental state examination
- MRI magnetic resonance imaging
- SPECT single photon emission computing tomography
- Each of the persons has time-sequential data of a brain potential (scalp potential) thereof measured using each of the twenty-one (J) sensors 2, and has the data recorded (step S102).
- a potential signal of each of the sensors 2 is sampled at intervals of 5 ms.
- specific frequency portions for example, predetermined frequencies ranging from 4 Hz to 20 Hz
- the optimal frequency band ranging from 4 Hz to 20 Hz will be described later.
- Recorded brain potential time-sequential data obtained by the sensor j (electrode) (j ranges from 1 to 21) is divided into segments (segment length T) on a time base.
- 2 ⁇ seg of squares of absolute values of the Fourier coefficients in all the segments is calculated (step S104).
- 2 ⁇ seg is referred to as a power of the frequency component.
- NPS;j,m that is a first parameter is calculated as a value normalized with the mean value ⁇
- NPS j , m ⁇ X j , m 2 ⁇ seg / ⁇ ⁇ X j , m 2 ⁇ seg ⁇ m
- the normalized power spectrum NPS;j,m represents an average distribution of the powers of the frequency component mf0 on the channel j.
- the calculated NPS;j,m is stored in the RAM 14.
- a normalized power ratio NPV;j,m that is a second parameter is calculated as a dimensionless quantity according to a formula (2) below (step S106).
- the calculated NPV;j,m is stored in the RAM 14.
- NPV j , m 4 ⁇ ⁇ X j , m 2 ⁇ seg ⁇ ⁇ X j , m + 1 2 ⁇ seg / ⁇ X j , m 2 ⁇ seg + ⁇ X j , m + 1 2 ⁇ seg 2
- the power ratio p;j,m between adjoining frequency components is expressed by a formula (3) below.
- p j , m ⁇ X j , m - 1 2 ⁇ seg / ⁇ X j , m 2 ⁇ seg
- NPV;j,m takes on a maximum value of 1.
- This represents the power ratio between frequency components that adjoin on a frequency axis, and signifies a gradient of a power spectrum of a signal whose intensity is modulated and which is fed to the brain due to a brain function activity. That is, when p;j,m 1, an average power ratio is 1.
- the brain function activity becomes random and signal transmission is not carried out.
- Zero reset processing is performed on the parameters in order to calculate sNAT;j,m and vNAT;j,m (step S107). More particularly, in order to enhance a spatial distribution on the channel j with respect to the frequency mf0 in each of the normalized power spectrum NPS;j,m and normalized power ratio NPV;j,m, offset values appearing in the spatial distribution have to be removed because they weaken a relative change concerning the space. Markers sNAT and vNAT are obtained by removing the offset values according to formulae (5) and (6) below. Accordingly, sensitivity is improved.
- steps S102 to S107 are repeatedly performed on all normal controls, whereby group means for the group of normal controls, ⁇ sNAT;NLc,jm> and ⁇ vNAT;NLc,jm>, and standard deviations s ⁇ ;NLc,jm and v ⁇ ;NLc,jm within the group are calculated.
- group means for the group of normal controls ⁇ sNAT;NLc,jm> and ⁇ vNAT;NLc,jm>
- standard deviations s ⁇ ;NLc,jm and v ⁇ ;NLc,jm within the group are calculated.
- the results of the calculation are stored as a database in the RAM 14 (step S108a).
- a group of AD patients including a predetermined number of persons is determined in advance by conducting the mini mental state examination (MMSE), magnetic resonance imaging (MRI) for image examination, or single photon emission computing tomography (SPECT), or the like which is an existing method intended to evaluate a cognitive function.
- MMSE mini mental state examination
- MRI magnetic resonance imaging
- SPECT single photon emission computing tomography
- Each of the persons has time-sequential data of a brain potential (scalp potential) thereof measured using each of twenty-one (J) sensors 2, and has the data recorded (step S102).
- steps S103 to S105 are executed in order to calculate a normalized power spectrum NPS;j,m that is a first parameter of an AD patient and store the normalized power spectrum in the RAM 14.
- Step S106 is then executed in order to calculate a normalized power ratio NPV;j,m that is a second parameter of the AD patient and store the normalized power ratio in the RAM 14.
- Step S107 is executed in order to calculate sNAT;j,m and vNAT;j,m of the AD patient.
- Steps S101 to S107 are repeatedly performed on all the AD patents, whereby group means ⁇ sNAT;AD,jm> and ⁇ vNAT;AD,jm> for the group of AD patients and standard deviations s ⁇ ;AD,jm and v ⁇ ;AD,jm within the group are calculated.
- the results of the calculation are stored as a database in the RAM 14 (step S108b).
- processing for a measured brain potential of a subject (x) begins at S101c).
- the sensors 2 are mounted on the subject (x), and the subject is measured in order to acquire time-sequential data of a brain potential (scalp potential) from each of the sensors 2 and record the data (step S102).
- Steps S103 to S105 are executed in order to calculate a normalized power spectrum NPS;j,m that is a first parameter of the subject (x).
- Step S106 is executed in order to calculate a normalized power ratio NPV;j,m that is a second parameter of the subject (x).
- Step S107 is executed in order to calculate sNAT;x,jm and vNAT;x,jm that are a pair of markers characterizing a state of the brain function activity of the subject (x).
- step S109 processing of step S109 will be described below.
- the group means ⁇ sNAT;NLc,jm> and ⁇ vNAT;NLc,jm> for the group of normal controls, and the standard deviations s ⁇ ;NLc,jm and v ⁇ ;NLc,jm within the group are read from the RAM 14, and are used together with sNAT;x,jm and vNAT;x,jm of the subject (x), which are obtained at step S107, to calculate sZ;j,m;x:NLc according to a formula (7) below.
- vZ;j,m;x:NLc is calculated according to a formula (8) below.
- sZ;j,m;x:NLc and vZ;j,m;x:NLc are quantities representing a distance between the brain function activity of the subject (x) and the standard state of the brain function activities of the group of normal controls, and the distance may be referred to as a normalized distance or Mahalanobis distance.
- sZ;j,m;x:NLc and vZ;j,m;x:NLc are defined as an sZ score and vZ score respectively.
- the vZ score is an index relevant to a coherency of a brain function activity
- the sZ score is an index relevant to a level of the brain function activity in the brain.
- vZ;j,m;x:NLc>0 a brain function activity that contributes to generation of a brain potential at the position of the electrode j is in an under-synchronous state compared with those of NLc (normal controls).
- vZ;j,m;x:NLc ⁇ 0 the brain function activity is in an over-synchronous state.
- sZ;j,m;x:NLc>0 since the brain function activity level is larger than those of NLc, the brain function activity is in a hyperactive state.
- sZ;j,m;x:NLc ⁇ 0 since the brain function activity level is smaller than those of NLc, the brain function activity is in a hypoactive state.
- the state of the brain function activity can be classified into four states, that is, an over-synchronous and hyperactive state, an over-synchronous and hypoactive state, under-synchronous and hyperactive state, and under-synchronous and hypoactive state.
- the brain function activity can be characterized in more detail.
- the group means ⁇ sNAT;AD,jm> and ⁇ vNAT;AD,jm> for the group of AD patients and the standard deviations s ⁇ ;AD,jm and v ⁇ ;NLc,jm within the group are read from the RAM 14, and used together with sNAT;x,jm and vNAT;x,jm of the subject (x), which are obtained at step S107, to calculate sZ;j,m;x:AD according to a formula (9) below.
- vZ;j,m;x:AD is calculated according to a formula (10) below.
- v ⁇ Z j , m ; x AD ⁇ vNAT j , m x - vNAT j , m AD / v ⁇ ⁇ j , m AD
- sZ;j,m;x:AD and vZ;j,m;x:AD are quantities representing a distance between the state of the brain function activity of the subject (x) and a template state of the brain function activities of the group of AD patients.
- step S110 processing of step S110 will be described below.
- sL;x,ADc and vL;x,ADc that represent the likelihoods of the subject (x) to the standard state of the group of AD patients are calculated according to formulae (13) and (14) respectively.
- step S111 processing of step S111 will be described below.
- difference likelihoods signifying to which of the standard state of the group of normal controls and the standard state of the group of AD patients the subject (x) is similar are calculated according to formulae (15) and (16) respectively.
- the standard state of the group of AD patients and the standard state of the group of normal controls can be separated from each other, and the brain function activity level of the subject (x) can be highly precisely evaluated.
- the results of execution (results of computation) of the processing ending at step S111 are subjected to imaging processing, and displayed on the display unit 31 such as a CRT (step S112).
- the display will be described later.
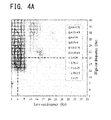
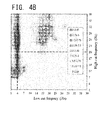
- Fig. 4A and Fig. 4B show the results of an experiment.
- Fig. 4A and Fig. 4B are diagrams expressing t values in a t-test which represent significance of state separation.
- Fig. 4A is concerned with sNAT;j,m, while Fig. 4B is concerned with vNAT;j,m.
- the axis of abscissas indicates a lower-limit frequency, and the axis of ordinates indicates an upper-limit frequency.
- a frequency band in which large t values are obtained in common for the two markers sNAT;j,m and vNAT;j,m ranges from 4 Hz to 20 Hz. Therefore, in the present invention, the optimal frequency band is set to the range from 4 Hz to 20 Hz.
- Fig. 3 is a diagram showing sensitivity/specificity curves with respect to a difference likelihood.
- the difference likelihood sL;x,ADc-NLc signifying to which of the template state of the group of normal controls and the template state of the group of AD patients the subject (x) is more similar is marked on the axis of abscissas, and sensitivity/specificity curves are plotted as functions of the difference likelihood.
- Fig. 3 demonstrates that a sensitivity or specificity of a maximum of 85 % can be obtained. In other words, an erroneous discrimination probability of discriminating AD from no disease is 15 %. Since the present invention is not accompanied by radiation exposure, if a normal state results from repeated diagnosis, a possibility of erroneous diagnosis decreases accordingly. Therefore, the present invention can be utilized for high-sensitivity screening of AD patients.
- Fig. 6A to Fig. 6C are diagrams showing examples of display of NAT images and SPECT images.
- Fig. 6A the images are displayed with vZ;j,x:AD allocated to associated positions on a standard brain surface.
- a bar displayed in the right upper part of the drawing is a gradation bar in which a whiter color indicates a larger positive value of the vZ score, and a blacker color indicates a larger negative value of the vZ score.
- a left lateral image of the standard brain surface, a superior image thereof, and a right lateral image thereof are viewed in association with the gradation bar, whereby the state of a brain function activity can be discerned.
- the vZ score is larger than 0, an under-synchronous state is observed. If the vZ score is smaller than 0, an over-synchronous state is observed.
- Fig. 6B the images are displayed with sZ;j,x:AD allocated to associated positions on a standard brain surface.
- a bar displayed in the right upper part of the drawing is a gradation bar in which a whiter color indicates a larger positive value of the sZ score and a blacker color indicates a larger negative value of the sZ score.
- the left lateral image of the standard brain surface, the superior image thereof, and the right lateral image thereof are viewed in association with the gradation bar, whereby the state of a brain function activity can be discerned.
- a hyperactive state is observed.
- a hypoactive state is observed.
- the state of the brain function activity can be classified into four states of the over-synchronous and hyperactive state, over-synchronous and hypoactive state, under-synchronous and hyperactive state, and under-synchronous and hypoactive state.
- Fig. 6C shows SPECT images.
- a black area in the image shows a region in which a cerebral bloodstream is decreased.
- regions in which the brain function activity is hypoactive and under-synchronous correspond to the cerebral bloodstream decreased regions.
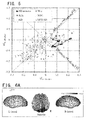
- Fig. 5 is the likelihood graph using a pair of difference likelihoods.
- the axis of abscissas indicates the difference likelihood sL; x:ADc-NLc , and the axis of ordinates indicates the difference likelihood vL; x:ADc-NLc .
- the difference likelihoods are obtained at step S111 mentioned in Fig. 2 . Assuming that the system of coordinates is turned through 45° clockwise, a degree of severity of AD is indicated in the right upper direction over the first and second quadrants in the resultant system of coordinates, and a normal domain is spread in the left lower direction therein.
- a dashed line with an arrow indicates a therapeutic process of a certain AD patient.
- MCI-AD expresses a group of patients who suffer from mild cognitive impairment and have a possibility of converting in AD.
- Fig. 7 is a block diagram of a brain function activity level evaluation system that is another example of the present invention.
- a computer 10 acts as a data transfer terminal device installed at each of clinical sites.
- Measured brain potential data is transmitted to a calculation center 42, which serves as arithmetic equipment, over a communication line 41 such as the Internet via a communication interface 17 of the computer 10.
- the calculation center 42 performs various computations on the measured brain potential data, and transmits the results of computation or results of analysis to the computer 10 over the communication line 41.
- the computer 10 serving as a data transfer terminal performs image processing on the received results of computation or results of analysis, and displays the resultant data on a CRT 31, or allows an output unit such as a printer 32 to print out the resultant data.
- the calculation center 42 has a program and a storage medium included in a server device that is not shown.
- the server device or the like acquires and stores a brain potential, that is, data concerning the brain potential, stores data concerning a specific brain disease, performs various computations on the stored data concerning the brain potential, and stores the results of computation or results of analysis.
- the calculation center computes data and manages the results of computation on a centralized manner.
- the computers 10 serving as data transfer terminals and being installed at respective clinical sites need to merely transmit measured brain potential data and perform image processing on the results of computation or results of analysis received from the calculation center 42.
- loads can be dispersed.
- Fig. 8 is a flowchart describing processing of the brain function activity level evaluation system of the present invention.
- the calculation center 42 receives measured brain potential time-sequential data items of a subject (x), a group of normal controls, and a group of AD patients from the computer 10 (steps S201a, S201b, S201c, and S202).
- the calculation center 42 reads the program from the server device, and performs computation on the received brain potential time-sequential data items (steps S203 to S211).
- the contents of processing to be performed are identical to those of steps S103 to S111 mentioned in Fig. 2 . An iterative description will be omitted.
- Calculated values that are the results of computation or results of analysis are transmitted to the data transfer terminal (step S212).
- the present invention is not limited to the foregoing examples but encompasses various variants.
- the examples have been described for a better understanding of the present invention.
- the present invention is not limited to a configuration including all of the described components.
Landscapes
- Health & Medical Sciences (AREA)
- Life Sciences & Earth Sciences (AREA)
- Engineering & Computer Science (AREA)
- Physics & Mathematics (AREA)
- Surgery (AREA)
- Animal Behavior & Ethology (AREA)
- Pathology (AREA)
- Veterinary Medicine (AREA)
- Biomedical Technology (AREA)
- Heart & Thoracic Surgery (AREA)
- Medical Informatics (AREA)
- Molecular Biology (AREA)
- Public Health (AREA)
- Biophysics (AREA)
- General Health & Medical Sciences (AREA)
- Psychiatry (AREA)
- Psychology (AREA)
- Measurement And Recording Of Electrical Phenomena And Electrical Characteristics Of The Living Body (AREA)
- Physiology (AREA)
- Mathematical Physics (AREA)
- Artificial Intelligence (AREA)
- Computer Vision & Pattern Recognition (AREA)
- Signal Processing (AREA)
- Computer Networks & Wireless Communication (AREA)
Abstract
Description
- The present invention relates to a device that evaluates a brain function activity level by measuring the brain function activity level and an evaluation system using the device. In particular, the present invention is concerned with a device that evaluates the state of a brain function activity so as to discriminate a brain disease such as senile cognitive impairment, and a system using the device.
- Among dementias, Alzheimer's dementia (hereinafter AD) whose morbidity rises along with progress of aging has the cause thereof left unrevealed and the therapeutic method thereof left unestablished. In contrast, the number of AD patients is increasing. Therefore, not only in Japan but also in other countries in the world, a ratio by which increasing medical expenses and care expenses, which are needed to address AD, occupy a national budget is gradually augmenting. The augmentation has become a socially serious problem. As for a prophylactic approach, prophylaxis cannot help depending on early recognition and rehabilitation for activating the brain function. For example, in Japan, the population of elderly persons who are sixty-five years of age or older has reached thirty million. A diagnostic modality that assists in deciding whether an elderly person suffers from dementia is getting more significant. For prophylactic diagnosis aiming at the elderly, development of a novel diagnostic modality satisfying seven conditions listed below is expected.
- (A) Inexpensive
- (B) Noninvasive in that cerebrospinal fluid or blood is not collected
- (C) Not accompanied by radiation exposure
- (D) Highly sensitive
- (E) Highly reliable
- (F) Having the capability to present information permitting any physician other than a specialist of dementias to make diagnosis
- (G) Operation of the device does not require an expertise.
- A device that measures a brain function activity and satisfies the above conditions is needed. Brain function activity measuring devices based on scalp potential analysis which are devised by the present inventor are disclosed in
Patent Documents 1 and 2 (Japanese Patent No. 4145344 Japanese Patent No. 5118230 - The aforesaid existing arts are unsatisfactory from the viewpoints described below. The description below is based on findings acquired for the first time as a result of a large-scale clinical test.
- (A) A quantity called the normalized power variance (NPV) of a brain potential does not provide information that is unique enough to characterize the brain function activity. A degree of discrimination between different diseases, for example, between Alzheimer's dementia and depression is not high.
- (B) The marker includes an unnecessary offset that degrades sensitivity. A marker devoid of such an offset has to be introduced.
- (C) A state specified by the marker is represented by a vector in a multidimensional space. A likelihood between states is represented by a cosine or inner product of an angle formed by vectors representing the states. The variable is not fully adaptable as the likelihood, and the meaning of the variable is not clarified.
- (D) A recorded potential signal includes an artifact component. Since the artifact component becomes a factor that degrades sensitivity in separating diseases, there is no rigorous criterion to be used to determine a frequency band, which is an object of analysis, and a segment length of the recorded potential signal.
- An object of the present invention is to provide a brain function activity level evaluation device and brain function activity level evaluation system capable of highly precisely discriminating different diseases from one another and displaying the discrimination between diseases.
- In the present Description, some values are denoted by NPV;j,m, NLc,jm, or any other reference sign having a half-width additional character appended thereto. Whether the additional character is a superscript or subscript is requested to be decided by referencing an associated formula or drawing. In the present Description, what is referred to as a brain function activity is a brain activity caused by a brain function, and what is referred to as a brain function activity level is a degree of the brain function activity.
- In order to solve the aforesaid problems, a brain function activity level evaluation device of the present invention includes plural sensors that are mounted on the head of a subject in order to measure a brain potential of the subject. The brain function activity level evaluation device further includes arithmetic means that: divides a brain potential, which is outputted from each of the sensors, into segments, which have a predetermined time width, on a time base; performs discrete Fourier transform for each of the segments so as to obtain a discrete Fourier coefficient that has a frequency component, which is an integral multiple of a fundamental frequency that is an inverse number of the predetermined time width, within a predetermined frequency band; obtains a mean value of squares of absolute values of the Fourier coefficients in all the segments, normalizes the obtained mean value of the squares of the absolute values of the Fourier coefficients so as to obtain a normalized power spectrum (NPS;j,m) that is a first parameter; and normalizes a product of mean values of squares of absolute values of Fourier coefficients of adjoining frequency components in all the segments using the square of the sum of the mean values of the adjoining frequency components so as to obtain a normalized power ratio (NPV;j,m) that is a second parameter. The first parameter and the second parameter are used to evaluate a brain function activity level.
- Further, as an embodiment of the brain function activity level evaluation device of the present invention, the arithmetic means obtains a first marker sNAT;j,m and a second marker vNAT;j,m by subtracting a mean value of values of the frequency component, which are derived from all the sensors, in each of the normalized power spectrum (NPS;j,m) that is the first parameter, and the normalized power ratio (NPV;j,m) that is the second parameter. Each of the markers is characterized by a position in a multidimensional sNAT space or vNAT space in which sub-markers determined with the number of sensors and the number of discrete frequencies respectively are expressed.
- As another embodiment of the brain function activity level evaluation device of the present invention, the arithmetic means calculates an sZ score (sZ;j,m;x:NLc) using the first marker (sNAT;x,jm) relevant to a subject x, a template state (sNAT;NLc,jm) of normal controls that is a mean value of the first markers obtained in advance from a predetermined group of normal controls in the same manner as the aforementioned one, and a standard deviation thereof (sσ;NLc,jm). The arithmetic means further calculates a vZ score (vZ;j,m;x:NLc) using the state of the subject x (vNAT;x,jm) determined with the second marker, a template state (vNAT;NLc,jm) determined with a mean value of the second markers obtained in advance in the same manner from the predetermined group of normal controls, and a standard deviation thereof (vσ;NLc,jm). The arithmetic means visualizes or displays the state of the activity of the brain at an associated position in a brain surface image on the basis of the values of the sZ score (sZ;j,m;x:NLc) and vZ score (vZ;j,m;x:NLc). As a function of a normalized distance (for example, Maharanobis distance) between a template state (for example, a mean state of a group of numerous AD patients), which characterizes any of various cerebral diseases, and the state of the subject, likelihoods of the subject to the disease are determined. By expressing the likelihoods with the shortness of the normalized distance, the meaning of the likelihoods becomes apparent, and separation between different diseases can be displayed.
- A brain function activity level evaluation system as another embodiment of the present invention includes at least a brain function activity measuring terminal including plural sensors that are mounted on the head of a subject in order to measure a brain potential of the subject, an interface via which the brain potential outputted from each of the sensors is transmitted to outside, and an arithmetic unit, and a calculation center connected to the brain function activity measuring terminal over a communication line. The calculation center is characterized in that:
- (1) the calculation center includes arithmetic means that divides a brain potential, which is outputted from each of the sensors and sent from the brain function activity measuring terminal, into segments, which have a predetermined time width, on a time base, that performs discrete Fourier transform for each of the segments so as to obtain a Fourier coefficient that has a frequency component, which is an integral multiple of a fundamental frequency that is an inverse number of the predetermined time width, within a predetermined frequency band, that obtains a mean value of squares of absolute values of the Fourier coefficients in all the segments, that normalizes the obtained mean value of the squares of the absolute values of the Fourier coefficients so as to obtain a normalized power spectrum (NPS;j,m) that is a first parameter, that normalizes a product of mean values of squares of absolute values of Fourier coefficients of adjoining discretized frequency components using a square of the sum of the mean values of the adjoining frequency components so as to obtain a normalized power ratio (NPV;j,m) that is a second parameter; and
- (2) the calculation center transmits the obtained first parameter (NPS;j,m) and second parameter (NPV;j,m) to the brain function activity measuring terminal.
- Further, in a brain function activity level evaluation system as another embodiment of the present invention, the arithmetic means of the calculation center obtains a first marker and a second marker by subtracting a mean value of values of the frequency component, which are derived from all the sensors, in each of the normalized power spectrum that is the first parameter, and the normalized power ratio that is the second parameter.
- Further, in a brain function activity level evaluation system as another embodiment of the present invention, the arithmetic means of the calculation center calculates an sZ score using the value of the first marker relevant to a subject, a template state regarded as a mean value of the first markers obtained in advance in the same manner from a predetermined group of normal controls, and a standard deviation thereof, and further calculates a vZ score using the value of the second marker relevant to the subject, a template state regarded as a mean value of the second markers obtained in advance from the predetermined group of normal controls, and a standard deviation thereof. The brain function activity measuring terminal includes a unit that receives the calculated sZ score and vZ score over the communication line, and visualizes or displays a brain function activity level at associated positions in a brain surface image on the basis of the sZ score and vZ score.
- Further, in a brain function activity level evaluation system as another embodiment of the present invention, the arithmetic means of the calculation center calculates likelihoods of the subject to the template state of the group of normal controls on the basis of the calculated sZ score and vZ score, uses the likelihoods to calculate difference likelihoods signifying to which of the template state of the group of normal controls and a template state of a group of AD patients the subject is more similar, and visualizes or displays the state of a brain function activity of the subject.
- A program that is another embodiment of the present invention allows a computer to execute a procedure of: dividing a brain potential, which is outputted from each of plural sensors that are mounted on the head of a subject in order to measure the brain potential of the subject, into segments, which have a predetermined time width, on a time base; performing discrete Fourier transform for each of the segments so as to obtain a discrete Fourier coefficient that has a frequency component, which is an integral multiple of a fundamental frequency that is an inverse number of the predetermined time width, within a predetermined frequency band; obtaining a mean value of squares of absolute values of the Fourier coefficients in all the segments; normalizing the obtained mean value of the squares of the absolute values of the discrete Fourier coefficients so as to obtain a normalized power spectrum (NPS;j,m) that is a first marker; normalizing a product of mean values of squares of absolute values of discrete Fourier coefficients of adjoining frequency components using a square value of the sum of the mean values of the adjoining frequency components so as to obtain a normalized power ratio (NPV;j,m) that is a second marker; obtaining differences obtained by subtracting a mean value of values of the frequency component, which are derived from all the sensors, from the values of the frequency component in each of the normalized power spectrum that is the first parameter, and the normalized power ratio that is the second parameter, and obtaining a first marker (sNAT;j,m) and second marker (vNAT;j,m) by removing the offset values.
- In the present invention, a power spectrum of a brain potential is normalized with a mean value of a power spectrum within a given frequency band in order to obtain a normalized power spectrum NPS. A recorded brain potential signal is divided into segments, and an inverse number of a segment length is regarded as a fundamental frequency. A power distribution with respect to a frequency that is a positive integral multiple of the fundamental frequency is used as a raw material of a first parameter. As a second parameter, a normalized power ratio NPV obtained by normalizing a ratio of discretized power spectral components with a mean power of the powers of the spectral components is adopted. The parameters NPS and NPV are obtained by performing normalization on a frequency axis. A mean value of values of the frequency component derived from all channels is subtracted from the values of the frequency component in each of the parameters NPS and NPV, whereby a zero level is reset. This results in two markers sNAT and vNAT.
- A state in which mean values (sZ;j,m;x:NLc)m and (vZ;j,m;x:NLc)m of Z scores of the two markers with respect to a frequency m are positive or negative is referred to as a hyperactive and under-synchronous state in which a brain function activity associated with the markers sNAT and vNAT is hyperactive and under-synchronous. A state in which the mean values are smaller is referred to as a hypoactive and over-synchronous state. As a result, the state of the brain function activity can be classified into four combinational states of a hyperactive and over-synchronous state, hyperactive and under-synchronous state, hypoactive and over-synchronous state, and hypoactive and under-synchronous state. The brain function activity can be characterized in more detail.
- Accordingly, a distance between a template AD state, which is a mean of a group of numerous patients suffering from a certain disease, for example, AD patients, and a subject state is represented by a normalized distance expressed with quotients by standard deviations of the template AD state. Likelihoods are expressed based on the shortness of the distance. Accordingly, the meaning of the likelihoods becomes apparent and separation between diseases can be achieved.
- According to the present invention, two newly introduced markers are used to display an abnormal region, in which a brain function activity is abnormal, on a brain surface in more detail. Various brain diseases can be detected in an early stage, and likelihoods to a template state characterizing any of the various brain diseases can be quantized. Different brain diseases can be highly precisely identified and discriminated from a normal control state. The states of the brain diseases can be imaged and displayed on a standard brain surface. Therefore, brain disease diagnosis can be realized inexpensively, noninvasively, highly sensitively, and highly reliably. This modality is expected to prevail in medium- and small-scale medical institutions.
-
-
Fig. 1 is a block diagram showing a configuration of a brain function activity level evaluation device that is an example of the present invention; -
Fig. 2 is a flowchart describing processing of the brain function activity level evaluation device of the present invention; -
Fig. 3 is a diagram showing sensitivity/specificity curves with respect to a difference likelihood; -
Fig. 4A is a diagram showing t values in a t-test indicating significance of state separation and being concerned with sNAT;j,m; -
Fig. 4B is a diagram showing the t values in the t-test indicating the significance of state separation and being concerned with vNAT;j,m; -
Fig. 5 is a likelihood graph based on a pair of difference likelihoods; -
Fig. 6A is a diagram showing an example of display of NAT images and having vZ;j;x:AD allocated to associated positions on a standard brain surface; -
Fig. 6B is a diagram showing an example of display of the NAT images and having sZ;j;x:AD allocated to associated positions on the standard brain surface; -
Fig. 6C is a diagram showing an example of display of SPECT images; -
Fig. 7 is a block diagram of a brain function activity level evaluation system that is another example of the present invention; and -
Fig. 8 is a flowchart describing processing of the brain function activity level evaluation system of the present invention. - Examples will be described below in conjunction with the drawings.
-
Fig. 1 is a block diagram showing a configuration of a brain function activity level evaluation device that is an example of the present invention. The brain function activity level evaluation device that is an example of the present invention includes brain potential sensors or magnetoencephalographic sensors (which may be called electrodes and may hereinafter be generically called sensors) 2, anamplifier 3 that amplifies a brain potential measured by each of thesensors 2, amultiplexer 4, an analog-to-digital converter (A/D converter) 5, acomputer 10, aninput unit 24 such as a keyboard, anexternal storage unit 25 in which programs and others are stored, adisplay unit 31 such as a CRT, and aprinter 32. Thecomputer 10 includes an interface (I/F) 15 via which digitized measured brain potential data is inputted, aCPU 11, aROM 13, aRAM 14, an output interface (I/F) 16, and abus 12 over which the components are interconnected. - The
ROM 13 is a read-only storage medium, and theRAM 14 is a memory in which brain potential data sent from theinput unit 24 such as a keyboard or the A/D converter 5 is stored during computation. TheCPU 11 is an arithmetic unit that reads a program out of theexternal storage unit 25 orROM 13, and performs various computations on the brain potential data sent from the A/D converter 5 and read from theRAM 14. The results of computation are displayed on the display unit 31 (CRT) via theoutput interface 16. Theprinter 32 prints out data or a waveform displayed on thedisplay unit 31. Theexternal storage unit 25 may not be used but the programs and others may all be stored in advance in theROM 13. - The
sensors 2 are formed with plural electrodes, for example, about twenty-one electrodes, and mounted on thehead 1 in order to measure a brain potential based on a brain function activity. Otherwise, a cap or helmet in which the about twenty-one electrodes are included in advance may be mounted on thehead 1 in order to measure the brain potential. Needless to say, any technique other than the use of the cap or helmet may be adopted as long as it can measure the brain potential based on the brain function activity. In this case, thesensors 2 are disposed at positions stipulated in or determined in conformity with the International 10-20 Standard, and a sensor (not shown) is disposed at, for example, the right earlobe regarded as the position of a reference potential. The brain potential measured by thesensor 2 is fed to the analog-to-digital converter (A/D converter) 5 via theamplifier 3 andmultiplexer 4. Digitized measured brain potential data is fed to thecomputer 10 via the input interface (I/F) 15. The measured brain potential data may be passed through theinput interface 15 as it is. Alternatively, only components falling within a pre-defined frequency band (for example, a predetermined frequency band wider than the frequency band of alpha waves) may be subjected to digital filtering processing and then outputted. - The brain function activity level evaluation device may be configured as a stand-alone device. When the brain function activity level evaluation device is configured as the stand-alone device, a physician can immediately obtain diagnosis assistive information even at a clinical site in an isolated island in which an Internet environment is unavailable. As far as the Internet environment is available, more appropriate diagnosis assistance can be attained over the Internet using the external storage unit as a server.
-
Fig. 2 is a flowchart describing processing of the brain function activity level evaluation device that is an example of the present invention. In the example of the present invention, the processing of the brain function activity level evaluation device is performed on each of a subject, a group of normal controls, and a group of AD patients. - To begin with, production of a database concerning the group of normal controls will be described (processing begins at S101c). A group of normal controls including a predetermined number of persons is determined in advance by conducting the mini mental state examination (MMSE), the magnetic resonance imaging (MRI) for image examination, the single photon emission computing tomography (SPECT), or the like which is an existing method intended to evaluate a cognitive function. Each of the persons has time-sequential data of a brain potential (scalp potential) thereof measured using each of the twenty-one (J)
sensors 2, and has the data recorded (step S102). A potential signal of each of thesensors 2 is sampled at intervals of 5 ms. As for a frequency range, specific frequency portions (for example, predetermined frequencies ranging from 4 Hz to 20 Hz) are extracted through bandpass filter processing. The optimal frequency band ranging from 4 Hz to 20 Hz will be described later. - Recorded brain potential time-sequential data obtained by the sensor j (electrode) (j ranges from 1 to 21) is divided into segments (segment length T) on a time base. The brain potential is subjected to discrete Fourier transform for each of the segments in order to obtain a Fourier coefficient Xj,m that has a frequency component mf0 which is an integral m multiple of a fundamental frequency fo (=1/T) relevant to each segment (step S103). Thereafter, a mean value 〈|Xj,m|2〉seg of squares of absolute values of the Fourier coefficients in all the segments is calculated (step S104). The mean value 〈|Xj,m|2〉seg is referred to as a power of the frequency component.
- A normalized power spectrum NPS;j,m that is a first parameter is calculated as a value normalized with the mean value 〈|Xj,m|2〉seg according to a formula (1) below (step S105).

- The normalized power spectrum NPS;j,m represents an average distribution of the powers of the frequency component mf0 on the channel j. The calculated NPS;j,m is stored in the
RAM 14. - In order to characterize a power ratio between adjoining frequency components, a normalized power ratio NPV;j,m that is a second parameter is calculated as a dimensionless quantity according to a formula (2) below (step S106). The calculated NPV;j,m is stored in the
RAM 14.
- The power ratio p;j,m between adjoining frequency components is expressed by a formula (3) below.

- By assigning the formula (3) to the formula (2), a formula (4) below is obtained.

- According to the formula (4), when p;j,m=1, NPV;j,m takes on a maximum value of 1. This represents the power ratio between frequency components that adjoin on a frequency axis, and signifies a gradient of a power spectrum of a signal whose intensity is modulated and which is fed to the brain due to a brain function activity. That is, when p;j,m=1, an average power ratio is 1. The brain function activity becomes random and signal transmission is not carried out.
- Zero reset processing is performed on the parameters in order to calculate sNAT;j,m and vNAT;j,m (step S107). More particularly, in order to enhance a spatial distribution on the channel j with respect to the frequency mf0 in each of the normalized power spectrum NPS;j,m and normalized power ratio NPV;j,m, offset values appearing in the spatial distribution have to be removed because they weaken a relative change concerning the space. Markers sNAT and vNAT are obtained by removing the offset values according to formulae (5) and (6) below. Accordingly, sensitivity is improved.


- The aforesaid steps S102 to S107 are repeatedly performed on all normal controls, whereby group means for the group of normal controls, <sNAT;NLc,jm> and <vNAT;NLc,jm>, and standard deviations sσ;NLc,jm and vσ;NLc,jm within the group are calculated. The results of the calculation are stored as a database in the RAM 14 (step S108a).
- Next, production of a database for a group of AD patients will be described below (processing begins at S101b). Similarly to the case of the group of normal controls, a group of AD patients including a predetermined number of persons is determined in advance by conducting the mini mental state examination (MMSE), magnetic resonance imaging (MRI) for image examination, or single photon emission computing tomography (SPECT), or the like which is an existing method intended to evaluate a cognitive function. Each of the persons has time-sequential data of a brain potential (scalp potential) thereof measured using each of twenty-one (J)
sensors 2, and has the data recorded (step S102). - Similarly to the case of the group of normal controls, steps S103 to S105 are executed in order to calculate a normalized power spectrum NPS;j,m that is a first parameter of an AD patient and store the normalized power spectrum in the
RAM 14. Step S106 is then executed in order to calculate a normalized power ratio NPV;j,m that is a second parameter of the AD patient and store the normalized power ratio in theRAM 14. Step S107 is executed in order to calculate sNAT;j,m and vNAT;j,m of the AD patient. Steps S101 to S107 are repeatedly performed on all the AD patents, whereby group means <sNAT;AD,jm> and <vNAT;AD,jm> for the group of AD patients and standard deviations sσ;AD,jm and vσ;AD,jm within the group are calculated. The results of the calculation are stored as a database in the RAM 14 (step S108b). - Next, processing for a measured brain potential of a subject (x) will be described below (processing begins at S101c). Similarly to the case of the group of normal controls, the
sensors 2 are mounted on the subject (x), and the subject is measured in order to acquire time-sequential data of a brain potential (scalp potential) from each of thesensors 2 and record the data (step S102). Steps S103 to S105 are executed in order to calculate a normalized power spectrum NPS;j,m that is a first parameter of the subject (x). Step S106 is executed in order to calculate a normalized power ratio NPV;j,m that is a second parameter of the subject (x). Step S107 is executed in order to calculate sNAT;x,jm and vNAT;x,jm that are a pair of markers characterizing a state of the brain function activity of the subject (x). - Next, processing of step S109 will be described below.
- The group means <sNAT;NLc,jm> and <vNAT;NLc,jm> for the group of normal controls, and the standard deviations sσ;NLc,jm and vσ;NLc,jm within the group are read from the
RAM 14, and are used together with sNAT;x,jm and vNAT;x,jm of the subject (x), which are obtained at step S107, to calculate sZ;j,m;x:NLc according to a formula (7) below.
- Likewise, vZ;j,m;x:NLc is calculated according to a formula (8) below.

- Now, the foregoing sZ;j,m;x:NLc and vZ;j,m;x:NLc are quantities representing a distance between the brain function activity of the subject (x) and the standard state of the brain function activities of the group of normal controls, and the distance may be referred to as a normalized distance or Mahalanobis distance.
- In the present invention, sZ;j,m;x:NLc and vZ;j,m;x:NLc are defined as an sZ score and vZ score respectively. The vZ score is an index relevant to a coherency of a brain function activity, and the sZ score is an index relevant to a level of the brain function activity in the brain.
- Now, if vZ;j,m;x:NLc>0, a brain function activity that contributes to generation of a brain potential at the position of the electrode j is in an under-synchronous state compared with those of NLc (normal controls). In contrast, if vZ;j,m;x:NLc<0, the brain function activity is in an over-synchronous state. If sZ;j,m;x:NLc>0, since the brain function activity level is larger than those of NLc, the brain function activity is in a hyperactive state. If sZ;j,m;x:NLc<0, since the brain function activity level is smaller than those of NLc, the brain function activity is in a hypoactive state. Therefore, by introducing the sZ score and vZ score, the state of the brain function activity can be classified into four states, that is, an over-synchronous and hyperactive state, an over-synchronous and hypoactive state, under-synchronous and hyperactive state, and under-synchronous and hypoactive state. The brain function activity can be characterized in more detail.
- Likewise, at step S109, the group means <sNAT;AD,jm> and <vNAT;AD,jm> for the group of AD patients and the standard deviations sσ;AD,jm and vσ;NLc,jm within the group are read from the
RAM 14, and used together with sNAT;x,jm and vNAT;x,jm of the subject (x), which are obtained at step S107, to calculate sZ;j,m;x:AD according to a formula (9) below.
- Likewise, vZ;j,m;x:AD is calculated according to a formula (10) below.

- The foregoing sZ;j,m;x:AD and vZ;j,m;x:AD are quantities representing a distance between the state of the brain function activity of the subject (x) and a template state of the brain function activities of the group of AD patients.
- Next, processing of step S110 will be described below.
- Using sZ;j,m;x:NLc and vZ;j,m;x:NLc obtained at step S109, sL;x,NLc and vL;x,NLc that represent the likelihoods of the subject (x) to the standard state of the group of normal controls are calculated according to formulae (11) and (12) respectively.


- Likewise, sL;x,ADc and vL;x,ADc that represent the likelihoods of the subject (x) to the standard state of the group of AD patients are calculated according to formulae (13) and (14) respectively.


- Next, processing of step S111 will be described below. Using the likelihoods sL;x,NLc, vL;x,NLc, sL;x,ADc, and vL;x,ADc obtained at step S110, difference likelihoods signifying to which of the standard state of the group of normal controls and the standard state of the group of AD patients the subject (x) is similar are calculated according to formulae (15) and (16) respectively.


- By introducing the difference likelihoods, the standard state of the group of AD patients and the standard state of the group of normal controls can be separated from each other, and the brain function activity level of the subject (x) can be highly precisely evaluated.
- The results of execution (results of computation) of the processing ending at step S111 are subjected to imaging processing, and displayed on the
display unit 31 such as a CRT (step S112). The display will be described later. - Designation of the optimal frequency band ranging from 4 Hz to 20 Hz will be described below. In general, it is almost impossible to automatically remove an unnecessary signal (artifact) such as a myoelectric signal caused by a body motion or blink occurring during brain potential measurement. Preprocessing is to merely exclude a segment in which an amplitude is equal to or higher than 100 microvolts. An optimal frequency band, that is, a frequency band in which a separation probability between an AD patient and a normal control becomes maximum was experimentally determined through trial and error.
Fig. 4A andFig. 4B show the results of an experiment.Fig. 4A andFig. 4B are diagrams expressing t values in a t-test which represent significance of state separation.Fig. 4A is concerned with sNAT;j,m, whileFig. 4B is concerned with vNAT;j,m. The axis of abscissas indicates a lower-limit frequency, and the axis of ordinates indicates an upper-limit frequency. A frequency band in which large t values are obtained in common for the two markers sNAT;j,m and vNAT;j,m ranges from 4 Hz to 20 Hz. Therefore, in the present invention, the optimal frequency band is set to the range from 4 Hz to 20 Hz. -
Fig. 3 is a diagram showing sensitivity/specificity curves with respect to a difference likelihood. The difference likelihood sL;x,ADc-NLc signifying to which of the template state of the group of normal controls and the template state of the group of AD patients the subject (x) is more similar is marked on the axis of abscissas, and sensitivity/specificity curves are plotted as functions of the difference likelihood.Fig. 3 demonstrates that a sensitivity or specificity of a maximum of 85 % can be obtained. In other words, an erroneous discrimination probability of discriminating AD from no disease is 15 %. Since the present invention is not accompanied by radiation exposure, if a normal state results from repeated diagnosis, a possibility of erroneous diagnosis decreases accordingly. Therefore, the present invention can be utilized for high-sensitivity screening of AD patients. -
Fig. 6A to Fig. 6C are diagrams showing examples of display of NAT images and SPECT images. - In
Fig. 6A , the images are displayed with vZ;j,x:AD allocated to associated positions on a standard brain surface. A bar displayed in the right upper part of the drawing is a gradation bar in which a whiter color indicates a larger positive value of the vZ score, and a blacker color indicates a larger negative value of the vZ score. A left lateral image of the standard brain surface, a superior image thereof, and a right lateral image thereof are viewed in association with the gradation bar, whereby the state of a brain function activity can be discerned. As mentioned above, if the vZ score is larger than 0, an under-synchronous state is observed. If the vZ score is smaller than 0, an over-synchronous state is observed. - In
Fig. 6B , the images are displayed with sZ;j,x:AD allocated to associated positions on a standard brain surface. A bar displayed in the right upper part of the drawing is a gradation bar in which a whiter color indicates a larger positive value of the sZ score and a blacker color indicates a larger negative value of the sZ score. The left lateral image of the standard brain surface, the superior image thereof, and the right lateral image thereof are viewed in association with the gradation bar, whereby the state of a brain function activity can be discerned. As mentioned above, if the sZ score is larger than 0, a hyperactive state is observed. If the sZ score is smaller than 0, a hypoactive state is observed. - By viewing
Fig. 6A andFig. 6B on a screen, the state of the brain function activity can be classified into four states of the over-synchronous and hyperactive state, over-synchronous and hypoactive state, under-synchronous and hyperactive state, and under-synchronous and hypoactive state. -
Fig. 6C shows SPECT images. A black area in the image shows a region in which a cerebral bloodstream is decreased. In other words, regions in which the brain function activity is hypoactive and under-synchronous correspond to the cerebral bloodstream decreased regions. - Next, a case where a likelihood graph is displayed on the screen will be described below.
Fig. 5 is the likelihood graph using a pair of difference likelihoods. The axis of abscissas indicates the difference likelihood sL;x:ADc-NLc, and the axis of ordinates indicates the difference likelihood vL;x:ADc-NLc. The difference likelihoods are obtained at step S111 mentioned inFig. 2 . Assuming that the system of coordinates is turned through 45° clockwise, a degree of severity of AD is indicated in the right upper direction over the first and second quadrants in the resultant system of coordinates, and a normal domain is spread in the left lower direction therein. Talking of a synchronous abnormality of a brain function activity and an activity level abnormality, an adverse effect of the latter one is seen greater than that of the former one in the right lower part of the resultant system of coordinates, while the adverse effect of the former one is seen greater in the left upper part thereof. A dashed line with an arrow indicates a therapeutic process of a certain AD patient. By displaying the therapeutic process while superposing it on the likelihood diagram, AD can be discovered in an early stage in course of a transition from a normal state to AD, or a therapeutic effect can be verified. - In
Fig. 5 , the difference likelihoods to MCI-AD are also plotted. MCI-AD expresses a group of patients who suffer from mild cognitive impairment and have a possibility of converting in AD. -
Fig. 7 is a block diagram of a brain function activity level evaluation system that is another example of the present invention. - Compared with
Fig. 1 , in the present example, acomputer 10 acts as a data transfer terminal device installed at each of clinical sites. Measured brain potential data is transmitted to acalculation center 42, which serves as arithmetic equipment, over acommunication line 41 such as the Internet via acommunication interface 17 of thecomputer 10. Thecalculation center 42 performs various computations on the measured brain potential data, and transmits the results of computation or results of analysis to thecomputer 10 over thecommunication line 41. Thecomputer 10 serving as a data transfer terminal performs image processing on the received results of computation or results of analysis, and displays the resultant data on aCRT 31, or allows an output unit such as aprinter 32 to print out the resultant data. Thecalculation center 42 has a program and a storage medium included in a server device that is not shown. The server device or the like acquires and stores a brain potential, that is, data concerning the brain potential, stores data concerning a specific brain disease, performs various computations on the stored data concerning the brain potential, and stores the results of computation or results of analysis. By thus configuring the brain function activity level evaluation system, the calculation center computes data and manages the results of computation on a centralized manner. Thecomputers 10 serving as data transfer terminals and being installed at respective clinical sites need to merely transmit measured brain potential data and perform image processing on the results of computation or results of analysis received from thecalculation center 42. In addition to the advantage of Example 1, there is provided an advantage that loads can be dispersed. -
Fig. 8 is a flowchart describing processing of the brain function activity level evaluation system of the present invention. Thecalculation center 42 receives measured brain potential time-sequential data items of a subject (x), a group of normal controls, and a group of AD patients from the computer 10 (steps S201a, S201b, S201c, and S202). Thecalculation center 42 reads the program from the server device, and performs computation on the received brain potential time-sequential data items (steps S203 to S211). The contents of processing to be performed are identical to those of steps S103 to S111 mentioned inFig. 2 . An iterative description will be omitted. Calculated values that are the results of computation or results of analysis are transmitted to the data transfer terminal (step S212). - The present invention is not limited to the foregoing examples but encompasses various variants. For example, the examples have been described for a better understanding of the present invention. The present invention is not limited to a configuration including all of the described components.
Claims (10)
- A brain function activity level evaluation device of a subject comprising:a plurality of sensors that is mounted on the head of a subject in order to measure a brain potential of the subject; andarithmetic means that divides a brain potential, which is outputted from each of the sensors, into segments, which have a predetermined time width, on a time base, performs discrete Fourier transform for each of the segments so as to obtain a discrete Fourier coefficient that has a frequency component, which is an integral multiple of a fundamental frequency that is an inverse number of the predetermined time width, within a predetermined frequency band, obtains a mean value of squares of absolute values of Fourier coefficients in all the segments, performs normalization using the obtained mean value of the squares of the absolute values of the Fourier coefficients so as to obtain a normalized power spectrum that is a first parameter, normalizes a product of mean values of squares of absolute values of Fourier coefficients of adjoining frequency components in all the segments using a square value of the sum of the mean values of the adjoining frequency components so as to obtain a normalized power ratio that is a second parameter, whereinthe first parameter and the second parameter are used to evaluate a brain function activity level.
- The brain function activity level evaluation device of a subject according to Claim 1, wherein the arithmetic means obtains a first marker and a second marker by subtracting a mean value of values of the frequency component, which are derived from all the sensors, from the values of the frequency component in each of the normalized power spectrum that is the first parameter, and the normalized power ratio that is the second parameter.
- The brain function activity level evaluation device of a subject according to Claim 2, wherein:the arithmetic means calculates an sZ score using the value of the first marker relevant to a subject, a mean value of the first markers obtained in advance in the same manner from a predetermined group of normal controls, and a standard deviation thereof;the arithmetic means further calculates a vZ score using the value of the second marker relevant to the subject, a mean value of the second markers obtained in advance in the same manner from the predetermined group of normal controls, and a standard deviation thereof; andthe arithmetic means visualizes or displays the state of a brain function activity at associated positions in a brain surface image on the basis of the sZ score and vZ score.
- The brain function activity level evaluation device of a subject according to any one of Claims 1 to 3, wherein the predetermined frequency band ranges from 4 Hz to 20 Hz.
- A brain function activity level evaluation system of a subject, comprising at least:a brain function activity measuring terminal including a plurality of sensors that is mounted on the head of a subject in order to measure a brain potential of the subject, an interface via which the brain potential outputted from each of the sensors is transmitted to outside, and an arithmetic unit; anda calculation center connected to the brain function activity measuring terminal over a communication line, whereinthe calculation center includes arithmetic means that divides a brain potential, which is outputted from each of the sensors and sent from the brain function activity measuring terminal, into segments, which have a predetermined time width, on a time base,performs discrete Fourier transform for each of the segments so as to obtain a Fourier coefficient that has a frequency component, which is an integral multiple of a fundamental frequency that is an inverse number of the predetermined time width, within a predetermined frequency band,obtains a mean value of squares of absolute values of Fourier coefficients in all the segments,normalizes the Fourier coefficients using the obtained mean value of the squares of the absolute values of the Fourier coefficients so as to obtain a normalized power spectrum that is a first marker, andnormalizes a product of mean values of squares of absolute values of Fourier coefficients of adjoining discretized frequency components using a square value of the sum of the mean values of the adjoining frequency components so as to obtain a normalized power ratio that is a second marker; andthe calculation center transmits the obtained first marker and second marker to the brain function activity measuring terminal.
- The brain function activity level evaluation system of a subject according to Claim 5, wherein:the arithmetic means of the calculation center obtains a first marker and a second marker by subtracting a mean value of values of the frequency component, which are derived from all the sensors, in each of the normalized power spectrum that is the first parameter, and the normalized power ratio that is the second parameter.
- The brain function activity level evaluation system according to Claim 6, wherein:the arithmetic means of the calculation center calculates an sZ score using the first marker relevant to a subject, a template that is a mean value of the first markers obtained in advance in the same manner from a predetermined group of normal controls, and a standard deviation thereof;the arithmetic means further calculates a vZ score using the second marker relevant to the subject, a template that is a mean value of the second markers obtained in advance from the predetermined group of normal controls, and a standard deviation thereof; andthe brain function activity measuring terminal includes a unit that receives the calculated sZ score and vZ score over the communication line, and visualizes or displays the state of a brain activity of the subject at associated positions in a brain surface image on the basis of the sZ score and the vZ score.
- The brain function activity level evaluation system of a subject according to Claim 7, wherein:the arithmetic means calculates likelihoods of the subject to the template of the group of normal controls on the basis of the calculated sZ score and vZ score, calculates difference likelihoods, which signify to which of the template of the group of normal controls and the template of a group of AD patients the subject is more similar, on the basis of the calculated likelihoods, and visualizes or displays the state of the brain activity of the subject.
- A program allowing a computer to execute a procedure of:dividing a brain potential, which is outputted from each of a plurality of sensors that is mounted on the head of a subject in order to measure the brain potential of the subject, into segments of a predetermined time width on a time base;performing discrete Fourier transform for each of the segments so as to obtain a discrete Fourier coefficient that has a frequency component, which is an integral multiple of a fundamental frequency that is an inverse number of the predetermined time width, within a predetermined frequency band;obtaining a mean value of squares of absolute values of Fourier coefficients in all the segments;performing normalization using the obtained mean value of the squares of the absolute values of the discrete Fourier coefficients so as to obtain a normalized power spectrum that is a first parameter;normalizing a product of mean values of squares of absolute values of discrete Fourier coefficients of adjoining frequency components using a square value of the sum of the mean values of the adjoining frequency components so as to obtain a normalized power ratio that is a second parameter; andobtaining differences by subtracting a mean value of values of the frequency component, which are derived from all the sensors, from the values of the frequency component in each of the normalized power spectrum that is the first parameter, and the normalized power ratio that is the second parameter, and obtaining a first marker and a second marker by removing the offset values.
- A computer readable recording medium having the program set forth in Claim 9 recorded therein.
Applications Claiming Priority (2)
| Application Number | Priority Date | Filing Date | Title |
|---|---|---|---|
| JP2013042198 | 2013-03-04 | ||
| PCT/JP2014/055230 WO2014136704A1 (en) | 2013-03-04 | 2014-03-03 | Brain function activity evaluation device and evaluation system using same |
Publications (2)
| Publication Number | Publication Date |
|---|---|
| EP2965690A1 true EP2965690A1 (en) | 2016-01-13 |
| EP2965690A4 EP2965690A4 (en) | 2016-11-02 |
Family
ID=51491222
Family Applications (1)
| Application Number | Title | Priority Date | Filing Date |
|---|---|---|---|
| EP14759461.8A Withdrawn EP2965690A4 (en) | 2013-03-04 | 2014-03-03 | DEVICE FOR EVALUATING BRAIN FUNCTION ACTIVITY AND EVALUATION SYSTEM USING THE SAME |
Country Status (6)
| Country | Link |
|---|---|
| US (1) | US20150073249A1 (en) |
| EP (1) | EP2965690A4 (en) |
| JP (1) | JP6017015B2 (en) |
| CN (1) | CN105407797A (en) |
| SG (1) | SG11201508920TA (en) |
| WO (1) | WO2014136704A1 (en) |
Families Citing this family (7)
| Publication number | Priority date | Publication date | Assignee | Title |
|---|---|---|---|---|
| WO2019060298A1 (en) | 2017-09-19 | 2019-03-28 | Neuroenhancement Lab, LLC | Method and apparatus for neuroenhancement |
| US11717686B2 (en) | 2017-12-04 | 2023-08-08 | Neuroenhancement Lab, LLC | Method and apparatus for neuroenhancement to facilitate learning and performance |
| US12280219B2 (en) | 2017-12-31 | 2025-04-22 | NeuroLight, Inc. | Method and apparatus for neuroenhancement to enhance emotional response |
| US11318277B2 (en) | 2017-12-31 | 2022-05-03 | Neuroenhancement Lab, LLC | Method and apparatus for neuroenhancement to enhance emotional response |
| US11364361B2 (en) | 2018-04-20 | 2022-06-21 | Neuroenhancement Lab, LLC | System and method for inducing sleep by transplanting mental states |
| CN113382683A (en) | 2018-09-14 | 2021-09-10 | 纽罗因恒思蒙特实验有限责任公司 | System and method for improving sleep |
| US11786694B2 (en) | 2019-05-24 | 2023-10-17 | NeuroLight, Inc. | Device, method, and app for facilitating sleep |
Family Cites Families (5)
| Publication number | Priority date | Publication date | Assignee | Title |
|---|---|---|---|---|
| JP4145344B1 (en) | 2007-10-18 | 2008-09-03 | 株式会社脳機能研究所 | Brain activity measuring device |
| US20110112426A1 (en) * | 2009-11-10 | 2011-05-12 | Brainscope Company, Inc. | Brain Activity as a Marker of Disease |
| EP2595530A4 (en) * | 2010-07-22 | 2015-09-16 | Univ Washington | CORRELATION BETWEEN FREQUENCY SIGNATURES AND COGNITIVE PROCESSES |
| JP5118230B2 (en) | 2011-05-10 | 2013-01-16 | 株式会社脳機能研究所 | Brain activity measuring device |
| US20140107519A1 (en) * | 2012-10-12 | 2014-04-17 | Brain Functions Laboratory, Inc. | Apparatus for measuring brain local activity |
-
2014
- 2014-03-03 CN CN201480025000.5A patent/CN105407797A/en active Pending
- 2014-03-03 WO PCT/JP2014/055230 patent/WO2014136704A1/en not_active Ceased
- 2014-03-03 SG SG11201508920TA patent/SG11201508920TA/en unknown
- 2014-03-03 EP EP14759461.8A patent/EP2965690A4/en not_active Withdrawn
- 2014-03-03 JP JP2015504288A patent/JP6017015B2/en active Active
- 2014-11-18 US US14/546,128 patent/US20150073249A1/en not_active Abandoned
Also Published As
| Publication number | Publication date |
|---|---|
| SG11201508920TA (en) | 2015-11-27 |
| US20150073249A1 (en) | 2015-03-12 |
| CN105407797A (en) | 2016-03-16 |
| WO2014136704A1 (en) | 2014-09-12 |
| EP2965690A4 (en) | 2016-11-02 |
| JPWO2014136704A1 (en) | 2017-02-09 |
| JP6017015B2 (en) | 2016-10-26 |
Similar Documents
| Publication | Publication Date | Title |
|---|---|---|
| US20150073249A1 (en) | Brain function activity level evaluation device and evaluation system using it | |
| Bairagi | EEG signal analysis for early diagnosis of Alzheimer disease using spectral and wavelet based features | |
| Lahmiri et al. | Accurate classification of seizure and seizure-free intervals of intracranial EEG signals from epileptic patients | |
| Wu et al. | Automatic epileptic seizures joint detection algorithm based on improved multi-domain feature of cEEG and spike feature of aEEG | |
| Mookiah et al. | Data mining technique for automated diagnosis of glaucoma using higher order spectra and wavelet energy features | |
| Boashash et al. | Principles of time–frequency feature extraction for change detection in non-stationary signals: Applications to newborn EEG abnormality detection | |
| US8577451B2 (en) | System and methods for neurologic monitoring and improving classification and treatment of neurologic states | |
| EP2498676B1 (en) | Brain activity as a marker of disease | |
| US8577106B2 (en) | Ready automated screening, diagnosis and classification technique for alzheimer's disease using magnetic resonance imaging signal from ventricular zone contour of brain | |
| JP2005021176A (en) | Brain activity measuring device | |
| JP6856917B2 (en) | Diagnosis support device, diagnosis support program and diagnosis support method for status epilepticus acute encephalopathy | |
| Sahu | Artificial intelligence system for verification of schizophrenia via theta-EEG rhythm | |
| Moslem et al. | Combining data fusion with multiresolution analysis for improving the classification accuracy of uterine EMG signals | |
| Hernandez et al. | Examining electroencephalogram signatures of people with multiple sclerosis using a nonlinear dynamics approach: a systematic review and bibliographic analysis | |
| Yang et al. | Fusion of eyes-open and eyes-closed electroencephalography in resting state for classification of major depressive disorder | |
| Semiz et al. | Pain assessment and determination methods with wearable sensors: a scoping review | |
| Barriga et al. | Automatic system for diabetic retinopathy screening based on am-fm, partial least squares, and support vector machines | |
| Wei et al. | Analysis of using the tongue deviation angle as a warning sign of a stroke | |
| Khanmohammadi et al. | Localizing focal brain injury via EEG spectral variance | |
| Cheker et al. | Comparative analysis of VEP signals discrimination methods based on time-frequency transformation and CNN-2D | |
| JP5118230B2 (en) | Brain activity measuring device | |
| Khouaja et al. | Enhancing EEG surface resolution by using a combination of kalman filter and interpolation method | |
| CN119296773B (en) | Child neuropsychological development monitoring and management system | |
| Herath et al. | High-performance medicine in cognitive impairment: Brain–computer interfacing for prodromal Alzheimer's disease | |
| Al-Alwani et al. | Brain Stroke Detection Using ANN Based On EEG Signals Using CNN Path |
Legal Events
| Date | Code | Title | Description |
|---|---|---|---|
| PUAI | Public reference made under article 153(3) epc to a published international application that has entered the european phase |
Free format text: ORIGINAL CODE: 0009012 |
|
| 17P | Request for examination filed |
Effective date: 20141118 |
|
| AK | Designated contracting states |
Kind code of ref document: A1 Designated state(s): AL AT BE BG CH CY CZ DE DK EE ES FI FR GB GR HR HU IE IS IT LI LT LU LV MC MK MT NL NO PL PT RO RS SE SI SK SM TR |
|
| AX | Request for extension of the european patent |
Extension state: BA ME |
|
| DAX | Request for extension of the european patent (deleted) | ||
| A4 | Supplementary search report drawn up and despatched |
Effective date: 20161004 |
|
| RIC1 | Information provided on ipc code assigned before grant |
Ipc: A61B 5/0476 20060101AFI20160927BHEP |
|
| GRAP | Despatch of communication of intention to grant a patent |
Free format text: ORIGINAL CODE: EPIDOSNIGR1 |
|
| INTG | Intention to grant announced |
Effective date: 20191031 |
|
| RAP1 | Party data changed (applicant data changed or rights of an application transferred) |
Owner name: NIPRO CORPORATION |
|
| STAA | Information on the status of an ep patent application or granted ep patent |
Free format text: STATUS: THE APPLICATION IS DEEMED TO BE WITHDRAWN |
|
| 18D | Application deemed to be withdrawn |
Effective date: 20200311 |