EP2960806A1 - Detecting an event from time-series data sequences - Google Patents
Detecting an event from time-series data sequences Download PDFInfo
- Publication number
- EP2960806A1 EP2960806A1 EP15174139.4A EP15174139A EP2960806A1 EP 2960806 A1 EP2960806 A1 EP 2960806A1 EP 15174139 A EP15174139 A EP 15174139A EP 2960806 A1 EP2960806 A1 EP 2960806A1
- Authority
- EP
- European Patent Office
- Prior art keywords
- series data
- time
- sample points
- shape
- data sequences
- Prior art date
- Legal status (The legal status is an assumption and is not a legal conclusion. Google has not performed a legal analysis and makes no representation as to the accuracy of the status listed.)
- Granted
Links
Images



Classifications
-
- G—PHYSICS
- G06—COMPUTING OR CALCULATING; COUNTING
- G06F—ELECTRIC DIGITAL DATA PROCESSING
- G06F17/00—Digital computing or data processing equipment or methods, specially adapted for specific functions
- G06F17/10—Complex mathematical operations
- G06F17/18—Complex mathematical operations for evaluating statistical data, e.g. average values, frequency distributions, probability functions, regression analysis
-
- G—PHYSICS
- G06—COMPUTING OR CALCULATING; COUNTING
- G06F—ELECTRIC DIGITAL DATA PROCESSING
- G06F17/00—Digital computing or data processing equipment or methods, specially adapted for specific functions
- G06F17/10—Complex mathematical operations
- G06F17/16—Matrix or vector computation, e.g. matrix-matrix or matrix-vector multiplication, matrix factorization
-
- G—PHYSICS
- G07—CHECKING-DEVICES
- G07C—TIME OR ATTENDANCE REGISTERS; REGISTERING OR INDICATING THE WORKING OF MACHINES; GENERATING RANDOM NUMBERS; VOTING OR LOTTERY APPARATUS; ARRANGEMENTS, SYSTEMS OR APPARATUS FOR CHECKING NOT PROVIDED FOR ELSEWHERE
- G07C5/00—Registering or indicating the working of vehicles
- G07C5/08—Registering or indicating performance data other than driving, working, idle, or waiting time, with or without registering driving, working, idle or waiting time
- G07C5/0808—Diagnosing performance data
Definitions
- the present subject matter described herein in general, relates to detecting an event from time-series data sequences.
- An event can be detected from time-series data sequences using several techniques known in the art.
- the time-series data sequences extracted using a sensor comprise unique signal patterns corresponding to the event.
- the event in case of a vehicle may be an abrupt braking of the vehicle, rapid rise/fall in acceleration/deceleration of the vehicle, change in direction of the vehicle and the like.
- the time series data sequences may be processed using techniques known in the art, for recognizing the unique signal patterns and further identifying the event based on the unique signal patterns.
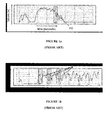
- FIG. 1a shows a time-series data sequence representing speed of the vehicle.
- a window 102 of the time-series data sequence highlights an event related to the vehicle.
- the event may be a hard-stop event related to the vehicle. During the hard-stop event while brakes are applied to the vehicle running at high speeds, the speed of the vehicle may reduce drastically.
- the unique signal pattern present in the time-series data sequence, as illustrated in the window 102, may be identified and thus the hard-stop event related to the vehicle may be determined.
- Figure 1b shows a time-series data sequence representing speed of the vehicle in another case. Further, windows 104 highlight the unique signal patterns indicating the hard-stop events related to the vehicle, where speed of the vehicle reduces drastically.
- a system for detecting an event from time-series data sequences comprises a processor and a memory coupled to the processor for executing a plurality of modules stored in the memory.
- the plurality of modules may comprise a pairing module, a matrix computing module, and a histogram generating and event determining (HGED) module.
- the pairing module may receive the time-series data sequences of variable lengths generated by a plurality of sensors, wherein the time-series data sequences may comprise timestamp information.
- the pairing module may sample the time-series data sequences at a uniform sampling rate, wherein the time-series data sequences may be sampled for generating sample points.
- the pairing module may generate a plurality of pairs of sample points using the sample points such that each sample point is paired with one another.
- the matrix computing module may compute a distance matrix (D) and an angle matrix (A) for one or more pairs of the sample points of the plurality of pairs of sample points.
- the HGED module may generate a two-dimensional (2D) shape histogram for the time-series data sequences using the distance matrix (D) and the angle matrix (A).
- the 2D shape histogram may be of constant dimension and may represent a global distribution of the plurality of pairs of sample points.
- the global distribution of the plurality of pairs of sample points is computed using the distance matrix (D) and the angle matrix (A).
- the HGED module further may concatenate the 2D shape histograms for one or more time-series data sequences based on the timestamp information to generate a concatenated shape histogram. Further, the HGED module may match the concatenated shape histogram with a pre-stored set of shape histograms to detect an event.
- the pre-stored set of shape histograms may comprise shape histograms corresponding to a relevant event.
- a method for detecting an event from time-series data sequences may comprise a step of receiving the time-series data sequences of variable lengths generated by a plurality of sensors, wherein the time-series data sequences may comprise timestamp information.
- the method may comprise sampling the time-series data sequences at a uniform sampling rate for generating sample points.
- the method may further comprise generating a plurality of pairs of sample points using the sample points.
- the plurality of pairs of sample points are generated by pairing each sample point with one another.
- the method may further comprise computing a distance matrix (D) and an angle matrix (A) for one or more pairs of the sample points of the plurality of pairs of sample points.
- the method may further comprise generating two-dimensional (2D) shape histogram for the time-series data sequence using the distance matrix (D) and the angle matrix (A).
- the 2D shape histogram is having a constant dimension, and the 2D shape histogram represents global distribution of the plurality of pairs of sample points, and wherein the global distribution of the plurality of pairs of sample points is computed using the distance matrix (D) and the angle matrix (A).
- the method may further comprise concatenating 2D shape histograms, based on the timestamp information, for one or more time-series data sequence generated by the plurality of sensors, to generate a concatenated shape histogram.
- the method may further comprise matching the concatenated shape histogram with a pre-stored set of shape histograms to detect an event, wherein the pre-stored set of shape histograms comprise shape histograms corresponding to a relevant event. Further, the receiving, the generating, the computing, the concatenating and the matching are performed by a processor.
- a non-transitory computer readable medium embodying a program executable in a computing device for detecting an event from time-series data sequences comprises a program code for receiving the time-series data sequences of variable lengths generated by a plurality of sensors, wherein the time-series data sequences comprise timestamp information.
- the program comprises a program code for sampling the time-series data sequences at a uniform sampling rate, wherein the time-series data sequences are sampled for generating sample points.
- the program further comprises a program code for generating a plurality of pairs of sample points using the sample points such that each sample point is paired with one another.
- the program further comprises a program code for computing a distance matrix (D) and an angle matrix (A) for one or more pairs of the sample points of the plurality of pairs of sample points.
- the program further comprises a program code for generating a two-dimensional (2D) shape histogram for the time-series data sequence using the distance matrix (D) and the angle matrix (A).
- the 2D shape histogram is having a constant dimension and represents global distribution of the plurality of pairs of sample points, and wherein the global distribution of the plurality of pairs of sample points is computed using the distance matrix (D) and the angle matrix (A).
- the program further comprises a program code for concatenating 2D shape histograms for the time-series data sequences based on the timestamp information to generate a concatenated shape histogram.
- the program further comprises a program code for matching the concatenated shape histogram with a pre-stored set of shape histograms to detect an event.
- the event may be detected from the time-series data sequences upon processing the time-series data sequences.
- a plurality of sensors may be used.
- the time-series data sequences generated by the sensors may comprise different waveform characteristics corresponding to the event. Further, the time-series data sequences may be of variable lengths and may also comprise timestamp information.
- the time-series data sequences may be sampled at a uniform sampling rate. Further, the time-series data sequences may be sampled for generating sample points. Further, the sample points may be paired with one another to generate a plurality of pairs of sample points.
- the time-series data sequences may be represented in a two-dimensional (2D) Euclidean space.
- the 2D Euclidean space may be used for computing Euclidean distances between the sample points of the plurality of pairs of sample points.
- the Euclidean distances may be used further for determining a distance matrix.
- the 2D Euclidean space may further be used for computing angles between the sample points of the plurality of pairs of sample points. The angles between the sample points may be used for determining an angle matrix.
- the distance matrix and the angle matrix may be used for determining a global distribution of the plurality of pairs of sample points.
- the global distribution of the plurality of pairs of sample points may represent a 2D shape histogram, wherein the 2D shape histogram may be of constant dimension.
- the 2D shape histogram for the time-series data sequences may be concatenated using a linear concatenation technique for generating a concatenated shape histogram. Further, the timestamp information may be used for concatenating the 2D shape histograms.
- the concatenated shape histogram may further be matched with a pre-stored set of shape histograms, using a Support Vector Machine (SVM) classifier, for recognizing the event.
- SVM Support Vector Machine
- the pre-stored set of shape histograms may comprise 2D shape histograms associated with an identified category of the event.
- the system 202 may facilitate the detection of an event from time-series data sequences.
- the system 202 may employ sensors to capture the time-series data sequences.
- the time-series data sequences may be of variable lengths.
- the time-series data sequences may be sampled at a uniform sampling rate, wherein the time-series data sequences may be sampled for generating sample points.
- the system 202 may compute a global distribution of the plurality of pairs of sample points.
- the global distribution of the plurality of pairs of sample points may represent a 2D shape histogram for a time-series data sequence, wherein the 2D shape histogram may be of constant dimension.
- the system 202 may generate a concatenated shape histogram using the 2D shape histogram for each time-series data sequence.
- the system 202 may generate the concatenated shape histogram using the linear concatenation technique.
- the system 202 may detect the event by matching the concatenated shape histogram with the pre-stored set of shape histograms.
- the pre-stored set of shape histograms may comprise 2D shape histograms corresponding to relevant events.
- system 202 may also be implemented in a variety of computing systems, such as a laptop computer, a desktop computer, a notebook, a workstation, a mainframe computer, a server, a network server, a tablet, a mobile phone, and the like.
- the system 202 may be implemented in a cloud-based environment. It will be understood that the system 202 may be accessed by multiple users through one or more user devices 204-1, 204-2...204-N, collectively referred to as user device 204 hereinafter, or applications residing on the user device 204.
- Examples of the user device 204 may include, but are not limited to, a portable computer with a webcam, a personal digital assistant with a camera, a handheld device with a camera, and a digital camera.
- the user device 204 is communicatively coupled to the system 202 through a network 206.
- the network 206 may be a wireless network, a wired network or a combination thereof.
- the network 206 can be implemented as one of the different types of networks, such as intranet, local area network (LAN), wide area network (WAN), the internet, and the like.
- the network 206 may either be a dedicated network or a shared network.
- the shared network represents an association of the different types of networks that use a variety of protocols, for example, Hypertext Transfer Protocol (HTTP), Transmission Control Protocol/Internet Protocol (TCP/IP), Wireless Application Protocol (WAP), and the like, to communicate with one another.
- the network 206 may include a variety of network devices, including routers, bridges, servers, computing devices, storage devices, and the like.
- the system 202 may include at least one processor 302, an input/output (I/O) interface 304, and a memory 306.
- the at least one processor 302 may be implemented as one or more microprocessors, microcomputers, microcontrollers, digital signal processors, central processing units, state machines, logic circuitries, and/or any devices that manipulate signals based on operational instructions. Further, the at least one processor 302 may comprise a multi-core architecture. Among other capabilities, the at least one processor 302 is configured to fetch and execute computer-readable instructions or modules stored in the memory 306.
- the I/O interface 304 may include a variety of software and hardware interfaces, for example, a web interface, a graphical user interface, and the like.
- the I/O interface 304 may allow the system 202 to interact with a user directly or through the user devices 204. Further, the I/O interface 304 may enable the system 202 to communicate with other computing devices, such as web servers and external data servers (not shown).
- the I/O interface 304 can facilitate multiple communications within a wide variety of networks and protocol types, including wired networks, for example, LAN, cable, etc., and wireless networks, such as WLAN, cellular, or satellite.
- the I/O interface 304 may include one or more ports for connecting a number of devices to one another or to another server.
- the memory 306 may include any computer-readable medium or computer program product known in the art including, for example, volatile memory, such as static random access memory (SRAM) and dynamic random access memory (DRAM), and/or non-volatile memory, such as read only memory (ROM), erasable programmable ROM, flash memories, hard disks, optical disks, a compact disks (CDs), digital versatile disc or digital video disc (DVDs) and magnetic tapes.
- volatile memory such as static random access memory (SRAM) and dynamic random access memory (DRAM)
- non-volatile memory such as read only memory (ROM), erasable programmable ROM, flash memories, hard disks, optical disks, a compact disks (CDs), digital versatile disc or digital video disc (DVDs) and magnetic tapes.
- ROM read only memory
- ROM erasable programmable ROM
- flash memories hard disks, optical disks, a compact disks (CDs), digital versatile disc or digital video disc (DVDs) and magnetic tapes
- the modules 308 include routines, programs, objects, components, data structures, etc., which perform particular tasks or implement particular abstract data types.
- the modules 308 may include a pairing module 310, a matrix computing module 312, a histogram generating and event determining (HGED) module 314, and other modules 316.
- the other modules 316 may include programs or coded instructions that supplement applications and functions of the system 202.
- the data 318 serves as a repository for storing data processed, received, and generated by one or more of the modules 308.
- the data 318 may also include a system database 320, and other data 322.
- the other data 322 may include data generated as a result of the execution of one or more modules in the other modules 316.
- the sensors may be positioned across an environment for detecting events related to the environment.
- the sensors may be positioned across a vehicle for determining the events related to the vehicle.
- the events related to the vehicle may comprise an abrupt braking of the vehicle (hard-stop event), rapid rise/fall in acceleration/deceleration of the vehicle, change in direction of the vehicle, and the like.
- the sensors may capture data related to the event.
- the data captured by the sensors may be represented as time series data sequences.
- the time-series data sequences may comprise timestamp information.
- time-series data sequences may be sampled at a uniform sampling rate wherein the time-series data sequences may be sampled for generating sample points.
- the time-series data sequences captured by the sensors may be of variable lengths such that the time duration of the time-series data sequences may vary.
- the time-series data sequences captured by the sensors (more than one sensor) may be used for determining the event related to the vehicle. The event may be determined accurately as the time-series data sequences from multiple sensors may be used.
- a time-series data sequence S1 captured using a sensor 1 (pressure sensor) for a hard-stop event related to the vehicle is shown in figure 4a .
- x-axis represents time (seconds) and y-axis represents brake cylinder pressure (Pounds per Square Inch, PSI).
- the time-series data sequence S1 represents a brake cylinder pressure of the vehicle during the hard-stop event. Further, the time-series data sequence S1 may include missing signal values during certain time intervals.
- a time-series data sequence S2 captured using a sensor 2 (speed sensor) for the hard-stop event related to the vehicle is shown in figure 4b .
- x-axis represents time (seconds) and y-axis represents speed (Miles per Hour, MPH).
- the time-series data sequence S2 represents a wheel speed of the vehicle, during the hard-stop event. Further, the time-series data sequence S2 may include missing signal values during certain time intervals.
- a time-series data sequence S3 captured using a sensor 3 (gear sensor) for a hard-stop event related to the vehicle is shown in figure 4c .
- x-axis represents time (seconds) and y-axis represents a gear number (numbers, N).
- the time-series data sequence S3 represents a gear number related to the vehicle, during the hard-stop event. Further, the time-series data sequence S3 may include missing signal values during certain time intervals.
- s 1 denotes a positive pressure threshold value
- s 2 denotes a positive speed threshold value
- [s 31 , etc,s 3m ] denotes the gear numbers
- s 2 * denotes a negative speed threshold.
- the positive pressure threshold value may refer to a maximum threshold value of the sensors and the negative speed threshold may refer to a minimum threshold value of the sensors.
- the system 202 may employ the pairing module 310 to receive the time-series data sequences of variable lengths.
- the pairing module 310 may further pair the sample points for generating the plurality of pairs of sample points. Each sample point may be paired with one another to generate the plurality of pairs of sample points.
- the matrix computing module 312 may represent the time-series data sequences in a two-dimensional (2D) Euclidean space, as shown in figure 5 .
- an x-axis represents a time (t) of a time-series data sequence S4 and y-axis denotes value (w) of the time-series data sequence S4.
- the time-series data sequence S4 may comprise a pair of sample points generated between sample points 'q i ' and 'q j '.
- the sample point 'q i ' may be located at (w i , t i ) and the sample point 'q j ' may be located at (w j , t j ) in the 2D Euclidean space.
- the matrix computing module 312 may compute the Euclidean distances for each pair of the plurality of pairs of the sample points.
- the Euclidean distances for each pair of the plurality of pairs of the sample points may be represented as a distance matrix.
- the matrix computing module 312 may normalize the distance matrix by dividing the Euclidean distances present in one or more rows of the distance matrix with a maximum Euclidean distance present in the one or more rows.
- the normalization of the distance matrix may convert the distance matrix into [0, 1] scale.
- the matrix computing module 312 may compute angles between the sample points of the pairs of sample points. For example, an angle ' ⁇ ' between the sample points 'q i ' (origin point) and 'q j ' may be computed, as shown in figure 5 . Similarly, the angles between the sample points of each pair of the plurality of pairs may be computed. The angles between the sample points of each pair of the plurality of pairs may be represented as an angle matrix.
- the matrix computing module 312 may quantize the Euclidean distances and the angles.
- the Euclidean distances and the angles may be quantized for splitting the Euclidean distances and the angles into bins.
- the Euclidean distances maybe represented as [do, d 1 ] U [d 1 , d 2 ] ... U [d m-1 , d m ].
- [do, d 1 ], [d 1 , d 2 ], and [d m-1 , d m ] may represent distance bins.
- angles upon quantizing the angles into 'n' levels the angles may be represented as [ ⁇ 0 , ⁇ 1 ] U [ ⁇ 1 , ⁇ 2 ] ... U [ ⁇ n-1 , ⁇ n ].
- U [ ⁇ n-1 , ⁇ n ] may represent angle bins.
- the system 202 may employ the histogram generating and event determining (HGED) module 314.
- the HGED module 314 may generate a two-dimensional (2D) shape histogram for the time-series data sequence.
- the 2D shape histogram may represent a global distribution of the plurality of pairs of sample points.
- the global distribution of the plurality of pairs of sample points may be computed using the distance matrix (D) and the angle matrix (A).
- the HGED module 314 may compute the global distribution of the plurality of pairs of sample points by computing a shape context of each sample point.
- the shape context may be defined by a distance-angle based distribution of each sample point with respect to other sample points.
- ⁇ ⁇ D i , j ⁇ A i , j ⁇ d p - 1 ⁇ d p ⁇ ⁇ q - 1 ⁇ ⁇ q ⁇ 1 if D i , j ⁇ d p - 1 ⁇ d p , A i , j ⁇ ⁇ q - 1 ⁇ ⁇ q 0 otherwise
- the HGED module 314 may add the shape contexts of the sample points of the plurality of pairs of sample points for computing a cumulative shape histogram (h sum ).
- the cumulative shape histogram may define the global distribution of the plurality of pairs of sample points.
- the bins of the cumulative shape histograms (h sum ) may represent the count of the plurality of pairs of sample points.
- the bin (p, q) may represent the count of the plurality of pairs of sample points arranged within the Euclidean distance [d p-1 , d p ] and within the angle [ ⁇ q-1 , ⁇ q ].
- the HGED module 314 may divide cumulative histogram (h sum ) by a maximum entry for generating the 2D shape histogram.
- the HGED module 314 may generate the 2D shape histogram corresponding to the each time-series data sequence generated by the plurality of sensors, wherein the 2D shape histogram may be of constant dimension.
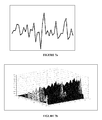
- Figure 6a illustrates an example of the time-series data sequence S5 and Figure 6b illustrates the 2D shape histogram corresponding to the time-series data sequence S5 generated by the system 202.
- the number of distance bins (m) is considered as 40 and number of angle bins (n) is considered as 36.
- Figure 7a illustrates an example of the time-series data sequence S6 and Figure 7b illustrates the 2D shape histogram corresponding to the time-series data sequence S6 generated by the system 202.
- the number of distance bins (m) is considered as 40 and number of angle bins (n) is considered as 36.
- the HGED module 314 may concatenate the 2D shape histogram for each time-series data sequence based on the timestamp information for generating a concatenated shape histogram. Further, the 2D shape histograms for the time-series data sequences comprising proximate timestamp information may be concatenated for generating the concatenated shape histogram.
- the HGED module 314 may employ a linear concatenation technique for generating the concatenated shape histogram. The HGED module 314 may bring together the bins of the shape histograms and may increase the number of dimensions of the feature vector.
- the HGED module 314 may convert the distance matrix and the angle matrix of the 2D shape histogram corresponding to the time-series data sequence S5 into one-dimensional (1D) vectors.
- the HGED module 314 may also convert the distance matrix and the angle matrix of the 2D shape histogram corresponding to the time-series data sequence S6 into one-dimensional (1D) vectors.
- the HGED module 314 may adjoin the 1D vectors of the time-series data sequence S5 with the 1D vectors of the time-series data sequence S6.
- the HGED module 314 may adjoin the 1D vectors for employing a linear concatenation technique. Upon employing the linear concatenation technique by the HGED module 314, a concatenated shape histogram may be generated by the HGED module 314.
- the 2D shape histogram for the time-series data sequences derived from sensors employed in the vehicle/environment may be concatenated by the HGED module 314. Concatenating the 2D shape histogram for the time-series data sequences may bring together the discriminating features of the 2D shape histogram for the time-series data sequences. Thus, concatenating the 2D shape histogram for the time-series data sequences may improve the accuracy of detecting the event related to the vehicle/environment.
- the HGED module 314 may match the concatenated shape histogram with a pre-stored set of shape histograms for detecting the event.
- the pre-stored set of shape histograms may comprise shape histograms corresponding to relevant events.
- the HGED module 314 may match the concatenated shape histogram with the pre-stored set of shape histograms using a Support Vector Machine (SVM) classifier.
- SVM Support Vector Machine
- the HGED module 314 may use Radial Basis Function (RBF) kernel with the SVM classifier for matching the concatenated shape histogram with the pre-stored set of shape histograms.
- RBF Radial Basis Function
- the method 800 may be described in the general context of computer executable instructions.
- computer executable instructions can include routines, programs, objects, components, data structures, procedures, modules, functions, etc., that perform particular functions or implement particular abstract data types.
- the method 800 may also be practiced in a distributed computing environment where functions are performed by remote processing devices that are linked through a communications network.
- computer executable instructions may be located in both local and remote computer storage media, including memory storage devices.
- the order in which the method 800 is described is not intended to be construed as a limitation, and any number of the described method blocks can be combined in any order to implement the method 800 or alternate methods. Additionally, individual blocks may be deleted from the method 800 without departing from the spirit and scope of the subject matter described herein. Furthermore, the method 800 can be implemented in any suitable hardware, software, firmware, or combination thereof. However, for ease of explanation, in the embodiments described below, the method 800 may be considered to be implemented in the above described system 202.
- the time-series data sequences related to an event are received. Further, the step of receiving time-series data sequences related to the event may be performed by a processor.
- the time-series data sequences are sampled.
- the time-series data sequences are sampled for generating sample points. Further, the step of sampling the time-series data sequences may be performed by a processor.
- the pairs of sample points are generated. Further, each of the sample point may be paired with one another. Further, the step of generating pairs of sample points is performed by the processor.
- the distance matrix and the angle matrix are computed. Further the distance matrix and the angle matrix are computed in a 2D Euclidean space. Further, the step of computing the distance matrix and the angle matrix is performed by the processor.
- the 2D shape histogram for the time-series data sequences are generated, wherein the 2D shape histogram for the time-series data sequences represent global distribution of the plurality of pairs of sample points.
- the global distribution of the plurality of pairs of sample points is computed using the distance matrix (D) and the angle matrix (A). Further, the step of generating the 2D shape histograms is performed by the processor.
- the 2D shape histogram for the time-series data sequences are concatenated. Further, the 2D shape histogram for the time-series data sequences are concatenated using a linear concatenation technique for generating a concatenated shape histogram. Further, the step of concatenating the 2D shape histogram for the time-series data sequences is performed by the processor.
- the concatenated shape histogram is matched with a pre-stored set of histograms for determining the event. Further, the step of matching the concatenated shape histogram with the pre-stored shape histograms, for determining the event, is performed by the processor.
Landscapes
- Engineering & Computer Science (AREA)
- Physics & Mathematics (AREA)
- General Physics & Mathematics (AREA)
- Data Mining & Analysis (AREA)
- Mathematical Physics (AREA)
- Computational Mathematics (AREA)
- Theoretical Computer Science (AREA)
- Mathematical Analysis (AREA)
- Mathematical Optimization (AREA)
- Pure & Applied Mathematics (AREA)
- Software Systems (AREA)
- Databases & Information Systems (AREA)
- Algebra (AREA)
- General Engineering & Computer Science (AREA)
- Operations Research (AREA)
- Life Sciences & Earth Sciences (AREA)
- Bioinformatics & Cheminformatics (AREA)
- Bioinformatics & Computational Biology (AREA)
- Evolutionary Biology (AREA)
- Probability & Statistics with Applications (AREA)
- Computing Systems (AREA)
- Length Measuring Devices With Unspecified Measuring Means (AREA)
- Testing Or Calibration Of Command Recording Devices (AREA)
- Information Retrieval, Db Structures And Fs Structures Therefor (AREA)
- Regulating Braking Force (AREA)
- Image Analysis (AREA)
- Traffic Control Systems (AREA)
Abstract
Description
- The present application claims priority from Indian patent application
2074/MUM/2014 filed on 26th June 2014 - The present subject matter described herein, in general, relates to detecting an event from time-series data sequences.
- An event can be detected from time-series data sequences using several techniques known in the art. Generally the time-series data sequences extracted using a sensor comprise unique signal patterns corresponding to the event. For example, the event in case of a vehicle may be an abrupt braking of the vehicle, rapid rise/fall in acceleration/deceleration of the vehicle, change in direction of the vehicle and the like. The time series data sequences may be processed using techniques known in the art, for recognizing the unique signal patterns and further identifying the event based on the unique signal patterns.
- Referring to
figure 1a and figure 1b , the time-series data sequences captured using the sensor are illustrated, wherein x-axis represents time in seconds and y-axis represents values of speed. Thefigure 1a shows a time-series data sequence representing speed of the vehicle. Awindow 102 of the time-series data sequence highlights an event related to the vehicle. The event may be a hard-stop event related to the vehicle. During the hard-stop event while brakes are applied to the vehicle running at high speeds, the speed of the vehicle may reduce drastically. The unique signal pattern present in the time-series data sequence, as illustrated in thewindow 102, may be identified and thus the hard-stop event related to the vehicle may be determined.Figure 1b shows a time-series data sequence representing speed of the vehicle in another case. Further, windows 104 highlight the unique signal patterns indicating the hard-stop events related to the vehicle, where speed of the vehicle reduces drastically. - This summary is provided to introduce aspects related to systems and methods for detecting an event from time-series data sequences and the aspects are further described below in the detailed description. This summary is not intended to identify essential features of subject matter nor is it intended for use in determining or limiting the scope of the subject matter.
- In one implementation, a system for detecting an event from time-series data sequences is disclosed. The system comprises a processor and a memory coupled to the processor for executing a plurality of modules stored in the memory. The plurality of modules may comprise a pairing module, a matrix computing module, and a histogram generating and event determining (HGED) module. The pairing module may receive the time-series data sequences of variable lengths generated by a plurality of sensors, wherein the time-series data sequences may comprise timestamp information. The pairing module may sample the time-series data sequences at a uniform sampling rate, wherein the time-series data sequences may be sampled for generating sample points. The pairing module may generate a plurality of pairs of sample points using the sample points such that each sample point is paired with one another. Further, the matrix computing module may compute a distance matrix (D) and an angle matrix (A) for one or more pairs of the sample points of the plurality of pairs of sample points. Further, the HGED module may generate a two-dimensional (2D) shape histogram for the time-series data sequences using the distance matrix (D) and the angle matrix (A). The 2D shape histogram may be of constant dimension and may represent a global distribution of the plurality of pairs of sample points. The global distribution of the plurality of pairs of sample points is computed using the distance matrix (D) and the angle matrix (A). The HGED module further may concatenate the 2D shape histograms for one or more time-series data sequences based on the timestamp information to generate a concatenated shape histogram. Further, the HGED module may match the concatenated shape histogram with a pre-stored set of shape histograms to detect an event. The pre-stored set of shape histograms may comprise shape histograms corresponding to a relevant event.
- In another implementation, a method for detecting an event from time-series data sequences is disclosed. The method may comprise a step of receiving the time-series data sequences of variable lengths generated by a plurality of sensors, wherein the time-series data sequences may comprise timestamp information. The method may comprise sampling the time-series data sequences at a uniform sampling rate for generating sample points. The method may further comprise generating a plurality of pairs of sample points using the sample points. The plurality of pairs of sample points are generated by pairing each sample point with one another. The method may further comprise computing a distance matrix (D) and an angle matrix (A) for one or more pairs of the sample points of the plurality of pairs of sample points. The method may further comprise generating two-dimensional (2D) shape histogram for the time-series data sequence using the distance matrix (D) and the angle matrix (A). The 2D shape histogram is having a constant dimension, and the 2D shape histogram represents global distribution of the plurality of pairs of sample points, and wherein the global distribution of the plurality of pairs of sample points is computed using the distance matrix (D) and the angle matrix (A). The method may further comprise concatenating 2D shape histograms, based on the timestamp information, for one or more time-series data sequence generated by the plurality of sensors, to generate a concatenated shape histogram. The method may further comprise matching the concatenated shape histogram with a pre-stored set of shape histograms to detect an event, wherein the pre-stored set of shape histograms comprise shape histograms corresponding to a relevant event. Further, the receiving, the generating, the computing, the concatenating and the matching are performed by a processor.
- Yet in another implementation, a non-transitory computer readable medium embodying a program executable in a computing device for detecting an event from time-series data sequences is disclosed. The program comprises a program code for receiving the time-series data sequences of variable lengths generated by a plurality of sensors, wherein the time-series data sequences comprise timestamp information. The program comprises a program code for sampling the time-series data sequences at a uniform sampling rate, wherein the time-series data sequences are sampled for generating sample points. The program further comprises a program code for generating a plurality of pairs of sample points using the sample points such that each sample point is paired with one another. The program further comprises a program code for computing a distance matrix (D) and an angle matrix (A) for one or more pairs of the sample points of the plurality of pairs of sample points. The program further comprises a program code for generating a two-dimensional (2D) shape histogram for the time-series data sequence using the distance matrix (D) and the angle matrix (A). The 2D shape histogramis having a constant dimension and represents global distribution of the plurality of pairs of sample points, and wherein the global distribution of the plurality of pairs of sample points is computed using the distance matrix (D) and the angle matrix (A). The program further comprises a program code for concatenating 2D shape histograms for the time-series data sequences based on the timestamp information to generate a concatenated shape histogram. The program further comprises a program code for matching the concatenated shape histogram with a pre-stored set of shape histograms to detect an event.
- The detailed description is described with reference to the accompanying figures. In the figures, the left-most digit(s) of a reference number identifies the figure in which the reference number first appears. The same numbers are used throughout the drawings to refer like features and components.
-
Figure 2 illustrates a network implementation of a system for detecting an event from time-series data sequences, in accordance with an embodiment of the present subject matter. -
Figure 3 illustrates the system ofFigure 2 , in accordance with an embodiment of the present subject matter. -
Figure 4a illustrates a time-series data sequence S1 captured using a sensor 1 (pressure sensor), in accordance with an embodiment of the present subject matter. -
Figure 4b illustrates a time-series data sequence S2 captured using a sensor 2 (speed sensor), in accordance with an embodiment of the present subject matter. -
Figure 4c illustrates a time-series data sequence S3 captured using a sensor 3 (gear sensor), in accordance with an embodiment of the present subject matter. -
Figure 5 illustrates a time-series data sequence S4 represented in two-dimensional (2D) Euclidean space. -
Figure 6a illustrates a time-series data sequence S5 captured using a sensor. -
Figure 6b illustrates the 2D shape histogram corresponding to the time-series data sequence S5. -
Figure 7a illustrates a time-series data sequence S6 captured using a sensor. -
Figure 7b illustrates the 2D shape histogram corresponding to the time-series data sequence S6. -
Figure 8 shows a flowchart illustrating a method for detecting an event from time-series data sequences, in accordance with an embodiment of the present subject matter. - Systems and methods for detecting an event from time-series data sequences are described. The event may be detected from the time-series data sequences upon processing the time-series data sequences. In order to generate the time-series data sequences related to the event, a plurality of sensors may be used. The time-series data sequences generated by the sensors may comprise different waveform characteristics corresponding to the event. Further, the time-series data sequences may be of variable lengths and may also comprise timestamp information.
- The time-series data sequences may be sampled at a uniform sampling rate. Further, the time-series data sequences may be sampled for generating sample points. Further, the sample points may be paired with one another to generate a plurality of pairs of sample points.
- The time-series data sequences may be represented in a two-dimensional (2D) Euclidean space. The 2D Euclidean space may be used for computing Euclidean distances between the sample points of the plurality of pairs of sample points. The Euclidean distances may be used further for determining a distance matrix. The 2D Euclidean space may further be used for computing angles between the sample points of the plurality of pairs of sample points. The angles between the sample points may be used for determining an angle matrix.
- The distance matrix and the angle matrix may be used for determining a global distribution of the plurality of pairs of sample points. The global distribution of the plurality of pairs of sample points may represent a 2D shape histogram, wherein the 2D shape histogram may be of constant dimension. The 2D shape histogram for the time-series data sequences may be concatenated using a linear concatenation technique for generating a concatenated shape histogram. Further, the timestamp information may be used for concatenating the 2D shape histograms.
- The concatenated shape histogram may further be matched with a pre-stored set of shape histograms, using a Support Vector Machine (SVM) classifier, for recognizing the event. The pre-stored set of shape histograms may comprise 2D shape histograms associated with an identified category of the event.
- While aspects of described system and method for detecting an event from time-series data sequences may be implemented in any number of different computing systems, environments, and/or configurations, the embodiments are described in the context of the following exemplary system.
- Referring to
Figure 2 , anetwork implementation 200 of asystem 202 for detecting an event from time-series data sequences is illustrated, in accordance with an embodiment of the present subject matter. In one embodiment, thesystem 202 may facilitate the detection of an event from time-series data sequences. At first, thesystem 202 may employ sensors to capture the time-series data sequences. The time-series data sequences may be of variable lengths. The time-series data sequences may be sampled at a uniform sampling rate, wherein the time-series data sequences may be sampled for generating sample points. Thesystem 202 may compute a global distribution of the plurality of pairs of sample points. The global distribution of the plurality of pairs of sample points may represent a 2D shape histogram for a time-series data sequence, wherein the 2D shape histogram may be of constant dimension. Thesystem 202 may generate a concatenated shape histogram using the 2D shape histogram for each time-series data sequence. Thesystem 202 may generate the concatenated shape histogram using the linear concatenation technique. Finally, thesystem 202 may detect the event by matching the concatenated shape histogram with the pre-stored set of shape histograms. The pre-stored set of shape histograms may comprise 2D shape histograms corresponding to relevant events. - Although the present subject matter is explained considering that the
system 202 is implemented for detecting the event from the time-series data sequences, it may be understood that thesystem 202 may also be implemented in a variety of computing systems, such as a laptop computer, a desktop computer, a notebook, a workstation, a mainframe computer, a server, a network server, a tablet, a mobile phone, and the like. In one embodiment, thesystem 202 may be implemented in a cloud-based environment. It will be understood that thesystem 202 may be accessed by multiple users through one or more user devices 204-1, 204-2...204-N, collectively referred to asuser device 204 hereinafter, or applications residing on theuser device 204. Examples of theuser device 204 may include, but are not limited to, a portable computer with a webcam, a personal digital assistant with a camera, a handheld device with a camera, and a digital camera. Theuser device 204 is communicatively coupled to thesystem 202 through anetwork 206. - In one implementation, the
network 206 may be a wireless network, a wired network or a combination thereof. Thenetwork 206 can be implemented as one of the different types of networks, such as intranet, local area network (LAN), wide area network (WAN), the internet, and the like. Thenetwork 206 may either be a dedicated network or a shared network. The shared network represents an association of the different types of networks that use a variety of protocols, for example, Hypertext Transfer Protocol (HTTP), Transmission Control Protocol/Internet Protocol (TCP/IP), Wireless Application Protocol (WAP), and the like, to communicate with one another. Further thenetwork 206 may include a variety of network devices, including routers, bridges, servers, computing devices, storage devices, and the like. - Referring now to
Figure 3 , thesystem 202 is illustrated in accordance with an embodiment of the present subject matter. In one embodiment, thesystem 202 may include at least oneprocessor 302, an input/output (I/O)interface 304, and amemory 306. The at least oneprocessor 302 may be implemented as one or more microprocessors, microcomputers, microcontrollers, digital signal processors, central processing units, state machines, logic circuitries, and/or any devices that manipulate signals based on operational instructions. Further, the at least oneprocessor 302 may comprise a multi-core architecture. Among other capabilities, the at least oneprocessor 302 is configured to fetch and execute computer-readable instructions or modules stored in thememory 306. - The I/
O interface 304 may include a variety of software and hardware interfaces, for example, a web interface, a graphical user interface, and the like. The I/O interface 304 may allow thesystem 202 to interact with a user directly or through theuser devices 204. Further, the I/O interface 304 may enable thesystem 202 to communicate with other computing devices, such as web servers and external data servers (not shown). The I/O interface 304 can facilitate multiple communications within a wide variety of networks and protocol types, including wired networks, for example, LAN, cable, etc., and wireless networks, such as WLAN, cellular, or satellite. The I/O interface 304 may include one or more ports for connecting a number of devices to one another or to another server. - The
memory 306 may include any computer-readable medium or computer program product known in the art including, for example, volatile memory, such as static random access memory (SRAM) and dynamic random access memory (DRAM), and/or non-volatile memory, such as read only memory (ROM), erasable programmable ROM, flash memories, hard disks, optical disks, a compact disks (CDs), digital versatile disc or digital video disc (DVDs) and magnetic tapes. Thememory 306 may includemodules 308 anddata 318. - The
modules 308 include routines, programs, objects, components, data structures, etc., which perform particular tasks or implement particular abstract data types. In one implementation, themodules 308 may include apairing module 310, amatrix computing module 312, a histogram generating and event determining (HGED)module 314, andother modules 316. Theother modules 316 may include programs or coded instructions that supplement applications and functions of thesystem 202. - The
data 318, amongst other things, serves as a repository for storing data processed, received, and generated by one or more of themodules 308. Thedata 318 may also include a system database 320, andother data 322. Theother data 322 may include data generated as a result of the execution of one or more modules in theother modules 316. - In one implementation, at first, the sensors may be positioned across an environment for detecting events related to the environment. For example, the sensors may be positioned across a vehicle for determining the events related to the vehicle. The events related to the vehicle may comprise an abrupt braking of the vehicle (hard-stop event), rapid rise/fall in acceleration/deceleration of the vehicle, change in direction of the vehicle, and the like. The sensors may capture data related to the event. The data captured by the sensors may be represented as time series data sequences. The time-series data sequences may comprise timestamp information.
- Further, the time-series data sequences may be sampled at a uniform sampling rate wherein the time-series data sequences may be sampled for generating sample points. The time-series data sequences captured by the sensors may be of variable lengths such that the time duration of the time-series data sequences may vary. Thus, the time-series data sequences captured by the sensors (more than one sensor) may be used for determining the event related to the vehicle. The event may be determined accurately as the time-series data sequences from multiple sensors may be used.
- In an example, a time-series data sequence S1 captured using a sensor 1 (pressure sensor) for a hard-stop event related to the vehicle is shown in
figure 4a . Infigure 4a , x-axis represents time (seconds) and y-axis represents brake cylinder pressure (Pounds per Square Inch, PSI). The time-series data sequence S1 represents a brake cylinder pressure of the vehicle during the hard-stop event. Further, the time-series data sequence S1 may include missing signal values during certain time intervals. - In an example, a time-series data sequence S2 captured using a sensor 2 (speed sensor) for the hard-stop event related to the vehicle is shown in
figure 4b . Infigure 4b , x-axis represents time (seconds) and y-axis represents speed (Miles per Hour, MPH). The time-series data sequence S2 represents a wheel speed of the vehicle, during the hard-stop event. Further, the time-series data sequence S2 may include missing signal values during certain time intervals. - In an example, a time-series data sequence S3 captured using a sensor 3 (gear sensor) for a hard-stop event related to the vehicle is shown in
figure 4c . Infigure 4c , x-axis represents time (seconds) and y-axis represents a gear number (numbers, N). The time-series data sequence S3 represents a gear number related to the vehicle, during the hard-stop event. Further, the time-series data sequence S3 may include missing signal values during certain time intervals. - In an example, a signal pattern representing the hard-stop event of the vehicle may be determined using the
sensor 1, thesensor 2, and the sensor 3 upon applying apredefined rule 1, as mentioned below,
- Here, s1 denotes a positive pressure threshold value, s2 denotes a positive speed threshold value, [s31,.....,s3m] denotes the gear numbers, and s2* denotes a negative speed threshold. The positive pressure threshold value may refer to a maximum threshold value of the sensors and the negative speed threshold may refer to a minimum threshold value of the sensors.
- In another example, extreme boundaries (left boundary and right boundary) of the signal pattern indicative of the event may be defined by a
rule 2, as mentioned below,
- Post capturing the time-series data sequences of variable lengths by the sensors, the
system 202 may employ thepairing module 310 to receive the time-series data sequences of variable lengths. Thepairing module 310 may further pair the sample points for generating the plurality of pairs of sample points. Each sample point may be paired with one another to generate the plurality of pairs of sample points. The number of pairs (P) of sample points generated for a time-series data sequence 'S' comprising 'L' number of sample points may be calculated using an below mentionedequation 1,
- After determining the pairs of sample points, the
matrix computing module 312 may represent the time-series data sequences in a two-dimensional (2D) Euclidean space, as shown infigure 5 . According tofigure 5 an x-axis represents a time (t) of a time-series data sequence S4 and y-axis denotes value (w) of the time-series data sequence S4. The time-series data sequence S4 may comprise a pair of sample points generated between sample points 'qi' and 'qj'. The sample point 'qi' may be located at (wi, ti) and the sample point 'qj' may be located at (wj, tj) in the 2D Euclidean space. Thematrix computing module 312 may compute the Euclidean distance (d) between the sample points 'qi' and 'qj' present in the pair of sample points 'qi- qj', in the 2D Euclidean space using a below mentionedequation 2,
- Similarly, the
matrix computing module 312 may compute the Euclidean distances for each pair of the plurality of pairs of the sample points. The Euclidean distances for each pair of the plurality of pairs of the sample points may be represented as a distance matrix. - Post computing the distance matrix, the
matrix computing module 312 may normalize the distance matrix by dividing the Euclidean distances present in one or more rows of the distance matrix with a maximum Euclidean distance present in the one or more rows. The normalization of the distance matrix may convert the distance matrix into [0, 1] scale. - Further, the
matrix computing module 312 may compute angles between the sample points of the pairs of sample points. For example, an angle 'θ' between the sample points 'qi' (origin point) and 'qj' may be computed, as shown infigure 5 . Similarly, the angles between the sample points of each pair of the plurality of pairs may be computed. The angles between the sample points of each pair of the plurality of pairs may be represented as an angle matrix. - Post determining the distance matrix and the angle matrix, the
matrix computing module 312 may quantize the Euclidean distances and the angles. The Euclidean distances and the angles may be quantized for splitting the Euclidean distances and the angles into bins. Thus, in an example, upon quantizing the Euclidean distances into 'm' levels, the Euclidean distances maybe represented as [do, d1] U [d1, d2] ... U [dm-1, dm]. Here [do, d1], [d1, d2], and [dm-1, dm] may represent distance bins. Similarly, in an example, upon quantizing the angles into 'n' levels the angles may be represented as [α0, α1] U [α1, α2] ... U [αn-1, αn]. Here [α0, α1] U [α1, α2] ... U [αn-1, αn] may represent angle bins. - After employing the
matrix computing module 312, thesystem 202 may employ the histogram generating and event determining (HGED)module 314. TheHGED module 314 may generate a two-dimensional (2D) shape histogram for the time-series data sequence. The 2D shape histogram may represent a global distribution of the plurality of pairs of sample points. The global distribution of the plurality of pairs of sample points may be computed using the distance matrix (D) and the angle matrix (A). TheHGED module 314 may compute the global distribution of the plurality of pairs of sample points by computing a shape context of each sample point. The shape context may be defined by a distance-angle based distribution of each sample point with respect to other sample points. In an example, theHGED module 314 may compute the bin (p, q) of the shape context (hi) of a sample point 'qi' using a below mentioned equation 3,
Here,
- The
HGED module 314 may add the shape contexts of the sample points of the plurality of pairs of sample points for computing a cumulative shape histogram (hsum). The cumulative shape histogram may define the global distribution of the plurality of pairs of sample points. The bins of the cumulative shape histograms (hsum) may represent the count of the plurality of pairs of sample points. In one example, the bin (p, q) may represent the count of the plurality of pairs of sample points arranged within the Euclidean distance [dp-1, dp] and within the angle [αq-1, αq]. Further, theHGED module 314 may divide cumulative histogram (hsum) by a maximum entry for generating the 2D shape histogram. Further, theHGED module 314 may generate the 2D shape histogram corresponding to the each time-series data sequence generated by the plurality of sensors, wherein the 2D shape histogram may be of constant dimension. -
Figure 6a illustrates an example of the time-series data sequence S5 andFigure 6b illustrates the 2D shape histogram corresponding to the time-series data sequence S5 generated by thesystem 202. Here, the number of distance bins (m) is considered as 40 and number of angle bins (n) is considered as 36. -
Figure 7a illustrates an example of the time-series data sequence S6 andFigure 7b illustrates the 2D shape histogram corresponding to the time-series data sequence S6 generated by thesystem 202. Here, the number of distance bins (m) is considered as 40 and number of angle bins (n) is considered as 36. - Post generating the 2D shape histogram for the time-series data sequence generated by the plurality of sensors, the
HGED module 314 may concatenate the 2D shape histogram for each time-series data sequence based on the timestamp information for generating a concatenated shape histogram. Further, the 2D shape histograms for the time-series data sequences comprising proximate timestamp information may be concatenated for generating the concatenated shape histogram. TheHGED module 314 may employ a linear concatenation technique for generating the concatenated shape histogram. TheHGED module 314 may bring together the bins of the shape histograms and may increase the number of dimensions of the feature vector. In an example, theHGED module 314 may convert the distance matrix and the angle matrix of the 2D shape histogram corresponding to the time-series data sequence S5 into one-dimensional (1D) vectors. TheHGED module 314 may also convert the distance matrix and the angle matrix of the 2D shape histogram corresponding to the time-series data sequence S6 into one-dimensional (1D) vectors. Further, theHGED module 314 may adjoin the 1D vectors of the time-series data sequence S5 with the 1D vectors of the time-series data sequence S6. TheHGED module 314 may adjoin the 1D vectors for employing a linear concatenation technique. Upon employing the linear concatenation technique by theHGED module 314, a concatenated shape histogram may be generated by theHGED module 314. - Thus, the 2D shape histogram for the time-series data sequences derived from sensors employed in the vehicle/environment, may be concatenated by the
HGED module 314. Concatenating the 2D shape histogram for the time-series data sequences may bring together the discriminating features of the 2D shape histogram for the time-series data sequences. Thus, concatenating the 2D shape histogram for the time-series data sequences may improve the accuracy of detecting the event related to the vehicle/environment. - Further, the
HGED module 314 may match the concatenated shape histogram with a pre-stored set of shape histograms for detecting the event. The pre-stored set of shape histograms may comprise shape histograms corresponding to relevant events. In an example, theHGED module 314 may match the concatenated shape histogram with the pre-stored set of shape histograms using a Support Vector Machine (SVM) classifier. However, in a case, theHGED module 314 may use Radial Basis Function (RBF) kernel with the SVM classifier for matching the concatenated shape histogram with the pre-stored set of shape histograms. Upon determining a successful match of the concatenated shape histogram, theHGED module 314 may determine the event. - Referring now to
Figure 8 , the method for detecting an event from time-series data sequences, in accordance with an embodiment of the present subject matter. Themethod 800 may be described in the general context of computer executable instructions. Generally, computer executable instructions can include routines, programs, objects, components, data structures, procedures, modules, functions, etc., that perform particular functions or implement particular abstract data types. Themethod 800 may also be practiced in a distributed computing environment where functions are performed by remote processing devices that are linked through a communications network. In a distributed computing environment, computer executable instructions may be located in both local and remote computer storage media, including memory storage devices. - The order in which the
method 800 is described is not intended to be construed as a limitation, and any number of the described method blocks can be combined in any order to implement themethod 800 or alternate methods. Additionally, individual blocks may be deleted from themethod 800 without departing from the spirit and scope of the subject matter described herein. Furthermore, themethod 800 can be implemented in any suitable hardware, software, firmware, or combination thereof. However, for ease of explanation, in the embodiments described below, themethod 800 may be considered to be implemented in the above describedsystem 202. - At
block 802, the time-series data sequences related to an event are received. Further, the step of receiving time-series data sequences related to the event may be performed by a processor. - At
block 804, the time-series data sequences are sampled. The time-series data sequences are sampled for generating sample points. Further, the step of sampling the time-series data sequences may be performed by a processor. - At
block 806, the pairs of sample points are generated. Further, each of the sample point may be paired with one another. Further, the step of generating pairs of sample points is performed by the processor. - At
block 808, the distance matrix and the angle matrix are computed. Further the distance matrix and the angle matrix are computed in a 2D Euclidean space. Further, the step of computing the distance matrix and the angle matrix is performed by the processor. - At
block 810, the 2D shape histogram for the time-series data sequences are generated, wherein the 2D shape histogram for the time-series data sequences represent global distribution of the plurality of pairs of sample points. The global distribution of the plurality of pairs of sample points is computed using the distance matrix (D) and the angle matrix (A). Further, the step of generating the 2D shape histograms is performed by the processor. - At
block 812, the 2D shape histogram for the time-series data sequences are concatenated. Further, the 2D shape histogram for the time-series data sequences are concatenated using a linear concatenation technique for generating a concatenated shape histogram. Further, the step of concatenating the 2D shape histogram for the time-series data sequences is performed by the processor. - At
block 814, the concatenated shape histogram is matched with a pre-stored set of histograms for determining the event. Further, the step of matching the concatenated shape histogram with the pre-stored shape histograms, for determining the event, is performed by the processor. - Although implementations for detecting an event from time-series data sequences have been described in language specific to structural features and/or methods, it is to be understood that the appended claims are not necessarily limited to the specific features or methods described. Rather, the specific features and methods are disclosed as examples of implementations for monitoring the user activities on the software application external to an organization.
Claims (15)
- A method for detecting an event from time-series data sequences, the method comprising:receiving, by a processor, the time-series data sequences of variable lengths, generated by a plurality of sensors, wherein the time-series data sequences comprise timestamp information;sampling the time-series data sequences at a uniform sampling rate for generating sample points;generating, by the processor, a plurality of pairs of sample points using the sample points, wherein the plurality of pairs of sample points are generated by pairing each sample point with one another;computing, by the processor, a distance matrix (D) and an angle matrix (A) for one or more pairs of the sample points of the plurality of pairs of sample points;generating, by the processor, a two-dimensional (2D) shape histogram for the time-series data sequences using the distance matrix (D) and the angle matrix (A), wherein the 2D shape histogram have a constant dimension and the 2D shape histogram represents a global distribution of the plurality of pairs of sample points,;concatenating, by the processor, the 2D shape histograms for one or more time-series data sequences based on the timestamp information to generate a concatenated shape histogram; andmatching, by the processor, the concatenated shape histogram with a pre-stored set of shape histograms to detect an event.
- The method of claim 1, wherein the distance matrix (D) is computed by calculating Euclidean distances between the sample points present in the pairs of the sample points, and wherein the Euclidean distances are computed in a two-dimensional Euclidean space.
- The method of claim 1, wherein the angle matrix (A) is computed by calculating angles between the sample points present in the pairs of the sample points, and wherein the angles are computed in a two-dimensional Euclidean space.
- The method of claim 2 further comprising normalizing the distance matrix (D) by dividing the Euclidean distances of one or more rows with a maximum Euclidean distance of the one or more rows.
- The method of claim 1, wherein the 2D shape histograms for the one or more time-series data sequences comprising proximate timestamp information are concatenated to generate the concatenated shape histogram, and concatenating of the 2D shape histograms brings together discriminating features of the 2D shape histograms for the one or more time-series data sequences.
- The method of claim 1, wherein the concatenated shape histogram is generated by converting the distance matrix (D) and the angle matrix (A) into one-dimensional vectors and merging the one-dimensional (1D) vectors.
- The method of claim 1, wherein the concatenated shape histogram is matched with the pre-stored set of shape histograms using a Support Vector Machine (SVM) classifier.
- The method of claim 1, wherein the pre-stored set of shape histograms comprise shape histograms corresponding to a relevant event.
- A system for detecting an event from time-series data sequences, the system comprising:a processor 302;a memory 306 coupled to the processor 302, wherein the processor 302 is capable for executing a plurality of modules 308 stored in the memory, and wherein the plurality of modules 308 comprising:a pairing module 310,to receive the time-series data sequences of variable lengths generated by a plurality of sensors, wherein the time-series data sequences comprise timestamp information;to sample the time-series data sequences at a uniform sampling rate for generating sample points;to generate a plurality of pairs of sample points using the sample points such that each sample point is paired with one another; a matrix computing module 312,to compute a distance matrix (D) and an angle matrix (A) for one or more pairs of the sample points of the plurality of pairs of sample points;a histogram generating and event determining (HGED) module 314,to generate a two-dimensional (2D) shape histogram for the time-series data sequences using the distance matrix (D) and the angle matrix (A), wherein the 2D shape histogram have a constant dimension, and the 2D shape histogram represents global distribution of the plurality of pairs of sample points;to concatenate the 2D shape histograms for one or more time-series data sequences based on the timestamp information to generate a concatenated shape histogram; andto match the concatenated shape histogram with a pre-stored set of shape histograms to detect an event.
- The system of claim 9, wherein the distance matrix (D) is computed by calculating Euclidean distances between the sample points present in the pairs of the sample points, and wherein the Euclidean distances are computed in a two-dimensional Euclidean space.
- The system of claim 9, wherein the angle matrix (A) is computed by calculating angles between the sample points present in the pairs of the sample points, and wherein the angles are computed in a two-dimensional Euclidean space.
- The system of claim 10, wherein the matrix computing module 312 further normalizes the distance matrix (D) by dividing the Euclidean distances of one or more rows with a maximum Euclidean distance of the one or more rows.
- The system of claim 9, wherein the time-series data sequences comprising proximate timestamp information are concatenated to generate the concatenated shape histogram, and concatenating the 2D shape histograms brings together discriminating features of the 2D shape histograms for the one or more time-series data sequences.
- The system of claim 9, wherein the concatenated shape histogram is generated by converting the distance matrix (D) and the angle matrix (A) into one-dimensional vectors and merging the one-dimensional (1D) vectors.
- The system of claim 9, wherein the pre-stored set of shape histograms comprise shape histograms corresponding to a relevant event.
Applications Claiming Priority (1)
| Application Number | Priority Date | Filing Date | Title |
|---|---|---|---|
| IN2074MU2014 | 2014-06-26 |
Publications (3)
| Publication Number | Publication Date |
|---|---|
| EP2960806A1 true EP2960806A1 (en) | 2015-12-30 |
| EP2960806C0 EP2960806C0 (en) | 2025-09-03 |
| EP2960806B1 EP2960806B1 (en) | 2025-09-03 |
Family
ID=53502489
Family Applications (1)
| Application Number | Title | Priority Date | Filing Date |
|---|---|---|---|
| EP15174139.4A Active EP2960806B1 (en) | 2014-06-26 | 2015-06-26 | Detecting an event from time-series data sequences |
Country Status (7)
| Country | Link |
|---|---|
| US (1) | US10108582B2 (en) |
| EP (1) | EP2960806B1 (en) |
| JP (1) | JP6211561B2 (en) |
| AU (1) | AU2015203557B2 (en) |
| BR (1) | BR102015015616B1 (en) |
| CA (1) | CA2895624C (en) |
| MX (1) | MX355984B (en) |
Cited By (2)
| Publication number | Priority date | Publication date | Assignee | Title |
|---|---|---|---|---|
| WO2020199241A1 (en) * | 2019-04-04 | 2020-10-08 | 东北大学 | Visual time-series pattern matching method employing hough transform |
| CN111814767A (en) * | 2020-09-02 | 2020-10-23 | 科大讯飞(苏州)科技有限公司 | Fall detection method and device, electronic equipment and storage medium |
Families Citing this family (2)
| Publication number | Priority date | Publication date | Assignee | Title |
|---|---|---|---|---|
| CN108228832B (en) * | 2018-01-04 | 2022-04-22 | 南京大学 | Time series data completion method based on distance matrix |
| CN114967972B (en) * | 2022-04-27 | 2025-01-14 | 华南理工大学 | A method, system, device and storage medium for adjusting touch screen sampling rate |
Citations (1)
| Publication number | Priority date | Publication date | Assignee | Title |
|---|---|---|---|---|
| US20140111647A1 (en) * | 2011-05-03 | 2014-04-24 | Alon Atsmon | Automatic image content analysis method and system |
Family Cites Families (8)
| Publication number | Priority date | Publication date | Assignee | Title |
|---|---|---|---|---|
| JPH05248884A (en) * | 1991-10-31 | 1993-09-28 | Omron Corp | Canelling method for measuring signal |
| JPH07128098A (en) * | 1993-11-02 | 1995-05-19 | Nittetsu Hokkaido Seigyo Syst Kk | Remote diagnostic system for instrumentation facility |
| JP2005018304A (en) | 2003-06-25 | 2005-01-20 | Nippon Telegr & Teleph Corp <Ntt> | Time-series data prediction method, apparatus, time-series data prediction program and recording medium therefor |
| JP2007198803A (en) | 2006-01-24 | 2007-08-09 | Omron Corp | Appearance inspection system |
| US7706965B2 (en) | 2006-08-18 | 2010-04-27 | Inrix, Inc. | Rectifying erroneous road traffic sensor data |
| JP5186322B2 (en) | 2008-09-26 | 2013-04-17 | インターナショナル・ビジネス・マシーンズ・コーポレーション | Time series data analysis system, method and program |
| US20130041625A1 (en) * | 2011-08-11 | 2013-02-14 | International Business Machines Corporation | Advanced Statistical Detection of Emerging Trends |
| JP2013140135A (en) | 2011-12-09 | 2013-07-18 | Tokyo Electron Ltd | Abnormality detection apparatus for periodic driving system, processing apparatus including periodic driving system, abnormality detection method for periodic driving system, and computer program |
-
2015
- 2015-06-25 CA CA2895624A patent/CA2895624C/en active Active
- 2015-06-25 US US14/749,881 patent/US10108582B2/en active Active
- 2015-06-25 JP JP2015128117A patent/JP6211561B2/en active Active
- 2015-06-26 AU AU2015203557A patent/AU2015203557B2/en active Active
- 2015-06-26 EP EP15174139.4A patent/EP2960806B1/en active Active
- 2015-06-26 MX MX2015008412A patent/MX355984B/en active IP Right Grant
- 2015-06-26 BR BR102015015616-2A patent/BR102015015616B1/en active IP Right Grant
Patent Citations (1)
| Publication number | Priority date | Publication date | Assignee | Title |
|---|---|---|---|---|
| US20140111647A1 (en) * | 2011-05-03 | 2014-04-24 | Alon Atsmon | Automatic image content analysis method and system |
Non-Patent Citations (5)
| Title |
|---|
| "EPIA 2009", 12 October 2009, PROGRESS IN ARTIFICIAL INTELLIGENCE, SPRINGER BERLIN HEIDELBERG, BERLIN, HEIDELBERG, ISBN: 978-3-642-04685-8, article RUI PEREIRA ET AL: "Learning Visual Object Categories with Global Descriptors and Local Features", pages: 225 - 236, XP019131992 * |
| EHTESHAM HASSAN ET AL: "Multi-sensor event detection using shape histograms", DATA SCIENCES, 16 August 2014 (2014-08-16), 2 Penn Plaza, Suite 701 New York NY 10121-0701 USA, pages 1 - 14, XP055221659, ISBN: 978-1-4503-3436-5, Retrieved from the Internet <URL:http://arxiv.org/pdf/1408.3733.pdf> [retrieved on 20151016] * |
| EHTESHAM HASSAN ET AL: "Multi-sensor event detection using shape histograms", DATA SCIENCES, ACM, 2 PENN PLAZA, SUITE 701 NEW YORK NY 10121-0701 USA, 18 March 2015 (2015-03-18), pages 20 - 29, XP058068963, ISBN: 978-1-4503-3436-5, DOI: 10.1145/2732587.2732591 * |
| KUMAR ROY: "'Leaming Words from Sights and Sounds: A Computational Model", 1 September 1999 (1999-09-01), XP055140284, Retrieved from the Internet <URL:http://web.media.mit.edu/~dkroy/papers/pdf/phd_thesis_1999.pdf> [retrieved on 20140915] * |
| L. S. RIBEIRO: "Object recognition for semantic robot vision", MASTER'S THESIS, 1 January 2008 (2008-01-01), Universidade de Aveiro, pages 1 - 64, XP055222899, Retrieved from the Internet <URL:http://ria.ua.pt/bitstream/10773/2057/1/2009001002.pdf> [retrieved on 20151022] * |
Cited By (3)
| Publication number | Priority date | Publication date | Assignee | Title |
|---|---|---|---|---|
| WO2020199241A1 (en) * | 2019-04-04 | 2020-10-08 | 东北大学 | Visual time-series pattern matching method employing hough transform |
| US11328502B2 (en) | 2019-04-04 | 2022-05-10 | Northeastern University | Visualized time sequence pattern matching method for data visualization analysis based on Hough transformation |
| CN111814767A (en) * | 2020-09-02 | 2020-10-23 | 科大讯飞(苏州)科技有限公司 | Fall detection method and device, electronic equipment and storage medium |
Also Published As
| Publication number | Publication date |
|---|---|
| US10108582B2 (en) | 2018-10-23 |
| MX355984B (en) | 2018-05-07 |
| BR102015015616A2 (en) | 2017-12-05 |
| CA2895624C (en) | 2024-03-26 |
| EP2960806C0 (en) | 2025-09-03 |
| BR102015015616B1 (en) | 2022-11-22 |
| AU2015203557B2 (en) | 2021-02-18 |
| CA2895624A1 (en) | 2015-12-26 |
| JP2016011954A (en) | 2016-01-21 |
| US20150378963A1 (en) | 2015-12-31 |
| MX2015008412A (en) | 2016-02-26 |
| JP6211561B2 (en) | 2017-10-11 |
| EP2960806B1 (en) | 2025-09-03 |
| AU2015203557A1 (en) | 2016-01-21 |
Similar Documents
| Publication | Publication Date | Title |
|---|---|---|
| US11451566B2 (en) | Network traffic anomaly detection method and apparatus | |
| US10108582B2 (en) | Detecting an event from time-series data sequences | |
| US10288653B2 (en) | Time series analytics | |
| KR102412829B1 (en) | Method for training and testing obfuscation network capable of processing data to be obfuscated for privacy, and training device and testing device using the same | |
| CN114422450B (en) | Network traffic analysis method and device based on multi-source network traffic data | |
| US20210034929A1 (en) | Inter-class adaptive threshold structure for object detection | |
| US10733264B2 (en) | System and method for detecting outliers in real-time for a univariate time-series signal | |
| CN110443219B (en) | Driving behavior abnormity detection method and device and industrial equipment | |
| US11880427B2 (en) | Time-series data processing method, corresponding processing system, device and computer program product | |
| CN107991633A (en) | Geomagnetic signal processing method and processing device | |
| US20160259849A1 (en) | System and method for reducing size of raw data by performing time-frequency data analysis | |
| CN112333155A (en) | Abnormal flow detection method and system, electronic equipment and storage medium | |
| CN113971673B (en) | Point cloud segmentation method and device | |
| EP3790022B1 (en) | Method and system for heart rate estimation of a user | |
| CN106936561B (en) | Side channel attack protection capability assessment method and system | |
| CN116895286B (en) | Printer fault monitoring method and related device | |
| CN111539576A (en) | An optimization method and device for a risk identification model | |
| CN113489740B (en) | Method, device, storage medium and processor for processing network threat intelligence information | |
| US9070045B2 (en) | Crosstalk cascades for use in object detection | |
| Al-Din | Calibration and pre-processing techniques for a smartphone-based driving events identification and classification system | |
| US11100108B2 (en) | Inflationary segment approach to temporal data partitioning for optimized model scoring | |
| CN114255373A (en) | Sequence anomaly detection method and device, electronic equipment and readable medium | |
| Grivel et al. | Process comparison combining signal power ratio and Jeffrey’s divergence between unit-power signals | |
| Park et al. | LGO-YOLO: A Lightweight Generalized Optimization of YOLOv8 for On-device Object Detection | |
| CN117574245B (en) | Intelligent detector index self-checking method and system applied to mountain exploration |
Legal Events
| Date | Code | Title | Description |
|---|---|---|---|
| PUAI | Public reference made under article 153(3) epc to a published international application that has entered the european phase |
Free format text: ORIGINAL CODE: 0009012 |
|
| AK | Designated contracting states |
Kind code of ref document: A1 Designated state(s): AL AT BE BG CH CY CZ DE DK EE ES FI FR GB GR HR HU IE IS IT LI LT LU LV MC MK MT NL NO PL PT RO RS SE SI SK SM TR |
|
| AX | Request for extension of the european patent |
Extension state: BA ME |
|
| 17P | Request for examination filed |
Effective date: 20160630 |
|
| RBV | Designated contracting states (corrected) |
Designated state(s): AL AT BE BG CH CY CZ DE DK EE ES FI FR GB GR HR HU IE IS IT LI LT LU LV MC MK MT NL NO PL PT RO RS SE SI SK SM TR |
|
| STAA | Information on the status of an ep patent application or granted ep patent |
Free format text: STATUS: REQUEST FOR EXAMINATION WAS MADE |
|
| R17P | Request for examination filed (corrected) |
Effective date: 20160630 |
|
| STAA | Information on the status of an ep patent application or granted ep patent |
Free format text: STATUS: EXAMINATION IS IN PROGRESS |
|
| 17Q | First examination report despatched |
Effective date: 20200422 |
|
| GRAP | Despatch of communication of intention to grant a patent |
Free format text: ORIGINAL CODE: EPIDOSNIGR1 |
|
| STAA | Information on the status of an ep patent application or granted ep patent |
Free format text: STATUS: GRANT OF PATENT IS INTENDED |
|
| INTG | Intention to grant announced |
Effective date: 20250310 |
|
| GRAS | Grant fee paid |
Free format text: ORIGINAL CODE: EPIDOSNIGR3 |
|
| GRAA | (expected) grant |
Free format text: ORIGINAL CODE: 0009210 |
|
| STAA | Information on the status of an ep patent application or granted ep patent |
Free format text: STATUS: THE PATENT HAS BEEN GRANTED |
|
| AK | Designated contracting states |
Kind code of ref document: B1 Designated state(s): AL AT BE BG CH CY CZ DE DK EE ES FI FR GB GR HR HU IE IS IT LI LT LU LV MC MK MT NL NO PL PT RO RS SE SI SK SM TR |
|
| REG | Reference to a national code |
Ref country code: GB Ref legal event code: FG4D |
|
| REG | Reference to a national code |
Ref country code: CH Ref legal event code: EP |
|
| REG | Reference to a national code |
Ref country code: DE Ref legal event code: R096 Ref document number: 602015092286 Country of ref document: DE |
|
| REG | Reference to a national code |
Ref country code: IE Ref legal event code: FG4D |
|
| U01 | Request for unitary effect filed |
Effective date: 20251001 |
|
| U07 | Unitary effect registered |
Designated state(s): AT BE BG DE DK EE FI FR IT LT LU LV MT NL PT RO SE SI Effective date: 20251010 |
|
| PG25 | Lapsed in a contracting state [announced via postgrant information from national office to epo] |
Ref country code: NO Free format text: LAPSE BECAUSE OF FAILURE TO SUBMIT A TRANSLATION OF THE DESCRIPTION OR TO PAY THE FEE WITHIN THE PRESCRIBED TIME-LIMIT Effective date: 20251203 |
|
| PG25 | Lapsed in a contracting state [announced via postgrant information from national office to epo] |
Ref country code: HR Free format text: LAPSE BECAUSE OF FAILURE TO SUBMIT A TRANSLATION OF THE DESCRIPTION OR TO PAY THE FEE WITHIN THE PRESCRIBED TIME-LIMIT Effective date: 20250903 |
|
| PG25 | Lapsed in a contracting state [announced via postgrant information from national office to epo] |
Ref country code: GR Free format text: LAPSE BECAUSE OF FAILURE TO SUBMIT A TRANSLATION OF THE DESCRIPTION OR TO PAY THE FEE WITHIN THE PRESCRIBED TIME-LIMIT Effective date: 20251204 |
|
| PG25 | Lapsed in a contracting state [announced via postgrant information from national office to epo] |
Ref country code: PL Free format text: LAPSE BECAUSE OF FAILURE TO SUBMIT A TRANSLATION OF THE DESCRIPTION OR TO PAY THE FEE WITHIN THE PRESCRIBED TIME-LIMIT Effective date: 20250903 |
|
| PG25 | Lapsed in a contracting state [announced via postgrant information from national office to epo] |
Ref country code: RS Free format text: LAPSE BECAUSE OF FAILURE TO SUBMIT A TRANSLATION OF THE DESCRIPTION OR TO PAY THE FEE WITHIN THE PRESCRIBED TIME-LIMIT Effective date: 20251203 |
|
| PG25 | Lapsed in a contracting state [announced via postgrant information from national office to epo] |
Ref country code: ES Free format text: LAPSE BECAUSE OF FAILURE TO SUBMIT A TRANSLATION OF THE DESCRIPTION OR TO PAY THE FEE WITHIN THE PRESCRIBED TIME-LIMIT Effective date: 20250903 |
|
| PG25 | Lapsed in a contracting state [announced via postgrant information from national office to epo] |
Ref country code: SM Free format text: LAPSE BECAUSE OF FAILURE TO SUBMIT A TRANSLATION OF THE DESCRIPTION OR TO PAY THE FEE WITHIN THE PRESCRIBED TIME-LIMIT Effective date: 20250903 |
|
| PG25 | Lapsed in a contracting state [announced via postgrant information from national office to epo] |
Ref country code: IS Free format text: LAPSE BECAUSE OF FAILURE TO SUBMIT A TRANSLATION OF THE DESCRIPTION OR TO PAY THE FEE WITHIN THE PRESCRIBED TIME-LIMIT Effective date: 20260103 |
|
| PG25 | Lapsed in a contracting state [announced via postgrant information from national office to epo] |
Ref country code: CZ Free format text: LAPSE BECAUSE OF FAILURE TO SUBMIT A TRANSLATION OF THE DESCRIPTION OR TO PAY THE FEE WITHIN THE PRESCRIBED TIME-LIMIT Effective date: 20250903 |
|
| PG25 | Lapsed in a contracting state [announced via postgrant information from national office to epo] |
Ref country code: SK Free format text: LAPSE BECAUSE OF FAILURE TO SUBMIT A TRANSLATION OF THE DESCRIPTION OR TO PAY THE FEE WITHIN THE PRESCRIBED TIME-LIMIT Effective date: 20250903 |