EP2959830A1 - Apparatus, method, and program for visualization - Google Patents
Apparatus, method, and program for visualization Download PDFInfo
- Publication number
- EP2959830A1 EP2959830A1 EP15170995.3A EP15170995A EP2959830A1 EP 2959830 A1 EP2959830 A1 EP 2959830A1 EP 15170995 A EP15170995 A EP 15170995A EP 2959830 A1 EP2959830 A1 EP 2959830A1
- Authority
- EP
- European Patent Office
- Prior art keywords
- heart
- wave
- electrical signal
- time step
- behavior
- Prior art date
- Legal status (The legal status is an assumption and is not a legal conclusion. Google has not performed a legal analysis and makes no representation as to the accuracy of the status listed.)
- Granted
Links
Images










Classifications
-
- G—PHYSICS
- G06—COMPUTING OR CALCULATING; COUNTING
- G06T—IMAGE DATA PROCESSING OR GENERATION, IN GENERAL
- G06T7/00—Image analysis
- G06T7/0002—Inspection of images, e.g. flaw detection
- G06T7/0012—Biomedical image inspection
-
- G—PHYSICS
- G16—INFORMATION AND COMMUNICATION TECHNOLOGY [ICT] SPECIALLY ADAPTED FOR SPECIFIC APPLICATION FIELDS
- G16Z—INFORMATION AND COMMUNICATION TECHNOLOGY [ICT] SPECIALLY ADAPTED FOR SPECIFIC APPLICATION FIELDS, NOT OTHERWISE PROVIDED FOR
- G16Z99/00—Subject matter not provided for in other main groups of this subclass
-
- A—HUMAN NECESSITIES
- A61—MEDICAL OR VETERINARY SCIENCE; HYGIENE
- A61B—DIAGNOSIS; SURGERY; IDENTIFICATION
- A61B5/00—Measuring for diagnostic purposes; Identification of persons
- A61B5/24—Detecting, measuring or recording bioelectric or biomagnetic signals of the body or parts thereof
- A61B5/316—Modalities, i.e. specific diagnostic methods
- A61B5/318—Heart-related electrical modalities, e.g. electrocardiography [ECG]
- A61B5/346—Analysis of electrocardiograms
- A61B5/349—Detecting specific parameters of the electrocardiograph cycle
-
- A—HUMAN NECESSITIES
- A61—MEDICAL OR VETERINARY SCIENCE; HYGIENE
- A61B—DIAGNOSIS; SURGERY; IDENTIFICATION
- A61B5/00—Measuring for diagnostic purposes; Identification of persons
- A61B5/24—Detecting, measuring or recording bioelectric or biomagnetic signals of the body or parts thereof
- A61B5/316—Modalities, i.e. specific diagnostic methods
- A61B5/318—Heart-related electrical modalities, e.g. electrocardiography [ECG]
- A61B5/346—Analysis of electrocardiograms
- A61B5/349—Detecting specific parameters of the electrocardiograph cycle
- A61B5/353—Detecting P-waves
-
- G—PHYSICS
- G06—COMPUTING OR CALCULATING; COUNTING
- G06T—IMAGE DATA PROCESSING OR GENERATION, IN GENERAL
- G06T19/00—Manipulating three-dimensional [3D] models or images for computer graphics
-
- G—PHYSICS
- G16—INFORMATION AND COMMUNICATION TECHNOLOGY [ICT] SPECIALLY ADAPTED FOR SPECIFIC APPLICATION FIELDS
- G16H—HEALTHCARE INFORMATICS, i.e. INFORMATION AND COMMUNICATION TECHNOLOGY [ICT] SPECIALLY ADAPTED FOR THE HANDLING OR PROCESSING OF MEDICAL OR HEALTHCARE DATA
- G16H50/00—ICT specially adapted for medical diagnosis, medical simulation or medical data mining; ICT specially adapted for detecting, monitoring or modelling epidemics or pandemics
- G16H50/50—ICT specially adapted for medical diagnosis, medical simulation or medical data mining; ICT specially adapted for detecting, monitoring or modelling epidemics or pandemics for simulation or modelling of medical disorders
Definitions
- the embodiments discussed herein relate to an apparatus, method, and program for visualizing behavior of a heart.
- Electrocardiograms are used as source data for analysis of arrhythmia and other heart diseases.
- one proposed electrocardiogram analyzer evaluates electrical activities in a heart in terms of the distribution of indicators that are useful for prediction of fatal arrhythmias.
- several researchers have proposed a method for classifying waveforms of Holter electrocardiography by using clustering techniques. See, for example, the following documents:
- a patient suspected of having a heart disease is subjected to monitoring of electrical signals produced in his or her myocardium, and the result is obtained as electrocardiogram data.
- electrocardiogram data There is a need in some situations for visually checking the behavior of the heart in comparison with electrocardiogram data. This is achieved by conducting a dynamic simulation of myocardial motion and blood flows and reproducing the simulated heart behavior in the form of a three-dimensional model on a monitor screen.
- a visualization apparatus including: storage means for storing a three-dimensional model of a heart of a patient, heart behavior data representing shapes of the heart at different time steps of a behavioral simulation of the heart, and electrocardiogram data representing temporal variations of an electrical signal in myocardium that have been measured from the patient; and computation means for determining a first time step at which the heart exhibits a first behavior in response to a first wave of the electrical signal, as well as a second time step at which the heart exhibits a second behavior in response to a second wave of the electrical signal, based on the heart behavior data, and for reproducing behavior of the heart over time by updating the three-dimensional model according to the heart behavior data, simultaneously with variations in strength of the electrical signal over time according to the electrocardiogram data, such that a first shape of the heart at the first time step is reproduced simultaneously with the first wave of the electrical signal, and such that a second shape of the heart at the second time step is reproduced simultaneously with the second wave of the electrical signal.
- FIG. 1 illustrates an exemplary functional structure of a visualization apparatus according to a first embodiment.
- the illustrated visualization apparatus 10 includes a storage unit 11 and a computation unit 12.
- the storage unit 11 stores a three-dimensional cardiac model 1, heart behavior data 2, and electrocardiogram data 3.
- the three-dimensional cardiac model 1 is a structure model representing a heart under analysis.
- the heart behavior data 2 represents shapes of the heart at different time steps of a behavioral simulation of the heart. For reproduction of simulated behavior of the heart, the time steps are labeled in their chronological order, with successively larger numbers starting from zero.
- the electrocardiogram data 3 represents temporal variations of an electrical signal in myocardium that have been measured from the patient's body. For example, the electrical signal is measured in terms of voltage.
- the computation unit 12 determines a first time step at which the heart exhibits a first behavior in response to a first wave of the electrical signal, as well as a second time step at which the heart exhibits a second behavior in response to a second wave of the electrical signal (step S1).
- the first wave is P wave seen in an electrocardiogram given by the electrocardiogram data 3
- the first time step refers to the moment when the atriums begin to contract.
- the second wave is, on the other hand, R wave seen in the electrocardiogram
- the second time step refers to the moment when the ventricles begin to contract.
- the computation unit 12 reproduces behavior of the heart over time by updating the three-dimensional cardiac model 1 according to the heart behavior data 2, simultaneously with variations in strength of the electrical signal over time according to the electrocardiogram data 3 (step S2).
- the computation unit 12 coordinates the reproduction of heart behavior such that a first shape of the heart at the first time step will be reproduced simultaneously with the first wave of the electrical signal, and such that a second shape of the heart at the second time step will be reproduced simultaneously with the second wave of the electrical signal. More specifically, the computation unit 12 reproduces the first shape at the moment when the reproduced electrical signal reaches a peak (maximum) of the first wave, and reproduces the second shape at the moment when the reproduced electrical signal reaches a peak of the second wave.
- the computation unit 12 displays the reproduced electrocardiogram and heart behavior on a monitor screen 4, for example.
- the computation unit 12 analyzes heart behavior data 2 obtained as result of a simulation and determines a first time step at which the atriums begin to contract. This first time step is distinguished by its number i, where i is an integer equal to or greater than zero.
- the computation unit 12 also determines a second time step at which the ventricles begin to contract. This second time step is distinguished by its number j, where j is an integer equal to or greater than zero.
- the computation unit 12 then reproduces an electrocardiogram and an image depicting the heart's behavior in a synchronized manner. Specifically, the computation unit 12 determines when to reproduce each time step of the heart behavior data 2, on the basis of the electrocardiogram data 3. For example, the i-th time step (i.e., start of atrial contraction) is supposed to be reproduced when the electrical signal exhibits a peak of P wave in the electrocardiogram. That moment is referred to as time ti in FIG. 1 . Similarly the j-th time step (i.e., start of ventricular contraction) is supposed to be reproduced when the electrical signal exhibits a peak of R wave in the electrocardiogram. That moment is referred to as time tj in FIG. 1 .
- the visualization apparatus 10 dynamically reproduces how the heart changes its shape at each time step, as the electrical signal varies with time in the reproduced electrocardiogram, thus achieving correct synchronization between the electrocardiogram and heart behavior.
- the electrocardiogram is reproduced as a graph with horizontal and vertical axes respectively representing reproduction time and electrical signal intensity. With the progress of reproduction time, a special mark representing the current position moves along the curved line of the graph so as to indicate the current signal strength being reproduced.
- the visualization apparatus 10 displays the synchronized electrocardiogram and heart behavior on a monitor screen 4, thus making it easier for the viewer to understand the relationship between electrical signals seen in the electrocardiogram and actual behavior of the heart.
- the visualization apparatus 10 is designed to adjust the electrocardiogram and heart behavior such that the start of atrial contraction is timed to the peak of P wave, and the start of ventricular contraction is timed to the peak of R wave. This adjustment reflects the delay time from reception of electrical signals by myocardium and consequent contraction of the myocardium, and thus contributes to correct synchronization between the electrocardiogram and heart behavior.
- the atrial myocardium receives an electrical signal when P wave begins.
- the atriums do not respond immediately, but start to contract some time after the reception of those electrical signals.
- the visualization apparatus 10 waits for the electrocardiogram to reach the peak of P wave before rendering the contraction of atriums.
- the above-described computation unit 12 may be implemented as, for example, functions performed by a processor in the visualization apparatus 10.
- the storage unit 11 may be implemented as part of the data storage space of memory devices or the like in the visualization apparatus 10.
- the storage unit 11 discussed above in FIG. 1 may be termed as a storage means for storing a three-dimensional cardiac model 1, heart behavior data 2, and electrocardiogram data 3.
- the computation unit 12 discussed above in FIG. 1 may be termed as a computation means for determining first and second time steps and reproducing behavior of the heart simultaneously with variations in electrical signal strength.
- This section describes a second embodiment, which provides more specific techniques for visualizing the result of behavioral simulation of a patient's heart, precisely in synchronization with his or her electrocardiogram.
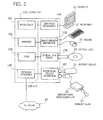
- FIG. 2 illustrates an exemplary hardware configuration of a computer according to the second embodiment.
- the illustrated computer 100 includes a processor 101 to control its entire operation.
- the processor 101 is coupled to a memory 102 and other various devices and interfaces via a bus 109.
- the processor 101 may be a single processing device or a multiprocessor system including two or more processing devices, such as a central processing unit (CPU), micro processing unit (MPU), or digital signal processor (DSP). It is also possible to implement the processing functions of the processor 101 wholly or partly in an application-specific integrated circuit (ASIC), programmable logic device (PLD), or other electronic circuits, or their combinations.
- ASIC application-specific integrated circuit
- PLD programmable logic device
- the memory 102 serves as a primary storage device of the computer 100. Specifically, the memory 102 is used to temporarily store at least some of the operating system (OS) programs and application programs that the processor 101 executes, in addition to other various data objects that it manipulates at runtime.
- the memory 102 may be, for example, a random access memory (RAM) or other volatile semiconductor memory devices.
- HDD hard disk drive
- graphics processor 104 an input device interface 105
- optical disc drive 106 an optical disc drive
- peripheral device interface 107 a peripheral device interface 107
- network interface 108 a network interface 108.
- the HDD 103 writes and reads data magnetically on its internal platters.
- the HDD 103 serves as a secondary storage device in the computer 100 to store program files and data files relating to the operating system and applications. Flash memory and other semiconductor memory devices may also be used as secondary storage devices, in place of or together with the HDD 103.
- the graphics processor 104 coupled to a monitor 21, produces video images in accordance with drawing commands from the processor 101 and displays them on a screen of the monitor 21.
- the monitor 21 may be, for example, a cathode ray tube (CRT) display or a liquid crystal display.
- CTR cathode ray tube
- the input device interface 105 is used to connect input devices such as a keyboard 22 and a mouse 23 to the computer 100 and supply signals from these devices to the processor 101.
- the mouse 23 is a pointing device, which may be replaced with other kinds of pointing devices such as a touchscreen, tablet, touchpad, and trackball.
- the optical disc drive 106 reads out data encoded on an optical disc 24, by using laser light or the like.
- the optical disc 24 is a portable data storage medium, the data recorded on which can be read as a reflection of light or the lack of the same.
- the optical disc 24 may be a digital versatile disc (DVD), DVD-RAM, compact disc read-only memory (CD-ROM), CD-Recordable (CD-R), or CD-Rewritable (CD-RW), for example.
- the peripheral device interface 107 is a communication interface for connecting some peripheral devices to the computer 100.
- the peripheral device interface 107 may be used to connect a memory device 25 and a memory card reader/writer 26.
- the memory device 25 is a data storage medium with a capability of communicating with the peripheral device interface 107.
- the memory card reader/writer 26 is an adapter used to write data to or read data from a memory card 27, which is a data storage medium in the form of a small card.
- the network interface 108 is connected to a network 20 to exchange data with other computers or network devices (not illustrated).
- the above hardware configuration serves as a platform of processing functions to implement the second embodiment. It is noted that the foregoing visualization apparatus 10 of the first embodiment may also be implemented on the same hardware platform discussed in FIG. 2 for the computer 100 of the second embodiment.
- the computer 100 provides various processing functions of the second embodiment by executing programs stored in a non-transitory computer-readable storage medium. These processing functions of the computer 100 are encoded in the form of computer programs, which may be stored in a variety of storage media.
- the computer 100 may store program files in its own HDD 103.
- the processor 101 loads the memory 102 with at least part of these programs read out of the HDD 103 and executes them on the memory 102. It is also possible to store programs files in an optical disc 24, memory device 25, memory card 27, or the like.
- the programs stored in a portable storage medium are installed in the HDD 103 under the control of the processor 101, so that they are ready to execute upon request. It may also be possible for the processor 101 to execute program codes read out of a portable storage medium, without installing them in its local storage devices.
- FIG. 3 is a functional block diagram of a computer of the second embodiment.
- the illustrated computer 100 includes an unstructured grid data storage unit 110, a heart simulator 120, a simulation result storage unit 130, an electrocardiogram data storage unit 140, and a visualization unit 150.
- the unstructured grid data storage unit 110 stores unstructured grid data that describes the shape of a heart in three-dimensional form.
- unstructured grid data expresses the geometry of a heart as a collection of tetrahedral elements with irregular shapes. More specifically, many nodes are placed in a heart simulation domain, where each four neighboring nodes define a tetrahedron. The heart is thus represented as a collection of many tetrahedrons each serving as an element that portrays myocardial cells.
- the unstructured grid data storage unit 110 may be implemented as part of storage space of the memory 102 or HDD 103.
- the heart simulator 120 mimics the behavior of a heart under test, including its beating motion, on the basis of a given three-dimensional cardiac model.
- the heart simulator 120 may also simulate coronary circulation (blood flow in the heart).
- the heart simulator 120 outputs its simulation result to the simulation result storage unit 130.
- the heart simulator 120 repetitively calculates new node positions of the three-dimensional cardiac model and some relating physical quantities (e.g., blood pressure and amount of blood flow) at each node or cardiac element, while advancing the simulation clock by a predetermined time step size.
- the node positions and their relating physical quantities at a specific time step are calculated on the basis of those obtained at one or more preceding time steps.
- the simulation result includes the calculated positions of nodes and new physical quantities at those nodes or elements at each predetermined point on the simulation time axis.
- the simulation result storage unit 130 stores data of simulation results discussed above.
- the simulation result storage unit 130 may be implemented as part of storage space of the memory 102 or HDD 103.
- the electrocardiogram data storage unit 140 stores original measurement data of an electrocardiogram of a patient. This data indicates the strength of electrical signals produced in the heart.
- the electrocardiogram data storage unit 140 may be implemented as part of storage space of the memory 102 or HDD 103.
- the visualization unit 150 displays the patient's electrocardiogram and heart behavior on the monitor 21 in a synchronized manner.
- the simulated heart behavior includes contraction of atriums and ventricles.
- the visualization unit 150 positions the electrocardiogram in such a way that the peak of P wave will match with the atrial contraction, and the peak of R wave with the ventricular contraction.
- the visualization unit 150 is an exemplary implementation of the computation unit 12 discussed previously in FIG. 1 for the first embodiment.
- the unstructured grid data storage unit 110, simulation result storage unit 130, and electrocardiogram data storage unit 140 are collectively equivalent to the storage unit 11 discussed previously in FIG. 1 for the first embodiment.
- the lines interconnecting the functional blocks in FIG. 3 represent some of their communication paths. The person skilled in the art would appreciate that there may be other communication paths in actual implementations. It is also noted that the functions of each element seen in FIG. 3 may be implemented as program modules executed by a computer.
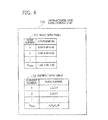
- the unstructured grid data storage unit 110 contains, for example, a node data table 111 and an element data table 112, which constitute unstructured grid data.
- Each entry of the node data table 111 defines a node as a combination of its node number and coordinate position.
- the node coordinates defined in this node data table 111 indicate the initial position of each node before a simulation is started. During a simulation, these node coordinates in the node data table 111 are changed with the progress of simulated heart beat motion.
- the element data table 112 describes tetrahedral elements of a cardiac model. Specifically, each tetrahedral element is distinguished by a specific element number, and its four corners are designated by their corresponding node numbers.
- a three-dimensional cardiac model is produced from the foregoing data in the unstructured grid data storage unit 110 of FIG. 4 .
- FIG. 5 illustrates an example of such a three-dimensional cardiac model.
- the illustrated three-dimensional cardiac model 31 is made up of a large number of tetrahedral elements.
- the heart simulator 120 computationally reproduces a process of electrical signal conduction (propagation of excitation) in the heart muscle.
- the three-dimensional cardiac model 31 is also given some other conditions relating to the contraction and relaxation of myocardium, enabling the heart simulator 120 to mimic the heart's mechanical behavior (motion) as well.
- the simulation result storage unit 130 As the simulation progresses, its outcome is accumulated in the simulation result storage unit 130 in the way described below.
- FIG. 6 illustrates an exemplary structure of data stored in a simulation result storage unit.
- Each single cycle of computation in the simulation process is referred to as a "simulation time step" or simply “time step.”
- the simulation result storage unit 130 contains a plurality of myocardium datasets 131, 132, 133, ... obtained at different time steps. These myocardium datasets 131, 132, 133, ..., given a series of time step indexes, represent how the heart changes its state (including shape) with the progress of simulation time.
- each record in the myocardium datasets 131, 132, 133, ... is associated with a particular element or node of the three-dimensional cardiac model and thus includes its element ID or node ID, coordinate position, and various physical quantities.
- the node positions vary with time, thus representing a varying shape of the heart at each time step.
- the coordinate position of a tetrahedral element actually means its centroid, or the center of gravity.
- Each column of physical quantity is populated with data only in the element records, or only in the node records, or in the both.
- the illustrated electrocardiogram data storage unit 140 stores a plurality of electrocardiogram datasets 141, 142, 143, ... containing records of voltage observed at different points on the patient's body.
- the electrocardiogram data storage unit 140 stores twelve electrocardiogram datasets corresponding to the twelve leads.
- Each electrocardiogram dataset 141, 142, 143, ... is a time-series of voltage values of electrical signals measured with the progress of time relative to the measurement start time.
- the above-described electrocardiogram data has been obtained by measuring myocardial voltage of the patient of interest, with a plurality of electrodes attached to his or her body.
- the measured values of myocardium voltage represent the strength of propagating electrical signals that cause cardiac excitation.
- FIG. 8 illustrates an example of propagation of cardiac excitation.
- the illustrated heart 40 is formed from four chambers called right atrium 41, left atrium 42, right ventricle 43, and left ventricle 44. Each of these heart chambers contracts in accordance with electrical signals that propagate through the heart's stimulus conduction system.
- the stimulus conduction system is made up of a collection of muscle cells specialized for conducting electrical signals that stimulate muscle contraction.
- the stimulus conduction system includes a tissue called "sinoatrial node” 45 that serves as the source of electrical signals.
- the sinoatrial node 45 sits in the right atrium 41 and generates an electrical impulse signal at regular intervals without the need for external stimulation.
- the generated signal is sent first to the right atrium 41, and to the left atrium 42 as well, and propagates through the atrial muscle before reaching the place called "atrioventricular node” 46.
- the muscles of the right atrium 41 and left atrium 42 contract in response to the electrical signals that they receive.
- the atrioventricular node 46 transfers the electrical signal to the ventricles.
- the electrical signal then bifurcates to the left and right bundle branches. These signals go down to the bottom of each ventricle and then propagate across the entire ventricular muscle.
- Such excitation-causing electrical signals are observed as the voltage potential of myocardium through a process called electrocardiography.
- the graph representing these recorded voltage variations over time is referred to as an electrocardiogram.
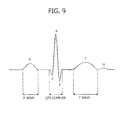
- FIG. 9 illustrates an example of an electrocardiogram.
- a healthy heart exhibits six waves named P, Q, R, S, T, and U waves in its electrocardiogram.
- Q, R, and S waves occur back-to-back (i.e., without interruption) and are collectively referred to as a QRS complex.
- P wave represents depolarization (excitation) of the atriums. That is, P wave is the first upward (i.e., positive) wave that comes after the electrical signal begins to propagate in a heart beat cycle.
- the subsequent QRS complex represents depolarization (excitation) of the ventricles, which begins with a downward (i.e., negative) Q wave and continues to an upward R wave and then to a downward S wave.
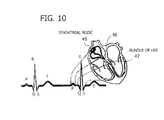
- FIG. 10 illustrates how an electrocardiogram relates to propagation of cardiac excitation.
- the sinoatrial node 45 generates an electrical signal, initiating P wave. This P wave disappears when the electrical signal reaches the atrioventricular node 46.
- the electrical signal further propagates from the atrioventricular node 46 through the bundle of His 47 and bifurcates into the left and right bundle branches, causing a QRS complex to begin.
- the QRS complex is finished when the bifurcated electrical signals arrive at the extreme ends of those two bundle branches within the ventricular myocardium.
- FIG. 11 illustrates an example of a twelve-lead electrocardiogram.
- the illustrated twelve-lead electrocardiogram 51 actually includes twelve different waveforms, or leads. Many leads have R waves larger than their subsequent S waves (negative), while some may exhibit S waves larger than R waves. There may even be a missing wave in some of those leads. Electrocardiograms contain some amount of noise introduced during the measurement process, which may be visible in their waveforms.
- the computer 100 of the second embodiment displays such an electrocardiogram together with a picture visualizing simulated behavior of the heart in question. This feature of the computer 100 permits the user to understand how the heart behaves in response to electrical signals seen in the electrocardiogram.
- the patient's electrocardiogram is used to determine the values of parameters for a behavioral simulation of his or her heart. With such parameters based on electrocardiogram data, the simulation result will reflect the condition of the patient's cardiac excitation system. Suppose, for example, the patient in question has a symptom of cardiac arrhythmia. The use of his electrocardiogram data for simulation makes it possible to reproduce the heart's behavior under the arrhythmic condition.
- the visualization unit 150 makes some timing adjustment to synchronize the heart actions with the given electrocardiogram when reproducing them on a monitor screen. Specifically, P wave in the electrocardiogram is timed to atrial contraction caused by an electrical signal from the sinoatrial node 45, and R wave is timed to ventricular contraction caused by an electrical signal from the atrioventricular node 46. In other words, the visualization unit 150 renders the reproduced heart behavior so as to make the atriums begin to contract at the peak point of P wave, as well as to make the ventricles begin to contract at the peak point of R wave.
- FIG. 12 is a flowchart of a visualization process.
- Step S101 The visualization unit 150 determines initial positions of atriums and ventricles. For example, two points in the atriums or ventricles are selected such that they are as distant as possible, assuming that it is before a heart beat begins. A displacement of atriums from their initial positions will be interpreted as a start of atrial contraction. Similarly, a displacement of ventricles from their initial positions will be interpreted as a start of ventricular contraction. Details of this step S101 will be discussed later with reference to FIG. 13 .
- Step S102 The visualization unit 150 produces synchronization data that specifies when to reproduce heart behavior of each time step. Details of this processing will be discussed later with reference to FIG. 17 .
- Step S103 The visualization unit 150 reproduces behavior of the heart in its three-dimensional model, and the visualization unit 150 displays it on the monitor 21 in synchronization with an electrocardiogram.
- FIG. 13 is a flowchart illustrating a procedure of determining initial positions of atriums and ventricles.
- Step S111 The visualization unit 150 retrieves data of a three-dimensional cardiac model 31 from the unstructured grid data storage unit 110.
- Step S112 The visualization unit 150 sets a cardiac axis (long axis of the heart) in the three-dimensional cardiac model 31.
- the long axis runs through the heart in its vertical direction.
- the visualization unit 150 sets an atrial short axis and a ventricular short axis in three-dimensional cardiac model 31.
- the atrial short axis refers to a lateral axis of atriums that is perpendicular to the long axis of the heart.
- the ventricular short axis refers to a lateral axis of ventricles that is perpendicular to the long axis of the heart.
- Step S114 The visualization unit 150 calculates the coordinates of points at which the atrial short axis intersects with free walls of myocardium and determines these intersectional coordinates as the initial positions of atriums. Similarly, the visualization unit 150 calculates the coordinates of points at which the ventricular short axis intersects with free walls of myocardium and determines these intersectional coordinates as the initial positions of ventricles.
- the process starts with setting a long axis of the heart in its three-dimensional cardiac model. It is assumed here that the heart is in the condition before a heart beat begins.
- the visualization unit 150 sets a long axis through the bottommost portion of a ventricular cavity.
- FIG. 14 illustrates the bottommost portion of a ventricular cavity.
- the long axis is defined as a straight line passing through the illustrated bottommost ventricular portion 60 in the three-dimensional cardiac model 31.
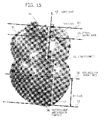
- FIG. 15 illustrates an example of long and short axes.
- the visualization unit 150 draws a line segment 61 between the center of the aorta valve and that of the mitral valve in the three-dimensional cardiac model 31.
- the visualization unit 150 determines the midpoint of this line segment 61 and draws a straight line that goes through the midpoint and the above-noted bottommost ventricular portion 60, thereby determining a long axis 62 as seen in FIG. 15 .
- the visualization unit 150 then produces two straight lines 63 and 64 perpendicular to the long axis 62.
- One straight line 63 passes through the bottommost ventricular portion 60.
- the other straight line 64 meets the long axis 62 at the topmost point of the heart.
- La be the distance between the line segment 61 and the latter straight line 64
- Lv be the distance between the line segment 61 and the former straight line 63.
- the visualization unit 150 now draws a straight line that is perpendicular to the long axis 62 and apart from the line segment 61 at a distance of la being equal to two fifths of La. This straight line will be an atrial short axis 65 of the heart.
- the visualization unit 150 draws another straight line that is perpendicular to the long axis 62 and apart from the straight line 63 at a distance of Iv being equal to two fifths of Lv. This straight line will be a ventricular short axis 66 of the heart.
- the visualization unit 150 now determines at which points the atrial short axis 65 meets free walls (cardiac walls other than the septum) of the atriums. These points are initial positions of the atriums. Similarly, the visualization unit 150 determines at which points the ventricular short axis 66 meets free walls of the ventricles, and sets these points as initial positions of the ventricles.
- FIG. 16 illustrates such initial positions. Specifically, two initial positions 71 and 72 are seen on the atrial short axis 65 in the three-dimensional cardiac model 31, and another two initial positions 73 and 74 are seen on the ventricular short axis 66.
- the above-described procedure determines initial positions of atriums and ventricles. Based on those initial positions, the visualization unit 150 produces synchronization data as a preparation for reproduction of heart behavior recorded in myocardium datasets 131, 132, 133, and so on. For example, the visualization unit 150 seeks a time point at which the atrial free walls move from their initial positions 71 and 72 and maps that time point to the peak of P wave seen in the electrocardiogram. The visualization unit 150 also seeks another time point at which the ventricular free walls move from their initial positions 73 and 74 and maps that time point to the peak of R wave seen in the electrocardiogram.
- the visualization unit 150 further maps a single heart beat cycle in the myocardium datasets to that in the electrocardiogram.
- a heart beat cycle is defined as a period from the peak of one P wave to that of the next P wave.
- a heart beat cycle may refer to a period between the rising edges of two P waves in the case where the first simulation time step corresponds to the time point when the sinoatrial node 45 starts to output an electrical signal.
- a heart beat cycle may start at a change in the ventricles from relaxation to contraction and end at another such change. Such a change from relaxation to contraction of ventricles occurs after R wave appears in the QRS period (i.e., from the beginning of Q wave to the end of S wave).
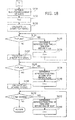
- FIGS. 17 and 18 are first and second halves of a flowchart illustrating a procedure of producing synchronization data.
- Step S121 The visualization unit 150 retrieves a myocardium dataset 131, 132, 133, ... of each time step from the simulation result storage unit 130.
- Step S122 The visualization unit 150 initializes a variable T to zero, where T indicates the current time step number.
- Step S123 The visualization unit 150 determines whether variable T is smaller than Max_timestep, or the total number of time steps constituting a single heart beat cycle. If T is smaller than Max_timestep, the process advances to step S124. Otherwise, the process branches to step S131 in FIG. 18 .
- Step S124 Variable T has not reached the end of the heart beat cycle.
- the visualization unit 150 thus checks the cardiac shape of time step T to determine whether the atrial myocardium has started to move from its initial position. For example, the visualization unit 150 watches the current positions of some pieces of atrial myocardium while variable P_top contains no values. When any movement from their initial positions is found at time step T, the visualization unit 150 determines that the atrial myocardium started to move at that time step T, which means that the atriums have started to contract. Upon detection of such a movement, the process advances to step S125. The process skips to step S128 when there is no such movement as of time step T, or the atriums have already started to move.
- Step S125 The visualization unit 150 assigns the current value of T to variable P_top to record the time step at which the atriums started contraction.
- Step S126 The visualization unit 150 checks the cardiac shape of time step T to determine whether the ventricular myocardium has started to move from its initial position. For example, the visualization unit 150 watches the current positions of some pieces of ventricular myocardium while variable R_top contains no values. When any movement from their initial positions is found at time step T, the visualization unit 150 determines that the ventricular myocardium started to move at that time step T, which means that the ventricles have started to contract. Upon detection of such a movement, the process advances to step S127. The process skips to step S128 when there is no such movement as of time step T, or the ventricles have already started to move.
- Step S127 The visualization unit 150 assigns the current value of T to variable R_top to record the time step at which the ventricles started contraction.
- Step S1228 The visualization unit 150 increments variable T by one and makes the process go back to step S123.
- the above-described processing steps of FIG. 17 cause two variables P_top and R_top to gain their values respectively indicating at which time steps the atriums and ventricles started contraction.
- the visualization unit 150 determines when to render the cardiac shape of each subsequent time step as defined in the myocardium datasets.
- FIG. 18 is the second half of the flowchart illustrating a procedure of generating synchronization data.
- Step S131 The visualization unit 150 retrieves electrocardiogram datasets 141, 142, 143, ... from the electrocardiogram data storage unit 140.
- Step S132 The visualization unit 150 initializes variable T to zero.
- Step S133 The visualization unit 150 calculates a first time interval ⁇ t1 of each time step of heart behavior that is supposed to be reproduced in the period from the beginning of electrical signal output to the peak of P wave in the electrocardiogram.
- the myocardium datasets include n1 time steps between the beginning of a heart beat cycle and the time step P_top.
- the electrocardiogram gives a time length of t1 between the beginning of electrical signal output and the peak of P wave.
- the visualization unit 150 obtains ⁇ t1 by dividing t1 by n1.
- Step S134 The visualization unit 150 determines whether variable T is smaller than P_top. If T is smaller than P_top, the process advances to step S135. Otherwise, the process proceeds to step S137.
- Step S135 the synchronization data specifies reproduction time of each time step of heart behavior.
- the visualization unit 150 determines reproduction time for time step T such that the cardiac shape of time step T will be rendered ⁇ t1 after that of time step (T-1). It is noted that time step 0 is supposed to be reproduced simultaneously with the start of a single heart beat cycle in the electrocardiogram.
- Step S136 The visualization unit 150 increments variable T by one and moves the process back to step S134.
- Step S137 The visualization unit 150 calculates a second time interval ⁇ t2 of each time step of heart behavior that is supposed to be reproduced in the period from the peak of P wave to the peak of R wave in the electrocardiogram.
- the myocardium datasets include n2 time steps between two time steps P_top and R_top.
- the electrocardiogram gives a time length of t2 between the peak of P wave and the peak of R wave.
- the visualization unit 150 obtains ⁇ t2 by dividing t2 by n2.
- Step S138 The visualization unit 150 determines whether variable T is smaller than R_top. If T is smaller than R_top, the process advances to step S139. Otherwise, the process proceeds to step S141.
- Step S139 The visualization unit 150 determines reproduction time for time step T such that the cardiac shape of time step T will be rendered ⁇ t2 after that of time step (T-1).
- Step S140 The visualization unit 150 increments variable T by one and makes the process go back to step S138.
- Step S141 The visualization unit 150 calculates a third time interval ⁇ t3 of each time step of heart behavior that is supposed to be reproduced in the period from the peak of R wave to the end of the heart beat cycle in the electrocardiogram.
- the myocardium datasets include n3 time steps between time step R_top and the last time step of the heart beat cycle.
- the electrocardiogram gives a time length of t3 between the peak of R wave and the end of the heart beat cycle.
- the visualization unit 150 obtains ⁇ t3 by dividing t3 by n3.
- Step S142 The visualization unit 150 determines whether variable T is smaller than Max_timestep, or the number of time steps constituting the heart beat cycle. If T is smaller than Max_timestep, the process advances to step S143. Otherwise, the visualization unit 150 exits from the present process of FIG. 18 .
- Step S143 The visualization unit 150 determines reproduction time for time step T such that the cardiac shape of time step T will be rendered ⁇ t3 after that of time step (T-1).
- Step S144 The visualization unit 150 increments variable T by one and makes the process go back to step S142.
- the above-described processing steps enable the visualization unit 150 to produce synchronization data that specifies when to reproduce the cardiac shape of each time step.
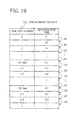
- FIG. 19 illustrates an example of synchronization data.
- the illustrated synchronization data 151 contains time code values associated with different time step numbers. These values are labeled "reproduction time" and each indicate when the cardiac shape of the associated time step is to be rendered, in terms of the elapsed time since the beginning of a heart beat cycle in the electrocardiogram.
- This synchronization data 151 is located in, for example, a storage space of the memory 102 that the visualization unit 150 manages.
- the synchronization data may be implemented in other forms than the table illustrated in the example of FIG. 19 .
- the synchronization data may be contained in an array of time code values indexed by the time step number.
- one heart beat cycle period may be divided differently from the foregoing example of FIGS. 18 and 19 , which has illustrated three sections demarcated by the peaks of P and R waves.
- the visualization unit 150 may be configured to calculate the interval of each time step in a unified period from the peak of R wave in one heart beat cycle to the peak of P wave in the next cycle.
- This synchronization data 151 is used to reproduce the heart behavior on a monitor screen so that the user can see it in synchronization with an electrocardiogram.
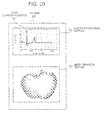
- FIG. 20 illustrates an example of a picture that reproduces heart behavior together with an electrocardiogram.
- the illustrated picture 80 is formed from an electrocardiogram section 81 and a heart behavior section 82.
- the electrocardiogram section 81 displays an electrocardiogram reproduced from electrocardiogram data, with a mark 83 indicating which time point is being reproduced. For example, the mark 83 moves from left to right along the waveform indicating voltage strength in the electrocardiogram, according to the progress of cardiac image reproduction.
- the heart behavior section 82 depicts the behavior of the heart in the form of a three-dimensional model by deforming its shape in accordance with a series of myocardium datasets 131, 132, 133, and so on. That is, the three-dimensional model seen in the heart behavior section 82 has a shape reproduced from a myocardium dataset that corresponds to the reproduction time indicated by the mark 83 in the electrocardiogram section 81. The three-dimensional model is updated with its new myocardium dataset as the mark 83 moves with time, so that the behavior of the heart will be presented in an animated way.
- FIG. 21 illustrates an exemplary screenshot of a twelve-lead electrocardiogram.
- the illustrated electrocardiogram section 81 presents all waveforms of a twelve-lead electrocardiogram, each having a mark 83 indicating the current time point in the waveforms.
- Seen in the heart behavior section 82 is a reproduced image of the heart at the current time point (reproduction time) indicated by the mark 83, relative to the beginning of the electrocardiogram.
- the cardiac image in the heart behavior section 82 changes as the mark 83 moves rightward.
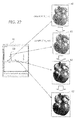
- FIG. 22 illustrates how the heart changes its shape with the progress of reproduction time.
- the illustrated mark 83 moves rightward along the waveform of electrocardiogram in the electrocardiogram section 81 with the passage of reproduction time.
- the heart behavior section 82 contains an image of the heart at a time point corresponding to the current voltage indicated by the mark 83 in the electrocardiogram. For example, when the mark 83 is at the peak of P wave, the heart behavior section 82 displays the shape of the heart at time step P_top. When the mark 83 is at the peak of R wave, the heart behavior section 82 displays the shape of the heart at time step R_top.
- FIG. 23 illustrates an exemplary screenshot that depicts heart behavior together with an electrocardiogram in the case of arrhythmia. More particularly, FIG. 23 illustrates the case of tachyarrhythmia. This means that the patient's electrocardiogram contains more frequent waves than normal persons', which may be observed in the heart behavior section 82 as unnatural creases on the heart surface.
- an animated image of a patient's heart is displayed in synchronization with his or her electrocardiogram, thus making it easier for the user to understand how the heart actually behaves when a particular pattern of electrical signals appears in the electrocardiogram.
- the proposed techniques contribute to more precise diagnosis of the patient's medical condition.
- the proposed techniques enable synchronized reproduction of a measured electrocardiogram and a simulated behavior of the heart under diagnosis.
Landscapes
- Health & Medical Sciences (AREA)
- Engineering & Computer Science (AREA)
- Cardiology (AREA)
- Life Sciences & Earth Sciences (AREA)
- Medical Informatics (AREA)
- Public Health (AREA)
- Physics & Mathematics (AREA)
- General Health & Medical Sciences (AREA)
- Biomedical Technology (AREA)
- Pathology (AREA)
- Molecular Biology (AREA)
- Surgery (AREA)
- Animal Behavior & Ethology (AREA)
- Biophysics (AREA)
- Veterinary Medicine (AREA)
- Heart & Thoracic Surgery (AREA)
- General Physics & Mathematics (AREA)
- Theoretical Computer Science (AREA)
- Computer Graphics (AREA)
- General Engineering & Computer Science (AREA)
- Computer Hardware Design (AREA)
- Software Systems (AREA)
- Data Mining & Analysis (AREA)
- Databases & Information Systems (AREA)
- Epidemiology (AREA)
- Primary Health Care (AREA)
- Computer Vision & Pattern Recognition (AREA)
- Quality & Reliability (AREA)
- Radiology & Medical Imaging (AREA)
- Nuclear Medicine, Radiotherapy & Molecular Imaging (AREA)
- Measurement And Recording Of Electrical Phenomena And Electrical Characteristics Of The Living Body (AREA)
Abstract
Description
- The embodiments discussed herein relate to an apparatus, method, and program for visualizing behavior of a heart.
- The recent advancement of computer-based numerical analysis has enabled reproduction of various phenomena in a heart by modeling it on a computer. For example, the behavior of myocardium is analyzed numerically and reproduced on a monitor screen with the techniques of three-dimensional computer graphics. It is also possible to produce an electrocardiogram on the thorax of a person as an outcome of simulation. Such output data representing electrical activities in a heart may be visualized as video images, along with other data indicating the propagation of cardiac excitation.
- Electrocardiograms are used as source data for analysis of arrhythmia and other heart diseases. For example, one proposed electrocardiogram analyzer evaluates electrical activities in a heart in terms of the distribution of indicators that are useful for prediction of fatal arrhythmias. Also, several researchers have proposed a method for classifying waveforms of Holter electrocardiography by using clustering techniques. See, for example, the following documents:
- Japanese Laid-open Patent Publication No.
2007-313122 - Tsuyunashi, Oguri, Matsuo, Iwata, "The Holter ECG waveform classification using clustering," The Institute of Electronics, Information and Communication Engineers (IEICE), Technical Report of IEICE. MBE, ME and Biocybernetics, December 1, 2003, 103(489), pp.23-28
- A patient suspected of having a heart disease is subjected to monitoring of electrical signals produced in his or her myocardium, and the result is obtained as electrocardiogram data. There is a need in some situations for visually checking the behavior of the heart in comparison with electrocardiogram data. This is achieved by conducting a dynamic simulation of myocardial motion and blood flows and reproducing the simulated heart behavior in the form of a three-dimensional model on a monitor screen.
- It is not easy, however, for the conventional tools to make a simulation result exactly simultaneous with electrocardiogram data because of their difference in the progress of time. More specifically, existing electrocardiogram data is used as input data for a behavioral simulation of myocardium, where the electrocardiogram data provides particular conditions about propagation of excitation in the patient's heart. The simulation process produces a set of output data indicating the state of the heart at each discrete time step. There is, however, some amount of time difference between the generation of electrical signals seen in the electrocardiogram and the consequent contraction of myocardium. Because of this time difference, simply starting an electrocardiogram together with animation of a heart beat would not be sufficient for achieving correct synchronization between the variations of electrical signal strength and the motion of cardiac muscle.
- It is desirable in an embodiment of one aspect to provide a technique for synchronizing an electrocardiogram measured from a patient with simulated behavior of his or her heart.
- In an embodiment of one aspect, there is provided a visualization apparatus, including: storage means for storing a three-dimensional model of a heart of a patient, heart behavior data representing shapes of the heart at different time steps of a behavioral simulation of the heart, and electrocardiogram data representing temporal variations of an electrical signal in myocardium that have been measured from the patient; and computation means for determining a first time step at which the heart exhibits a first behavior in response to a first wave of the electrical signal, as well as a second time step at which the heart exhibits a second behavior in response to a second wave of the electrical signal, based on the heart behavior data, and for reproducing behavior of the heart over time by updating the three-dimensional model according to the heart behavior data, simultaneously with variations in strength of the electrical signal over time according to the electrocardiogram data, such that a first shape of the heart at the first time step is reproduced simultaneously with the first wave of the electrical signal, and such that a second shape of the heart at the second time step is reproduced simultaneously with the second wave of the electrical signal.
- The invention is described, by way of example only, with reference to the following drawings, in which:
-
FIG. 1 illustrates an exemplary functional structure of a visualization apparatus according to a first embodiment; -
FIG. 2 illustrates an exemplary hardware configuration of a computer according to a second embodiment; -
FIG. 3 is a functional block diagram of a computer of the second embodiment; -
FIG. 4 illustrates an exemplary structure of data stored in an unstructured grid data storage unit; -
FIG. 5 illustrates an example of a three-dimensional cardiac model; -
FIG. 6 illustrates an exemplary structure of data stored in a simulation result storage unit; -
FIG. 7 illustrates an exemplary structure of data stored in an electrocardiogram data storage unit; -
FIG. 8 illustrates an example of propagation of cardiac excitation; -
FIG. 9 illustrates an example of an electrocardiogram; -
FIG. 10 illustrates how an electrocardiogram relates to propagation of cardiac excitation; -
FIG. 11 illustrates an example of a twelve-lead electrocardiogram; -
FIG. 12 is a flowchart of a visualization process; -
FIG. 13 is a flowchart illustrating a procedure of determining initial positions of atriums and ventricles; -
FIG. 14 illustrates the bottommost portion of a ventricular cavity; -
FIG. 15 illustrates an example of long and short axes; -
FIG. 16 illustrates initial positions; -
FIGS. 17 and18 are first and second halves of a flowchart illustrating a procedure of producing synchronization data; -
FIG. 19 illustrates an example of synchronization data; -
FIG. 20 illustrates an example of a picture that reproduces heart behavior together with an electrocardiogram; -
FIG. 21 illustrates an exemplary screenshot of a twelve-lead electrocardiogram; -
FIG. 22 illustrates how the heart changes its shape with the progress of reproduction time; and -
FIG. 23 illustrates an exemplary screenshot that depicts heart behavior together with an electrocardiogram in the case of arrhythmia. - Several embodiments of the present invention will be described below with reference to the accompanying drawings. These embodiments may be combined with each other unless they have contradictory features.
- This section describes a first embodiment. To start with,
FIG. 1 illustrates an exemplary functional structure of a visualization apparatus according to a first embodiment. The illustratedvisualization apparatus 10 includes astorage unit 11 and acomputation unit 12. - The
storage unit 11 stores a three-dimensionalcardiac model 1,heart behavior data 2, andelectrocardiogram data 3. The three-dimensionalcardiac model 1 is a structure model representing a heart under analysis. Theheart behavior data 2 represents shapes of the heart at different time steps of a behavioral simulation of the heart. For reproduction of simulated behavior of the heart, the time steps are labeled in their chronological order, with successively larger numbers starting from zero. Theelectrocardiogram data 3 represents temporal variations of an electrical signal in myocardium that have been measured from the patient's body. For example, the electrical signal is measured in terms of voltage. - Based on of the
heart behavior data 2 noted above, thecomputation unit 12 determines a first time step at which the heart exhibits a first behavior in response to a first wave of the electrical signal, as well as a second time step at which the heart exhibits a second behavior in response to a second wave of the electrical signal (step S1). For example, the first wave is P wave seen in an electrocardiogram given by theelectrocardiogram data 3, and the first time step refers to the moment when the atriums begin to contract. The second wave is, on the other hand, R wave seen in the electrocardiogram, and the second time step refers to the moment when the ventricles begin to contract. - The
computation unit 12 reproduces behavior of the heart over time by updating the three-dimensionalcardiac model 1 according to theheart behavior data 2, simultaneously with variations in strength of the electrical signal over time according to the electrocardiogram data 3 (step S2). Here thecomputation unit 12 coordinates the reproduction of heart behavior such that a first shape of the heart at the first time step will be reproduced simultaneously with the first wave of the electrical signal, and such that a second shape of the heart at the second time step will be reproduced simultaneously with the second wave of the electrical signal. More specifically, thecomputation unit 12 reproduces the first shape at the moment when the reproduced electrical signal reaches a peak (maximum) of the first wave, and reproduces the second shape at the moment when the reproduced electrical signal reaches a peak of the second wave. Thecomputation unit 12 displays the reproduced electrocardiogram and heart behavior on amonitor screen 4, for example. - In operation of the above-described
visualization apparatus 10, thecomputation unit 12 analyzesheart behavior data 2 obtained as result of a simulation and determines a first time step at which the atriums begin to contract. This first time step is distinguished by its number i, where i is an integer equal to or greater than zero. Thecomputation unit 12 also determines a second time step at which the ventricles begin to contract. This second time step is distinguished by its number j, where j is an integer equal to or greater than zero. - The
computation unit 12 then reproduces an electrocardiogram and an image depicting the heart's behavior in a synchronized manner. Specifically, thecomputation unit 12 determines when to reproduce each time step of theheart behavior data 2, on the basis of theelectrocardiogram data 3. For example, the i-th time step (i.e., start of atrial contraction) is supposed to be reproduced when the electrical signal exhibits a peak of P wave in the electrocardiogram. That moment is referred to as time ti inFIG. 1 . Similarly the j-th time step (i.e., start of ventricular contraction) is supposed to be reproduced when the electrical signal exhibits a peak of R wave in the electrocardiogram. That moment is referred to as time tj inFIG. 1 . - In accordance with the reproduction time determined in the way described above, the
visualization apparatus 10 dynamically reproduces how the heart changes its shape at each time step, as the electrical signal varies with time in the reproduced electrocardiogram, thus achieving correct synchronization between the electrocardiogram and heart behavior. For example, the electrocardiogram is reproduced as a graph with horizontal and vertical axes respectively representing reproduction time and electrical signal intensity. With the progress of reproduction time, a special mark representing the current position moves along the curved line of the graph so as to indicate the current signal strength being reproduced. - The
visualization apparatus 10 displays the synchronized electrocardiogram and heart behavior on amonitor screen 4, thus making it easier for the viewer to understand the relationship between electrical signals seen in the electrocardiogram and actual behavior of the heart. Particularly, thevisualization apparatus 10 is designed to adjust the electrocardiogram and heart behavior such that the start of atrial contraction is timed to the peak of P wave, and the start of ventricular contraction is timed to the peak of R wave. This adjustment reflects the delay time from reception of electrical signals by myocardium and consequent contraction of the myocardium, and thus contributes to correct synchronization between the electrocardiogram and heart behavior. More specifically, the atrial myocardium receives an electrical signal when P wave begins. The atriums, however, do not respond immediately, but start to contract some time after the reception of those electrical signals. For realistic reproduction of heart behavior, thevisualization apparatus 10 waits for the electrocardiogram to reach the peak of P wave before rendering the contraction of atriums. - The above-described
computation unit 12 may be implemented as, for example, functions performed by a processor in thevisualization apparatus 10. Thestorage unit 11 may be implemented as part of the data storage space of memory devices or the like in thevisualization apparatus 10. - It is noted that the lines interconnecting the functional blocks in
FIG. 1 represent some of their communication paths. The person skilled in the art would appreciate that there may be other communication paths in actual implementations. - It is also noted that the
storage unit 11 discussed above inFIG. 1 may be termed as a storage means for storing a three-dimensionalcardiac model 1,heart behavior data 2, andelectrocardiogram data 3. Similarly, thecomputation unit 12 discussed above inFIG. 1 may be termed as a computation means for determining first and second time steps and reproducing behavior of the heart simultaneously with variations in electrical signal strength. - This section describes a second embodiment, which provides more specific techniques for visualizing the result of behavioral simulation of a patient's heart, precisely in synchronization with his or her electrocardiogram.
-
FIG. 2 illustrates an exemplary hardware configuration of a computer according to the second embodiment. The illustratedcomputer 100 includes aprocessor 101 to control its entire operation. Theprocessor 101 is coupled to amemory 102 and other various devices and interfaces via a bus 109. Theprocessor 101 may be a single processing device or a multiprocessor system including two or more processing devices, such as a central processing unit (CPU), micro processing unit (MPU), or digital signal processor (DSP). It is also possible to implement the processing functions of theprocessor 101 wholly or partly in an application-specific integrated circuit (ASIC), programmable logic device (PLD), or other electronic circuits, or their combinations. - The
memory 102 serves as a primary storage device of thecomputer 100. Specifically, thememory 102 is used to temporarily store at least some of the operating system (OS) programs and application programs that theprocessor 101 executes, in addition to other various data objects that it manipulates at runtime. Thememory 102 may be, for example, a random access memory (RAM) or other volatile semiconductor memory devices. - Other devices on the bus 109 include a hard disk drive (HDD) 103, a
graphics processor 104, aninput device interface 105, anoptical disc drive 106, aperipheral device interface 107, and anetwork interface 108. TheHDD 103 writes and reads data magnetically on its internal platters. TheHDD 103 serves as a secondary storage device in thecomputer 100 to store program files and data files relating to the operating system and applications. Flash memory and other semiconductor memory devices may also be used as secondary storage devices, in place of or together with theHDD 103. - The
graphics processor 104, coupled to amonitor 21, produces video images in accordance with drawing commands from theprocessor 101 and displays them on a screen of themonitor 21. Themonitor 21 may be, for example, a cathode ray tube (CRT) display or a liquid crystal display. - The
input device interface 105 is used to connect input devices such as akeyboard 22 and a mouse 23 to thecomputer 100 and supply signals from these devices to theprocessor 101. The mouse 23 is a pointing device, which may be replaced with other kinds of pointing devices such as a touchscreen, tablet, touchpad, and trackball. - The
optical disc drive 106 reads out data encoded on anoptical disc 24, by using laser light or the like. Theoptical disc 24 is a portable data storage medium, the data recorded on which can be read as a reflection of light or the lack of the same. Theoptical disc 24 may be a digital versatile disc (DVD), DVD-RAM, compact disc read-only memory (CD-ROM), CD-Recordable (CD-R), or CD-Rewritable (CD-RW), for example. - The
peripheral device interface 107 is a communication interface for connecting some peripheral devices to thecomputer 100. For example, theperipheral device interface 107 may be used to connect amemory device 25 and a memory card reader/writer 26. Thememory device 25 is a data storage medium with a capability of communicating with theperipheral device interface 107. The memory card reader/writer 26 is an adapter used to write data to or read data from amemory card 27, which is a data storage medium in the form of a small card. Thenetwork interface 108 is connected to anetwork 20 to exchange data with other computers or network devices (not illustrated). - The above hardware configuration serves as a platform of processing functions to implement the second embodiment. It is noted that the foregoing
visualization apparatus 10 of the first embodiment may also be implemented on the same hardware platform discussed inFIG. 2 for thecomputer 100 of the second embodiment. - The
computer 100 provides various processing functions of the second embodiment by executing programs stored in a non-transitory computer-readable storage medium. These processing functions of thecomputer 100 are encoded in the form of computer programs, which may be stored in a variety of storage media. For example, thecomputer 100 may store program files in itsown HDD 103. Theprocessor 101 loads thememory 102 with at least part of these programs read out of theHDD 103 and executes them on thememory 102. It is also possible to store programs files in anoptical disc 24,memory device 25,memory card 27, or the like. The programs stored in a portable storage medium are installed in theHDD 103 under the control of theprocessor 101, so that they are ready to execute upon request. It may also be possible for theprocessor 101 to execute program codes read out of a portable storage medium, without installing them in its local storage devices. -
FIG. 3 is a functional block diagram of a computer of the second embodiment. The illustratedcomputer 100 includes an unstructured griddata storage unit 110, aheart simulator 120, a simulationresult storage unit 130, an electrocardiogramdata storage unit 140, and avisualization unit 150. - The unstructured grid
data storage unit 110 stores unstructured grid data that describes the shape of a heart in three-dimensional form. For example, unstructured grid data expresses the geometry of a heart as a collection of tetrahedral elements with irregular shapes. More specifically, many nodes are placed in a heart simulation domain, where each four neighboring nodes define a tetrahedron. The heart is thus represented as a collection of many tetrahedrons each serving as an element that portrays myocardial cells. For example, the unstructured griddata storage unit 110 may be implemented as part of storage space of thememory 102 orHDD 103. - The
heart simulator 120 mimics the behavior of a heart under test, including its beating motion, on the basis of a given three-dimensional cardiac model. Theheart simulator 120 may also simulate coronary circulation (blood flow in the heart). Theheart simulator 120 outputs its simulation result to the simulationresult storage unit 130. For example, theheart simulator 120 repetitively calculates new node positions of the three-dimensional cardiac model and some relating physical quantities (e.g., blood pressure and amount of blood flow) at each node or cardiac element, while advancing the simulation clock by a predetermined time step size. The node positions and their relating physical quantities at a specific time step are calculated on the basis of those obtained at one or more preceding time steps. The simulation result includes the calculated positions of nodes and new physical quantities at those nodes or elements at each predetermined point on the simulation time axis. - The simulation
result storage unit 130 stores data of simulation results discussed above. For example, the simulationresult storage unit 130 may be implemented as part of storage space of thememory 102 orHDD 103. - The electrocardiogram
data storage unit 140 stores original measurement data of an electrocardiogram of a patient. This data indicates the strength of electrical signals produced in the heart. For example, the electrocardiogramdata storage unit 140 may be implemented as part of storage space of thememory 102 orHDD 103. - The
visualization unit 150 displays the patient's electrocardiogram and heart behavior on themonitor 21 in a synchronized manner. For example, the simulated heart behavior includes contraction of atriums and ventricles. Thevisualization unit 150 positions the electrocardiogram in such a way that the peak of P wave will match with the atrial contraction, and the peak of R wave with the ventricular contraction. - The
visualization unit 150 is an exemplary implementation of thecomputation unit 12 discussed previously inFIG. 1 for the first embodiment. The unstructured griddata storage unit 110, simulationresult storage unit 130, and electrocardiogramdata storage unit 140 are collectively equivalent to thestorage unit 11 discussed previously inFIG. 1 for the first embodiment. It is noted that the lines interconnecting the functional blocks inFIG. 3 represent some of their communication paths. The person skilled in the art would appreciate that there may be other communication paths in actual implementations. It is also noted that the functions of each element seen inFIG. 3 may be implemented as program modules executed by a computer. - Referring now to
FIG. 4 , an exemplary structure of data stored in the unstructured griddata storage unit 110 will be described below. The unstructured griddata storage unit 110 contains, for example, a node data table 111 and an element data table 112, which constitute unstructured grid data. Each entry of the node data table 111 defines a node as a combination of its node number and coordinate position. The node coordinates defined in this node data table 111 indicate the initial position of each node before a simulation is started. During a simulation, these node coordinates in the node data table 111 are changed with the progress of simulated heart beat motion. The element data table 112, on the other hand, describes tetrahedral elements of a cardiac model. Specifically, each tetrahedral element is distinguished by a specific element number, and its four corners are designated by their corresponding node numbers. - A three-dimensional cardiac model is produced from the foregoing data in the unstructured grid
data storage unit 110 ofFIG. 4 .FIG. 5 illustrates an example of such a three-dimensional cardiac model. The illustrated three-dimensionalcardiac model 31 is made up of a large number of tetrahedral elements. With a given initial condition of electrical signals in this three-dimensionalcardiac model 31, theheart simulator 120 computationally reproduces a process of electrical signal conduction (propagation of excitation) in the heart muscle. The three-dimensionalcardiac model 31 is also given some other conditions relating to the contraction and relaxation of myocardium, enabling theheart simulator 120 to mimic the heart's mechanical behavior (motion) as well. As the simulation progresses, its outcome is accumulated in the simulationresult storage unit 130 in the way described below. -
FIG. 6 illustrates an exemplary structure of data stored in a simulation result storage unit. Each single cycle of computation in the simulation process is referred to as a "simulation time step" or simply "time step." The simulationresult storage unit 130 contains a plurality ofmyocardium datasets myocardium datasets - More specifically, each record in the
myocardium datasets - Referring now to
FIG. 7 , the next section describes an exemplary structure of electrocardiogram data stored in the electrocardiogramdata storage unit 140. The illustrated electrocardiogramdata storage unit 140 stores a plurality ofelectrocardiogram datasets data storage unit 140 stores twelve electrocardiogram datasets corresponding to the twelve leads. Eachelectrocardiogram dataset - The above-described electrocardiogram data has been obtained by measuring myocardial voltage of the patient of interest, with a plurality of electrodes attached to his or her body. The measured values of myocardium voltage represent the strength of propagating electrical signals that cause cardiac excitation.
- The next section will describe how the excitation propagates over the myocardium and how it is detected as electrical signals.
-
FIG. 8 illustrates an example of propagation of cardiac excitation. The illustratedheart 40 is formed from four chambers calledright atrium 41, leftatrium 42,right ventricle 43, and leftventricle 44. Each of these heart chambers contracts in accordance with electrical signals that propagate through the heart's stimulus conduction system. Specifically, the stimulus conduction system is made up of a collection of muscle cells specialized for conducting electrical signals that stimulate muscle contraction. - The stimulus conduction system includes a tissue called "sinoatrial node" 45 that serves as the source of electrical signals. The
sinoatrial node 45 sits in theright atrium 41 and generates an electrical impulse signal at regular intervals without the need for external stimulation. The generated signal is sent first to theright atrium 41, and to theleft atrium 42 as well, and propagates through the atrial muscle before reaching the place called "atrioventricular node" 46. The muscles of theright atrium 41 and leftatrium 42 contract in response to the electrical signals that they receive. Then with some delay time after that, theatrioventricular node 46 transfers the electrical signal to the ventricles. The electrical signal then bifurcates to the left and right bundle branches. These signals go down to the bottom of each ventricle and then propagate across the entire ventricular muscle. - Such excitation-causing electrical signals are observed as the voltage potential of myocardium through a process called electrocardiography. The graph representing these recorded voltage variations over time is referred to as an electrocardiogram.
-
FIG. 9 illustrates an example of an electrocardiogram. A healthy heart exhibits six waves named P, Q, R, S, T, and U waves in its electrocardiogram. Q, R, and S waves occur back-to-back (i.e., without interruption) and are collectively referred to as a QRS complex. P wave represents depolarization (excitation) of the atriums. That is, P wave is the first upward (i.e., positive) wave that comes after the electrical signal begins to propagate in a heart beat cycle. The subsequent QRS complex represents depolarization (excitation) of the ventricles, which begins with a downward (i.e., negative) Q wave and continues to an upward R wave and then to a downward S wave. -
FIG. 10 illustrates how an electrocardiogram relates to propagation of cardiac excitation. Specifically, thesinoatrial node 45 generates an electrical signal, initiating P wave. This P wave disappears when the electrical signal reaches theatrioventricular node 46. The electrical signal further propagates from theatrioventricular node 46 through the bundle of His 47 and bifurcates into the left and right bundle branches, causing a QRS complex to begin. The QRS complex is finished when the bifurcated electrical signals arrive at the extreme ends of those two bundle branches within the ventricular myocardium. - Most electrocardiograms are obtained as twelve leads, meaning that twelve different views of a heart are captured at a time.
FIG. 11 illustrates an example of a twelve-lead electrocardiogram. The illustrated twelve-lead electrocardiogram 51 actually includes twelve different waveforms, or leads. Many leads have R waves larger than their subsequent S waves (negative), while some may exhibit S waves larger than R waves. There may even be a missing wave in some of those leads. Electrocardiograms contain some amount of noise introduced during the measurement process, which may be visible in their waveforms. - The
computer 100 of the second embodiment displays such an electrocardiogram together with a picture visualizing simulated behavior of the heart in question. This feature of thecomputer 100 permits the user to understand how the heart behaves in response to electrical signals seen in the electrocardiogram. - The patient's electrocardiogram is used to determine the values of parameters for a behavioral simulation of his or her heart. With such parameters based on electrocardiogram data, the simulation result will reflect the condition of the patient's cardiac excitation system. Suppose, for example, the patient in question has a symptom of cardiac arrhythmia. The use of his electrocardiogram data for simulation makes it possible to reproduce the heart's behavior under the arrhythmic condition.
- The
visualization unit 150 makes some timing adjustment to synchronize the heart actions with the given electrocardiogram when reproducing them on a monitor screen. Specifically, P wave in the electrocardiogram is timed to atrial contraction caused by an electrical signal from thesinoatrial node 45, and R wave is timed to ventricular contraction caused by an electrical signal from theatrioventricular node 46. In other words, thevisualization unit 150 renders the reproduced heart behavior so as to make the atriums begin to contract at the peak point of P wave, as well as to make the ventricles begin to contract at the peak point of R wave. - The following description will now explain how the
visualization unit 150 reproduces heart behavior in a three-dimensional model in synchronization with a corresponding electrocardiogram.FIG. 12 is a flowchart of a visualization process. - (Step S101) The
visualization unit 150 determines initial positions of atriums and ventricles. For example, two points in the atriums or ventricles are selected such that they are as distant as possible, assuming that it is before a heart beat begins. A displacement of atriums from their initial positions will be interpreted as a start of atrial contraction. Similarly, a displacement of ventricles from their initial positions will be interpreted as a start of ventricular contraction. Details of this step S101 will be discussed later with reference toFIG. 13 . - (Step S102) The
visualization unit 150 produces synchronization data that specifies when to reproduce heart behavior of each time step. Details of this processing will be discussed later with reference toFIG. 17 . - (Step S103) The
visualization unit 150 reproduces behavior of the heart in its three-dimensional model, and thevisualization unit 150 displays it on themonitor 21 in synchronization with an electrocardiogram. - The description will now provide details of how to determine the initial positions of atriums and ventricles.
FIG. 13 is a flowchart illustrating a procedure of determining initial positions of atriums and ventricles. - (Step S111) The
visualization unit 150 retrieves data of a three-dimensionalcardiac model 31 from the unstructured griddata storage unit 110. - (Step S112) The
visualization unit 150 sets a cardiac axis (long axis of the heart) in the three-dimensionalcardiac model 31. The long axis runs through the heart in its vertical direction. - (Step S113) The
visualization unit 150 sets an atrial short axis and a ventricular short axis in three-dimensionalcardiac model 31. The atrial short axis refers to a lateral axis of atriums that is perpendicular to the long axis of the heart. The ventricular short axis refers to a lateral axis of ventricles that is perpendicular to the long axis of the heart. - (Step S114) The
visualization unit 150 calculates the coordinates of points at which the atrial short axis intersects with free walls of myocardium and determines these intersectional coordinates as the initial positions of atriums. Similarly, thevisualization unit 150 calculates the coordinates of points at which the ventricular short axis intersects with free walls of myocardium and determines these intersectional coordinates as the initial positions of ventricles. - A specific example of initial position setup will now be described below with reference to
FIGS. 14 to 16 . The process starts with setting a long axis of the heart in its three-dimensional cardiac model. It is assumed here that the heart is in the condition before a heart beat begins. Thevisualization unit 150 sets a long axis through the bottommost portion of a ventricular cavity. -
FIG. 14 illustrates the bottommost portion of a ventricular cavity. The long axis is defined as a straight line passing through the illustratedbottommost ventricular portion 60 in the three-dimensionalcardiac model 31. -
FIG. 15 illustrates an example of long and short axes. Thevisualization unit 150 draws aline segment 61 between the center of the aorta valve and that of the mitral valve in the three-dimensionalcardiac model 31. Thevisualization unit 150 then determines the midpoint of thisline segment 61 and draws a straight line that goes through the midpoint and the above-notedbottommost ventricular portion 60, thereby determining along axis 62 as seen inFIG. 15 . - The
visualization unit 150 then produces twostraight lines long axis 62. Onestraight line 63 passes through thebottommost ventricular portion 60. The otherstraight line 64 meets thelong axis 62 at the topmost point of the heart. Let La be the distance between theline segment 61 and the latterstraight line 64, and Lv be the distance between theline segment 61 and the formerstraight line 63. Thevisualization unit 150 now draws a straight line that is perpendicular to thelong axis 62 and apart from theline segment 61 at a distance of la being equal to two fifths of La. This straight line will be an atrialshort axis 65 of the heart. Thevisualization unit 150 draws another straight line that is perpendicular to thelong axis 62 and apart from thestraight line 63 at a distance of Iv being equal to two fifths of Lv. This straight line will be a ventricularshort axis 66 of the heart. - The
visualization unit 150 now determines at which points the atrialshort axis 65 meets free walls (cardiac walls other than the septum) of the atriums. These points are initial positions of the atriums. Similarly, thevisualization unit 150 determines at which points the ventricularshort axis 66 meets free walls of the ventricles, and sets these points as initial positions of the ventricles.FIG. 16 illustrates such initial positions. Specifically, twoinitial positions short axis 65 in the three-dimensionalcardiac model 31, and another twoinitial positions short axis 66. - The above-described procedure determines initial positions of atriums and ventricles. Based on those initial positions, the
visualization unit 150 produces synchronization data as a preparation for reproduction of heart behavior recorded inmyocardium datasets visualization unit 150 seeks a time point at which the atrial free walls move from theirinitial positions visualization unit 150 also seeks another time point at which the ventricular free walls move from theirinitial positions - The
visualization unit 150 further maps a single heart beat cycle in the myocardium datasets to that in the electrocardiogram. For example, a heart beat cycle is defined as a period from the peak of one P wave to that of the next P wave. As an alternative, a heart beat cycle may refer to a period between the rising edges of two P waves in the case where the first simulation time step corresponds to the time point when thesinoatrial node 45 starts to output an electrical signal. As another alternative, a heart beat cycle may start at a change in the ventricles from relaxation to contraction and end at another such change. Such a change from relaxation to contraction of ventricles occurs after R wave appears in the QRS period (i.e., from the beginning of Q wave to the end of S wave). - The
visualization unit 150 now produces synchronization data in the way described below. The synchronization data enables thevisualization unit 150 to determine when to reproduce each time step of simulated heart behavior, while ensuring its synchronization with an associated electrocardiogram.FIGS. 17 and18 are first and second halves of a flowchart illustrating a procedure of producing synchronization data. - (Step S121) The
visualization unit 150 retrieves amyocardium dataset result storage unit 130. - (Step S122) The
visualization unit 150 initializes a variable T to zero, where T indicates the current time step number. - (Step S123) The
visualization unit 150 determines whether variable T is smaller than Max_timestep, or the total number of time steps constituting a single heart beat cycle. If T is smaller than Max_timestep, the process advances to step S124. Otherwise, the process branches to step S131 inFIG. 18 . - (Step S124) Variable T has not reached the end of the heart beat cycle. The
visualization unit 150 thus checks the cardiac shape of time step T to determine whether the atrial myocardium has started to move from its initial position. For example, thevisualization unit 150 watches the current positions of some pieces of atrial myocardium while variable P_top contains no values. When any movement from their initial positions is found at time step T, thevisualization unit 150 determines that the atrial myocardium started to move at that time step T, which means that the atriums have started to contract. Upon detection of such a movement, the process advances to step S125. The process skips to step S128 when there is no such movement as of time step T, or the atriums have already started to move. - (Step S125) The
visualization unit 150 assigns the current value of T to variable P_top to record the time step at which the atriums started contraction. - (Step S126) The
visualization unit 150 checks the cardiac shape of time step T to determine whether the ventricular myocardium has started to move from its initial position. For example, thevisualization unit 150 watches the current positions of some pieces of ventricular myocardium while variable R_top contains no values. When any movement from their initial positions is found at time step T, thevisualization unit 150 determines that the ventricular myocardium started to move at that time step T, which means that the ventricles have started to contract. Upon detection of such a movement, the process advances to step S127. The process skips to step S128 when there is no such movement as of time step T, or the ventricles have already started to move. - (Step S127) The
visualization unit 150 assigns the current value of T to variable R_top to record the time step at which the ventricles started contraction. - (Step S128) The
visualization unit 150 increments variable T by one and makes the process go back to step S123. - The above-described processing steps of
FIG. 17 cause two variables P_top and R_top to gain their values respectively indicating at which time steps the atriums and ventricles started contraction. Thevisualization unit 150 then determines when to render the cardiac shape of each subsequent time step as defined in the myocardium datasets. -
FIG. 18 is the second half of the flowchart illustrating a procedure of generating synchronization data. - (Step S131) The
visualization unit 150 retrieveselectrocardiogram datasets data storage unit 140. - (Step S132) The
visualization unit 150 initializes variable T to zero. - (Step S133) The
visualization unit 150 calculates a first time interval Δt1 of each time step of heart behavior that is supposed to be reproduced in the period from the beginning of electrical signal output to the peak of P wave in the electrocardiogram. Suppose, for example, that the myocardium datasets include n1 time steps between the beginning of a heart beat cycle and the time step P_top. Also suppose that the electrocardiogram gives a time length of t1 between the beginning of electrical signal output and the peak of P wave. Thevisualization unit 150 obtains Δt1 by dividing t1 by n1. - (Step S134) The
visualization unit 150 determines whether variable T is smaller than P_top. If T is smaller than P_top, the process advances to step S135. Otherwise, the process proceeds to step S137. - (Step S135) As will be illustrated later, the synchronization data specifies reproduction time of each time step of heart behavior. At this step S135, the
visualization unit 150 determines reproduction time for time step T such that the cardiac shape of time step T will be rendered Δt1 after that of time step (T-1). It is noted thattime step 0 is supposed to be reproduced simultaneously with the start of a single heart beat cycle in the electrocardiogram. - (Step S136) The
visualization unit 150 increments variable T by one and moves the process back to step S134. - (Step S137) The
visualization unit 150 calculates a second time interval Δt2 of each time step of heart behavior that is supposed to be reproduced in the period from the peak of P wave to the peak of R wave in the electrocardiogram. Suppose, for example, that the myocardium datasets include n2 time steps between two time steps P_top and R_top. Also suppose that the electrocardiogram gives a time length of t2 between the peak of P wave and the peak of R wave. Thevisualization unit 150 obtains Δt2 by dividing t2 by n2. - (Step S138) The
visualization unit 150 determines whether variable T is smaller than R_top. If T is smaller than R_top, the process advances to step S139. Otherwise, the process proceeds to step S141. - (Step S139) The
visualization unit 150 determines reproduction time for time step T such that the cardiac shape of time step T will be rendered Δt2 after that of time step (T-1). - (Step S140) The
visualization unit 150 increments variable T by one and makes the process go back to step S138. - (Step S141) The
visualization unit 150 calculates a third time interval Δt3 of each time step of heart behavior that is supposed to be reproduced in the period from the peak of R wave to the end of the heart beat cycle in the electrocardiogram. Suppose, for example, that the myocardium datasets include n3 time steps between time step R_top and the last time step of the heart beat cycle. Also suppose that the electrocardiogram gives a time length of t3 between the peak of R wave and the end of the heart beat cycle. Thevisualization unit 150 obtains Δt3 by dividing t3 by n3. - (Step S142) The
visualization unit 150 determines whether variable T is smaller than Max_timestep, or the number of time steps constituting the heart beat cycle. If T is smaller than Max_timestep, the process advances to step S143. Otherwise, thevisualization unit 150 exits from the present process ofFIG. 18 . - (Step S143) The
visualization unit 150 determines reproduction time for time step T such that the cardiac shape of time step T will be rendered Δt3 after that of time step (T-1). - (Step S144) The
visualization unit 150 increments variable T by one and makes the process go back to step S142. - The above-described processing steps enable the
visualization unit 150 to produce synchronization data that specifies when to reproduce the cardiac shape of each time step. -
FIG. 19 illustrates an example of synchronization data. The illustratedsynchronization data 151 contains time code values associated with different time step numbers. These values are labeled "reproduction time" and each indicate when the cardiac shape of the associated time step is to be rendered, in terms of the elapsed time since the beginning of a heart beat cycle in the electrocardiogram. Thissynchronization data 151 is located in, for example, a storage space of thememory 102 that thevisualization unit 150 manages. - It is noted that the synchronization data may be implemented in other forms than the table illustrated in the example of
FIG. 19 . For example, the synchronization data may be contained in an array of time code values indexed by the time step number. - It is also noted that one heart beat cycle period may be divided differently from the foregoing example of
FIGS. 18 and19 , which has illustrated three sections demarcated by the peaks of P and R waves. For example, thevisualization unit 150 may be configured to calculate the interval of each time step in a unified period from the peak of R wave in one heart beat cycle to the peak of P wave in the next cycle. - The above description has discussed how the
visualization unit 150 producessynchronization data 151. Thissynchronization data 151 is used to reproduce the heart behavior on a monitor screen so that the user can see it in synchronization with an electrocardiogram. -
FIG. 20 illustrates an example of a picture that reproduces heart behavior together with an electrocardiogram. The illustratedpicture 80 is formed from anelectrocardiogram section 81 and aheart behavior section 82. Theelectrocardiogram section 81 displays an electrocardiogram reproduced from electrocardiogram data, with amark 83 indicating which time point is being reproduced. For example, themark 83 moves from left to right along the waveform indicating voltage strength in the electrocardiogram, according to the progress of cardiac image reproduction. - The
heart behavior section 82 depicts the behavior of the heart in the form of a three-dimensional model by deforming its shape in accordance with a series ofmyocardium datasets heart behavior section 82 has a shape reproduced from a myocardium dataset that corresponds to the reproduction time indicated by themark 83 in theelectrocardiogram section 81. The three-dimensional model is updated with its new myocardium dataset as themark 83 moves with time, so that the behavior of the heart will be presented in an animated way. - While the above example of
FIG. 20 depicts only one lead, theelectrocardiogram section 81 may optionally display all waveforms of twelve leads.FIG. 21 illustrates an exemplary screenshot of a twelve-lead electrocardiogram. The illustratedelectrocardiogram section 81 presents all waveforms of a twelve-lead electrocardiogram, each having amark 83 indicating the current time point in the waveforms. Seen in theheart behavior section 82 is a reproduced image of the heart at the current time point (reproduction time) indicated by themark 83, relative to the beginning of the electrocardiogram. The cardiac image in theheart behavior section 82 changes as themark 83 moves rightward. -
FIG. 22 illustrates how the heart changes its shape with the progress of reproduction time. The illustratedmark 83 moves rightward along the waveform of electrocardiogram in theelectrocardiogram section 81 with the passage of reproduction time. Theheart behavior section 82, on the other hand, contains an image of the heart at a time point corresponding to the current voltage indicated by themark 83 in the electrocardiogram. For example, when themark 83 is at the peak of P wave, theheart behavior section 82 displays the shape of the heart at time step P_top. When themark 83 is at the peak of R wave, theheart behavior section 82 displays the shape of the heart at time step R_top. - The proposed techniques of the second embodiment are not limited to the visualization of normal heart behavior, but may also be applied to the case of arrhythmia. That is, it is possible to depict an arrhythmic heart beat in synchronization with an electrocardiogram of a patient experiencing arrhythmia.
FIG. 23 illustrates an exemplary screenshot that depicts heart behavior together with an electrocardiogram in the case of arrhythmia. More particularly,FIG. 23 illustrates the case of tachyarrhythmia. This means that the patient's electrocardiogram contains more frequent waves than normal persons', which may be observed in theheart behavior section 82 as unnatural creases on the heart surface. - As can be seen from the above examples, an animated image of a patient's heart is displayed in synchronization with his or her electrocardiogram, thus making it easier for the user to understand how the heart actually behaves when a particular pattern of electrical signals appears in the electrocardiogram. In this way, the proposed techniques contribute to more precise diagnosis of the patient's medical condition.
- In one aspect of the embodiments described above, the proposed techniques enable synchronized reproduction of a measured electrocardiogram and a simulated behavior of the heart under diagnosis.
Claims (8)
- A visualization apparatus, comprising:storage means (11) for storing a three-dimensional model (1) of a heart of a patient, heart behavior data (2) representing shapes of the heart at different time steps of a behavioral simulation of the heart, and electrocardiogram data (3) representing temporal variations of an electrical signal in myocardium that have been measured from the patient; andcomputation means (12) for determining a first time step at which the heart exhibits a first behavior in response to a first wave of the electrical signal, as well as a second time step at which the heart exhibits a second behavior in response to a second wave of the electrical signal, based on the heart behavior data (2), and for reproducing behavior of the heart over time by updating the three-dimensional model (1) according to the heart behavior data (2), simultaneously with variations in strength of the electrical signal over time according to the electrocardiogram data (3), such that a first shape of the heart at the first time step is reproduced simultaneously with the first wave of the electrical signal, and such that a second shape of the heart at the second time step is reproduced simultaneously with the second wave of the electrical signal.
- The visualization apparatus according to claim 1, wherein the first wave is P wave appearing in an electrocardiogram, and the second wave is R wave appearing in the electrocardiogram.
- The visualization apparatus according to claim 1 or 2, wherein the first time step is a time step at which atriums of the heart begin to contract, and the second time step is a time step at which ventricles of the heart begin to contract.
- The visualization apparatus according to any of claims 1 to 3, wherein the computation means reproduces the first shape of the heart when the electrical signal reaches a peak of the first wave, and the second shape of the heart when the electrical signal reaches a peak of the second wave.
- The visualization apparatus according to any of claims 1 to 4, wherein:the computation means divides a single heart beat cycle into first to third sections, the first section being a period from a start of the electrical signal that initiates the single heart beat cycle to a peak of the first wave, the second section being a period from the peak of the first wave to a peak of the second wave, the third section being a period from the peak of the second wave to an end of the electrical signal that terminates the single heart beat cycle; andthe computation means determines at what constant time intervals the computation means is to reproduce the shapes of the heart at different time steps, depending on to which of the first to third sections of the single heart beat cycle the different time steps belong.
- The visualization apparatus according to any of claims 1 to 5, wherein:the first time step is a time step at which an initial move of atrial myocardium is detected at an intersection point of a straight line traversing atriums of the heart and a free wall of the atriums; andthe second time step is a time step at which an initial move of ventricular myocardium is detected at an intersection point of a straight line traversing ventricles of the heart and a free wall of the ventricles.
- A visualization method to be executed by a computer, the visualization method comprising:determining a first time step at which a heart of a patient exhibits a first behavior in response to a first wave of an electrical signal in myocardium of the heart, as well as a second time step at which the heart exhibits a second behavior in response to a second wave of the electrical signal, based on heart behavior data (2) representing shapes of the heart at different time steps of a behavioral simulation of the heart; andreproducing behavior of the heart over time by updating a three-dimensional model (1) of the heart according to the heart behavior data (2), simultaneously with variations in strength of the electrical signal over time according to electrocardiogram data (3) representing temporal variations of the electrical signal that have been measured from the patient, such that a first shape of the heart at the first time step is reproduced simultaneously with the first wave of the electrical signal, and such that a second shape of the heart at the second time step is reproduced simultaneously with the second wave of the electrical signal.
- A program that causes a computer to perform a procedure comprising:determining a first time step at which a heart of a patient exhibits a first behavior in response to a first wave of an electrical signal in myocardium of the heart, as well as a second time step at which the heart exhibits a second behavior in response to a second wave of the electrical signal, based on heart behavior data (2) representing shapes of the heart at different time steps of a behavioral simulation of the heart; andreproducing behavior of the heart over time by updating a three-dimensional model (1) of the heart according to the heart behavior data (2), simultaneously with variations in strength of the electrical signal over time according to electrocardiogram data (3) representing temporal variations of the electrical signal that have been measured from the patient, such that a first shape of the heart at the first time step is reproduced simultaneously with the first wave of the electrical signal, and such that a second shape of the heart at the second time step is reproduced simultaneously with the second wave of the electrical signal.
Applications Claiming Priority (1)
| Application Number | Priority Date | Filing Date | Title |
|---|---|---|---|
| JP2014129752A JP6338055B2 (en) | 2014-06-25 | 2014-06-25 | Visualization device, visualization method, and visualization program |
Publications (2)
| Publication Number | Publication Date |
|---|---|
| EP2959830A1 true EP2959830A1 (en) | 2015-12-30 |
| EP2959830B1 EP2959830B1 (en) | 2019-05-15 |
Family
ID=53476666
Family Applications (1)
| Application Number | Title | Priority Date | Filing Date |
|---|---|---|---|
| EP15170995.3A Not-in-force EP2959830B1 (en) | 2014-06-25 | 2015-06-08 | Apparatus, method, and program for visualization |
Country Status (3)
| Country | Link |
|---|---|
| US (1) | US10115192B2 (en) |
| EP (1) | EP2959830B1 (en) |
| JP (1) | JP6338055B2 (en) |
Families Citing this family (5)
| Publication number | Priority date | Publication date | Assignee | Title |
|---|---|---|---|---|
| CN106774271B (en) * | 2017-01-03 | 2020-06-23 | 中车株洲电力机车有限公司 | Urban rail transit vehicle fault diagnosis and display system |
| CN110310744B (en) * | 2019-06-10 | 2021-12-24 | 暨南大学 | Construction method of virtual physiological tissue of sinus node, storage medium and computing device |
| JP7074971B2 (en) * | 2020-06-12 | 2022-05-25 | 元吉 大幅 | Plant cultivation equipment |
| CN112711881B (en) * | 2020-12-29 | 2023-03-31 | 深圳技术大学 | Physiological dynamic blood flow simulation method, device, computer equipment and storage medium |
| CN113288167B (en) * | 2021-04-01 | 2022-12-23 | 中国医学科学院北京协和医院 | Auxiliary diagnosis equipment, device and computer readable storage medium for cardiomyopathy |
Citations (3)
| Publication number | Priority date | Publication date | Assignee | Title |
|---|---|---|---|---|
| US5273038A (en) * | 1990-07-09 | 1993-12-28 | Beavin William C | Computer simulation of live organ |
| JP2007313122A (en) | 2006-05-26 | 2007-12-06 | Fukuda Denshi Co Ltd | ECG analyzer |
| US20090135992A1 (en) * | 2007-11-27 | 2009-05-28 | Regis Vaillant | Method for the processing of radiography cardiac images with a view to obtaining a subtracted and registered image |
Family Cites Families (4)
| Publication number | Priority date | Publication date | Assignee | Title |
|---|---|---|---|---|
| US5803084A (en) * | 1996-12-05 | 1998-09-08 | Olson; Charles | Three dimensional vector cardiographic display and method for displaying same |
| RS49856B (en) * | 2004-01-16 | 2008-08-07 | Boško Bojović | DEVICE AND PROCEDURE FOR VISUAL THREE-DIMENSIONAL ECG DATA PRESENTATION |
| WO2007146864A2 (en) | 2006-06-13 | 2007-12-21 | Rhythmia Medical, Inc. | Non-contact cardiac mapping, including moving catheter and multi-beat integration |
| US8209002B2 (en) * | 2007-08-01 | 2012-06-26 | Newcardio, Inc. | Method and apparatus for quantitative assessment of cardiac electrical events |
-
2014
- 2014-06-25 JP JP2014129752A patent/JP6338055B2/en not_active Expired - Fee Related
-
2015
- 2015-06-04 US US14/730,592 patent/US10115192B2/en active Active
- 2015-06-08 EP EP15170995.3A patent/EP2959830B1/en not_active Not-in-force
Patent Citations (3)
| Publication number | Priority date | Publication date | Assignee | Title |
|---|---|---|---|---|
| US5273038A (en) * | 1990-07-09 | 1993-12-28 | Beavin William C | Computer simulation of live organ |
| JP2007313122A (en) | 2006-05-26 | 2007-12-06 | Fukuda Denshi Co Ltd | ECG analyzer |
| US20090135992A1 (en) * | 2007-11-27 | 2009-05-28 | Regis Vaillant | Method for the processing of radiography cardiac images with a view to obtaining a subtracted and registered image |
Non-Patent Citations (2)
| Title |
|---|
| SERMESANT M ET AL: "An Electromechanical Model of the Heart for Image Analysis and Simulation", IEEE TRANSACTIONS ON MEDICAL IMAGING, IEEE SERVICE CENTER, PISCATAWAY, NJ, US, vol. 25, no. 5, 1 May 2006 (2006-05-01), pages 612 - 625, XP001545798, ISSN: 0278-0062, DOI: 10.1109/TMI.2006.872746 * |
| TSUYUNASHI; OGURI; MATSUO; IWATA: "The Holter ECG waveform classification using clustering", THE INSTITUTE OF ELECTRONICS, INFORMATION AND COMMUNICATION ENGINEERS (IEICE), TECHNICAL REPORT OF IEICE. MBE, ME AND BIOCYBERNETICS, vol. 103, no. 489, 1 December 2003 (2003-12-01), pages 23 - 28 |
Also Published As
| Publication number | Publication date |
|---|---|
| US20150379755A1 (en) | 2015-12-31 |
| JP2016007364A (en) | 2016-01-18 |
| US10115192B2 (en) | 2018-10-30 |
| JP6338055B2 (en) | 2018-06-06 |
| EP2959830B1 (en) | 2019-05-15 |
Similar Documents
| Publication | Publication Date | Title |
|---|---|---|
| Sermesant et al. | Applications of artificial intelligence in cardiovascular imaging | |
| EP2959830B1 (en) | Apparatus, method, and program for visualization | |
| US10241968B2 (en) | System and method for real-time simulation of patient-specific cardiac electrophysiology including the effect of the electrical conduction system of the heart | |
| US11393593B2 (en) | Biological simulation apparatus and biological simulation apparatus control method | |
| JP4521271B2 (en) | An image processing system for displaying information on the movement of the top of a deformable three-dimensional object | |
| US10325686B2 (en) | System and methods for integrated and predictive analysis of molecular, imaging, and clinical data for patient-specific management of diseases | |
| Ukwatta et al. | Image‐based reconstruction of three‐dimensional myocardial infarct geometry for patient‐specific modeling of cardiac electrophysiology | |
| Ukwatta et al. | Myocardial infarct segmentation from magnetic resonance images for personalized modeling of cardiac electrophysiology | |
| Hansalia et al. | The value of live/real time three‐dimensional transesophageal echocardiography in the assessment of valvular vegetations | |
| Soni et al. | A comprehensive review on CFD simulations of left ventricle hemodynamics: numerical methods, experimental validation techniques, and emerging trends | |
| Burman et al. | Large-scale simulation of realistic cardiac ultrasound data with clinical appearance: methodology and open-access database | |
| CN109068984A (en) | Myocardial excitement determination device | |
| Akdeniz et al. | Deep learning for multi-level detection and localization of myocardial scars based on regional strain validated on virtual patients | |
| Mishra et al. | Innovative ECG signal modeling: unleashing the potential of the parametric spline approach for advancing global health challenges | |
| WO2022266291A1 (en) | Synthetic echo from ecg | |
| Coelho et al. | A mobile device tool to assist the ECG interpretation based on a realistic 3D virtual heart simulation | |
| JP7044297B2 (en) | Excitement propagation visualization device, excitement propagation visualization method, and excitement propagation visualization program | |
| Sharda | Patient Specific Computational Fluid Dynamic in the Left Atrium. Atrial Fibrillation vs Sinus Rhythm | |
| Abdala | Electro-Fluid-Mechanical Computational Models of the Human Heart | |
| Nataren Moran et al. | Generating patient-specific computational models with point cloud data from human atrial electrophysiology studies | |
| Canè | Patient-Specific Computational Fluid Dynamics Models of the Human Left Heart Using the Chimera Technique | |
| Bergquist | Advances in Electrocardiographic Imaging: Technical Improvements and Novel Applications | |
| Gupta | Universal Atrial Coordinate (UAC) for Wall Motion Deep Learning | |
| Rahmani et al. | A cohort-based global sensitivity benchmark of MRI-derived whole-heart electromechanical models in healthy hearts | |
| Rodrigues et al. | Patient-specific left ventricle mesh generation using the bull’s eye of the wall thickness measurements from medical images |
Legal Events
| Date | Code | Title | Description |
|---|---|---|---|
| PUAI | Public reference made under article 153(3) epc to a published international application that has entered the european phase |
Free format text: ORIGINAL CODE: 0009012 |
|
| AK | Designated contracting states |
Kind code of ref document: A1 Designated state(s): AL AT BE BG CH CY CZ DE DK EE ES FI FR GB GR HR HU IE IS IT LI LT LU LV MC MK MT NL NO PL PT RO RS SE SI SK SM TR |
|
| AX | Request for extension of the european patent |
Extension state: BA ME |
|
| 17P | Request for examination filed |
Effective date: 20160411 |
|
| RBV | Designated contracting states (corrected) |
Designated state(s): AL AT BE BG CH CY CZ DE DK EE ES FI FR GB GR HR HU IE IS IT LI LT LU LV MC MK MT NL NO PL PT RO RS SE SI SK SM TR |
|
| RIN1 | Information on inventor provided before grant (corrected) |
Inventor name: WATANABE, MASAHIRO Inventor name: FUCHIKAMI, SATOSHI Inventor name: HISADA, TOSHIAKI Inventor name: ATAKA, TADASHI Inventor name: WASHIO, TAKUMI Inventor name: OKADA, JUN-ICHI Inventor name: SUGIURA, SEIRYO Inventor name: KADOOKA, YOSHIMASA |
|
| RIC1 | Information provided on ipc code assigned before grant |
Ipc: G06T 17/00 20060101ALN20180927BHEP Ipc: G06F 19/00 20110101ALI20180927BHEP Ipc: A61B 5/0452 20060101AFI20180927BHEP Ipc: G06T 19/00 20110101ALN20180927BHEP |
|
| RIC1 | Information provided on ipc code assigned before grant |
Ipc: G06T 19/00 20110101ALN20181005BHEP Ipc: G06T 17/00 20060101ALN20181005BHEP Ipc: G06F 19/00 20110101ALI20181005BHEP Ipc: A61B 5/0452 20060101AFI20181005BHEP |
|
| GRAP | Despatch of communication of intention to grant a patent |
Free format text: ORIGINAL CODE: EPIDOSNIGR1 |
|
| STAA | Information on the status of an ep patent application or granted ep patent |
Free format text: STATUS: GRANT OF PATENT IS INTENDED |
|
| INTG | Intention to grant announced |
Effective date: 20181207 |
|
| GRAS | Grant fee paid |
Free format text: ORIGINAL CODE: EPIDOSNIGR3 |
|
| GRAA | (expected) grant |
Free format text: ORIGINAL CODE: 0009210 |
|
| STAA | Information on the status of an ep patent application or granted ep patent |
Free format text: STATUS: THE PATENT HAS BEEN GRANTED |
|
| AK | Designated contracting states |
Kind code of ref document: B1 Designated state(s): AL AT BE BG CH CY CZ DE DK EE ES FI FR GB GR HR HU IE IS IT LI LT LU LV MC MK MT NL NO PL PT RO RS SE SI SK SM TR |
|
| REG | Reference to a national code |
Ref country code: CH Ref legal event code: EP |
|
| REG | Reference to a national code |
Ref country code: IE Ref legal event code: FG4D |
|
| REG | Reference to a national code |
Ref country code: DE Ref legal event code: R096 Ref document number: 602015030223 Country of ref document: DE |
|
| REG | Reference to a national code |
Ref country code: NL Ref legal event code: MP Effective date: 20190515 |
|
| REG | Reference to a national code |
Ref country code: LT Ref legal event code: MG4D |
|
| PG25 | Lapsed in a contracting state [announced via postgrant information from national office to epo] |
Ref country code: PT Free format text: LAPSE BECAUSE OF FAILURE TO SUBMIT A TRANSLATION OF THE DESCRIPTION OR TO PAY THE FEE WITHIN THE PRESCRIBED TIME-LIMIT Effective date: 20190915 Ref country code: AL Free format text: LAPSE BECAUSE OF FAILURE TO SUBMIT A TRANSLATION OF THE DESCRIPTION OR TO PAY THE FEE WITHIN THE PRESCRIBED TIME-LIMIT Effective date: 20190515 Ref country code: ES Free format text: LAPSE BECAUSE OF FAILURE TO SUBMIT A TRANSLATION OF THE DESCRIPTION OR TO PAY THE FEE WITHIN THE PRESCRIBED TIME-LIMIT Effective date: 20190515 Ref country code: NL Free format text: LAPSE BECAUSE OF FAILURE TO SUBMIT A TRANSLATION OF THE DESCRIPTION OR TO PAY THE FEE WITHIN THE PRESCRIBED TIME-LIMIT Effective date: 20190515 Ref country code: SE Free format text: LAPSE BECAUSE OF FAILURE TO SUBMIT A TRANSLATION OF THE DESCRIPTION OR TO PAY THE FEE WITHIN THE PRESCRIBED TIME-LIMIT Effective date: 20190515 Ref country code: HR Free format text: LAPSE BECAUSE OF FAILURE TO SUBMIT A TRANSLATION OF THE DESCRIPTION OR TO PAY THE FEE WITHIN THE PRESCRIBED TIME-LIMIT Effective date: 20190515 Ref country code: FI Free format text: LAPSE BECAUSE OF FAILURE TO SUBMIT A TRANSLATION OF THE DESCRIPTION OR TO PAY THE FEE WITHIN THE PRESCRIBED TIME-LIMIT Effective date: 20190515 Ref country code: NO Free format text: LAPSE BECAUSE OF FAILURE TO SUBMIT A TRANSLATION OF THE DESCRIPTION OR TO PAY THE FEE WITHIN THE PRESCRIBED TIME-LIMIT Effective date: 20190815 Ref country code: LT Free format text: LAPSE BECAUSE OF FAILURE TO SUBMIT A TRANSLATION OF THE DESCRIPTION OR TO PAY THE FEE WITHIN THE PRESCRIBED TIME-LIMIT Effective date: 20190515 |
|
| PG25 | Lapsed in a contracting state [announced via postgrant information from national office to epo] |
Ref country code: RS Free format text: LAPSE BECAUSE OF FAILURE TO SUBMIT A TRANSLATION OF THE DESCRIPTION OR TO PAY THE FEE WITHIN THE PRESCRIBED TIME-LIMIT Effective date: 20190515 Ref country code: GR Free format text: LAPSE BECAUSE OF FAILURE TO SUBMIT A TRANSLATION OF THE DESCRIPTION OR TO PAY THE FEE WITHIN THE PRESCRIBED TIME-LIMIT Effective date: 20190816 Ref country code: BG Free format text: LAPSE BECAUSE OF FAILURE TO SUBMIT A TRANSLATION OF THE DESCRIPTION OR TO PAY THE FEE WITHIN THE PRESCRIBED TIME-LIMIT Effective date: 20190815 Ref country code: LV Free format text: LAPSE BECAUSE OF FAILURE TO SUBMIT A TRANSLATION OF THE DESCRIPTION OR TO PAY THE FEE WITHIN THE PRESCRIBED TIME-LIMIT Effective date: 20190515 |
|
| REG | Reference to a national code |
Ref country code: AT Ref legal event code: MK05 Ref document number: 1132457 Country of ref document: AT Kind code of ref document: T Effective date: 20190515 |
|
| PG25 | Lapsed in a contracting state [announced via postgrant information from national office to epo] |
Ref country code: AT Free format text: LAPSE BECAUSE OF FAILURE TO SUBMIT A TRANSLATION OF THE DESCRIPTION OR TO PAY THE FEE WITHIN THE PRESCRIBED TIME-LIMIT Effective date: 20190515 Ref country code: DK Free format text: LAPSE BECAUSE OF FAILURE TO SUBMIT A TRANSLATION OF THE DESCRIPTION OR TO PAY THE FEE WITHIN THE PRESCRIBED TIME-LIMIT Effective date: 20190515 Ref country code: SK Free format text: LAPSE BECAUSE OF FAILURE TO SUBMIT A TRANSLATION OF THE DESCRIPTION OR TO PAY THE FEE WITHIN THE PRESCRIBED TIME-LIMIT Effective date: 20190515 Ref country code: EE Free format text: LAPSE BECAUSE OF FAILURE TO SUBMIT A TRANSLATION OF THE DESCRIPTION OR TO PAY THE FEE WITHIN THE PRESCRIBED TIME-LIMIT Effective date: 20190515 Ref country code: CZ Free format text: LAPSE BECAUSE OF FAILURE TO SUBMIT A TRANSLATION OF THE DESCRIPTION OR TO PAY THE FEE WITHIN THE PRESCRIBED TIME-LIMIT Effective date: 20190515 Ref country code: RO Free format text: LAPSE BECAUSE OF FAILURE TO SUBMIT A TRANSLATION OF THE DESCRIPTION OR TO PAY THE FEE WITHIN THE PRESCRIBED TIME-LIMIT Effective date: 20190515 |
|
| REG | Reference to a national code |
Ref country code: CH Ref legal event code: PL |
|
| REG | Reference to a national code |
Ref country code: DE Ref legal event code: R097 Ref document number: 602015030223 Country of ref document: DE |
|
| PG25 | Lapsed in a contracting state [announced via postgrant information from national office to epo] |
Ref country code: MC Free format text: LAPSE BECAUSE OF FAILURE TO SUBMIT A TRANSLATION OF THE DESCRIPTION OR TO PAY THE FEE WITHIN THE PRESCRIBED TIME-LIMIT Effective date: 20190515 Ref country code: IT Free format text: LAPSE BECAUSE OF FAILURE TO SUBMIT A TRANSLATION OF THE DESCRIPTION OR TO PAY THE FEE WITHIN THE PRESCRIBED TIME-LIMIT Effective date: 20190515 Ref country code: SM Free format text: LAPSE BECAUSE OF FAILURE TO SUBMIT A TRANSLATION OF THE DESCRIPTION OR TO PAY THE FEE WITHIN THE PRESCRIBED TIME-LIMIT Effective date: 20190515 |
|
| PLBE | No opposition filed within time limit |
Free format text: ORIGINAL CODE: 0009261 |
|
| STAA | Information on the status of an ep patent application or granted ep patent |
Free format text: STATUS: NO OPPOSITION FILED WITHIN TIME LIMIT |
|
| REG | Reference to a national code |
Ref country code: BE Ref legal event code: MM Effective date: 20190630 |
|
| PG25 | Lapsed in a contracting state [announced via postgrant information from national office to epo] |
Ref country code: TR Free format text: LAPSE BECAUSE OF FAILURE TO SUBMIT A TRANSLATION OF THE DESCRIPTION OR TO PAY THE FEE WITHIN THE PRESCRIBED TIME-LIMIT Effective date: 20190515 |
|
| 26N | No opposition filed |
Effective date: 20200218 |
|
| PG25 | Lapsed in a contracting state [announced via postgrant information from national office to epo] |
Ref country code: IE Free format text: LAPSE BECAUSE OF NON-PAYMENT OF DUE FEES Effective date: 20190608 Ref country code: PL Free format text: LAPSE BECAUSE OF FAILURE TO SUBMIT A TRANSLATION OF THE DESCRIPTION OR TO PAY THE FEE WITHIN THE PRESCRIBED TIME-LIMIT Effective date: 20190515 |
|
| PG25 | Lapsed in a contracting state [announced via postgrant information from national office to epo] |
Ref country code: CH Free format text: LAPSE BECAUSE OF NON-PAYMENT OF DUE FEES Effective date: 20190630 Ref country code: BE Free format text: LAPSE BECAUSE OF NON-PAYMENT OF DUE FEES Effective date: 20190630 Ref country code: SI Free format text: LAPSE BECAUSE OF FAILURE TO SUBMIT A TRANSLATION OF THE DESCRIPTION OR TO PAY THE FEE WITHIN THE PRESCRIBED TIME-LIMIT Effective date: 20190515 Ref country code: LI Free format text: LAPSE BECAUSE OF NON-PAYMENT OF DUE FEES Effective date: 20190630 Ref country code: LU Free format text: LAPSE BECAUSE OF NON-PAYMENT OF DUE FEES Effective date: 20190608 |
|
| REG | Reference to a national code |
Ref country code: DE Ref legal event code: R079 Ref document number: 602015030223 Country of ref document: DE Free format text: PREVIOUS MAIN CLASS: A61B0005045200 Ipc: A61B0005349000 |
|
| REG | Reference to a national code |
Ref country code: DE Ref legal event code: R082 Ref document number: 602015030223 Country of ref document: DE Representative=s name: HL KEMPNER PATENTANWAELTE, SOLICITORS (ENGLAND, DE Ref country code: DE Ref legal event code: R082 Ref document number: 602015030223 Country of ref document: DE Representative=s name: HL KEMPNER PATENTANWALT, RECHTSANWALT, SOLICIT, DE |
|
| PG25 | Lapsed in a contracting state [announced via postgrant information from national office to epo] |
Ref country code: CY Free format text: LAPSE BECAUSE OF FAILURE TO SUBMIT A TRANSLATION OF THE DESCRIPTION OR TO PAY THE FEE WITHIN THE PRESCRIBED TIME-LIMIT Effective date: 20190515 |
|
| PG25 | Lapsed in a contracting state [announced via postgrant information from national office to epo] |
Ref country code: IS Free format text: LAPSE BECAUSE OF FAILURE TO SUBMIT A TRANSLATION OF THE DESCRIPTION OR TO PAY THE FEE WITHIN THE PRESCRIBED TIME-LIMIT Effective date: 20190915 |
|
| PG25 | Lapsed in a contracting state [announced via postgrant information from national office to epo] |
Ref country code: MT Free format text: LAPSE BECAUSE OF FAILURE TO SUBMIT A TRANSLATION OF THE DESCRIPTION OR TO PAY THE FEE WITHIN THE PRESCRIBED TIME-LIMIT Effective date: 20190515 Ref country code: HU Free format text: LAPSE BECAUSE OF FAILURE TO SUBMIT A TRANSLATION OF THE DESCRIPTION OR TO PAY THE FEE WITHIN THE PRESCRIBED TIME-LIMIT; INVALID AB INITIO Effective date: 20150608 |
|
| PG25 | Lapsed in a contracting state [announced via postgrant information from national office to epo] |
Ref country code: MK Free format text: LAPSE BECAUSE OF FAILURE TO SUBMIT A TRANSLATION OF THE DESCRIPTION OR TO PAY THE FEE WITHIN THE PRESCRIBED TIME-LIMIT Effective date: 20190515 |
|
| PGFP | Annual fee paid to national office [announced via postgrant information from national office to epo] |
Ref country code: FR Payment date: 20230510 Year of fee payment: 9 Ref country code: DE Payment date: 20230502 Year of fee payment: 9 |
|
| PGFP | Annual fee paid to national office [announced via postgrant information from national office to epo] |
Ref country code: GB Payment date: 20230427 Year of fee payment: 9 |
|
| REG | Reference to a national code |
Ref country code: DE Ref legal event code: R119 Ref document number: 602015030223 Country of ref document: DE |
|
| GBPC | Gb: european patent ceased through non-payment of renewal fee |
Effective date: 20240608 |
|
| PG25 | Lapsed in a contracting state [announced via postgrant information from national office to epo] |
Ref country code: DE Free format text: LAPSE BECAUSE OF NON-PAYMENT OF DUE FEES Effective date: 20250101 |
|
| PG25 | Lapsed in a contracting state [announced via postgrant information from national office to epo] |
Ref country code: FR Free format text: LAPSE BECAUSE OF NON-PAYMENT OF DUE FEES Effective date: 20240630 |
|
| PG25 | Lapsed in a contracting state [announced via postgrant information from national office to epo] |
Ref country code: GB Free format text: LAPSE BECAUSE OF NON-PAYMENT OF DUE FEES Effective date: 20240608 |