EP2954840A1 - Method for the estimation of the heart-rate and corresponding system - Google Patents
Method for the estimation of the heart-rate and corresponding system Download PDFInfo
- Publication number
- EP2954840A1 EP2954840A1 EP15170706.4A EP15170706A EP2954840A1 EP 2954840 A1 EP2954840 A1 EP 2954840A1 EP 15170706 A EP15170706 A EP 15170706A EP 2954840 A1 EP2954840 A1 EP 2954840A1
- Authority
- EP
- European Patent Office
- Prior art keywords
- heart
- signal
- data blocks
- heart beat
- estimate
- Prior art date
- Legal status (The legal status is an assumption and is not a legal conclusion. Google has not performed a legal analysis and makes no representation as to the accuracy of the status listed.)
- Granted
Links
Images




Classifications
-
- A—HUMAN NECESSITIES
- A61—MEDICAL OR VETERINARY SCIENCE; HYGIENE
- A61B—DIAGNOSIS; SURGERY; IDENTIFICATION
- A61B5/00—Measuring for diagnostic purposes; Identification of persons
- A61B5/02—Detecting, measuring or recording for evaluating the cardiovascular system, e.g. pulse, heart rate, blood pressure or blood flow
- A61B5/024—Measuring pulse rate or heart rate
- A61B5/02416—Measuring pulse rate or heart rate using photoplethysmograph signals, e.g. generated by infrared radiation
-
- A—HUMAN NECESSITIES
- A61—MEDICAL OR VETERINARY SCIENCE; HYGIENE
- A61B—DIAGNOSIS; SURGERY; IDENTIFICATION
- A61B5/00—Measuring for diagnostic purposes; Identification of persons
- A61B5/02—Detecting, measuring or recording for evaluating the cardiovascular system, e.g. pulse, heart rate, blood pressure or blood flow
- A61B5/024—Measuring pulse rate or heart rate
- A61B5/02438—Measuring pulse rate or heart rate with portable devices, e.g. worn by the patient
-
- A—HUMAN NECESSITIES
- A61—MEDICAL OR VETERINARY SCIENCE; HYGIENE
- A61B—DIAGNOSIS; SURGERY; IDENTIFICATION
- A61B5/00—Measuring for diagnostic purposes; Identification of persons
- A61B5/103—Measuring devices for testing the shape, pattern, colour, size or movement of the body or parts thereof, for diagnostic purposes
- A61B5/11—Measuring movement of the entire body or parts thereof, e.g. head or hand tremor or mobility of a limb
-
- A—HUMAN NECESSITIES
- A61—MEDICAL OR VETERINARY SCIENCE; HYGIENE
- A61B—DIAGNOSIS; SURGERY; IDENTIFICATION
- A61B5/00—Measuring for diagnostic purposes; Identification of persons
- A61B5/68—Arrangements of detecting, measuring or recording means, e.g. sensors, in relation to patient
- A61B5/6801—Arrangements of detecting, measuring or recording means, e.g. sensors, in relation to patient specially adapted to be attached to or worn on the body surface
- A61B5/6802—Sensor mounted on worn items
- A61B5/681—Wristwatch-type devices
-
- A—HUMAN NECESSITIES
- A61—MEDICAL OR VETERINARY SCIENCE; HYGIENE
- A61B—DIAGNOSIS; SURGERY; IDENTIFICATION
- A61B5/00—Measuring for diagnostic purposes; Identification of persons
- A61B5/68—Arrangements of detecting, measuring or recording means, e.g. sensors, in relation to patient
- A61B5/6801—Arrangements of detecting, measuring or recording means, e.g. sensors, in relation to patient specially adapted to be attached to or worn on the body surface
- A61B5/6813—Specially adapted to be attached to a specific body part
- A61B5/6824—Arm or wrist
-
- A—HUMAN NECESSITIES
- A61—MEDICAL OR VETERINARY SCIENCE; HYGIENE
- A61B—DIAGNOSIS; SURGERY; IDENTIFICATION
- A61B5/00—Measuring for diagnostic purposes; Identification of persons
- A61B5/72—Signal processing specially adapted for physiological signals or for diagnostic purposes
- A61B5/7203—Signal processing specially adapted for physiological signals or for diagnostic purposes for noise prevention, reduction or removal
- A61B5/7207—Signal processing specially adapted for physiological signals or for diagnostic purposes for noise prevention, reduction or removal of noise induced by motion artifacts
- A61B5/721—Signal processing specially adapted for physiological signals or for diagnostic purposes for noise prevention, reduction or removal of noise induced by motion artifacts using a separate sensor to detect motion or using motion information derived from signals other than the physiological signal to be measured
-
- A—HUMAN NECESSITIES
- A61—MEDICAL OR VETERINARY SCIENCE; HYGIENE
- A61B—DIAGNOSIS; SURGERY; IDENTIFICATION
- A61B5/00—Measuring for diagnostic purposes; Identification of persons
- A61B5/72—Signal processing specially adapted for physiological signals or for diagnostic purposes
- A61B5/7225—Details of analogue processing, e.g. isolation amplifier, gain or sensitivity adjustment, filtering, baseline or drift compensation
-
- A—HUMAN NECESSITIES
- A61—MEDICAL OR VETERINARY SCIENCE; HYGIENE
- A61B—DIAGNOSIS; SURGERY; IDENTIFICATION
- A61B5/00—Measuring for diagnostic purposes; Identification of persons
- A61B5/72—Signal processing specially adapted for physiological signals or for diagnostic purposes
- A61B5/7235—Details of waveform analysis
- A61B5/7253—Details of waveform analysis characterised by using transforms
- A61B5/7257—Details of waveform analysis characterised by using transforms using Fourier transforms
-
- A—HUMAN NECESSITIES
- A61—MEDICAL OR VETERINARY SCIENCE; HYGIENE
- A61B—DIAGNOSIS; SURGERY; IDENTIFICATION
- A61B5/00—Measuring for diagnostic purposes; Identification of persons
- A61B5/74—Details of notification to user or communication with user or patient; User input means
- A61B5/742—Details of notification to user or communication with user or patient; User input means using visual displays
-
- A—HUMAN NECESSITIES
- A61—MEDICAL OR VETERINARY SCIENCE; HYGIENE
- A61B—DIAGNOSIS; SURGERY; IDENTIFICATION
- A61B2562/00—Details of sensors; Constructional details of sensor housings or probes; Accessories for sensors
- A61B2562/02—Details of sensors specially adapted for in-vivo measurements
- A61B2562/0219—Inertial sensors, e.g. accelerometers, gyroscopes, tilt switches
Definitions
- the present description relates to techniques for the estimation of the heart-rate using photoplethysmography on a body organ and an information on acceleration of said body organ.
- Various embodiments may apply e.g. in wearable, in particular wrist-wearable devices, for continuous monitoring of the heart-rate in fitness/wellness applications.
- Photoplethysmography involves obtaining optically a volumetric measurement of an organ (plethysmogram).
- a photoplethysmogram is often obtained by using a pulse oximeter which illuminates the skin and measures changes in light absorption.
- a conventional pulse oximeter monitors the perfusion of blood to the dermis and subcutaneous tissue of the skin.
- PPG was historically first employed with finger clips in medical applications. Lately PPG has been employed also on wrist, arm, forearm, to make it suitable for fitness applications.
- SNR Signal to Noise Ratio
- SIR Signal to Interference Ratio
- SNR means the ratio of the heart rate, i.e. the signal S, to all the other signals, i.e. the noise N. It can be measured by having a subject wearing a cardio frequency meter and a PPG device.
- the power of the frequency component (peak) measured by the PPG device closest to cardio frequency measured by the cardio frequency meter is the signal S.
- S/N S/(T-S)
- the SIR value is obtained as ratio of the signal S over I, the power of the strongest non-cardiac frequency component.
- One or more embodiments may refer to a corresponding system, to a corresponding measuring device and as well as to a computer program product that can be loaded into the memory of at least one computer and comprises parts of software code that are able to execute the steps of the method when the product is run on at least one computer.
- a computer program product is understood as being equivalent to reference to a computer-readable means containing instructions for controlling the processing system in order to coordinate implementation of the method according to the embodiments.
- Reference to "at least one computer” is evidently intended to highlight the possibility of the present embodiments being implemented in modular and/or distributed form.
- the method comprises that said compensation operation includes obtaining from said selected data blocks corresponding frequency domain data blocks for the heart rate signal and acceleration signal, performing a motion compensation of the frequency domain data blocks for the heart rate using the frequency domain data blocks for the acceleration signal.
- the method comprises performing the motion compensation by subtracting from the frequency domain data blocks for the heart the frequency domain data blocks in the frequency by a scalar weight to obtain said compensated heart rate signal.
- the method comprises performing a detection operation on said compensated heart rate signal to obtain an estimate of the heart rate.
- the method comprises computing a non-linear predictor value on the basis of said frequency domain data blocks, performing a correction operation of the detected estimate of the heart rate including performing a decision between the detected estimate of the heart rate and a predicted estimate to select a heart rate value, said predicted estimate being obtained as a linear function of said predictor.
- the method comprises performing a decision which includes smoothing operations to obtain a final heart rate estimate.
- the system implementing the method comprises sensors configured for acquiring optically from said body organ a signal representative of the heartbeat and acquiring an acceleration signal representative of the acceleration of said body organ and a processor module configured for selecting data blocks of said acquired heart beat signal and acceleration signal, compensating said heart beat signal by the acceleration signal, calculating the heart rate value on the basis of said compensated heart beat signal.
- the system includes such sensors and processing module are comprised in a same photoplethysmographic heart rate measuring device.
- the PPG heart rate measuring device is comprised in an apparatus which is wearable on said body organ, in particular the apparatus is wearable on the wrist or the arm, in particular by means of a bracelet.
- a photoplethysmographic heart rate measuring device capable of operating in the system here described.
- such device is associated to a remote processing device connected to it by a communication link.
- such device includes a display.
- references to "an embodiment” or “one embodiment” in the framework of the present description is meant to indicate that a particular configuration, structure, or characteristic described in relation to the embodiment is comprised in at least one embodiment.
- phrases such as “in an embodiment” or “in one embodiment”, that may be present in various points of the present description do not necessarily refer to the one and the same embodiment.
- particular conformations, structures, or characteristics can be combined appropriately in one or more embodiments.
- FIG 1A it is shown a block diagram representing a photoplethysmographic (PPG) device 10 for measuring the heart rate.
- PPG device 10 includes two lighting emitting diodes, i.e. LEDs, 13a and 13b, in particular green LEDs, which emit light in the direction of the user's skin surface.
- LEDs 13a and 13b are driven by a LED driver 15 which is in its turn controlled by a digital to analog converter 16 to control the current value.
- the skin surface is the skin surface of a body organ which in the preferred example is the wrist.
- Other suitable body organs can be for instance the arm, the forearm, the finger, the forehead or the ear.
- Light is absorbed, reflected, scattered, and transmitted as it travels through the user's tissues and encounters one or more blood vessels.
- Heart beats cause the amount of light reflected to drop during systoles and to increase during diastoles.
- the reflected light is sensed by a photodiode 17 which converts the amount of light into a current.
- the two LEDs 13a and 13b are placed respectively immediately above and below the photodiode 17.
- the current at the output of photodiode 17 is converted into a voltage by means of a trans-impedance amplifier 18.
- an analog-to-digital converter 18 for instance a 12-bit analog-to-digital converter 18 operating at a sampling rate f s of 100Hz and acquired by a microcontroller 11, in particular a 32-bit microcontroller STM32L1 (or STM32F), as a optically acquired digital signal representative of the heart beat, or digital optical heart beat signal o.
- the microcontroller 11 also controls by means of one of its digital outputs connected to digital-to-analog converter 16 the current of the LEDs 13a and 13b, i.e. their light intensity.
- the PPG device 10 includes also a three-axis accelerometer 21, which is in particular equipped with an internal analog-to-digital converter operating at the same sampling rate f s , 100Hz, which provides three accelerometric signals to the microcontroller, namely ax, ay, az, according to axis x, y and z respectively.
- An internal memory, in particular a SRAM, of the microcontroller 11, in particular the 48KB SRAM of the STM32L1 microcontroller, is used to implement the method for the estimation of the heart rate here described, indicated as a whole with reference 1000 in figure 2 .
- Such method for the estimation of the heart rate receives as input the optically acquired heart beat signal o and the accelerometric signals ax , ay, az and supplies as output a series of heart rate estimate values r. If more memory is available, for example by using the alternative STM32F4 microcontroller, an operation of decimation during a filtering stage 110 shown in figure 2 is not necessary.
- the PPG heart rate measuring device 10 in a preferred embodiment, shown in figure 1B is arranged in a way which is known per se in a wrist-wearable device 40, including a wrist bracelet 41, with the LEDs 13a and 13b and the photodiode PD oriented in direction of the wrist skin surface.
- a wrist-wearable device 40 including a wrist bracelet 41
- LEDs 13a and 13b and the photodiode PD oriented in direction of the wrist skin surface.
- LED 13a is shown, in dashed line.
- the PPG device 10 is equipped with an own local display 12 to visualize the series of heart rate estimate values r, in particular, as better detailed in the following, the time series r(n) of the heart rate estimates r.
- the microcontroller 11 itself can further use the data of the heart estimate r for statistics and other type of data manipulation, for instance in order to supply different types of data presentations to the user, such as statistical analyses, the microcontroller 11 itself can further perform processing of the heart rate estimate r, acting as a local application processor if it has enough computing power.
- the PPG device 10 comprises a transmitter 22, in the example a Bluetooth transmitter, to send wirelessly the series of heart rate estimate values r to a remote device 30, also shown in figure 1 , which receives the series of heart rate estimate values r by means of a corresponding receiver 31, which sends the data to an application processor 32, which in its turn shows the results on a display 33.
- the remote device 30 can be for instance a PC, as shown in figure 1B , or a smart phone or another device capable of processing and displaying data.
- Such option of having the time series of the heart rate estimate values r either visualized on a local display 12, used by the microcontroller 11 itself or sent wirelessly to the remote device 30 depends on the product/application that the system is integrated onto.
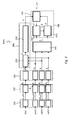
- FIG 2 it is shown a block diagram representing an embodiment of a method for the estimation of the heart rate, indicated as a whole with the reference 1000, which is performed by the microcontroller 11.
- the digital optical heart beat signal o acquired by the PPG device 10 and the digital accelerometric signals ax , ay, az pertaining the three axes x, y z are sent in parallel to a filtering stage 110, then to a selective block generation stage 120, then to a frequency analysis stage 130, which outputs a frequency domain heart beat signal O and frequency domain accelerometric signals AX, AY, AZ pertaining the three axes x, y, z respectively.
- the purpose of the filtering stage 110 is to remove the unwanted frequency bands, that is, all the bands not included in the band of interest of the heart rate. Since the band of interest of the heart rate is, for example, the interval of frequencies between 40 bpm (beats per minute) and 200 bpm, the unwanted bands include a low-frequency band (between 0 bpm and 40 bpm) and a high-frequency band (between 200 bpm and half the sampling frequency). Both the low-frequency and the high-frequency unwanted bands need to be removed to clear the heart signal from noise. In addition, the low-frequency unwanted band needs to be removed because it contains a strong sub-band (between 0 bpm and a few bpm) that negatively interferes with the frequency-analysis stage.
- the frequency-analysis stage is not limited to orthogonal frequency points, but it calculates also non-orthogonal frequency points, the presence of a strong sub-band in the very low end of the spectrum would cause this sub-band to interfere with the calculation of the non-orthogonal frequency points.
- the high-frequency unwanted band needs to be removed in order to prevent aliasing, in case decimation is performed.
- Each of such stages 110, 120, 130 include four banks in parallel to perform substantially the same operations respectively on the digital optical heart beat signal o and the three digital accelerometric signals ax , ay, az.
- adjustements can be possible to take in account the different nature of the optically acquired heart signal and of the accelerometric signal.
- the four banks of the filtering stages 110 can have the same structure, i.e. the one described with refererence to figures 4A and $B. This allows to have signals at the output of the banks of the filtering stage 110 with basically the same delay and provides simplicity of implementation or design.
- the filtering banks can have differences to take in account differences among the input signals, provided they perform the task of removing the frequency bands as indicated above.
- the frequency domain heart beat signal O and the frequency domain accelerometers signals, AX, AY, AZ are fed to an estimation module 200 which includes a motion compensation block 210 and a detection block 220.
- the motion compensation block 210 compensates the frequency domain heart beat signal O using the values of the frequency domain accelerometers signals, AX, AY, AZ.
- the compensated output, O' , of such motion compensation block 210, namely a compensated frequency domain heart beat signal O' is fed to the detection block 220 which computes a detected heart rate estimate d, i.e. identifies the main frequency of the compensated frequency domain heart beat signal O', which is then outputted as detected heart rate estimate d.
- Such detected heart rate estimate d is fed to a correction module 400, performing a model estimation, which also receives the frequency domain accelerometers signals, AX, AY, AZ.
- the detected heart rate estimate d is sent as input to a decision block 410 which decides which value, between the detected heart rate estimate d and a predicted estimate m, send as decided heart rate r.
- the succession of decided heart rate values r form the series of heart rate estimate values r, i.e. the final output of the method described by the block diagram of figure 2 .
- a non linear prediction calculation block 300 receives the frequency domain accelerometers signals, AX, AY, AZ and calculates a predictor p. Such predictor p is fed to the correction module 400, specifically to a model learning block 430 which also receives from the decision block 410 the detected heart rate estimate d.
- the model learning block 430 on the basis of the predictor p and of the frequency domain accelerometers signals, AX, AY, AZ calculates linear parameters ⁇ and ⁇ , respectively the constant term and the first degree coefficient of a linear function, which are fed to a linear function calculation block 420, together with the predictor p from the non linear prediction calculation block 300.
- the linear function calculation block 420 outputs the predicted estimate m on the basis of the linear function, as better detailed in the following.
- a parametric model in the form of a linear function calculates a predicted estimate m of the heart rate from the predictor p and the linear parameters ⁇ and ⁇ .
- the decision block 410 chooses which value between the detected heart rate estimate d and the predicted estimate m represents the decided heart rate r.
- the decision block 410 in various embodiment can simply select to send either the detected heart rate estimate d or the predicted estimate m as output.
- the decision block 410 performs a decision which operate in a smoothed manner, to filter out abrupt changes due to the transitions between the two estimators, the detected heart rate estimate d, which represent a first optical estimator, and the secondary predicted estimator, m , supplying as an output the decided heart rate estimate r and, ultimately, the series of heart rate estimate values r.
- the method attempts at learning the value of linear regression parameters ⁇ and ⁇ on the basis of points (p, d). For efficiency reasons, the number of points on the basis of which the linear regression parameters ⁇ and ⁇ are maintained limited in number, since the number of the observation points (p, d) grows rapidly, one point being stored each time the decisor 410 chooses to select the estimate d.
- This is obtained by a procedure which, as better detailed in the following, includes collapsing the observation points (p, d) which are sufficiently similar or near one to the other in a single point, and includes substituting with the most recent observation points the oldest observation points, using the FIFO data structures.
- the size of such FIFO structures is equal to the maximum number of points on the basis of which the regression line is traced.
- the observation points are no longer of the type of pairs (p, d), but collapsed unique elements contained in the FIFO (cx, cy).
- the output of the method for the estimation of the heart-rate 1000, directed to the local display 12, the microcontroller 11 or the remote device 30, is the numerical time series of estimates r, r(ns), ns being the index of the estimate produced. For instance a decided estimate r is produced every three seconds, so that the index ns is increased every three seconds.
- such method not necessarily includes all the operations and modules shown in such figure and describe above, or, alternatively, some of the operations and module can be different.
- the method for the estimation of the heart-rate using photoplethysmography on a body organ comprises acquiring optically from sensor 13a, 13b, 17 from said body organ a heart beat signal o , acquiring from sensor 21 an acceleration signal ax , ay, az representative of the acceleration of said body organ, selecting by the stage 120 data blocks B o , B x , B y , B z of said acquired heart beat signal o and acceleration signal ax , ay, az, compensating in block 210 said heart beat signal o by the acceleration signal ax, ay, az, calculating in block 210, 220 a heart-rate value, the heart rate estimate d on the basis of the resulting compensated heart beat signal O' , the compensation operation 210, 220 including obtaining in stage 130 from said selected data blocks Bo, Bx, By, Bz corresponding frequency domain data blocks for the heart rate signal
- the correction module 400 operates on the basis of the heart rate estimate d and of the predictor p originated by the non linear prediction calculation block 300 to produce the decided heart rate value r.
- the decided heart rate value r is calculated by a smoothed decision operation (as detailed in figure 8 ).
- each comprises a low-pass FIR (Finite Impulse Response) filter 111, as shown in figure 4A , followed by a high-pass filter 113.
- a factor-2 decimation stage 112 is optionally applied, as in the example shown, in order to reduce the memory footprint of the algorithm.
- the filters are independently applied to each of the four input signals: the optical sequence of values corresponding to the optical signal o , o(n), n being as mentioned the numeric index of the samples acquired, and analogously the three accelerometric sequences ax(n), ay (n) and az(n), corresponding to signals ax , ay and az.
- the filters of filtering stage 110 produce respectively four filtered time domain signals, one, O HP (n) , pertaining the optical sensor 17, and the other three pertaining each axis of the accelerometric sensor 21, ax HP (n), ay HP (n), az HP (n) respectively.
- the high pass filter 113 is implemented by means of a chain of five IIR (Infinite Impulse Response) filters 113a, as illustrated in figure 4B .
- IIR Infinite Impulse Response
- the transfer function resulting from the cascade of the five IIR filters accomplishes the removal of the unwanted low-frequency band as explained before, especially the very first portion of the unwanted low-frequency band.
- this stage comprises four parallel banks receiving as input each a respective sequence corresponding to one of the four filtered time domain signals coming from the sensors, O HP (n), ax HP (n), ay HP (n), az HP (n), and generating four time domain data blocks by operating on such respective filtered optical and accelerometric sequences.
- the four generated time-domain data blocks, B o from the data in the optical sequence O HP (n) , and B x , B y , B z from the data in the accelerometric sequences ax HP (n), ay HP (n), az HP (n), are time synchronized, which means that the first samples in each bank of the stage 120 are time aligned to the same temporal reference, which marks the beginning of the time domain data blocks.
- the selection of the time domain data block is done by means of a procedure, i.e. the selective block-generation better detailed below, that repeatedly tests the data blocks tentatively constructed on the time domain optical sequence o(n) until a given condition is met.
- the procedure consists in provisionally generating a data block from the optical sequence o(n), testing the condition, and, in case the condition is met, exiting the procedure and forwarding that block B o to the next stage of the method (along with the three time-aligned accelerometric data blocks B x , B y , B z ), while, in case it is not met, generating a new provisional block that is time shifted relative to the previous block.
- the new provisional block contains a sub-block with more recent samples relative to the previous block.
- the selective block generation procedure operates as follows and as detailed in figure 6 , where no indicates an index of the most recent optical sample of the optical sequence o(n) stored in memory out of the filtering stage 110 and B indicates a data block formed from the N most recent optical samples, from no backwards:
- the parameter N indicating the number of most recent optical samples taken into account is set to 1024, but other values are also possible (although with some effects on performance and memory requirements).
- the factor 2 in the denominator of the previous formula refers to the case of the sampling-rate reduction through decimation.
- the throughput parameter N e is set to 250 samples.
- the value of the parameter N w can be set to any amount smaller than throughput parameter N e , for example to 50 samples.
- this stage operates independently on each of the four blocks B o , B x , B y , B z at the output of the selective block generation stage 120.
- the four time domain data blocks B o , B x , B y , B z pass through the same type of processing.
- Each of the four time domain data blocks B o , B x , B y , B z is transformed into the frequency domain in the form of a number K of frequency lines, or frequency bins.
- the K bins are obtained by interleaving a number M of N-point FFTs (Fast Fourier Transform) as shown in reference to figure 3 .
- N - 1 and U(n) is obtained by multiplying in a multiplier block 132 the samples of the generic block B(n) by an apodization function (or window function), for example a Taylor function.
- apodization function or window function
- the use of apodization functions is well known in the prior art and has the purpose to attenuate the artifacts due to the secondary lobes introduced by the operation of block selection.
- the complex argument of the exponential includes the product of index m identifying the m-th FFT, index n identifying the sample and a frequency resolution of the frequency analysis ⁇ , over the sampling frequency f s .
- D is the duration in seconds of the analysis block.
- K that is the number of elements in the set S
- a band of frequencies of interest is specified, for example the band 40 bpm - 200 bpm.
- the normalized block S is thus indicated by S u .
- a normalized block S u is constructed on each of the four time domain data blocks B o , B x , B y , B z , and these normalized blocks, which are frequency domain data values, are denoted respectively with O u , A x u , A y u , A z u .
- the signal O u ( k ) can be decomposed into five contributions: a heart-beat signal O h ( k ) (the wanted signal), three motion-induced artifact signals, O x ( k ), O y ( k ), and O z ( k ), and a non motion-induced noise O n ( k ) .
- O u k O h k + O x k + O y k + O z k + O n k
- O X k V X k ⁇ A X u k
- O Y k V Y k ⁇ A Y u k
- O Z k V Z k ⁇ A Z u k
- V X ( k ), V Y ( k ), and V Z ( k ) are three transfer functions defined as:
- V X k O X k A X u k
- V Y k O Y k A Y u k
- V Z k O Z k A Z u k
- the transfer functions have been approximated to a constant value both in the time and in the frequency axis, denoted respectively with v X , v Y , and v Z .
- the performance of the motion compensation stage is still acceptable in that the purpose of motion compensation is not the complete (over the whole frequency band) estimation of O h ( k ), but, rather, is the estimation of only the position of the dominant frequency component of O h ( k ) , as it will be described next.
- the optimal values for the three constant (approximated) transfer functions can be obtained, for example, through an optimization process that maximizes the performance of the final heart-rate estimation with respect to v X' v Y , and v Z .
- Another important aspect of the motion compensation stage is the operation of normalization applied to the four signals (one heart signal and three accelerometric signals).
- the result of this operation is to equalize the energy of the four signals to the unitary value. This operation is necessary in order to bring the magnitude of the spectra of the four signals to the same range of values. Failure to do this would cause the subtraction operation to be not effective, in that it would be performed on terms of non-comparable magnitudes.
- a strong frequency component present in the spectra of any of the accelerometric signals can effectively cancel the corresponding artefact on the optical signal.
- the motion compensation substantially includes subtracting from the frequency domain optical signal, O u , i.e. the heart beat signal in the frequency domain, a linear combination of the three frequency domain acceleration signals A x u (k), Ay u (k), A z u (k) multiplied by a respective scalar weight v X , v Y , v Y .
- This interval ⁇ l is usually equal to the update period T e , but it can be longer in case the selective block-generation stage 120 enters in the step 660 of the selective block generation procedure in which it is waited until the filtering stage 110 outputs the sample n 0 + N w .
- the l -th set of four frequency domain blocks, calculated at time t l is denoted as O u ( n;l ) , A X u n ⁇ l , A Y u n ⁇ l , and A Z u n ⁇ l .
- the calculation of the predictor in block 300 consists of the following procedure comprising the following steps:
- the previous formula represents the fact that the predictor p(l) is constructed as the maximum between two intermediate functions, p f (l) and p s (l). These two intermediate functions are two filtered versions of the time series of q(l). If to the time sequence q(l) is given the interpretation of the level of physical exertion of the user, the two filtered output of the time sequence q(l) represent two different responses to physical exertion. In particular, the series p f (l) represents a fast response to the time sequence q(l), while p s (l) represents a slow response to the time sequence q(l).
- the series p s (l) becomes relevant during periods of physical recovery (that is when the level of physical exertion is decreasing), while the series p f (l) becomes relevant during periods of increasing physical activity.
- cardiac output and therefore cardiac frequency
- heart rate responds differently to an increase of physical activity, and responds much more slowly to a decrease of physical activity.
- this stage uses the values of the predictor p(l) and of the detected heart rate estimate d(l) to arrive at a heart-rate estimate r(l) .
- the correction procedure 400 includes the following steps:
- index 1 will be used instead of time t l .
- FIFO memories c X , c Y which store, as mentioned, the observation points (p,d) each time the estimate d is selected, and a weight computation FIFO c W which is used in the aggregation of the points.
- FIFO memories c X , c Y , c W as described in the following, are initialized as empty.
- the predictor FIFO memory c x sequentially stores the values of the predictor p at each time instant l at which the estimate d is selected.
- the estimate FIFO memory c y sequentially stores the values of the estimate d at each time instant l .
- the weight FIFO memory c w increments the values of a weight factor at each time instant l .
- G indicates a safety margin set for instance to 40, therefore d min and d max represents two lines parallel to m(l) which identify the lower and upper limit of a safety range. If the value estimate d is outside such range is considered not a good value.
- operation 860 within the decision operation performed by block 410, represents a smoothing operation applied taking in account a plurality of estimates d at different times, such as l-2 ,..., l and averaging over them.
- steps 810-870 are indicated by a dashed polygonal as operated specifically by the decision block 410.
- the decision block 410 in its simpler form decides if the final estimate r(l) is equal to the optical estimate d ( l ) or to the predicted estimate m(l) on the basis of a given condition, such as c 1 (l) or c 2 (l) ) , which evaluates if the optical estimate value is reliable.
- a smoothed decision is implemented, i.e. the final estimate r(l) is at least in some cases the result of an average of the current estimate with previous estimates, optical estimate d and or predicted estimate m.
- step 870 output simply the optical estimate d(l) as final estimate r(l)
- step 860 outputs an average over previous optical estimates
- step 830 outputs an average with the previous final estimate r(l) .It is clear that in various embodiments other choices of reliability conditions such as c 1 (l) or c 2 (l) ) and other type of averaging are possible to the person skilled in the art.
- steps 830, 860 or 870 are collected in a block 896 which supplies the final estimate r(l) outputted by the decision block 410.
- the update of the linear block 430 includes performing an aggregation operation, described here below, to keep low the number of observation points in the FIFO.
- a step 881 of evaluating if aggregation is required.
- the linear model in block 430 is updated, this meaning that observation point (p, d) are stored in a step 875 in the FIFO c X , c Y .
- step 896 is performed, outputting the final estimate r(l) .
- a ⁇ a max i.e. the closest element a in the predictor FIFO c x is closer than a threshold value to the predictor p at time l . This corresponds to evaluate if the new observation point is near to an existing point stored in the FIFO.
- j 0 is a parameter indicating the value of index j of the value c x (j) in the predictor FIFO c x which minimizes the distance with the predictor p ( l ) at time index l, which identifies an aggregating point ( c x ( j 0 ), c y ( j 0 )).
- c w is in general a weight factor FIFO.
- c w ( j 0 ) represents a weight factor of the aggregating point ( c x ( j 0 ), c y ( j 0 )), i.e. a FIFO counter which is incremented by one at each aggregation of a new observation point (p,d) to such aggregating point( c x ( j 0 ), c y ( j 0 )).
- the operation of aggregation or collapse in a single point is a weighted average performed on both the values in the predictor FIFO c x and in the estimate FIFO c y .
- the aggregating points ( c x ( j 0 ), c y ( j 0 )) with the greater weight are those which are the results of a greater number of aggregations in the past.
- the weight of the aggregating point is used to establish a weight of the newly aggregated point (p,d), which is represented by w.
- the relations above implements the operations of assigning to the new point or aggregated (p, d) a relative weight which is inversely proportional to the weight of the aggregating point (( c x ( j 0 ), c y ( j 0 )) to which is aggregated.
- condition 882 is performed a push operation on the content of the FIFO, before passing to step 875.
- c x push p l
- c x c y push p l
- c y c w push 1 ⁇ c w
- the function push(val, list) first shifts one position rightwards all the elements contained in the list (in this way discarding the rightmost element) and then inserts the number val at the leftmost position of the list.
- R indicates the coefficient of determination computed in the classical mode from the linear regression (it is R 2 properly, R for short).
- the coefficient of determination R measures the amount of linearity of the aggregated poins, which are used as reliability indication.
- R1 indicates therefore the coefficient of determination computed over the current aggregated points, i.e. the points ( c x , c y ) in the FIFO structures, while Rmin indicates a minimum threshold level above which the linear model is considered as reliable.
- a step 892 it is evaluated if the number of elements in the FIFO F(l) is at least a minimum value F min and if the coefficient of determination R is greater equal than a minimum value R min .
- a step 893 the linear parameters are updated, setting them to the linear regression parameters ⁇ 1 , ⁇ 1 calculated in the step 890: ⁇ ⁇ ⁇ 1 ⁇ ⁇ ⁇ 1
- a step 894 the linear parameters are set to the initial values of initialization step 810: ⁇ ⁇ ⁇ 0 ⁇ ⁇ ⁇ 0
- step 840 The procedure goes to step 840 and then to step 820 to wait for the next iteration.
- Steps 890-894 are indicated by a dashed square as operated specifically by the model learning block 430 to update the linear regression parameters on the basis of the observation points storing step 875.
- steps 880-884 represents an accessory aggregation procedure. In various embodiments it is also possible to proceed from the observation points storing step 875 directly to linear parameters calculation step 890.
- the method according to the various embodiments here described is advantageous since it allows to overcome noise by means of high processing gain (for instance, with 1024 points FFT is obtained a 30dB gain).
- the method according to the various embodiments here described is also advantageous since it allows to overcome interference due to motion of the body organ in the frequency domain (motion compensation).
- the method according to the various embodiments here described is also advantageous since it to build a secondary estimator, i.e. a prediction, to be used whenever the primary estimator derived by the optical signal fails.
- the method here described can be used in system and device for the continuous monitoring of the heart-rate for fitness/wellness applications.
- These systems and devices can be for instance wrist-wearable devices for runners monitoring their workout session.
- These devices can be wristwear or also earwear, smart-watches, smart-headphones.
Landscapes
- Health & Medical Sciences (AREA)
- Life Sciences & Earth Sciences (AREA)
- Engineering & Computer Science (AREA)
- Physics & Mathematics (AREA)
- Public Health (AREA)
- Surgery (AREA)
- Veterinary Medicine (AREA)
- General Health & Medical Sciences (AREA)
- Animal Behavior & Ethology (AREA)
- Biophysics (AREA)
- Pathology (AREA)
- Biomedical Technology (AREA)
- Heart & Thoracic Surgery (AREA)
- Medical Informatics (AREA)
- Molecular Biology (AREA)
- Physiology (AREA)
- Cardiology (AREA)
- Signal Processing (AREA)
- Artificial Intelligence (AREA)
- Computer Vision & Pattern Recognition (AREA)
- Psychiatry (AREA)
- Dentistry (AREA)
- Oral & Maxillofacial Surgery (AREA)
- Power Engineering (AREA)
- Mathematical Physics (AREA)
- Measuring Pulse, Heart Rate, Blood Pressure Or Blood Flow (AREA)
Abstract
obtaining (130) from said selected data blocks (Bo, Bx, By, Bz) corresponding frequency domain data blocks for the heart beat signal (O) and for the acceleration signal (AX, AY, AZ),
said compensating operation includes performing a motion compensation (210) in the frequency domain, compensating the frequency domain data blocks for the heart beat (O) with the corresponding frequency domain data blocks for the acceleration signal (AX, AY, AZ).
Description
- The present description relates to techniques for the estimation of the heart-rate using photoplethysmography on a body organ and an information on acceleration of said body organ.
- Various embodiments may apply e.g. in wearable, in particular wrist-wearable devices, for continuous monitoring of the heart-rate in fitness/wellness applications.
- Among the methods for the estimation of the heart-rate in a subject, one of the most employed makes use of optical means to detect heart beat to evaluate the heart-rate, based on photoplethysmography (PPG). Photoplethysmography involves obtaining optically a volumetric measurement of an organ (plethysmogram). A photoplethysmogram is often obtained by using a pulse oximeter which illuminates the skin and measures changes in light absorption. A conventional pulse oximeter monitors the perfusion of blood to the dermis and subcutaneous tissue of the skin.
- PPG was historically first employed with finger clips in medical applications. Lately PPG has been employed also on wrist, arm, forearm, to make it suitable for fitness applications.
- The PPG techniques typically allow an easy estimation of the heart rate at rest. In motion conditions the PPG signal is affected however by a very low SNR (Signal to Noise Ratio) and SIR (Signal to Interference Ratio. In this specific context SNR means the ratio of the heart rate, i.e. the signal S, to all the other signals, i.e. the noise N. It can be measured by having a subject wearing a cardio frequency meter and a PPG device. The power of the frequency component (peak) measured by the PPG device closest to cardio frequency measured by the cardio frequency meter is the signal S. The total power T is T=(S+N). Thus, for the SNR it is S/N=S/(T-S). The SIR value is obtained as ratio of the signal S over I, the power of the strongest non-cardiac frequency component.
- Poor performances are sometimes obtained by processing a PPG signal with known frequency-domain techniques or time-domain techniques, including adaptive filtering techniques.
- Thus problems affecting the PPG are strong motion artifacts leading to low SNR, low SIR due to motion artifacts, spikes in the detected signal due to motion.
- In the state of the art it is known, in order to compensate the above discussed effects of motion on SNR and SIR and other aspect of the signal detection, to acquire optically from the body organ a heart rate signal, acquire an acceleration signal representative of the acceleration of such body organ, selecting data blocks of said acquired heart rate signal and acceleration signal, compensating in the time domain the heart rate signal by the acceleration signal.
- The following publications described similar prior art techniques for the reduction of the artifacts:
- Yuta Kuboyama, "Motion Artifact Cancellation for Wearable Photoplethismography Sensor", MIT, 2009;
- K. Ashoka eddy, V. Jagadeesh Kumar, "Motion Artifact Reduction in Photoplethysmographic Signals using Singular Value Decomposition", Instrumentation and Measurement Technology Conference, Poland, May 1-3, 2007;
- H. Han, M. Kim, J. Kim, "Development of real-time motion artifact reduction algorithm for a wearable photoplethismography", Proceedings of the 29 th Annual International Conference of the IEEE EMBS Cite Internationale, Lyon, France, August 23-26, 2007;
- P. Wei, R. Guo, J. Zhang, Y.T. Zhang, "A New Wristband Sensor Using Adaptive Reduction Filter to Reduce Motion Artifact", Proceedings of the 5th International Conference on Information Technology and Application in Biomedicine, Shenzen, China, May 30-31, 2008.
- An object of one or more embodiments is to provide a communication system that solves the drawbacks of the prior art and in particular allows:
- to overcome noise by means of high processing gain;
- to overcome interference due to motion in the frequency domain (motion compensation);
- to build a secondary estimator to be used whenever the primary estimator (optical) fails.
- According to one or more embodiments, that object is achieved thanks to method having the characteristics specified in
Claim 1. One or more embodiments may refer to a corresponding system, to a corresponding measuring device and as well as to a computer program product that can be loaded into the memory of at least one computer and comprises parts of software code that are able to execute the steps of the method when the product is run on at least one computer. As used herein, reference to such a computer program product is understood as being equivalent to reference to a computer-readable means containing instructions for controlling the processing system in order to coordinate implementation of the method according to the embodiments. Reference to "at least one computer" is evidently intended to highlight the possibility of the present embodiments being implemented in modular and/or distributed form. - The claims form an integral part of the technical teaching provided herein in relation to the various embodiments.
- According to the solution described herein, the method comprises that said compensation operation includes obtaining from said selected data blocks corresponding frequency domain data blocks for the heart rate signal and acceleration signal, performing a motion compensation of the frequency domain data blocks for the heart rate using the frequency domain data blocks for the acceleration signal.
- In various embodiments, the method comprises performing the motion compensation by subtracting from the frequency domain data blocks for the heart the frequency domain data blocks in the frequency by a scalar weight to obtain said compensated heart rate signal.
- In various embodiments, the method comprises performing a detection operation on said compensated heart rate signal to obtain an estimate of the heart rate.
- In various embodiments, the method comprises computing a non-linear predictor value on the basis of said frequency domain data blocks, performing a correction operation of the detected estimate of the heart rate including performing a decision between the detected estimate of the heart rate and a predicted estimate to select a heart rate value, said predicted estimate being obtained as a linear function of said predictor.
- In various embodiments, the method comprises performing a decision which includes smoothing operations to obtain a final heart rate estimate.
- In various embodiments, the system implementing the method comprises sensors configured for acquiring optically from said body organ a signal representative of the heartbeat and acquiring an acceleration signal representative of the acceleration of said body organ and a processor module configured for selecting data blocks of said acquired heart beat signal and acceleration signal, compensating said heart beat signal by the acceleration signal, calculating the heart rate value on the basis of said compensated heart beat signal.
- In various embodiments, the system includes such sensors and processing module are comprised in a same photoplethysmographic heart rate measuring device.
- In various embodiments, the PPG heart rate measuring device is comprised in an apparatus which is wearable on said body organ, in particular the apparatus is wearable on the wrist or the arm, in particular by means of a bracelet.
- In various embodiments, it is provided a photoplethysmographic heart rate measuring device capable of operating in the system here described.
- In various embodiments such device is associated to a remote processing device connected to it by a communication link.
- In various embodiments such device includes a display.
- The invention will now be described purely by way of a non-limiting example with reference to the annexed drawings, in which:
-
Figures 1A and1B show a system and a device operating according to an embodiment of the method for estimation of the heart rate; -
Figure 2 represents a block diagram of the operations performed by said method; -
Figure 3 represents a diagram detailing an operation of the method described infigure 2 ; -
Figures 4A and 4B detail a filtering operation of the method described infigure 2 ; -
Figure 5 shows a diagram representing a model applied by the method described infigure 2 ; -
Figures 6, 7 and8 represents flow diagrams detailing operations of the method ofFigure 2 . - The ensuing description illustrates various specific details aimed at an in-depth understanding of the embodiments. The embodiments may be implemented without one or more of the specific details, or with other methods, components, materials, etc. In other cases, known structures, materials, or operations are not illustrated or described in detail so that various aspects of the embodiments will not be obscured.
- Reference to "an embodiment" or "one embodiment" in the framework of the present description is meant to indicate that a particular configuration, structure, or characteristic described in relation to the embodiment is comprised in at least one embodiment. Likewise, phrases such as "in an embodiment" or "in one embodiment", that may be present in various points of the present description, do not necessarily refer to the one and the same embodiment. Furthermore, particular conformations, structures, or characteristics can be combined appropriately in one or more embodiments.
- The references used herein are intended merely for convenience and hence do not define the sphere of protection or the scope of the embodiments.
- In
figure 1A it is shown a block diagram representing a photoplethysmographic (PPG)device 10 for measuring the heart rate.Such PPG device 10 includes two lighting emitting diodes, i.e. LEDs, 13a and 13b, in particular green LEDs, which emit light in the direction of the user's skin surface.Such LEDs LED driver 15 which is in its turn controlled by a digital toanalog converter 16 to control the current value. The skin surface is the skin surface of a body organ which in the preferred example is the wrist. Other suitable body organs can be for instance the arm, the forearm, the finger, the forehead or the ear. Light is absorbed, reflected, scattered, and transmitted as it travels through the user's tissues and encounters one or more blood vessels. Heart beats cause the amount of light reflected to drop during systoles and to increase during diastoles. The reflected light is sensed by aphotodiode 17 which converts the amount of light into a current. The twoLEDs photodiode 17. The current at the output ofphotodiode 17 is converted into a voltage by means of a trans-impedance amplifier 18. Finally the voltage is converted into a digital word by means of an analog-to-digital converter 18, for instance a 12-bit analog-to-digital converter 18 operating at a sampling rate fs of 100Hz and acquired by amicrocontroller 11, in particular a 32-bit microcontroller STM32L1 (or STM32F), as a optically acquired digital signal representative of the heart beat, or digital optical heart beat signal o. Themicrocontroller 11 also controls by means of one of its digital outputs connected to digital-to-analog converter 16 the current of theLEDs - The
PPG device 10 includes also a three-axis accelerometer 21, which is in particular equipped with an internal analog-to-digital converter operating at the same sampling rate fs, 100Hz, which provides three accelerometric signals to the microcontroller, namely ax, ay, az, according to axis x, y and z respectively. - An internal memory, in particular a SRAM, of the
microcontroller 11, in particular the 48KB SRAM of the STM32L1 microcontroller, is used to implement the method for the estimation of the heart rate here described, indicated as a whole withreference 1000 infigure 2 . Such method for the estimation of the heart rate receives as input the optically acquired heart beat signal o and the accelerometric signals ax, ay, az and supplies as output a series of heart rate estimate values r. If more memory is available, for example by using the alternative STM32F4 microcontroller, an operation of decimation during afiltering stage 110 shown infigure 2 is not necessary. - The PPG heart
rate measuring device 10 in a preferred embodiment, shown infigure 1B , is arranged in a way which is known per se in a wrist-wearable device 40, including awrist bracelet 41, with theLEDs figure 1B for simplicity's sake onlyLED 13a is shown, in dashed line. - The
PPG device 10 is equipped with an ownlocal display 12 to visualize the series of heart rate estimate values r, in particular, as better detailed in the following, the time series r(n) of the heart rate estimates r. Themicrocontroller 11 itself can further use the data of the heart estimate r for statistics and other type of data manipulation, for instance in order to supply different types of data presentations to the user, such as statistical analyses, themicrocontroller 11 itself can further perform processing of the heart rate estimate r, acting as a local application processor if it has enough computing power. Also, thePPG device 10 comprises atransmitter 22, in the example a Bluetooth transmitter, to send wirelessly the series of heart rate estimate values r to aremote device 30, also shown infigure 1 , which receives the series of heart rate estimate values r by means of a correspondingreceiver 31, which sends the data to anapplication processor 32, which in its turn shows the results on adisplay 33. Theremote device 30 can be for instance a PC, as shown infigure 1B , or a smart phone or another device capable of processing and displaying data. - Such option of having the time series of the heart rate estimate values r either visualized on a
local display 12, used by themicrocontroller 11 itself or sent wirelessly to theremote device 30 depends on the product/application that the system is integrated onto. - In
figure 2 it is shown a block diagram representing an embodiment of a method for the estimation of the heart rate, indicated as a whole with thereference 1000, which is performed by themicrocontroller 11. - The digital optical heart beat signal o acquired by the
PPG device 10 and the digital accelerometric signals ax, ay, az pertaining the three axes x, y z are sent in parallel to afiltering stage 110, then to a selectiveblock generation stage 120, then to afrequency analysis stage 130, which outputs a frequency domain heart beat signal O and frequency domain accelerometric signals AX, AY, AZ pertaining the three axes x, y, z respectively. - The purpose of the
filtering stage 110 is to remove the unwanted frequency bands, that is, all the bands not included in the band of interest of the heart rate. Since the band of interest of the heart rate is, for example, the interval of frequencies between 40 bpm (beats per minute) and 200 bpm, the unwanted bands include a low-frequency band (between 0 bpm and 40 bpm) and a high-frequency band (between 200 bpm and half the sampling frequency). Both the low-frequency and the high-frequency unwanted bands need to be removed to clear the heart signal from noise. In addition, the low-frequency unwanted band needs to be removed because it contains a strong sub-band (between 0 bpm and a few bpm) that negatively interferes with the frequency-analysis stage. More specifically, since the frequency-analysis stage is not limited to orthogonal frequency points, but it calculates also non-orthogonal frequency points, the presence of a strong sub-band in the very low end of the spectrum would cause this sub-band to interfere with the calculation of the non-orthogonal frequency points. In addition, the high-frequency unwanted band needs to be removed in order to prevent aliasing, in case decimation is performed. - Each of
such stages figures 4A and $B. This allows to have signals at the output of the banks of thefiltering stage 110 with basically the same delay and provides simplicity of implementation or design. Nevertheless, in various embodiments the filtering banks can have differences to take in account differences among the input signals, provided they perform the task of removing the frequency bands as indicated above. - Downstream the
frequency analysis stage 130 the frequency domain heart beat signal O and the frequency domain accelerometers signals, AX, AY, AZ are fed to anestimation module 200 which includes amotion compensation block 210 and adetection block 220. Themotion compensation block 210 compensates the frequency domain heart beat signal O using the values of the frequency domain accelerometers signals, AX, AY, AZ. The compensated output, O', of suchmotion compensation block 210, namely a compensated frequency domain heart beat signal O' is fed to thedetection block 220 which computes a detected heart rate estimate d, i.e. identifies the main frequency of the compensated frequency domain heart beat signal O', which is then outputted as detected heart rate estimate d. - Such detected heart rate estimate d is fed to a
correction module 400, performing a model estimation, which also receives the frequency domain accelerometers signals, AX, AY, AZ. In thecorrection module 400, the detected heart rate estimate d is sent as input to adecision block 410 which decides which value, between the detected heart rate estimate d and a predicted estimate m, send as decided heart rate r. The succession of decided heart rate values r form the series of heart rate estimate values r, i.e. the final output of the method described by the block diagram offigure 2 . - Also, a non linear
prediction calculation block 300 receives the frequency domain accelerometers signals, AX, AY, AZ and calculates a predictor p. Such predictor p is fed to thecorrection module 400, specifically to amodel learning block 430 which also receives from thedecision block 410 the detected heart rate estimate d. Themodel learning block 430, on the basis of the predictor p and of the frequency domain accelerometers signals, AX, AY, AZ calculates linear parameters α and β, respectively the constant term and the first degree coefficient of a linear function, which are fed to a linearfunction calculation block 420, together with the predictor p from the non linearprediction calculation block 300. The linearfunction calculation block 420 outputs the predicted estimate m on the basis of the linear function, as better detailed in the following. Thus, summarizing, a parametric model in the form of a linear function calculates a predicted estimate m of the heart rate from the predictor p and the linear parameters α and β. - As mentioned, the
decision block 410 chooses which value between the detected heart rate estimate d and the predicted estimate m represents the decided heart rate r. Thedecision block 410 in various embodiment can simply select to send either the detected heart rate estimate d or the predicted estimate m as output. However, in a preferred embodiment, better detailed in the following thedecision block 410 performs a decision which operate in a smoothed manner, to filter out abrupt changes due to the transitions between the two estimators, the detected heart rate estimate d, which represent a first optical estimator, and the secondary predicted estimator, m, supplying as an output the decided heart rate estimate r and, ultimately, the series of heart rate estimate values r. - When the
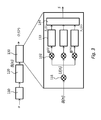
decision block 410 operates its choice, if the optical estimate d is selected, such optical estimate d and the predictor p evaluated at the same time are stored, in particular in respective FIFO memories cx , cy, the pair of values identifying an observation point (p,d) on a predictor-estimate diagram, as better shown with reference tofigure 5 , which is used to refine the model inblock 430.Figure 5 shows a scatter plot of such observation points, (p,d), i.e. the detected heart rate d and the predictor p values. The line shown infigure 5 corresponds to predicted estimate m=α + β * p. - The method attempts at learning the value of linear regression parameters α and β on the basis of points (p, d). For efficiency reasons, the number of points on the basis of which the linear regression parameters α and β are maintained limited in number, since the number of the observation points (p, d) grows rapidly, one point being stored each time the
decisor 410 chooses to select the estimate d. This is obtained by a procedure which, as better detailed in the following, includes collapsing the observation points (p, d) which are sufficiently similar or near one to the other in a single point, and includes substituting with the most recent observation points the oldest observation points, using the FIFO data structures. The size of such FIFO structures is equal to the maximum number of points on the basis of which the regression line is traced. The observation points are no longer of the type of pairs (p, d), but collapsed unique elements contained in the FIFO (cx, cy). - The output of the method for the estimation of the heart-
rate 1000, directed to thelocal display 12, themicrocontroller 11 or theremote device 30, is the numerical time series of estimates r, r(ns), ns being the index of the estimate produced. For instance a decided estimate r is produced every three seconds, so that the index ns is increased every three seconds. The method for the estimation of the heart-rate 1000 makes an attempt to update such series r, with a tentative update period of the estimate Te, i.e. every Te seconds from the last estimate, for example Te=5s or Te=1s. Occasionally the updating attempt fails, due to poor signal conditions; in this case the subsequent update will be provided after a period longer than the update period Te . - With reference to the operations shown in
figure 2 , in various embodiments such method not necessarily includes all the operations and modules shown in such figure and describe above, or, alternatively, some of the operations and module can be different. - By way of example, in various embodiments, the method for the estimation of the heart-rate using photoplethysmography on a body organ, in particular on a wrist of a user, comprises acquiring optically from
sensor sensor 21 an acceleration signal ax, ay, az representative of the acceleration of said body organ, selecting by thestage 120 data blocks Bo, Bx, By , Bz of said acquired heart beat signal o and acceleration signal ax, ay, az, compensating inblock 210 said heart beat signal o by the acceleration signal ax, ay, az, calculating inblock 210, 220 a heart-rate value, the heart rate estimate d on the basis of the resulting compensated heart beat signal O', thecompensation operation stage 130 from said selected data blocks Bo, Bx, By, Bz corresponding frequency domain data blocks for the heart rate signal O and for the acceleration signal AX, AY, AZ, performing amotion compensation 210 of the frequency domain data blocks for the heart beat O using the frequency domain data blocks for the acceleration signal AX, AY, AZ. - In various embodiments, the
correction module 400 operates on the basis of the heart rate estimate d and of the predictor p originated by the non linearprediction calculation block 300 to produce the decided heart rate value r. - In various embodiments the decided heart rate value r is calculated by a smoothed decision operation (as detailed in
figure 8 ). - Now the operation of the specific blocks and stages shown in
figure 3 will be detailed. - As regards the banks of the
filtering stage 110, each comprises a low-pass FIR (Finite Impulse Response)filter 111, as shown infigure 4A , followed by a high-pass filter 113. Between the low-pass filter 111 and thehigh pass filter 113 a factor-2decimation stage 112 is optionally applied, as in the example shown, in order to reduce the memory footprint of the algorithm. The filters are independently applied to each of the four input signals: the optical sequence of values corresponding to the optical signal o, o(n), n being as mentioned the numeric index of the samples acquired, and analogously the three accelerometric sequences ax(n), ay (n) and az(n), corresponding to signals ax, ay and az. The filters offiltering stage 110 produce respectively four filtered time domain signals, one, OHP(n), pertaining theoptical sensor 17, and the other three pertaining each axis of theaccelerometric sensor 21, axHP(n), ayHP(n), azHP(n) respectively. - Since the required transfer function of the high-
pass filter 113 is very stringent, preferably thehigh pass filter 113 is implemented by means of a chain of five IIR (Infinite Impulse Response) filters 113a, as illustrated infigure 4B . - Each of the five
IIR filters 113a have the following transfer function:
where - a 1= -1.905850154697027
- a 2=0.911145313595591
- b 0=0.979650817189758
- b 1=-1.907660496005129
- b 2=0.929684155087730
- The transfer function resulting from the cascade of the five IIR filters accomplishes the removal of the unwanted low-frequency band as explained before, especially the very first portion of the unwanted low-frequency band.
- For what regards the selection
block generation stage 120, this stage comprises four parallel banks receiving as input each a respective sequence corresponding to one of the four filtered time domain signals coming from the sensors, OHP(n), axHP(n), ayHP(n), azHP(n), and generating four time domain data blocks by operating on such respective filtered optical and accelerometric sequences. The four generated time-domain data blocks, B o from the data in the optical sequence OHP(n), and Bx, By , Bz from the data in the accelerometric sequences axHP(n), ayHP(n), azHP(n), are time synchronized, which means that the first samples in each bank of thestage 120 are time aligned to the same temporal reference, which marks the beginning of the time domain data blocks. The selection of the time domain data block is done by means of a procedure, i.e. the selective block-generation better detailed below, that repeatedly tests the data blocks tentatively constructed on the time domain optical sequence o(n) until a given condition is met. The procedure consists in provisionally generating a data block from the optical sequence o(n), testing the condition, and, in case the condition is met, exiting the procedure and forwarding that block Bo to the next stage of the method (along with the three time-aligned accelerometric data blocks Bx, By , Bz ), while, in case it is not met, generating a new provisional block that is time shifted relative to the previous block. In this way, the new provisional block contains a sub-block with more recent samples relative to the previous block. - Specifically, the selective block generation procedure operates as follows and as detailed in
figure 6 , where no indicates an index of the most recent optical sample of the optical sequence o(n) stored in memory out of thefiltering stage 110 and B indicates a data block formed from the N most recent optical samples, from no backwards: - a
de-trending step 610 is first operated on the block B. A block is said to be de-trended if its samples are replaced with the result of the subtraction of the mean value of its original samples from each original sample. In this way, the mean of the samples of the de-trended block equals zero; - then in a
step 620 it is calculated a ratio S on the de-trended block B as the maximum value of B over the mean of the de-trended data block B. N is the number of samples in the block.
- if in a
step 630 test condition is evaluated that such ratio S is lower than a determined threshold value Smax:- ∘ in a
step 640 thestage 120 gives as output the optical data block B0, set equal to block B, and the three time-aligned and de-trended accelerometric blocks Bx , By , Bz , which are forwarded to the frequency-analysis stage 130; - o it is then waited in a
step 650 until thefiltering stage 110 outputs the sample n0+Ne and repeated the above procedure starting from thede-trending step 610 to generate the next blocks;
- ∘ in a
- else, if the
condition 630 is not met, in astep 660 it is waited until thefiltering stage 110 outputs the sample n0 +Nw (the new most recent optical sample) and then it is repeated the procedure from thede-trending step 610, thus generating a new provisional block that is time shifted relative to the previous block. - The parameter N indicating the number of most recent optical samples taken into account is set to 1024, but other values are also possible (although with some effects on performance and memory requirements).
- The throughput parameter Ne is set according to the required throughput of heart-rate estimates, i.e. update period, Te :

- The factor 2 in the denominator of the previous formula refers to the case of the sampling-rate reduction through decimation.
- For example, in case a throughput of 0.2Hz is required (one estimate every 5s), and the sample frequency fs is 100Hz, the throughput parameter Ne is set to 250 samples. The value of the parameter Nw can be set to any amount smaller than throughput parameter Ne, for example to 50 samples.
- For what regards the
frequency analysis stage 130, this stage operates independently on each of the four blocks Bo, Bx, By , Bz at the output of the selectiveblock generation stage 120. The four time domain data blocks Bo, Bx, By , Bz pass through the same type of processing. Each of the four time domain data blocks Bo, Bx , By , Bz is transformed into the frequency domain in the form of a number K of frequency lines, or frequency bins. The K bins are obtained by interleaving a number M of N-point FFTs (Fast Fourier Transform) as shown in reference tofigure 3 . In this way a higher (better) frequency resolution can be obtained, as compared to a single FFT. Not all of the N points are necessary for each FFT, but only a subset of K/M points, as described next. K it is assumed to be an integer multiple of M. Each of the M FFTs are calculated respectively on blocks B(m), with m=0...M-1 obtained by multiplying in amultiplier block 132 the samples of the block U(n) by a complex-valued sequence:
where m=0...M-1, n=0...N-1 and U(n) is obtained by multiplying in amultiplier block 132 the samples of the generic block B(n) by an apodization function (or window function), for example a Taylor function. The use of apodization functions is well known in the prior art and has the purpose to attenuate the artifacts due to the secondary lobes introduced by the operation of block selection. - The complex argument of the exponential includes the product of index m identifying the m-th FFT, index n identifying the sample and a frequency resolution of the frequency analysis Δ, over the sampling frequency fs.
- The m-th FFT, calculated in
block 133 on the block B(m) is denoted with Fm (k), while Sm (k), indicates the squared modulus of the m-th FFT: Sm (k)=|Fm (k)|2 , also calculated inblock 133. - The output of the
frequency analysis 130 is a block S of frequency domain values, formed with such squared modulus of the FFT Sm (k) by amultiplexer 134 as follows:
where k 0 is the index corresponding to the lower bound of the frequency band of interest, as described later. - The K elements of S are numbered from 0 to K-1 so that:

where v=qM+m, with q and m univocally determined by the conditions: m<M, q integer, and m integer. - Each element S(v) corresponds therefore to the frequency (k 0+q)·M·Δ+m·Δ, where the quantity Δ is the frequency resolution: Δ=1/(M*D), and D is the duration in seconds of the analysis block. By way of example, if D=20.48s, and M=3, then Δ =0.0162
- In order to determine the value of K, that is the number of elements in the set S, it is possible to proceed in the following way. First, a band of frequencies of interest is specified, for example the
band 40 bpm - 200 bpm. Secondly, the index k0 , is determined by imposing

- Finally, it is imposed

- Finally the block S is normalized. Within the context of the present description, the normalization of a block X containing K elements produces the block Xu defined as follows:

where
- The normalized block S is thus indicated by Su.
- A normalized block Su is constructed on each of the four time domain data blocks Bo, Bx, By , Bz, and these normalized blocks, which are frequency domain data values, are denoted respectively with Ou , Ax u, Ay u, Az u .
- For what regards the
motion compensation 210, this operation consists in calculating a motion compensated block OMC defined as follows:
Where vX, vY, vY are three scalar weight values, for example set to 1; Ou(k), Ax u(k), Ay u(k), Az u(k) are the normalized frequency domain data block outputted by thefrequency analysis stage 130 respectively for the optical and the three accelerometric sequences. - The derivation of the motion-compensation formula can be made proceeding in the following way.
- The signal Ou (k) can be decomposed into five contributions: a heart-beat signal Oh (k) (the wanted signal), three motion-induced artifact signals, Ox (k), Oy (k), and Oz (k), and a non motion-induced noise On (k). So it is possible to write:

The artifact components, being caused by motion, can be written in terms of transfer function of the accelerometric input:


where VX(k), VY (k), and VZ (k) are three transfer functions defined as:


- Perfect motion compensation would require the knowledge of the three transfer functions. Unfortunately, the transfer functions are unknown for the following reasons:
- they are time variant;
- they are motion dependent;
- a model for their estimation is not available and it is not easy to derive;
- they are subject dependent.
- For the reasons listed above, the transfer functions have been approximated to a constant value both in the time and in the frequency axis, denoted respectively with vX, vY, and vZ . Despite this approximation, the performance of the motion compensation stage is still acceptable in that the purpose of motion compensation is not the complete (over the whole frequency band) estimation of Oh (k), but, rather, is the estimation of only the position of the dominant frequency component of Oh (k), as it will be described next. The optimal values for the three constant (approximated) transfer functions can be obtained, for example, through an optimization process that maximizes the performance of the final heart-rate estimation with respect to vX' vY, and vZ. The values vX = 1,vY = 1, and vZ = 1 offer a first guess of the optimal solution.
- Another important aspect of the motion compensation stage is the operation of normalization applied to the four signals (one heart signal and three accelerometric signals). The result of this operation is to equalize the energy of the four signals to the unitary value. This operation is necessary in order to bring the magnitude of the spectra of the four signals to the same range of values. Failure to do this would cause the subtraction operation to be not effective, in that it would be performed on terms of non-comparable magnitudes. Through the operation of normalization, a strong frequency component present in the spectra of any of the accelerometric signals can effectively cancel the corresponding artefact on the optical signal.
- Thus, the motion compensation substantially includes subtracting from the frequency domain optical signal, Ou , i.e. the heart beat signal in the frequency domain, a linear combination of the three frequency domain acceleration signals Ax u(k), Ayu(k), Az u(k) multiplied by a respective scalar weight vX , vY, vY.
- For what regards the
detection operation 220, the detection consists in finding a argument kmax of the maximum value of the motion compensated block OMC(k):
- The frequency bin kdet of the detected heart-rate d can then be obtained from such argument kmax as the sum of the index of the first useful bin k0 and argument kmax :

- Optionally, the estimate of the frequency bin kdet can be refined by a 3-point interpolation:


- Finally, the detected heart rate estimate d is obtained by performing a rescaling the frequency bin kdet of the detected heart-rate d:

- For what regards the predictor calculation in
block 300, thefrequency analysis stage 130 produces a set of four frequency-domain data blocks at output times tl =t l-1+τ l , where τ l is the interval between two consecutive calculations and 1 is the index of the output times. This interval τ l is usually equal to the update period Te , but it can be longer in case the selective block-generation stage 120 enters in thestep 660 of the selective block generation procedure in which it is waited until thefiltering stage 110 outputs the sample n0 +Nw . The l-th set of four frequency domain blocks, calculated at time tl, is denoted as Ou (n;l),


- The calculation of the predictor in
block 300 consists of the following procedure comprising the following steps: - a
step 710 of summing the normalized frequency domain blocks of the three accelerometric signals to obtain a sum of accelerations A(k;l)
- a
step 720 of finding the maximum Amax(l) of the sum of accelerations A(k;l) and the corresponding argument nmax:

- a
step 730 of calculating a time sequence q(l) as function of the maximum Amax(l) of the sum of accelerations A(k;l) and of the corresponding argument nmax as follows:
- a
step 740 of filtering the time sequence q(l) by means of two first-order IIR filters as follows:

where:

- a
step 750 of selecting as predictor at time tl, p(l), the maximum between the first filtered sequence pf (l) and the second filtered sequence ps(l):
- The previous formula represents the fact that the predictor p(l) is constructed as the maximum between two intermediate functions, pf(l) and ps(l). These two intermediate functions are two filtered versions of the time series of q(l). If to the time sequence q(l) is given the interpretation of the level of physical exertion of the user, the two filtered output of the time sequence q(l) represent two different responses to physical exertion. In particular, the series pf(l) represents a fast response to the time sequence q(l), while ps(l) represents a slow response to the time sequence q(l). Through the operation of maximum search max, the series ps(l) becomes relevant during periods of physical recovery (that is when the level of physical exertion is decreasing), while the series pf(l) becomes relevant during periods of increasing physical activity. This is consistent with the fact that cardiac output (and therefore cardiac frequency) responds differently to increases and decreases of physical activity. Typically, heart rate responds quickly to an increase of physical activity, and responds much more slowly to a decrease of physical activity.
- For what concerns the
correction stage 400, this stage uses the values of the predictor p(l) and of the detected heart rate estimate d(l) to arrive at a heart-rate estimate r(l). - The
correction procedure 400 includes the following steps: - a
step 805 in which is verified if an initialization of values is required. This occurs usually only at the power-on of the system. In the affirmative (Y), astep 810 of initialization of the values is performed. Values are by way of example initialized as follows:- l=1
- α= α0
- β= β0
- In the following for simplicity of
representation index 1 will be used instead of time tl. - Three FIFO memories, cX, cY, which store, as mentioned, the observation points (p,d) each time the estimate d is selected, and a weight computation FIFO cW which is used in the aggregation of the points. FIFO memories cX, cY, cW as described in the following, are initialized as empty.
- In particular, the predictor FIFO memory cx sequentially stores the values of the predictor p at each time instant l at which the estimate d is selected.
- The estimate FIFO memory cy sequentially stores the values of the estimate d at each time instant l.
- The weight FIFO memory cw increments the values of a weight factor at each time instant l.
- α0 and β0 are initial guesses set for the first order term and for the constant term of the linear regression, for example, α0=80 and β0=0.8. Other values are suitable, although they have an effect on the accuracy of the final heart rate estimate;
- after
step 810 or if the condition verified atstep 805 is negative (N), i.e. initialization has been already performed a step ofevaluation 820 of a condition c1(l) at time l is performed:
where:


- G indicates a safety margin set for instance to 40, therefore dmin and dmax represents two lines parallel to m(l) which identify the lower and upper limit of a safety range. If the value estimate d is outside such range is considered not a good value.
- If the condition c1(l) is true then the estimate r(l) is, in block 830:

- The correction is finished, and the procedure wait in a
step 840 for the next iteration, updating the time index l, thus it is l=l+1 and going back tooperation 820. - Else if condition c1(l) is false, the condition c2(l) is evaluated at time l in a step 850:

- g1 and g2 are parameters set for instance to g1=-10 and g 2= 20 which set a confidence range [g1, g2] for the variation between time adjacent estimates. If the estimates d(l) are within said range, c2(l) is false, meaning that the estimate d is reliable and can be selected as valid output (see
step 870 below). - Other values are possible, although they may affect the accuracy of the heart rate estimates.
- If condition c2(l) is true, the final estimate r(l) is evaluated in a
step 860 as the median of the latest three detected estimates d(l-2),d(l-1),d(l):
- It is noted that if c2(l) is true the optical estimate d is considered in any case at least partly reliable, since it is used to obtain the final estimate r(l), although through the median function. If c2(l) is false, the reliability of the optical estimate d(l) is greater, thus there is no need of taking in account the two previous estimates d(l-1), d(l-2) and the estimate d(l) is sent directly as output r(l). Thus
operation 860, within the decision operation performed byblock 410, represents a smoothing operation applied taking in account a plurality of estimates d at different times, such as l-2,...,l and averaging over them. - Also in this case the correction procedure is finished and the procedure waits in a
step 840 for the next iteration, updating the time index l, thus it is l=l+1 and going back tooperation 820. - If condition c2(l) is false, the final estimate is set in a
step 870 to the detected estimate d(l):
- In
figure 8 steps 810-870 are indicated by a dashed polygonal as operated specifically by thedecision block 410. As mentioned, thedecision block 410 in its simpler form decides if the final estimate r(l) is equal to the optical estimate d(l) or to the predicted estimate m(l) on the basis of a given condition, such as c1(l) or c2(l)), which evaluates if the optical estimate value is reliable. In the embodiment offigure 8 , however, a smoothed decision is implemented, i.e. the final estimate r(l) is at least in some cases the result of an average of the current estimate with previous estimates, optical estimate d and or predicted estimate m. Specifically, whilestep 870 output simply the optical estimate d(l) as final estimate r(l),step 860 outputs an average over previous optical estimates,step 830 outputs an average with the previous final estimate r(l).It is clear that in various embodiments other choices of reliability conditions such as c1(l) or c2(l)) and other type of averaging are possible to the person skilled in the art. - The results of either
steps decision block 410. - Preferably, the update of the
linear block 430 includes performing an aggregation operation, described here below, to keep low the number of observation points in the FIFO. Thus, infigure 8 it is indicated, afterstep 870, astep 881 of evaluating if aggregation is required. In the negative, after thestep 870, since thedecision block 410 has chosen the detected estimate d(l), the linear model inblock 430 is updated, this meaning that observation point (p, d) are stored in astep 875 in the FIFO cX, cY . Then step 896 is performed, outputting the final estimate r(l). - If
step 881 indicates that an aggregation procedure must be performed, it is executed astep 882 of finding an element a in the predictor FIFO cx, storing a time sequence of predictors p, closest to the predictor p(l):
- and evaluating if a<a max, i.e. the closest element a in the predictor FIFO cx is closer than a threshold value to the predictor p at time l. This corresponds to evaluate if the new observation point is near to an existing point stored in the FIFO.
- In the affirmative in a
step 883 it is set:


- j0 is a parameter indicating the value of index j of the value cx(j) in the predictor FIFO cx which minimizes the distance with the predictor p(l) at time index l, which identifies an aggregating point (cx (j0 ),cy (j0 )).
- cw is in general a weight factor FIFO. cw (j0 ) represents a weight factor of the aggregating point (cx (j0 ),cy (j0 )), i.e. a FIFO counter which is incremented by one at each aggregation of a new observation point (p,d) to such aggregating point(cx (j 0),cy (j 0)).
- The operation of aggregation or collapse in a single point is a weighted average performed on both the values in the predictor FIFO cx and in the estimate FIFO cy . The aggregating points (cx (j0 ),cy (j0 )) with the greater weight are those which are the results of a greater number of aggregations in the past. The weight of the aggregating point is used to establish a weight of the newly aggregated point (p,d), which is represented by w. Thus, the relations above implements the operations of assigning to the new point or aggregated (p, d) a relative weight which is inversely proportional to the weight of the aggregating point ((cx (j 0),cy (j 0)) to which is aggregated.
- In this way, if the aggregating point (cx (j 0),cy (j 0)) is reliable, the aggregated point (p,d) has not to change significantly its value.
- Else if
condition 882 is not met, it is performed a push operation on the content of the FIFO, before passing to step 875.


- The function push(val, list) first shifts one position rightwards all the elements contained in the list (in this way discarding the rightmost element) and then inserts the number val at the leftmost position of the list.
- Then in a
step 890, followingstep 883, are calculated the linear regression parameters α1 , β1, R1 of the set of points {(cx (j),cy (j))}, for j=0,...,F(l)-1, F(l) being the number of elements in the FIFO memory at time index l. - R indicates the coefficient of determination computed in the classical mode from the linear regression (it is R2 properly, R for short). The coefficient of determination R measures the amount of linearity of the aggregated poins, which are used as reliability indication. R1 indicates therefore the coefficient of determination computed over the current aggregated points, i.e. the points (cx, cy ) in the FIFO structures, while Rmin indicates a minimum threshold level above which the linear model is considered as reliable.
- In a
step 892 it is evaluated if the number of elements in the FIFO F(l) is at least a minimum value F min and if the coefficient of determination R is greater equal than a minimum value Rmin. - In the affirmative, in a
step 893 the linear parameters are updated, setting them to the linear regression parameters α1, β1 calculated in the step 890:

- Else, in a
step 894 the linear parameters are set to the initial values of initialization step 810:

- The procedure goes to step 840 and then to step 820 to wait for the next iteration.
- The parameters Fmin and Rmin are set, for example to Fmin =5 and Rmin =0.5. Other values are possible but performance may vary.
- Steps 890-894 are indicated by a dashed square as operated specifically by the
model learning block 430 to update the linear regression parameters on the basis of the observation points storingstep 875. As indicated steps 880-884 represents an accessory aggregation procedure. In various embodiments it is also possible to proceed from the observation points storingstep 875 directly to linearparameters calculation step 890. - The solution according to the various embodiments here described allows to obtain the following advantages.
- The method according to the various embodiments here described is advantageous since it allows to overcome noise by means of high processing gain (for instance, with 1024 points FFT is obtained a 30dB gain).
- The method according to the various embodiments here described is also advantageous since it allows to overcome interference due to motion of the body organ in the frequency domain (motion compensation).
- The method according to the various embodiments here described is also advantageous since it to build a secondary estimator, i.e. a prediction, to be used whenever the primary estimator derived by the optical signal fails.
- Of course, without prejudice to the principle of the embodiments, the details of construction and the embodiments may vary widely with respect to what has been described and illustrated herein purely by way of example, without thereby departing from the scope of the present embodiments, as defined the ensuing claims.
- The method here described can be used in system and device for the continuous monitoring of the heart-rate for fitness/wellness applications. These systems and devices can be for instance wrist-wearable devices for runners monitoring their workout session. These devices can be wristwear or also earwear, smart-watches, smart-headphones.
Claims (19)
- Method for the estimation of the heart-rate using photoplethysmography on a body organ, in particular on a wrist of a user, comprising acquiring optically (13a, 13b, 17) from said body organ a signal representative of the heart beat (o), acquiring (21) an acceleration signal (ax, ay, az) representative of the acceleration of said body organ, selecting (120) data blocks (Bo, Bx, By , Bz) of said acquired heart beat signal (o) and acceleration signal (ax, ay, az), compensating (210) said heart beat signal (o) by the acceleration signal (ax, ay, az), calculating (220; 410; 500) a heart-rate value (d; r) on the basis of said compensated heart beat signal (O'),
characterized in that said method includes obtaining (130) from said selected data blocks (Bo, Bx, By, Bz) corresponding frequency domain data blocks for the heart beeat signal (O) and for the acceleration signal (AX, AY, AZ),
said compensating operation includes performing a motion compensation (210) in the frequency domain, compensating the frequency domain data blocks for the heart beat (O) with the corresponding frequency domain data blocks for the acceleration signal (AX, AY, AZ). - The method according to claim 1, characterized in that said motion compensation (210) includes subtracting from the frequency domain data blocks for the heart beat (O) the frequency domain data blocks (AX, AY, AZ) multiplied by a respective scalar weight (vX, vY, vZ ) to obtain said compensated heart beat signal (O').
- The method according to claim 1 or claim 2, characterized by performing a detection operation (220) on said compensated heart beat signal (O') to obtain an estimate of the heart rate (d).
- The method according to any one of the preceding claims, characterized in that includes computing a non-linear predictor value (p) on the basis of said frequency domain data blocks (AX, AY, AZ),
performing a correction (400) operation of the detected estimate of the heart rate (d) including
performing a decision (410) between the detected estimate of the heart rate (d) and a predicted estimate (m) to select a decided heart rate value (r),
said predicted estimate (m) being obtained (420) as a linear function (α, β) of said predictor (p). - The method according to claim 4, characterized in that said performing a decision (410) between the detected estimate of the heart rate (d) and a predicted estimate (m) to select a decided heart rate value (r) includes a smoothing operation (850, 860) applied taking in account a plurality of estimates (d, m, r) at different times and averaging over them.
- The method according to any of the preceding claims, characterized by updating (430) said linear function (α, β) by storing the current detected estimate (d) and predictor value (p) each time the operation of performing a decision selects the optical estimate (d), obtaining a sequence of observation points (p,d), in particular stored in a FIFO (cx, cy), calculating the linear function (α, β) as regression over said sequence of observation points (p,d).
- The method according to claim 6, characterized by performing an aggregation operation (880, 882, 884) over said sequence of observation points (p,d) to keep low their number.
- The method according to any of the preceding claims, characterized by performing a filtering (110) before said selecting (120) data blocks (Bo, Bx, By, Bz ) of said acquired heart beat signal (o) and acceleration signal (ax, ay, az), in particular said filtering (111) comprising a low-pass FIR (Finite Impulse Response) filter (111) and a high-pass filter (113), in particular implemented by a chain of IIR (Infinite Impulse Response) filters (113a).
- The method according to any of the preceding claims, characterized in that said selecting (120) data blocks (Bo, Bx, By , Bz) of said acquired heart beat signal (o) and acceleration signal (ax, ay, az) includes provisionally generating a data block (Bo) from the acquired heart beat signal (o), testing (630) a condition (Smax ) on said block (Bo ) and, in case the condition is met (640) forwarding said block (Bo) and the data blocks (Bx, By , Bz) of said acquired acceleration signal (ax, ay, az), time-aligned with said data block (Bo) from the acquired heart beat signal (o) to the operation (130) for obtaining corresponding frequency domain data blocks for the heart beat signal (O) and for the acceleration signal (AX, AY, AZ), while, in case said condition is not met (660), generating a new provisional block that is time shifted (Nw) relative to the previous block.
- The method according to any of the preceding claims, characterized that said motion compensation operation (210) is followed by a detection operation (220) to identify a main frequency of the compensated frequency domain heart beat signal (O') which is outputted as detected heart rate estimate (d).
- The method according to any of the preceding claims, characterized that said operation of obtaining (130) from said selected data blocks (Bo, Bx, By, Bz) corresponding frequency domain data blocks for the heart beat signal (O) and for the acceleration signal (AX, AY, AZ) includes obtaining a plurality (K) of bins by interleaving a plurality (M) of Fast Fourier Transform operations.
- A system for the estimation of the heart-rate using photoplethysmography on a body organ, in particular a wrist of a user, comprising sensors (17, 21) configured for acquiring optically (13a, 13b, 17) from said body organ a heart beat signal (o) and acquiring (21) an acceleration signal (ax, ay, az) representative of the acceleration of said body organ and a processor module (11) configured for selecting data blocks (Bo, Bx, By, Bz) of said acquired heart beat signal (o) and acceleration signal (ax , ay , az ), compensating said heart beat signal (o) by the acceleration signal (ax, ay, az), calculating the heart rate value (r) on the basis of said compensated heart beat signal (O'),characterized in that said module (11) is configured to perform the method according to any of claim 1 to 9.
- The system according to Claim 12, wherein said sensors (17, 21) and said processing module (11) are comprised in a same photoplethysmographic heart rate measuring device (11).
- The system according to Claim 12, wherein said device (11) is comprised in a apparatus (40) which is wearable on said body organ.
- The system according to Claim 14, wherein said wearable apparatus (40) is wearable on the wrist or the arm, in particular by means of a bracelet (41).
- The system according to any of Claims 12 to 15, wherein said system comprises a remote processing device (30) connected by a communication link (22, 31) with said photoplethysmographic heart rate measuring device (11).
- The system according to Claim 15 or 16, wherein said photoplethysmographic heart rate measuring device (11) includes a display (12).
- A photoplethysmographic heart rate measuring device (11) according to any of Claims 12 to 17.
- A computer program product that can be loaded into the memory of at least one computer and comprises parts of software code that are able to execute the steps of the method of any of Claims 1 to 11 when the product is run on at least one computer.
Applications Claiming Priority (1)
| Application Number | Priority Date | Filing Date | Title |
|---|---|---|---|
| ITTO20140462 | 2014-06-09 |
Publications (2)
| Publication Number | Publication Date |
|---|---|
| EP2954840A1 true EP2954840A1 (en) | 2015-12-16 |
| EP2954840B1 EP2954840B1 (en) | 2019-11-06 |
Family
ID=51358014
Family Applications (1)
| Application Number | Title | Priority Date | Filing Date |
|---|---|---|---|
| EP15170706.4A Active EP2954840B1 (en) | 2014-06-09 | 2015-06-04 | Method for the estimation of the heart-rate and corresponding system |
Country Status (3)
| Country | Link |
|---|---|
| US (1) | US9936886B2 (en) |
| EP (1) | EP2954840B1 (en) |
| CN (3) | CN109381175B (en) |
Families Citing this family (34)
| Publication number | Priority date | Publication date | Assignee | Title |
|---|---|---|---|---|
| US8948832B2 (en) | 2012-06-22 | 2015-02-03 | Fitbit, Inc. | Wearable heart rate monitor |
| US9039614B2 (en) | 2013-01-15 | 2015-05-26 | Fitbit, Inc. | Methods, systems and devices for measuring fingertip heart rate |
| US9936886B2 (en) * | 2014-06-09 | 2018-04-10 | Stmicroelectronics S.R.L. | Method for the estimation of the heart-rate and corresponding system |
| US11071490B1 (en) | 2015-04-09 | 2021-07-27 | Heartbeam, Inc. | Electrocardiogram patch devices and methods |
| US10123746B2 (en) * | 2015-05-08 | 2018-11-13 | Texas Instruments Incorporated | Accuracy of heart rate estimation from photoplethysmographic (PPG) signals |
| US10568525B1 (en) | 2015-12-14 | 2020-02-25 | Fitbit, Inc. | Multi-wavelength pulse oximetry |
| EP3181038A1 (en) * | 2015-12-14 | 2017-06-21 | Cheng Uei Precision Industry Co., Ltd. | Heart rate measurement method and heart rate measurement device applying the same |
| US20170164847A1 (en) * | 2015-12-15 | 2017-06-15 | Texas Instruments Incorporated | Reducing Motion Induced Artifacts in Photoplethysmography (PPG) Signals |
| CN105559766A (en) * | 2015-12-23 | 2016-05-11 | 广州碧德电子科技有限公司 | Wrist type real-time dynamic heart rate measuring method based on PPG |
| US20170220752A1 (en) * | 2016-02-01 | 2017-08-03 | Verily Life Sciences Llc | Systems and methods for probabilistic pulse rate estimation from photoplethysmographic measurements in the presence of nonstationary and nontrivial signal and noise spectra |
| JP6642055B2 (en) * | 2016-02-02 | 2020-02-05 | 富士通株式会社 | Sensor information processing device, sensor unit, and sensor information processing program |
| CN110876615B (en) * | 2016-05-04 | 2022-08-02 | 把脉(上海)信息科技有限公司 | Real-time dynamic heart rate monitoring device and monitoring method |
| CN105943013B (en) * | 2016-05-09 | 2020-03-06 | 安徽华米信息科技有限公司 | Heart rate detection method and device and intelligent wearable device |
| TWI592136B (en) * | 2016-06-24 | 2017-07-21 | 晶翔微系統股份有限公司 | Wearable device and compensation method of heartbeat rate reading thereof |
| US20180085069A1 (en) * | 2016-08-29 | 2018-03-29 | Smartcardia Sa | Method and Device for Processing Bio-Signals |
| KR101831064B1 (en) * | 2016-09-06 | 2018-02-22 | 숭실대학교산학협력단 | Apparatus for motion artifact removal using ppg signal and method thereof |
| CN106343996A (en) * | 2016-11-14 | 2017-01-25 | 佳禾智能科技股份有限公司 | Heart rate step counting earphone and implementing method thereof |
| US12471790B2 (en) | 2017-04-07 | 2025-11-18 | Fitbit, LLC | Multiple source-detector pair photoplethysmography (PPG) sensor |
| US11051706B1 (en) | 2017-04-07 | 2021-07-06 | Fitbit, Inc. | Multiple source-detector pair photoplethysmography (PPG) sensor |
| CN107822607B (en) * | 2017-09-22 | 2021-03-16 | 广东乐心医疗电子股份有限公司 | A method, device and storage medium for estimating cardiovascular characteristic parameters |
| CN110141203A (en) * | 2018-02-12 | 2019-08-20 | 光宝新加坡有限公司 | Heart rate detecting system and the wearable device for using it |
| US11412972B2 (en) | 2018-03-28 | 2022-08-16 | Livmor, Inc. | Detection of atrial fibrillation |
| CN108926338B (en) * | 2018-05-31 | 2019-06-18 | 中南民族大学 | Heart rate prediction technique and device based on deep learning |
| US11701049B2 (en) | 2018-12-14 | 2023-07-18 | Heartbeam, Inc. | Hand held device for automatic cardiac risk and diagnostic assessment |
| CN110169764A (en) * | 2019-05-06 | 2019-08-27 | 上海理工大学 | A kind of LMS adaptive-filtering PPG signal heart rate extracting method |
| CA3137699A1 (en) | 2019-05-13 | 2020-11-19 | Branislav Vajdic | Compact mobile three-lead cardiac monitoring device |
| CN110960189B (en) * | 2019-09-12 | 2023-02-24 | 中国人民解放军陆军特色医学中心 | Wireless cognitive regulator and eye movement testing method |
| TWI777103B (en) * | 2019-11-06 | 2022-09-11 | 達爾生技股份有限公司 | Electronic device and blood oxygen correction method |
| CN114282590B (en) * | 2020-11-18 | 2025-10-21 | 阿里巴巴集团控股有限公司 | Method, system and readable medium for distance measurement of time series |
| CN113057613B (en) * | 2021-03-12 | 2022-08-19 | 歌尔科技有限公司 | Heart rate monitoring circuit and method and wearable device |
| CN115245320B (en) * | 2021-04-26 | 2025-03-07 | 安徽华米信息科技有限公司 | Wearable device, heart rate tracking method and heart rate tracking device thereof |
| CN113261932B (en) * | 2021-06-28 | 2022-03-04 | 山东大学 | Heart rate measurement method and device based on PPG signal and one-dimensional convolutional neural network |
| CN118430814B (en) * | 2024-06-14 | 2025-08-05 | 山东青年政治学院 | A method and system for recommending health and wellness knowledge for the elderly |
| TWI908592B (en) * | 2025-01-22 | 2025-12-11 | 大陸商廣州印芯半導體技術有限公司 | Evaluation system and method for optical physiological signal and related wearable device |
Citations (1)
| Publication number | Priority date | Publication date | Assignee | Title |
|---|---|---|---|---|
| JPH119564A (en) * | 1997-06-27 | 1999-01-19 | Seiko Epson Corp | Cardiac function diagnostic device |
Family Cites Families (9)
| Publication number | Priority date | Publication date | Assignee | Title |
|---|---|---|---|---|
| DE3688577D1 (en) * | 1985-09-17 | 1993-07-22 | Biotronik Mess & Therapieg | HEART PACEMAKER. |
| GB9718026D0 (en) | 1997-08-27 | 1997-10-29 | Secr Defence | Multi-component signal detection system |
| US7991448B2 (en) * | 1998-10-15 | 2011-08-02 | Philips Electronics North America Corporation | Method, apparatus, and system for removing motion artifacts from measurements of bodily parameters |
| US6339715B1 (en) | 1999-09-30 | 2002-01-15 | Ob Scientific | Method and apparatus for processing a physiological signal |
| US20120150052A1 (en) | 2010-12-13 | 2012-06-14 | James Buchheim | Heart rate monitor |
| CA2825331A1 (en) | 2011-01-21 | 2012-07-26 | Worcester Polytechnic Institute | Physiological parameter monitoring with a mobile communication device |
| US9005129B2 (en) * | 2012-06-22 | 2015-04-14 | Fitbit, Inc. | Wearable heart rate monitor |
| US20150065889A1 (en) * | 2013-09-02 | 2015-03-05 | Life Beam Technologies Ltd. | Bodily worn multiple optical sensors heart rate measuring device and method |
| US9936886B2 (en) * | 2014-06-09 | 2018-04-10 | Stmicroelectronics S.R.L. | Method for the estimation of the heart-rate and corresponding system |
-
2015
- 2015-05-28 US US14/724,579 patent/US9936886B2/en active Active
- 2015-06-04 EP EP15170706.4A patent/EP2954840B1/en active Active
- 2015-06-08 CN CN201811230190.0A patent/CN109381175B/en active Active
- 2015-06-08 CN CN201510311911.0A patent/CN105125198B/en active Active
- 2015-06-08 CN CN201520390570.6U patent/CN205083467U/en not_active Withdrawn - After Issue
Patent Citations (1)
| Publication number | Priority date | Publication date | Assignee | Title |
|---|---|---|---|---|
| JPH119564A (en) * | 1997-06-27 | 1999-01-19 | Seiko Epson Corp | Cardiac function diagnostic device |
Non-Patent Citations (6)
| Title |
|---|
| H. HAN; M. KIM; J. KIM: "Development of real- time motion artifact reduction algorithm for a wearable photoplethismography", PROCEEDINGS OF THE 29 TH ANNUAL INTERNATIONAL CONFERENCE OF THE IEEE EMBS CITE INTERNATIONALE, 23 August 2007 (2007-08-23) |
| HYONYOUNG HAN ET AL: "Development of real-time motion artifact reduction algorithm for a wearable photoplethysmography", 2007 ANNUAL INTERNATIONAL CONFERENCE OF THE IEEE ENGINEERING IN MEDICINE AND BIOLOGY SOCIETY : [EMBC '07] ; LYON, FRANCE, 22 - 26 AUGUST 2007 ; [IN CONJUNCTION WITH THE BIENNIAL CONFERENCE OF THE SOCIÉTÉ FRANÇAISE DE GÉNIE BIOLOGIQUE ET MÉDICAL (SFGB, 22 August 2007 (2007-08-22), pages 1538 - 1541, XP031336475, ISBN: 978-1-4244-0787-3 * |
| JAMES A C PATTERSON ET AL: "Ratiometric Artifact Reduction in Low Power Reflective Photoplethysmography", IEEE TRANSACTIONS ON BIOMEDICAL CIRCUITS AND SYSTEMS, IEEE, US, vol. 5, no. 4, 1 August 2011 (2011-08-01), pages 330 - 338, XP011336431, ISSN: 1932-4545, DOI: 10.1109/TBCAS.2011.2161304 * |
| K. ASHOKA EDDY; V. JAGADEESH KUMAR: "Motion Artifact Reduction in Photoplethysmographic Signals using Singular Value Decomposition", INSTRUMENTATION AND MEASUREMENT TECHNOLOGY CONFERENCE, 1 May 2007 (2007-05-01) |
| P. WEI; R. GUO; J. ZHANG; Y.T. ZHANG: "A New Wristband Sensor Using Adaptive Reduction Filter to Reduce Motion Artifact", PROCEEDINGS OF THE 5TH INTERNATIONAL CONFERENCE ON INFORMATION TECHNOLOGY AND APPLICATION IN BIOMEDICINE, 30 May 2008 (2008-05-30) |
| YUTA KUBOYAMA, MOTION ARTIFACT CANCELLATION FOR WEARABLE PHOTOPLETHISMOGRAPHY SENSOR, 2009 |
Also Published As
| Publication number | Publication date |
|---|---|
| US9936886B2 (en) | 2018-04-10 |
| US20150351646A1 (en) | 2015-12-10 |
| CN109381175A (en) | 2019-02-26 |
| EP2954840B1 (en) | 2019-11-06 |
| CN109381175B (en) | 2022-11-04 |
| CN205083467U (en) | 2016-03-16 |
| CN105125198A (en) | 2015-12-09 |
| CN105125198B (en) | 2018-11-09 |
Similar Documents
| Publication | Publication Date | Title |
|---|---|---|
| EP2954840B1 (en) | Method for the estimation of the heart-rate and corresponding system | |
| US11872060B2 (en) | Methods and systems for calculating physiological parameters | |
| US10893815B2 (en) | Heart rate measurement and a photoplethysmograph (PPG) heart rate monitor | |
| CN107949321B (en) | Time Domain Interference Removal and Improved Heart Rate Measurement Tracking Mechanism | |
| Yang et al. | Estimation and validation of arterial blood pressure using photoplethysmogram morphology features in conjunction with pulse arrival time in large open databases | |
| US6393311B1 (en) | Method, apparatus and system for removing motion artifacts from measurements of bodily parameters | |
| CN108478206B (en) | Heart rate monitoring method based on pulse wave in exercise state | |
| EP3478166B1 (en) | On-demand heart rate estimation based on optical measurements | |
| Chung et al. | Deep learning for heart rate estimation from reflectance photoplethysmography with acceleration power spectrum and acceleration intensity | |
| CN107530005B (en) | Method and apparatus for deriving mean arterial pressure of a subject | |
| Schäck et al. | Computationally efficient heart rate estimation during physical exercise using photoplethysmographic signals | |
| Schäck et al. | A new method for heart rate monitoring during physical exercise using photoplethysmographic signals | |
| Tanweer et al. | Motion artifact reduction from PPG signals during intense exercise using filtered X-LMS | |
| EP3292813B1 (en) | Method and device for processing bio-signals | |
| US20170143218A1 (en) | Heart rate estimation apparatus with state sequence optimization | |
| WO2009043028A2 (en) | Measurement of physiological signals | |
| US12369805B2 (en) | Motion detection and cancellation using ambient light | |
| CN105816165B (en) | A real-time dynamic heart rate monitoring device and monitoring method | |
| CN102197998A (en) | Use of the frequency spectrum of artifact in oscillometry | |
| TW201438669A (en) | Detecting method and apparatus for blood oxygen saturation | |
| WO2017091819A1 (en) | Heart rate estimation apparatus using digital automatic gain control | |
| Torres et al. | Heal-T: an efficient PPG-based heart-rate and IBI estimation method during physical exercise | |
| Arunkumar et al. | Improved heart rate estimation from photoplethysmography during physical exercise using combination of NLMS and RLS adaptive filters | |
| Kajita et al. | Motion artifact canceling PPG heart rate sensor based on an adaptive filter algorithm with variable tap length | |
| Ciobotariu et al. | Virtual instrumentation on mobile devices for measuring the pulse wave velocity |
Legal Events
| Date | Code | Title | Description |
|---|---|---|---|
| PUAI | Public reference made under article 153(3) epc to a published international application that has entered the european phase |
Free format text: ORIGINAL CODE: 0009012 |
|
| AK | Designated contracting states |
Kind code of ref document: A1 Designated state(s): AL AT BE BG CH CY CZ DE DK EE ES FI FR GB GR HR HU IE IS IT LI LT LU LV MC MK MT NL NO PL PT RO RS SE SI SK SM TR |
|
| AX | Request for extension of the european patent |
Extension state: BA ME |
|
| 17P | Request for examination filed |
Effective date: 20160615 |
|
| RBV | Designated contracting states (corrected) |
Designated state(s): AL AT BE BG CH CY CZ DE DK EE ES FI FR GB GR HR HU IE IS IT LI LT LU LV MC MK MT NL NO PL PT RO RS SE SI SK SM TR |
|
| GRAP | Despatch of communication of intention to grant a patent |
Free format text: ORIGINAL CODE: EPIDOSNIGR1 |
|
| STAA | Information on the status of an ep patent application or granted ep patent |
Free format text: STATUS: GRANT OF PATENT IS INTENDED |
|
| INTG | Intention to grant announced |
Effective date: 20190617 |
|
| RIN1 | Information on inventor provided before grant (corrected) |
Inventor name: CERVINI, STEFANO |
|
| GRAS | Grant fee paid |
Free format text: ORIGINAL CODE: EPIDOSNIGR3 |
|
| GRAA | (expected) grant |
Free format text: ORIGINAL CODE: 0009210 |
|
| STAA | Information on the status of an ep patent application or granted ep patent |
Free format text: STATUS: THE PATENT HAS BEEN GRANTED |
|
| AK | Designated contracting states |
Kind code of ref document: B1 Designated state(s): AL AT BE BG CH CY CZ DE DK EE ES FI FR GB GR HR HU IE IS IT LI LT LU LV MC MK MT NL NO PL PT RO RS SE SI SK SM TR |
|
| REG | Reference to a national code |
Ref country code: GB Ref legal event code: FG4D |
|
| REG | Reference to a national code |
Ref country code: AT Ref legal event code: REF Ref document number: 1197657 Country of ref document: AT Kind code of ref document: T Effective date: 20191115 Ref country code: CH Ref legal event code: EP |
|
| REG | Reference to a national code |
Ref country code: IE Ref legal event code: FG4D |
|
| REG | Reference to a national code |
Ref country code: DE Ref legal event code: R096 Ref document number: 602015040961 Country of ref document: DE |
|
| REG | Reference to a national code |
Ref country code: NL Ref legal event code: MP Effective date: 20191106 |
|
| REG | Reference to a national code |
Ref country code: LT Ref legal event code: MG4D |
|
| PG25 | Lapsed in a contracting state [announced via postgrant information from national office to epo] |
Ref country code: BG Free format text: LAPSE BECAUSE OF FAILURE TO SUBMIT A TRANSLATION OF THE DESCRIPTION OR TO PAY THE FEE WITHIN THE PRESCRIBED TIME-LIMIT Effective date: 20200206 Ref country code: FI Free format text: LAPSE BECAUSE OF FAILURE TO SUBMIT A TRANSLATION OF THE DESCRIPTION OR TO PAY THE FEE WITHIN THE PRESCRIBED TIME-LIMIT Effective date: 20191106 Ref country code: PL Free format text: LAPSE BECAUSE OF FAILURE TO SUBMIT A TRANSLATION OF THE DESCRIPTION OR TO PAY THE FEE WITHIN THE PRESCRIBED TIME-LIMIT Effective date: 20191106 Ref country code: GR Free format text: LAPSE BECAUSE OF FAILURE TO SUBMIT A TRANSLATION OF THE DESCRIPTION OR TO PAY THE FEE WITHIN THE PRESCRIBED TIME-LIMIT Effective date: 20200207 Ref country code: NO Free format text: LAPSE BECAUSE OF FAILURE TO SUBMIT A TRANSLATION OF THE DESCRIPTION OR TO PAY THE FEE WITHIN THE PRESCRIBED TIME-LIMIT Effective date: 20200206 Ref country code: PT Free format text: LAPSE BECAUSE OF FAILURE TO SUBMIT A TRANSLATION OF THE DESCRIPTION OR TO PAY THE FEE WITHIN THE PRESCRIBED TIME-LIMIT Effective date: 20200306 Ref country code: LT Free format text: LAPSE BECAUSE OF FAILURE TO SUBMIT A TRANSLATION OF THE DESCRIPTION OR TO PAY THE FEE WITHIN THE PRESCRIBED TIME-LIMIT Effective date: 20191106 Ref country code: NL Free format text: LAPSE BECAUSE OF FAILURE TO SUBMIT A TRANSLATION OF THE DESCRIPTION OR TO PAY THE FEE WITHIN THE PRESCRIBED TIME-LIMIT Effective date: 20191106 Ref country code: LV Free format text: LAPSE BECAUSE OF FAILURE TO SUBMIT A TRANSLATION OF THE DESCRIPTION OR TO PAY THE FEE WITHIN THE PRESCRIBED TIME-LIMIT Effective date: 20191106 Ref country code: SE Free format text: LAPSE BECAUSE OF FAILURE TO SUBMIT A TRANSLATION OF THE DESCRIPTION OR TO PAY THE FEE WITHIN THE PRESCRIBED TIME-LIMIT Effective date: 20191106 |
|
| PG25 | Lapsed in a contracting state [announced via postgrant information from national office to epo] |
Ref country code: IS Free format text: LAPSE BECAUSE OF FAILURE TO SUBMIT A TRANSLATION OF THE DESCRIPTION OR TO PAY THE FEE WITHIN THE PRESCRIBED TIME-LIMIT Effective date: 20200306 Ref country code: RS Free format text: LAPSE BECAUSE OF FAILURE TO SUBMIT A TRANSLATION OF THE DESCRIPTION OR TO PAY THE FEE WITHIN THE PRESCRIBED TIME-LIMIT Effective date: 20191106 Ref country code: HR Free format text: LAPSE BECAUSE OF FAILURE TO SUBMIT A TRANSLATION OF THE DESCRIPTION OR TO PAY THE FEE WITHIN THE PRESCRIBED TIME-LIMIT Effective date: 20191106 |
|
| PG25 | Lapsed in a contracting state [announced via postgrant information from national office to epo] |
Ref country code: AL Free format text: LAPSE BECAUSE OF FAILURE TO SUBMIT A TRANSLATION OF THE DESCRIPTION OR TO PAY THE FEE WITHIN THE PRESCRIBED TIME-LIMIT Effective date: 20191106 |
|
| PG25 | Lapsed in a contracting state [announced via postgrant information from national office to epo] |
Ref country code: ES Free format text: LAPSE BECAUSE OF FAILURE TO SUBMIT A TRANSLATION OF THE DESCRIPTION OR TO PAY THE FEE WITHIN THE PRESCRIBED TIME-LIMIT Effective date: 20191106 Ref country code: DK Free format text: LAPSE BECAUSE OF FAILURE TO SUBMIT A TRANSLATION OF THE DESCRIPTION OR TO PAY THE FEE WITHIN THE PRESCRIBED TIME-LIMIT Effective date: 20191106 Ref country code: EE Free format text: LAPSE BECAUSE OF FAILURE TO SUBMIT A TRANSLATION OF THE DESCRIPTION OR TO PAY THE FEE WITHIN THE PRESCRIBED TIME-LIMIT Effective date: 20191106 Ref country code: CZ Free format text: LAPSE BECAUSE OF FAILURE TO SUBMIT A TRANSLATION OF THE DESCRIPTION OR TO PAY THE FEE WITHIN THE PRESCRIBED TIME-LIMIT Effective date: 20191106 Ref country code: RO Free format text: LAPSE BECAUSE OF FAILURE TO SUBMIT A TRANSLATION OF THE DESCRIPTION OR TO PAY THE FEE WITHIN THE PRESCRIBED TIME-LIMIT Effective date: 20191106 |
|
| REG | Reference to a national code |
Ref country code: DE Ref legal event code: R097 Ref document number: 602015040961 Country of ref document: DE |
|
| REG | Reference to a national code |
Ref country code: AT Ref legal event code: MK05 Ref document number: 1197657 Country of ref document: AT Kind code of ref document: T Effective date: 20191106 |
|
| PG25 | Lapsed in a contracting state [announced via postgrant information from national office to epo] |
Ref country code: SM Free format text: LAPSE BECAUSE OF FAILURE TO SUBMIT A TRANSLATION OF THE DESCRIPTION OR TO PAY THE FEE WITHIN THE PRESCRIBED TIME-LIMIT Effective date: 20191106 Ref country code: SK Free format text: LAPSE BECAUSE OF FAILURE TO SUBMIT A TRANSLATION OF THE DESCRIPTION OR TO PAY THE FEE WITHIN THE PRESCRIBED TIME-LIMIT Effective date: 20191106 |
|
| PLBE | No opposition filed within time limit |
Free format text: ORIGINAL CODE: 0009261 |
|
| STAA | Information on the status of an ep patent application or granted ep patent |
Free format text: STATUS: NO OPPOSITION FILED WITHIN TIME LIMIT |
|
| 26N | No opposition filed |
Effective date: 20200807 |
|
| PG25 | Lapsed in a contracting state [announced via postgrant information from national office to epo] |
Ref country code: AT Free format text: LAPSE BECAUSE OF FAILURE TO SUBMIT A TRANSLATION OF THE DESCRIPTION OR TO PAY THE FEE WITHIN THE PRESCRIBED TIME-LIMIT Effective date: 20191106 Ref country code: SI Free format text: LAPSE BECAUSE OF FAILURE TO SUBMIT A TRANSLATION OF THE DESCRIPTION OR TO PAY THE FEE WITHIN THE PRESCRIBED TIME-LIMIT Effective date: 20191106 |
|
| PG25 | Lapsed in a contracting state [announced via postgrant information from national office to epo] |
Ref country code: MC Free format text: LAPSE BECAUSE OF FAILURE TO SUBMIT A TRANSLATION OF THE DESCRIPTION OR TO PAY THE FEE WITHIN THE PRESCRIBED TIME-LIMIT Effective date: 20191106 Ref country code: IT Free format text: LAPSE BECAUSE OF FAILURE TO SUBMIT A TRANSLATION OF THE DESCRIPTION OR TO PAY THE FEE WITHIN THE PRESCRIBED TIME-LIMIT Effective date: 20191106 |
|
| REG | Reference to a national code |
Ref country code: CH Ref legal event code: PL |
|
| GBPC | Gb: european patent ceased through non-payment of renewal fee |
Effective date: 20200604 |
|
| PG25 | Lapsed in a contracting state [announced via postgrant information from national office to epo] |
Ref country code: LU Free format text: LAPSE BECAUSE OF NON-PAYMENT OF DUE FEES Effective date: 20200604 |
|
| REG | Reference to a national code |
Ref country code: BE Ref legal event code: MM Effective date: 20200630 |
|
| PG25 | Lapsed in a contracting state [announced via postgrant information from national office to epo] |
Ref country code: FR Free format text: LAPSE BECAUSE OF NON-PAYMENT OF DUE FEES Effective date: 20200630 Ref country code: LI Free format text: LAPSE BECAUSE OF NON-PAYMENT OF DUE FEES Effective date: 20200630 Ref country code: CH Free format text: LAPSE BECAUSE OF NON-PAYMENT OF DUE FEES Effective date: 20200630 Ref country code: GB Free format text: LAPSE BECAUSE OF NON-PAYMENT OF DUE FEES Effective date: 20200604 Ref country code: IE Free format text: LAPSE BECAUSE OF NON-PAYMENT OF DUE FEES Effective date: 20200604 |
|
| PG25 | Lapsed in a contracting state [announced via postgrant information from national office to epo] |
Ref country code: BE Free format text: LAPSE BECAUSE OF NON-PAYMENT OF DUE FEES Effective date: 20200630 |
|
| PG25 | Lapsed in a contracting state [announced via postgrant information from national office to epo] |
Ref country code: TR Free format text: LAPSE BECAUSE OF FAILURE TO SUBMIT A TRANSLATION OF THE DESCRIPTION OR TO PAY THE FEE WITHIN THE PRESCRIBED TIME-LIMIT Effective date: 20191106 Ref country code: MT Free format text: LAPSE BECAUSE OF FAILURE TO SUBMIT A TRANSLATION OF THE DESCRIPTION OR TO PAY THE FEE WITHIN THE PRESCRIBED TIME-LIMIT Effective date: 20191106 Ref country code: CY Free format text: LAPSE BECAUSE OF FAILURE TO SUBMIT A TRANSLATION OF THE DESCRIPTION OR TO PAY THE FEE WITHIN THE PRESCRIBED TIME-LIMIT Effective date: 20191106 |
|
| PG25 | Lapsed in a contracting state [announced via postgrant information from national office to epo] |
Ref country code: MK Free format text: LAPSE BECAUSE OF FAILURE TO SUBMIT A TRANSLATION OF THE DESCRIPTION OR TO PAY THE FEE WITHIN THE PRESCRIBED TIME-LIMIT Effective date: 20191106 |
|
| PGFP | Annual fee paid to national office [announced via postgrant information from national office to epo] |
Ref country code: DE Payment date: 20230523 Year of fee payment: 9 |
|
| REG | Reference to a national code |
Ref country code: DE Ref legal event code: R119 Ref document number: 602015040961 Country of ref document: DE |
|
| PG25 | Lapsed in a contracting state [announced via postgrant information from national office to epo] |
Ref country code: DE Free format text: LAPSE BECAUSE OF NON-PAYMENT OF DUE FEES Effective date: 20260101 |