EP2874177A1 - Method for correcting a drift of an isotopic ratio derived from data measured by a multi-collector mass spectrometer - Google Patents
Method for correcting a drift of an isotopic ratio derived from data measured by a multi-collector mass spectrometer Download PDFInfo
- Publication number
- EP2874177A1 EP2874177A1 EP20130306552 EP13306552A EP2874177A1 EP 2874177 A1 EP2874177 A1 EP 2874177A1 EP 20130306552 EP20130306552 EP 20130306552 EP 13306552 A EP13306552 A EP 13306552A EP 2874177 A1 EP2874177 A1 EP 2874177A1
- Authority
- EP
- European Patent Office
- Prior art keywords
- signal
- sample
- isotopic ratio
- isotope
- time
- Prior art date
- Legal status (The legal status is an assumption and is not a legal conclusion. Google has not performed a legal analysis and makes no representation as to the accuracy of the status listed.)
- Withdrawn
Links
- 230000000155 isotopic effect Effects 0.000 title claims abstract description 87
- 238000000034 method Methods 0.000 title claims abstract description 81
- 238000012417 linear regression Methods 0.000 claims description 32
- 238000004817 gas chromatography Methods 0.000 claims description 22
- 238000012545 processing Methods 0.000 claims description 21
- 238000000926 separation method Methods 0.000 claims description 10
- 238000000608 laser ablation Methods 0.000 claims description 8
- 239000007788 liquid Substances 0.000 claims description 4
- 238000009616 inductively coupled plasma Methods 0.000 claims description 3
- 238000010249 in-situ analysis Methods 0.000 claims description 2
- 238000003921 particle size analysis Methods 0.000 claims description 2
- 238000004590 computer program Methods 0.000 claims 1
- 239000011343 solid material Substances 0.000 claims 1
- 238000000100 multiple collector inductively coupled plasma mass spectrometry Methods 0.000 abstract description 6
- 230000004044 response Effects 0.000 abstract description 6
- 238000002307 isotope ratio mass spectrometry Methods 0.000 abstract 1
- 238000000176 thermal ionisation mass spectrometry Methods 0.000 abstract 1
- 238000013055 trapped ion mobility spectrometry Methods 0.000 abstract 1
- 238000012937 correction Methods 0.000 description 37
- 239000007924 injection Substances 0.000 description 29
- 238000002347 injection Methods 0.000 description 28
- 230000010354 integration Effects 0.000 description 26
- 238000005194 fractionation Methods 0.000 description 18
- 230000001052 transient effect Effects 0.000 description 18
- 238000013480 data collection Methods 0.000 description 17
- 230000006870 function Effects 0.000 description 14
- 238000005259 measurement Methods 0.000 description 12
- 150000002500 ions Chemical class 0.000 description 11
- 238000004401 flow injection analysis Methods 0.000 description 10
- 238000004458 analytical method Methods 0.000 description 7
- 238000001514 detection method Methods 0.000 description 6
- 238000004364 calculation method Methods 0.000 description 5
- 238000005251 capillar electrophoresis Methods 0.000 description 5
- 238000010828 elution Methods 0.000 description 5
- 239000006199 nebulizer Substances 0.000 description 5
- 239000000243 solution Substances 0.000 description 5
- 239000012086 standard solution Substances 0.000 description 5
- 230000001419 dependent effect Effects 0.000 description 4
- 239000006185 dispersion Substances 0.000 description 4
- 239000007789 gas Substances 0.000 description 4
- GRYLNZFGIOXLOG-UHFFFAOYSA-N Nitric acid Chemical compound O[N+]([O-])=O GRYLNZFGIOXLOG-UHFFFAOYSA-N 0.000 description 3
- 230000008878 coupling Effects 0.000 description 3
- 238000010168 coupling process Methods 0.000 description 3
- 238000005859 coupling reaction Methods 0.000 description 3
- 230000003247 decreasing effect Effects 0.000 description 3
- 238000010586 diagram Methods 0.000 description 3
- PCHJSUWPFVWCPO-UHFFFAOYSA-N gold Chemical compound [Au] PCHJSUWPFVWCPO-UHFFFAOYSA-N 0.000 description 3
- 239000010931 gold Substances 0.000 description 3
- 229910052737 gold Inorganic materials 0.000 description 3
- 238000004255 ion exchange chromatography Methods 0.000 description 3
- 229910017604 nitric acid Inorganic materials 0.000 description 3
- 230000008569 process Effects 0.000 description 3
- 239000007921 spray Substances 0.000 description 3
- 230000003068 static effect Effects 0.000 description 3
- 230000009897 systematic effect Effects 0.000 description 3
- 230000003321 amplification Effects 0.000 description 2
- 229910052956 cinnabar Inorganic materials 0.000 description 2
- 238000004128 high performance liquid chromatography Methods 0.000 description 2
- 238000011065 in-situ storage Methods 0.000 description 2
- 238000002218 isotachophoresis Methods 0.000 description 2
- 239000000463 material Substances 0.000 description 2
- 238000003199 nucleic acid amplification method Methods 0.000 description 2
- 239000007787 solid Substances 0.000 description 2
- 239000000126 substance Substances 0.000 description 2
- 239000002253 acid Substances 0.000 description 1
- 229910052768 actinide Inorganic materials 0.000 description 1
- 150000001255 actinides Chemical class 0.000 description 1
- 239000000443 aerosol Substances 0.000 description 1
- 229910052784 alkaline earth metal Inorganic materials 0.000 description 1
- 150000001342 alkaline earth metals Chemical class 0.000 description 1
- 238000009835 boiling Methods 0.000 description 1
- 239000003990 capacitor Substances 0.000 description 1
- 238000003965 capillary gas chromatography Methods 0.000 description 1
- 238000001649 capillary isotachophoresis Methods 0.000 description 1
- 239000012159 carrier gas Substances 0.000 description 1
- 229910052729 chemical element Inorganic materials 0.000 description 1
- 238000013375 chromatographic separation Methods 0.000 description 1
- 239000011248 coating agent Substances 0.000 description 1
- 238000000576 coating method Methods 0.000 description 1
- 239000008367 deionised water Substances 0.000 description 1
- 230000000694 effects Effects 0.000 description 1
- 230000002708 enhancing effect Effects 0.000 description 1
- 238000011156 evaluation Methods 0.000 description 1
- 238000002474 experimental method Methods 0.000 description 1
- 238000012886 linear function Methods 0.000 description 1
- 238000004811 liquid chromatography Methods 0.000 description 1
- 238000004949 mass spectrometry Methods 0.000 description 1
- 238000004452 microanalysis Methods 0.000 description 1
- 239000000203 mixture Substances 0.000 description 1
- 238000012986 modification Methods 0.000 description 1
- 230000004048 modification Effects 0.000 description 1
- 238000012544 monitoring process Methods 0.000 description 1
- VIKNJXKGJWUCNN-XGXHKTLJSA-N norethisterone Chemical compound O=C1CC[C@@H]2[C@H]3CC[C@](C)([C@](CC4)(O)C#C)[C@@H]4[C@@H]3CCC2=C1 VIKNJXKGJWUCNN-XGXHKTLJSA-N 0.000 description 1
- 238000010606 normalization Methods 0.000 description 1
- 230000010355 oscillation Effects 0.000 description 1
- 239000002245 particle Substances 0.000 description 1
- 230000002572 peristaltic effect Effects 0.000 description 1
- 238000005293 physical law Methods 0.000 description 1
- 229910052761 rare earth metal Inorganic materials 0.000 description 1
- 230000000630 rising effect Effects 0.000 description 1
- 239000012898 sample dilution Substances 0.000 description 1
- 230000035945 sensitivity Effects 0.000 description 1
- 238000001228 spectrum Methods 0.000 description 1
- 238000003860 storage Methods 0.000 description 1
- MRMOZBOQVYRSEM-UHFFFAOYSA-N tetraethyllead Chemical compound CC[Pb](CC)(CC)CC MRMOZBOQVYRSEM-UHFFFAOYSA-N 0.000 description 1
- 230000036962 time dependent Effects 0.000 description 1
- 230000009466 transformation Effects 0.000 description 1
- 229910052723 transition metal Inorganic materials 0.000 description 1
- 150000003624 transition metals Chemical class 0.000 description 1
- 238000012800 visualization Methods 0.000 description 1
Images







Classifications
-
- H—ELECTRICITY
- H01—ELECTRIC ELEMENTS
- H01J—ELECTRIC DISCHARGE TUBES OR DISCHARGE LAMPS
- H01J49/00—Particle spectrometers or separator tubes
- H01J49/0027—Methods for using particle spectrometers
- H01J49/0036—Step by step routines describing the handling of the data generated during a measurement
Definitions
- the invention relates to a method for correcting a drift of an isotopic ratio derived from data measured by a multi-collector mass spectrometer.
- Isotopic analysis plays a leading part in the nuclear industry. It is also used in numerous fields, such as biochemistry, pharmacology, environment monitoring, criminal or food fraud fighting, geochemistry or cosmochemistry.
- Measurement of isotopic ratios in a chemical element is generally made by mass spectrometry. Suitable instruments for these measurements are MC-ICPMS spectrometers (Multi Collector Inductively Coupled Plasma Mass Spectrometry) because of their low limit of detection, their high ionization potential, and simultaneous isotope analysis. These instruments offer isotopic ratio measurements on a large range of elements.
- MC-ICPMS spectrometers Multi Collector Inductively Coupled Plasma Mass Spectrometry
- the sample to be measured should be treated by a separation technique before being introduced into the MC-ICPMS spectrometer.
- the MC-ICPMS spectrometer can be coupled with a variety of introduction systems which usually are: High Performance Liquid Chromatography (HPLC), Ion Chromatography (IC), Gas Chromatography (GC), Gold Trap (GT), Capillary Electrophoresis (CE) or lsoTachoPhoresis (ITP).
- HPLC High Performance Liquid Chromatography
- IC Ion Chromatography
- GC Gas Chromatography
- GT Gold Trap
- CE Capillary Electrophoresis
- ITP lsoTachoPhoresis
- the MC-ICPMS can also be coupled with the Laser Ablation technique (LA).
- LA Laser Ablation technique
- the isotope ratio is determined for several points of a selected peak area centered around the maximum of the peak. The area of calculation is selected based on the stability of the measured isotope ratio.
- spectrometer constructors In order to try to solve this problem, spectrometer constructors generally provide a calibration technique allowing the user to adjust tau- correction required for each of the Faraday amplifiers. Signal decay curves must first be empirically determined for each Faraday amplifier and then applied to remove residual bias resulting from prior signal variations from the individual readings.
- One aim of the invention is to provide an efficient method for correcting the drift of an isotopic ratio measured by a multi-collector mass spectrometer.
- the invention provides a method for correcting a drift of an isotopic ratio in a sample, on the basis of a first signal and a second signal derived from data measured by a multi-collector mass spectrometer, the first signal representing a variation of a detected quantity of a first isotope in the sample as a function of time, and the second signal representing a variation of a detected quantity of a second isotope in the sample as a function of time, said method comprising steps of:
- the proposed method allows quantifying and correcting precisely the time offset between the different signals generated by the different amplifiers of the mass spectrometer, and thus provides an efficient correction of the isotopic ratios.
- the method uses the isotopic ratios between two signals, and not the intensity signal of each isotope independently. This allows a very precise calculation of the time offset and therefore, a fine correction of the isotopic ratio drift.
- the method can be applied to each additional data, taking into account their specificity (such as the slope of the increase and decrease of the signal and the duration of the transient signal), as well as the variability of the hysteresis which may possibly vary between the different spectra (for instance depending on the intensity of the measured signals).
- the proposed method can comprise a step of:
- the interpolation can be a piecewise polynomial interpolation, preferably a third degree piecewise polynomial interpolation.
- the steps of the method can be applied to a number N of signals, N>2, each i-th signal representing a variation of a detected quantity of a i-th isotope in the sample as a function of time, so as to determine a time offset for each of the second to the N-th signals.
- the isotopic ratio variation parameter is a slope as a function of time of a straight line obtained by linear regression of the values of isotopic ratio.
- the isotopic ratio variation parameter is a relative standard deviation of the isotopic ratio values.
- the method can comprise a step of:
- the steps can be carried out on several time intervals, and a time offset is determined for each time interval.
- the proposed method can comprise preliminary steps of:
- the multi-collector mass spectrometer is coupled to an ion source.
- an ion source may be selected from the group consisting in a thermal ionization device, an electron ionization device and a plasma ionization device.
- the ion source is an inductively coupled plasma device.
- methods of the invention can be applied to data measured by a multi-collector inductively coupled plasma mass spectrometer (MC-ICPMS), a multi-collector thermal ionization mass spectrometer (MC-TIMS) or an Isotopic Ratio mass spectrometer (IRMS).
- MC-ICPMS multi-collector inductively coupled plasma mass spectrometer
- MC-TIMS multi-collector thermal ionization mass spectrometer
- IRMS Isotopic Ratio mass spectrometer
- the multi-collector mass spectrometer may be coupled to a separation system for separating the sample into several elementary fractions and successively introducing the elementary fractions into the spectrometer.
- Such a separation system may be a liquid chromatography, high performance liquid chromatography, ion chromatography, gas chromatography, gold trap, capillary electrophoresis or isotachophoresis.
- the multi-collector mass spectrometer can also be coupled to a Laser Ablation (LA) system and for low sample volumes analysis to a flow injection (FI) system.
- LA Laser Ablation
- FI flow injection
- the multi-collector mass spectrometer comprises a control unit 1, a separation and/or an injection system 2, an ion source 3, a magnetic sector 4, a multi-collector array 5 and a data collection and processing unit 6.
- the control unit 1 is capable of controlling hardware and software components of the mass spectrometer. Such a control unit 1 may be a computer.
- the separation and/or an injection system 2 is a device which introduces a small amount of sample into the ion source 3 through an inlet.
- the ion source 3 is used for converting a portion of the sample into charged particles such as atomic ions.
- Such an ion source may be a plasma source, a gas source or a thermal ionization source.
- the magnetic sector 4 allows the separation of the ions by charge to mass ratios.
- the multi-collector array 5 is a ion collector, typically having an array of detector-amplifiers (or Faraday cups), which allows simultaneous detection of multiple isotopes.
- the data collection and processing unit 6 is configured to process and store data measured by the multi-collector array. It can comprise a computer for processing the data and a storage unit for storing the measured and processed data. Moreover, the data collection and processing unit 6 is programmed for correcting a drift of an isotopic ratio in the sample according to a possible embodiment of the method for correcting the drift of an isotopic ratio.
- a sample is introduced into a multi-collector mass spectrometer (MC-MS).
- MC-MS multi-collector mass spectrometer
- the multi-collector mass spectrometer may be coupled to a laser ablation system for in situ analysis, or to a flow injection system for low volume sample analysis.
- the first data comprise quantities of a first isotope (isotope a) measured by a first detector-amplifier system at different times.
- the second data comprise quantities of a second isotope (isotope b) measured by a second detector-amplifier system at different times.
- Figure 3A shows an example of first data (I a ) for the isotope a, second data (I b ) for the isotope b, and values of isotopic ratio I b /I a of an element X at the different times t i .
- a first signal I a is defined as being the first data representing detected quantities of the first isotope a, measured in the sample at different times t i .
- the first signal is thus composed of discrete measurement results with their associated timestamp reads.
- the data collection and processing unit computes a second signal I b by interpolation of second data representing detected quantities of a second isotope (b), measured in the sample at different times.
- the second signal I b (t) is computed by piecewise polynomial interpolation of the second data representing detected quantities of the second isotope b, measured in the sample at different times t i .
- a series of third polynomial curves through the successive points of the data is interpolated, which permits to create a well-behaved curve (no oscillations that are not supported by the data) rather than to generate a single polynomial.
- the third interpolation order is preferred because it is the lowest order polynomial for which curvature can be continuous. Lower order polynomials can be used but the result may be a jagged curve if there are many changes in slope.
- Figure 3B shows an example of a second signal I b (t i ) together with its interpolated curve I b (t) and corresponding values of drift corrected isotope ratio I b /I a of an element X at different times t i .
- a time interval is selected in which a correction is to be applied.
- the data collection and processing unit may display a diagram showing first and second signals I a (t) and I b (t), so that the user may select a time interval.
- the data collection and processing unit may select automatically an appropriate time interval.
- the selection can be performed several times at several stages of the method.
- an example of selected time interval is [t 1 , t 3 ].
- a reunion of several time intervals can be selected.
- the data-collection and processing unit applies a time offset ⁇ t to one of the signals computed by interpolation, typically the second signal according to the embodiment described and illustrated, so as to obtain a second offset signal (I b (t+ ⁇ t)).
- a time offset can be determined for each time interval, the time offset being possibly different from one time interval to another.
- the data collection and processing unit computes values of isotopic ratio, from the first signal I a (t) and the second offset signal I b (t+ ⁇ t) at a plurality of times t i within the time interval.
- the isotopic ratio is computed as a ratio of the intensity of the second signal I b (t i + ⁇ t) on the intensity of the first signal I a (t i ).
- the isotopic ratio could be calculated as a ratio of the intensity of the first signal I a (t i + ⁇ t) on the intensity of the second signal I b (t i ).
- the isotopic ratio could be calculated as a ratio of the intensity of the first signal I a (t i ) on the intensity of the second signal I b (t i + ⁇ t).
- the data collection and processing unit computes an isotopic ratio variation parameter as a function of the values of isotopic ratios computed during the fifth step 106.
- Steps 105 and 106 can typically be performed during step 107.
- the isotopic ratio variation parameter is preferably chosen so as to be easily computed.
- the isotopic ratio is typically chosen so as to avoid highly divergent isotope ratio values, for instance by an adapted normalization.
- the isotopic ratio variation parameter includes the absolute value of the slope S of a straight line obtained by linear regression of isotopic ratio values.
- ⁇ t is the time offset applied to the second signal
- n is the number of isotope ratio values for computing the slope S.
- the isotopic ratio variation parameter includes a relative standard deviation of the values of isotopic ratio.
- the isotopic ratio variation parameter can be a combination of both first a second embodiments.
- the slope-model according to the first embodiment can only be used if a systematic increase or decrease of the isotopic ratio with time is observed.
- the RSD-model according to the second embodiment is more appropriate for use.
- the eighth step 108 can include a modification of the value of the time offset ⁇ t.
- the eighth step 108 can then include that the data collection and processing unit repeats steps 105 to 107 with the new time offset.
- the adjustment step is performed until the slope S is null or inferior to a pre-determined value.
- the data collection and processing unit repeats steps 105 to 108 until the slope S is null or inferior to 10 -7 .
- Typical slope values after ⁇ t adjustment range from 10 -10 to 10 -16 (isotope ratio/second).
- the adjustment step is performed until the relative standard deviation RSD raises a minimum or at least has decreased to a value that is estimated to be close enough to a minimum.
- the data collection and processing unit repeats steps 105 to 108 until the relative standard deviation RSD raises a minimum or at least has decreased to a value that is estimated to be close enough to a minimum.
- the time offset ⁇ t min is obtained when isotopic ratio variation parameter raises a minimum or is estimated to be close enough to a minimum.
- Such a time offset ⁇ t min is applied to the second signal I b so as to correct the drift in the isotopic ratio I b /I a .
- the method allows computing corrected isotopic ratio values, free from artifacts caused by detection and amplification systems of the spectrometer.
- the data collection and processing unit computes a final value of isotopic ratio as a function of the first signal I a (t i ) and of the second corrected signal I b (t i + ⁇ t min ).
- An average peak method can be applied, wherein the final value of isotopic ratio is computed as a mean value of the time corrected isotopic ratio values, within a selected time interval, which can be the same as or different from the time interval selected at step 104.
- a linear-regression slope method can be applied, wherein a linear regression of the first signal I a (t) as a function of the second corrected signal I b (t+ ⁇ t min ) is computed, and the final value of isotopic ratio is calculated as the slope of the straight line obtained by the linear regression.
- the Neptune MC-ICPMS (ThermoFinnigan, Germany) used in this example is equipped with a multicollector system with nine Faraday cups attached to 10 11 Ohms resistors (dynamic range from 0 Volt to 50 Volts) for simultaneous detection and provides high mass-resolution capabilities. All measurements were performed in static multicollection mode with Faraday cups.
- the Faraday-amplifier gains were calibrated daily before the analytical session yielding a reproducibility of the electric gains better than 10 ppm per day.
- Faraday-amplifier systems have been corrected for compensation of signal decay ( tau -correction) according to the procedure recommended by the constructor.
- Pb transient signals were investigated after flow injection and using a demountable direct injection high efficiency nebulizer (d-DIHEN) as the introduction system in the Neptune MC-ICPMS.
- d-DIHEN demountable direct injection high efficiency nebulizer
- 5 ⁇ L of a 100 ppb SRM981 standard solution were pushed from the carrier solution into the torch.
- the aim of the d-DIHEN is to eliminate as maximum as possible parameters like memory blanks and processes during generation and transportation of the aerosol from the spray chamber to the torch. The objective is therefore to minimize all external parameters which could induce an isotope ratio fractionation and to highlight isotope ratio drift due to the time lag between the Faraday-amplifier systems.
- the time constant of the Faraday preamplifier response ⁇ 0.1 s
- the 208 Pb/ 206 Pb, 207 Pb/ 206 Pb and 204 Pb/ 206 Pb isotope ratios were investigated and only the 208 Pb/ 206 Pb ratio showed a significant drift.
- the point by point 208 Pb/ 206 Pb isotope ratio shows a systematic increase with time ( ⁇ 0.15%) over a period of ⁇ 20 s, which is significantly longer than the time constant of the Faraday-amplifier system. Therefore, this drift can be attributed to the time lag between H1/H3 (Table 1) Faraday-amplifier systems.
- the blank-corrected 208 Pb and 206 Pb intensities with their respective timestamp reads as were recorded from the onboard computer were used. Blank intensities were calculated for each isotope as the average value of a time window prior transient signal peak.
- data processing involves the blank subtraction from each intensity point of 208 Pb and 206 Pb isotopes.
- 206 Pb isotope is considered as the reference system and timestamp and intensity reads of 208 Pb were used for obtaining the intensity function I 208 ( t ) by the Piecewise Polynomial Interpolation (PPI) method.
- PPI Piecewise Polynomial Interpolation
- the calculated time lag can approximately be expressed as the difference between the stray capacitances of H1 and H3 collector systems which is called relative stray capacitance.
- ⁇ + ⁇ ⁇ t min R ⁇ C + ⁇ ⁇ C
- ⁇ , R , C are the time constant, the resistor and the capacitor of the Faraday collector system
- ⁇ C is denoted the relative stray capacitance between H1 and H3 collector systems, respectively.
- ⁇ C was found to be equal to 0.016 pF. Therefore, a very small relative stray capacitance (0.016 pF) between H1 and H3 collector systems induce a time lag in the order of magnitude of ⁇ 0.0016 s which in turn induce a 208 Pb/ 206 Pb isotope ratio drift of ⁇ 1.5 ⁇ .
- ⁇ t min values were then calculated by the application of the two models in the linear regression zones ( Figures 5A and 5C ) and were found to be in good agreement with ⁇ t min values for 0.524 s integration time. Furthermore, like 0.524 s integration time, ⁇ t min values obtained by the RSD model were found to be systematically slightly shifted toward lower time values compared to the ⁇ t min of the Slope model (Table 2). For isotope ratio time correction, the equation [4] and the ⁇ t min values of the Slope model were used ( Figure 5B and 5D ).
- Isotope ratio drift correction also highlights the integration time influence on the % RSD calculated for the linear regression zones. Although higher integration times lead to smaller isotope ratio random variations, % RSD values before model correction are dominated by the isotope ratio drift and therefore changes of the integration time have no significant impact to the %RSD values. In contrast, after isotope ratio drift correction, it is clear that % RSD for 1.049 s is widely lower than that of 0.262 s (Table 2).
- the Nu Plasma HR MC-ICPMS (Nu instrument, Wrexham, U.K.) is equipped with twelve Faraday cups attached to 10 11 ⁇ resistors for simultaneous detection (dynamic range from 0 V to 10 V).
- two preamplifiers were connected to the Faraday cup achieving 20 Volts dynamic range (from -10 V to 10 V). All measurements were performed in static multicollection mode with Faraday cups.
- Faraday-amplifier gains were calibrated daily before the analytical session yielding a reproducibility of the electric gains better than 10 ppm per day. Tau-correction was performed for all Faraday-amplifier systems.
- a commercially double-inlet torch was used for the Gas Chromatography (GC) hyphenation and the simultaneous introduction of TI solution (200 ⁇ L min -1 of a 200 ng mL -1 solution) through a self-aspirating microconcentric nebulizer coupled to a cinnabar spray chamber. Instrumental operation conditions and cup configuration are summarized in Table 1.
- the blank-corrected point by point isotope ratios showed a negative time drift for 208 Pb/ 206 Pb ratio (decrease with time, ⁇ 1.05%) and a positive drift for 207 Pb/ 206 Pb and 204 Pb/ 206 Pb ratios (increase with time, ⁇ 0.35% and ⁇ 0.17% respectively).
- a GC issued as the MC-ICPMS introduction system both chromatographic separation and time lag between the Faraday-amplifier systems can be considered as the source of the observed isotope ratio drift.
- the capillary GC column separates species by boiling point and thus separation would obey physical laws of isotope mass fractionation favoring the elution of light isotope masses. Therefore, if the major source of the observed isotope ratio drifts is mass dependent isotope fractionation in the GC column, 208 Pb/ 206 Pb and 204 Pb/ 206 Pb ratios should show a positive and negative drift respectively during Pb elution. Comparing this theoretical consideration with experimental results ( Figure 6A and 6C ), it is clear that GC mass fractionation cannot be the cause of this drift. Only 207 Pb/ 206 Pb isotope ratio drift is consistent with a possible isotope mass fraction in the GC column ( Figure 6B ).
- the 206 Pb isotope is considered as the reference system and timestamp and intensity reads of 204 Pb, 207 Pb and 208 Pb isotopes were used for obtaining the intensity functions I 204 (t ), I 207 ( t ) and I 208 ( t ) respectively.
- Negative time lag means that the H4 Faraday-amplifier system lags behind the H2 reference system ( 206 Pb isotope). Unlike other the isotope ratios, ⁇ t min values of the 204 Pb/ 206 Pb ratio showed high fluctuations between different injections with an average value equal to 0.00115 ⁇ 74.6% s (2 ⁇ ). The large time lag observed for the H4/H2 Faraday cups could be explained by the use of two amplifiers for increasing the dynamic range of the H4 collector.
- the performances of the drift correction on the isotope ratio uncertainty, trueness and repeatability were also tested and evaluated.
- the data of the thirty independent injections of the SRM981 standard solution were treated with the traditionally used methods for isotope ratio calculation on transient signals; Point by Point (PbP), Linear Regression (LR) and Peak Area Integration (PAI).
- PbP Point by Point
- LR Linear Regression
- PAI Peak Area Integration
- the results of the PbP and LR methods were compared before and after isotope ratio drift correction whereas with the PAI method only the no drift corrected data were treated.
- the integration of 100% of the peak area was selected and therefore time lag between the Faraday-amplifiers does not have any importance.
- the blank-corrected and mass fractionation-corrected 207 Pb/ 206 Pb, 204 Pb/ 206 Pb isotope ratios treated by different methods before and after isotope ratio drift correction are presented in Figure 8 .
- Isotope ratio uncertainties for the PbP and LR methods were calculated for each individual injection by taking into account the uncertainties of the mass fractionation factor ( ⁇ 208/206 ) and of the 207 Pb/ 206 Pb, 204 Pb/ 206 Pb isotope ratios. The latters were calculated as the standard deviation ( ⁇ ) for the PbP method and as the slope uncertainty (SE) for the LR method.
Landscapes
- Chemical & Material Sciences (AREA)
- Analytical Chemistry (AREA)
- Other Investigation Or Analysis Of Materials By Electrical Means (AREA)
Abstract
Description
- The invention relates to a method for correcting a drift of an isotopic ratio derived from data measured by a multi-collector mass spectrometer.
- Evaluation of isotopic ratios of a given element is an important source of information on the origin and transformation of a material. Isotopic analysis plays a leading part in the nuclear industry. It is also used in numerous fields, such as biochemistry, pharmacology, environment monitoring, criminal or food fraud fighting, geochemistry or cosmochemistry.
- Measurement of isotopic ratios in a chemical element is generally made by mass spectrometry. Suitable instruments for these measurements are MC-ICPMS spectrometers (Multi Collector Inductively Coupled Plasma Mass Spectrometry) because of their low limit of detection, their high ionization potential, and simultaneous isotope analysis. These instruments offer isotopic ratio measurements on a large range of elements.
- In order to eliminate possible isobaric interferences due to different elements having similar atomic masses in a sample, the sample to be measured should be treated by a separation technique before being introduced into the MC-ICPMS spectrometer. To that end, the MC-ICPMS spectrometer can be coupled with a variety of introduction systems which usually are: High Performance Liquid Chromatography (HPLC), Ion Chromatography (IC), Gas Chromatography (GC), Gold Trap (GT), Capillary Electrophoresis (CE) or lsoTachoPhoresis (ITP).
- For in situ micro-analysis of solids or single micrometric particle size analysis, the MC-ICPMS can also be coupled with the Laser Ablation technique (LA).
- Online coupling between these sample introduction systems and the MC-ICPMS spectrometer provides transient signals with specific time windows generally varying between some milliseconds to minutes in which the isotope ratios should be accurately measured.
- However, most experiments reveal a systematic increase or decrease of the point by point isotope ratio during the transient signal, also called "isotopic ratio drift". Most commonly used methods for the isotope ratio calculation on transient signal (point by point method, linear regression method and Peak Area Integration method) do not correct this isotope ratio drift which significantly degrades the quality (i.e. repeatability and trueness) of the obtained measurements. According to the point by point method, the isotope ratio is determined for several points of a selected peak area centered around the maximum of the peak. The area of calculation is selected based on the stability of the measured isotope ratio. According to the linear regression method, the isotope ratio is given by the slope of the linear regression line which is the best fitting line through the data points obtained by plotting the signal intensities of the two isotopes as a function of one another. According to the Peak Area Integration method, the isotope ratio is obtained by dividing the integrated peak areas for the two isotopes.
- For explaining the origin of this drift, one hypothesis is that the isotopic ratios derived from rapidly rising or decreasing signals are affected by responses of the mass spectrometer Faraday amplifiers. Depending on which amplifiers are faster or slower, measured signals become enhanced or reduced relative to each other.
- In order to try to solve this problem, spectrometer constructors generally provide a calibration technique allowing the user to adjust tau-correction required for each of the Faraday amplifiers. Signal decay curves must first be empirically determined for each Faraday amplifier and then applied to remove residual bias resulting from prior signal variations from the individual readings.
- However, such a calibration technique is generally not sufficient to completely remove the isotopic ratio drift. Even after tau-correction, time response of the different Faraday-amplifier systems may not be perfectly uniform and remaining isotope ratio drift in transient signals may be observed.
- These remaining isotope ratio time variations could be attributed to residual capacities of the Faraday-amplifier systems due to the instrumental setup, the length and the geometry of the wiring between the collectors. These residual capacities called stray capacities can cause a lowering of the amplification system response and can vary among the individual Faraday-amplifiers.
- There is thus a need for a method allowing the synchronization of the Faraday-amplifier signal responses providing an efficient correction of the isotopic ratio drift, also capable to enhancing repeatability or reducing uncertainty of isotopic ratio analysis. Such advantages can be of utmost importance when samples are in such quantities that only few analyses are allowed.
- One aim of the invention is to provide an efficient method for correcting the drift of an isotopic ratio measured by a multi-collector mass spectrometer.
- To that aim, the invention provides a method for correcting a drift of an isotopic ratio in a sample, on the basis of a first signal and a second signal derived from data measured by a multi-collector mass spectrometer, the first signal representing a variation of a detected quantity of a first isotope in the sample as a function of time, and the second signal representing a variation of a detected quantity of a second isotope in the sample as a function of time, said method comprising steps of:
- applying to the second signal a time offset so as to obtain a second offset signal,
- computing values of isotopic ratio between the first signal and the second offset signal at a plurality of times,
- computing an isotopic ratio variation parameter as a function of the computed values of isotopic ratio,
- adjusting the time offset applied to the second signal and repeating the preceding steps so as to determine a time offset for which the isotopic ratio variation parameter is reduced.
- Introduction of a time offset allows adjusting the electronic hysteresis between the different amplifiers of the mass spectrometer. Such an adjustment is made after acquisition of the data and thus, does not require preliminary calibration of the mass spectrometer (i.e. technique for compensating the signal decay in the Faraday-amplifiers called "tau-correction").
- The proposed method allows quantifying and correcting precisely the time offset between the different signals generated by the different amplifiers of the mass spectrometer, and thus provides an efficient correction of the isotopic ratios.
- Moreover, the method uses the isotopic ratios between two signals, and not the intensity signal of each isotope independently. This allows a very precise calculation of the time offset and therefore, a fine correction of the isotopic ratio drift.
- The method can be applied to each additional data, taking into account their specificity (such as the slope of the increase and decrease of the signal and the duration of the transient signal), as well as the variability of the hysteresis which may possibly vary between the different spectra (for instance depending on the intensity of the measured signals).
- The proposed method can comprise a step of:
- computing the second signal by interpolation of second data representing detected quantities of a second isotope, measured in the sample at different times.
- In particular, the interpolation can be a piecewise polynomial interpolation, preferably a third degree piecewise polynomial interpolation.
- The steps of the method can be applied to a number N of signals, N>2, each i-th signal representing a variation of a detected quantity of a i-th isotope in the sample as a function of time, so as to determine a time offset for each of the second to the N-th signals.
- According to a first embodiment of the invention, the isotopic ratio variation parameter is a slope as a function of time of a straight line obtained by linear regression of the values of isotopic ratio.
- According to a second embodiment of the invention, the isotopic ratio variation parameter is a relative standard deviation of the isotopic ratio values.
- The method can comprise a step of:
- selecting a time interval in which the values of isotopic ratio are computed.
- The steps can be carried out on several time intervals, and a time offset is determined for each time interval.
- The proposed method can comprise preliminary steps of:
- introducing a sample into the multi-collector mass spectrometer, and
- measuring data from the sample, the data being measured by the spectrometer.
- In particular, the multi-collector mass spectrometer is coupled to an ion source. Such an ion source may be selected from the group consisting in a thermal ionization device, an electron ionization device and a plasma ionization device. In a preferred embodiment, the ion source is an inductively coupled plasma device. Hence, in a more preferred embodiment, methods of the invention can be applied to data measured by a multi-collector inductively coupled plasma mass spectrometer (MC-ICPMS), a multi-collector thermal ionization mass spectrometer (MC-TIMS) or an Isotopic Ratio mass spectrometer (IRMS).
- In particular, the multi-collector mass spectrometer may be coupled to a separation system for separating the sample into several elementary fractions and successively introducing the elementary fractions into the spectrometer.
- Such a separation system may be a liquid chromatography, high performance liquid chromatography, ion chromatography, gas chromatography, gold trap, capillary electrophoresis or isotachophoresis.
- Alternately, for in situ isotope analysis the multi-collector mass spectrometer can also be coupled to a Laser Ablation (LA) system and for low sample volumes analysis to a flow injection (FI) system.
- The invention will be described with reference to the drawings, in which:
-
Figure 1 diagrammatically shows a multi-collector mass spectrometer comprising a data collection and processing unit programmed for carrying out a method for correcting a drift of an isotopic ratio, according to a possible embodiment of the invention, -
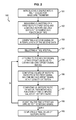
Figure 2 diagrammatically shows different steps of the method for correcting a drift of an isotopic ratio, -
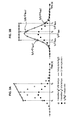
Figures 3A and 3B diagrammatically shows transient signals Ia(ti) and Ib(ti) of a given element X, and a linear positive drift of the isotopic ratio when no correction is applied (Figure 3A ), and the isotopic ratio when a correction is applied (Figure 3B ), -
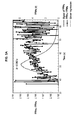
Figures 4A to 4C respectively show the linear increasing of values of the isotopic ratio 208Pb/206Pb measured point-by-point (Figure 4A ), values of the isotopic ratio 208Pb/206Pb after correction with a method according to the invention (Figure 4B ), and a comparison of the first embodiment of the method based on the slope obtained by linear regression of the values of isotopic ratio and the second embodiment of the method based on a relative standard deviation of the values of isotopic ratio (Figure 4C ), wherein data were acquired using flow injection and demountable direct injection high efficiency nebulizer (d-DIHEN) in the Neptune MC-ICPMS, -
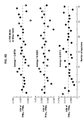
Figures 5A to 5D respectively show Pb transient signals acquired using flow injection and d-DIHEN in the Neptune MC-ICPMS with an integration time (it) of 0.262 seconds (Figure 5A ), corresponding time corrected isotope ratios (Figure 5B ), Pb transient signals acquired with an integration time of 1.049 seconds (Figure 5C ) and corresponding time corrected isotope ratio (Figure 5D ), -
Figures 6A to 6D respectively show a Pb transient signal acquired using a GC directly coupled with a Nu MC-ICPMS and isotope ratios before and after drift correction of: 208Pb/206Pb (Figure 6A ), 207Pb/206Pb (Figure 6B ) and 204Pb/206Pb (Figure 6C ), as well as slope values before (Sb ) and after (Sa ) isotope ratio drift correction, and Δtmin values for the Slope and RSD models for the 208Pb/206Pb, 207Pb/206Pb and 204Pb/206Pb isotope ratios (Figure 6D ), -
Figures 7A to 7D respectively show three isotope plots for the GC-MC-ICPMS: 208Pb/206Pb versus 207Pb/206Pb (Figure 7A ) and 208Pb/206Pb versus 204Pb/206Pb (Figure 7B ), and point by point percentage relative deviations from the Exponential Mass Fractionation Law for a given 208Pb/206Pb ratio of: 207Pb/206Pb (Figure 7C ) and 204Pb/206Pb (Figure 7D ), -
Figures 8A and 8B show blank-corrected and mass fractionation-corrected 207Pb/206Pb (Figure 8A ) and 204Pb/206Pb (Figure 8B ) isotope ratios of GC-MC-ICPMS thirty injections, all data having been treated before and after isotope ratio drift correction with Point by Point (PbP), Linear Regression (LR) and Peak Area Integration (PAI) methods. - Referring to
figure 1 , the multi-collector mass spectrometer comprises a control unit 1, a separation and/or aninjection system 2, an ion source 3, amagnetic sector 4, amulti-collector array 5 and a data collection andprocessing unit 6. - The control unit 1 is capable of controlling hardware and software components of the mass spectrometer. Such a control unit 1 may be a computer. The separation and/or an
injection system 2 is a device which introduces a small amount of sample into the ion source 3 through an inlet. The ion source 3 is used for converting a portion of the sample into charged particles such as atomic ions. Such an ion source may be a plasma source, a gas source or a thermal ionization source. Themagnetic sector 4 allows the separation of the ions by charge to mass ratios. Themulti-collector array 5 is a ion collector, typically having an array of detector-amplifiers (or Faraday cups), which allows simultaneous detection of multiple isotopes. The data collection andprocessing unit 6 is configured to process and store data measured by the multi-collector array. It can comprise a computer for processing the data and a storage unit for storing the measured and processed data. Moreover, the data collection andprocessing unit 6 is programmed for correcting a drift of an isotopic ratio in the sample according to a possible embodiment of the method for correcting the drift of an isotopic ratio. - Chemical components which may be subjected to isotopic ratio measurements comprise rare earth elements, alkaline earth metals, transition metals and actinides.
- Referring to
figure 2 , different steps of amethod 100 for correcting a drift of an isotopic ratio are illustrated. - According to a
first step 101, a sample is introduced into a multi-collector mass spectrometer (MC-MS). - To that end, the multi-collector mass spectrometer may be coupled to a separation system, such as a liquid or a gas chromatography system, a Gold Trap (GT), a Capillary Electrophoresis (CE) or a IsoTachoPhoresis (ITP) for separating the sample into several elementary fractions and successively introducing the elementary fractions into the spectrometer.
- In case the material to be tested is a solid, the multi-collector mass spectrometer may be coupled to a laser ablation system for in situ analysis, or to a flow injection system for low volume sample analysis.
- The multi-collector mass spectrometer comprises several detector-amplifier systems, each detector-amplifier being configured to measure a quantity of a given isotope in the sample.
- According to a
second step 102, data from the sample are acquired by the detector-amplifier systems of the mass spectrometer. The acquired data may comprise data measured for a number N of isotopes in the sample (N≥2). - In the example illustrated, on
figure 2 , data are measured for two isotopes a and b. - The acquired data comprises first data and second data.
- The first data comprise quantities of a first isotope (isotope a) measured by a first detector-amplifier system at different times.
- The second data comprise quantities of a second isotope (isotope b) measured by a second detector-amplifier system at different times.
-
Figure 3A shows an example of first data (Ia) for the isotope a, second data (Ib) for the isotope b, and values of isotopic ratio Ib/Ia of an element X at the different times ti. - The acquired data are processed by the data collection and processing unit which may be part of the mass spectrometer or may be separated from the mass spectrometer. The data collection and processing unit is programmed for applying subsequent steps of the method.
- A first signal Ia is defined as being the first data representing detected quantities of the first isotope a, measured in the sample at different times ti. The first signal is thus composed of discrete measurement results with their associated timestamp reads.
- According to a
third step 103, the data collection and processing unit computes a second signal Ib by interpolation of second data representing detected quantities of a second isotope (b), measured in the sample at different times. - Preferably, the second signal Ib(t) is computed by piecewise polynomial interpolation of the second data representing detected quantities of the second isotope b, measured in the sample at different times ti.
- According to such piecewise polynomial interpolation, a series of third polynomial curves through the successive points of the data (i.e. piecewise) is interpolated, which permits to create a well-behaved curve (no oscillations that are not supported by the data) rather than to generate a single polynomial.
- The third interpolation order is preferred because it is the lowest order polynomial for which curvature can be continuous. Lower order polynomials can be used but the result may be a jagged curve if there are many changes in slope.
-
Figure 3B shows an example of a second signal Ib(ti) together with its interpolated curve Ib(t) and corresponding values of drift corrected isotope ratio Ib/Ia of an element X at different times ti. - According to a
fourth step 104, a time interval is selected in which a correction is to be applied. - To that end, the data collection and processing unit may display a diagram showing first and second signals Ia(t) and Ib(t), so that the user may select a time interval.
- Alternatively, the data collection and processing unit may select automatically an appropriate time interval.
- Additionally, the selection can be performed several times at several stages of the method.
- As illustrated on
figure 3A , an example of selected time interval is [t1, t3]. - Within this time interval, the variation of the isotope ratio Ib/Ia as a function of time may be modeled by a linear function having a slope S defined by:

where n is the number of isotope ratio values for computing the slope S, and ti are the timestamp read. - Optionally, a reunion of several time intervals can be selected.
- According to a
fifth step 105, the data-collection and processing unit applies a time offset Δt to one of the signals computed by interpolation, typically the second signal according to the embodiment described and illustrated, so as to obtain a second offset signal (Ib(t+Δt)). - In the case of several time intervals, a time offset can be determined for each time interval, the time offset being possibly different from one time interval to another.
- According to a
sixth step 106, the data collection and processing unit computes values of isotopic ratio, from the first signal Ia(t) and the second offset signal Ib(t+Δt) at a plurality of times ti within the time interval. - For a given time ti, the isotopic ratio is computed as a ratio of the intensity of the second signal Ib(ti+Δt) on the intensity of the first signal Ia(ti). Alternatively, the isotopic ratio could be calculated as a ratio of the intensity of the first signal Ia(ti+Δt) on the intensity of the second signal Ib(ti). Alternatively, the isotopic ratio could be calculated as a ratio of the intensity of the first signal Ia(ti) on the intensity of the second signal Ib(ti+Δt).
- According to a
seventh step 107, the data collection and processing unit computes an isotopic ratio variation parameter as a function of the values of isotopic ratios computed during thefifth step 106. -
Steps step 107. - The isotopic ratio variation parameter is preferably chosen so as to be easily computed. The isotopic ratio is typically chosen so as to avoid highly divergent isotope ratio values, for instance by an adapted normalization.
- According to a first embodiment, the isotopic ratio variation parameter includes the absolute value of the slope S of a straight line obtained by linear regression of isotopic ratio values.
- An example of such an isotopic ratio variation parameter is typically defined as follows by formula [2]:

where Δt is the time offset applied to the second signal and n is the number of isotope ratio values for computing the slope S. - According to a second embodiment of the invention, the isotopic ratio variation parameter includes a relative standard deviation of the values of isotopic ratio.
- An example of such an isotopic ratio variation parameter is typically is defined as follows by formula [3]:

where Δt is the time offset applied to the second signal and n is the number of isotope ratio values for computing the relative standard deviation RSD. - Alternatively, the isotopic ratio variation parameter can be a combination of both first a second embodiments.
- The slope-model according to the first embodiment can only be used if a systematic increase or decrease of the isotopic ratio with time is observed.
- In the case of fast random changes of the isotopic ratio with time due to noisy or spiky signal behavior, the RSD-model according to the second embodiment is more appropriate for use.
- According to an
eighth step 108, the data collection and processing unit adjusts the time offset Δt applied to the second signal so as to determine a time offset (Δtmin) for which the isotopic ratio variation parameter is reduced. - Accordingly, the
eighth step 108 can include a modification of the value of the time offset Δt. Theeighth step 108 can then include that the data collection and processing unit repeatssteps 105 to 107 with the new time offset. - According to the first embodiment, the adjustment step is performed until the slope S is null or inferior to a pre-determined value. For example, the data collection and processing unit repeats
steps 105 to 108 until the slope S is null or inferior to 10-7. Typical slope values after Δt adjustment range from 10-10 to 10-16 (isotope ratio/second). - According to the second embodiment, the adjustment step is performed until the relative standard deviation RSD raises a minimum or at least has decreased to a value that is estimated to be close enough to a minimum. For example, the data collection and processing unit repeats
steps 105 to 108 until the relative standard deviation RSD raises a minimum or at least has decreased to a value that is estimated to be close enough to a minimum. - The time offset Δtmin is obtained when isotopic ratio variation parameter raises a minimum or is estimated to be close enough to a minimum.
- Both isotopic ratio variation parameter (slope S and relative standard deviation RSD) lead to very similar values of time offset Δtmin. However, the slope-based model is only applicable when a monotonic drift is observed. The relative standard deviation model may be applied in all cases, even in case of rapid and random variation of the isotopic ratio, which can be observed when coupling the mass spectrometer to a laser ablation system.
- Such a time offset Δtmin is applied to the second signal Ib so as to correct the drift in the isotopic ratio Ib/Ia. The method allows computing corrected isotopic ratio values, free from artifacts caused by detection and amplification systems of the spectrometer.
- The time corrected isotopic ratio values are typically defined by
formula 4 as follows:
- In case of N isotopes in the sample (N≥2), the same method is applied to the data measured for the i-th isotope. A time offset Δtmin is determined for each i-th signal taking one of the signals, for instance the first signal Ia, as a reference signal.
- According to a
ninth step 109, the data collection and processing unit computes a final value of isotopic ratio as a function of the first signal Ia(ti) and of the second corrected signal Ib(ti+Δtmin). - Several methods can be used to compute the final value of isotopic ratio.
- An average peak method can be applied, wherein the final value of isotopic ratio is computed as a mean value of the time corrected isotopic ratio values, within a selected time interval, which can be the same as or different from the time interval selected at
step 104. - Alternatively, a linear-regression slope method can be applied, wherein a linear regression of the first signal Ia(t) as a function of the second corrected signal Ib(t+Δtmin) is computed, and the final value of isotopic ratio is calculated as the slope of the straight line obtained by the linear regression.
- After isotope ratio drift correction both methods give similar results.
- The Neptune MC-ICPMS (ThermoFinnigan, Germany) used in this example is equipped with a multicollector system with nine Faraday cups attached to 1011 Ohms resistors (dynamic range from 0 Volt to 50 Volts) for simultaneous detection and provides high mass-resolution capabilities. All measurements were performed in static multicollection mode with Faraday cups. The Faraday-amplifier gains were calibrated daily before the analytical session yielding a reproducibility of the electric gains better than 10 ppm per day. Faraday-amplifier systems have been corrected for compensation of signal decay (tau-correction) according to the procedure recommended by the constructor. Intensities at m/z=202 were monitored for eventual 204Hg isobaric interference corrections and found to be inferiors to 0.1milliVolts. All samples were injected into the plasma through a demountable direct injection high efficiency nebulizer (d-DIHEN) directly coupled to a flow injection system. The flow injection system consists of a six-way high flow valve (ESI FAST) with an injection loop of 5 µL and a peristaltic pump which ensure the continuous flow of the carrier solution (HNO3, 0.5N). Cup configuration for Pb measurements and MC-ICPMS operating conditions are summarized in Table 1.
- All sample dilutions were performed with 0.5 M nitric acid obtained from sub-boiled 14 M nitric acid (EVAPOCLEAN system, Analab, France) and deionised water (Milli Q system, Millipore, Milford, MA, USA). The same acid was also used as the carrier solution for the flow injection. For all Pb injections (Neptune-dDIHEN, Nu-GC) the SRM981 standard solution was used and all calculations were performed by taking into account the isotopic composition as was reevaluated by Doucelance and Manhès (Doucelance, R.; Manhès, G. Chemical Geology 2001, 176, 361-377):208Pb/206Pb = 2.1681, 207Pb/206Pb = 0.914970(17), 204Pb/206Pb = 0.059019(5).
- Pb transient signals were investigated after flow injection and using a demountable direct injection high efficiency nebulizer (d-DIHEN) as the introduction system in the Neptune MC-ICPMS. For this purpose, 5 µL of a 100 ppb SRM981 standard solution were pushed from the carrier solution into the torch. Although flow injection system has already been used for transient signal studies, the aim of the d-DIHEN is to eliminate as maximum as possible parameters like memory blanks and processes during generation and transportation of the aerosol from the spray chamber to the torch. The objective is therefore to minimize all external parameters which could induce an isotope ratio fractionation and to highlight isotope ratio drift due to the time lag between the Faraday-amplifier systems. For transient signal data acquisition an integration time (it=0.524 s) longer than the time constant of the Faraday preamplifier response (~0.1 s) was chosen.
- The 208Pb/206Pb, 207Pb/206Pb and 204Pb/206Pb isotope ratios were investigated and only the 208Pb/206Pb ratio showed a significant drift. As can be seen in
Figure 4A the point by point 208Pb/206Pb isotope ratio shows a systematic increase with time (~0.15%) over a period of ~20 s, which is significantly longer than the time constant of the Faraday-amplifier system. Therefore, this drift can be attributed to the time lag between H1/H3 (Table 1) Faraday-amplifier systems. - For the isotope drift correction the blank-corrected 208Pb and 206Pb intensities with their respective timestamp reads as were recorded from the onboard computer were used. Blank intensities were calculated for each isotope as the average value of a time window prior transient signal peak. Before model use, data processing involves the blank subtraction from each intensity point of 208Pb and 206Pb isotopes. 206Pb isotope is considered as the reference system and timestamp and intensity reads of 208Pb were used for obtaining the intensity function I208 (t) by the Piecewise Polynomial Interpolation (PPI) method. In order to be able to efficiently calculate the time lag (Δtmin ) between H1 and H3 Faraday-amplifiers, the two models were applied in a specific time-zone where isotope ratio shows a steady trend avoiding high isotope ratio noisy or spiky behavior (
Figure 4A , zone taken into account for the linear regression). This zone corresponds to 208Pb intensities higher than ~2 Volts. A graphical visualization of the models behavior as a function of Δt is given inFigure 4B . As can be seen, Δtmin for the RSD model is slightly shifted toward lower time values compared to the minimum of the Slope model. Indeed, after Slope and RSD models minimization, Δtmin values have found to be equal to 0.00165 s and 0.00154 s respectively. Nevertheless, the Slope model presents a sharp shape in the minimum region whereas the RSD model shows a quasi-invariant profile for the same region. Consequently, for Δt = 0.00165 s, the RSD model is equal to 0.019785 which is not significantly different compared to the RSDmin value equal to 0.019725 (obtained for Δt = 0.00154 s). Thus, it can be considered that Δtmin values obtained by models minimization are in good agreement with each other. - Through equation [5], the calculated time lag can approximately be expressed as the difference between the stray capacitances of H1 and H3 collector systems which is called relative stray capacitance.

- For typical values of R=1011 Ω, C=10-12 F, τ=0.1 s and Δtmin =0.0016 s, ΔC was found to be equal to 0.016 pF. Therefore, a very small relative stray capacitance (0.016 pF) between H1 and H3 collector systems induce a time lag in the order of magnitude of ~0.0016 s which in turn induce a 208Pb/206Pb isotope ratio drift of ~1.5‰.
- Then, the time corrected 208Pb/206Pb isotope ratio was calculated using equation [4] and the Δtmin value from the Slope model (
Figure 4C ). Values of the slope and standard deviation for the selected isotope ratio zone before and after models correction are given in Table 2. By comparing the slopes, it can be seen that model efficiently corrects the isotope ratio drift. - The influence of the signal integration time on the isotope ratio drift was also investigated. Two independent injections of Pb were performed with 0.262 seconds and 1.049 seconds integration times respectively. For injection with 0.524 seconds integration time, only the 208Pb/206Pb isotope ratios showed a significant time dependent drift (
Figures 5A et5C ). As can be seen fromFigures 4A ,5A et5C , a similar trend of the 208Pb/206Pb isotope ratio drift for the three different integration times was observed. Moreover, the isotope ratio slopes calculated for the linear regression zones displayed similar values (Table 2, values of slope before model correction). - Therefore, it can be concluded that integration time has not a significant influence on the isotope ratio drift. In contrast, in the same figures it can be observed that higher integration times lead to smoother 208Pb signal profiles and to smaller isotope ratio random variations. It should be noted that for transient signals with spiky and nosy shapes (i.e. laser ablation) the use of relatively long integration times compared to the signal variations (i.e. >0.2 s), could induce inaccurate tracking of the ion signals and consequently can influence the isotope ratio drift.
- Δtmin values were then calculated by the application of the two models in the linear regression zones (
Figures 5A and5C ) and were found to be in good agreement with Δtmin values for 0.524 s integration time. Furthermore, like 0.524 s integration time, Δtmin values obtained by the RSD model were found to be systematically slightly shifted toward lower time values compared to the Δtmin of the Slope model (Table 2). For isotope ratio time correction, the equation [4] and the Δtmin values of the Slope model were used (Figure 5B and5D ). - Isotope ratio drift correction also highlights the integration time influence on the % RSD calculated for the linear regression zones. Although higher integration times lead to smaller isotope ratio random variations, % RSD values before model correction are dominated by the isotope ratio drift and therefore changes of the integration time have no significant impact to the %RSD values. In contrast, after isotope ratio drift correction, it is clear that % RSD for 1.049 s is widely lower than that of 0.262 s (Table 2).
- The Nu Plasma HR MC-ICPMS (Nu instrument, Wrexham, U.K.) is equipped with twelve Faraday cups attached to 1011 Ω resistors for simultaneous detection (dynamic range from 0 V to 10 V). For Pb isotope ratio measurements, in order to increase the dynamic range of the H4 collector for 208Pb detection, two preamplifiers were connected to the Faraday cup achieving 20 Volts dynamic range (from -10 V to 10 V). All measurements were performed in static multicollection mode with Faraday cups. Faraday-amplifier gains were calibrated daily before the analytical session yielding a reproducibility of the electric gains better than 10 ppm per day. Tau-correction was performed for all Faraday-amplifier systems. Correction for isobaric interference on mass 204 was unnecessary firstly because Hg is not present in the standard solution and secondly Hg species do not elute at the same time as PbEt4. However, 204Hg presence was monitored using 202Hg and for all injections 202Hg intensities have found to be inferiors to 0.1 milliVolts.
- A commercially double-inlet torch was used for the Gas Chromatography (GC) hyphenation and the simultaneous introduction of TI solution (200 µL min-1 of a 200 ng mL-1 solution) through a self-aspirating microconcentric nebulizer coupled to a cinnabar spray chamber. Instrumental operation conditions and cup configuration are summarized in Table 1.
- The developed method for isotope ratio drift correction in transient signals was applied in data acquired by gas chromatography directly coupled to a Nu MC-ICPMS for Pb isotope ratio determination. These data consist of thirty independent injections of a NIST SRM981 standard solution. Data acquisition was performed in static multicollection mode with an integration time of 0.5 seconds. Elution Pb profiles were highly reproducible in time, peak-shape and maximum intensity. Typical isotope ratio profiles during Pb elution are given in
Figures 6A to 6C . As can be seen the blank-corrected point by point isotope ratios showed a negative time drift for 208Pb/206Pb ratio (decrease with time, ~1.05%) and a positive drift for 207Pb/206Pb and 204Pb/206Pb ratios (increase with time, ~0.35% and ~0.17% respectively). Theoretically, in this case in which a GC issued as the MC-ICPMS introduction system, both chromatographic separation and time lag between the Faraday-amplifier systems can be considered as the source of the observed isotope ratio drift. The capillary GC column separates species by boiling point and thus separation would obey physical laws of isotope mass fractionation favoring the elution of light isotope masses. Therefore, if the major source of the observed isotope ratio drifts is mass dependent isotope fractionation in the GC column, 208Pb/206Pb and 204Pb/206Pb ratios should show a positive and negative drift respectively during Pb elution. Comparing this theoretical consideration with experimental results (Figure 6A and6C ), it is clear that GC mass fractionation cannot be the cause of this drift. Only 207Pb/206Pb isotope ratio drift is consistent with a possible isotope mass fraction in the GC column (Figure 6B ). In order to shed more light on the source of this drift, the 204Pb/206Pb and 207Pb/206Pb isotope ratios were plotted against 208Pb/206Pb ratios and compared to the Exponential Mass Fractionation Low (EMFL). For these diagrams, the blank-corrected isotope ratios from the linear regression zones of the thirty injections were plotted together (Figure 7A and7B ). - If the observed drifts are caused by a mass-dependent fractionation in the GC column, the uncorrected data of
Figures 7A and7B should be in good agreement with the EMFL. Any statistically significant deviation from the EMFL is considered as a mass-independent fractionation. As can be seen, important deviations from the EMFL clearly point out that the major source of 204Pb/206Pb, 207Pb/206Pb and 208Pb/206Pb isotope ratio drifts cannot be the isotope mass-dependent fractionation in the GC column during Pb elution. However, due to the high degree of these deviations (~0.4%), their origin seems to come more from the instrument (MC-ICPMS) than processes like nuclear volume and nuclear spin traditionally responsible to mass-independent fractionations. Therefore, the time lag between the Faraday-amplifier systems is considered as the major source for explaining this unpredictable behavior of the isotope ratio drifts. - For the isotope ratio drift correction, the same procedure previously described for the d-DIHEN introduction system was used. The 206Pb isotope is considered as the reference system and timestamp and intensity reads of 204Pb, 207Pb and 208Pb isotopes were used for obtaining the intensity functions I204(t), I207 (t) and I208 (t) respectively.
- For each injection, Δtmin was calculated by both the Slope model and the RSD model. The values were found to be in good agreement each other with Δtmin relative differences between the two models of <0.2%, <1% and <4% for the 208Pb/206Pb, 207Pb/206Pb and 204Pb/206Pb ratios respectively. The Δtmin values of both models and for the thirty injections are given in
Figure 6D . As can be seen, Δtmin of 208Pb/206Pb and 207Pb/206Pb ratios have found to be reproducible with average values of -0.0076 ± 2.6% s (2σ) and 0.00269 ± 8.0% s (2σ) respectively. Negative time lag means that the H4 Faraday-amplifier system lags behind the H2 reference system (206Pb isotope). Unlike other the isotope ratios, Δtmin values of the 204Pb/206Pb ratio showed high fluctuations between different injections with an average value equal to 0.00115 ± 74.6% s (2σ). The large time lag observed for the H4/H2 Faraday cups could be explained by the use of two amplifiers for increasing the dynamic range of the H4 collector. - It should be also noted that, even if time lag between the Faraday-amplifier systems is the dominant source of the observed isotope ratios drift, mass-dependent isotope fractionation in the GC column cannot be excluded. Column isotope fractionation generates an isotope ratio drift that should be added or subtracted to the drift originating from the Faraday-amplifier time lag (addition for the same slope signs and subtraction otherwise).
- For the isotope ratio time correction the Δtmin values obtained from the Slope model were used. When comparing the 204Pb/206Pb, 207Pb/206Pb and 208Pb/206Pb slopes of the linear regressions before and after Δtmin correction, it appears that isotope ratio drift is efficiently corrected by the model (
Figure 6A ,6B and6C ). Moreover, after drift correction the data much better fit the EMFL (Figure 7A and7B ). - The observed dispersion of the corrected data along the EMFL is due to instrumental mass fractionation changes during the different injection sessions. This is also confirmed by TI which was continuously introduced into the torch without passing through GC column. Fractionation factors (β) of 205TI/203TI and 204Pb/206Pb, 207Pb/206Pb, 208Pb/206Pb ratios reveal identical variations.
- In order to highlight small deviations of the drift corrected data from the EMFL (
Figure 7A ,7B ) at the level of some ppm, representations of Δ204Pb/206Pb and Δ 207Pb/206Pb against 208Pb signal were used (Figure 7C and7D ). Δ204Pb/206Pb and Δ207Pb/206Pb correspond to the differences between measured and calculated ratios according to the reference EMFL for a given 208Pb/206Pb ratio. The 208Pb signal intensity was used in the X-axis due to the continuously changing signal which significantly influences the counting statistics (Poisson law) and therefore the isotope ratio precision. As can be seen onFigure 7C , for 208Pb intensities higher than 10 V, 207Pb/206Pb ratios show downward trend relative to the EMFL with an average value of about 250 ppm. In contrast, for intensities lower than 10 V, the data show a random dispersion around the EMFL. Different fractionation laws were also used (Power law and Linear Law) and displayed differences relative to the EMFL which are not distinguishable for the dispersion of our data. This isotopic deviation from the EMFL has been attributed to the superposition of the classical mass discrimination isotope evolution (EMFL) with a non-exponential effect whose physical origin has not been identified yet. Unlike 207Pb/206Pb, 204Pb/206Pb results are not conclusive due to the high point dispersion around the EMFL (Figure 7B ). - The performances of the drift correction on the isotope ratio uncertainty, trueness and repeatability were also tested and evaluated. The data of the thirty independent injections of the SRM981 standard solution were treated with the traditionally used methods for isotope ratio calculation on transient signals; Point by Point (PbP), Linear Regression (LR) and Peak Area Integration (PAI). The results of the PbP and LR methods were compared before and after isotope ratio drift correction whereas with the PAI method only the no drift corrected data were treated. For the PAI method the integration of 100% of the peak area was selected and therefore time lag between the Faraday-amplifiers does not have any importance.
- Epov et al. (Epov, V. N.; Rodriguez-Gonzalez, P.; Sonke, J. E.; Tessier, E.; Amouroux, D.; Bourgoin, L. M.; Donard, O. F. X. , Epov, V. N.; Berail, S.; Jimenez-Moreno, M.; Perrot, V.; Pecheyran, C.; Amouroux, D.; Donard, O. F. X. Analytical Chemistry 2010, 82, 5652-5662) found that the best isotope ratio precision using the PAI method obtained for an integration of 90-95% of the peak area. For the measured data, two different integration zones 95% and 100% of the peak area were tested and no significant differences were observed. 100% of the peak zone was also used for the LR method and the zone of the linear regression for the PbP method (
Figure 6A ,6B and6C , isotope ratio zone used for the linear regression). The blank intensity was calculated for each isotope as the average value of a zone (duration ~8 s) before the transient signal peak. The blank contribution was then subtracted from each intensity point of the respective isotopes. Isotope ratio drifts for all injections were corrected using Δtmin values obtained from the Slope model. The instrumental isotope mass fractionation was corrected internally using the 208Pb/206Pb ratio and the exponential mass fractionation low. - The blank-corrected and mass fractionation-corrected 207Pb/206Pb, 204Pb/206Pb isotope ratios treated by different methods before and after isotope ratio drift correction are presented in
Figure 8 . Isotope ratio uncertainties for the PbP and LR methods were calculated for each individual injection by taking into account the uncertainties of the mass fractionation factor (β208/206) and of the 207Pb/206Pb, 204Pb/206Pb isotope ratios. The latters were calculated as the standard deviation (σ) for the PbP method and as the slope uncertainty (SE) for the LR method. The SE was calculated using the command Regress of Mathematica and can also be calculated using INDEX(LINEST(...)) function of MS EXCEL. Unlike PbP and LR methods, PAI method does not provide isotope ratio uncertainties for individual injections. All isotope ratio uncertainties are expressed for a coverage factor k=2. - As can be seen, for the PbP method both individual injection uncertainties and repeatability (σ of thirty injections) of the 204Pb/206Pb, 207Pb/206Pb drift corrected ratios were surprisingly improved by a
factor 20 and 13 respectively, compared to the results without drift correction. In contrast, for the isotope ratios treated with the LR method, repeatability before and after drift correction seems to be invariant but individual injection uncertainties were improved by a factor 14. Average values of 204Pb/206Pb, 207Pb/206Pb individual injection uncertainties, repeatability and trueness are given in Table 3. As can be seen, contribution of the isotope ratio drift correction to individual injection uncertainty and to repeatability is most important for the 207Pb/206Pb ratio due certainly to higher drift compared to that of 204Pb/206Pb ratio. Drift correction has no statistically significant influence on the average trueness (trueness of the thirty measurements average); trueness variations are inferior to the measurement uncertainties, and therefore not significant (Table 3).TABLE 1: MC-ICPMS and GC operating conditions and Faraday cup configuration MC-ICPMS conditions Neptune Nu Plasma Sample Introduction System GC Nebulizer d-DIHEN Microconcentric (for Tl) Spray chamber Cinnabar 20 mL (for Tl) Sample gas 0.2 (L min-1) 20 (psi) Ar makeup gas (mL min-1) 0.4 He GC carrier gas (mL min-1) 25 Liquid uptake (µL min-1) 50 200 (for Tl) MC-ICPMS conditions RF power (W) 1200 1300 Plasma gas flow rate (L min-1) 15 13 Auxiliary flow rate (L min-1) 1.3 0.9 Resolution Low Low Integration time (s) 0.262, 0.524, 1.049 0.5 (TRA mode) Sensitivity on 208Pb (V ppm-1) 120 45 Cup configuration L3 L2 L1 Ax H1 H2 H3 H4 Neptune 202Hg 204Pb 206Pb 207Pb 208Pb Nu Plasma 202Hg 203Tl 204Pb 205Tl 206Ph 207Pb 208Pb Focus GC GC temp. Program Injector Split/splitless Initial temperature (°C) 60 Injector volume (µL) 3 Initial time (min) 2 Injector Temperature (°C) 250 Ramp 1 (°C/min) 60 Column MXT, 30 m, 0.53 mm i.d., 1.0 mm coating Final temperature 1 (°C) 95 Hold time (min) 5 Ramp 2 (°C/min) 60 Final temperature 2 (°C) 250 Hold time (min) 1 TABLE 2: Direct injection - MC-ICPMS Δtmin values obtained by the Slope and RSD models for different integration times. The values of the slope and the %RSD calculated for the isotope ratios used for the linear regression were also presented. Int. Time (s) Δtmin (s) Values of slope Values of% RSD Slope model RSD model No corrected Corrected No corrected Corrected 0.262 0.00161 0.00151 1.14×10⁻⁴ 4.93×10⁻¹¹ 0.0318 0.0208 0.524 0.00165 0.00154 8.95×10⁻⁵ 4.20×10⁻¹⁶ 0.0295 0.0197 1.049 0.00163 0.00157 8.33×10⁻⁵ 6.68×10⁻¹⁴ 0.0273 0.0132 TABLE 3: GC-MC-ICPMS average values of 207Pb/206Pb and 204Pb/206Pb isotope ratios uncertainty, repeatability and trueness of no corrected and corrected data for isotope ratio drift. Where PbP, LR and PAI are the Point by Point, the Linear Regression and the Peak Integration methods respectively. Uncertainties and repeat abilities are expressed for a coverage factor k=2. 207Pb/206Pb PbP LR PAI No corrected Corrected No corrected Corrected No corrected % Uncertainty 0.50 0.024 0.034 0.0024 % Repeatability 0.098 0.0072 0.0062 0.0062 0.0058 % Trueness 0.030 0.014 0.018 0.019 0.016 204Pb/206Pb % Uncertainty 0.52 0.088 0.031 0.017 % Repeatability 0.125 0.034 0.022 0.022 0.062 % Trueness 0.013 0.032 0.030 0.030 0.025
Claims (16)
- Method for correcting a drift of an isotopic ratio in a sample, on the basis of a first signal (Ia) and a second signal (Ib) derived from data measured by a multi-collector mass spectrometer, the first signal (Ia) representing a variation of a detected quantity of a first isotope (a) in the sample as a function of time, and the second signal (Ib) representing a variation of a detected quantity of a second isotope (b) in the sample as a function of time, said method comprising steps of:- applying (105) to the second signal (Ib) a time offset (Δt) so as to obtain a second offset signal (Ib(t+Δt)),- computing (106) values of isotopic ratio between the first signal (Ia) and the second offset signal (Ib(t+Δt)) at a plurality of times (ti),- computing an isotopic ratio variation parameter as a function of the computed values of isotopic ratio,- adjusting the time offset (Δt) applied to the second signal (Ib) and repeating the preceding steps so as to determine a time offset (Δtmin) for which the isotopic ratio variation parameter is reduced.
- Method according to claim 1, comprising a step of:- computing the second signal (Ib(t)) by interpolation of second data representing detected quantities of a second isotope (b), measured in the sample at different times.
- Method according to claim 2, wherein the interpolation is a piecewise polynomial interpolation.
- Method according to one of claims 1 to 3, wherein the steps are applied to a number N of signals, N>2, each i-th signal representing a variation of a detected quantity of a i-th isotope in the sample as a function of time, so as to determine a time offset for each of the second to the N-th signals.
- Method according to one of claims 1 to 4, wherein the isotopic ratio variation parameter is a slope of a straight line obtained by linear regression of the values of isotopic ratio.
- Method according to one of claims 1 to 4, wherein the isotopic ratio variation parameter is a relative standard deviation of the values of isotopic ratio.
- Method according to one of claims 1 to 6, comprising a step of:- selecting a time interval in which the values of isotopic ratio are computed.
- Method according to one of claims 1 to 6, wherein the steps are carried out on several time intervals, and a time offset is determined for each time interval.
- Method according to one of claims 1 to 8, comprising preliminary steps of:- introducing a sample into the multi-collector mass spectrometer, and- measuring data from the sample, the data being measured by the spectrometer.
- Method according to claim 9, wherein the multi-collector mass spectrometer is coupled to a separation system for separating the sample into several elementary fractions and successively introducing the elementary fractions into the spectrometer.
- Method according to claim 10, wherein the separation system is a liquid, high performance liquid, ionic or a gas chromatography system.
- Method according to claim 10, wherein the multi-collector mass spectrometer is coupled to a laser ablation system for in situ analysis of solid materials or single micrometric particle size analysis, so as to obtain the sample to be introduced into the multi-collector mass spectrometer.
- Method according to one of claims 1 to 12, wherein the multi-collector mass spectrometer comprises an ion source selected from the group consisting in a thermal ionization device, an electron ionization device and a plasma ionization device.
- Method according to one of claims 1 to 13, wherein the multi-collector mass spectrometer is a multi-collector inductively coupled plasma mass spectrometer.
- Processing unit adapted for receiving data measured on a sample by a multi-collector mass spectrometer, and configured for correcting a drift of an isotopic ratio in the sample according to the method defined by one of claims 1 to 14.
- Computer program for correcting a drift of an isotopic ratio in a sample from data measured on the sample by a multi-collector mass spectrometer, comprising program instructions for causing a processing unit to implement the method defined by one of claims 1 to 14.
Priority Applications (1)
| Application Number | Priority Date | Filing Date | Title |
|---|---|---|---|
| EP20130306552 EP2874177A1 (en) | 2013-11-13 | 2013-11-13 | Method for correcting a drift of an isotopic ratio derived from data measured by a multi-collector mass spectrometer |
Applications Claiming Priority (1)
| Application Number | Priority Date | Filing Date | Title |
|---|---|---|---|
| EP20130306552 EP2874177A1 (en) | 2013-11-13 | 2013-11-13 | Method for correcting a drift of an isotopic ratio derived from data measured by a multi-collector mass spectrometer |
Publications (1)
| Publication Number | Publication Date |
|---|---|
| EP2874177A1 true EP2874177A1 (en) | 2015-05-20 |
Family
ID=49641699
Family Applications (1)
| Application Number | Title | Priority Date | Filing Date |
|---|---|---|---|
| EP20130306552 Withdrawn EP2874177A1 (en) | 2013-11-13 | 2013-11-13 | Method for correcting a drift of an isotopic ratio derived from data measured by a multi-collector mass spectrometer |
Country Status (1)
| Country | Link |
|---|---|
| EP (1) | EP2874177A1 (en) |
Cited By (9)
| Publication number | Priority date | Publication date | Assignee | Title |
|---|---|---|---|---|
| CN108780730A (en) * | 2016-03-07 | 2018-11-09 | 英国质谱公司 | Spectrum analysis |
| CN110676150A (en) * | 2019-09-06 | 2020-01-10 | 清华大学 | Self-adaptive correction method and device for mass spectrometer |
| CN110823989A (en) * | 2018-08-07 | 2020-02-21 | 塞莫费雪科学(不来梅)有限公司 | Isotope ratio measurement |
| CN110879246A (en) * | 2019-11-28 | 2020-03-13 | 中国科学院地质与地球物理研究所 | Emitting agent for trace sample nickel isotope analysis and preparation and application thereof |
| CN115015366A (en) * | 2022-06-09 | 2022-09-06 | 国家核安保技术中心 | Uranium isotope ratio measuring method, device, equipment and computer storage medium |
| WO2023055399A1 (en) * | 2021-09-28 | 2023-04-06 | Halliburton Energy Services, Inc. | Recycled isotope correction |
| CN116952679A (en) * | 2023-07-11 | 2023-10-27 | 中国计量科学研究院 | Sample delta based on EA-IRMS measurement 13 Method for C value |
| CN118817819A (en) * | 2024-07-26 | 2024-10-22 | 中国计量科学研究院 | Uncertainty evaluation method and device for TE-TIMS analysis of strontium isotope composition |
| GB2641831A (en) * | 2024-06-14 | 2025-12-17 | Thermo Fisher Scient Bremen Gmbh | Mass spectrometer signal optimisation |
-
2013
- 2013-11-13 EP EP20130306552 patent/EP2874177A1/en not_active Withdrawn
Non-Patent Citations (7)
| Title |
|---|
| COAKLEY K J ET AL: "Secondary ion mass spectrometry measurements of isotopic ratios: correction for time varying count rate", INTERNATIONAL JOURNAL OF MASS SPECTROMETRY, ELSEVIER SCIENCE PUBLISHERS, AMSTERDAM, NL, vol. 240, no. 2, 15 January 2005 (2005-01-15), pages 107 - 120, XP027705160, ISSN: 1387-3806, [retrieved on 20050115] * |
| DOUCELANCE, R.; MANHÈS, G., CHEMICAL GEOLOGY, vol. 176, 2001, pages 361 - 377 |
| EHRLICH S ET AL: "Experimental study of the copper isotope fractionation between aqueous Cu(II) and covellite, CuS", CHEMICAL GEOLOGY, ELSEVIER SCIENCE PUBLISHER B.V., AMSTERDAM, NL, vol. 209, no. 3-4, 27 September 2004 (2004-09-27), pages 259 - 269, XP004549123, ISSN: 0009-2541, DOI: 10.1016/J.CHEMGEO.2004.06.010 * |
| EPOV, V. N.; BERAIL, S.; JIMENEZ-MORENO, M; PERROT, V; PECHEYRAN, C.; AMOUROUX, D.; DONARD, O. F. X., ANALYTICAL CHEMISTRY, vol. 82, 2010, pages 5652 - 5662 |
| EPOV, V. N.; RODRIGUEZ-GONZALEZ, P.; SONKE, J. E.; TESSIER, E.; AMOUROUX, D.; BOURGOIN, L. M.; DONARD, O. F. X., ANALYTICAL CHEMISTRY, vol. 80, 2008, pages 3530 - 3538 |
| THOMAS PETTKE ET AL: "Quantification of transient signals in multiple collector inductively coupled plasma mass spectrometry: accurate lead isotope ratio determination by laser ablation of individual fluid inclusions", JOURNAL OF ANALYTICAL ATOMIC SPECTROMETRY, vol. 26, no. 3, 1 January 2011 (2011-01-01), pages 475, XP055122636, ISSN: 0267-9477, DOI: 10.1039/c0ja00140f * |
| VLADIMIR N. EPOV ET AL: "Simultaneous Determination of Species-Specific Isotopic Composition of Hg by Gas Chromatography Coupled to Multicollector ICPMS", ANALYTICAL CHEMISTRY, vol. 80, no. 10, 1 May 2008 (2008-05-01), pages 3530 - 3538, XP055122067, ISSN: 0003-2700, DOI: 10.1021/ac800384b * |
Cited By (13)
| Publication number | Priority date | Publication date | Assignee | Title |
|---|---|---|---|---|
| CN108780730A (en) * | 2016-03-07 | 2018-11-09 | 英国质谱公司 | Spectrum analysis |
| US11583805B2 (en) | 2018-08-07 | 2023-02-21 | Thermo Fisher Scientific (Bremen) Gmbh | Isotope ratio measurement |
| CN110823989A (en) * | 2018-08-07 | 2020-02-21 | 塞莫费雪科学(不来梅)有限公司 | Isotope ratio measurement |
| CN110823989B (en) * | 2018-08-07 | 2022-05-17 | 塞莫费雪科学(不来梅)有限公司 | Isotope ratio measurement |
| US12403426B2 (en) | 2018-08-07 | 2025-09-02 | Thermo Fisher Scientific (Bremen) Gmbh | Isotope ratio measurement |
| CN110676150A (en) * | 2019-09-06 | 2020-01-10 | 清华大学 | Self-adaptive correction method and device for mass spectrometer |
| CN110879246A (en) * | 2019-11-28 | 2020-03-13 | 中国科学院地质与地球物理研究所 | Emitting agent for trace sample nickel isotope analysis and preparation and application thereof |
| WO2023055399A1 (en) * | 2021-09-28 | 2023-04-06 | Halliburton Energy Services, Inc. | Recycled isotope correction |
| US12163423B2 (en) | 2021-09-28 | 2024-12-10 | Halliburton Energy Services, Inc. | Recycled isotope correction |
| CN115015366A (en) * | 2022-06-09 | 2022-09-06 | 国家核安保技术中心 | Uranium isotope ratio measuring method, device, equipment and computer storage medium |
| CN116952679A (en) * | 2023-07-11 | 2023-10-27 | 中国计量科学研究院 | Sample delta based on EA-IRMS measurement 13 Method for C value |
| GB2641831A (en) * | 2024-06-14 | 2025-12-17 | Thermo Fisher Scient Bremen Gmbh | Mass spectrometer signal optimisation |
| CN118817819A (en) * | 2024-07-26 | 2024-10-22 | 中国计量科学研究院 | Uncertainty evaluation method and device for TE-TIMS analysis of strontium isotope composition |
Similar Documents
| Publication | Publication Date | Title |
|---|---|---|
| EP2874177A1 (en) | Method for correcting a drift of an isotopic ratio derived from data measured by a multi-collector mass spectrometer | |
| White et al. | High-precision analysis of Pb isotope ratios by multi-collector ICP-MS | |
| Harycki et al. | Characterization of a high-sensitivity ICP-TOFMS instrument for microdroplet, nanoparticle, and microplastic analyses | |
| Gourgiotis et al. | Method for isotope ratio drift correction by internal amplifier signal synchronization in MC-ICPMS transient signals | |
| JP5464711B2 (en) | A method for improving signal-to-noise for quantification by mass spectrometry | |
| JP2011512534A (en) | Quantification method by mass spectrometry | |
| Pfeifer et al. | Tantalum isotope ratio measurements and isotope abundances determined by MC-ICP-MS using amplifiers equipped with 10 10, 10 12 and 10 13 Ohm resistors | |
| EP3018694A1 (en) | Systems and methods for calibrating gain in an electron multiplier | |
| EP3454358B1 (en) | Determining isotope ratios using mass spectrometry | |
| US8145438B2 (en) | Method for quantitating substance to be measured | |
| Resano et al. | Evaluation of the multi-element capabilities of electrothermal vaporization quadrupole-based ICP mass spectrometryPresented at the 2001 European Winter Conference on Plasma Spectrochemistry, Lillehammer, Norway, February 4–8, 2001. | |
| Malinovsky et al. | Calibration of Mo isotope amount ratio measurements by MC-ICPMS using normalisation to an internal standard and improved experimental design | |
| Pearson et al. | Mass fractionation correction in laser ablation multiple-collector ICP–MS: implications for overlap corrections and precise and accurate in situ isotope ratio measurement | |
| Hoffmann et al. | Characterisation of secondary electron multiplier nonlinearity using MC-ICPMS | |
| Craig et al. | Dynamic time correction for high precision isotope ratio measurements | |
| JP7053562B2 (en) | Mass spectrometer that compensates for ion beam fluctuations and how to operate it | |
| US20190074169A1 (en) | Determining isotope ratios using mass spectrometry | |
| Varga et al. | Accurate and precise 230Th/232Th isotope ratio measurement by multi-collector inductively coupled plasma mass spectrometry using a pre-cell mass filter for collision/reaction cell (MC-ICP-MS/MS) | |
| US12159773B2 (en) | Calibration of mass spectrometry systems | |
| Gourgiotis et al. | Transient signal isotope analysis using multicollection of ion beams with Faraday cups equipped with 10 12 Ω and 10 11 Ω feedback resistors | |
| EP3608941B1 (en) | Isotope ratio measurement | |
| JP2004361367A (en) | Isotope ratio analysis using plasma ion source mass spectrometer | |
| EP3966738B1 (en) | Dynamic data correction method and apparatus for generating a high resolution spectrum | |
| JP6976445B2 (en) | Mass spectrometer and mass spectrometry method | |
| Malinovsky et al. | Calibration of boron isotope ratio measurements by MC-ICP-MS using normalisation to admixed internal standards |
Legal Events
| Date | Code | Title | Description |
|---|---|---|---|
| PUAI | Public reference made under article 153(3) epc to a published international application that has entered the european phase |
Free format text: ORIGINAL CODE: 0009012 |
|
| 17P | Request for examination filed |
Effective date: 20131113 |
|
| AK | Designated contracting states |
Kind code of ref document: A1 Designated state(s): AL AT BE BG CH CY CZ DE DK EE ES FI FR GB GR HR HU IE IS IT LI LT LU LV MC MK MT NL NO PL PT RO RS SE SI SK SM TR |
|
| AX | Request for extension of the european patent |
Extension state: BA ME |
|
| R17P | Request for examination filed (corrected) |
Effective date: 20151030 |
|
| RBV | Designated contracting states (corrected) |
Designated state(s): AL AT BE BG CH CY CZ DE DK EE ES FI FR GB GR HR HU IE IS IT LI LT LU LV MC MK MT NL NO PL PT RO RS SE SI SK SM TR |
|
| 17Q | First examination report despatched |
Effective date: 20160527 |
|
| GRAP | Despatch of communication of intention to grant a patent |
Free format text: ORIGINAL CODE: EPIDOSNIGR1 |
|
| INTG | Intention to grant announced |
Effective date: 20170717 |
|
| STAA | Information on the status of an ep patent application or granted ep patent |
Free format text: STATUS: THE APPLICATION IS DEEMED TO BE WITHDRAWN |
|
| 18D | Application deemed to be withdrawn |
Effective date: 20171128 |