EP2867376B1 - Targeted rna-seq methods and materials for the diagnosis of prostate cancer - Google Patents
Targeted rna-seq methods and materials for the diagnosis of prostate cancer Download PDFInfo
- Publication number
- EP2867376B1 EP2867376B1 EP13810495.5A EP13810495A EP2867376B1 EP 2867376 B1 EP2867376 B1 EP 2867376B1 EP 13810495 A EP13810495 A EP 13810495A EP 2867376 B1 EP2867376 B1 EP 2867376B1
- Authority
- EP
- European Patent Office
- Prior art keywords
- rep
- dna
- rna
- lab
- avr
- Prior art date
- Legal status (The legal status is an assumption and is not a legal conclusion. Google has not performed a legal analysis and makes no representation as to the accuracy of the status listed.)
- Not-in-force
Links
- 208000000236 Prostatic Neoplasms Diseases 0.000 title claims description 95
- 206010060862 Prostate cancer Diseases 0.000 title claims description 82
- 238000003559 RNA-seq method Methods 0.000 title description 21
- 238000003745 diagnosis Methods 0.000 title description 6
- 239000000463 material Substances 0.000 title description 5
- 108091032973 (ribonucleotides)n+m Proteins 0.000 claims description 223
- 239000000090 biomarker Substances 0.000 claims description 176
- 230000014509 gene expression Effects 0.000 claims description 114
- 239000002299 complementary DNA Substances 0.000 claims description 100
- 206010028980 Neoplasm Diseases 0.000 claims description 98
- 238000000034 method Methods 0.000 claims description 98
- 210000001519 tissue Anatomy 0.000 claims description 88
- 108091093088 Amplicon Proteins 0.000 claims description 83
- 239000013615 primer Substances 0.000 claims description 66
- 201000011510 cancer Diseases 0.000 claims description 44
- 210000004027 cell Anatomy 0.000 claims description 41
- 108091034117 Oligonucleotide Proteins 0.000 claims description 38
- 238000012163 sequencing technique Methods 0.000 claims description 36
- 208000037265 diseases, disorders, signs and symptoms Diseases 0.000 claims description 26
- 238000003752 polymerase chain reaction Methods 0.000 claims description 26
- 239000012472 biological sample Substances 0.000 claims description 22
- 238000001574 biopsy Methods 0.000 claims description 16
- 238000007481 next generation sequencing Methods 0.000 claims description 15
- 239000003155 DNA primer Substances 0.000 claims description 14
- 238000011471 prostatectomy Methods 0.000 claims description 14
- 108091028043 Nucleic acid sequence Proteins 0.000 claims description 10
- 210000002700 urine Anatomy 0.000 claims description 10
- 230000001965 increasing effect Effects 0.000 claims description 7
- 210000002966 serum Anatomy 0.000 claims description 6
- 238000012544 monitoring process Methods 0.000 claims description 5
- 210000004369 blood Anatomy 0.000 claims description 4
- 239000008280 blood Substances 0.000 claims description 4
- 230000003247 decreasing effect Effects 0.000 claims description 4
- 210000003819 peripheral blood mononuclear cell Anatomy 0.000 claims description 3
- 230000002194 synthesizing effect Effects 0.000 claims description 3
- 108020004414 DNA Proteins 0.000 description 337
- 241000282414 Homo sapiens Species 0.000 description 142
- 102100038358 Prostate-specific antigen Human genes 0.000 description 39
- 108090000623 proteins and genes Proteins 0.000 description 38
- 210000002307 prostate Anatomy 0.000 description 34
- 108010072866 Prostate-Specific Antigen Proteins 0.000 description 31
- 230000000762 glandular Effects 0.000 description 26
- 102000040430 polynucleotide Human genes 0.000 description 22
- 108091033319 polynucleotide Proteins 0.000 description 22
- 239000002157 polynucleotide Substances 0.000 description 22
- 108090000765 processed proteins & peptides Proteins 0.000 description 22
- 238000012360 testing method Methods 0.000 description 22
- 229920001184 polypeptide Polymers 0.000 description 21
- 102000004196 processed proteins & peptides Human genes 0.000 description 21
- 238000005516 engineering process Methods 0.000 description 20
- JLCPHMBAVCMARE-UHFFFAOYSA-N [3-[[3-[[3-[[3-[[3-[[3-[[3-[[3-[[3-[[3-[[3-[[5-(2-amino-6-oxo-1H-purin-9-yl)-3-[[3-[[3-[[3-[[3-[[3-[[5-(2-amino-6-oxo-1H-purin-9-yl)-3-[[5-(2-amino-6-oxo-1H-purin-9-yl)-3-hydroxyoxolan-2-yl]methoxy-hydroxyphosphoryl]oxyoxolan-2-yl]methoxy-hydroxyphosphoryl]oxy-5-(5-methyl-2,4-dioxopyrimidin-1-yl)oxolan-2-yl]methoxy-hydroxyphosphoryl]oxy-5-(6-aminopurin-9-yl)oxolan-2-yl]methoxy-hydroxyphosphoryl]oxy-5-(6-aminopurin-9-yl)oxolan-2-yl]methoxy-hydroxyphosphoryl]oxy-5-(6-aminopurin-9-yl)oxolan-2-yl]methoxy-hydroxyphosphoryl]oxy-5-(6-aminopurin-9-yl)oxolan-2-yl]methoxy-hydroxyphosphoryl]oxyoxolan-2-yl]methoxy-hydroxyphosphoryl]oxy-5-(5-methyl-2,4-dioxopyrimidin-1-yl)oxolan-2-yl]methoxy-hydroxyphosphoryl]oxy-5-(4-amino-2-oxopyrimidin-1-yl)oxolan-2-yl]methoxy-hydroxyphosphoryl]oxy-5-(5-methyl-2,4-dioxopyrimidin-1-yl)oxolan-2-yl]methoxy-hydroxyphosphoryl]oxy-5-(5-methyl-2,4-dioxopyrimidin-1-yl)oxolan-2-yl]methoxy-hydroxyphosphoryl]oxy-5-(6-aminopurin-9-yl)oxolan-2-yl]methoxy-hydroxyphosphoryl]oxy-5-(6-aminopurin-9-yl)oxolan-2-yl]methoxy-hydroxyphosphoryl]oxy-5-(4-amino-2-oxopyrimidin-1-yl)oxolan-2-yl]methoxy-hydroxyphosphoryl]oxy-5-(4-amino-2-oxopyrimidin-1-yl)oxolan-2-yl]methoxy-hydroxyphosphoryl]oxy-5-(4-amino-2-oxopyrimidin-1-yl)oxolan-2-yl]methoxy-hydroxyphosphoryl]oxy-5-(6-aminopurin-9-yl)oxolan-2-yl]methoxy-hydroxyphosphoryl]oxy-5-(4-amino-2-oxopyrimidin-1-yl)oxolan-2-yl]methyl [5-(6-aminopurin-9-yl)-2-(hydroxymethyl)oxolan-3-yl] hydrogen phosphate Polymers Cc1cn(C2CC(OP(O)(=O)OCC3OC(CC3OP(O)(=O)OCC3OC(CC3O)n3cnc4c3nc(N)[nH]c4=O)n3cnc4c3nc(N)[nH]c4=O)C(COP(O)(=O)OC3CC(OC3COP(O)(=O)OC3CC(OC3COP(O)(=O)OC3CC(OC3COP(O)(=O)OC3CC(OC3COP(O)(=O)OC3CC(OC3COP(O)(=O)OC3CC(OC3COP(O)(=O)OC3CC(OC3COP(O)(=O)OC3CC(OC3COP(O)(=O)OC3CC(OC3COP(O)(=O)OC3CC(OC3COP(O)(=O)OC3CC(OC3COP(O)(=O)OC3CC(OC3COP(O)(=O)OC3CC(OC3COP(O)(=O)OC3CC(OC3COP(O)(=O)OC3CC(OC3COP(O)(=O)OC3CC(OC3COP(O)(=O)OC3CC(OC3CO)n3cnc4c(N)ncnc34)n3ccc(N)nc3=O)n3cnc4c(N)ncnc34)n3ccc(N)nc3=O)n3ccc(N)nc3=O)n3ccc(N)nc3=O)n3cnc4c(N)ncnc34)n3cnc4c(N)ncnc34)n3cc(C)c(=O)[nH]c3=O)n3cc(C)c(=O)[nH]c3=O)n3ccc(N)nc3=O)n3cc(C)c(=O)[nH]c3=O)n3cnc4c3nc(N)[nH]c4=O)n3cnc4c(N)ncnc34)n3cnc4c(N)ncnc34)n3cnc4c(N)ncnc34)n3cnc4c(N)ncnc34)O2)c(=O)[nH]c1=O JLCPHMBAVCMARE-UHFFFAOYSA-N 0.000 description 18
- 208000035475 disorder Diseases 0.000 description 16
- 239000000523 sample Substances 0.000 description 16
- 238000004422 calculation algorithm Methods 0.000 description 15
- 238000010561 standard procedure Methods 0.000 description 15
- 238000004458 analytical method Methods 0.000 description 13
- 239000012634 fragment Substances 0.000 description 13
- 238000011529 RT qPCR Methods 0.000 description 11
- 101001136592 Homo sapiens Prostate stem cell antigen Proteins 0.000 description 10
- 102100036735 Prostate stem cell antigen Human genes 0.000 description 10
- 150000001413 amino acids Chemical group 0.000 description 10
- 238000004519 manufacturing process Methods 0.000 description 10
- 230000003387 muscular Effects 0.000 description 10
- 235000018102 proteins Nutrition 0.000 description 10
- 102000004169 proteins and genes Human genes 0.000 description 10
- 230000001105 regulatory effect Effects 0.000 description 10
- 238000011282 treatment Methods 0.000 description 10
- 102100031936 Anterior gradient protein 2 homolog Human genes 0.000 description 9
- 101000775021 Homo sapiens Anterior gradient protein 2 homolog Proteins 0.000 description 9
- 101000872580 Homo sapiens Serine protease hepsin Proteins 0.000 description 9
- 102100034801 Serine protease hepsin Human genes 0.000 description 9
- 238000001514 detection method Methods 0.000 description 9
- 201000007094 prostatitis Diseases 0.000 description 9
- 238000001356 surgical procedure Methods 0.000 description 9
- 102100039563 ETS translocation variant 1 Human genes 0.000 description 8
- 101000813729 Homo sapiens ETS translocation variant 1 Proteins 0.000 description 8
- 101001050286 Homo sapiens Jupiter microtubule associated homolog 1 Proteins 0.000 description 8
- 101000992298 Homo sapiens Kappa-type opioid receptor Proteins 0.000 description 8
- 101001021821 Homo sapiens KxDL motif-containing protein 1 Proteins 0.000 description 8
- 101000972834 Homo sapiens Normal mucosa of esophagus-specific gene 1 protein Proteins 0.000 description 8
- 101001126498 Homo sapiens Peroxisome biogenesis factor 10 Proteins 0.000 description 8
- 101000605534 Homo sapiens Prostate-specific antigen Proteins 0.000 description 8
- 101001001272 Homo sapiens Prostatic acid phosphatase Proteins 0.000 description 8
- 102100031819 Kappa-type opioid receptor Human genes 0.000 description 8
- 102100036075 KxDL motif-containing protein 1 Human genes 0.000 description 8
- 102100022646 Normal mucosa of esophagus-specific gene 1 protein Human genes 0.000 description 8
- 102100030554 Peroxisome biogenesis factor 10 Human genes 0.000 description 8
- 102100035703 Prostatic acid phosphatase Human genes 0.000 description 8
- 102100022972 Transcription factor AP-2-alpha Human genes 0.000 description 8
- 235000001014 amino acid Nutrition 0.000 description 8
- 229940024606 amino acid Drugs 0.000 description 8
- 239000003098 androgen Substances 0.000 description 8
- 238000009396 hybridization Methods 0.000 description 8
- 238000010606 normalization Methods 0.000 description 8
- 230000008569 process Effects 0.000 description 8
- 238000011002 quantification Methods 0.000 description 8
- 102100038238 Aromatic-L-amino-acid decarboxylase Human genes 0.000 description 7
- 108010066050 CDP-diacylglycerol-inositol 3-phosphatidyltransferase Proteins 0.000 description 7
- 102100027367 Cysteine-rich secretory protein 3 Human genes 0.000 description 7
- 102100040351 FK506-binding protein 15 Human genes 0.000 description 7
- 101000726258 Homo sapiens Cysteine-rich secretory protein 3 Proteins 0.000 description 7
- 101000891018 Homo sapiens FK506-binding protein 15 Proteins 0.000 description 7
- 101000988651 Homo sapiens Humanin-like 1 Proteins 0.000 description 7
- 101001091365 Homo sapiens Plasma kallikrein Proteins 0.000 description 7
- 101000757378 Homo sapiens Transcription factor AP-2-alpha Proteins 0.000 description 7
- 101000638105 Homo sapiens Transmembrane channel-like protein 5 Proteins 0.000 description 7
- 101000818517 Homo sapiens Zinc-alpha-2-glycoprotein Proteins 0.000 description 7
- 102100023133 Jupiter microtubule associated homolog 1 Human genes 0.000 description 7
- 102100032007 Serum amyloid A-2 protein Human genes 0.000 description 7
- 108010035075 Tyrosine decarboxylase Proteins 0.000 description 7
- 102100021144 Zinc-alpha-2-glycoprotein Human genes 0.000 description 7
- 210000002919 epithelial cell Anatomy 0.000 description 7
- 208000023958 prostate neoplasm Diseases 0.000 description 7
- 102100027194 CDP-diacylglycerol-inositol 3-phosphatidyltransferase Human genes 0.000 description 6
- 102100039578 ETS translocation variant 4 Human genes 0.000 description 6
- 102100041003 Glutamate carboxypeptidase 2 Human genes 0.000 description 6
- 101000813747 Homo sapiens ETS translocation variant 4 Proteins 0.000 description 6
- 101000892862 Homo sapiens Glutamate carboxypeptidase 2 Proteins 0.000 description 6
- 101001097889 Homo sapiens Platelet-activating factor acetylhydrolase Proteins 0.000 description 6
- 101000851892 Homo sapiens Tropomyosin beta chain Proteins 0.000 description 6
- 206010027476 Metastases Diseases 0.000 description 6
- 102100034256 Mucin-1 Human genes 0.000 description 6
- 102100037518 Platelet-activating factor acetylhydrolase Human genes 0.000 description 6
- 101710083332 Serum amyloid A-2 protein Proteins 0.000 description 6
- 102100033920 Synemin Human genes 0.000 description 6
- 102100031994 Transmembrane channel-like protein 5 Human genes 0.000 description 6
- 102100036471 Tropomyosin beta chain Human genes 0.000 description 6
- 230000034994 death Effects 0.000 description 6
- 230000009401 metastasis Effects 0.000 description 6
- 210000003205 muscle Anatomy 0.000 description 6
- 230000035772 mutation Effects 0.000 description 6
- 150000007523 nucleic acids Chemical class 0.000 description 6
- 239000002773 nucleotide Substances 0.000 description 6
- 125000003729 nucleotide group Chemical group 0.000 description 6
- 229930024421 Adenine Natural products 0.000 description 5
- GFFGJBXGBJISGV-UHFFFAOYSA-N Adenine Chemical compound NC1=NC=NC2=C1N=CN2 GFFGJBXGBJISGV-UHFFFAOYSA-N 0.000 description 5
- 101100177160 Arabidopsis thaliana HAC2 gene Proteins 0.000 description 5
- 101000605528 Homo sapiens Kallikrein-2 Proteins 0.000 description 5
- 101000941892 Homo sapiens Leucine-rich repeat and calponin homology domain-containing protein 4 Proteins 0.000 description 5
- 101001133056 Homo sapiens Mucin-1 Proteins 0.000 description 5
- 101001022780 Homo sapiens Myosin light chain kinase, smooth muscle Proteins 0.000 description 5
- 101000693231 Homo sapiens PDZK1-interacting protein 1 Proteins 0.000 description 5
- 101000642258 Homo sapiens Spondin-2 Proteins 0.000 description 5
- 101000640289 Homo sapiens Synemin Proteins 0.000 description 5
- 101000889756 Homo sapiens Tudor domain-containing protein 1 Proteins 0.000 description 5
- 101000781952 Homo sapiens Zinc finger C3H1 domain-containing protein Proteins 0.000 description 5
- 102100038356 Kallikrein-2 Human genes 0.000 description 5
- 102100025648 PDZK1-interacting protein 1 Human genes 0.000 description 5
- 239000013614 RNA sample Substances 0.000 description 5
- 102100036427 Spondin-2 Human genes 0.000 description 5
- 102100029633 UDP-glucuronosyltransferase 2B15 Human genes 0.000 description 5
- 101710200683 UDP-glucuronosyltransferase 2B15 Proteins 0.000 description 5
- 102100036583 Zinc finger C3H1 domain-containing protein Human genes 0.000 description 5
- 229960000643 adenine Drugs 0.000 description 5
- 230000003321 amplification Effects 0.000 description 5
- 238000013459 approach Methods 0.000 description 5
- 230000008859 change Effects 0.000 description 5
- 238000002405 diagnostic procedure Methods 0.000 description 5
- 230000004927 fusion Effects 0.000 description 5
- 108020004999 messenger RNA Proteins 0.000 description 5
- 238000002493 microarray Methods 0.000 description 5
- 108091027963 non-coding RNA Proteins 0.000 description 5
- 102000042567 non-coding RNA Human genes 0.000 description 5
- 238000003199 nucleic acid amplification method Methods 0.000 description 5
- 239000012188 paraffin wax Substances 0.000 description 5
- 229920001481 poly(stearyl methacrylate) Polymers 0.000 description 5
- 101100476210 Caenorhabditis elegans rnt-1 gene Proteins 0.000 description 4
- WSFSSNUMVMOOMR-UHFFFAOYSA-N Formaldehyde Chemical compound O=C WSFSSNUMVMOOMR-UHFFFAOYSA-N 0.000 description 4
- 102100027529 Heat shock factor-binding protein 1 Human genes 0.000 description 4
- 102100020759 Homeobox protein Hox-C4 Human genes 0.000 description 4
- 101000693765 Homo sapiens ATP-dependent 6-phosphofructokinase, platelet type Proteins 0.000 description 4
- 101001080298 Homo sapiens Heat shock factor-binding protein 1 Proteins 0.000 description 4
- 101001002994 Homo sapiens Homeobox protein Hox-C4 Proteins 0.000 description 4
- 101001081567 Homo sapiens Insulin-like growth factor-binding protein 1 Proteins 0.000 description 4
- 101000941871 Homo sapiens Leucine-rich repeat neuronal protein 1 Proteins 0.000 description 4
- 101000830894 Homo sapiens Targeting protein for Xklp2 Proteins 0.000 description 4
- 102100027636 Insulin-like growth factor-binding protein 1 Human genes 0.000 description 4
- 102100032680 Leucine-rich repeat and calponin homology domain-containing protein 4 Human genes 0.000 description 4
- 102100030610 Mothers against decapentaplegic homolog 5 Human genes 0.000 description 4
- 101710143113 Mothers against decapentaplegic homolog 5 Proteins 0.000 description 4
- 102100035044 Myosin light chain kinase, smooth muscle Human genes 0.000 description 4
- 102100040557 Osteopontin Human genes 0.000 description 4
- 239000012807 PCR reagent Substances 0.000 description 4
- 102100030350 Prolactin-inducible protein Human genes 0.000 description 4
- 101710168942 Sphingosine-1-phosphate phosphatase 1 Proteins 0.000 description 4
- 102100024813 Targeting protein for Xklp2 Human genes 0.000 description 4
- MUMGGOZAMZWBJJ-DYKIIFRCSA-N Testostosterone Chemical compound O=C1CC[C@]2(C)[C@H]3CC[C@](C)([C@H](CC4)O)[C@@H]4[C@@H]3CCC2=C1 MUMGGOZAMZWBJJ-DYKIIFRCSA-N 0.000 description 4
- 102100040192 Tudor domain-containing protein 1 Human genes 0.000 description 4
- ISAKRJDGNUQOIC-UHFFFAOYSA-N Uracil Chemical compound O=C1C=CNC(=O)N1 ISAKRJDGNUQOIC-UHFFFAOYSA-N 0.000 description 4
- 201000010099 disease Diseases 0.000 description 4
- 230000005669 field effect Effects 0.000 description 4
- 238000012986 modification Methods 0.000 description 4
- 230000004048 modification Effects 0.000 description 4
- 238000003762 quantitative reverse transcription PCR Methods 0.000 description 4
- 239000002096 quantum dot Substances 0.000 description 4
- 230000005855 radiation Effects 0.000 description 4
- 238000011472 radical prostatectomy Methods 0.000 description 4
- 238000010839 reverse transcription Methods 0.000 description 4
- 238000006467 substitution reaction Methods 0.000 description 4
- 239000006228 supernatant Substances 0.000 description 4
- RWQNBRDOKXIBIV-UHFFFAOYSA-N thymine Chemical class CC1=CNC(=O)NC1=O RWQNBRDOKXIBIV-UHFFFAOYSA-N 0.000 description 4
- XLYOFNOQVPJJNP-UHFFFAOYSA-N water Chemical compound O XLYOFNOQVPJJNP-UHFFFAOYSA-N 0.000 description 4
- 102000040650 (ribonucleotides)n+m Human genes 0.000 description 3
- 102100030489 15-hydroxyprostaglandin dehydrogenase [NAD(+)] Human genes 0.000 description 3
- 102100025514 ATP-dependent 6-phosphofructokinase, platelet type Human genes 0.000 description 3
- 102000004602 Aldo-Keto Reductase Family 1 Member C3 Human genes 0.000 description 3
- 102100040410 Alpha-methylacyl-CoA racemase Human genes 0.000 description 3
- 108010044434 Alpha-methylacyl-CoA racemase Proteins 0.000 description 3
- 102000013918 Apolipoproteins E Human genes 0.000 description 3
- 108010025628 Apolipoproteins E Proteins 0.000 description 3
- 108091003079 Bovine Serum Albumin Proteins 0.000 description 3
- 102000004594 DNA Polymerase I Human genes 0.000 description 3
- 108010017826 DNA Polymerase I Proteins 0.000 description 3
- 102000016928 DNA-directed DNA polymerase Human genes 0.000 description 3
- 108010014303 DNA-directed DNA polymerase Proteins 0.000 description 3
- 102100026561 Filamin-A Human genes 0.000 description 3
- 102100032827 Homeodomain-interacting protein kinase 2 Human genes 0.000 description 3
- 101001126430 Homo sapiens 15-hydroxyprostaglandin dehydrogenase [NAD(+)] Proteins 0.000 description 3
- 101000913549 Homo sapiens Filamin-A Proteins 0.000 description 3
- 101001066401 Homo sapiens Homeodomain-interacting protein kinase 2 Proteins 0.000 description 3
- 101000972489 Homo sapiens Laminin subunit alpha-1 Proteins 0.000 description 3
- 101001055092 Homo sapiens Mitogen-activated protein kinase kinase kinase 7 Proteins 0.000 description 3
- 101001128429 Homo sapiens Myelin expression factor 2 Proteins 0.000 description 3
- 101000642268 Homo sapiens Speckle-type POZ protein Proteins 0.000 description 3
- 101000659053 Homo sapiens Synaptopodin-2 Proteins 0.000 description 3
- 101000759892 Homo sapiens Tetraspanin-13 Proteins 0.000 description 3
- 101000766332 Homo sapiens Tribbles homolog 1 Proteins 0.000 description 3
- 206010020880 Hypertrophy Diseases 0.000 description 3
- 102100031790 Myelin expression factor 2 Human genes 0.000 description 3
- 108700020796 Oncogene Proteins 0.000 description 3
- 238000012408 PCR amplification Methods 0.000 description 3
- 102100026651 Pro-adrenomedullin Human genes 0.000 description 3
- 108010065942 Prostaglandin-F synthase Proteins 0.000 description 3
- 208000025844 Prostatic disease Diseases 0.000 description 3
- 108091006617 SLC10A7 Proteins 0.000 description 3
- 102100030058 Secreted frizzled-related protein 1 Human genes 0.000 description 3
- 102100021980 Sodium/bile acid cotransporter 7 Human genes 0.000 description 3
- 102100036422 Speckle-type POZ protein Human genes 0.000 description 3
- 102100035603 Synaptopodin-2 Human genes 0.000 description 3
- 102100024996 Tetraspanin-13 Human genes 0.000 description 3
- 102100024200 Transcription factor COE3 Human genes 0.000 description 3
- 102100026387 Tribbles homolog 1 Human genes 0.000 description 3
- 208000009956 adenocarcinoma Diseases 0.000 description 3
- 238000003556 assay Methods 0.000 description 3
- 230000008901 benefit Effects 0.000 description 3
- 230000027455 binding Effects 0.000 description 3
- 230000015572 biosynthetic process Effects 0.000 description 3
- 231100000504 carcinogenesis Toxicity 0.000 description 3
- 230000001413 cellular effect Effects 0.000 description 3
- 239000013068 control sample Substances 0.000 description 3
- 238000012217 deletion Methods 0.000 description 3
- 230000037430 deletion Effects 0.000 description 3
- 238000009826 distribution Methods 0.000 description 3
- 229940079593 drug Drugs 0.000 description 3
- 239000003814 drug Substances 0.000 description 3
- 239000012091 fetal bovine serum Substances 0.000 description 3
- 230000036541 health Effects 0.000 description 3
- 210000004072 lung Anatomy 0.000 description 3
- 206010061289 metastatic neoplasm Diseases 0.000 description 3
- 239000000203 mixture Substances 0.000 description 3
- 102000039446 nucleic acids Human genes 0.000 description 3
- 108020004707 nucleic acids Proteins 0.000 description 3
- 239000008188 pellet Substances 0.000 description 3
- 238000002360 preparation method Methods 0.000 description 3
- 208000021046 prostate intraepithelial neoplasia Diseases 0.000 description 3
- 238000003753 real-time PCR Methods 0.000 description 3
- 238000011160 research Methods 0.000 description 3
- 230000000630 rising effect Effects 0.000 description 3
- 238000012216 screening Methods 0.000 description 3
- 230000035945 sensitivity Effects 0.000 description 3
- 208000024891 symptom Diseases 0.000 description 3
- 238000002560 therapeutic procedure Methods 0.000 description 3
- 239000000107 tumor biomarker Substances 0.000 description 3
- 230000003827 upregulation Effects 0.000 description 3
- 108010085238 Actins Proteins 0.000 description 2
- 102000007469 Actins Human genes 0.000 description 2
- 102100022712 Alpha-1-antitrypsin Human genes 0.000 description 2
- 208000005623 Carcinogenesis Diseases 0.000 description 2
- 201000009030 Carcinoma Diseases 0.000 description 2
- 102100027473 Cartilage oligomeric matrix protein Human genes 0.000 description 2
- 101710176668 Cartilage oligomeric matrix protein Proteins 0.000 description 2
- 108020004635 Complementary DNA Proteins 0.000 description 2
- 102100031051 Cysteine and glycine-rich protein 1 Human genes 0.000 description 2
- 102000053602 DNA Human genes 0.000 description 2
- 102100021420 Defensin-5 Human genes 0.000 description 2
- 206010061818 Disease progression Diseases 0.000 description 2
- 102100038392 GRAM domain-containing protein 4 Human genes 0.000 description 2
- 102000004989 Hepsin Human genes 0.000 description 2
- 108090001101 Hepsin Proteins 0.000 description 2
- 102100038970 Histone-lysine N-methyltransferase EZH2 Human genes 0.000 description 2
- 101000823116 Homo sapiens Alpha-1-antitrypsin Proteins 0.000 description 2
- 101001041589 Homo sapiens Defensin-5 Proteins 0.000 description 2
- 101001033004 Homo sapiens GRAM domain-containing protein 4 Proteins 0.000 description 2
- 101001046870 Homo sapiens Hypoxia-inducible factor 1-alpha Proteins 0.000 description 2
- 101001004946 Homo sapiens Lactoylglutathione lyase Proteins 0.000 description 2
- 101001125417 Homo sapiens Na(+)/H(+) exchange regulatory cofactor NHE-RF3 Proteins 0.000 description 2
- 101000651309 Homo sapiens Retinoic acid receptor responder protein 1 Proteins 0.000 description 2
- 101000864743 Homo sapiens Secreted frizzled-related protein 1 Proteins 0.000 description 2
- 101001010792 Homo sapiens Transcriptional regulator ERG Proteins 0.000 description 2
- 101000836339 Homo sapiens Transposon Hsmar1 transposase Proteins 0.000 description 2
- 101000640793 Homo sapiens UDP-galactose translocator Proteins 0.000 description 2
- 101000672037 Homo sapiens UDP-glucose:glycoprotein glucosyltransferase 2 Proteins 0.000 description 2
- 102100022875 Hypoxia-inducible factor 1-alpha Human genes 0.000 description 2
- 108091092195 Intron Proteins 0.000 description 2
- 102100026004 Lactoylglutathione lyase Human genes 0.000 description 2
- 102100022746 Laminin subunit alpha-1 Human genes 0.000 description 2
- 101710099430 Microtubule-associated protein RP/EB family member 3 Proteins 0.000 description 2
- 102100026888 Mitogen-activated protein kinase kinase kinase 7 Human genes 0.000 description 2
- 102100029467 Na(+)/H(+) exchange regulatory cofactor NHE-RF3 Human genes 0.000 description 2
- 108010069341 Phosphofructokinases Proteins 0.000 description 2
- 102000001105 Phosphofructokinases Human genes 0.000 description 2
- 238000002123 RNA extraction Methods 0.000 description 2
- 102100027682 Retinoic acid receptor responder protein 1 Human genes 0.000 description 2
- 102100023647 Selenoprotein M Human genes 0.000 description 2
- 102000008847 Serpin Human genes 0.000 description 2
- 108050000761 Serpin Proteins 0.000 description 2
- 102100029983 Transcriptional regulator ERG Human genes 0.000 description 2
- 102100031989 Transmembrane protease serine 2 Human genes 0.000 description 2
- 101710081844 Transmembrane protease serine 2 Proteins 0.000 description 2
- 102100033782 UDP-galactose translocator Human genes 0.000 description 2
- 238000010317 ablation therapy Methods 0.000 description 2
- 230000004075 alteration Effects 0.000 description 2
- 229940030486 androgens Drugs 0.000 description 2
- 230000000692 anti-sense effect Effects 0.000 description 2
- 230000036952 cancer formation Effects 0.000 description 2
- 239000006285 cell suspension Substances 0.000 description 2
- 238000005119 centrifugation Methods 0.000 description 2
- 238000006243 chemical reaction Methods 0.000 description 2
- 238000002591 computed tomography Methods 0.000 description 2
- 230000007423 decrease Effects 0.000 description 2
- 238000013461 design Methods 0.000 description 2
- 230000005750 disease progression Effects 0.000 description 2
- 230000003828 downregulation Effects 0.000 description 2
- 238000000605 extraction Methods 0.000 description 2
- 230000012010 growth Effects 0.000 description 2
- 208000015181 infectious disease Diseases 0.000 description 2
- 210000004185 liver Anatomy 0.000 description 2
- 210000001165 lymph node Anatomy 0.000 description 2
- 239000003550 marker Substances 0.000 description 2
- 210000004379 membrane Anatomy 0.000 description 2
- 239000012528 membrane Substances 0.000 description 2
- 201000002120 neuroendocrine carcinoma Diseases 0.000 description 2
- 210000004412 neuroendocrine cell Anatomy 0.000 description 2
- 239000002243 precursor Substances 0.000 description 2
- 230000037452 priming Effects 0.000 description 2
- 239000000047 product Substances 0.000 description 2
- 238000004393 prognosis Methods 0.000 description 2
- 230000035755 proliferation Effects 0.000 description 2
- 201000005825 prostate adenocarcinoma Diseases 0.000 description 2
- 238000000746 purification Methods 0.000 description 2
- 238000001959 radiotherapy Methods 0.000 description 2
- 238000003757 reverse transcription PCR Methods 0.000 description 2
- 230000003248 secreting effect Effects 0.000 description 2
- 239000003001 serine protease inhibitor Substances 0.000 description 2
- 239000000243 solution Substances 0.000 description 2
- 239000000758 substrate Substances 0.000 description 2
- 238000003786 synthesis reaction Methods 0.000 description 2
- 229960003604 testosterone Drugs 0.000 description 2
- 229940113082 thymine Drugs 0.000 description 2
- 238000013518 transcription Methods 0.000 description 2
- 230000035897 transcription Effects 0.000 description 2
- 229940035893 uracil Drugs 0.000 description 2
- 102100039377 28 kDa heat- and acid-stable phosphoprotein Human genes 0.000 description 1
- 101710176122 28 kDa heat- and acid-stable phosphoprotein Proteins 0.000 description 1
- 101710097446 3'(2'),5'-bisphosphate nucleotidase 1 Proteins 0.000 description 1
- IGRCWJPBLWGNPX-UHFFFAOYSA-N 3-(2-chlorophenyl)-n-(4-chlorophenyl)-n,5-dimethyl-1,2-oxazole-4-carboxamide Chemical compound C=1C=C(Cl)C=CC=1N(C)C(=O)C1=C(C)ON=C1C1=CC=CC=C1Cl IGRCWJPBLWGNPX-UHFFFAOYSA-N 0.000 description 1
- 108020005075 5S Ribosomal RNA Proteins 0.000 description 1
- 102100022144 Achaete-scute homolog 2 Human genes 0.000 description 1
- 102100036732 Actin, aortic smooth muscle Human genes 0.000 description 1
- 102100022454 Actin, gamma-enteric smooth muscle Human genes 0.000 description 1
- 102100027647 Activin receptor type-2B Human genes 0.000 description 1
- 102100026024 Acyl-coenzyme A synthetase ACSM3, mitochondrial Human genes 0.000 description 1
- 208000010507 Adenocarcinoma of Lung Diseases 0.000 description 1
- 102100031933 Adhesion G protein-coupled receptor F5 Human genes 0.000 description 1
- 102100031831 Adipogenesis regulatory factor Human genes 0.000 description 1
- 102000004379 Adrenomedullin Human genes 0.000 description 1
- 101800004616 Adrenomedullin Proteins 0.000 description 1
- 102000005602 Aldo-Keto Reductases Human genes 0.000 description 1
- 108010084469 Aldo-Keto Reductases Proteins 0.000 description 1
- 108700028369 Alleles Proteins 0.000 description 1
- 102100032187 Androgen receptor Human genes 0.000 description 1
- 102000011772 Apolipoprotein C-I Human genes 0.000 description 1
- 108010076807 Apolipoprotein C-I Proteins 0.000 description 1
- 102000030169 Apolipoprotein C-III Human genes 0.000 description 1
- 108010056301 Apolipoprotein C-III Proteins 0.000 description 1
- 102100029470 Apolipoprotein E Human genes 0.000 description 1
- 101710095339 Apolipoprotein E Proteins 0.000 description 1
- 102100033261 Aspartyl aminopeptidase Human genes 0.000 description 1
- 241000271566 Aves Species 0.000 description 1
- 241000894006 Bacteria Species 0.000 description 1
- 208000035143 Bacterial infection Diseases 0.000 description 1
- 102100025142 Beta-microseminoprotein Human genes 0.000 description 1
- 208000007204 Brain death Diseases 0.000 description 1
- 206010006187 Breast cancer Diseases 0.000 description 1
- 208000026310 Breast neoplasm Diseases 0.000 description 1
- 108010074051 C-Reactive Protein Proteins 0.000 description 1
- 102100032752 C-reactive protein Human genes 0.000 description 1
- 102100027207 CD27 antigen Human genes 0.000 description 1
- 101100371857 Caenorhabditis elegans unc-71 gene Proteins 0.000 description 1
- 102100023073 Calcium-activated potassium channel subunit alpha-1 Human genes 0.000 description 1
- 102100029184 Calmodulin regulator protein PCP4 Human genes 0.000 description 1
- 102100033620 Calponin-1 Human genes 0.000 description 1
- 241000606161 Chlamydia Species 0.000 description 1
- 102100030099 Chloride anion exchanger Human genes 0.000 description 1
- 102100039505 Choline transporter-like protein 5 Human genes 0.000 description 1
- 108010077544 Chromatin Proteins 0.000 description 1
- 102000003780 Clusterin Human genes 0.000 description 1
- 108090000197 Clusterin Proteins 0.000 description 1
- 102100037529 Coagulation factor V Human genes 0.000 description 1
- 102100029136 Collagen alpha-1(II) chain Human genes 0.000 description 1
- 102100030976 Collagen alpha-2(IX) chain Human genes 0.000 description 1
- 102100028036 Cystatin-S Human genes 0.000 description 1
- 102100038695 Cysteine-rich secretory protein LCCL domain-containing 1 Human genes 0.000 description 1
- 101710155020 Cysteine-rich secretory protein LCCL domain-containing 1 Proteins 0.000 description 1
- 101710195240 Cysteine-rich venom protein Proteins 0.000 description 1
- 230000004544 DNA amplification Effects 0.000 description 1
- 108090000626 DNA-directed RNA polymerases Proteins 0.000 description 1
- 102000004163 DNA-directed RNA polymerases Human genes 0.000 description 1
- 102100023348 DNA-directed RNA polymerases I, II, and III subunit RPABC2 Human genes 0.000 description 1
- 102100033209 Dysbindin domain-containing protein 2 Human genes 0.000 description 1
- 108091071901 ETS family Proteins 0.000 description 1
- 241000588724 Escherichia coli Species 0.000 description 1
- 102100029525 F-box only protein 7 Human genes 0.000 description 1
- 108010014172 Factor V Proteins 0.000 description 1
- 102100020856 Forkhead box protein F1 Human genes 0.000 description 1
- 102100030671 Gastrin-releasing peptide receptor Human genes 0.000 description 1
- 102000016354 Glucuronosyltransferase Human genes 0.000 description 1
- 108010092364 Glucuronosyltransferase Proteins 0.000 description 1
- 102100038942 Glutamate receptor ionotropic, NMDA 3A Human genes 0.000 description 1
- 102000006485 Glutamyl Aminopeptidase Human genes 0.000 description 1
- 108010058940 Glutamyl Aminopeptidase Proteins 0.000 description 1
- 102100030943 Glutathione S-transferase P Human genes 0.000 description 1
- 101710112368 Glutathione S-transferase P 1 Proteins 0.000 description 1
- 102100031181 Glyceraldehyde-3-phosphate dehydrogenase Human genes 0.000 description 1
- DHMQDGOQFOQNFH-UHFFFAOYSA-N Glycine Chemical compound NCC(O)=O DHMQDGOQFOQNFH-UHFFFAOYSA-N 0.000 description 1
- 239000000579 Gonadotropin-Releasing Hormone Substances 0.000 description 1
- 108010069236 Goserelin Proteins 0.000 description 1
- BLCLNMBMMGCOAS-URPVMXJPSA-N Goserelin Chemical compound C([C@@H](C(=O)N[C@H](COC(C)(C)C)C(=O)N[C@@H](CC(C)C)C(=O)N[C@@H](CCCN=C(N)N)C(=O)N1[C@@H](CCC1)C(=O)NNC(N)=O)NC(=O)[C@H](CO)NC(=O)[C@H](CC=1C2=CC=CC=C2NC=1)NC(=O)[C@H](CC=1NC=NC=1)NC(=O)[C@H]1NC(=O)CC1)C1=CC=C(O)C=C1 BLCLNMBMMGCOAS-URPVMXJPSA-N 0.000 description 1
- 108010043121 Green Fluorescent Proteins Proteins 0.000 description 1
- 108010004889 Heat-Shock Proteins Proteins 0.000 description 1
- 102000002812 Heat-Shock Proteins Human genes 0.000 description 1
- 101710196274 Histone-lysine N-methyltransferase EZH2 Proteins 0.000 description 1
- 108700005087 Homeobox Genes Proteins 0.000 description 1
- 102100021088 Homeobox protein Hox-B13 Human genes 0.000 description 1
- 102100027886 Homeobox protein Nkx-2.2 Human genes 0.000 description 1
- 108010048671 Homeodomain Proteins Proteins 0.000 description 1
- 102000009331 Homeodomain Proteins Human genes 0.000 description 1
- 101000901109 Homo sapiens Achaete-scute homolog 2 Proteins 0.000 description 1
- 101000929319 Homo sapiens Actin, aortic smooth muscle Proteins 0.000 description 1
- 101000678433 Homo sapiens Actin, gamma-enteric smooth muscle Proteins 0.000 description 1
- 101000937269 Homo sapiens Activin receptor type-2B Proteins 0.000 description 1
- 101000720124 Homo sapiens Acyl-coenzyme A synthetase ACSM3, mitochondrial Proteins 0.000 description 1
- 101000775045 Homo sapiens Adhesion G protein-coupled receptor F5 Proteins 0.000 description 1
- 101000775473 Homo sapiens Adipogenesis regulatory factor Proteins 0.000 description 1
- 101000927708 Homo sapiens Aspartyl aminopeptidase Proteins 0.000 description 1
- 101000576812 Homo sapiens Beta-microseminoprotein Proteins 0.000 description 1
- 101000914511 Homo sapiens CD27 antigen Proteins 0.000 description 1
- 101001049859 Homo sapiens Calcium-activated potassium channel subunit alpha-1 Proteins 0.000 description 1
- 101000988362 Homo sapiens Calmodulin regulator protein PCP4 Proteins 0.000 description 1
- 101000945318 Homo sapiens Calponin-1 Proteins 0.000 description 1
- 101000771163 Homo sapiens Collagen alpha-1(II) chain Proteins 0.000 description 1
- 101000919645 Homo sapiens Collagen alpha-2(IX) chain Proteins 0.000 description 1
- 101000722966 Homo sapiens Cystatin-S Proteins 0.000 description 1
- 101000922020 Homo sapiens Cysteine and glycine-rich protein 1 Proteins 0.000 description 1
- 101000686009 Homo sapiens DNA-directed RNA polymerases I, II, and III subunit RPABC2 Proteins 0.000 description 1
- 101000871249 Homo sapiens Dysbindin domain-containing protein 2 Proteins 0.000 description 1
- 101000931494 Homo sapiens Forkhead box protein F1 Proteins 0.000 description 1
- 101000603180 Homo sapiens Glutamate receptor ionotropic, NMDA 3A Proteins 0.000 description 1
- 101001010139 Homo sapiens Glutathione S-transferase P Proteins 0.000 description 1
- 101000882127 Homo sapiens Histone-lysine N-methyltransferase EZH2 Proteins 0.000 description 1
- 101001041145 Homo sapiens Homeobox protein Hox-B13 Proteins 0.000 description 1
- 101000632186 Homo sapiens Homeobox protein Nkx-2.2 Proteins 0.000 description 1
- 101001043809 Homo sapiens Interleukin-7 receptor subunit alpha Proteins 0.000 description 1
- 101000652160 Homo sapiens Mothers against decapentaplegic homolog 5 Proteins 0.000 description 1
- 101001000104 Homo sapiens Myosin-11 Proteins 0.000 description 1
- 101000721386 Homo sapiens OTU domain-containing protein 5 Proteins 0.000 description 1
- 101000734572 Homo sapiens Phosphoenolpyruvate carboxykinase, cytosolic [GTP] Proteins 0.000 description 1
- 101000605666 Homo sapiens Phospholipase A1 member A Proteins 0.000 description 1
- 101001113490 Homo sapiens Poly(A)-specific ribonuclease PARN Proteins 0.000 description 1
- 101000997280 Homo sapiens Potassium voltage-gated channel subfamily C member 2 Proteins 0.000 description 1
- 101000891848 Homo sapiens Protein FAM3D Proteins 0.000 description 1
- 101001027456 Homo sapiens Protein FEV Proteins 0.000 description 1
- 101001138030 Homo sapiens Protein Largen Proteins 0.000 description 1
- 101001073409 Homo sapiens Retrotransposon-derived protein PEG10 Proteins 0.000 description 1
- 101000739786 Homo sapiens Semenogelin-2 Proteins 0.000 description 1
- 101000637821 Homo sapiens Serum amyloid A-2 protein Proteins 0.000 description 1
- 101000821829 Homo sapiens Solute carrier family 22 member 17 Proteins 0.000 description 1
- 101000700646 Homo sapiens Steroid receptor-associated and regulated protein Proteins 0.000 description 1
- 101000826406 Homo sapiens Sulfotransferase 1C2 Proteins 0.000 description 1
- 101000595467 Homo sapiens T-complex protein 1 subunit gamma Proteins 0.000 description 1
- 101000800061 Homo sapiens Testican-3 Proteins 0.000 description 1
- 101000807354 Homo sapiens Ubiquitin-conjugating enzyme E2 C Proteins 0.000 description 1
- 206010062767 Hypophysitis Diseases 0.000 description 1
- 108060003951 Immunoglobulin Proteins 0.000 description 1
- 206010021639 Incontinence Diseases 0.000 description 1
- 206010061218 Inflammation Diseases 0.000 description 1
- 102000004375 Insulin-like growth factor-binding protein 1 Human genes 0.000 description 1
- 108090000957 Insulin-like growth factor-binding protein 1 Proteins 0.000 description 1
- 102100021593 Interleukin-7 receptor subunit alpha Human genes 0.000 description 1
- 102000006541 Ionotropic Glutamate Receptors Human genes 0.000 description 1
- 108010008812 Ionotropic Glutamate Receptors Proteins 0.000 description 1
- -1 KLK3.470 Proteins 0.000 description 1
- WHUUTDBJXJRKMK-VKHMYHEASA-N L-glutamic acid Chemical compound OC(=O)[C@@H](N)CCC(O)=O WHUUTDBJXJRKMK-VKHMYHEASA-N 0.000 description 1
- ROHFNLRQFUQHCH-YFKPBYRVSA-N L-leucine Chemical compound CC(C)C[C@H](N)C(O)=O ROHFNLRQFUQHCH-YFKPBYRVSA-N 0.000 description 1
- 101710096582 L-tyrosine decarboxylase Proteins 0.000 description 1
- 102100032655 Leucine-rich repeat neuronal protein 1 Human genes 0.000 description 1
- 108010000817 Leuprolide Proteins 0.000 description 1
- 206010058467 Lung neoplasm malignant Diseases 0.000 description 1
- 208000007433 Lymphatic Metastasis Diseases 0.000 description 1
- 241000124008 Mammalia Species 0.000 description 1
- 102220513084 Methionine-R-sulfoxide reductase B2, mitochondrial_U95C_mutation Human genes 0.000 description 1
- 108010006519 Molecular Chaperones Proteins 0.000 description 1
- 102000005431 Molecular Chaperones Human genes 0.000 description 1
- 241001430197 Mollicutes Species 0.000 description 1
- 108010008707 Mucin-1 Proteins 0.000 description 1
- 241001269800 Myoporum laetum Species 0.000 description 1
- 108060008487 Myosin Proteins 0.000 description 1
- 102000003505 Myosin Human genes 0.000 description 1
- 102100036639 Myosin-11 Human genes 0.000 description 1
- HOKKHZGPKSLGJE-GSVOUGTGSA-N N-Methyl-D-aspartic acid Chemical compound CN[C@@H](C(O)=O)CC(O)=O HOKKHZGPKSLGJE-GSVOUGTGSA-N 0.000 description 1
- 239000000020 Nitrocellulose Substances 0.000 description 1
- 239000004677 Nylon Substances 0.000 description 1
- 102100025194 OTU domain-containing protein 5 Human genes 0.000 description 1
- 108010058765 Oncogene Protein pp60(v-src) Proteins 0.000 description 1
- 102000004264 Osteopontin Human genes 0.000 description 1
- 108010081689 Osteopontin Proteins 0.000 description 1
- 108091033411 PCA3 Proteins 0.000 description 1
- 108010011536 PTEN Phosphohydrolase Proteins 0.000 description 1
- 102000014160 PTEN Phosphohydrolase Human genes 0.000 description 1
- 208000000450 Pelvic Pain Diseases 0.000 description 1
- 229940122344 Peptidase inhibitor Drugs 0.000 description 1
- 102000015731 Peptide Hormones Human genes 0.000 description 1
- 108010038988 Peptide Hormones Proteins 0.000 description 1
- 102100034796 Phosphoenolpyruvate carboxykinase, cytosolic [GTP] Human genes 0.000 description 1
- 108091000080 Phosphotransferase Proteins 0.000 description 1
- 102100023715 Poly(A)-specific ribonuclease PARN Human genes 0.000 description 1
- 102100034307 Potassium voltage-gated channel subfamily C member 2 Human genes 0.000 description 1
- 208000006994 Precancerous Conditions Diseases 0.000 description 1
- 101710122111 Probable proline iminopeptidase Proteins 0.000 description 1
- 101710170844 Proline iminopeptidase Proteins 0.000 description 1
- 102100040821 Protein FAM3D Human genes 0.000 description 1
- 102100037681 Protein FEV Human genes 0.000 description 1
- 102000001253 Protein Kinase Human genes 0.000 description 1
- 102100020860 Protein Largen Human genes 0.000 description 1
- 108010026552 Proteome Proteins 0.000 description 1
- 101710122579 Putative proline iminopeptidase Proteins 0.000 description 1
- 238000010357 RNA editing Methods 0.000 description 1
- 230000026279 RNA modification Effects 0.000 description 1
- 108020004511 Recombinant DNA Proteins 0.000 description 1
- 102100035844 Retrotransposon-derived protein PEG10 Human genes 0.000 description 1
- 108091028664 Ribonucleotide Proteins 0.000 description 1
- 108091006744 SLC22A1 Proteins 0.000 description 1
- 108091006504 SLC26A3 Proteins 0.000 description 1
- 206010039491 Sarcoma Diseases 0.000 description 1
- 101150103877 Selenom gene Proteins 0.000 description 1
- 101710095025 Selenoprotein M Proteins 0.000 description 1
- 102100037547 Semenogelin-2 Human genes 0.000 description 1
- 102100032416 Solute carrier family 22 member 1 Human genes 0.000 description 1
- 102100021542 Solute carrier family 22 member 17 Human genes 0.000 description 1
- 238000002105 Southern blotting Methods 0.000 description 1
- 101000857870 Squalus acanthias Gonadoliberin Proteins 0.000 description 1
- 241000295644 Staphylococcaceae Species 0.000 description 1
- 102100029291 Steroid receptor-associated and regulated protein Human genes 0.000 description 1
- 102100036049 T-complex protein 1 subunit gamma Human genes 0.000 description 1
- 102100033386 Testican-3 Human genes 0.000 description 1
- 108091023040 Transcription factor Proteins 0.000 description 1
- 102000004893 Transcription factor AP-2 Human genes 0.000 description 1
- 108090001039 Transcription factor AP-2 Proteins 0.000 description 1
- 101710189834 Transcription factor AP-2-alpha Proteins 0.000 description 1
- 108090001012 Transforming Growth Factor beta Proteins 0.000 description 1
- 102000004887 Transforming Growth Factor beta Human genes 0.000 description 1
- 102100027172 Transposon Hsmar1 transposase Human genes 0.000 description 1
- 108010078184 Trefoil Factor-3 Proteins 0.000 description 1
- 102100039145 Trefoil factor 3 Human genes 0.000 description 1
- 108010083162 Twist-Related Protein 1 Proteins 0.000 description 1
- 102100030398 Twist-related protein 1 Human genes 0.000 description 1
- 102100037256 Ubiquitin-conjugating enzyme E2 C Human genes 0.000 description 1
- 241000202898 Ureaplasma Species 0.000 description 1
- HCHKCACWOHOZIP-UHFFFAOYSA-N Zinc Chemical compound [Zn] HCHKCACWOHOZIP-UHFFFAOYSA-N 0.000 description 1
- 230000002159 abnormal effect Effects 0.000 description 1
- 230000005856 abnormality Effects 0.000 description 1
- 230000006978 adaptation Effects 0.000 description 1
- ULCUCJFASIJEOE-NPECTJMMSA-N adrenomedullin Chemical compound C([C@@H](C(=O)N[C@@H](CCC(N)=O)C(=O)NCC(=O)N[C@@H]([C@@H](C)CC)C(=O)N[C@@H](CCCNC(N)=N)C(=O)N[C@@H](CO)C(=O)N[C@@H](CC=1C=CC=CC=1)C(=O)NCC(=O)N[C@@H]1C(N[C@@H](CCCNC(N)=N)C(=O)N[C@@H](CC=2C=CC=CC=2)C(=O)NCC(=O)N[C@H](C(=O)N[C@@H](CSSC1)C(=O)N[C@@H]([C@@H](C)O)C(=O)N[C@@H](C(C)C)C(=O)N[C@@H](CCC(N)=O)C(=O)N[C@@H](CCCCN)C(=O)N[C@@H](CC(C)C)C(=O)N[C@@H](C)C(=O)N[C@@H](CC=1NC=NC=1)C(=O)N[C@@H](CCC(N)=O)C(=O)N[C@@H]([C@@H](C)CC)C(=O)N[C@@H](CC=1C=CC(O)=CC=1)C(=O)N[C@@H](CCC(N)=O)C(=O)N[C@@H](CC=1C=CC=CC=1)C(=O)N[C@@H]([C@@H](C)O)C(=O)N[C@@H](CC(O)=O)C(=O)N[C@@H](CCCCN)C(=O)N[C@@H](CC(O)=O)C(=O)N[C@@H](CCCCN)C(=O)N[C@@H](CC(O)=O)C(=O)N[C@@H](CC(N)=O)C(=O)N[C@@H](C(C)C)C(=O)N[C@@H](C)C(=O)N1[C@@H](CCC1)C(=O)N[C@@H](CCCNC(N)=N)C(=O)N[C@@H](CO)C(=O)N[C@@H](CCCCN)C(=O)N[C@@H]([C@@H](C)CC)C(=O)N[C@@H](CO)C(=O)N1[C@@H](CCC1)C(=O)N[C@@H](CCC(N)=O)C(=O)NCC(=O)N[C@@H](CC=1C=CC(O)=CC=1)C(N)=O)[C@@H](C)O)=O)NC(=O)[C@H](CC(N)=O)NC(=O)[C@H](CC(N)=O)NC(=O)[C@H](CCSC)NC(=O)[C@H](CO)NC(=O)[C@H](CCC(N)=O)NC(=O)[C@H](CCCNC(N)=N)NC(=O)[C@@H](N)CC=1C=CC(O)=CC=1)C1=CC=CC=C1 ULCUCJFASIJEOE-NPECTJMMSA-N 0.000 description 1
- 239000011543 agarose gel Substances 0.000 description 1
- 239000000556 agonist Substances 0.000 description 1
- SHGAZHPCJJPHSC-YCNIQYBTSA-N all-trans-retinoic acid Chemical compound OC(=O)\C=C(/C)\C=C\C=C(/C)\C=C\C1=C(C)CCCC1(C)C SHGAZHPCJJPHSC-YCNIQYBTSA-N 0.000 description 1
- 108010048418 alpha Subunit Hypoxia-Inducible Factor 1 Proteins 0.000 description 1
- 102000009120 alpha Subunit Hypoxia-Inducible Factor 1 Human genes 0.000 description 1
- 150000001412 amines Chemical class 0.000 description 1
- 125000000539 amino acid group Chemical group 0.000 description 1
- 230000003698 anagen phase Effects 0.000 description 1
- 108010080146 androgen receptors Proteins 0.000 description 1
- 230000000890 antigenic effect Effects 0.000 description 1
- 230000006907 apoptotic process Effects 0.000 description 1
- 208000022362 bacterial infectious disease Diseases 0.000 description 1
- 230000000035 biogenic effect Effects 0.000 description 1
- 239000002981 blocking agent Substances 0.000 description 1
- 239000010836 blood and blood product Substances 0.000 description 1
- 230000036765 blood level Effects 0.000 description 1
- 229940125691 blood product Drugs 0.000 description 1
- 238000009534 blood test Methods 0.000 description 1
- 210000000988 bone and bone Anatomy 0.000 description 1
- 238000007469 bone scintigraphy Methods 0.000 description 1
- 210000000481 breast Anatomy 0.000 description 1
- 238000010805 cDNA synthesis kit Methods 0.000 description 1
- 238000004364 calculation method Methods 0.000 description 1
- 239000000969 carrier Substances 0.000 description 1
- 238000004113 cell culture Methods 0.000 description 1
- 230000022131 cell cycle Effects 0.000 description 1
- 230000010261 cell growth Effects 0.000 description 1
- 229920002678 cellulose Polymers 0.000 description 1
- 229920002301 cellulose acetate Polymers 0.000 description 1
- 238000002512 chemotherapy Methods 0.000 description 1
- 210000003483 chromatin Anatomy 0.000 description 1
- 208000013507 chronic prostatitis Diseases 0.000 description 1
- 230000000295 complement effect Effects 0.000 description 1
- 238000011217 control strategy Methods 0.000 description 1
- XUJNEKJLAYXESH-UHFFFAOYSA-N cysteine Natural products SCC(N)C(O)=O XUJNEKJLAYXESH-UHFFFAOYSA-N 0.000 description 1
- 235000018417 cysteine Nutrition 0.000 description 1
- 230000002380 cytological effect Effects 0.000 description 1
- 239000005547 deoxyribonucleotide Substances 0.000 description 1
- 125000002637 deoxyribonucleotide group Chemical group 0.000 description 1
- 230000002074 deregulated effect Effects 0.000 description 1
- 238000011161 development Methods 0.000 description 1
- 230000018109 developmental process Effects 0.000 description 1
- 239000000104 diagnostic biomarker Substances 0.000 description 1
- 230000009274 differential gene expression Effects 0.000 description 1
- 238000010790 dilution Methods 0.000 description 1
- 239000012895 dilution Substances 0.000 description 1
- 238000002224 dissection Methods 0.000 description 1
- 239000000975 dye Substances 0.000 description 1
- 230000000694 effects Effects 0.000 description 1
- 230000002124 endocrine Effects 0.000 description 1
- 230000007613 environmental effect Effects 0.000 description 1
- 238000011156 evaluation Methods 0.000 description 1
- 230000001747 exhibiting effect Effects 0.000 description 1
- 238000002474 experimental method Methods 0.000 description 1
- 239000000284 extract Substances 0.000 description 1
- 238000001917 fluorescence detection Methods 0.000 description 1
- 239000000499 gel Substances 0.000 description 1
- 238000001502 gel electrophoresis Methods 0.000 description 1
- 238000011223 gene expression profiling Methods 0.000 description 1
- 210000004907 gland Anatomy 0.000 description 1
- 108020004445 glyceraldehyde-3-phosphate dehydrogenase Proteins 0.000 description 1
- XLXSAKCOAKORKW-AQJXLSMYSA-N gonadorelin Chemical compound C([C@@H](C(=O)NCC(=O)N[C@@H](CC(C)C)C(=O)N[C@@H](CCCNC(N)=N)C(=O)N1[C@@H](CCC1)C(=O)NCC(N)=O)NC(=O)[C@H](CO)NC(=O)[C@H](CC=1C2=CC=CC=C2NC=1)NC(=O)[C@H](CC=1N=CNC=1)NC(=O)[C@H]1NC(=O)CC1)C1=CC=C(O)C=C1 XLXSAKCOAKORKW-AQJXLSMYSA-N 0.000 description 1
- 229940035638 gonadotropin-releasing hormone Drugs 0.000 description 1
- 229960002913 goserelin Drugs 0.000 description 1
- 238000012203 high throughput assay Methods 0.000 description 1
- 230000003054 hormonal effect Effects 0.000 description 1
- 239000005556 hormone Substances 0.000 description 1
- 229940088597 hormone Drugs 0.000 description 1
- 206010020718 hyperplasia Diseases 0.000 description 1
- 102000018358 immunoglobulin Human genes 0.000 description 1
- 201000001881 impotence Diseases 0.000 description 1
- 230000001976 improved effect Effects 0.000 description 1
- 238000007901 in situ hybridization Methods 0.000 description 1
- 230000004054 inflammatory process Effects 0.000 description 1
- 230000010354 integration Effects 0.000 description 1
- 238000009830 intercalation Methods 0.000 description 1
- 210000000936 intestine Anatomy 0.000 description 1
- 208000024312 invasive carcinoma Diseases 0.000 description 1
- 238000002955 isolation Methods 0.000 description 1
- 231100000518 lethal Toxicity 0.000 description 1
- 230000001665 lethal effect Effects 0.000 description 1
- 231100000225 lethality Toxicity 0.000 description 1
- GFIJNRVAKGFPGQ-LIJARHBVSA-N leuprolide Chemical compound CCNC(=O)[C@@H]1CCCN1C(=O)[C@H](CCCNC(N)=N)NC(=O)[C@H](CC(C)C)NC(=O)[C@@H](CC(C)C)NC(=O)[C@@H](NC(=O)[C@H](CO)NC(=O)[C@H](CC=1C2=CC=CC=C2NC=1)NC(=O)[C@H](CC=1N=CNC=1)NC(=O)[C@H]1NC(=O)CC1)CC1=CC=C(O)C=C1 GFIJNRVAKGFPGQ-LIJARHBVSA-N 0.000 description 1
- 229960004338 leuprorelin Drugs 0.000 description 1
- 201000005249 lung adenocarcinoma Diseases 0.000 description 1
- 201000005202 lung cancer Diseases 0.000 description 1
- 208000020816 lung neoplasm Diseases 0.000 description 1
- 230000036210 malignancy Effects 0.000 description 1
- 238000005259 measurement Methods 0.000 description 1
- 230000005184 men's health Effects 0.000 description 1
- 230000004060 metabolic process Effects 0.000 description 1
- 239000002207 metabolite Substances 0.000 description 1
- 230000001394 metastastic effect Effects 0.000 description 1
- 208000010658 metastatic prostate carcinoma Diseases 0.000 description 1
- ONCZDRURRATYFI-QTCHDTBASA-N methyl (2z)-2-methoxyimino-2-[2-[[(e)-1-[3-(trifluoromethyl)phenyl]ethylideneamino]oxymethyl]phenyl]acetate Chemical compound CO\N=C(/C(=O)OC)C1=CC=CC=C1CO\N=C(/C)C1=CC=CC(C(F)(F)F)=C1 ONCZDRURRATYFI-QTCHDTBASA-N 0.000 description 1
- 230000000813 microbial effect Effects 0.000 description 1
- 238000007431 microscopic evaluation Methods 0.000 description 1
- 238000000386 microscopy Methods 0.000 description 1
- 230000000869 mutational effect Effects 0.000 description 1
- BTCFFMPDIBWZLF-UHFFFAOYSA-N n-(5-aminopyridin-2-yl)-4-(trifluoromethyl)benzamide Chemical compound N1=CC(N)=CC=C1NC(=O)C1=CC=C(C(F)(F)F)C=C1 BTCFFMPDIBWZLF-UHFFFAOYSA-N 0.000 description 1
- 210000000653 nervous system Anatomy 0.000 description 1
- 230000007935 neutral effect Effects 0.000 description 1
- 229920001220 nitrocellulos Polymers 0.000 description 1
- 210000003924 normoblast Anatomy 0.000 description 1
- 229920001778 nylon Polymers 0.000 description 1
- 210000000056 organ Anatomy 0.000 description 1
- 239000003960 organic solvent Substances 0.000 description 1
- 210000000496 pancreas Anatomy 0.000 description 1
- 210000003134 paneth cell Anatomy 0.000 description 1
- 230000001575 pathological effect Effects 0.000 description 1
- 230000037361 pathway Effects 0.000 description 1
- 239000000813 peptide hormone Substances 0.000 description 1
- 230000000144 pharmacologic effect Effects 0.000 description 1
- 239000012071 phase Substances 0.000 description 1
- 102000020233 phosphotransferase Human genes 0.000 description 1
- 230000004962 physiological condition Effects 0.000 description 1
- 210000003635 pituitary gland Anatomy 0.000 description 1
- 229920000515 polycarbonate Polymers 0.000 description 1
- 239000004417 polycarbonate Substances 0.000 description 1
- 229920000728 polyester Polymers 0.000 description 1
- 229920000642 polymer Polymers 0.000 description 1
- 229920002981 polyvinylidene fluoride Polymers 0.000 description 1
- 238000012545 processing Methods 0.000 description 1
- 230000002250 progressing effect Effects 0.000 description 1
- 230000000750 progressive effect Effects 0.000 description 1
- 108060006633 protein kinase Proteins 0.000 description 1
- 230000009430 psychological distress Effects 0.000 description 1
- JFINOWIINSTUNY-UHFFFAOYSA-N pyrrolidin-3-ylmethanesulfonamide Chemical compound NS(=O)(=O)CC1CCNC1 JFINOWIINSTUNY-UHFFFAOYSA-N 0.000 description 1
- 230000008707 rearrangement Effects 0.000 description 1
- 230000004044 response Effects 0.000 description 1
- 230000003938 response to stress Effects 0.000 description 1
- 230000004043 responsiveness Effects 0.000 description 1
- 229930002330 retinoic acid Natural products 0.000 description 1
- 230000002441 reversible effect Effects 0.000 description 1
- 238000012552 review Methods 0.000 description 1
- 239000002336 ribonucleotide Substances 0.000 description 1
- 125000002652 ribonucleotide group Chemical group 0.000 description 1
- 210000003296 saliva Anatomy 0.000 description 1
- 210000003079 salivary gland Anatomy 0.000 description 1
- 150000003839 salts Chemical class 0.000 description 1
- 210000004739 secretory vesicle Anatomy 0.000 description 1
- 238000004062 sedimentation Methods 0.000 description 1
- 230000011664 signaling Effects 0.000 description 1
- 210000002460 smooth muscle Anatomy 0.000 description 1
- 239000007787 solid Substances 0.000 description 1
- 239000007790 solid phase Substances 0.000 description 1
- 238000007619 statistical method Methods 0.000 description 1
- 239000008223 sterile water Substances 0.000 description 1
- 230000035882 stress Effects 0.000 description 1
- 230000004083 survival effect Effects 0.000 description 1
- ZRKFYGHZFMAOKI-QMGMOQQFSA-N tgfbeta Chemical compound C([C@H](NC(=O)[C@H](C(C)C)NC(=O)CNC(=O)[C@H](CCC(O)=O)NC(=O)[C@H](CCCNC(N)=N)NC(=O)[C@H](CC(N)=O)NC(=O)[C@H](CC(C)C)NC(=O)[C@H]([C@@H](C)O)NC(=O)[C@H](CCC(O)=O)NC(=O)[C@H]([C@@H](C)O)NC(=O)[C@H](CC(C)C)NC(=O)CNC(=O)[C@H](C)NC(=O)[C@H](CO)NC(=O)[C@H](CCC(N)=O)NC(=O)[C@@H](NC(=O)[C@H](C)NC(=O)[C@H](C)NC(=O)[C@@H](NC(=O)[C@H](CC(C)C)NC(=O)[C@@H](N)CCSC)C(C)C)[C@@H](C)CC)C(=O)N[C@@H]([C@@H](C)O)C(=O)N[C@@H](C(C)C)C(=O)N[C@@H](CC=1C=CC=CC=1)C(=O)N[C@@H](C)C(=O)N1[C@@H](CCC1)C(=O)N[C@@H]([C@@H](C)O)C(=O)N[C@@H](CC(N)=O)C(=O)N[C@@H](CCC(O)=O)C(=O)N[C@@H](C)C(=O)N[C@@H](CC=1C=CC=CC=1)C(=O)N[C@@H](CCCNC(N)=N)C(=O)N[C@@H](C)C(=O)N[C@@H](CC(C)C)C(=O)N1[C@@H](CCC1)C(=O)N1[C@@H](CCC1)C(=O)N[C@@H](CCCNC(N)=N)C(=O)N[C@@H](CCC(O)=O)C(=O)N[C@@H](CCCNC(N)=N)C(=O)N[C@@H](CO)C(=O)N[C@@H](CCCNC(N)=N)C(=O)N[C@@H](CC(C)C)C(=O)N[C@@H](CC(C)C)C(O)=O)C1=CC=C(O)C=C1 ZRKFYGHZFMAOKI-QMGMOQQFSA-N 0.000 description 1
- 230000001225 therapeutic effect Effects 0.000 description 1
- 230000002103 transcriptional effect Effects 0.000 description 1
- 238000012546 transfer Methods 0.000 description 1
- 230000009466 transformation Effects 0.000 description 1
- 229960001727 tretinoin Drugs 0.000 description 1
- 108700026220 vif Genes Proteins 0.000 description 1
- 230000003612 virological effect Effects 0.000 description 1
- 238000012800 visualization Methods 0.000 description 1
- 239000011701 zinc Substances 0.000 description 1
- 229910052725 zinc Inorganic materials 0.000 description 1
Images
Classifications
-
- C—CHEMISTRY; METALLURGY
- C12—BIOCHEMISTRY; BEER; SPIRITS; WINE; VINEGAR; MICROBIOLOGY; ENZYMOLOGY; MUTATION OR GENETIC ENGINEERING
- C12Q—MEASURING OR TESTING PROCESSES INVOLVING ENZYMES, NUCLEIC ACIDS OR MICROORGANISMS; COMPOSITIONS OR TEST PAPERS THEREFOR; PROCESSES OF PREPARING SUCH COMPOSITIONS; CONDITION-RESPONSIVE CONTROL IN MICROBIOLOGICAL OR ENZYMOLOGICAL PROCESSES
- C12Q1/00—Measuring or testing processes involving enzymes, nucleic acids or microorganisms; Compositions therefor; Processes of preparing such compositions
- C12Q1/68—Measuring or testing processes involving enzymes, nucleic acids or microorganisms; Compositions therefor; Processes of preparing such compositions involving nucleic acids
- C12Q1/6876—Nucleic acid products used in the analysis of nucleic acids, e.g. primers or probes
- C12Q1/6883—Nucleic acid products used in the analysis of nucleic acids, e.g. primers or probes for diseases caused by alterations of genetic material
- C12Q1/6886—Nucleic acid products used in the analysis of nucleic acids, e.g. primers or probes for diseases caused by alterations of genetic material for cancer
-
- C—CHEMISTRY; METALLURGY
- C12—BIOCHEMISTRY; BEER; SPIRITS; WINE; VINEGAR; MICROBIOLOGY; ENZYMOLOGY; MUTATION OR GENETIC ENGINEERING
- C12Q—MEASURING OR TESTING PROCESSES INVOLVING ENZYMES, NUCLEIC ACIDS OR MICROORGANISMS; COMPOSITIONS OR TEST PAPERS THEREFOR; PROCESSES OF PREPARING SUCH COMPOSITIONS; CONDITION-RESPONSIVE CONTROL IN MICROBIOLOGICAL OR ENZYMOLOGICAL PROCESSES
- C12Q1/00—Measuring or testing processes involving enzymes, nucleic acids or microorganisms; Compositions therefor; Processes of preparing such compositions
- C12Q1/68—Measuring or testing processes involving enzymes, nucleic acids or microorganisms; Compositions therefor; Processes of preparing such compositions involving nucleic acids
- C12Q1/6809—Methods for determination or identification of nucleic acids involving differential detection
-
- C—CHEMISTRY; METALLURGY
- C12—BIOCHEMISTRY; BEER; SPIRITS; WINE; VINEGAR; MICROBIOLOGY; ENZYMOLOGY; MUTATION OR GENETIC ENGINEERING
- C12Q—MEASURING OR TESTING PROCESSES INVOLVING ENZYMES, NUCLEIC ACIDS OR MICROORGANISMS; COMPOSITIONS OR TEST PAPERS THEREFOR; PROCESSES OF PREPARING SUCH COMPOSITIONS; CONDITION-RESPONSIVE CONTROL IN MICROBIOLOGICAL OR ENZYMOLOGICAL PROCESSES
- C12Q2600/00—Oligonucleotides characterized by their use
- C12Q2600/158—Expression markers
Definitions
- the present disclosure relates to methods and compositions for diagnosing and defining the staging or progress of disorders such as prostate cancer.
- PSA prostate specific antigen
- a blood serum level of around 4 ng per ml of PSA is considered indicative of prostate cancer, while a PSA level of 10 ng per ml or higher is considered highly suggestive of prostate cancer.
- the PSA blood test is not used in isolation when checking for prostate cancer; a digital rectal examination (DRE) is usually also performed. If the results of the PSA test or the DRE are abnormal, a biopsy is generally performed in which small samples of tissue are removed from the prostate and examined. If the results are positive for prostate cancer, further tests may be needed to determine the stage of progression of the cancer, such as a bone scan, a computed tomography (CT) scan or a pelvic lymph node dissection.
- CT computed tomography
- PSA test has a good sensitivity (80%), it suffers from a false positive rate that approaches 75%. For example, it has been estimated that for PSA values of 4-10 ng/ml, only one true diagnosis of prostate cancer was found in approximately four biopsies performed ( Catalona et al. J. Urol. 151(5):1283-90, 1994 ). Tests that measure the ratio of free to total (i.e., free plus bound) PSA do not have significantly greater specificity or sensitivity than the standard PSA test.
- control strategies may involve surgery to remove the prostate gland if identified before metastasis, radiation to destroy cancer cells within the prostate and drug-based testosterone repression, generally referred to as androgen depletion therapy. These various treatments may bring about cures in some instances, or slow the time to death. However, for those with the most virulent forms of prostate cancer, the cancer will usually recur after surgery or radiation therapy and progress to resistance to androgen depletion therapy, with death a frequent outcome.
- Adenocarcinoma is a cancer of epithelial cells in the prostate gland and accounts for approximately 95% of prostate cancers.
- Neuroendocrine cancers may arise from cells of the endocrine (hormonal) and nervous systems of the prostate gland and account for approximately 5% of prostate cancers.
- Neuroendocrine cells have common features such as special secretory granules, produce biogenic amines and polypeptide hormones, and are most common in the intestine, lung, salivary gland, pituitary gland, pancreas, liver, breast and prostate.
- Neuroendocrine cells co-proliferate with malignant adenocarcinomas and secrete factors which appear to stimulate adenocarcinoma cell growth.
- Neuroendocrine cancers are rarer, and are considered non-PSA secreting and androgen-independent for their growth.
- Benign prostate hypertrophy (BPH), a non-malignant growth of epithelial cells, and prostatitis are diseases of the prostate that are usually caused by an infection of the prostate gland. Both BPH and prostatitis are common in men over 50 and can result in increased PSA levels. Incidence rates increase from 3 cases per 1000 man-years at age 45-49 years, to 38 cases per 1000 man-years by the age of 75-79 years. Whereas the prevalence rate is 2.7% for men aged 45-49, it increases to at least 24% by the age of 80 years. While prostate cancer results from the deregulated proliferation of epithelial cells, BPH commonly results from proliferation of normal epithelial cells and frequently does not lead to malignancy ( Ziada et al.
- Urology 53(3 Suppl 3D): 1-6 Bacterial infection of the prostate can be demonstrated in only about 10% of men with symptoms of chronic prostatitis/chronic pelvic pain syndrome. Bacteria able to be cultured from patients suffering chronic bacterial prostatitis are mainly Gram-negative uropathogens. The role of Gram-positives, such as staphylococci and enterococci, and atypicals, such as chlamydia, ureaplasmas, mycoplasmas, are still debatable.
- PIN prostate intraepithelial neoplasia
- prostate cancer The phenotype of prostate cancer varies from one patient to another. More specifically, in different individuals prostate cancers display heterogeneous cellular morphologies, growth rates, responsiveness to androgens and pharmacological blocking agents for androgens, and varying metastatic potential. Each prostate cancer has its own unique progression involving multiple steps, including progression from localized carcinoma to invasive carcinoma to metastasis. The progression of prostate cancer likely proceeds, as seen for other cancers, via events that include the loss of function of cell regulators such as cancer suppressors, cell cycle and apoptosis regulators, proteins involved in metabolism and stress response, and metastasis related molecules ( Abate-Shen et al. Polypeptides Dev. 14(19):2410-34, 2000 ; Ciocca et al. Cell Stress Chaperones 10(2):86-103, 2005 ).
- cell regulators such as cancer suppressors, cell cycle and apoptosis regulators, proteins involved in metabolism and stress response, and metastasis related molecules
- prostate cancer is the most prevalent form of cancer and the second most common cause of cancer death in New Zealand, Australian and North American males ( Jemal et al. CA Cancer J. Clin., 57(1):43-66, 2007 ).
- Treatment options for more aggressive cancers are invasive and include radical prostatectomy and/or radiation therapy. Androgen-depletion therapy, for example using gonadotropin-releasing hormone agonists (e.g., leuprolide, goserelin, etc.), is designed to reduce the amount of testosterone that enters the prostate gland and is used in patients with metastatic disease, some patients who have a rising PSA and choose not to have surgery or radiation, and some patients with a rising PSA after surgery or radiation. Treatment options usually depend on the stage of the prostate cancer.
- gonadotropin-releasing hormone agonists e.g., leuprolide, goserelin, etc.
- Men with a 10-year life expectancy or less, who have a low Gleason score from a biopsy and whose cancer has not spread beyond the prostate are often not treated. Younger men with a low Gleason score and a prostate-restricted cancer may enter a phase of "watchful waiting" in which treatment is withheld until signs of progression are identified. However, these prognostic indicators do not accurately predict clinical outcome for individual patients.
- FFPE formalin fixed paraffin embedded
- RNA-seq is a technique based on enumeration of RNA transcripts using next-generation sequencing methodologies.
- these studies have also shown few consensus genes, ( Aryee et al. Sci Transl Med 5, 169ra10, 2013 ; Chandran et al. BMC Cancer, 5:1471-2407 2005 ; Pflueger et al. Genome Res. 21:56-67, 2011 ; Prensner et al. Nature Biotechnology 29:742-749, 2011 ; Shancheng Ren et al. Cell Research 22:806-821, 2012 ).
- TMPRSS2-ERG fusions appear commonly in prostate cancers and have been shown to be prevalent in more aggressive cancers ( Attard et al., Oncogene 27:253-63, 2008 ; Barwick et al. Br. J. Cancer 102:570-576, 2010 ; Demichelis et al., Oncogene 26:4596-9, 2007 ; Nam et al., Br. J. Cancer 97:1690-5, 2007 ). Transcriptional modulation of TMPRSS2-ERG fusions has been shown to be associated with prostate cancer biomarkers and TGF-beta signalling ( Brase et al., BMC Cancer 11:507 doi: 10.1186/1471, 2011 ).
- Gene expression is the transcription of DNA into messenger RNA by RNA polymerase.
- Up-regulation describes a gene which has been observed to have higher expression (higher RNA levels) in one sample (for example, from cancer tissue) compared to another (usually healthy tissue from a control sample).
- Down-regulation describes a gene which has been observed to have lower expression (lower RNA levels) in one sample (for example, from cancer tissue) compared to another (usually healthy tissue from a control sample).
- RNA abundance A common technology used for measuring RNA abundance is RT-qPCR where reverse transcription (RT) is followed by real-time quantitative PCR (qPCR).
- Reverse transcription first generates a DNA template from the RNA. This single-stranded template is called cDNA.
- the cDNA template is then amplified in the quantitative step, during which the fluorescence emitted by labeled hybridization probes or intercalating dyes changes as the DNA amplification process progresses.
- Quantitative PCR produces a measurement of an increase or decrease in copies of the original RNA and has been used to attempt to define changes of gene expression in cancer tissue as compared to comparable healthy tissues ( Nolan T, et al. Nat Protoc 1:1559-1582, 2006 ; Paik S. The Oncologist 12:631-635, 2007 ; Costa C, et al. Transl Lung Cancer Research 2:87-91, 2013 ).
- RNA-seq Massive parallel sequencing made possible by next generation sequencing (NGS) technologies is another way to approach the enumeration of RNA transcripts in a tissue sample and RNA-seq is a method that utilizes this. It is currently the most powerful analytical tool used for transcriptome analyses, including gene expression level difference between different physiological conditions, or changes that occur during development or over the course of disease progression. Specifically, RNA-seq can be used to study phenomena such as gene expression changes, alternative splicing events, allele-specific gene expression, and chimeric transcripts, including gene fusion events, novel transcripts and RNA editing.
- WO2010/115154 discloses amplification methods in which target nucleotide sequences are labeleld with tags and barcode nucleotide sequences to allow rapid identification of the target nucleic acids in a plurality of samples.
- Levin et al (Genome Biology, vol 10, issue 10, Article R115 ) discloses a targeted RNA-sequencing method allowing further analysis of a specific subset of a transcriptome such as cancer-related genes for mutations, structural alterations and expression levels.
- biomarkers are preferable to using a single biomarker because of the following:
- RT-qPCR is a time consuming technique as expression differences are determined for a single gene at a time, which does not allow multiple biomarkers to be compared/assessed at one time.
- RT-qPCR does not allow the accurate detection of down-regulated genes because it is limited in its fluorescence detection range, compared to NGS based methods. This causes genes that are at a low and/or high abundance to be problematic. Very often these transcripts, for which differential expression is difficult to measure, are the ones with the most diagnostic and/or progonostic value. RT-PCR does not allow multiplexing which causes a rise in cost per RNA biomarker, and hence the overall cost of the diagnostic test.
- the present invention provides methods for determining the presence and progression of a disorder in a subject.
- Such methods employ modified RNA-seq techniques to determine the relative frequency of one or more RNA biomarkers (also referred to as gene transcript biomarkers) specific for the disorder in the subject compared to that in healthy controls. Determination of the relative frequency of expression levels of specific combinations of RNA biomarkers using the methods disclosed herein can also be used to determine the type and/or stage of a disorder, and to monitor the progression of a disorder and/or the effectiveness of treatment.
- Disorders that can be diagnosed and monitored using the methods disclosed herein include, but are not limited to, cancers, such as prostate and breast cancers.
- Multiplexing is a process wherein oligonucleotides specific for multiple biomarkers are amplified together to produce a pool of amplicons.
- the advantages of multiplexing are that it allows simultaneous testing of multiple RNA biomarkers in one or a small number of tubes, which in turn:
- the disclosed methods employ oligonucleotides specific for RNA biomarkers known to be associated with the presence and/or progression of a disorder, such as prostate cancer, at specific steps of a RNA-seq protocol to selectively identify cDNAs for the RNA biomarkers, and compare their relative frequency of expression between prostate cancer donors and healthy donors, as well as defining differences in expression between different stages of the disorder.
- RNA-seq methodologies the actual frequency of expression of each transcript is determined for the whole genome. These frequencies can be biased by differences in the efficiency of the cDNA production and subsequent PCR amplification steps for each transcript.
- the inventors believe that the methods disclosed herein avoid these biases by determining the relative, rather than actual, frequency of expression of RNA biomarkers. The biases are not relevant as long as they are neutral with respect to the comparisons made.
- the relative changes in frequency of expression of RNA biomarkers specific for prostate cancer allows detection of prostate cancers, distinguishing prostate cancers from benign prostate hypertrophy (BPH) and prostatitis, and detection of prostate cancers in asymptomatic men whose prostate cancer may produce low levels of PSA with high sensitivity and specificity.
- BPH benign prostate hypertrophy
- the disclosed methods determine changes in frequency of expression of RNA biomarkers in order to distinguish between indolent cancers, which have a low likelihood of progressing to a lethal disease, and more aggressive forms of prostate cancer which are life threatening and require treatment.
- the present disclosure provides methods for detecting the presence of a disorder in a subject, comprising: (a) determining the relative frequency of expression of at least one RNA biomarker in a biological sample obtained from the subject using RNA sequencing; and (b) comparing the relative frequency of expression of the at least one RNA biomarker in the biological sample with a predetermined threshold value, wherein increased or decreased relative frequency of expression of the at least one RNA biomarker in the biological sample indicates the presence of the disorder in the subject.
- the disclosed methods comprise: (a) determining the relative frequency of expression of a plurality of RNA biomarkers in the biological sample; and (b) comparing the relative frequency of expression of the plurality of RNA biomarkers in the biological sample with predetermined threshold values, wherein increased or decreased relative frequency of expression of at least two or more of the RNA biomarkers in the biological sample indicates the presence of the disorder in the subject.
- the relative frequency of expression of at least one RNA biomarker is determined by: (a) isolating total RNA from the biological sample; (b) generating first strand cDNA from the total RNA using a first oligonucleotide primer specific for the at least one RNA biomarker; (c) synthesizing second strand cDNA to provide double-stranded cDNA (dsDNA); (d) addingat least one sequencing adapter to the double-stranded cDNA; (e) amplifying the double-stranded cDNA to provide a cDNA library from the double-stranded cDNA; and (f) sequencing the cDNA library and determining the relative frequency of expression of the at least one RNA biomarker.
- such methods also comprise: (i) removing rRNA from the total RNA prior to step (b); (ii) end repairing the double stranded cDNA and adding an overhanging adenine (A) base to the 3' end of the double stranded cDNA after step (c) and prior to step (d); and/or (iii) purifying and, optionally, size selecting the cDNA in the cDNA library after step (e) and prior to step (f).
- such methods further comprise the option of synthesizing cDNA by polymerase chain reaction (PCR) using an oligonucleotide primer pair specific for the at least RNA biomarker after step (b) and prior to step (d) or by the standard methods.
- PCR polymerase chain reaction
- one of the oligonucleotides in the primer pair will be the same as the oligonucleotide primer used in the generation of the first strand cDNA.
- the relative frequency of expression of the at least one RNA biomarker is determined by: (a) isolating total RNA from a biological sample; (b) generating first strand cDNA from the total RNA; (c) amplifying cDNA by polymerase chain reaction using an oligonucleotide primer pair specific for the at least one RNA biomarker to provide amplified double-stranded cDNA; (d) adding at least one sequencing adapter to the amplified double-stranded cDNA; (e) further amplifying the amplified double-stranded cDNA using primers specific for the at least one sequencing adapter to provide a cDNA library; and (f) sequencing the cDNA library and determining the relative frequency of expression of the at least one RNA biomarker.
- such methods also comprise: (i) removing rRNA from the total RNA prior to step (b); (ii) end repairing the double stranded cDNA and adding an overhanging adenine (A) base to the 3' end of the double stranded cDNA after step (c) and prior to step (d); and/or (iii) purifying and, optionally, size selecting the cDNA in the cDNA library after step (e) and prior to step (f).
- the disclosed methods comprise determining the expression level of multiple RNA biomarkers corresponding to polynucleotide biomarkers selected from the group consisting of those listed in Tables 1, 2 and 3.
- Oligonucleotide primers that can be employed in the methods disclosed herein include, but are not limited to, those provided in SEQ ID NO: 76-232 and 293-326.
- the methods disclosed herein include detecting the relative frequency of expression of a RNA biomarker comprising an RNA sequence that corresponds to a DNA sequence of SEQ ID NO: 1-75 and 235-287 or a variant thereof, as defined herein.
- RNA sequences for the disclosed RNA biomarkers are identical to the cDNA sequences disclosed herein except for the substitution of thymine (T) residues with uracil (U) residues.
- the present disclosure provides an oligonucleotide primer comprising, or consisting of, a sequence selected from the group consisting of SEQ ID NO: 76-232 and 293-326, and variants thereof.
- the disclosure relates to oligonucleotide primers that have a length equal to or less than 30 nucleotides.
- the disclosed oligonucleotide primers can be effectively employed in methods for diagnosing the presence of, and/or monitoring the progression of, prostate cancer using methods well known to those of skill in the art, including quantitative real time PCR or small scale oligonucleotide microarrays.
- Biological samples that can be effectively employed in the disclosed methods include, but are not limited to, urine, blood, serum, cell lines, peripheral blood mononuclear cells (PBMCs), biopsy tissue and prostatectomy tissue.
- PBMCs peripheral blood mononuclear cells
- Fig. 1 shows four adaptations to conventional RNA-seq technology that are employed in the disclosed methods.
- biomarker refers to a molecule that is associated either quantitatively or qualitatively with a biological change.
- biomarkers include polypeptides, proteins, fragments of a polypeptide or protein; polynucleotides, such as a gene product, RNA or RNA fragment; and other body metabolites.
- RNA biomarker or “gene transcript biomarker” refers to an RNA molecule produced by transcription of a gene that is associated either quantitatively or qualitatively with a biological change.
- RNA sequence corresponding to a DNA sequence refers to a sequence that is identical to the DNA sequence except for the substitution of all thymine (T) residues with uracil (U) residues.
- oligonucleotide specific for a biomarker refers to an oligonucleotide that specifically hybridizes to a polynucleotide biomarker or a polynucleotide encoding a polypeptide biomarker, and that does not significantly hybridize to unrelated polynucleotides.
- the oligonucleotide hybridizes to a gene, a gene fragment or a gene transcript.
- the oligonucleotide hybridizes to the polynucleotide of interest under stringent conditions, such as, but not limited to, prewashing in a solution of 6X SSC, 0.2% SDS; hybridizing at 65°C, 6X SSC, 0.2% SDS overnight; followed by two washes of 30 minutes each in 1X SSC, 0.1% SDS at 65°C and two washes of 30 minutes each in 0.2X SSC, 0.1% SDS at 65°C.
- stringent conditions such as, but not limited to, prewashing in a solution of 6X SSC, 0.2% SDS; hybridizing at 65°C, 6X SSC, 0.2% SDS overnight; followed by two washes of 30 minutes each in 1X SSC, 0.1% SDS at 65°C and two washes of 30 minutes each in 0.2X SSC, 0.1% SDS at 65°C.
- oligonucleotide primer pair refers to a pair of oligonucleotide primers that span an intron in the cognate RNA biomarker.
- polynucleotide(s), refers to a single or double-stranded polymer of deoxyribonucleotide or ribonucleotide bases and includes DNA and corresponding RNA molecules, including hnRNA, mRNA, and non-coding RNA, molecules, both sense and anti-sense strands, and includes cDNA, genomic DNA and recombinant DNA, as well as wholly or partially synthesized polynucleotides.
- An hnRNA molecule contains introns and corresponds to a DNA molecule in a generally one-to-one manner.
- An mRNA molecule corresponds to an hnRNA and DNA molecule from which the introns have been excised.
- a non-coding RNA is a functional RNA molecule that is not translated into a protein, although in some circumstances non-coding RNA can be coding and vice a versa.
- the term “subject” refers to a mammal, preferably a human, who may or may not have a disorder, such as prostate cancer.
- a disorder such as prostate cancer.
- the terms “subject” and “patient” are used interchangeably herein in reference to a human subject.
- the term "healthy subject” refers to a subject who is not inflicted with a disorder of interest.
- the term "healthy male” refers to a male who has an undetectable PSA level in serum or non-rising PSA levels up to 1ng/ml, no evidence of prostate gland abnormality following a DRE and no clinical symptoms of prostatic disorders.
- asymptomatic male refers to a male who has a PSA level in serum of greater than 4ng/ml, which is considered indicative of prostate cancer, but whose DRE is inconclusive and who has no symptoms of clinical disease.
- BPH benign prostate hypertrophy
- prostatitis refers to another prostatic disease of the prostate, usually due to a microbial infection of the prostate gland. Both BPH and prostatitis can result in increased PSA levels.
- biopsy tissue refers to a sample of tissue (e.g., prostate tissue) that is removed from a subject for the purpose of determining if the sample contains cancerous tissue. The biopsy tissue is then examined (e.g., by microscopy) for the presence or absence of cancer.
- prostatectomy refers to the surgical removal of the prostate gland.
- sample is used herein in its broadest sense to include a sample, specimen or culture obtained from any source.
- Biological samples include blood products (such as plasma, serum and whole blood), urine, saliva and the like.
- Biological samples also include tissue samples, such as biopsy tissues or pathological tissues, that have previously been fixed (e.g., formalin, snap frozen, cytological processing, etc.).
- predetermined threshold value of expression of a RNA biomarker refers to the level of expression of the same RNA biomarker in a corresponding control/normal sample or group of control/normal samples obtained from normal, or healthy, subjects, e.g. from males who do not have prostate cancer.
- altered frequency of expression of a RNA biomarker in a test biological sample refers to a frequency that is either below or above the predetermined threshold value of expression for the same RNA biomarker in a control sample and thus encompasses either high (increased) or low (decreased) expression levels.
- the term "relative frequency of expression” refers to the frequency of expression of a RNA biomarker in a test biological sample relative to the frequency of expression of the same RNA biomarker in a corresponding control/normal sample or group of control/normal samples obtained from normal, or healthy, subjects, (e.g., from males who do not have prostate cancer).
- the frequency of expression of the RNA biomarker is also normalized to the frequency of an internal reference transcript.
- prognosis or “providing a prognosis” for a disorder, such as prostate cancer, refers to providing information regarding the likely impact of the presence of prostate cancer (e.g., as determined by the diagnostic methods) on a subject's future health (e.g., the risk of metastasis).
- RNA-seq is a relatively new technology that has been employed for mass sequencing of whole transcriptomes, and that offers significant advantages over other methods employed for transcriptome sequencing, such as microarrays, including low levels of background noise, the ability to detect low levels of expression, the ability to detect novel mutations and transcripts, and the ability to use relatively small amounts of RNA (for a review of RNA-seq, see Wang et al., Nat. Rev. Genet. (2009) 10:57-63 ).
- the disclosed methods employ oligonucleotides specific for one or more RNA biomarker in combination with RNA-seq technology to perform directed sequencing and thereby determine the relative frequency of expression of the RNA biomarker(s).
- Such methods have significant advantages over other technologies typically employed to determine expression levels of polynucleotide biomarkers, including improved accuracy, reproducibility and speed, the ability to easily determine the frequency of expression of a multitude of RNA biomarkers in a large number of samples at a relatively low cost, and the ability to identify novel mutations and transcripts.
- such methods use oligonucleotides specific for one or more biomarkers selected from those shown in Tables 1, 2 and 3.
- the disclosed methods comprise determining the relative frequency of expression levels of at least two, three, four, five, six, seven, eight, nine, ten or more RNA biomarkers selected from the group consisting of: SEQ ID NO: 76-223 and 293-326 in a biological sample taken from a subject, and comparing the relative frequency of expression levels with predetermined threshold values.
- the disclosed methods can be employed to diagnose the presence of prostate cancer in subjects with early stage prostate cancer; subjects who have had surgery to remove the prostate (radical prostatectomy); subjects who have had radiation treatment for prostate cancer; subjects who are undergoing, or have completed, androgen ablation therapy; subjects who have become resistant to hormone ablation therapy; and/or subjects who are undergoing, or have had, chemotherapy.
- the RNA biomarkers disclosed herein appear in subjects with prostate cancer at levels that are at least two-fold higher or lower than, or at least two standard deviations above or below, the mean level in normal, healthy individuals, or are at least two-fold higher or lower than, or at least two standard deviations above or below, a predetermined threshold of expression.
- biomarkers and oligonucleotides disclosed herein are isolated and purified, as those terms are commonly used in the art.
- the biomarkers and oligonucleotides are at least about 80% pure, more preferably at least about 90% pure, and most preferably at least about 99% pure.
- the oligonucleotides employed in the disclosed methods specifically hybridize to a variant of a polynucleotide biomarker disclosed herein.
- the term "variant” comprehends nucleotide or amino acid sequences different from the specifically identified sequences, wherein one or more nucleotides or amino acid residues is deleted, substituted, or added. Variants may be naturally occurring allelic variants, or non-naturally occurring variants. Variant sequences (polynucleotide or polypeptide) preferably exhibit at least 80%, 85%, 90%, 95%, 96%, 97%, 98% or 99% identity to a sequence disclosed herein. The percentage identity is determined by aligning the two sequences to be compared as described below, determining the number of identical residues in the aligned portion, dividing that number by the total number of residues in the inventive (queried) sequence, and multiplying the result by 100.
- variants of the disclosed biomarkers are preferably themselves expressed in subjects with prostate cancer at a frequency that are higher or lower than the levels of expression in normal, healthy individuals.
- Polypeptide and polynucleotide sequences may be aligned, and percentages of identical amino acids or nucleotides in a specified region may be determined against another polypeptide or polynucleotide sequence, using computer algorithms that are publicly available.
- the percentage identity of a polynucleotide or polypeptide sequence is determined by aligning polynucleotide and polypeptide sequences using appropriate algorithms, such as BLASTN or BLASTP, respectively, set to default parameters; identifying the number of identical nucleic or amino acids over the aligned portions; dividing the number of identical nucleic or amino acids by the total number of nucleic or amino acids of the polynucleotide or polypeptide of the present invention; and then multiplying by 100 to determine the percentage identity.
- Two exemplary algorithms for aligning and identifying the identity of polynucleotide sequences are the BLASTN and FASTA algorithms.
- the alignment and identity of polypeptide sequences may be examined using the BLASTP algorithm.
- BLASTX and FASTX algorithms compare nucleotide query sequences translated in all reading frames against polypeptide sequences.
- the FASTA and FASTX algorithms are described in Pearson and Lipman, Proc. Natl. Acad. Sci. USA 85:2444-2448, 1988 ; and in Pearson, Methods in Enzymol. 183:63-98, 1990 .
- the FASTA software package is available from the University of Virginia, Charlottesville, VA 22906-9025.
- the FASTA algorithm set to the default parameters described in the documentation and distributed with the algorithm, may be used in the determination of polynucleotide variants.
- the readme files for FASTA and FASTX Version 2.0x that are distributed with the algorithms describe the use of the algorithms and describe the default parameters.
- the BLASTN software is available on the NCBI anonymous FTP server and is available from the National Center for Biotechnology Information (NCBI), National Library of Medicine, Building 38A, Room 8N805, Bethesda, MD 20894.
- NCBI National Center for Biotechnology Information
- the use of the BLAST family of algorithms, including BLASTN is described at NCBI's website and in the publication of Altschul, et al., "Gapped BLAST and PSI-BLAST: a new generation of protein database search programs," Nucleic Acids Res. 25:3389-3402, 1997 .
- Variant sequences generally differ from the specifically identified sequence only by conservative substitutions, deletions or modifications.
- a "conservative substitution” is one in which an amino acid is substituted for another amino acid that has similar properties, such that one skilled in the art of peptide chemistry would expect the secondary structure and hydropathic nature of the polypeptide to be substantially unchanged.
- amino acids represent conservative changes: (1) ala, pro, gly, glu, asp, gln, asn, ser, thr; (2) cys, ser, tyr, thr; (3) val, ile, leu, met, ala, phe; (4) lys, arg, his; and (5) phe, tyr, trp, his.
- Variants may also, or alternatively, contain other modifications, including the deletion or addition of amino acids that have minimal influence on the antigenic properties, secondary structure and hydropathic nature of the polypeptide.
- a polypeptide may be conjugated to a signal (or leader) sequence at the N-terminal end of the protein which co-translationally or post-translationally directs transfer of the protein.
- the polypeptide may also be conjugated to a linker or other sequence for ease of synthesis, purification or identification of the polypeptide (e.g., poly-His), or to enhance binding of the polypeptide to a solid support.
- a polypeptide may be conjugated to an immunoglobulin Fc region.
- variant polypeptides are encoded by polynucleotide sequences that hybridize to a disclosed polynucleotide under stringent conditions.
- Stringent hybridization conditions for determining complementarity include salt conditions of less than about 1 M, more usually less than about 500 mM, and preferably less than about 200 mM.
- Hybridization temperatures can be as low as 5°C, but are generally greater than about 22°C, more preferably greater than about 30°C, and most preferably greater than about 37°C. Longer DNA fragments may require higher hybridization temperatures for specific hybridization. Since the stringency of hybridization may be affected by other factors such as probe composition, presence of organic solvents and extent of base mismatching, the combination of parameters is more important than the absolute measure of any one alone.
- stringent conditions is prewashing in a solution of 6X SSC, 0.2% SDS; hybridizing at 65°C, 6X SSC, 0.2% SDS overnight; followed by two washes of 30 minutes each in 1X SSC, 0.1% SDS at 65°C and two washes of 30 minutes each in 0.2X SSC, 0.1% SDS at 65°C.
- the expression levels of one or more RNA biomarkers in a biological sample can be determined, for example, using one or more oligonucleotides that are specific for the RNA biomarker.
- the expression level of one or more RNA biomarkers disclosed herein is determined by first collecting urine from a subject following DRE or prostate massage via a bicycle or exocycle. RNA is isolated from the urine sample, and the frequency of expression of the RNA biomarker is determined as described below using modified RNA-seq technology in combination with oligonucleotides specific for the RNA biomarker of interest.
- the levels of mRNA corresponding to a prostate cancer biomarker disclosed herein can be detected using oligonucleotides in Southern hybridizations, in situ hybridizations, or quantitative real-time PCR amplification (qRT-PCR).
- Solid phase substrates, or carriers, that can be effectively employed in such assays are well known to those of skill in the art and include, but are not limited to, microporous membranes constructed, for example, of nitrocellulose, nylon, polyvinylidene difluoride, polyester, cellulose acetate, mixed cellulose esters and polycarbonate. Suitable microporous membranes include, for example, those described in US Patent Application Publication no. US2010/0093557A1 . Methods for performing such assays are well known to those of skill in the art.
- oligonucleotides employed in the disclosed methods are generally single-stranded molecules, such as synthetic antisense molecules or cDNA fragments, and are, for example, 6-60 nt, 15-30 or 20-25 nt in length.
- Oligonucleotides specific for a polynucleotide, or RNA, biomarker disclosed herein are prepared using techniques well known to those of skill in the art.
- oligonucleotides can be designed using known computer algorithms to identify oligonucleotides of a defined length that are unique to the polynucleotide, have a GC content within a range suitable for hybridization, and lack predicted secondary structure that may interfere with hybridization.
- Oligonucleotides can be synthesized using methods well known to those in the art.
- the oligonucleotides employed in the disclosed methods and compositions are selected from the group consisting of: SEQ ID NO: 76-223 and 293-326.
- RNA expression levels For tests involving alterations in RNA expression levels, it is important to ensure adequate standardization. Accordingly, in tests such as the adapted RNA-seq technology disclosed herein, quantitative real time PCR or small scale oligonucleotide microarrays, at least one expression standard is employed. Expression standards that can be employed in such methods include, but are not limited to, those listed in Table 3 below.
- the present disclosure further provides methods employing a plurality of oligonucleotides that are specific for a plurality of the prostate cancer RNA biomarkers disclosed herein.
- the urine was decanted and the cell pellet resuspended in 1.8 ml of ice cold 1X PBS containing 2.5% Fetal Bovine Serum (Invitrogen).
- the cell suspension was transferred to a 2ml Eppendorf tube and the cellular material collected by centrifugation at 400g for 5 minutes at 4°C. The supernatant was removed (leaving around 50 ⁇ l) and the cell pellet resuspended in 1.8 ml of ice cold 1X PBS containing 2.5% Fetal Bovine Serum (Invitrogen).
- the cells were again collected by centrifugation at 400g for 5 minutes at 4°C. The supernatant was removed (leaving around 50 ⁇ l) and the cell pellet resuspended in 1.8 ml of ice cold 1X PBS containing 2.5% Fetal Bovine Serum (Invitrogen). The cells were collected by centrif ⁇ gation at 400g for 5 minutes at 4°C and all but 100 ⁇ l of the supernatant removed. The cells were resuspended in the remaining 100 ⁇ l of supernatant, and 8 ⁇ l was taken for microscopic analysis. A total of 300 ⁇ l of Trizol LS (Invitrogen) and 5 ⁇ g of E.
- cDNA was produced from approximately 1-1.5ug of total RNA from either cell lines, biopsy tissue or urine extracts using random primers for the production of the first strand cDNA using the SuperScript® VILOTM cDNA Synthesis Kit (Life Technologies) or RNA biomarker-specific primers.
- the cDNA preparations were stored at -80°C prior to use and then diluted 1/5 in sterile water prior to qRT-PCR.
- RNA biomarker specific primers were used to perform real time SYBR green PCR quantification from cell line-, biopsy- or urine-derived cDNA using the Roche Lightcycler 480 using standard protocols for determining the specificity and efficiency of the amplification.
- the relative amount of the marker gene in each of the samples tested was determined by comparing the cycle threshold (Ct value: number of PCR cycles required for the SYBR green fluorescent signal to cross the threshold exceeding background level within the exponential growth phase of the amplification curve).
- the amplicons were electrophoresed on a 2% agarose gel and sequenced with standard Sanger chemistry using an Applied Biosystems 3130x1 DNA sequencer.
- RNA-seq The relative frequency of expression of specific RNA biomarkers was determined using the isolated RNA in one or more of the four methods described below. Each of these methods includes at least one modification of conventional RNA-seq technologies. Conventional RNA-seq technologies are well known to those of skill in the art and are described, for example, in Wang et al. (Nat. Rev. Genet. (2009) 10:57-63 ), and Marguerat and Bahler (Cell. Mol. Life Sci. (2010) 67:569-579 ).
- sequence specific priming is employed during the generation of first strand cDNA.
- An optional first step in this method is to deplete the total RNA of rRNA using an industry-provided kit, if necessary.
- An industry-provided first strand cDNA kit is used to combine total RNA or rRNA-depleted total RNA with at least one strand specific oligonucleotide primer (i.e. an oligonucleotide primer specific for the RNA biomarker of interest) and generate first strand cDNA according to the manufacturer's protocol.
- Second strand cDNA is then synthesized in an unbiased manner using standard techniques.
- the resulting double-stranded cDNA is fragmented if necessary using standard methods, and the cDNA ends are repaired using standard methods in which any overhangs at the cDNA ends are converted into blunt ends using T4 DNA polymerase.
- An overhanging adenine (A) base is added to the 3' end of the blunt DNA fragments by the use of Klenow fragment to assist with ligation of adapters required for the sequencing process.
- the adapters are ligated to the ends of the cDNA fragments using standard procedures, and then the cDNA fragments are run on a gel for purification and removal of excess adapters.
- the cDNA is amplified using adapter primers, purified, denatured and further diluted for cluster generation and sequencing, for example on a HiSeq2000 according to Illumina Corporation's standard protocols (208 cycles sequencing program, paired-end with indexing).
- the cDNA library is sequenced, and the relative frequency of expression of the specific RNA biomarkers in cancer patients and healthy controls is determined.
- sequence specific priming is employed during the generation of first strand cDNA.
- This is achieved using an industry provided first strand cDNA kit and at least one strand specific oligonucleotide primer to generate first strand cDNA from total RNA (or rRNA depleted total RNA if necessary) according to the manufacturer's protocol.
- the second strand cDNA can either be prepared in an unbiased manner using standard techniques, or it can be directly amplified using a set of specific oligonucleotide primers (i.e. oligonucleotide primers specific for the RNA biomarkers of interest) to amplify a specific set of PCR amplicons by either primer limited or cycle limited PCR.
- the oligonucleotide primer employed to generate the first strand cDNA can be the same as one of the pair of oligonucleotide primers used to amplify the double-stranded cDNA.
- the cDNA is then purified via a cleanup procedure to remove excess PCR reagents.
- the cDNA is fragmented if necessary using standard methods, and the cDNA ends are repaired using standard methods in which any overhangs at the cDNA ends are converted into blunt ends using T4 DNA polymerase.
- An overhanging adenine (A) base is added to the 3' end of the blunt DNA fragments by the use of Klenow fragment to assist with ligation of adapters required for the sequencing process.
- the adapters are ligated to the ends of the cDNA fragments using standard procedures, and the cDNA fragments are then purified to remove excess adapters.
- the cDNA is amplified using adapter primers, purified, denatured and further diluted for cluster generation and sequencing, for example on a HiSeq2000 according to Illumina Corporation's standard protocols (208 cycles sequencing program, paired-end with indexing).
- the cDNA library is sequenced and the relative frequency of expression of the specific RNA biomarkers in cancer patients and healthy controls is determined.
- This method employs total RNA or rRNA-depleted RNA if necessary.
- the first strand cDNA is synthesized using standard methods.
- the first strand cDNA is then directly amplified using a set of specific oligonucleotide primers (i.e. oligonucleotide primers specific for the RNA biomarkers of interest) to amplify a specific set of PCR amplicons using either primer limited or cycle limited PCR.
- the cDNA is purified via a cleanup procedure to remove excess PCR reagents.
- the cDNA is fragmented if necessary using standard methods, and the cDNA ends are repaired using standard methods, in which any overhangs at the cDNA ends are converted into blunt ends using T4 DNA polymerase.
- An overhanging adenine (A) base is added to the 3'end of the blunt DNA fragments by the use of Klenow fragment to assist with ligation of adapters required for the sequencing process.
- Adapters are ligated to the ends of the cDNA fragments using standard procedures, and the cDNA is purified to remove excess adapters.
- the cDNA is then amplified using adapter primers and purified.
- the cDNA can be size selected via gel electrophoresis using standard methods if necessary.
- the cDNA library is sequenced, and the relative frequency of expression of the specific RNA biomarkers in cancer patients and healthy controls is determined.
- Method 4 differs from Method 3 in that all sequences necessary for next generation sequencing are incorporated via either a one or two step PCR amplification.
- An optional first step in this method is to deplete the total RNA of rRNA using an industry-provided kit, if necessary.
- the first strand cDNA is then synthesized using standard methods.
- the first strand cDNA is directly amplified using a set of specific oligonucleotide primers (i.e. oligonucleotide primers specific for the RNA biomarkers of interest) also containing Next Generation Sequencing (NGS) primer sites, using either primer limited or cycle limited PCR.
- NGS Next Generation Sequencing
- the cDNA is then purified via a cleanup procedure to remove excess PCR reagents, and re-amplified with another set of primers, if necessary, in order to add further sites required for NGS using either primer limited or cycle limited PCR.
- the cDNA is then purified to remove excess PCR reagents and, if necessary, is again amplified using adaptor primers and purified.
- the cDNA is amplified using adapter primers, purified, denatured and further diluted for cluster generation and sequencing, for example on a HiSeq2000 according to Illumina Corporation's standard protocols (208 cycles sequencing program, paired-end with indexing).
- the cDNA library is sequenced, and the relative frequency of expression of the specific RNA biomarkers in cancer patients and healthy controls is determined.
- RNA biomarkers were selected using annotation and analysis of publicly available RNA expression profile data in the NCBI databases GSE6919 and GSE38241 as these data-sets include data from cancer free donors.
- the biomarkers shown in Table 1 below is a unique set identified as being over-expressed in subjects with prostate cancer.
- the biomarkers shown in Table 2 is a second unique combination of RNA biomarkers identified as being under-expressed in subjects with prostate cancer.
- NCBI database GSE6919 which was developed at the University of Pittsburgh, contains data from three Affymetrix chips (U95A, U95B and U95C), representing more than 36,000 gene reporters.
- the database which has been analyzed by Chandran et al. (BMC Cancer 2005, 5:45 ; BMC Cancer 2007, 9:64 ), and Yu et al. (J Clin Oncol 2004, 22:2790-2799 ), contains RNA profiles from more than 200 individual prostate tumor samples, combined with adjacent "normal” or "healthy” tissues, or prostate tissues from individuals believed to be free of prostate cancer.
- RNA Biomarkers with Elevated Expression Levels in Prostate Cancer Patients REPORTER GENBANK ACCESSION GENE DESCRIPTION GENE SYMBOL SEQ ID NO: PRIMER SEQ ID NOS: PRIMER IDS 34777_at D14874 Adrenomedullin ADM 1 76, 77 ND654, ND655 38827_at AF038451 Anterior gradient 2 homolog AGR2 2 78, 79 ND543, ND544 37399_at D17793 Aldo-keto reductase family 1, member C3 AKR1C3 3 80, 81 ND498, ND499 41764_at AA976838 Apolipoprotein C-I ApoC1 4 82, 83 ND414, ND599 608_at M12529 Apolipoprotein E ApoE 5 84, 85 CH350, CH351 1577_at M23263 Androgen receptor AR 6 86, 87 ND460, ND
- RNA expression levels For tests measuring the changes in frequency of RNA expression levels, it is essential to ensure adequate standardization. For this reason we have analyzed the NCBI database to identify reporters with the least variation between gene expression profiles, as shown in Table 3 below, in prostate cancer and healthy donor tissues. These reporters form a robust set of RNA expression standards that can be used where appropriate in tests involving quantification of RNA expression, such as in the modified RNA-seq technology described herein.
- RNA biomarker specific amplicon were created using a multistep primer design strategy. Specific intron-spanning primers were created to amplify an amplicon of a specific size (60-300bp) that can be used for Next Generation Sequencing (NGS).
- NGS Next Generation Sequencing
- the primers were designed using Primer3 (v. 0.4.0) software and the primers were checked to ensure that certain criteria were met:
- RNA specific amplicon primer sets for the RNA Biomarker Amplicon Sequencing (RBAS)
- nucleotides incorporating sequencing primers were added to the 5' end of the primers in the first round PCR as described in Table 4 below, and a second set of primers used for a second round of PCR were used to add further sequences containing an index and adaptor sequence.
- Table 4 Specification of the added sequence to the RNA biomarker specific primer use for the first round PCR for biomarker specific amplicon 1st round PCR Sequence added to forward primer 5' end ACGACGCTCTTCCGATCT (SEQ ID NO: 233) Sequence added to reverse primer 5' end CGTGTGCTCTTCCGATCT (SEQ ID NO: 234)
- RNA Biomarker Amplicon Sequencing to compare RNA biomarker expression profiles in a prostate adenocarcinoma cell line (LNCaP) and a lung adenocarcinoma cell line (A549)
- RNA Biomarker Amplicon Sequencing (RBAS) to be used for the accurate detection and relative quantification of multiple RNA biomarkers was demonstrated by:
- An amplicon is defined as the specific amplification product obtained by PCR using a pair of oligonucleotide primers targeted to a specific RNA biomarker.
- the template used for the amplicon production was the single strand DNA complementary to the RNA extracted from LNCaP and A549 cells (see method section above).
- the cDNA was produced using random primers in this example but biomarker specific primers can also be used to initiate the reverse transcription from the extracted RNA.
- DNA amplicons compatible with Illumina Corporation's Next Generation Sequencing technology were produced in this example. Amplicons compatible for sequencing using other NGS technology can also be prepared using the same rationale.
- the 25 specific primer pairs were targeted to 21 prostate cancer RNA biomarkers and 4 reference RNA biomarkers and contained added sequences for adaptor introduction to the 5' and 3' ends of the amplicons according to Illumina's specification (the RNA biomarker selection and primer design strategies are presented in the method section above).
- RNA biomarker was produced during a first round of PCR.
- the same cDNAs produced from RNA of LNCaP or A549 cells were used as a template for each of the three separate first round PCR amplifications.
- Six amplicon pools were then prepared by combining equal volumes of each of the 25 biomarker specific amplicons produced individually during the first round PCRs.
- the six cleaned amplicon pools were used as individual templates for the second round PCR performed with sequencing primers specific for the adaptor added during the first round PCR.
- the sequencing primers also contained a barcode sequence for indexing and a tag sequence for clustering.
- the amplicon libraries produced during the second round PCR were analyzed and the concentration determined using the 2100 Bio analysesr (Agilent Technologies, Inc.) and Qubit® (Life Technologies - Invitrogen). Residual primers and dNTPs were removed using Agencourt AMPureXP system (Beckman Coulter, Inc.) and then pooled together at equimolar concentration to produce a single amplicon library sequencing pool.
- the sequencing pool was denatured and further diluted for cluster generation and sequenced on a HiSeq2000 according to Illumina Corporation's standard protocols (208 cycles sequencing program, paired-end with indexing).
- Illumina bcl2fastq conversion software (version 1.8.3) was used for the demultiplexing of the sequence reads acquired during the sequencing program and base call conversion to fastq paired end read data. Quality statistics for percentage of bases > Q30 and mean QScore for all reads showed that all amplicon libraries sequenced and de-multiplexed very well.
- This data set was used to generate the read counts per amplicon (Read counts (Rc) Tables 5 and 6). This is the number of sequencing reads of at least 50bp in length that map to the corresponding amplicon. This number is directly proportional to the amount of the amplicon in the library, and is also proportional to the specific RNA biomarker abundance from which the amplicon was derived.
- the average of the read counts obtained from the four reference amplicons were used to normalize the raw read counts of the amplicons produced from the LNCaP and A549 RNA using the 21 primer pairs specific for the prostate cancer RNA biomarkers.
- the reference amplicons were made with specific primers targeted to four different RNA biomarkers selected due to their low level of expression variation between different prostate cancer and healthy donor control tissues.
- the raw counts obtained for the four reference amplicons derived from A549 and LNCaP RNA were consistent between replicates and between the two cell types compared (Table 5).
- Table 5 Read counts obtained in triplicate (Rep. 1, 2, 3) for the four Reference Amplicons (Ref) a) Reference read Counts from A549 amplicons Ref. Rep.1 Rep.2 Rep.2 Avr. StDev CDIPT 520,522 513,026 531,305 242,890 13,173 C19orf50 209,037 211,595 210,174 210,268 1,282 ZFC3HI.
- RNA biomarker differential expression fold change between the LNCaP and A549 cells was performed by comparing the normalized read counts per amplicon converted to a log 2 number.
- the log 2 FC was calculated for the read counts before (raw read counts) and after normalization (Normalised read counts) and was compared in order to assess the effect of the amplicon library count distributions on the evaluation of the differential expression (Table 6).
- the data in Table 6 compares the expression of 21 target RNA biomarkers in LNCaP and A549 cells.
- a negative log 2 number indicates a decrease, or down regulation of RNA biomarkers while a positive log 2 number indicates an increase, or up regulation of RNA biomarkers.
- Table 6 Read counts and relative quantification (Log 2 FC) of RNA biomarker specific amplicons derived from LNCaP RNA compared with A549 RNA Fold change (FC) calculated with the raw read count (Rc) FC calculated with the normalized count normalised read count (Rc) Rc Log 2 Log 2 FC LNCaP/ A549 Rc Log 2 Log 2 FC LNCaP / A549 A549 LNCaP A549 LNCaP A549 LNCaP A549 LNCaP ACPP Rep.1 108 52,877 6.8 15.7 8.9 0.0005 0.2503 -11.1 -2 9.1 Rep.2 145 51,052 7.2 15.6 8.9 0.0006 0.1767 -10.7 -2.5 8.2 Rep.3 143 63,492 7.2 16 9.2 0.0005 0.2280 -10.9 -2.1 8.7 Avr.
- the data shows that the difference between FC values calculated either using the log 2 value for raw counts or the log 2 value for the normalized counts is not large.
- the normalization process allows a more accurate detection of the relative difference in expression of RNA biomarkers in A549 and LNCaP cells.
- Table 7 Comparison of Log 2 FC expression levels of RNA biomarkers in LNCaP and A549 RNA Log 2 Fc Elevated expression in LNCaP RNA Elevated expression in A549 RNA Log 2 Fc>2 ACPP, AZGP1, CRISP3, DDC, UGT2B15, ETV1 PSCA AKRIC3, ETV4 , MUC1,PDZK1IP1, TPM2, AGR2, MYLK,, SYNM Log 2 Fc ⁇ 2 AR460, AR532, HN1, PCAT1, PEX10 TFAP2A
- the data reveals an even split of RNA biomarkers with Log 2 FC >2 between the two RNAs.
- the data contained in Table 8 are basic statistical analyses of the Log 2 FC differences between the 21 RNA biomarkers expressed in LNCaP and A549 RNA calculated by dividing the normalized Log 2 FC of each RNA biomarker from LNCaP RNA by the corresponding Log 2 FC from A549 RNA.
- Table 8 Significance levels comparing the differential expression of each RNA biomarker between LNCaP and A549 cells Target Log 2 FC difference t P.Value adj.P.Val ACPP 8.7 30 9.E-14 2.E-12 AZGP1 8.4 24 3.E-12 6.E-11 UGT2B15 8.1 15 1.E-09 2.E-08 ETV4 -6.7 -24 2.E-12 6.E-11 AKRIC3 -5.9 -22 6.E-12 1.E-10 CRISP3 5.7 13 4.E-09 7.E-08 TPM2 -4.9 -17 1.E-10 3.E-09 DDC 4.4 --10 2.E-07 2.E-06 MUC1 -4.3 -15 9.E-10 2.E-08 PDZKIP1 -4.3 -14 2.E-09 3.E-08 AGR2 -3.6 -14 2.E-09 3.E-08 SYNM -3.5 -13 5.E-09 9.E-08 MYLK -3.4 -13 7.E-09 1.E-07 PSCA 2.9 7 5.E-06 5.E-
- RNA biomarker expression in two cell lines were chosen for this example to demonstrate a proof of concept by comparing RNA biomarker expression in two cell lines; one (LNCaP cells) of prostate origin and the other (A549 cells) of lung origin.
- LNCaP cells LNCaP cells
- A549 cells A549 cells
- the data provided in the above example shows that it is possible to detect the change in expression of specific RNA biomarkers through quantitative amplicon synthesis followed by enumeration using a Next Generation DNA sequencing methodology.
- RNA amplicon biomarker sequencing in the analysis of differential gene expression profile using prostate cancer tissue from formalin-fixed paraffin embedded (FFPE) human prostatectomy tissue
- RNA amplicon biomarker sequencing (RBAS) method is diagnostically and prognostically relevant by quantifying the relative expression of 79 RNA biomarkers using amplicon production and NGS to establish their RNA expression profile in prostate cancer tissues.
- FFPE formalin-fixed paraffin embedded
- Subject 1 is a 63 year old male who underwent a prostate biopsy in 2007 and was diagnosed with prostate cancer with a Gleason score of 4+5. The subject underwent a radical prostatectomy at the age of 58. A stored FFPE block containing the original prostatectomy tissue was re-examined and a tumor region was identified with a Gleason score of 4+5. The region identified was reset in paraffin and then sectioned. Three tissue samples were selected from Subject 1 for RNA extraction: Tumor tissue 4+5 (T); adjacent glandular tissue (Adj.G); and adjacent muscle tissue (Adj.M) deemed histologically normal.
- T Tumor tissue 4+5
- Adj.G adjacent glandular tissue
- Adj.M adjacent muscle tissue
- Subject 2 is a 67 year old male who underwent a prostate biopsy in 2012 and was diagnosed with prostate cancer with a Gleason score of 3+4. The subject underwent a radical prostatectomy at the age of 66. A stored FFPE block containing the prostatectomy tissue was re-examined. Three tumors were identified with different Gleason scores, 4+5 (T1), 3+4 (T2) and 3+3 (T3) respectively. The different regions from the blocks were reset, and then sectioned. Tissue samples were selected from each of the three tumor regions as well as an adjacent glandular tissue (Adj.G) deemed histologically normal. No Adj.M region was identified in Subject 2 tissue samples.
- Adj.G adjacent glandular tissue
- Illumina bcl2fastq conversion software version 1.8.3 was used to obtain the number of sequence reads per amplicon (read counts).
- Table 9A Subject 1 - Average of raw counts for the triplicates for reference amplicons tested in triplicates from Tumor (T) and adjacent glandular (AdjG) or adjacent muscular (AdjM) RNA samples T Adj.G Adj.M Run 1 Avr. StDev Avr StDev Avr.
- Table 9B Subject 2 - Average raw counts for the triplicate reference amplicons from Tumors (T1,T2 and T3) and adjacent glandular (Adj.G) RNA samples T1 Adj.G T2 Run 1 Avr. StDev Avr StDev Avr.
- the average of the read counts from the five reference amplicons was used to normalize the raw read counts of the amplicons produced from the appropriate tumor and adjacent glandular and muscular tissue pairings.
- the data compared the relative expression of the RNA biomarkers between tumor tissue and both adjacent glandular and adjacent muscular tissue.
- the raw counts of triplicate samples from tumor tissue and both adjacent glandular and adjacent muscular tissue is given followed by the log 2 normalized counts.
- the log 2 FC expression of each RNA biomarker from the tumor region of the prostatectomy tissue RNA samples is given relative to the adjacent glandular and muscular adjacent muscular tissue RNA.
- Finally the log 2 FC of the adjacent glandular relative to the muscular adjacent muscular tissue RNA is presented (Table 10).
- RNA biomarkers with a differential amplicon count (Log 2 FC >2) from Subject 1 were selected from the tumor, adjacent glandular and adjacent muscular samples with the data being presented in Table 11.
- Table 10 Subject 1 - Raw read counts, Log 2 normalization of the read counts and relative quantification (Log 2 FC) of RNA biomarker specific amplicons Raw read counts (Rc) Log 2 Normalised Rc Differential Expression (Log 2 FC) T Adj . G Adj.M T Adj.G Adj . M T/ Adj.G T/ Adj.M Adj .
- RNA biomarkers are found to be differentially expressed in either the tumor samples or the adjacent glandular or muscular tissues and these have been grouped in Table 12 below.
- Table 12 Subject 1 - Comparison of the tumor, adjacent glandular and adjacent muscule tissue expression of select RNA biomarkers Tumor vs adjacent glandular and muscle tissue differential expression with log2FC >2 RNA biomarkers Up regulated in tumor compared with adjacent glandular and muscle tissues and no difference between the adjacent glandular and muscle tissues. ETV1, HPN, F5, PMSA, UGT2BI5, CRISP3 Up regulated in the tumor and the glandular adjacent tissue compared with the adjacent muscle tissue, with higher up regulation in the tumor than in the glandular adjacent tissue.
- TMC5, PDZK1IP1, MSMB, PSCA No difference between the tumor and the adjacent glandular tissus and up regulated compared with adjacent muscule tissue.
- RNA expression profile more similar to the tumor which is very likely due to field effects as described for prostate cancer tissues by Chandran et al (2005), Rizzi et al. (PLoS One 3(10):e3617, 2008 ) and reviewed in Trujillo et al. (Prostate Cancer, 2012 ).
- Subject 2 used prostatectomy tissue and the data compares the relative expression of the RNA biomarkers between three tumor tissues with different Gleason scores (termed T1, T2, and T3) to the adjacent glandular tissue only.
- the raw counts of triplicate samples from T1, T2 and T3 tumor tissues and adjacent glandular tissue is given followed by the log 2 normalised counts.
- Finally the log 2 FC expression of each RNA biomarker from the tumor region of the prostatectomy tissue RNA samples is given relative to the adjacent glandular tissue RNA.
- Table 13 The raw counts acquired for each amplicon from Subject 2 samples is presented in Table 13 with the calculation of the normalized count and FC.
- Table 13 Subject 2 - Raw read counts, Log 2 normalization and relative quantification (Log 2 FC) of RNA biomarker specific amplicons Raw read counts ( Rc ) Log 2 Normalised Rc Differential Expression (Log 2 FC) T1 T2 Adj.G T1 T2 Adj.G T1/T2 T1/ Adj.G ACPP Rep.1 1,115,466 578,078 212,966 4.43 4.28 2.92 0.16 1.51 Rep.2 4 381,347 138,256 1.74 3.79 2.26 -2.06 -0.53 Rep.3 478,421 707,704 171,359 3.87 3.51 2.43 0.36 1.44 Avr.
- RNA biomarkers with a Log 2 FC >2 in the differential expression in the tumour compare to the adjacent gland. Most of these RNA biomarkers are up regulated in the tumor compared with the adjacent glandular tissue. Only two biomarkers were detected in a higher amount in the adjacent glandular tissue compared with all tumors. Some distinctions between the different grades of tumors can be made, for example with the OPRK1 and PSMA RNA biomarkers.
- RNA biomarker with differential expression (Log 2 FC) in Tumor and adjacent tissues of Subject 2 Differential expression (>2Log 2 FC) in Subject 2 tumors* compared with adjacent glandular tissue RNA Biomarkers Up regulated in: T1 TPX2, SPP1, PIP T2 HOXC4, HPN, KLK3.470, C15orf48, PSMA, PLA2G7, SAA2, HN1 T3 HPN, C15orf48, KLK3.470, ApoC1, SAA2 Down regulated in: T1 PSCA T2 PSCA, OPRK1, IGFBP1 T3 OPRK1 *T1(Gleason score 4+5), T2 (3+4), and T3 (3+3))
- RNA biomarkers disclosed herein are by selecting those that are up-regulated or down-regulated in a small number of prostate tumors, rather than in all prostate tumors. For this reason it is not expected that differential expression of all the RNA biomarkers would be seen in all prostate tumors or their adjacent tissues.
- the data indicate that tumors examined from Subjects 1 and 2 are likely not to have some of the RNA dysregulated within their tissue. The analysis of tumors from a range of subjects will will likely reveal differences in the expression of these and other RNA biomarkers. That is the major reason why, for diagnostic and prognostic use, RNA biomarker panels are selected from a large RNA biomarker pool. RBAS methodology has been developed to allow rapid screening of tumor samples for a large number of RNA biomarkers simultaneously.
- SEQ ID NO: 1-326 are set out in the attached Sequence Listing.
Landscapes
- Chemical & Material Sciences (AREA)
- Life Sciences & Earth Sciences (AREA)
- Health & Medical Sciences (AREA)
- Organic Chemistry (AREA)
- Proteomics, Peptides & Aminoacids (AREA)
- Analytical Chemistry (AREA)
- Zoology (AREA)
- Engineering & Computer Science (AREA)
- Wood Science & Technology (AREA)
- Immunology (AREA)
- Genetics & Genomics (AREA)
- Pathology (AREA)
- Biotechnology (AREA)
- Microbiology (AREA)
- Physics & Mathematics (AREA)
- Biochemistry (AREA)
- Bioinformatics & Cheminformatics (AREA)
- General Engineering & Computer Science (AREA)
- General Health & Medical Sciences (AREA)
- Biophysics (AREA)
- Molecular Biology (AREA)
- Hospice & Palliative Care (AREA)
- Oncology (AREA)
- Measuring Or Testing Involving Enzymes Or Micro-Organisms (AREA)
Description
- The present disclosure relates to methods and compositions for diagnosing and defining the staging or progress of disorders such as prostate cancer.
- The use of prostate specific antigen (PSA) as a diagnostic biomarker for prostate cancer was approved by the US Federal Drug Agency in 1994. In the nearly two decades since this approval, the PSA test has remained the primary tool for use in prostate cancer diagnosis, in monitoring for recurrence of prostate cancer, and in following the efficacy of treatments. However the PSA test has multiple shortcomings and, despite its widespread use, has resulted in only small changes in the death rate from advanced prostate cancers. To reduce the death rate and the negative impacts on quality of life caused by prostate cancer, new tools are required not only for more accurate primary diagnosis, but also for assessing the risk of spread of primary prostate cancers, and for monitoring responses to therapeutic interventions.
- Today, a blood serum level of around 4 ng per ml of PSA is considered indicative of prostate cancer, while a PSA level of 10 ng per ml or higher is considered highly suggestive of prostate cancer. The PSA blood test is not used in isolation when checking for prostate cancer; a digital rectal examination (DRE) is usually also performed. If the results of the PSA test or the DRE are abnormal, a biopsy is generally performed in which small samples of tissue are removed from the prostate and examined. If the results are positive for prostate cancer, further tests may be needed to determine the stage of progression of the cancer, such as a bone scan, a computed tomography (CT) scan or a pelvic lymph node dissection.
- While the PSA test has a good sensitivity (80%), it suffers from a false positive rate that approaches 75%. For example, it has been estimated that for PSA values of 4-10 ng/ml, only one true diagnosis of prostate cancer was found in approximately four biopsies performed (Catalona et al. J. Urol. 151(5):1283-90, 1994). Tests that measure the ratio of free to total (i.e., free plus bound) PSA do not have significantly greater specificity or sensitivity than the standard PSA test.
- Higher PSA levels often lead to biopsies to determine the presence or absence of cancer cells in the prostate, and may lead to the surgical removal of the localized prostate gland. While surgery removes the localized cancer and often improves prostate cancer-specific mortality, it also masks the fact that many patients with prostate cancer, even in the absence of surgery, do not experience disease progression to metastasis or death.
- The high false positive rate associated with the PSA test leads to many unnecessary biopsies. In addition to the physical discomfort and psychological distress associated with biopsies, it has been suggested that performing a biopsy may promote inflammation of cancerous tissue and increase the risk of cancer metastasis.
- Currently, the established prognostic factors of histological grade and cancer stage from biopsy results, and prostate-specific antigen level in blood at diagnosis are insufficient to separate prostate cancer patients who are at high risk for cancer progression from those who are likely to die of another cause.
- Once high risk or virulent forms of prostate cancer have been diagnosed, control strategies may involve surgery to remove the prostate gland if identified before metastasis, radiation to destroy cancer cells within the prostate and drug-based testosterone repression, generally referred to as androgen depletion therapy. These various treatments may bring about cures in some instances, or slow the time to death. However, for those with the most virulent forms of prostate cancer, the cancer will usually recur after surgery or radiation therapy and progress to resistance to androgen depletion therapy, with death a frequent outcome.
- Early detection of virulent forms of prostate cancer is critical but the conclusion of specialist physicians is that the PSA test alone is inadequate for distinguishing patients whose cancers will become virulent and progress to threaten life expectancy from those with indolent cancers.
- The following are some key reasons why the PSA test does not meet the needs of men's health:
- There are at least two basic cell types involved in prostate cancer. Adenocarcinoma is a cancer of epithelial cells in the prostate gland and accounts for approximately 95% of prostate cancers. Neuroendocrine cancers may arise from cells of the endocrine (hormonal) and nervous systems of the prostate gland and account for approximately 5% of prostate cancers. Neuroendocrine cells have common features such as special secretory granules, produce biogenic amines and polypeptide hormones, and are most common in the intestine, lung, salivary gland, pituitary gland, pancreas, liver, breast and prostate. Neuroendocrine cells co-proliferate with malignant adenocarcinomas and secrete factors which appear to stimulate adenocarcinoma cell growth. Neuroendocrine cancers are rarer, and are considered non-PSA secreting and androgen-independent for their growth.
- Some 15 to 17% of men with prostate cancer have cancers that grow but do not produce increasing or high blood levels of PSA. In these patients, who are termed asymptomatic, the PSA test often returns false negative test results as the cancer grows.
- Benign prostate hypertrophy (BPH), a non-malignant growth of epithelial cells, and prostatitis are diseases of the prostate that are usually caused by an infection of the prostate gland. Both BPH and prostatitis are common in men over 50 and can result in increased PSA levels. Incidence rates increase from 3 cases per 1000 man-years at age 45-49 years, to 38 cases per 1000 man-years by the age of 75-79 years. Whereas the prevalence rate is 2.7% for men aged 45-49, it increases to at least 24% by the age of 80 years. While prostate cancer results from the deregulated proliferation of epithelial cells, BPH commonly results from proliferation of normal epithelial cells and frequently does not lead to malignancy (Ziada et al. (1999) Urology 53(3 Suppl 3D): 1-6). Bacterial infection of the prostate can be demonstrated in only about 10% of men with symptoms of chronic prostatitis/chronic pelvic pain syndrome. Bacteria able to be cultured from patients suffering chronic bacterial prostatitis are mainly Gram-negative uropathogens. The role of Gram-positives, such as staphylococci and enterococci, and atypicals, such as chlamydia, ureaplasmas, mycoplasmas, are still debatable.
- Another condition, known as prostate intraepithelial neoplasia (PIN), may precede prostate cancer by five to ten years. Currently there are no specific diagnostic tests for PIN, although the ability to detect and monitor this potentially pre-cancerous condition would contribute to early detection and enhanced survival rates for prostate cancer.
- The phenotype of prostate cancer varies from one patient to another. More specifically, in different individuals prostate cancers display heterogeneous cellular morphologies, growth rates, responsiveness to androgens and pharmacological blocking agents for androgens, and varying metastatic potential. Each prostate cancer has its own unique progression involving multiple steps, including progression from localized carcinoma to invasive carcinoma to metastasis. The progression of prostate cancer likely proceeds, as seen for other cancers, via events that include the loss of function of cell regulators such as cancer suppressors, cell cycle and apoptosis regulators, proteins involved in metabolism and stress response, and metastasis related molecules (Abate-Shen et al. Polypeptides Dev. 14(19):2410-34, 2000; Ciocca et al. Cell Stress Chaperones 10(2):86-103, 2005).
- At present health authorities do not universally recommend widespread screening for prostate cancer with the PSA test. There are concerns that many men may be diagnosed and treated unnecessarily as a result of being screened, at high cost to health systems as well as risking the patient's quality of life, such as through incontinence or impotence. Despite these concerns, prostate cancer is the most prevalent form of cancer and the second most common cause of cancer death in New Zealand, Australian and North American males (Jemal et al. CA Cancer J. Clin., 57(1):43-66, 2007). In reality, at least some of the men incubating life threatening forms of prostate cancer are being missed until their cancer is too advanced, due to the economic costs of national screening, the need to avoid unnecessary over-treatment, and/or the presence of progressive cancers producing only low or background levels of PSA. The need for a better diagnostic test could not be clearer.
- The lack of a diagnostic test that distinguishes a non-life threatening from a potentially life-threatening cancer raises the important clinical question as to how aggressively to treat patients with localized prostate cancer. Treatment options for more aggressive cancers are invasive and include radical prostatectomy and/or radiation therapy. Androgen-depletion therapy, for example using gonadotropin-releasing hormone agonists (e.g., leuprolide, goserelin, etc.), is designed to reduce the amount of testosterone that enters the prostate gland and is used in patients with metastatic disease, some patients who have a rising PSA and choose not to have surgery or radiation, and some patients with a rising PSA after surgery or radiation. Treatment options usually depend on the stage of the prostate cancer. Men with a 10-year life expectancy or less, who have a low Gleason score from a biopsy and whose cancer has not spread beyond the prostate are often not treated. Younger men with a low Gleason score and a prostate-restricted cancer may enter a phase of "watchful waiting" in which treatment is withheld until signs of progression are identified. However, these prognostic indicators do not accurately predict clinical outcome for individual patients.
- Unlike many cancer types, specific patterns of gene expression have not been consistently identified in prostate cancer progression, although a number of candidate genes and pathways likely to be important in individual cases have been identified (Tomlins et al., Annu. Rev. Pathol. 1:243-71, 2006). Several groups have attempted to examine prostate cancer progression by comparing gene expression of primary carcinomas to normal prostate tissue. Because of differences in technique, the integrity of the tissue samples used as well as the biological heterogeneity of prostate cancers, these studies have reported thousands of candidate genes that share only moderate consensus. Also sample type differences could contribute to the lack of consensus seen from these studies. For example formalin fixed paraffin embedded (FFPE) tissues allow a convenient comparison of tumor and adjacent tissues but many of the cDNA microarray studies have used snap frozen tissues (Bibikova et al., Genomics 89:666-72, 2007; van't Veer et al., Nature 415:530-6, 2002). In addition, some studies have included accident victim donors as controls to overcome potential field effects (Aryee et al. Sci Transl Med 5, 169ra10 2013; Chandran et al. BMC Cancer, 5:45 doi:10.1186/1471-2407-5-45, 2005). However, a few genes have emerged including hepsin (HPN; Rhodes et al., Cancer Res. 62:4427-33, 2002), alpha-methylacyl-CoA racemase (AMACR; Rubin et al., JAMA 287:1662-70, 2002, Lin et al. Biosensors 2:377-387, 2012), enhancer of Zeste homolog 2 (EZH2; Varambally et al. Nature, 419:624-9, 2002), L-dopa decarboxylase (DDC; Koutalellis et al. BJU International, 110:E267-E273, 2012) and anterior-gradient 2 (AGR2; Hu et al. Carcinogenesis 33:1178-1186, 2012) which have been shown experimentally to have probable roles in prostate carcinogenesis.
- More recently, bioinformatic approaches employing data from gene expression profiling using both microarray and RNA-seq have generated lists of dysregulated genes in prostate cancer. RNA-seq is a technique based on enumeration of RNA transcripts using next-generation sequencing methodologies. However, because of their different experimental approaches, these studies have also shown few consensus genes, (Aryee et al. Sci Transl Med 5, 169ra10, 2013; Chandran et al. BMC Cancer, 5:1471-2407 2005; Pflueger et al. Genome Res. 21:56-67, 2011; Prensner et al. Nature Biotechnology 29:742-749, 2011; Shancheng Ren et al. Cell Research 22:806-821, 2012).
- A number of studies have also shown distinct classes of prostate cancers separable by their gene expression profiles (Glinsky et al., J. Clin. Invest. 113:913-23, 2004; Hsieh et al., Nature doi:10.1038/nature.10912, 2012; Lapointe et al., Proc. Natl. Acad. Sci. USA 101:811-6, 2004; LaTulippe et al., Cancer Res. 62:4499-506, 2002; Markert et al., Proc. Natl. Acad. Sci. doi:10.1073/pnas.1117029108, 2012; Rhodes et al., Cancer Res. 62:4427-33, 2002; Singh et al., Cancer Cell 1:203-9, 2002; Yu et al., J. Clin. Oncol. 22:2790-9, 2004; Varambally et al., Nature 419:624-9, 2002). Additionally, these approaches have been used to identify the genomic fusion of androgen-regulated genes including transmembrane protease, serine 2 (TMPRSS2) with members of the erythroblast transformation specific (ETS) DNA transcription factor family (Tomlins et al., Science 310:644-8, 2005, Tomlins, Nature 448: 595-599, 2007). These fusions appear commonly in prostate cancers and have been shown to be prevalent in more aggressive cancers (Attard et al., Oncogene 27:253-63, 2008; Barwick et al. Br. J. Cancer 102:570-576, 2010; Demichelis et al., Oncogene 26:4596-9, 2007; Nam et al., Br. J. Cancer 97:1690-5, 2007). Transcriptional modulation of TMPRSS2-ERG fusions has been shown to be associated with prostate cancer biomarkers and TGF-beta signalling (Brase et al., BMC Cancer 11:507 doi: 10.1186/1471, 2011). In addition to specific gene fusions, a vast array of mutational changes, including copy number variants, have been associated with prostate cancer tumours (Berger et al., Nature 470:214-220, 2011; Demichellis et al., Proc. Natl. Acad. Sci. doi:10.1073/pnas.117405109, 2012; Kumar et al., Proc. Natl. Acad. Sci. 108:17087-17092, 2011). Intratumor heterogeneity has also been found which has been suggested to result in underestimation of the degree of tumor heterogeneity (Gerlinger et al., New Eng, J. Med. 66:883-892, 2012). In particular mutations involving the substrate binding cleft of SPOP, which was found in 6-15% of prostate tumors, lacked ETS family gene rearrangements suggesting that tumors with SPOP mutations define a new class of prostate tumors. Also tumors with SPOP mutations lacked PTEN deletions in primary tumors but not in metastatic tumors (Barbieri et al., Nature Gen. 44:685-689, 2012).
- Gene expression is the transcription of DNA into messenger RNA by RNA polymerase. Up-regulation describes a gene which has been observed to have higher expression (higher RNA levels) in one sample (for example, from cancer tissue) compared to another (usually healthy tissue from a control sample). Down-regulation describes a gene which has been observed to have lower expression (lower RNA levels) in one sample (for example, from cancer tissue) compared to another (usually healthy tissue from a control sample).
- A common technology used for measuring RNA abundance is RT-qPCR where reverse transcription (RT) is followed by real-time quantitative PCR (qPCR). Reverse transcription first generates a DNA template from the RNA. This single-stranded template is called cDNA. The cDNA template is then amplified in the quantitative step, during which the fluorescence emitted by labeled hybridization probes or intercalating dyes changes as the DNA amplification process progresses. Quantitative PCR produces a measurement of an increase or decrease in copies of the original RNA and has been used to attempt to define changes of gene expression in cancer tissue as compared to comparable healthy tissues (Nolan T, et al. Nat Protoc 1:1559-1582, 2006; Paik S. The Oncologist 12:631-635, 2007; Costa C, et al. Transl Lung Cancer Research 2:87-91, 2013).
- Massive parallel sequencing made possible by next generation sequencing (NGS) technologies is another way to approach the enumeration of RNA transcripts in a tissue sample and RNA-seq is a method that utilizes this. It is currently the most powerful analytical tool used for transcriptome analyses, including gene expression level difference between different physiological conditions, or changes that occur during development or over the course of disease progression. Specifically, RNA-seq can be used to study phenomena such as gene expression changes, alternative splicing events, allele-specific gene expression, and chimeric transcripts, including gene fusion events, novel transcripts and RNA editing.
- High throughput assays for the detection and/or sequencing of particular target nucleic acids are known in the art and are disclosed in
WO2010/115154 andLevin et al. WO2010/115154 discloses amplification methods in which target nucleotide sequences are labeleld with tags and barcode nucleotide sequences to allow rapid identification of the target nucleic acids in a plurality of samples. Levin et al (Genome Biology, vol 10, issue 10, Article R115) discloses a targeted RNA-sequencing method allowing further analysis of a specific subset of a transcriptome such as cancer-related genes for mutations, structural alterations and expression levels. - However, there are currently no methods that allow the use of RNA-seq for the accurate and reproducible quantification of multiple specific RNAs for reliable applications in the field of diagnostics.
- Using multiple biomarkers in a diagnostic or prognostic test is preferable to using a single biomarker because of the following:
- Each individual tumor is heterogeneous with respect to all of the different aspects of their genome, transcriptome and proteome;
- Multiple tumor foci are commonly found in tissues;
- A single biomarker does not allow tumors of different lethality, aggressiveness or specificity to be differentiated;
- A single biomarker may be affected by a treatment regime or other environmental influence;
- A single biomarker may be affected by a field effect either as part of the progression of the disease or due to the tumor itself; and
- A single biomarker may be less effective in particular ethnic groups.
- RT-qPCR is a time consuming technique as expression differences are determined for a single gene at a time, which does not allow multiple biomarkers to be compared/assessed at one time.
- Comparing expression levels for genes across different experiments is often difficult, and can require complicated normalization methods that may not be suitable for integration into a diagnostic.
- RT-qPCR does not allow the accurate detection of down-regulated genes because it is limited in its fluorescence detection range, compared to NGS based methods. This causes genes that are at a low and/or high abundance to be problematic. Very often these transcripts, for which differential expression is difficult to measure, are the ones with the most diagnostic and/or progonostic value. RT-PCR does not allow multiplexing which causes a rise in cost per RNA biomarker, and hence the overall cost of the diagnostic test.
- There thus remains a need in the art for an accurate test for prostate cancer.
- The present invention provides methods for determining the presence and progression of a disorder in a subject. Such methods employ modified RNA-seq techniques to determine the relative frequency of one or more RNA biomarkers (also referred to as gene transcript biomarkers) specific for the disorder in the subject compared to that in healthy controls. Determination of the relative frequency of expression levels of specific combinations of RNA biomarkers using the methods disclosed herein can also be used to determine the type and/or stage of a disorder, and to monitor the progression of a disorder and/or the effectiveness of treatment. Disorders that can be diagnosed and monitored using the methods disclosed herein include, but are not limited to, cancers, such as prostate and breast cancers.
- The methods disclosed herein allow the determination of the frequency of multiple RNA biomarkers simultaneously using a process known as multiplexing. Multiplexing is a process wherein oligonucleotides specific for multiple biomarkers are amplified together to produce a pool of amplicons. The advantages of multiplexing are that it allows simultaneous testing of multiple RNA biomarkers in one or a small number of tubes, which in turn:
- Reduces cost;
- Reduces the amount of tissue required;
- Increases the level of reproducibility due to less hands-on manipulation;
- Reduces time involved in set-up; and
- Increases throughput.
- More specifically, the disclosed methods employ oligonucleotides specific for RNA biomarkers known to be associated with the presence and/or progression of a disorder, such as prostate cancer, at specific steps of a RNA-seq protocol to selectively identify cDNAs for the RNA biomarkers, and compare their relative frequency of expression between prostate cancer donors and healthy donors, as well as defining differences in expression between different stages of the disorder.
- In conventional RNA-seq methodologies, the actual frequency of expression of each transcript is determined for the whole genome. These frequencies can be biased by differences in the efficiency of the cDNA production and subsequent PCR amplification steps for each transcript. The inventors believe that the methods disclosed herein avoid these biases by determining the relative, rather than actual, frequency of expression of RNA biomarkers. The biases are not relevant as long as they are neutral with respect to the comparisons made. The relative changes in frequency of expression of RNA biomarkers specific for prostate cancer allows detection of prostate cancers, distinguishing prostate cancers from benign prostate hypertrophy (BPH) and prostatitis, and detection of prostate cancers in asymptomatic men whose prostate cancer may produce low levels of PSA with high sensitivity and specificity. In certain embodiments, the disclosed methods determine changes in frequency of expression of RNA biomarkers in order to distinguish between indolent cancers, which have a low likelihood of progressing to a lethal disease, and more aggressive forms of prostate cancer which are life threatening and require treatment.
- In one aspect, the present disclosure provides methods for detecting the presence of a disorder in a subject, comprising: (a) determining the relative frequency of expression of at least one RNA biomarker in a biological sample obtained from the subject using RNA sequencing; and (b) comparing the relative frequency of expression of the at least one RNA biomarker in the biological sample with a predetermined threshold value, wherein increased or decreased relative frequency of expression of the at least one RNA biomarker in the biological sample indicates the presence of the disorder in the subject. In related aspects, the disclosed methods comprise: (a) determining the relative frequency of expression of a plurality of RNA biomarkers in the biological sample; and (b) comparing the relative frequency of expression of the plurality of RNA biomarkers in the biological sample with predetermined threshold values, wherein increased or decreased relative frequency of expression of at least two or more of the RNA biomarkers in the biological sample indicates the presence of the disorder in the subject.
- In one embodiment, the relative frequency of expression of at least one RNA biomarker is determined by: (a) isolating total RNA from the biological sample; (b) generating first strand cDNA from the total RNA using a first oligonucleotide primer specific for the at least one RNA biomarker; (c) synthesizing second strand cDNA to provide double-stranded cDNA (dsDNA); (d) addingat least one sequencing adapter to the double-stranded cDNA; (e) amplifying the double-stranded cDNA to provide a cDNA library from the double-stranded cDNA; and (f) sequencing the cDNA library and determining the relative frequency of expression of the at least one RNA biomarker. Optionally, such methods also comprise: (i) removing rRNA from the total RNA prior to step (b); (ii) end repairing the double stranded cDNA and adding an overhanging adenine (A) base to the 3' end of the double stranded cDNA after step (c) and prior to step (d); and/or (iii) purifying and, optionally, size selecting the cDNA in the cDNA library after step (e) and prior to step (f).
- In a related embodiment, such methods further comprise the option of synthesizing cDNA by polymerase chain reaction (PCR) using an oligonucleotide primer pair specific for the at least RNA biomarker after step (b) and prior to step (d) or by the standard methods. In certain embodiments, one of the oligonucleotides in the primer pair will be the same as the oligonucleotide primer used in the generation of the first strand cDNA.
- In a further embodiment, the relative frequency of expression of the at least one RNA biomarker is determined by: (a) isolating total RNA from a biological sample; (b) generating first strand cDNA from the total RNA; (c) amplifying cDNA by polymerase chain reaction using an oligonucleotide primer pair specific for the at least one RNA biomarker to provide amplified double-stranded cDNA; (d) adding at least one sequencing adapter to the amplified double-stranded cDNA; (e) further amplifying the amplified double-stranded cDNA using primers specific for the at least one sequencing adapter to provide a cDNA library; and (f) sequencing the cDNA library and determining the relative frequency of expression of the at least one RNA biomarker. Optionally, such methods also comprise: (i) removing rRNA from the total RNA prior to step (b); (ii) end repairing the double stranded cDNA and adding an overhanging adenine (A) base to the 3' end of the double stranded cDNA after step (c) and prior to step (d); and/or (iii) purifying and, optionally, size selecting the cDNA in the cDNA library after step (e) and prior to step (f).
- In certain embodiments, the disclosed methods comprise determining the expression level of multiple RNA biomarkers corresponding to polynucleotide biomarkers selected from the group consisting of those listed in Tables 1, 2 and 3. Oligonucleotide primers that can be employed in the methods disclosed herein include, but are not limited to, those provided in SEQ ID NO: 76-232 and 293-326. In certain embodiments, the methods disclosed herein include detecting the relative frequency of expression of a RNA biomarker comprising an RNA sequence that corresponds to a DNA sequence of SEQ ID NO: 1-75 and 235-287 or a variant thereof, as defined herein. Those of skill in the art will appreciate that the RNA sequences for the disclosed RNA biomarkers are identical to the cDNA sequences disclosed herein except for the substitution of thymine (T) residues with uracil (U) residues.
- The present disclosure provides an oligonucleotide primer comprising, or consisting of, a sequence selected from the group consisting of SEQ ID NO: 76-232 and 293-326, and variants thereof. The disclosure relates to oligonucleotide primers that have a length equal to or less than 30 nucleotides. The disclosed oligonucleotide primers can be effectively employed in methods for diagnosing the presence of, and/or monitoring the progression of, prostate cancer using methods well known to those of skill in the art, including quantitative real time PCR or small scale oligonucleotide microarrays.
- Biological samples that can be effectively employed in the disclosed methods include, but are not limited to, urine, blood, serum, cell lines, peripheral blood mononuclear cells (PBMCs), biopsy tissue and prostatectomy tissue.
-
Fig. 1 shows four adaptations to conventional RNA-seq technology that are employed in the disclosed methods. - As used herein, the term "biomarker" refers to a molecule that is associated either quantitatively or qualitatively with a biological change. Examples of biomarkers include polypeptides, proteins, fragments of a polypeptide or protein; polynucleotides, such as a gene product, RNA or RNA fragment; and other body metabolites.
- As used herein, the term "RNA biomarker" or "gene transcript biomarker" refers to an RNA molecule produced by transcription of a gene that is associated either quantitatively or qualitatively with a biological change.
- As used herein the term "RNA sequence corresponding to a DNA sequence" refers to a sequence that is identical to the DNA sequence except for the substitution of all thymine (T) residues with uracil (U) residues.
- As used herein, the term "oligonucleotide specific for a biomarker" refers to an oligonucleotide that specifically hybridizes to a polynucleotide biomarker or a polynucleotide encoding a polypeptide biomarker, and that does not significantly hybridize to unrelated polynucleotides. In certain embodiments, the oligonucleotide hybridizes to a gene, a gene fragment or a gene transcript. In specific embodiments, the oligonucleotide hybridizes to the polynucleotide of interest under stringent conditions, such as, but not limited to, prewashing in a solution of 6X SSC, 0.2% SDS; hybridizing at 65°C, 6X SSC, 0.2% SDS overnight; followed by two washes of 30 minutes each in 1X SSC, 0.1% SDS at 65°C and two washes of 30 minutes each in 0.2X SSC, 0.1% SDS at 65°C.
- As used herein the term "oligonucleotide primer pair" refers to a pair of oligonucleotide primers that span an intron in the cognate RNA biomarker.
- As used, herein the term "polynucleotide(s)," refers to a single or double-stranded polymer of deoxyribonucleotide or ribonucleotide bases and includes DNA and corresponding RNA molecules, including hnRNA, mRNA, and non-coding RNA, molecules, both sense and anti-sense strands, and includes cDNA, genomic DNA and recombinant DNA, as well as wholly or partially synthesized polynucleotides. An hnRNA molecule contains introns and corresponds to a DNA molecule in a generally one-to-one manner. An mRNA molecule corresponds to an hnRNA and DNA molecule from which the introns have been excised. A non-coding RNA is a functional RNA molecule that is not translated into a protein, although in some circumstances non-coding RNA can be coding and vice a versa.
- As used herein, the term "subject" refers to a mammal, preferably a human, who may or may not have a disorder, such as prostate cancer. Typically, the terms "subject" and "patient" are used interchangeably herein in reference to a human subject.
- As used herein, the term "healthy subject" refers to a subject who is not inflicted with a disorder of interest.
- As used herein in connection with prostate cancer, the term "healthy male" refers to a male who has an undetectable PSA level in serum or non-rising PSA levels up to 1ng/ml, no evidence of prostate gland abnormality following a DRE and no clinical symptoms of prostatic disorders.
- As used herein in connection with prostate cancer, the term "asymptomatic male" refers to a male who has a PSA level in serum of greater than 4ng/ml, which is considered indicative of prostate cancer, but whose DRE is inconclusive and who has no symptoms of clinical disease.
- The term "benign prostate hypertrophy" (BPH) refers to a prostatic disease with a non-malignant growth of epithelial cells in the prostate gland and the term "prostatitis" refers to another prostatic disease of the prostate, usually due to a microbial infection of the prostate gland. Both BPH and prostatitis can result in increased PSA levels.
- As used herein, the term "metastatic prostate cancer" refers to prostate cancer which has spread beyond the prostate gland to a distant site, such as lymph nodes or bone.
As used herein, the term "biopsy tissue" refers to a sample of tissue (e.g., prostate tissue) that is removed from a subject for the purpose of determining if the sample contains cancerous tissue. The biopsy tissue is then examined (e.g., by microscopy) for the presence or absence of cancer. - As used herein, the term "prostatectomy" refers to the surgical removal of the prostate gland.
- As used herein, the term "sample" is used herein in its broadest sense to include a sample, specimen or culture obtained from any source. Biological samples include blood products (such as plasma, serum and whole blood), urine, saliva and the like. Biological samples also include tissue samples, such as biopsy tissues or pathological tissues, that have previously been fixed (e.g., formalin, snap frozen, cytological processing, etc.).
- As used herein, the term "predetermined threshold value of expression" of a RNA biomarker refers to the level of expression of the same RNA biomarker in a corresponding control/normal sample or group of control/normal samples obtained from normal, or healthy, subjects, e.g. from males who do not have prostate cancer.
- As used herein, the term "altered frequency of expression" of a RNA biomarker in a test biological sample refers to a frequency that is either below or above the predetermined threshold value of expression for the same RNA biomarker in a control sample and thus encompasses either high (increased) or low (decreased) expression levels.
- As used herein, the term "relative frequency of expression" refers to the frequency of expression of a RNA biomarker in a test biological sample relative to the frequency of expression of the same RNA biomarker in a corresponding control/normal sample or group of control/normal samples obtained from normal, or healthy, subjects, (e.g., from males who do not have prostate cancer). In preferred embodiments, the frequency of expression of the RNA biomarker is also normalized to the frequency of an internal reference transcript.
- As used herein, the term "prognosis" or "providing a prognosis" for a disorder, such as prostate cancer, refers to providing information regarding the likely impact of the presence of prostate cancer (e.g., as determined by the diagnostic methods) on a subject's future health (e.g., the risk of metastasis).
- As outlined above, the present disclosure provides methods for detecting the presence or absence of a disorder, such as prostate cancer, in a subject, monitoring progression of the disorder by determining the frequency of expression of specific RNA biomarkers in a biological sample obtained from the subject. The methods disclosed herein employ one or more modifications of standard RNA-seq protocols. RNA-seq is a relatively new technology that has been employed for mass sequencing of whole transcriptomes, and that offers significant advantages over other methods employed for transcriptome sequencing, such as microarrays, including low levels of background noise, the ability to detect low levels of expression, the ability to detect novel mutations and transcripts, and the ability to use relatively small amounts of RNA (for a review of RNA-seq, see Wang et al., Nat. Rev. Genet. (2009) 10:57-63).
- The disclosed methods employ oligonucleotides specific for one or more RNA biomarker in combination with RNA-seq technology to perform directed sequencing and thereby determine the relative frequency of expression of the RNA biomarker(s). Such methods have significant advantages over other technologies typically employed to determine expression levels of polynucleotide biomarkers, including improved accuracy, reproducibility and speed, the ability to easily determine the frequency of expression of a multitude of RNA biomarkers in a large number of samples at a relatively low cost, and the ability to identify novel mutations and transcripts.
- In specific embodiments, such methods use oligonucleotides specific for one or more biomarkers selected from those shown in Tables 1, 2 and 3.
- In one embodiment, the disclosed methods comprise determining the relative frequency of expression levels of at least two, three, four, five, six, seven, eight, nine, ten or more RNA biomarkers selected from the group consisting of: SEQ ID NO: 76-223 and 293-326 in a biological sample taken from a subject, and comparing the relative frequency of expression levels with predetermined threshold values.
- The disclosed methods can be employed to diagnose the presence of prostate cancer in subjects with early stage prostate cancer; subjects who have had surgery to remove the prostate (radical prostatectomy); subjects who have had radiation treatment for prostate cancer; subjects who are undergoing, or have completed, androgen ablation therapy; subjects who have become resistant to hormone ablation therapy; and/or subjects who are undergoing, or have had, chemotherapy.
- In certain embodiments, the RNA biomarkers disclosed herein appear in subjects with prostate cancer at levels that are at least two-fold higher or lower than, or at least two standard deviations above or below, the mean level in normal, healthy individuals, or are at least two-fold higher or lower than, or at least two standard deviations above or below, a predetermined threshold of expression.
- All of the biomarkers and oligonucleotides disclosed herein are isolated and purified, as those terms are commonly used in the art. Preferably, the biomarkers and oligonucleotides are at least about 80% pure, more preferably at least about 90% pure, and most preferably at least about 99% pure.
- In certain embodiments, the oligonucleotides employed in the disclosed methods specifically hybridize to a variant of a polynucleotide biomarker disclosed herein. As used herein, the term "variant" comprehends nucleotide or amino acid sequences different from the specifically identified sequences, wherein one or more nucleotides or amino acid residues is deleted, substituted, or added. Variants may be naturally occurring allelic variants, or non-naturally occurring variants. Variant sequences (polynucleotide or polypeptide) preferably exhibit at least 80%, 85%, 90%, 95%, 96%, 97%, 98% or 99% identity to a sequence disclosed herein. The percentage identity is determined by aligning the two sequences to be compared as described below, determining the number of identical residues in the aligned portion, dividing that number by the total number of residues in the inventive (queried) sequence, and multiplying the result by 100.
- In addition to exhibiting the recited level of sequence identity, variants of the disclosed biomarkers are preferably themselves expressed in subjects with prostate cancer at a frequency that are higher or lower than the levels of expression in normal, healthy individuals.
- Polypeptide and polynucleotide sequences may be aligned, and percentages of identical amino acids or nucleotides in a specified region may be determined against another polypeptide or polynucleotide sequence, using computer algorithms that are publicly available. The percentage identity of a polynucleotide or polypeptide sequence is determined by aligning polynucleotide and polypeptide sequences using appropriate algorithms, such as BLASTN or BLASTP, respectively, set to default parameters; identifying the number of identical nucleic or amino acids over the aligned portions; dividing the number of identical nucleic or amino acids by the total number of nucleic or amino acids of the polynucleotide or polypeptide of the present invention; and then multiplying by 100 to determine the percentage identity.
- Two exemplary algorithms for aligning and identifying the identity of polynucleotide sequences are the BLASTN and FASTA algorithms. The alignment and identity of polypeptide sequences may be examined using the BLASTP algorithm. BLASTX and FASTX algorithms compare nucleotide query sequences translated in all reading frames against polypeptide sequences. The FASTA and FASTX algorithms are described in Pearson and Lipman, Proc. Natl. Acad. Sci. USA 85:2444-2448, 1988; and in Pearson, Methods in Enzymol. 183:63-98, 1990. The FASTA software package is available from the University of Virginia, Charlottesville, VA 22906-9025. The FASTA algorithm, set to the default parameters described in the documentation and distributed with the algorithm, may be used in the determination of polynucleotide variants. The readme files for FASTA and FASTX Version 2.0x that are distributed with the algorithms describe the use of the algorithms and describe the default parameters.
- The BLASTN software is available on the NCBI anonymous FTP server and is available from the National Center for Biotechnology Information (NCBI), National Library of Medicine, Building 38A, Room 8N805, Bethesda, MD 20894. The BLASTN algorithm Version 2.0.6 [Sep-10-1998] and Version 2.0.11 [Jan-20-2000] set to the default parameters described in the documentation and distributed with the algorithm, is preferred for use in the determination of variants according to the present invention. The use of the BLAST family of algorithms, including BLASTN, is described at NCBI's website and in the publication of Altschul, et al., "Gapped BLAST and PSI-BLAST: a new generation of protein database search programs," Nucleic Acids Res. 25:3389-3402, 1997.
- Variant sequences generally differ from the specifically identified sequence only by conservative substitutions, deletions or modifications. As used herein with regards to amino acid sequences, a "conservative substitution" is one in which an amino acid is substituted for another amino acid that has similar properties, such that one skilled in the art of peptide chemistry would expect the secondary structure and hydropathic nature of the polypeptide to be substantially unchanged. In general, the following groups of amino acids represent conservative changes: (1) ala, pro, gly, glu, asp, gln, asn, ser, thr; (2) cys, ser, tyr, thr; (3) val, ile, leu, met, ala, phe; (4) lys, arg, his; and (5) phe, tyr, trp, his. Variants may also, or alternatively, contain other modifications, including the deletion or addition of amino acids that have minimal influence on the antigenic properties, secondary structure and hydropathic nature of the polypeptide. For example, a polypeptide may be conjugated to a signal (or leader) sequence at the N-terminal end of the protein which co-translationally or post-translationally directs transfer of the protein. The polypeptide may also be conjugated to a linker or other sequence for ease of synthesis, purification or identification of the polypeptide (e.g., poly-His), or to enhance binding of the polypeptide to a solid support. For example, a polypeptide may be conjugated to an immunoglobulin Fc region.
- In another embodiment, variant polypeptides are encoded by polynucleotide sequences that hybridize to a disclosed polynucleotide under stringent conditions. Stringent hybridization conditions for determining complementarity include salt conditions of less than about 1 M, more usually less than about 500 mM, and preferably less than about 200 mM. Hybridization temperatures can be as low as 5°C, but are generally greater than about 22°C, more preferably greater than about 30°C, and most preferably greater than about 37°C. Longer DNA fragments may require higher hybridization temperatures for specific hybridization. Since the stringency of hybridization may be affected by other factors such as probe composition, presence of organic solvents and extent of base mismatching, the combination of parameters is more important than the absolute measure of any one alone. An example of "stringent conditions" is prewashing in a solution of 6X SSC, 0.2% SDS; hybridizing at 65°C, 6X SSC, 0.2% SDS overnight; followed by two washes of 30 minutes each in 1X SSC, 0.1% SDS at 65°C and two washes of 30 minutes each in 0.2X SSC, 0.1% SDS at 65°C.
- The expression levels of one or more RNA biomarkers in a biological sample can be determined, for example, using one or more oligonucleotides that are specific for the RNA biomarker. In one method, the expression level of one or more RNA biomarkers disclosed herein is determined by first collecting urine from a subject following DRE or prostate massage via a bicycle or exocycle. RNA is isolated from the urine sample, and the frequency of expression of the RNA biomarker is determined as described below using modified RNA-seq technology in combination with oligonucleotides specific for the RNA biomarker of interest.
- In other embodiments, the levels of mRNA corresponding to a prostate cancer biomarker disclosed herein can be detected using oligonucleotides in Southern hybridizations, in situ hybridizations, or quantitative real-time PCR amplification (qRT-PCR). Solid phase substrates, or carriers, that can be effectively employed in such assays are well known to those of skill in the art and include, but are not limited to, microporous membranes constructed, for example, of nitrocellulose, nylon, polyvinylidene difluoride, polyester, cellulose acetate, mixed cellulose esters and polycarbonate. Suitable microporous membranes include, for example, those described in US Patent Application Publication no.
US2010/0093557A1 . Methods for performing such assays are well known to those of skill in the art. - The oligonucleotides employed in the disclosed methods are generally single-stranded molecules, such as synthetic antisense molecules or cDNA fragments, and are, for example, 6-60 nt, 15-30 or 20-25 nt in length.
- Oligonucleotides specific for a polynucleotide, or RNA, biomarker disclosed herein are prepared using techniques well known to those of skill in the art. For example, oligonucleotides can be designed using known computer algorithms to identify oligonucleotides of a defined length that are unique to the polynucleotide, have a GC content within a range suitable for hybridization, and lack predicted secondary structure that may interfere with hybridization. Oligonucleotides can be synthesized using methods well known to those in the art. In specific embodiments, the oligonucleotides employed in the disclosed methods and compositions are selected from the group consisting of: SEQ ID NO: 76-223 and 293-326.
- For tests involving alterations in RNA expression levels, it is important to ensure adequate standardization. Accordingly, in tests such as the adapted RNA-seq technology disclosed herein, quantitative real time PCR or small scale oligonucleotide microarrays, at least one expression standard is employed. Expression standards that can be employed in such methods include, but are not limited to, those listed in Table 3 below.
- The present disclosure further provides methods employing a plurality of oligonucleotides that are specific for a plurality of the prostate cancer RNA biomarkers disclosed herein.
- The following examples are intended to illustrate, but not limit, this disclosure.
- RNA was isolated from LNCaP and A549 cell lines that had been harvested from cell culture and stored in Trizol using a ZYMO Direct-zol™ kit (Ngaio Diagnostics Ltd.) following the manufacturer's instructions. RNA quality was assessed using the Agilent BioAnalyser and the Agilent RNA 6000 nano assay protocol. The LNCaP and A549 RNA had a RIN value of 9.5 and 9.8 respectively. The RNA was also checked on the NanoDrop 2000 spectrophotometer, (Thermo Scientific), and its concentration ascertained by the Qubit® 2.0 Fluorometer (Life Technologies).
- Histological blocks from subjects were reviewed by a clinical histopathologist, and tumor and histologically adjacent regions deemed "normal" were identified. These sections were then excised and reset in paraffin. Approximately fifteen freshly cut sections at a thickness of ten microns were then processed using a Qiagen RNeasy FFPE kit (Cat No: 74404, 73504). The method used in all extractions for deparaffinization step was the original method from the Cat no: 74404 kit, and the remainder of the protocol was performed following the manufacturer's instructions. The RNA was checked on the NanoDrop, and its concentration ascertained by the Qubit® 2.0 Fluorometer (Life Technologies).
- RNA was isolated from one or more separate fresh urine samples from donors by sedimentation of the cellular material using centrifgation at 1000g for five minutes at 4°C. The urine was decanted and the cell pellet resuspended in 1.8 ml of ice cold 1X PBS containing 2.5% Fetal Bovine Serum (Invitrogen). The cell suspension was transferred to a 2ml Eppendorf tube and the cellular material collected by centrifugation at 400g for 5 minutes at 4°C. The supernatant was removed (leaving around 50µl) and the cell pellet resuspended in 1.8 ml of ice cold 1X PBS containing 2.5% Fetal Bovine Serum (Invitrogen). The cells were again collected by centrifugation at 400g for 5 minutes at 4°C. The supernatant was removed (leaving around 50µl) and the cell pellet resuspended in 1.8 ml of ice cold 1X PBS containing 2.5% Fetal Bovine Serum (Invitrogen). The cells were collected by centrifµgation at 400g for 5 minutes at 4°C and all but 100 µl of the supernatant removed. The cells were resuspended in the remaining 100 µl of supernatant, and 8µl was taken for microscopic analysis. A total of 300 µl of Trizol LS (Invitrogen) and 5µg of E. coli 5S rRNA was added and the cell suspension was stored at -80°C. RNA was extracted as described by ZYMO using the Direct-zol™ kit, or as described by Invitrogen and further purified using Qiagen RNeasy™ spin columns. RNA was stored at -80°C prior to use.
- cDNA was produced from approximately 1-1.5ug of total RNA from either cell lines, biopsy tissue or urine extracts using random primers for the production of the first strand cDNA using the SuperScript® VILO™ cDNA Synthesis Kit (Life Technologies) or RNA biomarker-specific primers.The cDNA preparations were stored at -80°C prior to use and then diluted 1/5 in sterile water prior to qRT-PCR.
- RNA biomarker specific primers were used to perform real time SYBR green PCR quantification from cell line-, biopsy- or urine-derived cDNA using the Roche Lightcycler 480 using standard protocols for determining the specificity and efficiency of the amplification. The relative amount of the marker gene in each of the samples tested was determined by comparing the cycle threshold (Ct value: number of PCR cycles required for the SYBR green fluorescent signal to cross the threshold exceeding background level within the exponential growth phase of the amplification curve). Following 30 cycle RT-PCR reactions, the amplicons were electrophoresed on a 2% agarose gel and sequenced with standard Sanger chemistry using an Applied Biosystems 3130x1 DNA sequencer.
- The relative frequency of expression of specific RNA biomarkers was determined using the isolated RNA in one or more of the four methods described below. Each of these methods includes at least one modification of conventional RNA-seq technologies. Conventional RNA-seq technologies are well known to those of skill in the art and are described, for example, in Wang et al. (Nat. Rev. Genet. (2009) 10:57-63), and Marguerat and Bahler (Cell. Mol. Life Sci. (2010) 67:569-579).
- In a first method, sequence specific priming is employed during the generation of first strand cDNA. An optional first step in this method is to deplete the total RNA of rRNA using an industry-provided kit, if necessary. An industry-provided first strand cDNA kit is used to combine total RNA or rRNA-depleted total RNA with at least one strand specific oligonucleotide primer (i.e. an oligonucleotide primer specific for the RNA biomarker of interest) and generate first strand cDNA according to the manufacturer's protocol. Second strand cDNA is then synthesized in an unbiased manner using standard techniques. The resulting double-stranded cDNA is fragmented if necessary using standard methods, and the cDNA ends are repaired using standard methods in which any overhangs at the cDNA ends are converted into blunt ends using T4 DNA polymerase. An overhanging adenine (A) base is added to the 3' end of the blunt DNA fragments by the use of Klenow fragment to assist with ligation of adapters required for the sequencing process. The adapters are ligated to the ends of the cDNA fragments using standard procedures, and then the cDNA fragments are run on a gel for purification and removal of excess adapters. The cDNA is amplified using adapter primers, purified, denatured and further diluted for cluster generation and sequencing, for example on a HiSeq2000 according to Illumina Corporation's standard protocols (208 cycles sequencing program, paired-end with indexing). The cDNA library is sequenced, and the relative frequency of expression of the specific RNA biomarkers in cancer patients and healthy controls is determined.
- As in
method 1, sequence specific priming is employed during the generation of first strand cDNA. This is achieved using an industry provided first strand cDNA kit and at least one strand specific oligonucleotide primer to generate first strand cDNA from total RNA (or rRNA depleted total RNA if necessary) according to the manufacturer's protocol. The second strand cDNA can either be prepared in an unbiased manner using standard techniques, or it can be directly amplified using a set of specific oligonucleotide primers (i.e. oligonucleotide primers specific for the RNA biomarkers of interest) to amplify a specific set of PCR amplicons by either primer limited or cycle limited PCR. In preferred embodiments, the oligonucleotide primer employed to generate the first strand cDNA can be the same as one of the pair of oligonucleotide primers used to amplify the double-stranded cDNA. The cDNA is then purified via a cleanup procedure to remove excess PCR reagents. The cDNA is fragmented if necessary using standard methods, and the cDNA ends are repaired using standard methods in which any overhangs at the cDNA ends are converted into blunt ends using T4 DNA polymerase. An overhanging adenine (A) base is added to the 3' end of the blunt DNA fragments by the use of Klenow fragment to assist with ligation of adapters required for the sequencing process. The adapters are ligated to the ends of the cDNA fragments using standard procedures, and the cDNA fragments are then purified to remove excess adapters. The cDNA is amplified using adapter primers, purified, denatured and further diluted for cluster generation and sequencing, for example on a HiSeq2000 according to Illumina Corporation's standard protocols (208 cycles sequencing program, paired-end with indexing). The cDNA library is sequenced and the relative frequency of expression of the specific RNA biomarkers in cancer patients and healthy controls is determined. - This method employs total RNA or rRNA-depleted RNA if necessary. The first strand cDNA is synthesized using standard methods. The first strand cDNA is then directly amplified using a set of specific oligonucleotide primers (i.e. oligonucleotide primers specific for the RNA biomarkers of interest) to amplify a specific set of PCR amplicons using either primer limited or cycle limited PCR. The cDNA is purified via a cleanup procedure to remove excess PCR reagents. The cDNA is fragmented if necessary using standard methods, and the cDNA ends are repaired using standard methods, in which any overhangs at the cDNA ends are converted into blunt ends using T4 DNA polymerase. An overhanging adenine (A) base is added to the 3'end of the blunt DNA fragments by the use of Klenow fragment to assist with ligation of adapters required for the sequencing process. Adapters are ligated to the ends of the cDNA fragments using standard procedures, and the cDNA is purified to remove excess adapters. The cDNA is then amplified using adapter primers and purified. The cDNA can be size selected via gel electrophoresis using standard methods if necessary. The cDNA library is sequenced, and the relative frequency of expression of the specific RNA biomarkers in cancer patients and healthy controls is determined.
- Method 4 differs from
Method 3 in that all sequences necessary for next generation sequencing are incorporated via either a one or two step PCR amplification.
An optional first step in this method is to deplete the total RNA of rRNA using an industry-provided kit, if necessary. The first strand cDNA is then synthesized using standard methods. The first strand cDNA is directly amplified using a set of specific oligonucleotide primers (i.e. oligonucleotide primers specific for the RNA biomarkers of interest) also containing Next Generation Sequencing (NGS) primer sites, using either primer limited or cycle limited PCR. The cDNA is then purified via a cleanup procedure to remove excess PCR reagents, and re-amplified with another set of primers, if necessary, in order to add further sites required for NGS using either primer limited or cycle limited PCR. The cDNA is then purified to remove excess PCR reagents and, if necessary, is again amplified using adaptor primers and purified. The cDNA is amplified using adapter primers, purified, denatured and further diluted for cluster generation and sequencing, for example on a HiSeq2000 according to Illumina Corporation's standard protocols (208 cycles sequencing program, paired-end with indexing). The cDNA library is sequenced, and the relative frequency of expression of the specific RNA biomarkers in cancer patients and healthy controls is determined. - RNA biomarkers were selected using annotation and analysis of publicly available RNA expression profile data in the NCBI databases GSE6919 and GSE38241 as these data-sets include data from cancer free donors. The biomarkers shown in Table 1 below is a unique set identified as being over-expressed in subjects with prostate cancer. Similarly, the biomarkers shown in Table 2 is a second unique combination of RNA biomarkers identified as being under-expressed in subjects with prostate cancer.
- The NCBI database GSE6919, which was developed at the University of Pittsburgh, contains data from three Affymetrix chips (U95A, U95B and U95C), representing more than 36,000 gene reporters. The database, which has been analyzed by Chandran et al. (BMC Cancer 2005, 5:45; BMC Cancer 2007, 9:64), and Yu et al. (J Clin Oncol 2004, 22:2790-2799), contains RNA profiles from more than 200 individual prostate tumor samples, combined with adjacent "normal" or "healthy" tissues, or prostate tissues from individuals believed to be free of prostate cancer.
Table 1: RNA Biomarkers with Elevated Expression Levels in Prostate Cancer Patients REPORTER GENBANK ACCESSION GENE DESCRIPTION GENE SYMBOL SEQ ID NO: PRIMER SEQ ID NOS: PRIMER IDS 34777_at D14874 Adrenomedullin ADM 1 76, 77 ND654, ND655 38827_at AF038451 Anterior gradient 2 homolog AGR2 2 78, 79 ND543, ND544 37399_at D17793 Aldo-keto reductase family 1, member C3 AKR1C3 3 80, 81 ND498, ND499 41764_at AA976838 Apolipoprotein C-I ApoC1 4 82, 83 ND414, ND599 608_at M12529 Apolipoprotein E ApoE 5 84, 85 CH350, CH351 1577_at M23263 Androgen receptor AR 6 86, 87 ND460, ND461, ND532, ND533 88, 89 56999_at AI625959 Chromosome 15 open reading frame 48 C15ORF48 7 90, 91 CH075, CH076 36464_at X94323 cysteine-rich secretory CRISP3 8 92, 93 ND536, protein 3 ND537 40201_at M76180 Dopa decarboxylase DDC 9 94, 95 CH127, CH128 37156_at AF070641 ets variant gene 1 ETV1 10 96, 97 ND440, ND441 2084_s_at D12765 ets variant gene 4 (E1A enhancer binding protein, E1AF) ETV4 11 98, 99 ND410, ND411 35245_at M16967 F5, Coagulation factor V F5 12 100, 101 ND714, ND715 36622_at AI989422 Fibrinogen FGG 13 102, 103 ND442, ND443 36201_at D13315 Glycoxalase 1 GLO1 14 104, 105 CH186, CH187 39135_at AB018310 GRAM domain containing 4 GRAMD4 15 106, 107 ND484, ND589 48885_at R61847 Glutamate receptor, ionotropic N-methyl-D-aspartate 3A GRIN3A 16 108, 109 CH328, CH329 1039_s_at U22431 Hypoxia inducible factor 1, alpha subunit HIF-1A 17 110, 111 ND700, ND701 37851_at AF055019 Homeodomain interacting protein kinase: TF kinase HIPK2 18 112, 113 ND612, ND613 32480_at X07495 Homeobox C4 HOXC4 19 114, 115 ND422, ND423 56429_at AI525822 Homo sapiens hematological and neurological expressed 1 HN1 20 116, 117 ND490, ND491 32570_at L76465 Hydroxyprostaglandin dehydrogenase 15-(NAD) HPGD 21 118, 119 ND528, ND529 37639_at X07732 hepsin (transmembrane protease, serine 1) HPN 22 120, 121 ND595, ND596 63673_at AI635057 HSBP1 - Heat shock protein 27A HSBP1 23 122, 123 ND702, 703 1232_s_at M74587 Insulin like growth factor binding protein 1 precursor IGFBP1 24 124, 125 ND608, 609 1804_at X07730 kallikrein-related peptidase 3 KLK3 25 126, 127 128, 129 ND438, ND439 ND470, ND471 217_at, 41721_at S39329 kallikrein-related peptidase 2 KLK2 26 130, 131 ND418, ND419 62175_at AI50156 Homo sapiens laminin, alpha 1 LAMA1 27 132, 133 ND662, ND663 60019_at, 56912_at AA947309.1 Leucine rich repeat neuronal 1 - Homo sapiens leucine-rich repeats and calponin homology (CH) domain containing 4 (LRCH4) LRRN1 28 134, 135 ND428, ND429 1083_s_at, 927_at M35093 Mucin1 cell surface associated protein MUC1 29 136, 137 CH284, CH285 52116_at AI697679 Myelin expression factor 2 MYEF2 30 138, 139 ND396, ND397 35024_at L37362 OPRK1 receptor OPRK1 31 140, 141 ND404, ND405 ------ ------ Homo sapiens SET domain and mariner transposase fusion gene (SETMAR) transcript variant 3, non coding RNA PCAT1 32 142, 143 ND492, ND493 ------ ------ Homo sapiens uncharacterized LOC100506990, transcript variant 2 non-coding RNA PCAT14 33 144, 145 ND488, ND489 51776_s_at AI749525 PDZK1 interacting protein 1 PDZK1IP1 34 146, 147 ND500, ND501 31610_at U21049 59794_g_at AA872415 41281_s_at AF060502 Peroxisomal biogenesis factor 10 PEX10 35 148, 149 CH139, CH140 40116_at X16911 Homo sapiens phosphofructokinase, liver (PFKL) PFKL 36 150, 151 ND708, ND709 39175_at D25328 Homo sapiens phosphofructokinase, platelet (PFKP) gene PFKP 37 152, 153 ND696, ND697 41094_at Y10179 Prolactin Induced Protein PIP 38 154, 155 ND502, ND503 37068_at U24577 phospholipase A2, group VII (platelet-activating factor acetylhydrolase, plasma) PLA2G7 39 156, 157 CH212, CH213 63958_at AI583077 prostate stem cell antigen PSCA 40 158, 159 ND380, ND381 1739_at, 1740_g_at M99487 Prostate-specific membrane antigen PSMA 41 160, 161 ND402, ND403 33272_at AA829286 Serum amyloid A2 SAA2 42 162, 163 CH320, CH321 36781_at X01683 Serpin peptidase inhibitor clade A SERPINA1 43 164, 165 ND446, ND447 54293_at N30034 Solute carrier family 10, member 7 SLC10A7 44 166, 167 ND734, ND735 39926_at U59913 Homo sapiens SMAD family member 5 (SMAD5) SMAD5 45 168, 169 ND710, ND711 52576_s_at AW007426 Spondin 2 extracellular matrix protein SPON2 46 170, 171 ND358, ND359 34342_s_at AF052124 Osteopontin:secreted phophoprotein SPP1 47 172, 173 ND472, ND473 1938_at K03218 Homo sapiens v-src sarcoma (Schmidt-Ruppin A-2) viral oncogene homolog SRC 48 174, 175 ND704, ND705 ---- ----- Homo sapiens tudor domain containing 1 (TDRD1) TDRD1 49 176, 177 ND726, ND727 32154_at M36711 transcription factor AP-2 alpha (activating enhancer binding protein 2 alpha) TFAP2A 50 178, 179 ND494, ND495 47890_at AI921465 Homo sapiens transmembrane channel-like 5 (TMC5) TMC5 51 180, 181 ND670, ND671 45574_g_at AA534688 TPX2-microtubule associated TPX2 52 182, 183 ND436, ND437 57239_at AI439109 Homo sapiens isolate TRIB1-VI-T tribbles-like protein 1 TRIB1 53 184, 185 ND718,719 56508_at W22687 Tetraspanin 13 TSPAN13 54 186, 187 ND386, ND387 6315_f_at T50788 UDP glucuronosyltransferase 2 family polypeptide B15 UGT2B15 55 188, 189 ND452, ND453 33279_at X80062 acyl-CoA synthetase medium-chain family member 3 ACSM3 235 293, 294 NM_001106.3 ACVR2B 236 - 41706_at AJ130733 alpha-methylacyl-CoA racemase AMACR 237 - NM_000479.3 AMH 238 - 36106_at X01388 Apolipoprotein C-III ApoCIII 239 - 31355_at U77629.1 Achaete-scute complex homolog 2 ASCL2 240 - 56999_at AI625959 Chromosome 15 open reading frame 48 C15ORF4 8 241 - NM_178840.2 C1orf64 242 295, 296 NM_033150.2 COL2A1 243 - 39925_at M95610 collagen, type IX, alpha 2 COL9A2 244 - 40162_s_at AC003107 Cartilage Oligomeric Matrix protein precursor COMP 245 - 45399_at T77033 Cysteine-rich secretory protein LCCL domain containing 1 CRISPLD 1 246 297, 298 37020_at X56692 C-reactive protein CRP 247 - 35506_s_at J03870 Cystatin S CST4 248 299, 300 34623_at M97925 Defensin alpha 5, Paneth cell specific DEFA5 249 - 52138_at AI351043, AI351043 v-ets erythroblastosis virus E26 oncogene like (avian) ERG 250 - 45394_s_at AA563933 Family with sequence similarity 3, member D FAM3D 251 301-304 31685_at Y08976 FEV (ETS oncogene family) FEV 252 - NM_002046.4 GAPDH 253 - NM_0010985 18.1 GPR116 254 305, 306 32430_at M73481 Gastrin releasing peptide receptor GRPR 255 - 40327_at U57052 homeo box B13 HOXB13 256 - 36227_at AF043129 Interleukin 7 receptor IL7R 257 - 46958_at AI868421 Potassium voltage gated channel, Shaw-related subfamily, member 2 KCNC2 258 - 33606_g_at AF019415 NK2 homeobox NKX2-2 259 - NM_001136157.1 OTUD5 260 - NR_015342.1 PCA3 261 307, 308 33703_f_at, 33702_f_at L05144 Phophoenol pyruvate carboxy kinase I PCK1 262 - 39696_at AB028974 Paternally expressed 10 PEG10 263 - 58941_at AI765967 Phospholipase A1 PLA1A 264 - 62240_at AI096692 Proline rich 16 PRR16 265 - 33259_at M81652 Semenogelin II SEMG2 266 309, 310 928_at L02785 Solute carrier 26, member 3 SLC26A3 267 - 51847_at AA001450 Solute carrier family 44, member 5 SLC44A5 268 311, 312 35716_at AB008164 Sulfotransferase SULT1C2 269 313, 314 NM_003226.3 TFF3 270 - 40328_at X99268 TWIST homolog 1 TWIST1 271 - 1651_at U73379 Ubiquitin-conjugating enzyme E2C UBE2C 272 - 44403_at AI873501 Clone HH0011_E05 mRNA sequence 273 - Table 2: RNA Biomarkers Showing Reduced Expression Levels in Prostate Cancer Patients REPORTER GENBANK ACCESSION GENE DESCRIPTION GENE SYMBOL SEQ ID NO: PRIMER SEQ ID NOS: PRIMER ID'S 32200_at M24902 acid phosphatase, prostate ACPP 56 190, 191 ND496, ND497 35834_at X59766 Alpha-2-glycoprotein 1, zinc-binding AZGP1 57 192, 193 CH161, CH162 36780_at M25915 Clusterin CLU 58 194, 195 ND698, ND699 38700_at M33146 Cysteine and glycine-rich protein 1 CSRP1 59 196, 197, 198, 199 DR583, DR584, ND690, ND691 65988_at W19285 Early b-cell factor 3 EBF3 60 200, 201 ND730, ND731 38422_s_at U29332 4.5 LIM domains FHL2 61 202, 203 DR569, DR570 32749_s_at AL050396 filamin A FLNA 62 204, 205 ND624, ND625 53270_s_at AW021867 Homo sapiens mitogen-activated protein kinase kinase kinase 7 MAP3K7 63 206, 207 ND682, ND683 32149_at AA532495 microseminoprotein, beta- MSMB 64 208, 209 CH143, CH144 32847_at U48959 Myosin kinase MYLK 65 210, 211 DR567, DR568 33505_at, 1042_at, 62940_f_at AI887421 Retinoic acid responder RARRES1 66 212, 213 DR575, DR576 U27185 AI669229 64449_at AI810399 Selenoprotein M SELM1 67 214, 215 DR559, DR560 32521_at AF056087 Secreted frizzled-related protein 1 SFRP1 68 216, 217 DR555, DR556 39544_at AB002351 Synemin SYNM 69 218, 219 DR579, DR580 48039_at AI634580 Synaptopodin 2 SYNPO2 70 220, 221 DR737,738 32314_g_at M75165 Tropomyosin 2 TPM2 71 222, 223 DR565, DR566 32755_at X13839 Actin SM ACTA2 274 - 1197_at D00654 Actin gamma2 ACTG2 275 - 32527_at AI381790 Unknown C10orf116 276 315, 316 34203_at D17408 Calponin 1, basic, smooth muscle CNN1 277 317, 318 57241_at AI928870 Dystrobrevin binding protein 1 DBNDD2 278 - 38183_at U13219 Forkhead box F1 FOXF1 279 319, 320 33396_at U12472 glutathione S-transferase P1 GSTP1 280 - 53796_at AI819282 Potassium channel KCNMA1 281 321, 322 49502_i_at AI379607 Mutated in CRC MCC 282 323, 324 767_at AF001548 Myosin, heavy chain 11, smooth muscle MYH11 283, 284 - 37407_s_at AF013570 773_at D10667 774_g_at D10667 32582_at X69292 37576_at U52969 Purkinje cell protein 4 PCP4 285 - 63827_at AI479999 Solute carrier family 22, member 17 SLC22A1 7 286 325, 326 NM_016950. 2 SPOCK3 287 - For tests measuring the changes in frequency of RNA expression levels, it is essential to ensure adequate standardization. For this reason we have analyzed the NCBI database to identify reporters with the least variation between gene expression profiles, as shown in Table 3 below, in prostate cancer and healthy donor tissues. These reporters form a robust set of RNA expression standards that can be used where appropriate in tests involving quantification of RNA expression, such as in the modified RNA-seq technology described herein.
Table 3: Reporters with Least Variation between Gene Expression Profiles REPORTER PROBE GENE SYMBOL GENE DESCRIPTION SEQ ID NO: PRIMER SEQ ID NOS: PRIMER ID'S 35184_at AB011118 ZFC3H1 zinc finger, C3H1-type containing CCDC 131 72 224, 225 ND514, ND515 31826_at AB014574 FKBP15 FK506 binding protein 15, 133kDa 73 226, 227 ND468, ND469 39811_at AA402538 C19orf50 chromosome 19 open reading frame 50 74 228, 229, 230, 231 CH035, CH036, ND505 33397_at AL050383 CDIPT CDP-diacylglycerol--inositol 3-phosphatidyltransferase 75 231, 232 CH103, CH104 36003_at AJ005698 PARN poly(A)-specific ribonuclease (deadenylation nuclease) 288 - 35337_at AL050254 FBXO7 F-box protein 7 289 - F39020_at U82938 SIVA CD27-binding (Siva) protein polymerase 290 - 36027_at AA418779 POLR2F PDGFA associated protein 1291 - 38703_at AF005050 DNPEP Aspartyl aminopeptidase 292 - - Primers for the production of an RNA biomarker specific amplicon were created using a multistep primer design strategy. Specific intron-spanning primers were created to amplify an amplicon of a specific size (60-300bp) that can be used for Next Generation Sequencing (NGS).
- The primers were designed using Primer3 (v. 0.4.0) software and the primers were checked to ensure that certain criteria were met:
- No more than three C's or G's in the last five base pairs;
- No runs (more than three) of G's in either primer;
- No or limited self-complementarity, or hairpin formation; and
- Primer BLAST of the primer set hits the cognate RNA target of the expected size.
- In order to use these RNA specific amplicon primer sets for the RNA Biomarker Amplicon Sequencing (RBAS), nucleotides incorporating sequencing primers were added to the 5' end of the primers in the first round PCR as described in Table 4 below, and a second set of primers used for a second round of PCR were used to add further sequences containing an index and adaptor sequence.
Table 4: Specification of the added sequence to the RNA biomarker specific primer use for the first round PCR for biomarker specific amplicon 1st round PCR Sequence added to forward primer 5' end ACGACGCTCTTCCGATCT (SEQ ID NO: 233) Sequence added to reverse primer 5' end CGTGTGCTCTTCCGATCT (SEQ ID NO: 234) - All primers used in the studies described herein were designed by the inventors and supplied by Invitrogen or IDT, except for a set of primers for PSA (KLK3) which are taught by Hessels et al. (European Urology 44: 8-16, 2003.
- The ability of RNA Biomarker Amplicon Sequencing (RBAS) to be used for the accurate detection and relative quantification of multiple RNA biomarkers was demonstrated by:
- a) producing a selected set of 25 specific RNA biomarker amplicons from LNCaP cells (epithelial cell line derived from androgen-sensitive human prostate adenocarcinoma lymph node metastasis) and A549 cells (epithelial cell line derived from lung alveolar basal tissue); and
- b) detecting and measuring the relative abundance of the LNCaP- and A549-derived RNA biomarker specific amplicons by massive parallel sequencing.
- An amplicon is defined as the specific amplification product obtained by PCR using a pair of oligonucleotide primers targeted to a specific RNA biomarker. The template used for the amplicon production was the single strand DNA complementary to the RNA extracted from LNCaP and A549 cells (see method section above). The cDNA was produced using random primers in this example but biomarker specific primers can also be used to initiate the reverse transcription from the extracted RNA.
- DNA amplicons compatible with Illumina Corporation's Next Generation Sequencing technology were produced in this example. Amplicons compatible for sequencing using other NGS technology can also be prepared using the same rationale. The 25 specific primer pairs were targeted to 21 prostate cancer RNA biomarkers and 4 reference RNA biomarkers and contained added sequences for adaptor introduction to the 5' and 3' ends of the amplicons according to Illumina's specification (the RNA biomarker selection and primer design strategies are presented in the method section above).
- Technical triplicates for each individual RNA biomarker were produced during a first round of PCR. The same cDNAs produced from RNA of LNCaP or A549 cells were used as a template for each of the three separate first round PCR amplifications. Six amplicon pools were then prepared by combining equal volumes of each of the 25 biomarker specific amplicons produced individually during the first round PCRs. These six amplicon pools, technical triplicates for each of the two cell types, were purified to remove residual primers and dNTPs using Agencourt AMPureXP system (Beckman Coulter, Inc.), and then analyzed with the 2100 Bioanalyser (Agilent Technologies Inc.) and Qubit® 2.0 Fluorometer (Life Technologies) to ascertain quality, average size distribution and the concentration of amplicons in each pool.
- After dilution, the six cleaned amplicon pools were used as individual templates for the second round PCR performed with sequencing primers specific for the adaptor added during the first round PCR. The sequencing primers also contained a barcode sequence for indexing and a tag sequence for clustering. The amplicon libraries produced during the second round PCR were analyzed and the concentration determined using the 2100 Bioanalyser (Agilent Technologies, Inc.) and Qubit® (Life Technologies - Invitrogen). Residual primers and dNTPs were removed using Agencourt AMPureXP system (Beckman Coulter, Inc.) and then pooled together at equimolar concentration to produce a single amplicon library sequencing pool. The sequencing pool was denatured and further diluted for cluster generation and sequenced on a HiSeq2000 according to Illumina Corporation's standard protocols (208 cycles sequencing program, paired-end with indexing).
- Illumina bcl2fastq conversion software (version 1.8.3) was used for the demultiplexing of the sequence reads acquired during the sequencing program and base call conversion to fastq paired end read data. Quality statistics for percentage of bases > Q30 and mean QScore for all reads showed that all amplicon libraries sequenced and de-multiplexed very well. This data set was used to generate the read counts per amplicon (Read counts (Rc) Tables 5 and 6). This is the number of sequencing reads of at least 50bp in length that map to the corresponding amplicon. This number is directly proportional to the amount of the amplicon in the library, and is also proportional to the specific RNA biomarker abundance from which the amplicon was derived.
- By using the read count obtained for each amplicon it is thus possible to establish a precise assessment of the relative abundance of the corresponding RNA biomarkers in each sample studied.
- Different methods can be used for the normalization of the read count to minimize biases generated by the acquisition of wide count distribution by massive parallel sequencing. The average of the read counts obtained from the four reference amplicons were used to normalize the raw read counts of the amplicons produced from the LNCaP and A549 RNA using the 21 primer pairs specific for the prostate cancer RNA biomarkers. The reference amplicons were made with specific primers targeted to four different RNA biomarkers selected due to their low level of expression variation between different prostate cancer and healthy donor control tissues. The raw counts obtained for the four reference amplicons derived from A549 and LNCaP RNA were consistent between replicates and between the two cell types compared (Table 5). The data confirms the low level of differential expression of these reference RNAs and validates the selection of these RNA biomarkers as reference amplicons.
Table 5: Read counts obtained in triplicate (Rep. 1, 2, 3) for the four Reference Amplicons (Ref) a) Reference read Counts from A549 amplicons Ref. Rep.1 Rep.2 Rep.2 Avr. StDev CDIPT 520,522 513,026 531,305 242,890 13,173 C19orf50 209,037 211,595 210,174 210,268 1,282 ZFC3HI. 207,606 222,590 311,090 247,095 55,925 FKBP15 11,112 40,746 23,749 25,202 14,870 Avr. Ref. 237,069 246,989 269,079 160,855 b) Reference read Counts from LNCaP amplicons Ref. Rep.1 Rep.2 Rep.2 Avr. StDev CDIPT 473,707 590,290 533,300 267,674 44,723 C19orf50 236,952 283,338 380,160 300,150 73,069 ZFC3HI. 96,551 201,322 160,785 152,886 52,830 FKBP15 37,939 80,900 39,426 52,755 24,386 Avr. Ref. 211,287 288,962 278,418 168,597 - In Table 6, the normalization of the read count for each of the non-reference RNA biomarker specific amplicons derived from LNCaP and A549 RNA (termed target amplicons) was calculated by dividing each target read count by the average read count calculated from the mean of the four reference amplicons either from LNCaP or A549 RNA. This normalization was performed for each replicate (Table 6: target amplicon read counts/ average references read counts).
- The assessment of the RNA biomarker differential expression fold change (FC) between the LNCaP and A549 cells was performed by comparing the normalized read counts per amplicon converted to a log2 number. The log2 FC was calculated for the read counts before (raw read counts) and after normalization (Normalised read counts) and was compared in order to assess the effect of the amplicon library count distributions on the evaluation of the differential expression (Table 6). The data in Table 6 compares the expression of 21 target RNA biomarkers in LNCaP and A549 cells. A negative log2 number indicates a decrease, or down regulation of RNA biomarkers while a positive log2 number indicates an increase, or up regulation of RNA biomarkers.
Table 6: Read counts and relative quantification (Log 2 FC) of RNA biomarker specific amplicons derived from LNCaP RNA compared with A549 RNA Fold change (FC) calculated with the raw read count (Rc) FC calculated with the normalized count normalised read count (Rc) Rc Log2 Log2 FC LNCaP/ A549 Rc Log 2 Log2 FC LNCaP/ A549 A549 LNCaP A549 LNCaP A549 LNCaP A549 LNCaP ACPP Rep.1 108 52,877 6.8 15.7 8.9 0.0005 0.2503 -11.1 -2 9.1 Rep.2 145 51,052 7.2 15.6 8.9 0.0006 0.1767 -10.7 -2.5 8.2 Rep.3 143 63,492 7.2 16 9.2 0.0005 0.2280 -10.9 -2.1 8.7 Avr. 132 55,807 7 15.8 9 0.0005 0.2183 -10.9 -2.2 8.7 Stdev 21 6,718 0.2 0.2 -0.2 0.0001 0.0377 0.2 0.3 0.4 AGR2 Rep.1 676,547 48,098 19.4 15.6 -3.8 2.8538 0.2276 1.5 -2.1 -3.6 Rep.2 703,769 63,188 19.4 15.9 -3.4 2.8494 0.2187 1.5 -2.2 -3.7 Rep.3 712,083 71,317 19.4 16.1 -3.2 2.6464 0.2562 1.4 -2 -3.4 Avr. 697,466 60,868 19.4 15.9 -3.5 2.7832 0.2342 1.5 -2.1 -3.6 Stdev 18,587 11,782 0 0.3 0.3 0.1185 0.0196 0.1 0.1 0.2 AKRI C3 Rep.1 773,556 10,121 19.6 13.3 -6.3 3.2630 0.0479 1.7 -4.4 -6.1 Rep.2 763,968 12,768 19.5 13.6 -5.9 3.0931 0.0442 1.6 -4.5 -6.1 Rep.3 721,042 16,204 19.5 14 -5.6 2.6797 0.0582 1.4 -4.1 -5.5 Avr. 752,855 13,031 19.5 13.6 -5.9 3.0119 0.0501 1.6 -4.3 -5.9 Stdev 27,965 3,050 0.1 0.3 0.3 0.3000 0.0073 0.1 0.2 0.3 AR460 Rep.1 147,236 257,216 17.2 18 0.8 0.6211 1.2174 -0.7 0.3 1 Rep.2 145,185 272,469 17.1 18.1 0.9 0.5878 0.9429 -0.8 -0.1 0.7 Rep.3 146,121 237,525 17.2 17.9 0.7 0.5430 0.8531 -0.9 -0.2 0.7 Avr. 146,181 255,737 17.2 18 0.8 0.5840 1.0045 -0.8 0 0.8 Stdev 1,027 17,519 0 0.1 0.1 0.0392 0.1898 0.1 0.3 0.2 AR532 Rep.1 267,160 1,062,23 0 18 20 2 1.1269 5.0274 0.2 2.3 2.2 Rep.2 267,201 431,144 18 18.7 0.7 1.0818 1.4920 0.1 0.6 0.5 Rep.3 295,910 448,932 18.2 18.8 0.7 1.0997 1.6124 0.1 0.7 0.6 Avr. 276,757 647,435 18.1 19.2 1.1 1.1028 2.7106 0.1 1.2 1.1 Stdev 16,587 359,333 0.1 0.7 -0.7 0.0227 2.0073 0 1 1 AZGP 1Rep.1 324 129,118 8.3 17 8.6 0.0014 0.6111 -9.5 -0.7 8.8 Rep.2 240 104,903 7.9 16.7 8.3 0.0010 0.3630 -10 -1.5 8.5 Rep.3 308 79,348 8.3 16.3 7.9 0.0011 0.2850 -9.8 -1.8 8 Avr. 291 104,456 8.2 16.6 8.3 0.0012 0.4197 -9.8 -1.3 8.4 Stdev 45 24,888 0.2 0.4 0.4 0.0002 0.1703 0.2 0.6 0.4 CRISP 3Rep.1 74 9,068 6.2 13.1 6.9 0.0003 0.0429 -11.6 -4.5 7.1 Rep.2 131 6,967 7 12.8 6.6 0.0005 0.0241 -10.9 -5.4 5.5 Rep.3 302 7,297 8.2 12.8 6.6 0.0011 0.0262 -9.8 -5.3 4.5 Avr. 169 7,777 7.2 12.9 6.7 0.0007 0.0311 -10.8 -5.1 5.7 Stdev 119 1,130 1 0.2 0.2 0.0004 0.0103 0.9 0.4 1.3 DDC Rep.1 11,844 403,659 13.5 18.6 5.1 0.0500 1.9105 -4.3 0.9 5.3 Rep.2 13,632 448,386 13.7 18.8 5.2 0.0552 1.5517 -4.2 0.6 4.8 Rep.3 47,271 404,380 15.5 18.6 5.1 0.1757 1.4524 -2.5 0.5 3 Avr. 24,249 418,808 14.3 18.7 5.1 0.0936 1.6382 -3.7 0.7 4.4 Stdev 19,958 25,618 1.1 0.1 0.1 0.0711 0.2410 1 0.2 1.2 ETV1 Rep.1 80,571 574,119 16.3 19.1 2.8 0.3399 2.7172 -1.6 1.4 3.0 Rep.2 65,909 594,479 16 19.2 2.9 0.2668 2.0573 -1.9 1 2.9 Rep.3 76,805 645,353 16.2 19.3 3 0.2854 2.3179 -1.8 1.2 3.0 Avr. 74,428 604,650 16.2 19.2 2.9 0.2974 2.3642 -1.8 1.2 2.9 Stdev 7,614 36,690 0.2 0.1 0.1 0.0379 0.3324 0.2 0.2 0 ETV4 Rep.1 222,417 1,426 17.8 10.5 -7.3 0.9382 0.0067 -0.1 -7.2 -7.1 Rep.2 197,816 2,018 17.6 11 -6.8 0.8009 0.0070 -0.3 -7.2 -6.8 Rep.3 187,812 2,698 17.5 11.4 -6.4 0.6980 0.0097 -0.5 -6.7 -6.2 Avr. 202,682 2,047 17.6 11 -6.8 0.8124 0.0078 -0.3 -7 -6.7 Stdev 17,808 637 0.1 0.5 -0.5 0.1205 0.0016 0.2 0.3 0.5 HN1 Rep.1 292,321 311,090 18.2 18.2 0.1 1.2331 1.4724 0.3 0.6 0.3 Rep.2 257,665 362,158 18 18.5 0.3 1.0432 1.2533 0.1 0.3 0.3 Rep.3 246,021 348,395 17.9 18.4 0.3 0.9143 1.2513 -0.1 0.3 0.5 Avr. 265,336 340,548 18 18.4 0.2 1.0635 1.3257 0.1 0.4 0.3 Stdev 24,084 26,423 0.1 0.1 -0.1 0.1603 0.1270 0.2 0.1 0.1 MUC1 Rep.1 13,230 924 13.7 9.9 -3.8 0.0558 0.0044 -4.2 -7.8 -3.7 Rep.2 13,647 902 13.7 9.8 -3.9 0.0553 0.0031 -4.2 -8.3 -4.1 Rep.3 17,202 941 14.1 9.9 -3.8 0.0639 0.0034 -4 -8.2 -4.2 Avr. 14,693 922 13.8 9.8 -3.8 0.0583 0.0036 -4.1 -8.1 -4.3 Stdev 2,183 20 0.2 0 0.1 0.0049 0.0007 0.1 0.3 0.3 MYL K Rep.1 293,518 24,448 18.2 14.6 -3.6 1.2381 0.1157 0.3 -3.1 -3.4 Rep.2 276,460 31,241 18.1 14.9 -3.2 1.1193 0.1081 0.2 -3.2 -3.4 Rep.3 251,537 22,665 17.9 14.5 -3.7 0.9348 0.0814 -0.1 -3.6 -3.5 Avr. 273,838 26,118 18.1 14.7 -3.5 1.0974 0.1017 0.1 -3.3 -3.4 Stdev 21,113 4,525 0.1 0.2 0.2 0.1528 0.0180 0.2 0.3 0.1 PCAT 1Rep.1 114,546 386,617 16.8 18.6 1.8 0.4832 1.8298 -1 0.9 1.9 Rep.2 124,881 385,426 16.9 18.6 1.8 0.5056 1.3338 -1 0.4 1.4 Rep.3 208,422 413,859 17.7 18.7 1.9 0.7746 1.4865 -0.4 0.6 0.9 Avr. 149,283 395,301 17.1 18.6 1.8 0.5878 1.5500 -0.8 0.6 1.4 Stdev 51,476 16,083 0.5 0.1 0.1 0.1622 0.2540 0.4 0.2 0.5 PDZK1 IP1 Rep.1 125,239 4,428 16.9 12.1 -4.8 0.5283 0.0210 -0.9 -5.6 -4.7 Rep.2 118,631 11,141 16.9 13.4 -3.5 0.4803 0.0386 -1.1 -4.7 -3.6 Rep.3 111,850 8,550 16.8 13.1 -3.9 0.4157 0.0307 -1.3 -5 -3.8 Avr. 118,573 8,040 16.9 12.9 -4.1 0.4748 0.0301 -1.1 -5.1 -4.3 Stdev 6,695 3,385 0.1 0.7 0.7 0.0565 0.0088 0.2 0.4 0.6 PEX10 Rep.1 115,769 308,004 16.8 18.2 1.4 0.4883 1.4578 -1 0.5 1.6 Rep.2 137,943 378,401 17.1 18.5 1.7 0.5585 1.3095 -0.8 0.4 1.2 Rep.3 231,140 344,061 17.8 18.4 1.6 0.8590 1.2358 -0.2 0.3 0.5 Avr. 161,617 343,489 17.2 18.4 1.6 0.6353 1.3343 -0.7 0.4 1.1 Stdev 61,221 35,202 0.5 0.1 0.1 0.1969 0.1131 0.4 0.1 0.5 PSCA Rep.1 4,960 24,551 12.3 14.6 2.3 0.0209 0.1162 -5.6 -3.1 2.5 Rep.2 2,638 27,668 11.4 14.8 2.5 0.0107 0.0957 -6.5 -3.4 3.2 Rep.3 2,396 23,267 11.2 14.5 2.2 0.0089 0.0836 -6.8 -3.6 3.2 Avr. 3,331 25,162 11.6 14.6 2.3 0.0135 0.0985 -6.3 -3.4 2.9 Stdev 1,416 2,263 0.6 0.1 0.1 0.0065 0.0165 0.6 0.2 0.4 SYNM Rep.1 177,946 14,501 17.4 13.8 -3.6 0.7506 0.0686 -0.4 -3.9 -3.5 Rep.2 164,377 16,199 17.3 14 -3.5 0.6655 0.0561 -0.6 -4.2 -3.6 Rep.3 154,079 14,466 17.2 13.8 -3.6 0.5726 0.0520 -0.8 -4.3 -3.5 Avr. 165,467 15,055 17.3 13.9 -3.6 0.6629 0.0589 -0.6 -4.1 -3.5 Stdev 11,971 991 0.1 0.1 0.1 0.0890 0.0087 0.2 0.2 0.1 TFAP 2A Rep.1 94,299 27,021 16.5 14.7 -1.8 0.3978 0.1279 -1.3 -3 -1.6 Rep.2 106,592 25,883 16.7 14.7 -1.9 0.4316 0.0896 -1.2 -3.5 -2.3 Rep.3 127,323 28,986 17 14.8 -1.7 0.4732 0.1041 -1.1 -3.3 -2.2 Avr. 109,405 27,297 16.7 14.7 -1.8 0.4342 0.1072 -1.2 -3.2 -2.0 Stdev 16,691 1,570 0.2 0.1 0.1 0.0378 0.0193 0.1 0.3 0.3 TPM2 Rep.1 647,658 18,974 19.3 14.2 -5.1 2.7319 0.0898 1.4 -3.5 -4.9 Rep.2 571,092 21,325 19.1 14.4 -4.9 2.3122 0.0738 1.2 -3.8 -5 Rep.3 570,539 27,813 19.1 14.8 -4.5 2.1203 0.0999 1.1 -3.3 -4.4 Avr. 596,430 22,704 19.2 14.5 -4.9 2.3882 0.0878 1.2 -3.5 -4.8 Stdev 44,366 4,578 0.1 0.3 0.3 0.3128 0.0132 0.2 0.2 0.3 UGT2 B15 Rep.1 524 317,083 9 18.3 9.2 0.0022 1.5007 -8.8 0.6 9.4 Rep.2 535 154,557 9.1 17.2 8.2 0.0022 0.5349 -8.9 -0.9 7.9 Rep.3 2,478 294,434 11.3 18.2 9.1 0.0092 1.0575 -6.8 0.1 6.8 Avr. 1,179 255,358 9.8 17.9 8.9 0.0045 1.0310 -8.1 -0.1 8.1 Stdev 1,125 88,028 1.3 0.6 0.6 0.0041 0.4835 1.2 0.8 1.3 - The data shows that the difference between FC values calculated either using the log2 value for raw counts or the log2 value for the normalized counts is not large. However, the normalization process allows a more accurate detection of the relative difference in expression of RNA biomarkers in A549 and LNCaP cells.
- For the data in Table 7 we have accepted Log2 FC values greater than 2 are significant and grouped the expression levels of the 21 prostate cancer specific RNA biomarkers tested using LNCaP and A549 RNA in two groups: Log2FC >2; and Log2FC <2.
Table 7: Comparison of Log 2 FC expression levels of RNA biomarkers in LNCaP and A549 RNA Log2 Fc Elevated expression in LNCaP RNA Elevated expression in A549 RNA Log2 Fc>2 ACPP, AZGP1, CRISP3, DDC, UGT2B15, ETV1 PSCA AKRIC3, ETV4 , MUC1,PDZK1IP1, TPM2, AGR2, MYLK,, SYNM Log2 Fc<2 AR460, AR532, HN1, PCAT1, PEX10 TFAP2A - The data reveals an even split of RNA biomarkers with Log2 FC >2 between the two RNAs.
- The data contained in Table 8 are basic statistical analyses of the Log2 FC differences between the 21 RNA biomarkers expressed in LNCaP and A549 RNA calculated by dividing the normalized Log2 FC of each RNA biomarker from LNCaP RNA by the corresponding Log2 FC from A549 RNA. The level of differential expression calculated by the limma-based linear model fit analysis (T= limma moderated t- statistic) highlights some significant levels of differential expression of the RNA biomarker between the LNCaP and A549 cell types (T value) with correlating P value.
Table 8: Significance levels comparing the differential expression of each RNA biomarker between LNCaP and A549 cells Target Log2 FC difference t P.Value adj.P.Val ACPP 8.7 30 9.E-14 2.E-12 AZGP1 8.4 24 3.E-12 6.E-11 UGT2B15 8.1 15 1.E-09 2.E-08 ETV4 -6.7 -24 2.E-12 6.E-11 AKRIC3 -5.9 -22 6.E-12 1.E-10 CRISP3 5.7 13 4.E-09 7.E-08 TPM2 -4.9 -17 1.E-10 3.E-09 DDC 4.4 --10 2.E-07 2.E-06 MUC1 -4.3 -15 9.E-10 2.E-08 PDZKIP1 -4.3 -14 2.E-09 3.E-08 AGR2 -3.6 -14 2.E-09 3.E-08 SYNM -3.5 -13 5.E-09 9.E-08 MYLK -3.4 -13 7.E-09 1.E-07 PSCA 2.9 7 5.E-06 5.E-05 ETV1 2.9 9 3.E-07 4.E-06 TFAP2A -2.0 -8 2.E-06 2.E-05 PCAT1 1.4 4 2.E-03 2.E-02 AR532 1.1 2 8.E-02 5.E-01 AR460 0.8 2 9.E-02 5.E-01 PEX10 1.1 3 1.E-02 9.E-02 HN1 0.3 0 8.E-01 1.E+00 - These two cell lines, LNCAP and A549, were chosen for this example to demonstrate a proof of concept by comparing RNA biomarker expression in two cell lines; one (LNCaP cells) of prostate origin and the other (A549 cells) of lung origin. As might be expected, there is significant differential expression between these two cell lines of the RNA biomarkers chosen on the basis of their possible involvement in prostate cancer.
- The data provided in the above example shows that it is possible to detect the change in expression of specific RNA biomarkers through quantitative amplicon synthesis followed by enumeration using a Next Generation DNA sequencing methodology.
- This example demonstrates that the RNA amplicon biomarker sequencing (RBAS) method is diagnostically and prognostically relevant by quantifying the relative expression of 79 RNA biomarkers using amplicon production and NGS to establish their RNA expression profile in prostate cancer tissues.
- Stored formalin-fixed paraffin embedded (FFPE) prostatectomy tissue blocks were reviewed by a clinical histopathologist to select tissues for analysis. Prostatectomy tissue from two subjects was selected.
-
Subject 1 is a 63 year old male who underwent a prostate biopsy in 2007 and was diagnosed with prostate cancer with a Gleason score of 4+5. The subject underwent a radical prostatectomy at the age of 58. A stored FFPE block containing the original prostatectomy tissue was re-examined and a tumor region was identified with a Gleason score of 4+5. The region identified was reset in paraffin and then sectioned. Three tissue samples were selected fromSubject 1 for RNA extraction: Tumor tissue 4+5 (T); adjacent glandular tissue (Adj.G); and adjacent muscle tissue (Adj.M) deemed histologically normal. -
Subject 2 is a 67 year old male who underwent a prostate biopsy in 2012 and was diagnosed with prostate cancer with a Gleason score of 3+4. The subject underwent a radical prostatectomy at the age of 66. A stored FFPE block containing the prostatectomy tissue was re-examined. Three tumors were identified with different Gleason scores, 4+5 (T1), 3+4 (T2) and 3+3 (T3) respectively. The different regions from the blocks were reset, and then sectioned. Tissue samples were selected from each of the three tumor regions as well as an adjacent glandular tissue (Adj.G) deemed histologically normal. No Adj.M region was identified inSubject 2 tissue samples. - Total RNA was extracted separately from the seven selected tissue samples from
Subject - As described in Example 1, Illumina bcl2fastq conversion software (version 1.8.3) was used to obtain the number of sequence reads per amplicon (read counts).
- The raw counts of the five reference amplicons from each of the sequencing runs (Run1, Run2) is presented in Table 9. The sequence counts for all the reference amplicons were lower in
run 1 than therun 2. However, the ratio of the individual reference RNA biomarkers to each other was very similar in the two runs.Table 9A: Subject 1 - Average of raw counts for the triplicates for reference amplicons tested in triplicates from Tumor (T) and adjacent glandular (AdjG) or adjacent muscular (AdjM) RNA samples T Adj.G Adj.M Run 1 Avr. StDev Avr StDev Avr. StDev CDIPT 181,602 108,375 69,387 25,776 109,665 22,597 FKBP15 26,420 14,819 14,726 5,349 19,283 9,148 ZFC3H1 26,996 13,809 11,019 4,804 10,355 5,742 C19orf50.35/36 11,518 5,887 4,873 1,696 7,909 3,387 C19orf50.35/505 11,484 5,941 4,892 1,738 8,029 3,384 Avr. 51,604 28,926 20,979 6,330 31,048 7,989 T Adj.G Adj.M Run 2 Avr. StDev Avr StDev Avr. StDev CDIPT 579,696 428,581 392,492 26,856 312,658 28,339 FKBP15 107,916 67,181 91,199 4,604 52,760 10,832 ZFC3H1 164,089 104,640 75,341 2,445 82,436 13,887 C19orf50.35/36 39,019 27,178 33,147 6,143 23,112 5,425 C19orf50 .35/505 39,049 26,955 32,880 6,194 23,372 5,712 Avr. 185,954 130,620 125,012 5,966 98,868 6,648 Table 9B: Subject 2 - Average raw counts for the triplicate reference amplicons from Tumors (T1,T2 and T3) and adjacent glandular (Adj.G) RNA samples T1 Adj. G T2 Run 1 Avr. StDev Avr StDev Avr. StDev CDIPT 141,808 57,175 108,540 13,054 157,843 84,787 FKBP15 32,004 1,364 11,053 9,047 11,090 2,664 ZFC3H1 25,860 7,845 21,315 10,432 21,694 9,172 C19orf50 35/36 5,514 368 3,478 699 4,377 2,372 C19orf50 35/505 5,578 246 3,418 792 4,278 2,306 Avr. 42,153 13,400 29,561 1,977 39,856 19,405 T3 Adj. G T2 Run 2 Avr. StDev Avr StDev Avr. StDev CDIPT 453,616 163,307 482,506 80,991 444,554 19,270 FKBP15 82,124 40,266 69,754 10,656 90,864 19,203 ZFC3H1 124,362 54,650 99,653 31,461 138,021 19,628 C19orf50 (35/36) 14,934 5,048 11,097 4,414 20,073 8,693 C19orf50 (35/505) 14,997 5,010 11,129 4,241 20,223 8,519 Avr. 138,007 50,711 134,828 20,977 142,747 10,484 - The raw counts obtained for the reference amplicons presented in Table 9 were generally consistent between replicates across the prostatectomy-derived RNA samples and the data supports the selection of these RNA biomarkers as reference amplicons.
- The average of the read counts from the five reference amplicons was used to normalize the raw read counts of the amplicons produced from the appropriate tumor and adjacent glandular and muscular tissue pairings.
- For the analysis of
Subject 1, the data compared the relative expression of the RNA biomarkers between tumor tissue and both adjacent glandular and adjacent muscular tissue. The raw counts of triplicate samples from tumor tissue and both adjacent glandular and adjacent muscular tissue is given followed by the log2 normalized counts. The log2 FC expression of each RNA biomarker from the tumor region of the prostatectomy tissue RNA samples is given relative to the adjacent glandular and muscular adjacent muscular tissue RNA. Finally the log2 FC of the adjacent glandular relative to the muscular adjacent muscular tissue RNA is presented (Table 10). - Those RNA biomarkers with a differential amplicon count (Log2 FC >2) from
Subject 1 were selected from the tumor, adjacent glandular and adjacent muscular samples with the data being presented in Table 11.Table 10: Subject 1 - Raw read counts, Log 2 normalization of the read counts and relative quantification (Log 2 FC) of RNA biomarker specific amplicons Raw read counts (Rc) Log2 Normalised Rc Differential Expression (Log2 FC) T Adj.G Adj.M T Adj.G Adj.M T/ Adj.G T/ Adj.M Adj.G/ Adj.M ACPP Rep.1 218,083 640,127 31,967 2.94 5.24 0.51 -2.30 2.43 4.734 Rep.2 163,669 656,380 30,575 1.95 5.21 -0.33 -3.26 2.27 5.534 Rep.3 700,788 883,399 31,581 3.06 4.97 -0.04 -1.91 3.10 5.001 Avr. 360,847 726,635 31,374 2.65 5.14 0.05 -2.49 2.60 5.09 StDv 295,652 136,004 719 0.61 0.15 0.42 0.70 0.44 0.407 AGR2 Rep.1 131,239 31,120 6,276 2.21 0.88 -1.84 1.33 4.05 2.72 Rep.2 162,340 35,938 4,981 1.94 1.02 -2.94 0.92 4.88 3.961 Rep.3 476,179 49,861 3,389 2.50 0.82 -3.26 1.68 5.76 4.074 Avr. 256,586 38,973 4,882 2.22 0.91 -2.68 1.31 4.90 3.585 StDv 190,808 9,732 1,446 0.28 0.10 0.74 0.38 0.85 0.751 AKR1C3 Rep.1 7,565 7,573 11,688 -1.91 -1.16 -0.94 -0.75 -0.97 -0.22 Rep.2 11,053 8,093 27,577 -1.94 -1.13 -0.47 -0.81 -1.47 -0.66 Rep.3 25,510 11,563 19,632 -1.72 -1.29 -0.72 -0.43 -1.00 -0.57 Avr. 14,709 9,076 19,632 -1.86 -1.19 -0.71 -0.66 -1.14 -0.48 StDv 9,515 2,169 7,945 0.12 0.08 0.24 0.20 0.28 0.234 ADM Rep.1 383 177 45 -6.21 -6.58 -8.96 0.37 2.75 2.386 Rep.2 6,725 794 2,117 -2.66 -4.48 -4.18 1.83 1.52 -0.31 Rep.3 3,618 497 34 -4.54 -5.83 -9.89 1.29 5.36 4.064 Avr. 3,575 489 732 -4.47 -5.63 -7.68 1.16 3.21 2.049 StDv 3,171 309 1,199 1.78 1.06 3.07 0.74 1.96 2.204 AR(460) Rep.1 87,414 63,945 64,627 1.62 1.92 1.52 -0.30 0.10 0.395 Rep.2 106,349 75,612 98,985 1.33 2.09 1.37 -0.76 -0.04 0.721 Rep.3 201,173 84,483 62,643 1.26 1.58 0.95 -0.32 0.31 0.626 Avr. 131,645 74,680 75,418 1.40 1.86 1.28 -0.46 0.12 0.581 StDv 60,952 10,301 20,433 0.19 0.26 0.30 0.26 0.18 0.168 AR(532) Rep.1 42,868 43,461 22,464 0.59 1.36 0.00 -0.77 0.59 1.363 Rep.2 67,215 21,630 28,560 0.67 0.29 -0.42 0.38 1.09 0.709 Rep.3 111,816 60,319 43,444 0.41 1.09 0.43 -0.68 -0.01 0.668 Avr. 73,966 41,803 31,489 0.56 0.91 0.00 -0.36 0.56 0.913 StDv 34,966 19,398 10,792 0.13 0.56 0.42 0.64 0.55 0.39 AZGP1 Rep.1 198,131 545,971 35,292 2.80 5.01 0.65 -2.21 2.15 4.362 Rep.2 104,449 650,870 23,844 1.30 5.20 -0.68 -3.90 1.98 5.88 Rep.3 672,265 871,798 40,138 3.00 4.95 0.31 -1.95 2.69 4.636 Avr. 324,948 689,546 33,091 2.37 5.05 0.09 -2.68 2.28 4.959 StDv 304,410 166,321 8,367 0.93 0.13 0.69 1.06 0.37 0.809 CLU Rep.1 26,673 24,462 48,500 -0.09 0.53 1.11 -0.62 -1.20 -0.58 Rep.2 36,616 30,951 103,633 -0.21 0.80 1.44 -1.01 -1.65 -0.63 Rep.3 92,251 52,909 71,777 0.13 0.90 1.15 -0.77 -1.01 -0.25 Avr. 51,847 36,107 74,637 -0.06 0.75 1.23 -0.80 -1.29 -0.49 StDv 35,343 14,908 27,678 0.18 0.19 0.18 0.20 0.33 0.21 CRISP3 Rep.1 13,110 984 266 -1.12 -4.10 -6.40 2.99 5.29 2.298 Rep.2 17,388 4 10 -1.29 -12.12 -11.90 10.83 10.62 -0.21 Rep.3 17,838 143 36 -2.24 -7.63 -9.81 5.39 7.58 2.185 Avr. 16,112 377 104 -1.55 -7.95 -9.37 6.40 7.83 1.423 StDv 2,610 530 141 0.60 4.02 2.78 4.02 2.67 1.418 DDC Rep.1 49 1 2 -9.18 -14.05 -13.46 4.87 4.28 -0.59 Rep.2 1 1 1 -15.37 -14.12 -15.23 -1.26 -0.15 1.11 Rep.3 199 601 670 -8.72 -5.56 -5.59 -3.17 -3.13 0.038 Avr. 83 201 224 -11.09 -11.24 -11.43 0.15 0.33 0.186 StDv 103 346 386 3.71 4.92 5.13 4.20 3.73 0.859 ETV1 Rep.1 323,226 19,968 28,271 3.51 0.24 0.33 3.27 3.18 -0.09 Rep.2 470,090 16,096 42,166 3.47 -0.14 0.14 3.61 3.33 -0.28 Rep.3 697,535 24,370 28,491 3.05 -0.21 -0.18 3.27 3.24 -0.03 Avr. 496,950 20,145 32,976 3.34 -0.04 0.10 3.38 3.25 -0.13 StDv 188,595 4,140 7,960 0.25 0.24 0.26 0.20 0.08 0.13 ETV4 Rep.1 501 1,011 829 -5.83 -4.06 -4.76 -1.76 -1.06 0.697 Rep.2 2 871 2 -14.37 -4.35 -14.23 -10.02 -0.15 9.876 Rep.3 1,636 571 10 -5.68 -5.63 -11.66 -0.05 5.98 6.03 Avr. 713 818 280 -8.63 -4.68 -10.22 -3.95 1.59 5.534 StDv 837 225 475 4.98 0.83 4.89 5.33 3.83 4.61 FLNA Rep.1 427,572 338,722 869,661 3.91 4.32 5.27 -0.41 -1.36 -0.95 Rep.2 374,615 451,638 1,877,290 3.14 4.67 5.62 -1.53 -2.47 -0.95 Rep.3 1,169,697 462,865 1,064,855 3.80 4.03 5.04 -0.23 -1.24 -1.01 Avr. 657,295 417,742 1,270,602 3.62 4.34 5.31 -0.72 -1.69 -0.97 StDv 444,543 68,663 534,395 0.41 0.32 0.29 0.70 0.68 0.034 GLOI Rep.1 215272 35,392 28,114 0.62 1.33 1.78 2.42 2.40 0.46 Rep.2 132276 53,092 31,252 0.65 1.00 1.58 1.96 2.23 0.31 Rep.3 487668 76,360 29,474 0.55 0.65 1.85 1.20 2.40 0.00 Avr. 278405 54948 29613 0.61 0.99 1.74 1.86 2.34 0.26 StDv 185917 20547 1574 0.05 0.34 0.14 0.62 0.10 0.23 HN1 Rep.1 3,784 1,871 147 -2.91 -3.18 -7.26 0.27 4.35 4.08 Rep.2 2,614 2,796 4,995 -4.02 -2.67 -2.94 -1.35 -1.08 0.273 Rep.3 6,432 4,393 1,246 -3.71 -2.69 -4.70 -1.02 0.99 2.013 Avr. 4,277 3,020 2,129 -3.55 -2.84 -4.96 -0.70 1.42 2.122 StDv 1,956 1,276 2,542 0.57 0.29 2.17 0.86 2.74 1.906 HPGD Rep.1 10,885 6,589 11,129 -1.38 -1.36 -1.01 -0.02 -0.37 -0.35 Rep.2 22,378 12,952 13,946 -0.92 -0.45 -1.46 -0.47 0.54 1.003 Rep.3 47,146 20,066 12,168 -0.83 -0.49 -1.41 -0.34 0.58 0.916 Avr. 26,803 13,202 12,414 -1.05 -0.77 -1.29 -0.28 0.25 0.525 StDv 18,531 6,742 1,425 0.30 0.51 0.24 0.23 0.54 0.755 KLK2 Rep.1 300,931 494,877 34,461 3.40 4.87 0.62 -1.47 2.79 4.254 Rep.2 496,385 636,865 25,665 3.55 5.17 -0.58 -1.62 4.13 5.743 Rep.3 858,522 630,712 27,354 3.35 4.48 -0.24 -1.13 3.60 4.722 Avr. 551,946 587,485 29,160 3.44 4.84 -0.07 -1.40 3.50 4.906 StDv 282,917 80,260 4,668 0.10 0.34 0.62 0.25 0.67 0.761 KLK3 Rep.1 1,201,462 1,510,521 121,070 5.40 6.48 2.43 -1.08 2.97 4.052 Rep.2 1,715,345 1,465,004 121,869 5.34 6.37 1.67 -1.03 3.67 4.697 Rep.3 2,869,519 1,541,639 87,096 5.09 5.77 1.43 -0.67 3.67 4.34 Avr. 1,928,775 1,505,721 110,012 5.28 6.21 1.84 -0.93 3.44 4.363 StDv 854,265 38,542 19,850 0.16 0.38 0.52 0.22 0.40 0.323 LAMA1 Rep.1 38 1 2 -9.55 -14.05 -13.46 4.50 3.91 -0.59 Rep.2 2 2 1,480 -14.37 -13.12 -4.69 -1.26 -9.68 -8.42 Rep.3 526 1 1 -7.32 -14.79 -14.98 7.47 7.66 0.195 Avr. 189 1 494 -10.41 -13.98 -11.04 3.57 0.63 -2.94 StDv 293 1 854 3.60 0. 84 5.55 4.44 9.12 4.764 MSMB Rep.1 671,389 929,667 51,400 4.56 5.78 1.19 -1.22 3.37 4.587 Rep.2 910,538 848,857 18,772 4.43 5.58 -1.03 -1.15 5.45 6.609 Rep.3 1,628,017 11,765 15,852 4.28 -1.26 -1.03 5.54 5.31 -0.24 Avr. 1,069,981 596,763 28,675 4.42 3.37 -0.29 1.06 4.71 3.654 StDv 497,846 508,232 19,735 0.14 4.01 1.28 3.88 1.16 3.516 MUC1A Rep.1 262 1 5 -6.76 -14.05 -12.13 7.29 5.37 -1.91 Rep.2 1 1 1 -15.37 -14.12 -15.23 -1.26 -0.15 1.11 Rep.3 73 2 1 -10.17 -13.79 -14.98 3.62 4.81 1.195 Avr. 112 1 2 -10.77 -13.98 -14.11 3.22 3.35 0.131 StDv 135 1 2 4.34 0.17 1.72 4.28 3.04 1.769 MYLK Rep.1 715,065 617,785 1,953,630 4.65 5.19 6.44 -0.54 -1.79 -1.25 Rep.2 610,439 657,898 2,799,061 3.85 5.21 6.19 -1.36 -2.34 -0.98 Rep.3 1,951,162 943,798 1,861,415 4.54 5.06 5.85 -0.52 -1.31 -0.79 Avr. 1,092,222 739,827 2,204,702 4.35 5.15 6.16 -0.81 -1.81 -1 StDv 745,701 177,779 516,791 0.44 0.08 0.30 0.48 0.52 0.234 PCAT1 Rep.1 46,874 32,022 49,088 0.72 0.92 1.13 -0.20 -0.40 -0.21 Rep.2 32,297 32,088 42,375 -0.39 0.85 0.15 -1.25 -0.54 0.709 Rep.3 108,603 34,684 44,589 0.37 0.29 0.46 0.08 -0.09 -0.17 Avr. 62,591 32,931 45,351 0.23 0.69 0.58 -0.46 -0.34 0.112 StDv 40,508 1,518 3,421 0.57 0.34 0.50 0.70 0.23 0.517 PDZK1IP1 Rep.1 3,534 279 81 -3.01 -5.92 -8.12 2.92 5.11 2.195 Rep.2 7,452 763 25 -2.51 -4.54 -10.58 2.03 8.07 6.041 Rep.3 14,745 941 32 -2.51 -4.91 -9.98 2.40 7.47 5.073 Avr. 8,577 661 46 -2.68 -5.12 -9.56 2.45 6.88 4.436 StDv 5,690 343 31 0.29 0.72 1.29 0.44 1.57 2.001 PEX10 Rep.1 4,988 2,592 142 -2.51 -2.71 -7.31 0.20 4.80 4.601 Rep.2 11,488 2,484 18 -1.88 -2.84 -11.06 0.95 9.17 8.218 Rep.3 15,027 2,866 1,354 -2.48 -3.30 -4.58 0.82 2.10 1.277 Avr. 10,501 2,647 505 -2.29 -2.95 -7.65 0.66 5.35 4.698 StDv 5,092 197 738 0.35 0.31 3.25 0.40 3.57 3.472 PIP Rep.1 54 20 3 -9.04 -9.72 -12.87 0.69 3.83 3.147 Rep.2 1 1 1 -15.37 -14.12 -15.23 -1.26 -0.15 1.11 Rep.3 214 6 2 -8.62 -12.20 -13.98 3.59 5.36 1.78 Avr. 90 9 2 -11.01 -12.01 -14.03 1.00 3.02 2.012 StDv 111 10 1 3.78 2.20 1.18 2.44 2.84 1.039 PSCA Rep.1 5,241 1,893 584 -2.44 -3.16 -5.27 0.72 2.83 2.107 Rep.2 1,732 2,623 64 -4.61 -2.76 -9.23 -1.85 4.61 6.467 Rep.3 21,332 1,448 64 -1.98 -4.29 -8.98 2.31 7.00 4.695 Avr. 9,435 1,988 237 -3.01 -3.40 -7.82 0.39 4.81 4.423 StDv 10,451 593 300 1.41 0.79 2.22 2.10 2.10 2.193 RARRES1 Rep.1 32,243 22,582 13,675 0.18 0.42 -0.72 -0.23 0.90 1.134 Rep.2 60,617 19,969 49,942 0.52 0.17 0.38 0.35 0.13 -0.21 Rep.3 95,938 25,022 22,595 0.19 -0.18 -0.52 0.37 0.71 0.342 Avr. 62,933 22,524 28,737 0.30 0.14 -0.28 0.16 0.58 0.421 StDv 31,911 2,527 18,898 0.19 0.30 0.59 0.34 0.40 0.677 SELM1 Rep.1 45,074 60,198 56,679 0.67 1.83 1.33 -1.17 -0.67 0.497 Rep.2 81,299 74,988 256,748 0.94 2.08 2.74 -1.14 -1.81 -0.67 Rep.3 187,357 85,734 154,857 1.16 1.60 2.26 -0.44 -1.10 -0.66 Avr. 104,577 73,640 156,095 0.92 1.84 2.11 -0.92 -1.19 -0.28 StDv 73,943 12,821 100,040 0.25 0.24 0.72 0.41 0.57 0.669 SFRP1 Rep.1 20,200 13,851 10,177 -0.49 -0.29 -1.14 -0.20 0.65 0.855 Rep.2 38,279 14,458 25,213 -0.15 -0.30 -0.60 0.15 0.46 0.307 Rep.3 67,428 13,976 22,144 -0.32 -1.02 -0.55 0.70 0.23 -0.47 Avr. 41,969 14,095 19,178 -0.32 -0.53 -0.76 0.21 0.45 0.231 StDv 23,829 321 7,945 0.17 0.42 0.33 0.45 0.21 0.665 SPP1 Rep.1 17,123 8,549 5,130 -0.73 -0.98 -2.13 0.25 1.40 1.147 Rep.2 33,838 5,495 9,376 -0.32 -1.69 -2.03 1.37 1.71 0.339 Rep.3 47,407 5,307 7,799 -0.83 -2.41 -2.05 1.59 1.23 -0.36 Avr. 32,789 6,450 7,435 -0.63 -1.70 -2.07 1.07 1.44 0.375 StDv 15,169 1,820 2,146 0.27 0.71 0.05 0.71 0.24 0.755 SYNM Rep.1 38,214 38,025 108,172 0.43 1.17 2.27 -0.74 -1.84 -1.1 Rep.2 24,320 27,575 136,330 -0.80 0.64 1.83 -1.44 -2.63 -1.2 Rep.3 128,472 65,055 113,498 0.61 1.20 1.81 -0.59 -1.20 -0.61 Avr. 63,669 43,552 119,333 0.08 1.00 1.97 -0.92 -1.89 -0.97 StDv 56,550 19,342 14,958 0.77 0.32 0.26 0.45 0.72 0.315 TFAP2 Rep.1 4,593 4,894 921 -2.63 -1.79 -4.61 -0.84 1.98 2.82 Rep.2 12,213 5,609 12 -1.80 -1.66 -11.64 -0.13 9.85 9.978 Rep.3 17,866 7,267 409 -2.23 -1.96 -6.31 -0.27 4.07 4.346 Avr. 11,557 5,923 447 -2.22 -1.80 -7.52 -0.42 5.30 5.715 StDv 6,661 1,217 456 0.42 0.15 3.67 0.37 4.07 3.77 TMC5 Rep.1 42,344 5,080 1,449 0.58 -1.74 -3.96 2.31 4.53 2.22 Rep.2 156,493 9,681 4,101 1.88 -0.87 -3.22 2.76 5.11 2.349 Rep.3 184,408 12,510 344 1.13 -1.18 -6.56 2.31 7.69 5.379 Avr. 127,748 9,090 1,965 1.20 -1.26 -4.58 2.46 5.78 3.316 StDv 75,268 3,750 1,931 0.66 0.44 1.75 0.26 1.68 1.788 TPM2 Rep.1 349,025 360,643 697,757 3.62 4.41 4.96 -0.80 -1.34 -0.54 Rep.2 258,123 394,476 1,498,424 2.61 4.47 5.29 -1.87 -2.68 -0.82 Rep.3 1,091,972 518,778 1,081,988 3.70 4.20 5.06 -0.50 -1.36 -0.87 Avr. 566,373 424,632 1,092,723 3.31 4.36 5.10 -1.05 -1.79 -0.74 StDv 457,445 83,269 400,441 0.61 0.15 0.17 0.72 0.77 0.174 TPX2 Rep.1 148 19 1,930 -7.58 -9.80 -3.54 2.21 -4.04 -6.26 Rep.2 2 39 1,802 -14.37 -8.83 -4.41 -5.54 -9.96 -4.42 Rep.3 648 4 4 -7.02 -12.79 -12.98 5.77 5.96 0.195 Avr. 266 21 1,245 -9.66 -10.47 -6.98 0.81 -2.68 -3.49 StDv 339 18 1,077 4.09 2.06 5.22 5.78 8.05 3.324 UGT2B15 Rep.1 1,427 8 26 -4.32 -11.05 -9.76 6.73 5.44 -1.29 Rep.2 174 4 3 -7.93 -12.12 -13.64 4.19 5.71 1.525 Rep.3 1,210 1,234 24 -6.12 -4.52 -10.40 -1.60 4.28 5.879 Avr. 937 415 18 -6.12 -9.23 -11.26 3.11 5.14 2.038 StDv 670 709 13 1.81 4.11 2.08 4.27 0.76 3.612 ApoCl Rep.1 174,984 60,571 15,853 0.32 -1.02 -2.61 1.34 2.93 1.586 Rep.2 109,280 61,628 16,719 0.37 -1.10 -2.48 1.47 2.86 1.388 Rep.3 287,167 63,189 16,083 -0.21 -0.93 -2.72 0.71 2.51 1.797 Avr. 190,477 61,796 16,218 0.16 -1.02 -2.61 1.17 2.77 1.59 StDv 89,950 1,317 449 0.33 0.08 0.12 0.41 0.22 0.205 ApoE Rep.1 291,532 162,851 193,580 1.06 0.40 1.00 0.65 0.06 -0.6 Rep.2 176,541 148,789 166,165 1.06 0.18 0.83 0.89 0.23 -0.65 Rep.3 598,834 164,006 168,695 0.85 0.45 0.67 0.40 0.18 -0.22 Avr. 355,636 158,549 176,147 0.99 0.34 0.83 0.65 0.16 -0.49 StDv 218,323 8,472 15,151 0.12 0.15 0.17 0.25 0.09 0.237 C15orf48 Rep.1 91,710 72,158 11,140 -0.61 -0.77 -3.12 0.16 2.51 2.348 Rep.2 24,923 90,805 13,560 -1.76 -0.54 -2.79 -1.22 1.02 2.249 Rep.3 335,481 73,301 9,586 0.01 -0.71 -3.47 0.72 3.48 2.758 Avr. 150,705 78,755 11,429 -0.79 -0.67 -3.13 -0.11 2.34 2.452 StDv 163,468 10,452 2,003 0.90 0.12 0.34 1.00 1.24 0.27 CSRP1.583 Rep.1 501,452 720,127 1,040,681 1.84 2.55 3.43 -0.71 -1.59 -0.88 Rep.2 211,188 999,386 1,129,536 1.32 2.92 3.60 -1.60 -2.27 -0.67 Rep.3 1,187,574 454,677 685,654 1.83 1.92 2.69 -0.09 -0.86 -0.77 Avr. 633,405 724,730 951,957 1.67 2.46 3.24 -0.80 -1.57 -0.77 StDv 501,389 272,384 234,865 0.30 0.51 0.48 0.76 0.71 0.104 CSRP1.690 Rep.1 428,472 677,330 878,261 1.61 2.46 3.18 -0.85 -1.57 -0.72 Rep.2 135,826 860,624 776,997 0.69 2.71 3.06 -2.02 -2.37 -0.35 Rep.3 939,564 682,836 907,654 1.50 2.51 3.09 -1.01 -1.60 -0.59 Avr. 501,287 740,263 854,304 1.26 2.56 3.11 -1.29 -1.85 -0.55 StDv 406,786 104,272 68,544 0.50 0.13 0.06 0.64 0.45 0.19 EBF3 Rep.1 3,600 7,994 7,110 -5.28 -3.95 -3.77 -1.34 -1.51 -0.18 Rep.2 2,129 4,120 5,084 -5.31 -5.00 -4.20 -0.31 -1.11 -0.8 Rep.3 11,296 3,972 4,659 -4.88 -4.92 -4.51 0.04 -0.37 -0.41 Avr. 5,675 5,362 5,618 -5.16 -4.62 -4.16 -0.54 -1.00 -0.46 StDv 4,923 2,281 1,310 0.24 0.59 0.37 0.71 0.58 0.313 F5 Rep.1 358,681 9,657 4,497 1.36 -3.67 -4.43 5.03 5.78 0.755 Rep.2 185,570 5,448 115 1.14 -4.60 -9.67 5.73 10.80 5.072 Rep.3 282,916 3,853 2,263 -0.24 -4.96 -5.55 4.73 5.32 0.591 Avr. 275,722 6,319 2,292 0.75 -4.41 -6.55 5.16 7.30 2.139 StDv 86,779 2,999 2,191 0.86 0.66 2.76 0.52 3.04 2.541 FGG Rep.1 67 6 321 -11.03 -14.33 -8.24 3.30 -2.79 -6.09 Rep.2 1 1 2 -16.37 -17.01 -15.51 0.64 -0.85 -1.49 Rep.3 341 4 3 -9.93 -14.87 -15.11 4.94 5.18 0.238 Avr. 136 4 109 -12.44 -15.40 -12.95 2.96 0.51 -2.45 StDv 180 3 184 3.44 1.42 4.09 2.17 4.16 3.27 FHL2 Rep.1 58,230 70,377 35,517 -1.27 -0.81 -1.45 -0.46 0.18 0.639 Rep.2 38,348 76,367 39,815 -1.14 -0.79 -1.23 -0.35 0.09 0.445 Rep.3 116,597 69,405 35,387 -1.52 -0.79 -1.59 -0.72 0.07 0.795 Avr. 71,058 72,050 36,906 -1.31 -0.80 -1.42 -0.51 0.11 0.626 StDv 40,671 3,770 2,520 0.19 0.01 0.18 0.19 0.06 0.175 GLOI Rep.1 58,230 70,377 35,517 -1.27 -0.81 -1.45 -0.46 0.18 0.639 Rep.2 38,348 76,367 39,815 -1.14 -0.79 -1.23 -0.35 0.09 0.445 Rep.3 116,597 69,405 35,387 -1.52 -0.79 -1.59 -0.72 0.07 0.795 Avr. 71,058 72,050 36,906 -1.31 -0.80 -1.42 -0.51 0.11 0.626 StDv 40,671 3,770 2,520 0.19 0.01 0.18 0.19 0.06 0.175 GRAMD4 Rep.1 40,612 35,025 14,160 -1.79 -1.81 -2.77 0.03 0.99 0.959 Rep.2 15,180 47,756 17,947 -2.48 -1.46 -2.38 -1.01 -0.09 0.918 Rep.3 85,337 44,607 31,849 -1.97 -1.43 -1.74 -0.54 -0.23 0.309 Avr. 47,043 42,463 21,319 -2.08 -1.57 -2.30 -0.51 0.22 0.729 StDv 35,518 6,631 9,314 0.36 0.21 0.52 0.52 0.67 0.364 HIF1A Rep.1 391,182 387,463 283,585 1.48 1.65 1.55 -0.17 -0.07 0.103 Rep.2 185,075 532,691 278,680 1.13 2.02 1.58 -0.88 -0.44 0.44 Rep.3 905,548 469,050 235,023 1.44 1.96 1.14 -0.52 0.30 0.82 Avr. 493,935 463,068 265,763 1.35 1.88 1.42 -0.53 -0.07 0.454 StDv 371,065 72,799 26,734 0.19 0.20 0.24 0.36 0.37 0.359 HIPK2 Rep.1 166,274 152,208 52,407 0.25 0.30 -0.89 -0.06 1.13 1.191 Rep.2 121,045 186,578 58,276 0.52 0.50 -0.68 0.02 1.20 1.184 Rep.3 387,919 143,266 74,611 0.22 0.25 -0.51 -0.03 0.73 0.764 Avr. 225,079 160,684 61,765 0.33 0.35 -0.69 -0.03 1.02 1.047 StDv 142,825 22,866 11,506 0.17 0.13 0.19 0.04 0.25 0.244 HOXC4 Rep.1 2,026 151 3,808 -6.11 -9.67 -4.67 3.56 -1.44 -5 Rep.2 12,598 2,903 5,307 -2.74 -5.50 -4.14 2.76 1.39 -1.36 Rep.3 22,809 57 3,547 -3.87 -11.04 -4.91 7.17 1.04 -6.14 Avr. 12,478 1,037 4,221 -4.24 -8.74 -4.57 4.50 0.33 -4.17 StDv 10,392 1,617 950 1.71 2.88 0.39 2.35 1.55 2.493 HPN Rep.1 148,315 10,413 4,335 0.08 -3.56 -4.48 3.65 4.56 0.917 Rep.2 171,935 9,123 4,240 1.03 -3.85 -4.46 4.88 5.49 0.611 Rep.3 266,748 9,548 9,841 -0.32 -3.65 -3.43 3.33 3.11 -0.22 Avr. 195,666 9,695 6,139 0.26 -3.69 -4.13 3.95 4.39 0.436 StDv 62,681 657 3,207 0.69 0.15 0.60 0.82 1.20 0.589 HSBP1 Rep.1 739,041 741,668 736,840 2.40 2.59 2.93 -0.19 -0.53 -0.34 Rep.2 310,328 857,558 664,962 1.88 2.70 2.83 -0.83 -0.95 -0.13 Rep.3 1,413,987 743,511 811,331 2.08 2.63 2.93 -0.54 -0.85 -0.3 Avr. 821,119 780,912 737,711 2.12 2.64 2.90 -0.52 -0.78 -0.26 StDv 556,389 66,383 73,188 0.26 0.06 0.06 0.32 0.22 0.113 IGFBP1 Rep.1 391 18 33 -8.49 -12.74 -11.52 4.26 3.03 -1.22 Rep.2 5 4 3 -14.04 -15.01 -14.93 0.96 0.88 -0.08 Rep.3 1,724 4 6 -7.59 -14.87 -14.11 7.28 6.52 -0.76 Avr. 707 9 14 -10.04 -14.21 -13.52 4.17 3.48 -0.69 StDv 902 8 17 3.49 1.27 1.78 3.16 2.84 0.575 KLK3.470 Rep.1 371,338 339,916 49,813 1.41 1.46 -0.96 -0.06 2.37 2.423 Rep.2 123,291 234,580 77,137 0.55 0.83 -0.28 -0.29 0.82 1.11 Rep.3 673,083 288,995 47,031 1.01 1.27 -1.18 -0.25 2.19 2.443 Avr. 389,237 287,830 57,994 0.99 1.19 -0.80 -0.20 1.79 1.992 StDv 275,333 52,678 16,637 0.43 0.32 0.47 0.12 0.84 0.764 LRRN1 Rep.1 2,400 1,967 3,990 -5.87 -5.97 -4.60 0.10 -1.27 -1.37 Rep.2 1,538 4,512 3,130 -5.78 -4.87 -4.90 -0.91 -0.88 0.033 Rep.3 4,314 2,719 3,327 -6.27 -5.47 -5.00 -0.81 -1.27 -0.47 Avr. 2,751 3,066 3,482 -5.97 -5.43 -4.83 -0.54 -1.14 -0.6 StDv 1,421 1,308 451 0.26 0.55 0.21 0.56 0.23 0.71 MAP3K7 Rep.1 285,317 268,102 197,273 1.03 1.12 1.03 -0.10 0.00 0.095 Rep.2 159,676 327,841 224,968 0.92 1.32 1.27 -0.40 -0.35 0.049 Rep.3 736,305 343,367 243,733 1.14 1.51 1.20 -0.37 -0.05 0.318 Avr. 393,766 313,103 221,991 1.03 1.32 1.16 -0.29 -0.13 0.154 StDv 303,226 39,738 23,373 0.11 0.20 0.12 0.17 0.19 0.144 MYEF2 Rep.1 46,838 35,016 26,471 -1.58 -1.82 -1.87 0.23 0.29 0.056 Rep.2 37,413 47,082 29,873 -1.17 -1.48 -1.65 0.31 0.47 0.162 Rep.3 107,994 36,896 29,425 -1.63 -1.70 -1.85 0.08 0.23 0.15 Avr. 64,082 39,665 28,590 -1.46 -1.67 -1.79 0.21 0.33 0.123 StDv 38,320 6,492 1,848 0.25 0.17 0.13 0.12 0.13 0.058 OPRK1 Rep.1 5,217 2,718 36 -4.75 -5.50 -11.39 0.76 6.65 5.891 Rep.2 1,995 1,118 792 -5.40 -6.88 -6.88 1.48 1.48 0.003 Rep.3 3,156 2,030 25 -6.72 -5.89 -12.05 -0.84 5.33 6.167 Avr. 3,456 1,955 284 -5.62 -6.09 -10.11 0.47 4.49 4.02 StDv 1,632 803 440 1.01 0.71 2.81 1.18 2.68 3.482 PCAT14 Rep.1 21,748 32,046 33,751 -2.69 -1.94 -1.52 -0.74 -1.17 -0.42 Rep.2 7,029 32,465 23,679 -3.59 -2.02 -1.98 -1.57 -1.61 -0.04 Rep.3 51,291 28,036 24,567 -2.70 -2.10 -2.11 -0.60 -0.59 0.014 Avr. 26,689 30,849 27,332 -2.99 -2.02 -1.87 -0.97 -1.12 -0.15 StDv 22,541 2,445 5,576 0.52 0.08 0.31 0.52 0.51 0.238 PFKP Rep.1 128,373 126,959 148,613 -0.13 0.04 0.62 -0.17 -0.74 -0.57 Rep.2 79,892 161,519 164,803 -0.08 0.29 0.82 -0.37 -0.90 -0.52 Rep.3 337,725 109,308 143,071 0.02 -0.14 0.43 0.16 -0.41 -0.57 Avr. 181,997 132,595 152,162 -0.06 0.07 0.62 -0.13 -0.68 -0.55 StDv 137,026 26,558 11,292 0.07 0.22 0.19 0.27 0.25 0.027 PFKL Rep.1 84,518 86,343 53,852 -0.73 -0.51 -0.85 -0.22 0.12 0.334 Rep.2 57,137 116,264 56,622 -0.56 -0.18 -0.72 -0.38 0.16 0.544 Rep.3 177,580 71,945 53,309 -0.91 -0.74 -1.00 -0.17 0.09 0.256 Avr. 106,412 91,517 54,594 -0.73 -0.48 -0.86 -0.26 0.12 0.378 StDv 63,136 22,608 1,777 0.17 0.28 0.14 0.11 0.04 0.149 PLA2G7 Rep.1 35,242 9,098 2,481 -1.99 -3.76 -5.29 1.77 3.30 1.527 Rep.2 18,511 17,773 2,808 -2.19 -2.89 -5.06 0.70 2.87 2.168 Rep.3 26,899 7,983 3,493 -3.63 -3.91 -4.93 0.28 1.30 1.016 Avr. 26,884 11,618 2,927 -2.60 -3.52 -5.09 0.92 2.49 1.57 StDv 8,366 5,359 516 0.90 0.55 0.18 0.77 1.05 0.577 PSMA Rep.1 325,305 29,181 3,040 1.22 -2.08 -4.99 3.29 6.21 2.915 Rep.2 291,538 31,302 4,664 1.79 -2.07 -4.32 3.86 6.11 2.252 Rep.3 267,804 13,383 3,813 -0.32 -3.17 -4.80 2.85 4.49 1.635 Avr. 294,882 24,622 3,839 0.90 -2.44 -4.71 3.33 5.60 2.267 StDv 28,896 9,791 812 1.09 0.63 0.34 0.51 0.97 0.641 SAA2 Rep.1 18,550 47,657 453 -2.92 -1.37 -7.74 -1.55 4.82 6.37 Rep.2 3,824 38,395 27 -4.46 -1.78 -11.76 -2.69 7.29 9.979 Rep.3 38,531 49,483 787 -3.11 -1.28 -7.08 -1.83 3.96 5.798 Avr. 20,302 45,178 422 -3.50 -1.48 -8.86 -2.02 5.36 7.382 StDv 17,420 5,945 381 0.84 0.27 2.53 0.59 1.73 2.267 SERPINA1 Rep.1 71,980 74,165 22,531 -0.96 -0.73 -2.10 -0.23 1.14 1.371 Rep.2 25,468 46,560 7,792 -1.73 -1.50 -3.58 -0.23 1.86 2.085 Rep.3 128,858 61,216 17,040 -1.37 -0.97 -2.64 -0.40 1.27 1.668 Avr. 75,435 60,647 15,788 -1.35 -1.07 -2.78 -0.29 1.42 1.708 StDv 51,782 13,811 7,449 0.38 0.39 0.75 0.10 0.38 0.358 SLC10A7 Rep.1 40,424 11,602 8,678 -1.79 -3.41 -3.48 1.62 1.69 0.071 Rep.2 3,727 2,626 2,051 -4.50 -5.65 -5.51 1.15 1.01 -0.14 Rep.3 45,902 6,739 4,999 -2.86 -4.16 -4.41 1.30 1.55 0.254 Avr. 30,018 6,989 5,243 -3.05 -4.40 -4.47 1.35 1.42 0.063 StDv 22,933 4,493 3,320 1.36 1.14 1.02 0.24 0.36 0.196 SMAD5 Rep.1 284,815 312,813 262,701 1.02 1.34 1.44 -0.32 -0.42 -0.1 Rep.2 131,876 336,415 220,795 0.64 1.35 1.24 -0.71 -0.60 0.113 Rep.3 589,034 310,738 276,986 0.82 1.37 1.38 -0.55 -0.56 -0.01 Avr. 335,242 319,989 253,494 0.83 1.36 1.35 -0.53 -0.52 0.002 StDv 232,713 14,263 29,205 0.19 0.01 0.10 0.20 0.10 0.105 SPON2 Rep.1 213,150 368,410 72,098 0.61 1.58 -0.43 -0.98 1.03 2.006 Rep.2 123,703 514,190 67,857 0.55 1.97 -0.46 -1.41 1.01 2.427 Rep.3 373,228 376,107 57,551 0.16 1.65 -0.89 -1.48 1.05 2.531 Avr. 236,694 419,569 65,835 0.44 1.73 -0.59 -1.29 1.03 2.322 StDv 126,418 82,035 7,481 0.24 0.21 0.26 0.28 0.02 0.278 SRC Rep.1 27,107 46,057 35,875 -2.37 -1.42 -1.43 -0.95 -0.94 0.013 Rep.2 25,281 63,357 33,209 -1.74 -1.06 -1.49 -0.68 -0.25 0.438 Rep.3 57,395 50,210 21,905 -2.54 -1.26 -2.28 -1.28 -0.26 1.02 Avr. 36,594 53,208 30,330 -2.22 -1.24 -1.73 -0.97 -0.48 0.49 StDv 18,037 9,031 7,417 0.42 0.18 0.47 0.30 0.40 0.506 SYNPO2 Rep.1 702,319 1,004,740 976,835 2.33 3.03 3.33 -0.70 -1.01 -0.31 Rep.2 261,029 1,022,928 1,169,889 1.63 2.96 3.65 -1.33 -2.02 -0.69 Rep.3 1,912,903 984,079 1,293,086 2.52 3.03 3.60 -0.51 -1.08 -0.57 Avr. 958,750 1,003,916 1,146,603 2.16 3.01 3.53 -0.85 -1.37 -0.52 StDv 855,272 19,438 159,406 0.47 0.04 0.17 0.43 0.56 0.195 TDRD1 Rep.1 415 153 1,634 -8.40 -9.65 -5.89 1.25 -2.51 -3.76 Rep.2 3 4 39 -14.78 -15.01 -11.23 0.23 -3.55 -3.78 Rep.3 1,886 5 24 -7.47 -14.55 -12.11 7.09 4.65 -2.44 Avr. 768 54 566 -10.22 -13.07 -9.74 2.86 -0.47 -3.33 StDv 990 86 925 3.98 2.97 3.37 3.70 4.46 0.769 TRIB1 Rep.1 221,374 165,506 56,123 0.66 0.43 -0.79 0.23 1.45 1.213 Rep.2 134,990 182,298 54,023 0.68 0.47 -0.79 0.21 1.47 1.26 Rep.3 321,378 153,222 57,415 -0.05 0.35 -0.89 -0.40 0.84 1.239 Avr. 225,914 167,009 55,854 0.43 0.42 -0.82 0.01 1.25 1.237 StDv 93,277 14,596 1,712 0.42 0.06 0.06 0.36 0.36 0.024 TSPAN13 Rep.1 157,778 49,173 13,875 0.17 -1.33 -2.80 1.50 2.97 1.478 Rep.2 84,561 53,576 15,083 0.00 -1.30 -2.63 1.30 2.63 1.334 Rep.3 221,110 47,740 19,395 -0.59 -1.33 -2.45 0.74 1.86 1.123 Avr. 154,483 50,163 16,118 -0.14 -1.32 -2.63 1.18 2.49 1.312 StDv 68,334 3,041 2,902 0.40 0.02 0.17 0.39 0.57 0.179 Table 11: Subject 1 - RNA biomarkers with differential expression (Log2 FC>2) in Tumor and adjacent tissues T/Adj.G T/Adj.M Adj.G/Adj.M Marker Avr. StDv Avr. StDv Avr. StDv ETV1 3.38 0.20 3.25 0.08 -0.13 0.13 HPN 3.95 0.82 4.39 1.20 0.44 0.59 F5 5.16 0.52 7.30 3.04 2.14 2.54 PSMA 3.33 0.51 5.60 0.97 2.27 0.64 UGT2B15 3.11 4.27 5.14 0.76 2.04 3.61 CRISP3 6.40 4.02 7.83 2.67 1.42 1.42 TMC5 2.46 0.26 5.78 1.68 3.32 1.79 PDZK1IP1 2.45 0.44 6.88 1.57 4.44 2.00 MSMB 1.06 3.88 4.71 1.16 3.65 3.52 PSCA 0.39 2.10 4.81 2.10 4.42 2.19 TFAP2 -0.42 0.37 5.30 4.07 5.71 3.77 KLK3 438 -0.93 0.22 3.44 0.40 4.36 0.32 KLK2 -1.40 0.25 3.50 0.67 4.91 0.76 OPRK1 0.47 1.18 4.49 2.68 4.02 3.48 PEX10 0.66 0.40 5.35 3.57 4.70 3.47 C15orf48 -0.11 1.00 2.34 1.24 2.45 0.27 AGR2 1.31 0.38 4.90 0.85 3.58 0.75 ADM 1.16 0.74 3.21 1.96 2.05 2.20 KLK3 470 -0.20 0.12 1.79 0.84 1.99 0.76 PLA2G7 0.92 0.77 2.49 1.05 1.57 0.58 SPON2 -1.29 0.28 1.03 0.02 2.32 0.28 HN1 -0.70 0.86 1.42 2.74 2.12 1.91 ACPP -2.49 0.70 2.60 0.44 5.09 0.41 AZGP1 -2.68 1.06 2.28 0.37 4.96 0.81 SAA2 -2.02 0.59 5.36 1.73 7.38 2.27 - A number of biomarkers are found to be differentially expressed in either the tumor samples or the adjacent glandular or muscular tissues and these have been grouped in Table 12 below.
Table 12: Subject 1 - Comparison of the tumor, adjacent glandular and adjacent muscule tissue expression of select RNA biomarkers Tumor vs adjacent glandular and muscle tissue differential expression with log2FC >2 RNA biomarkers Up regulated in tumor compared with adjacent glandular and muscle tissues and no difference between the adjacent glandular and muscle tissues. ETV1, HPN, F5, PMSA, UGT2BI5, CRISP3 Up regulated in the tumor and the glandular adjacent tissue compared with the adjacent muscle tissue, with higher up regulation in the tumor than in the glandular adjacent tissue. TMC5, PDZK1IP1, MSMB, PSCA No difference between the tumor and the adjacent glandular tissus and up regulated compared with adjacent muscule tissue. TFAP2, KLK3 438, KLK2, OPRK1, PEX10, C15orf48, AGR2, KLK3 470, PLA2G7, SPON2, Higher in the glandular tissue compared with the tumor tissue compared with the adjacent muscle tissue. ACPP, AZGP1, SAA2 - It is common practice in this area of cancer research, particularly when using archival FFPE blocks as the source of tumor tissue, to use tissue adjacent to the tumor as control healthy tissue when studying differential expression. However, studies that have compared gene expression profiles or the chromatin status of prostate tumor tissue with adjacent tissue and benign prostate tissue from brain dead organ donors with no evidence of prostate cancer have suggested that the adjacent tissue has a genome and transcriptome that is more similar to the tumor than to the donor control tissues, suggesting that field effects exist (Chandran et al. 2005, Aryee et al. 2013).
- The RBAS
analysis using Subject 1 tissue shows that the glandular adjacent tissue has an RNA expression profile more similar to the tumor which is very likely due to field effects as described for prostate cancer tissues by Chandran et al (2005), Rizzi et al. (PLoS One 3(10):e3617, 2008) and reviewed in Trujillo et al. (Prostate Cancer, 2012). - The analysis of
Subject 2 used prostatectomy tissue and the data compares the relative expression of the RNA biomarkers between three tumor tissues with different Gleason scores (termed T1, T2, and T3) to the adjacent glandular tissue only. The raw counts of triplicate samples from T1, T2 and T3 tumor tissues and adjacent glandular tissue is given followed by the log2 normalised counts. Finally the log2 FC expression of each RNA biomarker from the tumor region of the prostatectomy tissue RNA samples is given relative to the adjacent glandular tissue RNA. - The raw counts acquired for each amplicon from
Subject 2 samples is presented in Table 13 with the calculation of the normalized count and FC.Table 13: Subject 2 - Raw read counts, Log 2 normalization and relative quantification (Log 2 FC) of RNA biomarker specific amplicons Raw read counts (Rc) Log2 Normalised Rc Differential Expression (Log2 FC) T1 T2 Adj.G T1 T2 Adj.G T1/T2 T1/ Adj.G ACPP Rep.1 1,115,466 578,078 212,966 4.43 4.28 2.92 0.16 1.51 Rep.2 4 381,347 138,256 1.74 3.79 2.26 -2.06 -0.53 Rep.3 478,421 707,704 171,359 3.87 3.51 2.43 0.36 1.44 Avr. 531,297 555,710 174,194 3.35 3.86 2.54 -0.51 0.81 StDv 559,608 164,324 37,436 1.42 0.39 0.34 1.34 1.16 AGR2 Rep.1 967,584 227,247 305,013 4.23 2.93 3.44 1.30 0.79 Rep.2 4 285,242 416,971 1.74 3.37 3.86 -1.64 -2.12 Rep.3 551,975 408,212 508,593 4.08 2.71 4.00 1.36 0.08 Avr. 506,521 306,900 410,192 3.35 3.01 3.77 0.34 -0.42 StDv 485,389 92,406 101,959 1.40 0.34 0.29 1.71 1.51 AKR1C3 Rep.1 29,847 6,708 18,883 -0.79 -2.15 -0.57 1.36 -0.22 Rep.2 1 12,909 25,412 -0.26 -1.09 -0.18 0.83 -0.08 Rep.3 15,224 15,973 4,578 -1.10 -1.96 -2.80 0.86 1.69 Avr. 15,024 11,863 16,291 -0.72 -1.74 -1.18 1.02 0.46 StDv 14,924 4,720 10,656 0.42 0.57 1.41 0.30 1.07 ADM Rep.1 10 454 3 -12.33 -6.04 -13.19 -6.30 0.86 Rep.2 1 4 1,210 -0.26 -12.75 -4.57 12.48 4.31 Rep.3 1,165 1,647 6 -4.81 -5.24 -12.37 0.43 7.56 Avr. 392 702 406 -5.80 -8.01 -10.05 2.21 4.24 StDv 669 849 696 6.10 4.12 4.76 9.52 3.35 AR(532) Rep.1 156,637 62,951 26,553 1.60 1.08 -0.08 0.52 1.68 Rep.2 2 55,735 76,486 0.74 1.02 1.41 -0.28 -0.67 Rep.3 69,267 101,758 90,656 1.08 0.71 1.51 0.37 -0.43 Avr. 75,302 73,481 64,565 1.14 0.94 0.95 0.21 0.19 StDv 78,492 24,753 33,673 0.43 0.20 0.89 0.43 1.29 AR(460) Rep.1 90,088 37,428 54,162 0.80 0.33 0.95 0.48 -0.14 Rep.2 2 28,087 20,226 0.74 0.03 -0.51 0.71 1.25 Rep.3 33,627 62,350 42,563 0.04 0.00 0.42 0.04 -0.38 Avr. 41,239 42,622 38,984 0.53 0.12 0.29 0.41 0.24 StDv 45,523 17,712 17,249 0.42 0.18 0.74 0.34 0.88 AZGP1 Rep.1 1,205,621 257,386 176,572 4.55 3.11 2.65 1.44 1.89 Rep.2 4 488,064 484,084 1.74 4.15 4.07 -2.41 -2.33 Rep.3 577,755 953,508 474,743 4.14 3.94 3.90 0.21 0.24 Avr. 594,460 566,319 378,466 3.48 3.73 3.54 -0.26 -0.07 StDv 602,982 354,597 174,908 1.52 0.55 0.77 1.97 2.13 CLU Rep.1 31,199 29,463 27,065 -0.73 -0.02 -0.05 -0.71 -0.67 Rep.2 1 25,901 45,362 -0.26 -0.09 0.66 -0.18 -0.92 Rep.3 19,033 65,755 59,009 -0.78 0.08 0.89 -0.86 -1.67 Avr. 16,744 40,373 43,812 -0.59 -0.01 0.50 -0.58 -1.09 StDv 15,724 22,053 16,028 0.28 0.08 0.49 0.36 0.52 CRISP3 Rep.1 49 16 4 -10.04 -10.86 -12.78 0.82 2.74 Rep.2 1 6 7 -0.26 -12.16 -12.01 11.90 11.74 Rep.3 8 10 12 -12.00 -12.60 -11.37 0.61 -0.62 Avr. 19 11 8 -7.43 -11.88 -12.05 4.44 4.62 StDv 26 5 4 6.29 0.90 0.70 6.46 6.40 DDC Rep.1 2 1,199 1 -14.66 -4.64 -14.78 -10.02 0.12 Rep.2 1 1 2 -0.26 -14.75 -13.81 14.48 13.55 Rep.3 1 1 2 -15.00 -15.93 -13.96 0.93 -1.04 Avr. 1 400 2 -9.97 -11.77 -14.18 1.80 4.21 StDv 1 692 1 8.41 6.21 0.52 12.27 8.11 ETV1 Rep.1 55,213 19,124 17,021 0.10 -0.64 -0.72 0.74 0.82 Rep.2 1 7,861 12,058 -0.26 -1.81 -1.26 1.54 0.99 Rep.3 19,210 23,675 21,091 -0.77 -1.39 -0.59 0.63 -0.17 Avr. 24,808 16,887 16,723 -0.31 -1.28 -0.86 0.97 0.55 StDv 28,028 8,141 4,524 0.43 0.59 0.35 0.50 0.63 ETV4 Rep.1 1,075 1 4 -5.59 -14.86 -12.78 9.28 7.19 Rep.2 1 2 3 -0.26 -13.75 -13.23 13.48 12.97 Rep.3 1 1,466 148 -15.00 -5.41 -7.75 -9.59 -7.25 Avr. 359 490 52 -6.95 -11.34 -11.25 4.39 4.30 StDv 620 846 83 7.46 5.17 3.04 12.29 10.41 FLNA Rep.1 642,702 419,884 592,030 3.64 3.81 4.40 -0.18 -0.76 Rep.2 10 350,713 643,645 3.06 3.67 4.48 -0.61 -1.42 Rep.3 288,460 679,776 656,776 3.14 3.45 4.37 -0.31 -1.23 Avr. 310,391 483,458 630,817 3.28 3.65 4.42 -0.37 -1.14 StDv 321,907 173,499 34,226 0.31 0.18 0.06 0.22 0.34 GLO1 Rep.1 66,877 106,272 53,755 -1.21 -0.54 -1.33 -0.067 0.12 Rep.2 80,576 105,012 56,706 -1.14 -0.36 -1.00 -0.78 -0.14 Rep.3 66160 119,919 99018 -0.29 -0.21 -0.65 -0.08 0.36 Avr. 71,204 110,401 6,9826 -0.88 -0.37 -0.99 -0.31 0.11 StDv 8,124 8,267 2,5324 0.51 0.17 0.34 0.41 0.25 HN1 Rep.1 5,906 3,391 610 -3.13 -3.14 -5.52 0.01 2.40 Rep.2 1 1,965 1,360 -0.26 -3.81 -4.40 3.54 4.14 Rep.3 1,485 2,475 123 -4.46 -4.65 -8.01 0.19 3.55 Avr. 2,464 2,610 698 -2.62 -3.87 -5.98 1.25 3.36 StDv 3,072 723 623 2.14 0.76 1.85 1.99 0.89 HPGD Rep.1 51,645 15,143 24,758 0.00 -0.98 -0.18 0.98 0.18 Rep.2 1 42,608 21,512 -0.26 0.63 -0.42 -0.89 0.16 Rep.3 36,518 45,268 33,203 0.16 -0.46 0.06 0.62 0.10 Avr. 29,388 34,340 26,491 -0.03 -0.27 -0.18 0.23 0.15 StDv 26,550 16,678 6,035 0.21 0.82 0.24 0.99 0.04 KLK2 Rep.1 821,034 397,634 319,495 3.99 3.74 3.51 0.26 0.48 Rep.2 5 327,028 295,541 2.06 3.57 3.36 -1.51 -1.30 Rep.3 282,724 504,677 269,503 3.11 3.02 3.08 0.09 0.03 Avr. 367,921 409,780 294,846 3.05 3.44 3.32 -0.39 -0.26 StDv 417,092 89,445 25,003 0.97 0.38 0.22 0.98 0.93 KLK3 438 Rep.1 3,461,933 1,020,587 715,738 6.07 5.10 4.67 0.97 1.40 Rep.2 6 1,013,939 821,767 2.32 5.20 4.83 -2.88 -2.51 Rep.3 726,379 1,380,170 888,446 4.47 4.47 4.80 0.00 -0.33 Avr. 1,396,106 1,138,232 808,650 4.29 4.92 4.77 -0.64 -0.48 StDv 1,825,551 209,551 87,098 1.88 0.40 0.09 2.00 1.96 LAMA1 Rep.1 1 3 1 -15.66 -13.28 -14.78 -2.38 -0.88 Rep.2 1 1 1 -0.26 -14.75 -14.81 14.48 14.55 Rep.3 1 1 1 -15.00 -15.93 -14.96 0.93 -0.04 Avr. 1 2 1 -10.30 -14.65 -14.85 4.35 4.54 StDv 0 1 0 8.70 1.33 0.10 8.93 8.68 MSMB Rep.1 2,227,552 502,180 575,321 5.43 4.07 4.36 1.36 1.07 Rep.2 14 521,847 606,686 3.54 4.25 4.40 -0.70 -0.85 Rep.3 829,160 1,035,285 539,522 4.67 4.06 4.08 0.61 0.58 Avr. 1,018,909 686,437 573,843 4.55 4.13 4.28 0.42 0.27 StDv 1,125,826 302,271 33,606 0.95 0.10 0.17 1.04 1.00 MUC1A Rep.1 1 1 1 -15.66 -14.86 -14.78 -0.79 -0.88 Rep.2 1 2 1 -0.26 -13.75 -14.81 13.48 14.55 Rep.3 1 1 1 -15.00 -15.93 -14.96 0.93 -0.04 Avr. 1 1 1 -10.30 -14.85 -14.85 4.54 4.54 StDv 0 1 0 8.70 1.09 0.10 7.79 8.68 MYLK Rep.1 1,530,334 910,551 908,063 4.89 4.93 5.02 -0.04 -0.13 Rep.2 4 690,874 1,217,163 1.74 4.65 5.40 -2.91 -3.66 Rep.3 584,868 1.1 106 1.4 4.16 4.22 5.44 -0.05 -1.28 Avr. 705,069 919,376 1,169,326 3.60 4.60 5.29 -1.00 -1.69 StDv 772,213 233,040 240,933 1.65 0.36 0.24 1.65 1.80 PCAT1 Rep.1 176,018 51,153 60,175 1.77 0.78 1.10 0.99 0.67 Rep.2 1 23,697 37,342 -0.26 -0.22 0.37 -0.05 -0.64 Rep.3 56,838 50,071 47,687 0.80 -0.31 0.58 1.11 0.21 Avr. 77,619 41,640 48,401 0.77 0.08 0.69 0.69 0.08 StDv 89,830 15,549 11,433 1.02 0.60 0.37 0.64 0.66 PDZK1 IP1 Rep.1 8,995 2,067 1,865 -2.52 -3.85 -3.91 1.33 1.39 Rep.2 1 3,536 4,238 -0.26 -2.96 -2.76 2.70 2.50 Rep.3 7,861 17,707 2,509 -2.06 -1.81 -3.66 -0.24 1.61 Avr. 5,619 7,770 2,871 -1.61 -2.87 -3.45 1.26 1.83 StDv 4,898 8,637 1,227 1.19 1.02 0.60 1.47 0.59 PEX10 Rep.1 7,719 9 1,944 -2.74 -11.70 -3.85 8.95 1.11 Rep.2 1 784 1,078 -0.26 -5.13 -4.74 4.87 4.48 Rep.3 8,785 3,000 3,908 -1.90 -4.37 -3.02 2.48 1.13 Avr. 5,502 1,264 2,310 -1.63 -7.07 -3.87 5.43 2.24 StDv 4,793 1,552 1,450 1.26 4.03 0.86 3.27 1.94 PIP Rep.1 2,284 1 1 -4.50 -14.86 -14.78 10.37 10.28 Rep.2 1 1 1 -0.26 -14.75 -14.81 14.48 14.55 Rep.3 2 898 1 -14.00 -6.11 -14.96 -7.88 0.96 Avr. 762 300 1 -6.25 -11.91 -14.85 5.66 8.60 StDv 1,318 518 0 7.03 5.02 0.10 11.90 6.95 PSCA Rep.1 12,535 8,670 61,407 -2.04 -1.78 1.13 -0.26 -3.17 Rep.2 1 3,413 52,009 -0.26 -3.01 0.85 2.75 -1.12 Rep.3 8,366 2,537 68,425 -1.97 -4.62 1.11 2.65 -3.07 Avr. 6,967 4,873 60,614 -1.42 -3.14 1.03 1.71 -2.45 StDv 6,383 3,317 8,237 1.01 1.42 0.15 1.71 1.16 RARR ES1 Rep.1 170,826 64,937 19,653 1.73 1.12 -0.51 0.60 2.24 Rep.2 1 66,464 22,545 -0.26 1.27 -0.35 -1.54 0.09 Rep.3 63,506 84,074 23,140 0.96 0.43 -0.46 0.52 1.42 Avr. 78,111 71,825 21,779 0.81 0.94 -0.44 -0.14 1.25 StDv 86,344 10,635 1,865 1.00 0.45 0.08 1.21 1.08 SELM 1 Rep.1 168,631 61,687 37,098 1.71 1.05 0.40 0.66 1.31 Rep.2 2 64,482 80,173 0.74 1.23 1.48 -0.49 -0.74 Rep.3 69,773 84,097 59,539 1.09 0.43 0.90 0.66 0.19 Avr. 79,469 70,089 58,937 1.18 0.90 0.93 0.28 0.25 StDv 84,732 12,212 21,544 0.49 0.42 0.54 0.67 1.02 SFRP1 Rep.1 54,883 43,772 8,160 0.09 0.55 -1.78 -0.46 1.87 Rep.2 1 46,965 28,240 -0.26 0.77 -0.03 -1.03 -0.23 Rep.3 44,799 57,534 37,830 0.46 -0.11 0.25 0.57 0.20 Avr. 33,228 49,424 24,743 0.09 0.40 -0.52 -0.31 0.61 StDv 29,214 7,203 15,141 0.36 0.46 1.10 0.81 1.11 SPP1 Rep.1 88,187 20,998 5,469 0.77 -0.51 -2.36 1.28 3.13 Rep.2 1 23,950 6,577 -0.26 -0.20 -2.13 -0.06 1.87 Rep.3 42,213 27,737 4,804 0.37 -1.17 -2.73 1.54 3.10 Avr. 43,467 24,228 5,617 0.29 -0.62 -2.41 0.92 2.70 StDv 44,106 3,378 896 0.52 0.49 0.30 0.86 0.72 SYNM Rep.1 113,741 48,343 49,560 1.14 0.70 0.82 0.44 0.32 Rep.2 1 50,482 69,718 -0.26 0.88 1.28 -1.14 -1.54 Rep.3 32,666 84,942 104,171 0.00 0.45 1.71 -0.45 -1.71 Avr. 48,803 61,256 74,483 0.29 0.67 1.27 -0.38 -0.98 StDv 58,562 20,541 27,616 0.75 0.21 0.45 0.79 1.13 TFAP2 A Rep.1 4,633 4,198 7,283 -3.48 -2.83 -1.95 -0.65 -1.53 Rep.2 1 4,808 2,263 -0.26 -2.52 -3.67 2.25 3.41 Rep.3 2,925 6,336 2,544 -3.48 -3.30 -3.64 -0.19 0.16 Avr. 2,520 5,114 4,030 -2.41 -2.88 -3.09 0.47 0.68 StDv 2,342 1,101 2,821 1.86 0.39 0.99 1.56 2.51 TMC5 Rep.1 99,782 31,783 10,280 0.95 0.09 -1.45 0.86 2.40 Rep.2 1 46,113 18,809 -0.26 0.75 -0.61 -1.01 0.35 Rep.3 129,750 78,656 17,485 1.99 0.34 -0.86 1.65 2.85 Avr. 76,511 52,184 15,525 0.89 0.39 -0.98 0.50 1.87 StDv 67,933 24,019 4,590 1.13 0.33 0.43 1.37 1.33 TPM2 Rep.1 533,651 370,786 430,778 3.37 3.64 3.94 -0.27 -0.57 Rep.2 2 286,949 595,345 0.74 3.38 4.37 -2.65 -3.63 Rep.3 266,214 529,695 678,024 3.03 3.09 4.41 -0.06 -1.39 Avr. 266,622 395,810 568,049 2.38 3.37 4.24 -0.99 -1.86 StDv 266,825 123,293 125,863 1.43 0.27 0.26 1.44 1.59 TPX2 Rep.1 2,010 5 2 -4.68 -12.54 -13.78 7.86 9.09 Rep.2 1 2 3 -0.26 -13.75 -13.23 13.48 12.97 Rep.3 1,433 2 3 -4.51 -14.93 -13.37 10.41 8.86 Avr. 1,148 3 3 -3.15 -13.74 -13.46 10.59 10.31 StDv 1,034 2 1 2.50 1.19 0.28 2.82 2.31 UGT2 B15 Rep.1 13 786 1,209 -11.96 -5.25 -4.54 -6.71 -7.42 Rep.2 1 137 148 -0.26 -7.65 -7.60 7.39 7.34 Rep.3 3,199 6 4,002 -3.35 -13.34 -2.99 9.99 -0.36 Avr. 1,071 310 1,786 -5.19 -8.75 -5.04 3.56 -0.15 StDv 1,843 418 1,991 6.06 4.16 2.35 8.98 7.38 Raw read counts (Rc) Log2 Normalised Rc Differential Expression (Log2 FC) T1 T3 Adj.G T1 T3 Adj.G T1/T3 T1/ Adj.G ApoC1 Rep.1 98,101 68,822 23,748 -0.66 -1.17 -2.51 0.51 1.85 Rep.2 134,903 52,205 17,831 -0.40 -1.37 -2.67 0.97 2.27 Rep.3 50,743 49,348 5,790 -0.67 -1.49 -4.75 0.82 4.07 Avr. 94,582 56,792 15,790 -0.58 -1.34 -3.31 0.76 2.73 StDv 42,190 10,516 9,151 0.16 0.16 1.25 0.24 1.18 ApoE Rep.1 113,238 92,674 50,929 -0.45 -0.74 -1.41 0.28 0.96 Rep.2 120,951 97,766 26,427 -0.56 -0.46 -2.10 -0.10 1.55 Rep.3 53,870 80,438 36,240 -0.59 -0.79 -2.10 0.20 1.51 Avr. 96,020 90,293 37,865 -0.53 -0.66 -1.87 0.13 1.34 StDv 36,706 8,906 12,332 0.07 0.18 0.40 0.20 0.33 C15orf48 Rep.1 462,524 760,825 23,822 1.58 2.30 -2.51 -0.72 4.08 Rep.2 635,716 641,300 22,420 1.84 2.25 -2.34 -0.41 4.18 Rep.3 321,882 563,978 7,408 1.99 2.02 -4.39 -0.03 6.38 Avr. 473,374 655,368 17,883 1.80 2.19 -3.08 -0.39 4.88 StDv 157,198 99,175 9,099 0.21 0.15 1.14 0.35 1.30 CSRP1.5 83 Rep.1 921,105 514,866 939,933 2.57 1.74 2.79 0.83 -0.22 Rep.2 1,361,542 570,555 989,617 2.94 2.08 3.12 0.85 -0.19 Rep.3 390,734 242,180 690,001 2.27 0.80 2.15 1.47 0.12 Avr. 891,127 442,534 873,184 2.59 1.54 2.69 1.05 -0.10 StDv 486,098 175,731 160,574 0.33 0.66 0.50 0.36 0.19 CSRP1.6 90 Rep.1 610,121 317,158 490,682 1.97 1.04 1.86 0.94 0.12 Rep.2 789,293 344,428 517,589 2.15 1.36 2.19 0.79 -0.04 Rep.3 404,039 122,907 423,777 2.32 -0.18 1.45 2.50 0.87 Avr. 601,151 261,498 477,349 2.15 0.74 1.83 1.41 0.32 StDv 192,784 120,795 48,306 0.17 0.81 0.37 0.94 0.49 EBF3 Rep.1 11,409 6,191 8,760 -3.77 -4.64 -3.95 0.88 0.19 Rep.2 12,494 583 8,772 -3.83 -7.85 -3.69 4.02 -0.14 Rep.3 2,412 750 294 -5.07 -7.53 -9.05 2.47 3.98 Avr. 8,772 2,508 5,942 -4.22 -6.68 -5.56 2.45 1.34 StDv 5,534 3,191 4,891 0.73 1.77 3.02 1.57 2.29 F5 Rep.1 19,321 17,161 6,991 -3.01 -3.17 -4.28 0.17 1.27 Rep.2 21,147 13,841 90 -3.07 -3.28 -10.30 0.21 7.23 Rep.3 2,486 20,749 9,499 -5.02 -2.74 -4.03 -2.28 -0.99 Avr. 14,318 17,250 5,527 -3.70 -3.07 -6.20 -0.64 2.50 StDv 10,287 3,455 4,872 1.15 0.28 3.55 1.42 4.25 FGG Rep.1 5 2 2 -14.92 -16.24 -16.05 1.32 1.13 Rep.2 4,110 1 1 -5.44 -17.04 -16.79 11.60 11.36 Rep.3 1 2 1 -16.30 -16.09 -17.25 -0.22 0.94 Avr. 1,372 2 1 -12.22 -16.45 -16.70 4.23 4.47 StDv 2,371 1 1 5.92 0.51 0.60 6.43 5.96 FHL2 Rep.1 102,579 47,546 62,719 -0.60 -1.70 -1.11 1.10 0.51 Rep.2 109,719 57,142 51,134 -0.70 -1.24 -1.15 0.54 0.45 Rep.3 41,940 14,593 24,991 -0.95 -3.25 -2.64 2.30 1.69 Avr. 84,746 39,760 46,281 -0.75 -2.06 -1.63 1.32 0.89 StDv 37,243 22,317 19,326 0.18 1.06 0.87 0.90 0.70 GRAMD 4 Rep.1 31,350 25,907 28,223 -2.31 -2.58 -2.26 0.27 -0.04 Rep.2 37,363 24,238 29,679 -2.25 -2.47 -1.93 0.22 -0.32 Rep.3 20,118 35,834 16,514 -2.01 -1.96 -3.23 -0.05 1.23 Avr. 29,610 28,660 24,805 -2.19 -2.34 -2.48 0.15 0.29 StDv 8,753 6,269 7,217 0.16 0.33 0.68 0.17 0.82 HIF1A Rep.1 398,064 419,595 340,458 1.36 1.44 1.33 -0.08 0.03 Rep.2 771,120 404,282 369,458 2.12 1.59 1.70 0.53 0.41 Rep.3 297,843 557,606 438,692 1.88 2.00 1.50 -0.12 0.38 Avr. 489,009 460,494 382,869 1.78 1.68 1.51 0.11 0.28 StDv 249,401 84,449 50,472 0.39 0.29 0.19 0.37 0.21 HIPK2 Rep.1 109,550 170,523 42,729 -0.50 0.14 -1.67 -0.64 1.16 Rep.2 149,913 143,176 70,970 -0.25 0.09 -0.68 -0.34 0.43 Rep.3 75,965 201,996 72,517 -0.09 0.54 -1.10 -0.63 1.01 Avr. 111,809 171,898 62,072 -0.28 0.26 -1.15 -0.54 0.87 StDv 37,026 29,434 16,769 0.21 0.25 0.50 0.17 0.39 HOXC4 Rep.1 1,626 4,220 22 -6.58 -5.19 -12.59 -1.38 6.01 Rep.2 25 10,154 13 -12.80 -3.73 -13.09 -9.07 0.29 Rep.3 6,815 14,781 12 -3.57 -3.23 -13.66 -0.34 10.09 Avr. 2,822 9,718 16 -7.65 -4.05 -13.11 -3.60 5.47 StDv 3,549 5,294 6 4.71 1.02 0.54 4.77 4.92 HPN Rep.1 27,181 61,191 2,616 -2.51 -1.34 -5.70 -1.18 3.18 Rep.2 45,014 56,079 2,152 -1.98 -1.26 -5.72 -0.72 3.74 Rep.3 24,434 44,764 1,615 -1.73 -1.64 -6.59 -0.09 4.86 Avr. 32,210 54,011 2,128 -2.07 -1.41 -6.00 -0.66 3.93 StDv 11,174 8,406 501 0.40 0.20 0.51 0.54 0.85 HSBP1 Rep.1 715,949 515,099 585,263 2.21 1.74 2.11 0.47 0.10 Rep.2 936,366 390,235 488,172 2.40 1.54 2.11 0.86 0.29 Rep.3 434,201 353,606 747,508 2.42 1.35 2.27 1.08 0.16 Avr. 695,505 419,647 606,981 2.34 1.54 2.16 0.80 0.18 StDv 251,706 84,669 131,025 0.12 0.19 0.09 0.31 0.10 IGFBP1 Rep.1 4,956 3 3,852 -4.97 -15.65 -5.14 10.68 0.17 Rep.2 2,768 3 9,424 -6.01 -15.45 -3.59 9.45 -2.42 Rep.3 3 3 5 -14.72 -15.50 -14.92 0.78 0.20 Avr. 2,576 3 4,427 -8.56 -15.54 -7.88 6.97 -0.68 StDv 2,482 0 4,736 5.36 0.10 6.15 5.40 1.50 KLK3.47 0 Rep.1 152,238 296,395 38,574 -0.03 0.94 -1.81 -0.97 1.79 Rep.2 118,440 150,567 19,551 -0.59 0.16 -2.54 -0.75 1.95 Rep.3 92,387 178,823 40,080 0.19 0.36 -1.96 -0.17 2.15 Avr. 121,022 208,595 32,735 -0.14 0.49 -2.10 -0.63 1.96 StDv 30,009 77,338 11,442 0.40 0.40 0.38 0.41 0.18 LRRN1 Rep.1 370 78 7,572 -8.71 -10.95 -4.16 2.24 -4.55 Rep.2 4,313 397 5 -5.37 -8.41 -14.47 3.04 9.10 Rep.3 1,651 843 1,282 -5.62 -7.37 -6.92 1.75 1.31 Avr. 2,111 439 2,953 -6.56 -8.91 -8.52 2.34 1.95 StDv 2,011 384 4,051 1.86 1.85 5.34 0.65 6.85 MAP3K7 Rep.1 313,649 286,012 327,741 1.01 0.89 1.27 0.13 -0.26 Rep.2 481,330 323,184 393,629 1.44 1.26 1.79 0.17 -0.36 Rep.3 305,428 340,706 532,702 1.92 1.29 1.78 0.62 0.14 Avr. 366,802 316,634 418,024 1.46 1.15 1.61 0.31 -0.16 StDv 99,269 27,929 104,636 0.45 0.23 0.30 0.27 0.26 MYEF2 Rep.1 22,256 26,221 17,459 -2.80 -2.56 -2.96 -0.24 0.16 Rep.2 43,512 50,275 11,295 -2.03 -1.42 -3.33 -0.61 1.30 Rep.3 18,439 33,731 24,686 -2.13 -2.04 -2.65 -0.09 0.52 Avr. 28,069 36,742 17,813 -2.32 -2.01 -2.98 -0.31 0.66 StDv 13,510 12,306 6,703 0.42 0.57 0.34 0.27 0.58 OPRK1 Rep.1 17 7 2,208 -13.16 -14.43 -5.94 1.27 -7.22 Rep.2 2,902 248 3,210 -5.94 -9.08 -5.14 3.15 -0.79 Rep.3 71 3 4,485 -10.15 -15.50 -5.11 5.35 -5.04 Avr. 997 86 3,301 -9.75 -13.01 -5.40 3.26 -4.35 StDv 1,650 140 1,141 3.63 3.44 0.47 2.04 3.27 PCAT14 Rep.1 9,159 11,924 19,837 -4.08 -3.70 -2.77 -0.39 -1.31 Rep.2 16,009 8,041 9,785 -3.47 -4.07 -3.54 0.59 0.06 Rep.3 7,083 5,460 24,145 -3.51 -4.67 -2.69 1.16 -0.83 Avr. 10,750 8,475 17,922 -3.69 -4.14 -3.00 0.45 -0.69 StDv 4,671 3,254 7,369 0.34 0.49 0.47 0.78 0.70 PFKP Rep.1 144,614 98,784 122,550 -0.10 -0.65 -0.15 0.54 0.04 Rep.2 171,077 139,353 117,508 -0.06 0.05 0.05 -0.11 -0.11 Rep.3 99,055 83,294 108,599 0.29 -0.74 -0.52 1.03 0.81 Avr. 138,249 107,144 116,219 0.04 -0.45 -0.20 0.49 0.25 StDv 36,430 28,949 7,064 0.22 0.43 0.29 0.57 0.49 PFKL Rep.1 43,313 33,493 41,348 -1.84 -2.21 -1.71 0.37 -0.13 Rep.2 65,474 71,324 55,748 -1.44 -0.92 -1.03 -0.53 -0.42 Rep.3 44,011 41,829 66,882 -0.88 -1.73 -1.22 0.85 0.34 Avr. 50,933 48,882 54,659 -1.39 -1.62 -1.32 0.23 -0.07 StDv 12,598 19,877 12,802 0.48 0.65 0.36 0.70 0.38 PLA2G7 Rep.1 2,638 7,777 698 -5.88 -4.31 -7.60 -1.57 1.72 Rep.2 15,312 7,533 28 -3.54 -4.16 -11.98 0.62 8.45 Rep.3 1,237 9,543 2,435 -6.03 -3.86 -6.00 -2.17 -0.04 Avr. 6,396 8,284 1,054 -5.15 -4.11 -8.53 -1.04 3.38 StDv 7,753 1,097 1,242 1.40 0.23 3.10 1.47 4.48 PSMA Rep.1 48,780 219,535 13,959 -1.67 0.51 -3.28 -2.18 1.61 Rep.2 39,582 266,004 162 -2.17 0.98 -9.45 -3.15 7.28 Rep.3 12,045 155,230 3,076 -2.75 0.16 -5.66 -2.91 2.91 Avr. 33,469 213,590 5,732 -2.20 0.55 -6.13 -2.74 3.94 StDv 19,115 55,626 7,272 0.54 0.41 3.11 0.51 2.97 SAA2 Rep.1 32,915 23,385 5,206 -2.24 -2.72 -4.70 0.49 2.47 Rep.2 16,951 10,526 334 -3.39 -3.68 -8.41 0.29 5.02 Rep.3 11,263 12,714 3,183 -2.85 -3.45 -5.61 0.61 2.76 Avr. 20,376 15,542 2,908 -2.82 -3.28 -6.24 0.46 3.42 StDv 11,225 6,880 2,448 0.58 0.50 1.93 0.16 1.39 SERPIN A1 Rep.1 123,407 96,522 39,550 -0.33 -0.68 -1.78 0.35 1.45 Rep.2 94,620 28,318 12,562 -0.91 -2.25 -3.18 1.34 2.26 Rep.3 48,679 53,221 41,185 -0.73 -1.39 -1.92 0.65 1.18 Avr. 88,902 59,354 31,099 -0.66 -1.44 -2.29 0.78 1.63 StDv 37,691 34,513 16,074 0.30 0.79 0.77 0.51 0.56 SLC10A7 Rep.1 16,866 34,875 7,675 -3.20 -2.15 -4.14 -1.05 0.94 Rep.2 3,660 5,356 3,205 -5.60 -4.65 -5.15 -0.95 -0.46 Rep.3 7,367 13,761 1,632 -3.46 -3.34 -6.57 -0.12 3.12 Avr. 9,298 17,997 4,171 -4.09 -3.38 -5.29 -0.71 1.20 StDv 6,811 15,209 3,135 1.32 1.25 1.22 0.51 1.80 SMAD5 Rep.1 369,739 350,017 407,427 1.25 1.18 1.59 0.07 -0.33 Rep.2 290,176 196,854 221,405 0.71 0.55 0.96 0.16 -0.26 Rep.3 196,008 163,982 204,033 1.28 0.24 0.39 1.04 0.88 Avr. 285,308 236,951 277,622 1.08 0.66 0.98 0.42 0.10 StDv 86,968 99,288 112,750 0.32 0.48 0.60 0.53 0.68 SPON2 Rep.1 120,585 152,859 71,489 -0.36 -0.02 -0.92 -0.35 0.56 Rep.2 177,482 137,573 49,919 0.00 0.03 -1.18 -0.03 1.18 Rep.3 87,791 85,642 68,463 0.12 -0.70 -1.18 0.82 1.30 Avr. 128,619 125,358 63,290 -0.08 -0.23 -1.10 0.14 1.01 StDv 45,382 35,234 11,678 0.25 0.41 0.15 0.60 0.40 SRC Rep.1 22,920 29,855 12,967 -2.76 -2.37 -3.39 -0.39 0.63 Rep.2 20,332 26,195 16,253 -3.13 -2.36 -2.80 -0.77 -0.33 Rep.3 13,691 17,857 33,398 -2.56 -2.96 -2.22 0.40 -0.35 Avr. 18,981 24,636 20,873 -2.82 -2.56 -2.80 -0.25 -0.01 StDv 4,761 6,149 10,971 0.29 0.34 0.58 0.59 0.56 SYNPO2 Rep.1 1,269,282 764,162 1,271,402 3.03 2.31 3.23 0.73 -0.20 Rep.2 1,854,291 663,642 1,094,823 3.38 2.30 3.27 1.08 0.11 Rep.3 1,054,005 725,221 1,560,688 3.70 2.38 3.33 1.32 0.37 Avr. 1,392,526 717,675 1,308,971 3.37 2.33 3.28 1.04 0.10 StDv 414,133 50,683 235,194 0.34 0.05 0.05 0.30 0.29 TDRD1 Rep.1 9,108 2,685 847 -4.09 -5.85 -7.32 1.76 3.23 Rep.2 3,369 1,050 1,123 -5.72 -7.00 -6.66 1.28 0.94 Rep.3 1,790 176 5 -5.50 -9.63 -14.92 4.13 9.43 Avr. 4,756 1,304 658 -5.10 -7.49 -9.64 2.39 4.53 StDv 3,851 1,274 582 0.88 1.94 4.59 1.52 4.39 TRIB1 Rep.1 41,926 46,385 34,225 -1.89 -1.74 -1.99 -0.15 0.10 Rep.2 47,764 35,288 23,641 -1.90 -1.93 -2.26 0.03 0.37 Rep.3 22,768 15,896 12,646 -1.83 -3.13 -3.62 1.30 1.79 Avr. 37,486 32,523 23,504 -1.87 -2.27 -2.62 0.39 0.75 StDv 13,076 15,431 10,790 0.04 0.75 0.87 0.79 0.91 TSPAN13 Rep.1 126,805 135,413 60,500 -0.29 -0.19 -1.16 -0.10 0.87 Rep.2 127,130 153,934 66,513 -0.48 0.19 -0.77 -0.68 0.29 Rep.3 99,522 52,802 42,203 0.30 -1.40 -1.88 1.70 2.18 Avr. 117,819 114,050 56,405 -0.16 -0.46 -1.27 0.31 1.11 StDv 15,847 53,844 12,662 0.41 0.83 0.56 1.24 0.97 - In Table 14, the data represents those RNA biomarkers with a Log2 FC >2 in the differential expression in the tumour compare to the adjacent gland. Most of these RNA biomarkers are up regulated in the tumor compared with the adjacent glandular tissue. Only two biomarkers were detected in a higher amount in the adjacent glandular tissue compared with all tumors. Some distinctions between the different grades of tumors can be made, for example with the OPRK1 and PSMA RNA biomarkers.
Table 14: RNA biomarker with differential expression (Log 2 FC) in Tumor and adjacent tissues of Subject 2Differential expression (>2Log2FC) in Subject 2 tumors* compared with adjacent glandular tissueRNA Biomarkers Up regulated in: T1 TPX2, SPP1, PIP T2 HOXC4, HPN, KLK3.470, C15orf48, PSMA, PLA2G7, SAA2, HN1 T3 HPN, C15orf48, KLK3.470, ApoC1, SAA2 Down regulated in: T1 PSCA T2 PSCA, OPRK1, IGFBP1 T3 OPRK1 *T1(Gleason score 4+5), T2 (3+4), and T3 (3+3)) - Before proceeding with the amplicon production for RBAS analysis, the efficiency of all the RNA specific primers was tested by real time PCR or by visualization of the produced amplicon of the expected size. Therefore, the lower sequence counts observed for certain amplicons produced from prostatectomy tissues RNA cannot be attributed to the inefficiency of the amplicon production. As seen in Example 1, raw sequence counts of 900 and 13,000 were obtained from the MUC1 amplicon produced from LNCaP and A549 cell RNA respectively (Table 6).
- The process used to select RNA biomarkers disclosed herein is by selecting those that are up-regulated or down-regulated in a small number of prostate tumors, rather than in all prostate tumors. For this reason it is not expected that differential expression of all the RNA biomarkers would be seen in all prostate tumors or their adjacent tissues. The data indicate that tumors examined from
Subjects - In conclusion, these observations highlight the issue with staging prostate cancers and illustrate reasons for developing multi-RNA biomarker diagnostics, as it is unlikely that a single RNA biomarker can diagnose and stage prostate cancers, or distinguish prostate cancer from begnin prostate hyperplasia or prostatitis.
- SEQ ID NO: 1-326 are set out in the attached Sequence Listing. The codes for nucleotide sequences used in the attached Sequence Listing, including the symbol "n," conform to WIPO Standard ST.25 (1998),
Appendix 2, Table 1. -
- <110> Watson, James D
Elton, Clare
Musgrave, David Rex - <120> Methods and Materials for the Diagnosis
of Prostate Cancer - <130> 24700.1009PCT
- <150>
61/665,849
<151> 2012-06-28 - <150>
61/691,743
<151> 2012-08-21 - <150>
61/709,517
<151> 2012-10-04 - <160> 326
- <170> FastSEQ for windows version 4.0
- <210> 1
<211> 1449
<212> DNA
<213> Homo sapiens - <400> 1

- <210> 2
<211> 996
<212> DNA
<213> Homo sapiens - <400> 2


- <210> 3
<211> 1251
<212> DNA
<213> Homo sapiens - <400> 3
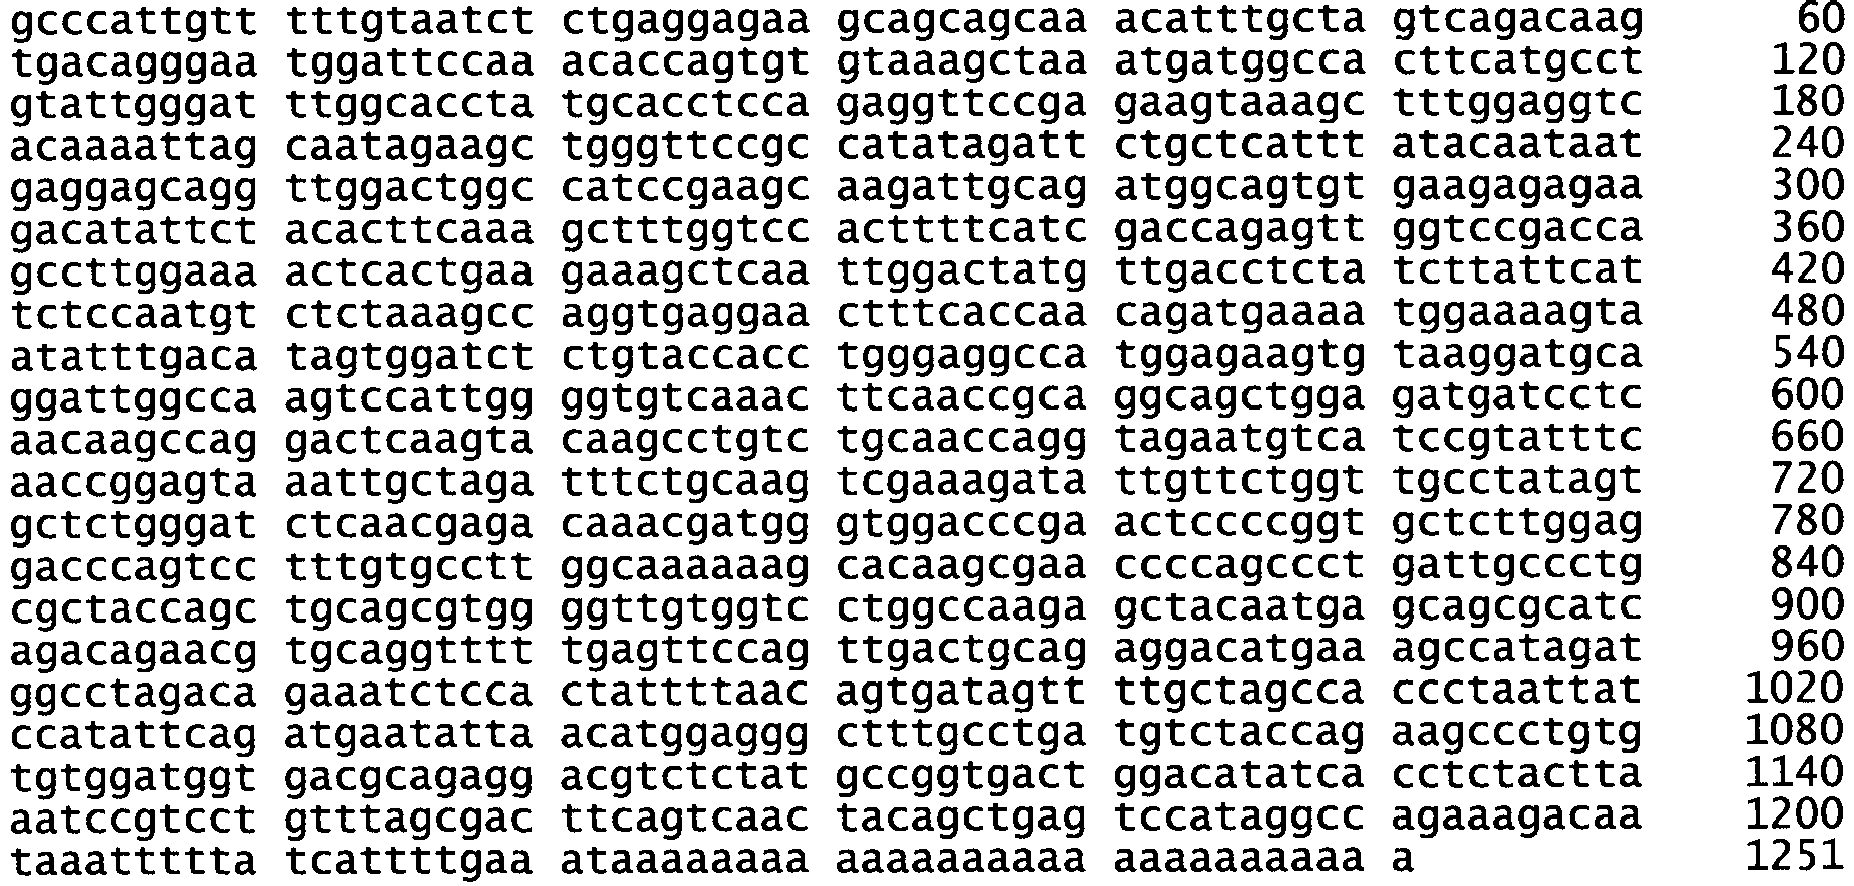
- <210> 4
<211> 464
<212> DNA
<213> Homo sapiens - <400> 4

- <210> 5
<211> 1223
<212> DNA
<213> Homo sapiens - <400> 5


- <210> 6
<211> 10661
<212> DNA
<213> Homo sapiens - <400> 6


- <210> 7
<211> 929
<212> DNA
<213> Homo sapiens - <400> 7

- <210> 8
<211> 2231
<212> DNA
<213> Homo sapiens - <400> 8

- <210> 9
<211> 1975
<212> DNA
<213> Homo sapiens - <400> 9

- <210> 10
<211> 6114
<212> DNA
<213> Homo sapiens - <400> 10


- <210> 11
<211> 2298
<212> DNA
<213> Homo sapiens - <400> 11

- <210> 12
<211> 9179
<212> DNA
<213> Homo sapiens - <400> 12


- <210> 13
<211> 1665
<212> DNA
<213> Homo sapiens - <400> 13

- <210> 14
<211> 2071
<212> DNA
<213> Homo sapiens - <400> 14


- <210> 15
<211> 4337
<212> DNA
<213> Homo sapiens - <400> 15


- <210> 16
<211> 7771
<212> DNA
<213> Homo sapiens - <400> 16

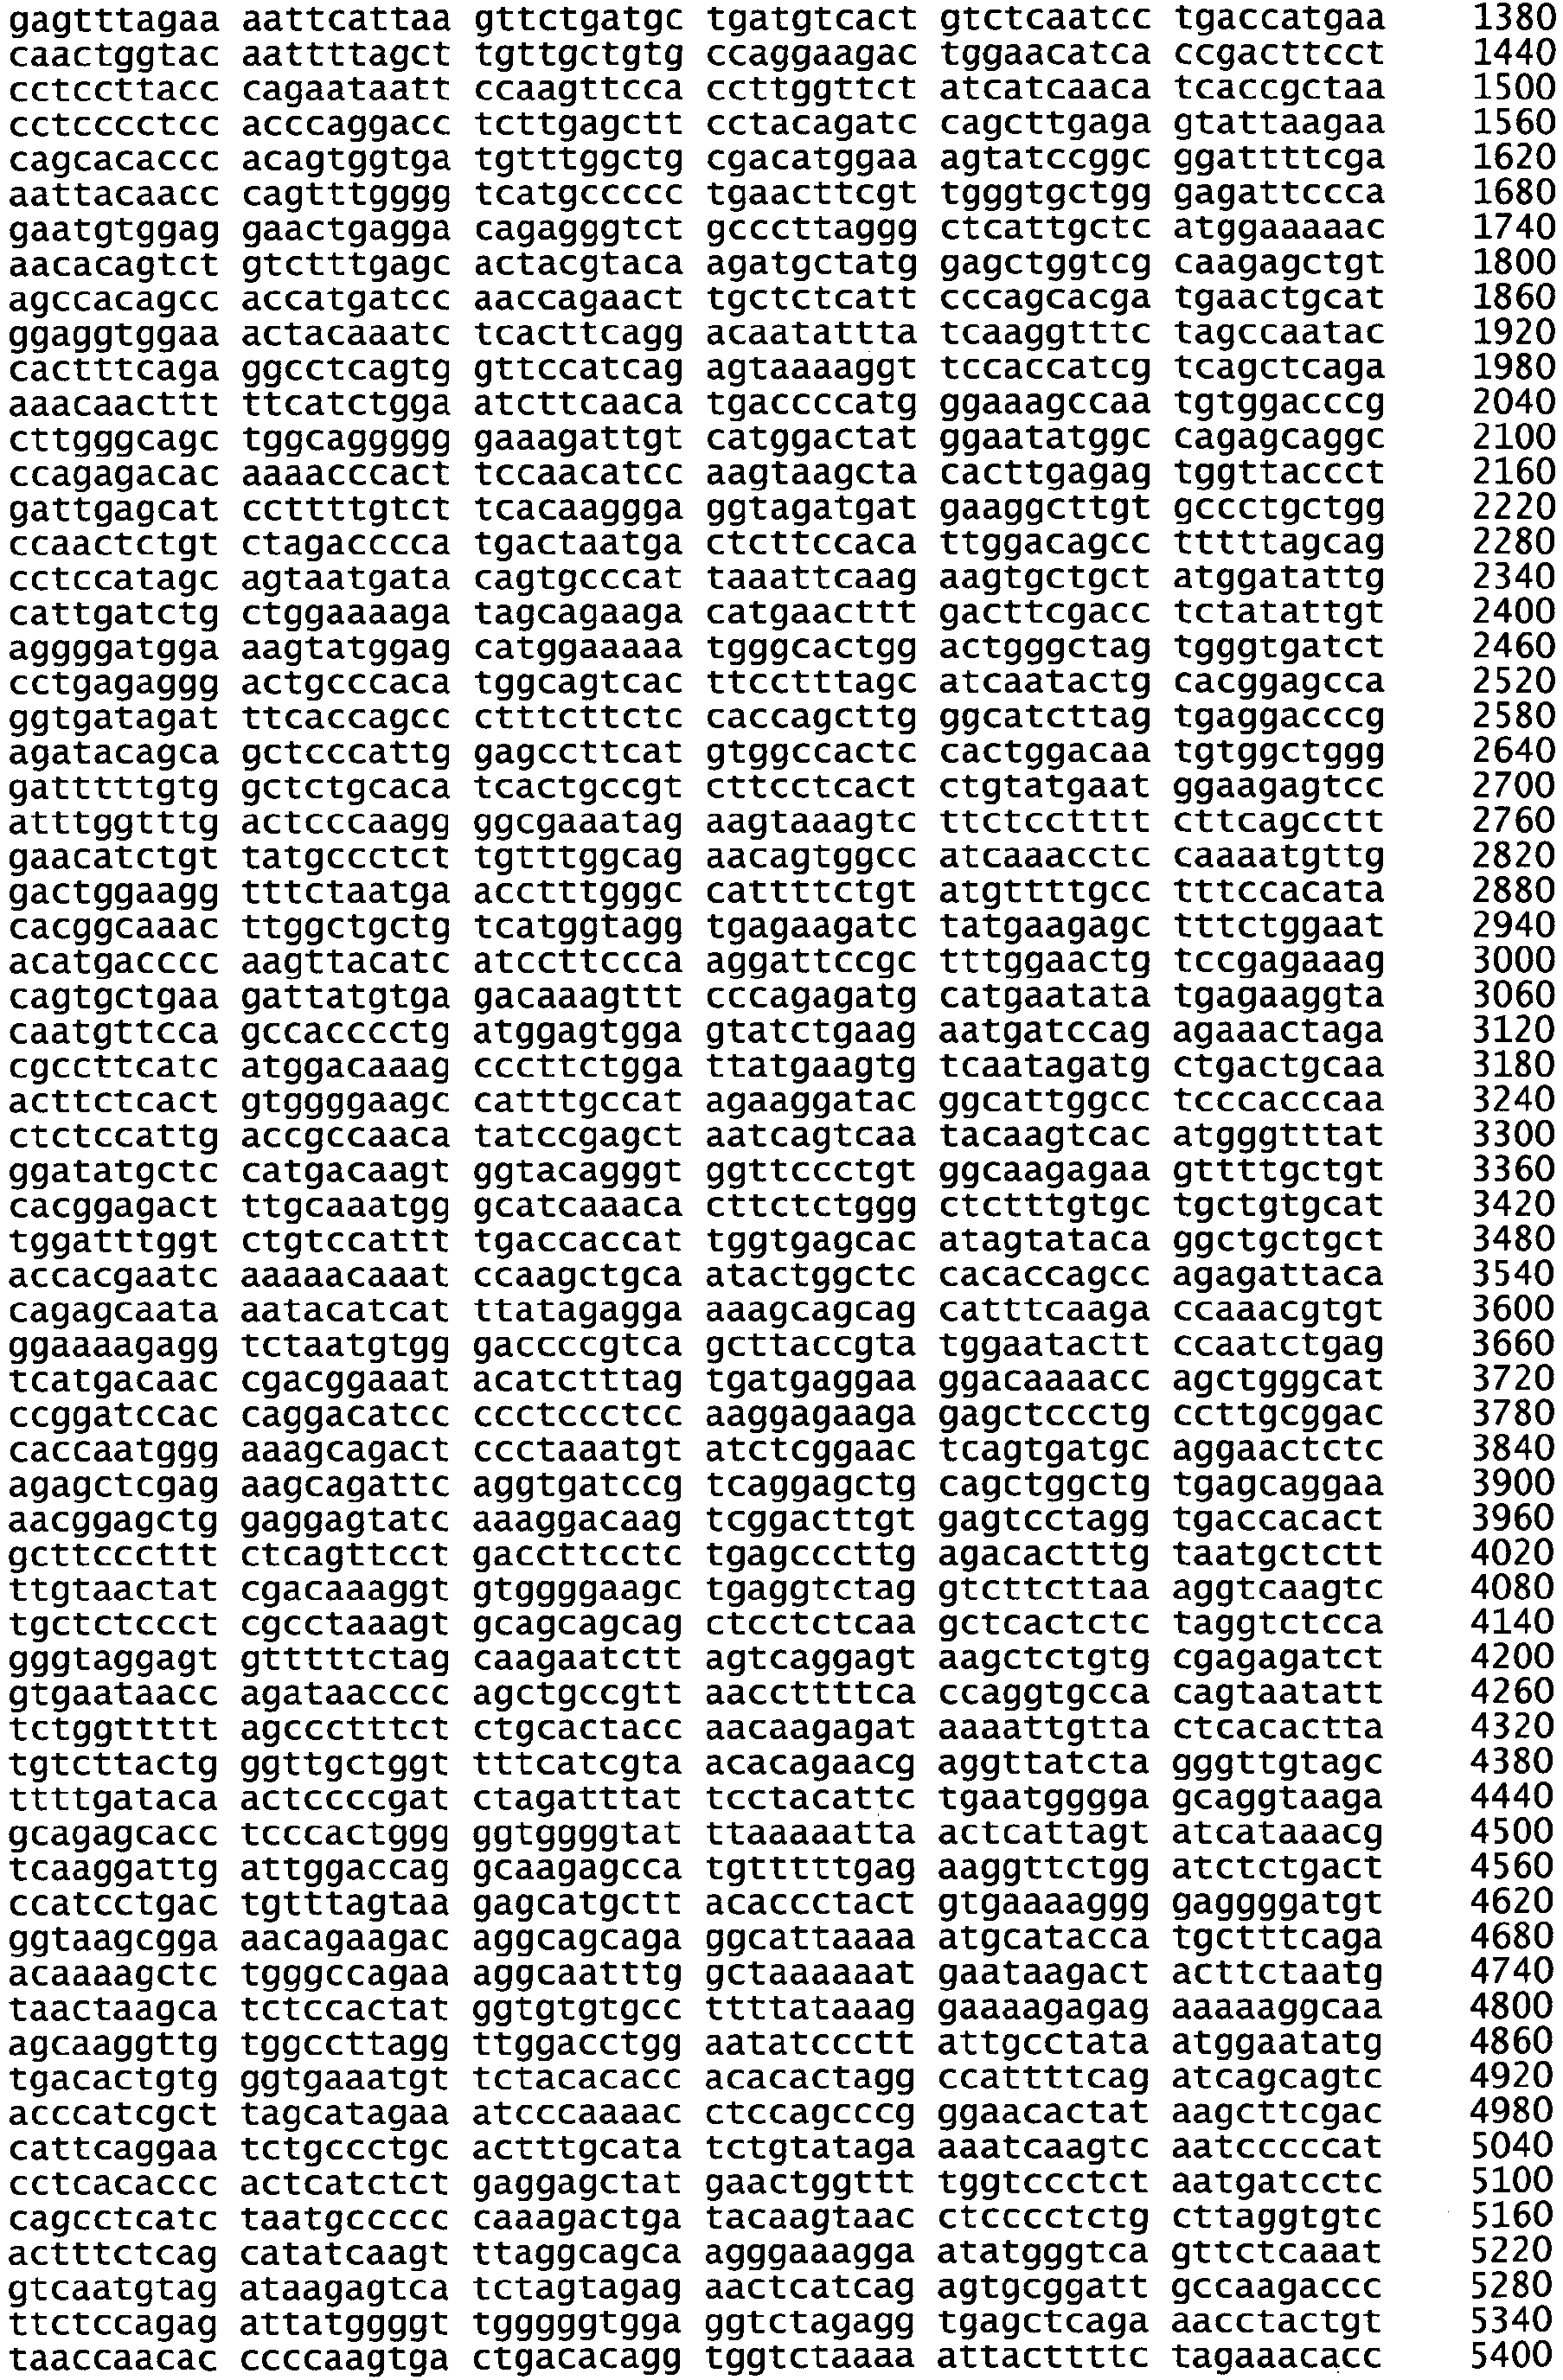

- <210> 17
<211> 4082
<212> DNA
<213> Homo sapiens - <400> 17


- <210> 18
<211> 15164
<212> DNA
<213> Homo sapiens - <400> 18


- <210> 19
<211> 2300
<212> DNA
<213> Homo sapiens - <400> 19


- <210> 20
<211> 1602
<212> DNA
<213> Homo sapiens - <400> 20

- <210> 21
<211> 3044
<212> DNA
<213> Homo sapiens - <400> 21


- <210> 22
<211> 2389
<212> DNA
<213> Homo sapiens - <400> 22


- <210> 23
<211> 914
<212> DNA
<213> Homo sapiens - <400> 23

- <210> 24
<211> 1660
<212> DNA
<213> Homo sapiens - <400> 24

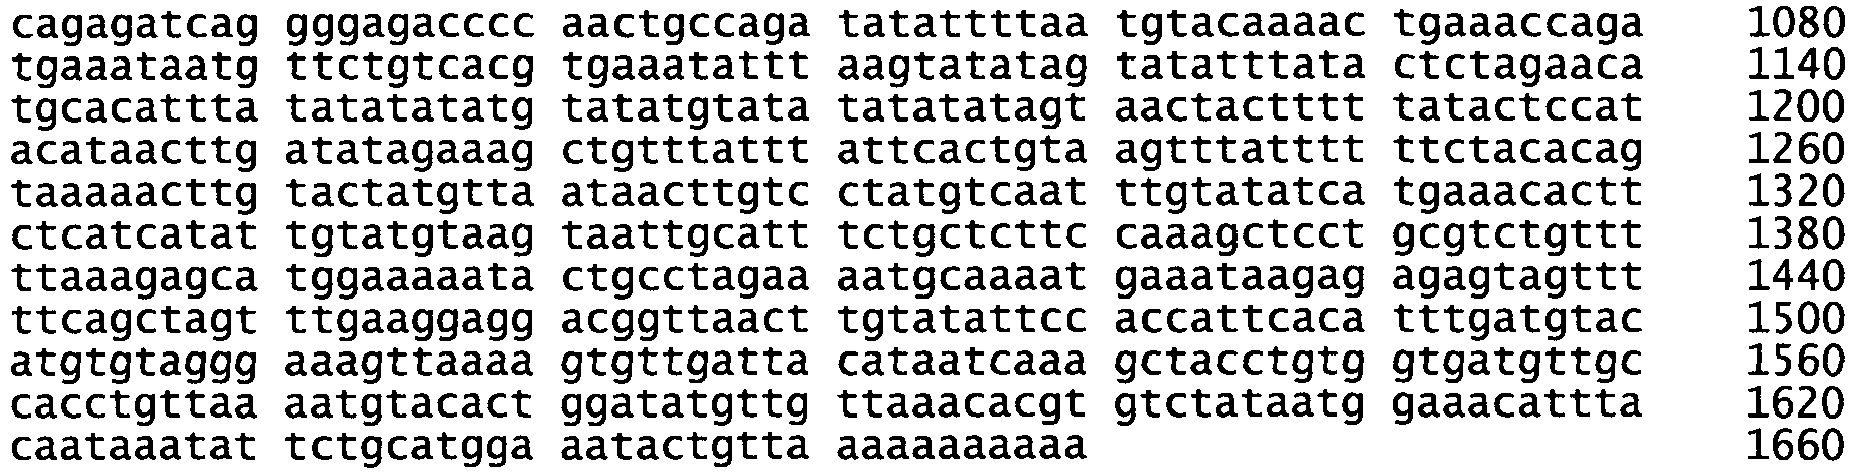
- <210> 25
<211> 1464
<212> DNA
<213> Homo sapiens - <400> 25

- <210> 26
<211> 2855
<212> DNA
<213> Homo sapiens - <400> 26


- <210> 27
<211> 9657
<212> DNA
<213> Homo sapiens - <400> 27


- <210> 28
<211> 3201
<212> DNA
<213> Homo sapiens - <400> 28

- <210> 29
<211> 1853
<212> DNA
<213> Homo sapiens - <400> 29


- <210> 30
<211> 5403
<212> DNA
<213> Homo sapiens - <400> 30


- <210> 31
<211> 4959
<212> DNA
<213> Homo sapiens - <400> 31


- <210> 32
<211> 2190
<212> DNA
<213> Homo sapiens - <400> 32

- <210> 33
<211> 2296
<212> DNA
<213> Homo sapiens - <400> 33


- <210> 34
<211> 894
<212> DNA
<213> Homo sapiens - <400> 34

- <210> 35
<211> 2034
<212> DNA
<213> Homo sapiens - <400> 35


- <210> 36
<211> 3401
<212> DNA
<213> Homo sapiens - <400> 36


- <210> 37
<211> 2657
<212> DNA
<213> Homo sapiens - <400> 37


- <210> 38
<211> 591
<212> DNA
<213> Homo sapiens - <400> 38

- <210> 39
<211> 1880
<212> DNA
<213> Homo sapiens - <400> 39

- <210> 40
<211> 1038
<212> DNA
<213> Homo sapiens - <400> 40

- <210> 41
<211> 2653
<212> DNA
<213> Homo sapiens - <400> 41


- <210> 42
<211> 594
<212> DNA
<213> Homo sapiens - <400> 42

- <210> 43
<211> 3220
<212> DNA
<213> Homo sapiens - <400> 43

- <210> 44
<211> 3783
<212> DNA
<213> Homo sapiens - <400> 44


- <210> 45
<211> 6937
<212> DNA
<213> Homo sapiens - <400> 45



- <210> 46
<211> 1883
<212> DNA
<213> Homo sapiens - <400> 46

- <210> 47
<211> 1616
<212> DNA
<213> Homo sapiens - <400> 47


- <210> 48
<211> 4044
<212> DNA
<213> Homo sapiens - <400> 48


- <210> 49
<211> 4510
<212> DNA
<213> Homo sapiens - <400> 49


- <210> 50
<211> 3300
<212> DNA
<213> Homo sapiens - <400> 50


- <210> 51
<211> 4872
<212> DNA
<213> Homo sapiens - <400> 51


- <210> 52
<211> 3685
<212> DNA
<213> Homo sapiens - <400> 52


- <210> 53
<211> 3658
<212> DNA
<213> Homo sapiens - <400> 53

- <210> 54
<211> 1912
<212> DNA
<213> Homo sapiens - <400> 54


- <210> 55
<211> 2264
<212> DNA
<213> Homo sapiens - <400> 55

- <210> 56
<211> 3223
<212> DNA
<213> Homo sapiens - <400> 56

- <210> 57
<211> 1278
<212> DNA
<213> Homo sapiens - <400> 57

- <210> 58
<211> 3012
<212> DNA
<213> Homo sapiens - <400> 58


- <210> 59
<211> 1970
<212> DNA
<213> Homo sapiens - <400> 59

- <210> 60
<211> 4412
<212> DNA
<213> Homo sapiens - <400> 60


- <210> 61
<211> 1727
<212> DNA
<213> Homo sapiens - <400> 61

- <210> 62
<211> 8533
<212> DNA
<213> Homo sapiens - <400> 62


- <210> 63
<211> 5091
<212> DNA
<213> Homo sapiens - <400> 63


- <210> 64
<211> 503
<212> DNA
<213> Homo sapiens - <400> 64

- <210> 65
<211> 7852
<212> DNA
<213> Homo sapiens - <400> 65


- <210> 66
<211> 1545
<212> DNA
<213> Homo sapiens - <400> 66

- <210> 67
<211> 739
<212> DNA
<213> Homo sapiens - <400> 67


- <210> 68
<211> 4482
<212> DNA
<213> Homo sapiens - <400> 68


- <210> 69
<211> 7355
<212> DNA
<213> Homo sapiens - <400> 69


- <210> 70
<211> 9950
<212> DNA
<213> Homo sapiens - <400> 70


- <210> 71
<211> 1182
<212> DNA
<213> Homo sapiens - <400> 71

- <210> 72
<211> 7158
<212> DNA
<213> Homo sapiens - <400> 72


- <210> 73
<211> 4336
<212> DNA
<213> Homo sapiens - <400> 73


- <210> 74
<211> 1496
<212> DNA
<213> Homo sapiens - <400> 74

- <210> 75
<211> 1874
<212> DNA
<213> Homo sapiens - <400> 75


- <210> 76
<211> 20
<212> DNA
<213> Artificial Sequence - <220>
<223> Made in a lab - <400> 76
acttcggagt tttgccattg 20 - <210> 77
<211> 19
<212> DNA
<213> Artificial Sequence - <220>
<223> Made in a lab - <400> 77
acggaaacca gcttcatcc 19 - <210> 78
<211> 19
<212> DNA
<213> Artificial Sequence - <220>
<223> Made in a lab - <400> 78
aggtgggtga ggaaatcca 19 - <210> 79
<211> 20
<212> DNA
<213> Artificial Sequence - <220>
<223> Made in a lab - <400> 79
gctccaggtt tgactgtggt 20 - <210> 80
<211> 20
<212> DNA
<213> Artificial Sequence - <220>
<223> Made in a lab - <400> 80
gtcctggcca agagctacaa 20 - <210> 81
<211> 21
<212> DNA
<213> Artificial Sequence - <220>
<223> Made in a lab - <400> 81
ctaggccatc tatggctttc a 21 - <210> 82
<211> 20
<212> DNA
<213> Artificial Sequence - <220>
<223> Made in a lab - <400> 82
ccgcatcaaa cagagtgaac 20 - <210> 83
<211> 20
<212> DNA
<213> Artificial Sequence - <220>
<223> Made in a lab - <400> 83
gtcacccttc aggtcctcat 20 - <210> 84
<211> 20
<212> DNA
<213> Artificial Sequence - <220>
<223> Made in a lab - <400> 84
tccagttccg atttgtaggc 20 - <210> 85
<211> 20
<212> DNA
<213> Artificial Sequence - <220>
<223> Made in a lab - <400> 85
gtcgcttttg ggattacctg 20 - <210> 86
<211> 20
<212> DNA
<213> Artificial Sequence - <220>
<223> Made in a lab - <400> 86
taccagctca ccaagctcct 20 - <210> 87
<211> 20
<212> DNA
<213> Artificial Sequence - <220>
<223> Made in a lab - <400> 87
aaagtccacg ctcaccatgt 20 - <210> 88
<211> 20
<212> DNA
<213> Artificial Sequence - <220>
<223> Made in a lab - <400> 88
atcccagtcc cacttgtgtc 20 - <210> 89
<211> 19
<212> DNA
<213> Artificial Sequence - <220>
<223> Made in a lab - <400> 89
aaacatggtc cctggcagt 19 - <210> 90
<211> 20
<212> DNA
<213> Artificial Sequence - <220>
<223> Made in a lab - <400> 90
gaaccttggg aaactgtgga 20 - <210> 91
<211> 20
<212> DNA
<213> Artificial Sequence - <220>
<223> Made in a lab - <400> 91
catttggtca ccctttggac 20 - <210> 92
<211> 20
<212> DNA
<213> Artificial Sequence - <220>
<223> Made in a lab - <400> 92
tcacaagcaa tccaaagctg 20 - <210> 93
<211> 20
<212> DNA
<213> Artificial Sequence - <220>
<223> Made in a lab - <400> 93
ttgggacagt aggcatttcc 20 - <210> 94
<211> 20
<212> DNA
<213> Artificial Sequence - <220>
<223> Made in a lab - <400> 94
cgagcagaga gggagtagga 20 - <210> 95
<211> 20
<212> DNA
<213> Artificial Sequence - <220>
<223> Made in a lab - <400> 95
ccacagacag ctgagttcca 20 - <210> 96
<211> 20
<212> DNA
<213> Artificial Sequence - <220>
<223> Made in a lab - <400> 96
tagccgttca ctccgctatt 20 - <210> 97
<211> 20
<212> DNA
<213> Artificial Sequence - <220>
<223> Made in a lab - <400> 97
ggagaaaagg gcttctggat 20 - <210> 98
<211> 20
<212> DNA
<213> Artificial Sequence - <220>
<223> Made in a lab - <400> 98
ccagccatga attacgacaa 20 - <210> 99
<211> 19
<212> DNA
<213> Artificial Sequence - <220>
<223> Made in a lab - <400> 99
cgggctcaca cacaaactt 19 - <210> 100
<211> 21
<212> DNA
<213> Artificial Sequence - <220>
<223> Made in a lab - <400> 100
catacaggct gaaatcctcc a 21 - <210> 101
<211> 20
<212> DNA
<213> Artificial Sequence - <220>
<223> Made in a lab - <400> 101
tgacacggat aaacctggaa 20 - <210> 102
<211> 21
<212> DNA
<213> Artificial Sequence - <220>
<223> Made in a lab - <400> 102
tggccatctc aatggagttt a 21 - <210> 103
<211> 19
<212> DNA
<213> Artificial Sequence - <220>
<223> Made in a lab - <400> 103
ataccaccgg gttttccaa 19 - <210> 104
<211> 20
<212> DNA
<213> Artificial Sequence - <220>
<223> Made in a lab - <400> 104
tggaattgct gttcctgatg 20 - <210> 105
<211> 22
<212> DNA
<213> Artificial Sequence - <220>
<223> Made in a lab - <400> 105
ggttgccatt ttgttaggat tc 22 - <210> 106
<211> 20
<212> DNA
<213> Artificial Sequence - <220>
<223> Made in a lab - <400> 106
gtctgtcctc ccaggctcag 20 - <210> 107
<211> 18
<212> DNA
<213> Artificial Sequence - <220>
<223> Made in a lab - <400> 107
gaaggcctca tccctgtg 18 - <210> 108
<211> 20
<212> DNA
<213> Artificial Sequence - <220>
<223> Made in a lab - <400> 108
tccctgtggc aagagaagtt 20 - <210> 109
<211> 20
<212> DNA
<213> Artificial Sequence - <220>
<223> Made in a lab - <400> 109
tggtggtcaa aatggacaga 20 - <210> 110
<211> 20
<212> DNA
<213> Artificial Sequence - <220>
<223> Made in a lab - <400> 110
tcatccaaga agccctaacg 20 - <210> 111
<211> 20
<212> DNA
<213> Artificial Sequence - <220>
<223> Made in a lab - <400> 111
cgctttctct gagcattctg 20 - <210> 112
<211> 20
<212> DNA
<213> Artificial Sequence - <220>
<223> Made in a lab - <400> 112
gatggcagat tccgactgag 20 - <210> 113
<211> 20
<212> DNA
<213> Artificial Sequence - <220>
<223> Made in a lab - <400> 113
cttgcacatg tgaggccata 20 - <210> 114
<211> 20
<212> DNA
<213> Artificial Sequence - <220>
<223> Made in a lab - <400> 114
ccagcaagca acccatagtc 20 - <210> 115
<211> 19
<212> DNA
<213> Artificial Sequence - <220>
<223> Made in a lab - <400> 115
acttgctgcc gggtatagg 19 - <210> 116
<211> 20
<212> DNA
<213> Artificial Sequence - <220>
<223> Made in a lab - <400> 116
ggaactcctc tgaagcaagc 20 - <210> 117
<211> 20
<212> DNA
<213> Artificial Sequence - <220>
<223> Made in a lab - <400> 117
cacgggcttc tcttcactct 20 - <210> 118
<211> 20
<212> DNA
<213> Artificial Sequence - <220>
<223> Made in a lab - <400> 118
cagccggttt attgtgcttc 20 - <210> 119
<211> 20
<212> DNA
<213> Artificial Sequence - <220>
<223> Made in a lab - <400> 119
aacaaagcct ggacaaatgg 20 - <210> 120
<211> 20
<212> DNA
<213> Artificial Sequence - <220>
<223> Made in a lab - <400> 120
cgaggagaac agcaacgata 20 - <210> 121
<211> 20
<212> DNA
<213> Artificial Sequence - <220>
<223> Made in a lab - <400> 121
cagatcttgc catccaccag 20 - <210> 122
<211> 20
<212> DNA
<213> Artificial Sequence - <220>
<223> Made in a lab - <400> 122
gtccctggat gtcaaccact 20 - <210> 123
<211> 20
<212> DNA
<213> Artificial Sequence - <220>
<223> Made in a lab - <400> 123
gatgtagcca tgctcgtcct 20 - <210> 124
<211> 20
<212> DNA
<213> Artificial Sequence - <220>
<223> Made in a lab - <400> 124
tatgatggct cgaaggctct 20 - <210> 125
<211> 20
<212> DNA
<213> Artificial Sequence - <220>
<223> Made in a lab - <400> 125
cctgtgcctt ggctaaactc 20 - <210> 126
<211> 18
<212> DNA
<213> Artificial Sequence - <220>
<223> Made in a lab - <400> 126
ccagtgggtc ctcacagc 18 - <210> 127
<211> 20
<212> DNA
<213> Artificial Sequence - <220>
<223> Made in a lab - <400> 127
agctgtggct gacctgaaat 20 - <210> 128
<211> 22
<212> DNA
<213> Artificial Sequence - <220>
<223> Made in a lab - <400> 128
agcattgaac cagaggagtt ct 22 - <210> 129
<211> 18
<212> DNA
<213> Artificial Sequence - <220>
<223> Made in a lab - <400> 129
cccgagcagg tgcttttg 18 - <210> 130
<211> 20
<212> DNA
<213> Artificial Sequence - <220>
<223> Made in a lab - <400> 130
gtggacacct gtgtcagcat 20 - <210> 131
<211> 19
<212> DNA
<213> Artificial Sequence - <220>
<223> Made in a lab - <400> 131
cctcccacaa tccgagact 19 - <210> 132
<211> 19
<212> DNA
<213> Artificial Sequence - <220>
<223> Made in a lab - <400> 132
ctgattgttg acgggaacg 19 - <210> 133
<211> 20
<212> DNA
<213> Artificial Sequence - <220>
<223> Made in a lab - <400> 133
aggcattttt gcttcacacc 20 - <210> 134
<211> 18
<212> DNA
<213> Artificial Sequence - <220>
<223> Made in a lab - <400> 134
cccctgctgt gccaaaac 18 - <210> 135
<211> 18
<212> DNA
<213> Artificial Sequence - <220>
<223> Made in a lab - <400> 135
gcagtgccct ggaggaga 18 - <210> 136
<211> 20
<212> DNA
<213> Artificial Sequence - <220>
<223> Made in a lab - <400> 136
tgagcgagta ccccacctac 20 - <210> 137
<211> 20
<212> DNA
<213> Artificial Sequence - <220>
<223> Made in a lab - <400> 137
cccctacaag ttggcagaag 20 - <210> 138
<211> 25
<212> DNA
<213> Artificial Sequence - <220>
<223> Made in a lab - <400> 138
ttgcaggaag aataggatct tctaa 25 - <210> 139
<211> 18
<212> DNA
<213> Artificial Sequence - <220>
<223> Made in a lab - <400> 139
agtcccatcc ccattcct 18 - <210> 140
<211> 20
<212> DNA
<213> Artificial Sequence - <220>
<223> Made in a lab - <400> 140
tatctgcatc tggctgctgt 20 - <210> 141
<211> 20
<212> DNA
<213> Artificial Sequence - <220>
<223> Made in a lab - <400> 141
tgcaaggagc actcaatgac 20 - <210> 142
<211> 20
<212> DNA
<213> Artificial Sequence - <220>
<223> Made in a lab - <400> 142
aagcgattga cccttgagac 20 - <210> 143
<211> 20
<212> DNA
<213> Artificial Sequence - <220>
<223> Made in a lab - <400> 143
tgttgcgagt tgtttctgct 20 - <210> 144
<211> 20
<212> DNA
<213> Artificial Sequence - <220>
<223> Made in a lab - <400> 144
gcactgagtc atcaggagca 20 - <210> 145
<211> 20
<212> DNA
<213> Artificial Sequence - <220>
<223> Made in a lab - <400> 145
caccagttcc ggacacacta 20 - <210> 146
<211> 20
<212> DNA
<213> Artificial Sequence - <220>
<223> Made in a lab - <400> 146
agtcctggtg ggaacagatg 20 - <210> 147
<211> 20
<212> DNA
<213> Artificial Sequence - <220>
<223> Made in a lab - <400> 147
ttggagccac agagaaggtt 20 - <210> 148
<211> 19
<212> DNA
<213> Artificial Sequence - <220>
<223> Made in a lab - <400> 148
tgttctgctg ggagtgcat 19 - <210> 149
<211> 20
<212> DNA
<213> Artificial Sequence - <220>
<223> Made in a lab - <400> 149
tgccgaaggt agatgagctt 20 - <210> 150
<211> 20
<212> DNA
<213> Artificial Sequence - <220>
<223> Made in a lab - <400> 150
tatggtattc acgccctgct 20 - <210> 151
<211> 20
<212> DNA
<213> Artificial Sequence - <220>
<223> Made in a lab - <400> 151
tgacacacat gacgatgcag 20 - <210> 152
<211> 20
<212> DNA
<213> Artificial Sequence - <220>
<223> Made in a lab - <400> 152
cgatgattcc atttgtgtgc 20 - <210> 153
<211> 20
<212> DNA
<213> Artificial Sequence - <220>
<223> Made in a lab - <400> 153
tgagccacca ctgttctttg 20 - <210> 154
<211> 20
<212> DNA
<213> Artificial Sequence - <220>
<223> Made in a lab - <400> 154
ctggttctct gcctgcagtt 20 - <210> 155
<211> 20
<212> DNA
<213> Artificial Sequence - <220>
<223> Made in a lab - <400> 155
gcagtgactt cgtcatttgg 20 - <210> 156
<211> 20
<212> DNA
<213> Artificial Sequence - <220>
<223> Made in a lab - <400> 156
ctggcttatg ggcaacattt 20 - <210> 157
<211> 20
<212> DNA
<213> Artificial Sequence - <220>
<223> Made in a lab - <400> 157
ccccaagacc atgagaaaaa 20 - <210> 158
<211> 19
<212> DNA
<213> Artificial Sequence - <220>
<223> Made in a lab - <400> 158
ctgcctgcag gtggagaac 19 - <210> 159
<211> 20
<212> DNA
<213> Artificial Sequence - <220>
<223> Made in a lab - <400> 159
gagtcatcca cgcagttcaa 20 - <210> 160
<211> 23
<212> DNA
<213> Artificial Sequence - <220>
<223> Made in a lab - <400> 160
tcatgtttct ggaaagagca ttt 23 - <210> 161
<211> 23
<212> DNA
<213> Artificial Sequence - <220>
<223> Made in a lab - <400> 161
tgctttcaat atcaaacaga gca 23 - <210> 162
<211> 20
<212> DNA
<213> Artificial Sequence - <220>
<223> Made in a lab - <400> 162
gccgatgtaa ttggcttctc 20 - <210> 163
<211> 20
<212> DNA
<213> Artificial Sequence - <220>
<223> Made in a lab - <400> 163
tggttttctg ctccttggtc 20 - <210> 164
<211> 22
<212> DNA
<213> Artificial Sequence - <220>
<223> Made in a lab - <400> 164
gcatcactaa ggtcttcagc aa 22 - <210> 165
<211> 20
<212> DNA
<213> Artificial Sequence - <220>
<223> Made in a lab - <400> 165
tcagtccctt tctcgtcgat 20 - <210> 166
<211> 22
<212> DNA
<213> Artificial Sequence - <220>
<223> Made in a lab - <400> 166
tcatcttctt ctgtgccttt ca 22 - <210> 167
<211> 22
<212> DNA
<213> Artificial Sequence - <220>
<223> Made in a lab - <400> 167
tccttgatgt atcttcggac aa 22 - <210> 168
<211> 20
<212> DNA
<213> Artificial Sequence - <220>
<223> Made in a lab - <400> 168
ggagtttgct cagcttctgg 20 - <210> 169
<211> 20
<212> DNA
<213> Artificial Sequence - <220>
<223> Made in a lab - <400> 169
tgatattctg ctccccaacc 20 - <210> 170
<211> 20
<212> DNA
<213> Artificial Sequence - <220>
<223> Made in a lab - <400> 170
ccagcaggga caatgagatt 20 - <210> 171
<211> 18
<212> DNA
<213> Artificial Sequence - <220>
<223> Made in a lab - <400> 171
agtggcctcc gcacagtc 18 - <210> 172
<211> 20
<212> DNA
<213> Artificial Sequence - <220>
<223> Made in a lab - <400> 172
gccgaggtga tagtgtggtt 20 - <210> 173
<211> 20
<212> DNA
<213> Artificial Sequence - <220>
<223> Made in a lab - <400> 173
tgaggtgatg tcctcgtctg 20 - <210> 174
<211> 21
<212> DNA
<213> Artificial Sequence - <220>
<223> Made in a lab - <400> 174
ggagtttgct ggactttctc a 21 - <210> 175
<211> 20
<212> DNA
<213> Artificial Sequence - <220>
<223> Made in a lab - <400> 175
acgtagttca tccgctccac 20 - <210> 176
<211> 20
<212> DNA
<213> Artificial Sequence - <220>
<223> Made in a lab - <400> 176
cagagtgcaa ccaatcacct 20 - <210> 177
<211> 22
<212> DNA
<213> Artificial Sequence - <220>
<223> Made in a lab - <400> 177
aattgagaag agcttccatt ca 22 - <210> 178
<211> 20
<212> DNA
<213> Artificial Sequence - <220>
<223> Made in a lab - <400> 178
ggagacgtaa agctgccaac 20 - <210> 179
<211> 20
<212> DNA
<213> Artificial Sequence - <220>
<223> Made in a lab - <400> 179
agctactgct ttggcaggaa 20 - <210> 180
<211> 20
<212> DNA
<213> Artificial Sequence - <220>
<223> Made in a lab - <400> 180
acaaggcttt ttgcatttgg 20 - <210> 181
<211> 22
<212> DNA
<213> Artificial Sequence - <220>
<223> Made in a lab - <400> 181
tggtgtctgg ttaccaaaag ag 22 - <210> 182
<211> 20
<212> DNA
<213> Artificial Sequence - <220>
<223> made in a lab - <400> 182
tggaggaggc cagactacag 20 - <210> 183
<211> 20
<212> DNA
<213> Artificial Sequence - <220>
<223> Made in a lab - <400> 183
ctccagaccc tggtacttgc 20 - <210> 184
<211> 18
<212> DNA
<213> Artificial Sequence - <220>
<223> Made in a lab - <400> 184
gccgactacc tgctgctg 18 - <210> 185
<211> 25
<212> DNA
<213> Artificial Sequence - <220>
<223> Made in a lab - <400> 185
gattttgtcc tggtagtgtt taatg 25 - <210> 186
<211> 20
<212> DNA
<213> Artificial Sequence - <220>
<223> Made in a lab - <400> 186
gcattggcct gttcttcagt 20 - <210> 187
<211> 22
<212> DNA
<213> Artificial Sequence - <220>
<223> Made in a lab - <400> 187
tcatcaaagg aatgcactag ga 22 - <210> 188
<211> 23
<212> DNA
<213> Artificial Sequence - <220>
<223> Made in a lab - <400> 188
tcaagtagag atttgctcaa tgc 23 - <210> 189
<211> 19
<212> DNA
<213> Artificial Sequence - <220>
<223> Made in a lab - <400> 189
ggcttcattg gttggtcat 19 - <210> 190
<211> 20
<212> DNA
<213> Artificial Sequence - <220>
<223> Made in a lab - <400> 190
tgccacttga cggaattgta 20 - <210> 191
<211> 20
<212> DNA
<213> Artificial Sequence - <220>
<223> Made in a lab - <400> 191
ccaggtagca tgaggggata 20 - <210> 192
<211> 20
<212> DNA
<213> Artificial Sequence - <220>
<223> Made in a lab - <400> 192
ggtggaagga atggaggatt 20 - <210> 193
<211> 20
<212> DNA
<213> Artificial Sequence - <220>
<223> Made in a lab - <400> 193
aaccttccct gcaatacgtg 20 - <210> 194
<211> 20
<212> DNA
<213> Artificial Sequence - <220>
<223> Made in a lab - <400> 194
agcagctgaa cgagcagttt 20 - <210> 195
<211> 20
<212> DNA
<213> Artificial Sequence - <220>
<223> Made in a lab - <400> 195
aaggaacgtc cgagtcagaa 20 - <210> 196
<211> 20
<212> DNA
<213> Artificial Sequence - <220>
<223> Made in a lab - <400> 196
ctttcgatgt gccaagtgtg 20 - <210> 197
<211> 20
<212> DNA
<213> Artificial Sequence - <220>
<223> Made in a lab - <400> 197
ggcccgaagt ttttagcata 20 - <210> 198
<211> 20
<212> DNA
<213> Artificial Sequence - <220>
<223> Made in a lab - <400> 198
atttgcccag aagattggtg 20 - <210> 199
<211> 20
<212> DNA
<213> Artificial Sequence - <220>
<223> Made in a lab - <400> 199
catcgaaagc aggccttatg 20 - <210> 200
<211> 20
<212> DNA
<213> Artificial Sequence - <220>
<223> Made in a lab - <400> 200
cagagacgtc acaagccaac 20 - <210> 201
<211> 22
<212> DNA
<213> Artificial Sequence - <220>
<223> Made in a lab - <400> 201
tgctgactgt gttgtaattg ga 22 - <210> 202
<211> 20
<212> DNA
<213> Artificial Sequence - <220>
<223> Made in a lab - <400> 202
gcctactgcc tgaactgctt 20 - <210> 203
<211> 20
<212> DNA
<213> Artificial Sequence - <220>
<223> Made in a lab - <400> 203
ccgttcctca aaggagatgt 20 - <210> 204
<211> 20
<212> DNA
<213> Artificial Sequence - <220>
<223> Made in a lab - <400> 204
ccctggagga gtgctatgtc 20 - <210> 205
<211> 18
<212> DNA
<213> Artificial Sequence - <220>
<223> Made in a lab - <400> 205
gtgccgttga acttgacg 18 - <210> 206
<211> 21
<212> DNA
<213> Artificial Sequence - <220>
<223> Made in a lab - <400> 206
ccaagacgta gatccatcca a 21 - <210> 207
<211> 20
<212> DNA
<213> Artificial Sequence - <220>
<223> Made in a lab - <400> 207
tctgaggttg gtcctgaggt 20 - <210> 208
<211> 20
<212> DNA
<213> Artificial Sequence - <220>
<223> Made in a lab - <400> 208
gtgatctttg ccaccttcgt 20 - <210> 209
<211> 20
<212> DNA
<213> Artificial Sequence - <220>
<223> Made in a lab - <400> 209
cagtctgcca ctccgagttt 20 - <210> 210
<211> 21
<212> DNA
<213> Artificial Sequence - <220>
<223> Made in a lab - <400> 210
tgctgctaga tttgactgca a 21 - <210> 211
<211> 20
<212> DNA
<213> Artificial Sequence - <220>
<223> Made in a lab - <400> 211
tcccgtcctc atcgtagtct 20 - <210> 212
<211> 21
<212> DNA
<213> Artificial Sequence - <220>
<223> Made in a lab - <400> 212
agtgtgaggc agtggaaaac t 21 - <210> 213
<211> 20
<212> DNA
<213> Artificial Sequence - <220>
<223> Made in a lab - <400> 213
ccagggtacc agaccaagtg 20 - <210> 214
<211> 24
<212> DNA
<213> Artificial Sequence - <220>
<223> Made in a lab - <400> 214
gacattccat tctatcacaa cctg 24 - <210> 215
<211> 18
<212> DNA
<213> Artificial Sequence - <220>
<223> Made in a lab - <400> 215
gcgggtcatt tcactgag 18 - <210> 216
<211> 20
<212> DNA
<213> Artificial Sequence - <220>
<223> Made in a lab - <400> 216
tctgaggcca tcattgaaca 20 - <210> 217
<211> 20
<212> DNA
<213> Artificial Sequence - <220>
<223> Made in a lab - <400> 217
tcaggggctt cttcttcttg 20 - <210> 218
<211> 20
<212> DNA
<213> Artificial Sequence - <220>
<223> Made in a lab - <400> 218
cgttgaaaac atgccgtcag 20 - <210> 219
<211> 20
<212> DNA
<213> Artificial Sequence - <220>
<223> Made in a lab - <400> 219
cttgccaaag gtgctttctg 20 - <210> 220
<211> 20
<212> DNA
<213> Artificial Sequence - <220>
<223> Made in a lab - <400> 220
tatcctttgc cgtctcatca 20 - <210> 221
<211> 20
<212> DNA
<213> Artificial Sequence - <220>
<223> Made in a lab - <400> 221
ggctttcact cctcctgagc 20 - <210> 222
<211> 20
<212> DNA
<213> Artificial Sequence - <220>
<223> Made in a lab - <400> 222
agagtttgcc gagaggtctg 20 - <210> 223
<211> 20
<212> DNA
<213> Artificial Sequence - <220>
<223> Made in a lab - <400> 223
tggtccaagg tctggtgaat 20 - <210> 224
<211> 20
<212> DNA
<213> Artificial Sequence - <220>
<223> Made in a lab - <400> 224
ttacagtccc tgcccgatac 20 - <210> 225
<211> 20
<212> DNA
<213> Artificial Sequence - <220>
<223> Made in a lab - <400> 225
atgctgggtc tttggaacac 20 - <210> 226
<211> 20
<212> DNA
<213> Artificial Sequence - <220>
<223> Made in a lab - <400> 226
cagctgacag aaagcctgaa 20 - <210> 227
<211> 20
<212> DNA
<213> Artificial Sequence - <220>
<223> Made in a lab - <400> 227
tccggttctg cttttcactt 20 - <210> 228
<211> 20
<212> DNA
<213> Artificial Sequence - <220>
<223> Made in a lab - <400> 228
gcggaggagg agaaagagat 20 - <210> 229
<211> 20
<212> DNA
<213> Artificial Sequence - <220>
<223> Made in a lab - <400> 229
actagggtcc tcgtgtggtg 20 - <210> 230
<211> 20
<212> DNA
<213> Artificial Sequence - <220>
<223> Made in a lab - <400> 230
gttgagcagc atctcattgg 20 - <210> 231
<211> 22
<212> DNA
<213> Artificial Sequence - <220>
<223> Made in a lab - <400> 231
tgtggtccga ggcagtgaga gt 22 - <210> 232
<211> 21
<212> DNA
<213> Artificial Sequence - <220>
<223> Made in a lab - <400> 232
acagagcagg cctcgaggtg t 21 - <210> 233
<211> 18
<212> DNA
<213> Artificial Sequence - <220>
<223> Made in a lab - <400> 233
acgacgctct tccgatct 18 - <210> 234
<211> 18
<212> DNA
<213> Artificial Sequence - <220>
<223> Made in a lab - <400> 234
cgtgtgctct tccgatct 18 - <210> 235
<211> 1587
<212> DNA
<213> Homo sapiens - <400> 235

- <210> 236
<211> 11373
<212> DNA
<213> Homo sapiens - <400> 236


- <210> 237
<211> 3352
<212> DNA
<213> Homo sapiens - <400> 237


- <210> 238
<211> 2065
<212> DNA
<213> Homo sapiens - <400> 238


- <210> 239
<211> 533
<212> DNA
<213> Homo sapiens - <400> 239

- <210> 240
<211> 1864
<212> DNA
<213> Homo sapiens - <400> 240

- <210> 241
<211> 948
<212> DNA
<213> Homo sapiens - <400> 241

- <210> 242
<211> 1432
<212> DNA
<213> Homo sapiens - <400> 242

- <210> 243
<211> 4880
<212> DNA
<213> Homo sapiens - <400> 243


- <210> 244
<211> 2831
<212> DNA
<213> Homo sapiens - <400> 244

- <210> 245
<211> 2471
<212> DNA
<213> Homo sapiens - <400> 245


- <210> 246
<211> 4334
<212> DNA
<213> Homo sapiens - <400> 246


- <210> 247
<211> 2024
<212> DNA
<213> Homo sapiens - <400> 247


- <210> 248
<211> 782
<212> DNA
<213> Homo sapiens - <400> 248

- <210> 249
<211> 449
<212> DNA
<213> Homo sapiens - <400> 249

- <210> 250
<211> 4727
<212> DNA
<213> Homo sapiens - <400> 250


- <210> 251
<211> 1322
<212> DNA
<213> Homo sapiens - <400> 251

- <210> 252
<211> 1901
<212> DNA
<213> Homo sapiens - <400> 252


- <210> 253
<211> 1401
<212> DNA
<213> Homo sapiens - <400> 253

- <210> 254
<211> 5822
<212> DNA
<213> Homo sapiens - <400> 254


- <210> 255
<211> 2681
<212> DNA
<213> Homo sapiens - <400> 255

- <210> 256
<211> 3047
<212> DNA
<213> Homo sapiens - <400> 256

- <210> 257
<211> 4617
<212> DNA
<213> Homo sapiens - <400> 257


- <210> 258
<211> 3407
<212> DNA
<213> Homo sapiens - <400> 258

- <210> 259
<211> 2095
<212> DNA
<213> Homo sapiens - <400> 259

- <210> 260
<211> 2926
<212> DNA
<213> Homo sapiens - <400> 260


- <210> 261
<211> 3675
<212> DNA
<213> Homo sapiens - <400> 261


- <210> 262
<211> 2692
<212> DNA
<213> Homo sapiens - <400> 262

- <210> 263
<211> 6602
<212> DNA
<213> Homo sapiens - <400> 263


- <210> 264
<211> 1647
<212> DNA
<213> Homo sapiens - <400> 264

- <210> 265
<211> 1798
<212> DNA
<213> Homo sapiens - <400> 265

- <210> 266
<211> 1982
<212> DNA
<213> Homo sapiens - <400> 266

- <210> 267
<211> 2894
<212> DNA
<213> Homo sapiens - <400> 267

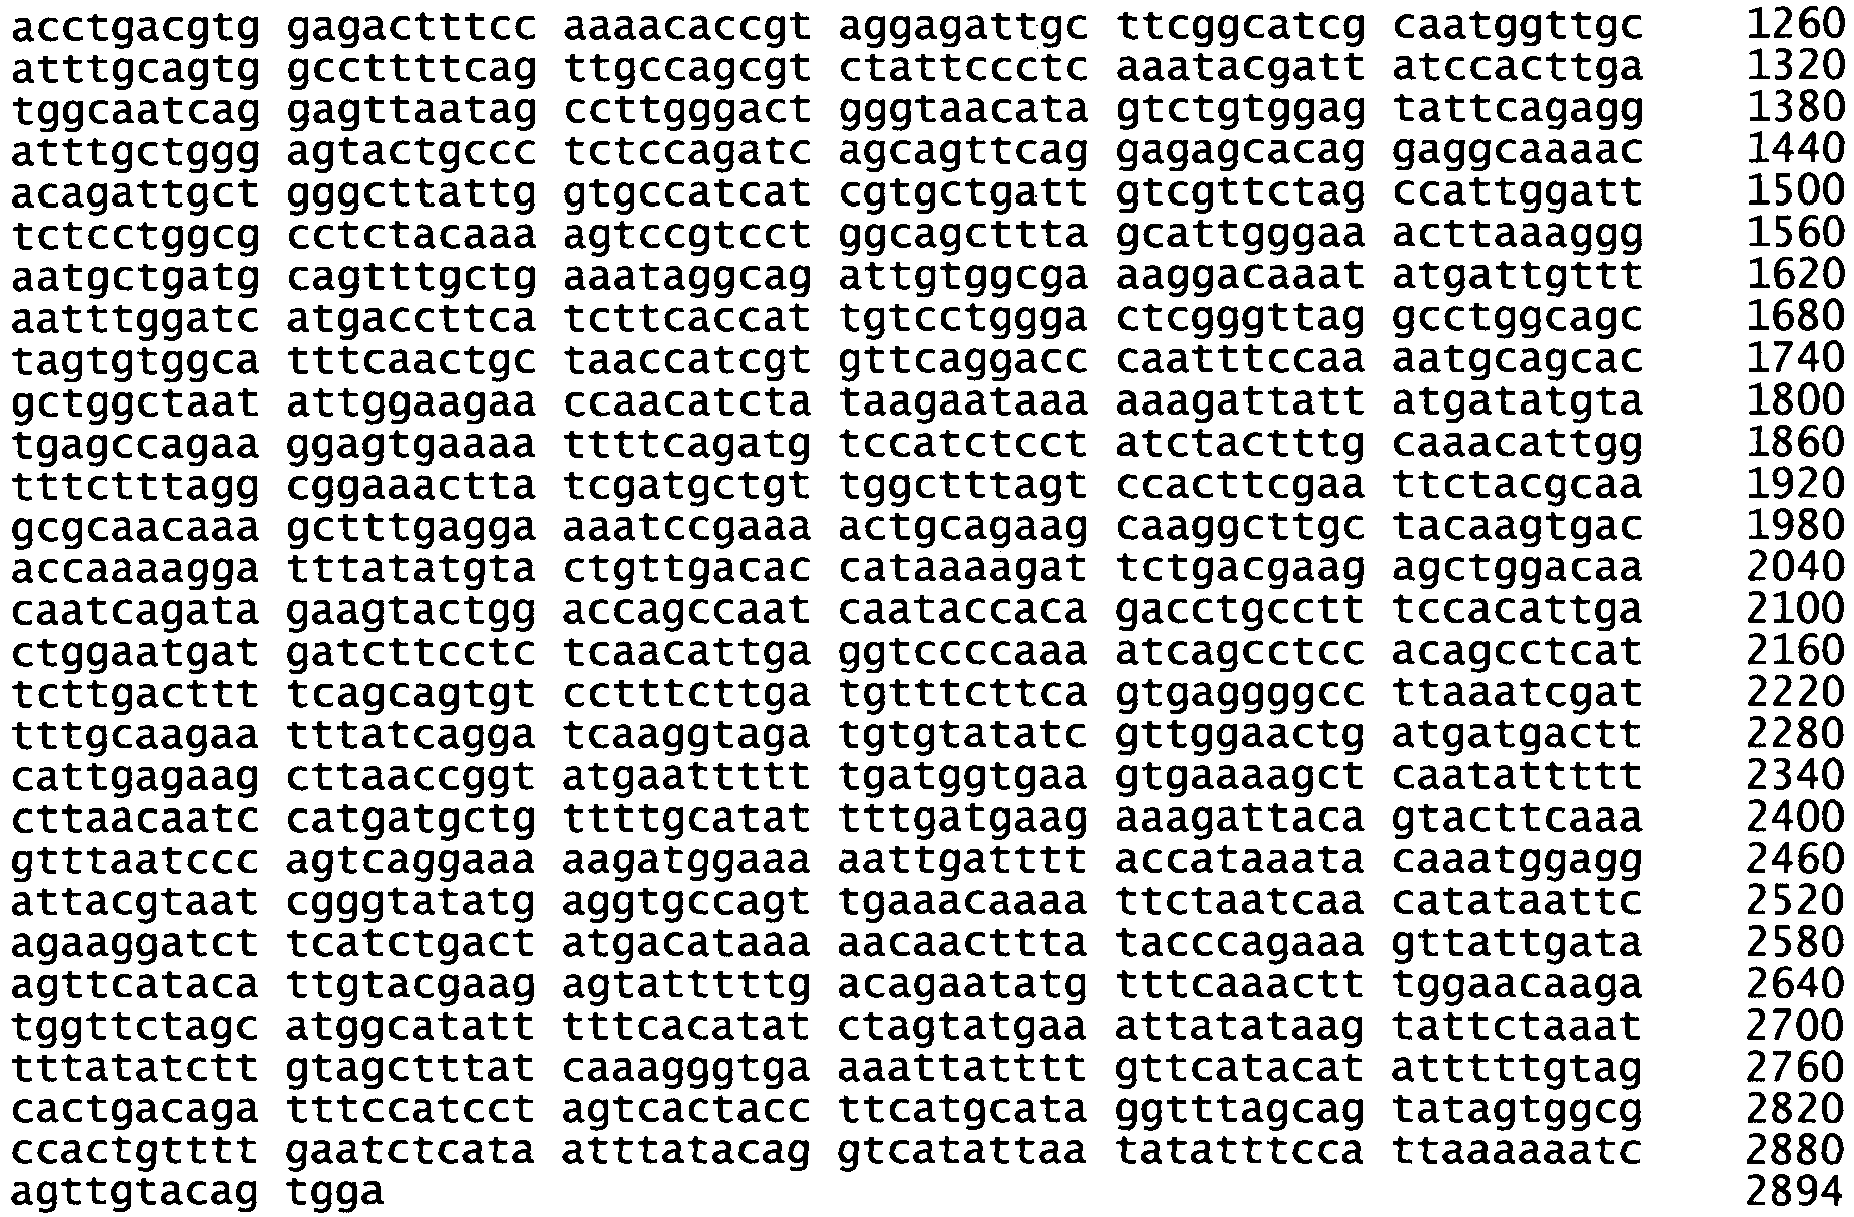
- <210> 268
<211> 3894
<212> DNA
<213> Homo sapiens - <400> 268


- <210> 269
<211> 2799
<212> DNA
<213> Homo sapiens - <400> 269


- <210> 270
<211> 1054
<212> DNA
<213> Homo sapiens - <400> 270

- <210> 271
<211> 1669
<212> DNA
<213> Homo sapiens - <400> 271


- <210> 272
<211> 823
<212> DNA
<213> Homo sapiens - <400> 272

- <210> 273
<211> 473
<212> DNA
<213> Homo sapiens - <400> 273

- <210> 274
<211> 1415
<212> DNA
<213> Homo sapiens - <400> 274


- <210> 275
<211> 1216
<212> DNA
<213> Homo sapiens - <400> 275

- <210> 276
<211> 672
<212> DNA
<213> Homo sapiens - <400> 276

- <210> 277
<211> 1599
<212> DNA
<213> Homo sapiens - <400> 277

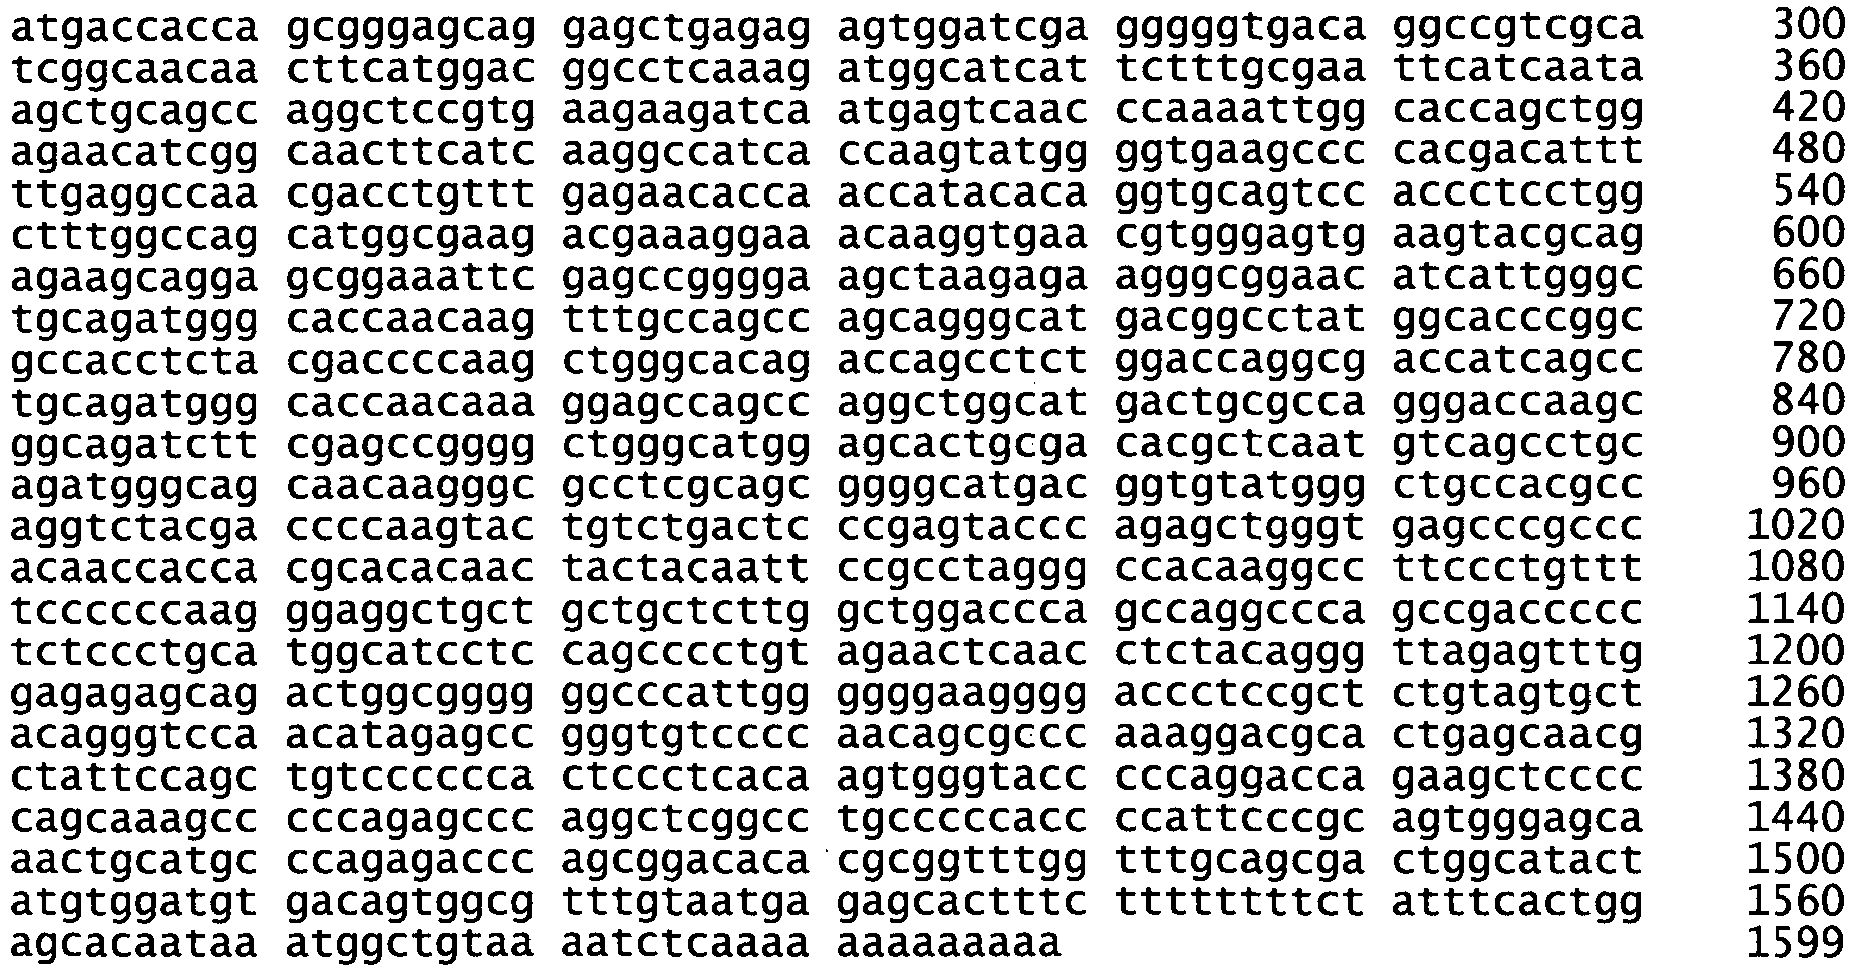
- <210> 278
<211> 1538
<212> DNA
<213> Homo sapiens - <400> 278

- <210> 279
<211> 2579
<212> DNA
<213> Homo sapiens - <400> 279


- <210> 280
<211> 986
<212> DNA
<213> Homo sapiens - <400> 280

- <210> 281
<211> 6120
<212> DNA
<213> Homo sapiens - <400> 281


- <210> 282
<211> 8220
<212> DNA
<213> Homo sapiens - <400> 282


- <210> 283
<211> 6882
<212> DNA
<213> Homo sapiens - <400> 283


- <210> 284
<211> 6921
<212> DNA
<213> Homo sapiens - <400> 284


- <210> 285
<211> 566
<212> DNA
<213> Homo sapiens - <400> 285

- <210> 286
<211> 2090
<212> DNA
<213> Homo sapiens - <400> 286


- <210> 287
<211> 2989
<212> DNA
<213> Homo sapiens - <400> 287


- <210> 288
<211> 3083
<212> DNA
<213> Homo sapiens - <400> 288

- <210> 289
<211> 2153
<212> DNA
<213> Homo sapiens - <400> 289

- <210> 290
<211> 790
<212> DNA
<213> Homo sapiens - <400> 290

- <210> 291
<211> 2119
<212> DNA
<213> Homo sapiens - <400> 291

- <210> 292
<211> 2438
<212> DNA
<213> Homo sapiens - <400> 292


- <210> 293
<211> 22
<212> DNA
<213> Artificial Sequence - <220>
<223> Made in a lab - <400> 293
tgaaaaatgg agaaacaaga cg 22 - <210> 294
<211> 20
<212> DNA
<213> Artificial Sequence - <220>
<223> Made in a lab - <400> 294
ttcccattga gccaggttta 20 - <210> 295
<211> 20
<212> DNA
<213> Artificial sequence - <220>
<223> Made in a lab - <400> 295
ctggagagcc aacctcaaag 20 - <210> 296
<211> 23
<212> DNA
<213> Artificial sequence - <220>
<223> Made in a lab - <400> 296
tcaataacaa aagtcaggtg age 23 - <210> 297
<211> 23
<212> DNA
<213> Artificial Sequence - <220>
<223> Made in a lab - <400> 297
atcactagac aaggaagaaa gca 23 - <210> 298
<211> 26
<212> DNA
<213> Artificial Sequence - <220>
<223> Made in a lab - <400> 298
ttagagactg tgaaggaatt agcaga 26 - <210> 299
<211> 20
<212> DNA
<213> Artificial Sequence - <220>
<223> Made in a lab - <400> 299
cagccagaac tgcagaagaa 20 - <210> 300
<211> 20
<212> DNA
<213> Artificial Sequence - <220>
<223> Made in a lab - <400> 300
aggcttcttg acacctggaa 20 - <210> 301
<211> 20
<212> DNA
<213> Artificial Sequence - <220>
<223> Made in a lab - <400> 301
gggacagctg ggtcttcata 20 - <210> 302
<211> 19
<212> DNA
<213> Artificial sequence - <220>
<223> Made in a lab - <400> 302
ctctggccat ccctcgtat 19 - <210> 303
<211> 20
<212> DNA
<213> Artificial Sequence - <220>
<223> Made in a lab - <400> 303
tgacttgggg agttcctacg 20 - <210> 304
<211> 20
<212> DNA
<213> Artificial Sequence - <220>
<223> Made in a lab - <400> 304
tgtttgtgtc tgggctgttc 20 - <210> 305
<211> 20
<212> DNA
<213> Artificial Sequence - <220>
<223> Made in a lab - <400> 305
gggttttggt ctcaccactg 20 - <210> 306
<211> 19
<212> DNA
<213> Artificial Sequence - <220>
<223> Made in a lab - <400> 306
atcccagagg catccaaag 19 - <210> 307
<211> 20
<212> DNA
<213> Artificial Sequence - <220>
<223> Made in a lab - <400> 307
agaagctggc atcagaaaaa 20 - <210> 308
<211> 21
<212> DNA
<213> Artificial Sequence - <220>
<223> Made in a lab - <400> 308
gcctcagatg gtaaagtcag c 21 - <210> 309
<211> 20
<212> DNA
<213> Artificial Sequence - <220>
<223> Made in a lab - <400> 309
gctggaccaa tagcaaggtg 20 - <210> 310
<211> 19
<212> DNA
<213> Artificial Sequence - <220>
<223> Made in a lab - <400> 310
aaggaagcat gggaaggtg 19 - <210> 311
<211> 20
<212> DNA
<213> Artificial Sequence - <220>
<223> Made in a lab - <400> 311
gggttcttca gcgtctatgc 20 - <210> 312
<211> 21
<212> DNA
<213> Artificial Sequence - <220>
<223> Made in a lab - <400> 312
ttcagcaaag gttgactcac a 21 - <210> 313
<211> 22
<212> DNA
<213> Artificial Sequence - <220>
<223> Made in a lab - <400> 313
aaaatcccat gacaaatcgt tc 22 - <210> 314
<211> 20
<212> DNA
<213> Artificial Sequence - <220>
<223> Made in a lab - <400> 314
gggcaacagt gaagtggttt 20 - <210> 315
<211> 20
<212> DNA
<213> Artificial Sequence - <220>
<223> Made in a lab - <400> 315
actccacaga taccccgaag 20 - <210> 316
<211> 19
<212> DNA
<213> Artificial sequence - <220>
<223> Made in a lab - <400> 316
tccaccactt gctgagctg 19 - <210> 317
<211> 20
<212> DNA
<213> Artificial sequence - <220>
<223> Made in a lab - <400> 317
acatttttga ggccaacgac 20 - <210> 318
<211> 20
<212> DNA
<213> Artificial Sequence - <220>
<223> Made in a lab - <400> 318
ctcccacgtt caccttgttt 20 - <210> 319
<211> 19
<212> DNA
<213> Artificial Sequence - <220>
<223> Made in a lab - <400> 319
cctggagcag ccgtatctg 19 - <210> 320
<211> 21
<212> DNA
<213> Artificial sequence - <220>
<223> Made in a lab - <400> 320
gacaaactcc tttcggtcac a 21 - <210> 321
<211> 20
<212> DNA
<213> Artificial sequence - <220>
<223> Made in a lab - <400> 321
cccagtcagt gcacaaagag 20 - <210> 322
<211> 20
<212> DNA
<213> Artificial sequence - <220>
<223> Made in a lab - <400> 322
gcattgtggt caaactgcat 20 - <210> 323
<211> 20
<212> DNA
<213> Artificial Sequence - <220>
<223> Made in a lab - <400> 323
gcaatctgca gagttcgtga 20 - <210> 324
<211> 20
<212> DNA
<213> Artificial sequence - <220>
<223> Made in a lab - <400> 324
gccatcatct gcgactctaa 20 - <210> 325
<211> 21
<212> DNA
<213> Artificial Sequence - <220>
<223> Made in a lab - <400> 325
tggagcagat cctcttcatc t 21 - <210> 326
<211> 19
<212> DNA
<213> Artificial Sequence - <220>
<223> Made in a lab - <400> 326
ccaaggtcag cagcacaat 19
Claims (12)
- A method for detecting the presence of a disorder and/or monitoring the progression of the disorder in a subject, comprising:(a) determining the relative frequency of expression of a plurality of RNA biomarkers simultaneously in a biological sample obtained from the subject, wherein the relative frequency of expression is determined using next generation sequencing of an amplicon cDNA library prepared using a plurality oligonucleotide primers specific for the plurality of RNA biomarkers; and(b) comparing the relative frequency of expression of the plurality of RNA biomarkers in the biological sample with a predetermined threshold value, wherein increased or decreased relative frequency of expression of the plurality of RNA biomarkers in the biological sample relative to the predetermined threshold value indicates the presence of the disorder and/or progression of the disorder in the subject.
- The method of claim 1, wherein the amplicon cDNA library is prepared by:(a) isolating total RNA from the biological sample;(b) generating first strand cDNA from the total RNA using a plurality of first oligonucleotide primers specific for the plurality of RNA biomarkers;(c) synthesizing second strand cDNA to provide double-stranded cDNA;(d) adding at least one sequencing adapter to the double-stranded cDNA; and(e) amplifying the double-stranded cDNA to provide the amplicon cDNA library.
- The method of claim 2, wherein the first oligonucleotide primer is selected from the group consisting of: SEQ ID NO: 76-223 and 293-326.
- The method of claim 2, further comprising amplifying the double-stranded cDNA by polymerase chain reaction using a plurality of oligonucleotide primer pairs specific for the plurality of RNA biomarkers after step (c) and prior to step (d).
- The method of claim 1, wherein the amplicon cDNA library is prepared by:(a) isolating total RNA from the biological sample;(b) preparing first strand cDNA to provide single-stranded cDNA;(c) amplifying the single-stranded cDNA by polymerase chain reaction using a plurality of oligonucleotide primer pairs specific for the plurality of RNA biomarkers to provide amplified double-stranded cDNA;(d) adding at least one sequencing adapter to the amplified double-stranded cDNA; and(e) further amplifying the amplified double-stranded cDNA using primers specific for the at least one sequencing adapter to provide the amplicon cDNA library.
- The method of any one of claims 4 and 5, wherein at least one member of the plurality of oligonucleotide primer pairs is selected from the group consisting of SEQ ID NO: 76-223 and 293-326.
- The method of any one of claims 1-6, wherein the disorder is a cancer.
- The method of any one of claims 1-7, wherein the disorder is prostate cancer and the plurality of RNA biomarkers comprises a RNA sequence corresponding to a DNA sequence selected from the group consisting of: SEQ ID NO: 1-71 and 235-287.
- The method of any one of claims 1-8, wherein the biological sample is selected from the group consisting of: urine, blood, serum, cell lines, PBMCs, biopsy tissue, and prostatectomy tissue.
- The method of any one of claims 1-9, wherein the plurality of RNA biomarkers comprises at least ten RNA biomarkers.
- The method of claim 1, wherein the frequency of expression of the plurality of RNA biomarkers is normalized to at least one expression standard selected from the reporters listed in Table 3.
- The method of any one of claims 1-11, wherein amplicons in the amplicon cDNA library are 60-300 bp in size.
Applications Claiming Priority (4)
| Application Number | Priority Date | Filing Date | Title |
|---|---|---|---|
| US201261665849P | 2012-06-28 | 2012-06-28 | |
| US201261691743P | 2012-08-21 | 2012-08-21 | |
| US201261709517P | 2012-10-04 | 2012-10-04 | |
| PCT/NZ2013/000114 WO2014003580A1 (en) | 2012-06-28 | 2013-06-28 | Targeted rna-seq methods and materials for the diagnosis of prostate cancer |
Publications (3)
| Publication Number | Publication Date |
|---|---|
| EP2867376A1 EP2867376A1 (en) | 2015-05-06 |
| EP2867376A4 EP2867376A4 (en) | 2015-10-28 |
| EP2867376B1 true EP2867376B1 (en) | 2017-09-06 |
Family
ID=49778731
Family Applications (1)
| Application Number | Title | Priority Date | Filing Date |
|---|---|---|---|
| EP13810495.5A Not-in-force EP2867376B1 (en) | 2012-06-28 | 2013-06-28 | Targeted rna-seq methods and materials for the diagnosis of prostate cancer |
Country Status (9)
| Country | Link |
|---|---|
| US (1) | US20140005058A1 (en) |
| EP (1) | EP2867376B1 (en) |
| JP (1) | JP2015522277A (en) |
| CN (1) | CN104781415A (en) |
| AU (1) | AU2013281355B2 (en) |
| CA (1) | CA2877864C (en) |
| NZ (1) | NZ629538A (en) |
| SG (1) | SG11201408434QA (en) |
| WO (1) | WO2014003580A1 (en) |
Families Citing this family (13)
| Publication number | Priority date | Publication date | Assignee | Title |
|---|---|---|---|---|
| US20150252425A1 (en) * | 2014-03-05 | 2015-09-10 | Caldera Health Ltd. | Gene expression profiling for the diagnosis of prostate cancer |
| AU2015338923B2 (en) | 2014-11-02 | 2021-10-21 | Arcturus Therapeutics, Inc. | Messenger UNA molecules and uses thereof |
| CA2969154A1 (en) * | 2014-12-01 | 2016-06-09 | Fraunhofer-Gesellschaft Zur Foerderung Der Angewandten Forschung E.V. | Novel rna-biomarker signature for diagnosis of prostate cancer |
| WO2017144457A1 (en) | 2016-02-25 | 2017-08-31 | F. Hoffmann-La Roche Ag | Elimination of primer-primer interactions during primer extension |
| CN105734159B (en) * | 2016-04-29 | 2019-04-05 | 北京泱深生物信息技术有限公司 | Molecular markers of esophageal squamous cell carcinoma |
| CN108624691A (en) * | 2018-06-22 | 2018-10-09 | 杭州西合精准医疗科技有限公司 | A kind of marker and its application for judging prostatic disorders |
| CN108913763A (en) * | 2018-07-03 | 2018-11-30 | 张罗 | Detect the method and application of SAA2 gene expression amount in nasal cavity cast-off cells |
| CN108913765A (en) * | 2018-07-03 | 2018-11-30 | 张罗 | The application of kit and SAA2 gene as biomarker for detecting chronic nasosinusitis with nasal polyp hypotype |
| WO2020102192A2 (en) * | 2018-11-13 | 2020-05-22 | Idbydna Inc. | Directional targeted sequencing |
| KR102258977B1 (en) * | 2018-11-26 | 2021-06-01 | 국립암센터 | A method for screening a therapeutic agent for cancer using binding inhibitor of Cyclin-dependent kinase 1(CDK1) - Cyclin B1 |
| CN110343761B (en) * | 2019-06-06 | 2023-06-27 | 宽盈医疗科技(上海)有限公司 | Prostate cancer marker panel and its application |
| CN113299340B (en) * | 2021-06-09 | 2023-06-30 | 四川大学华西医院 | Screening method of target test drugs and target test drug screening device |
| US12152280B2 (en) * | 2021-09-20 | 2024-11-26 | Droplet Biosciences, Inc. | Drain fluid for diagnostics |
Family Cites Families (17)
| Publication number | Priority date | Publication date | Assignee | Title |
|---|---|---|---|---|
| AU2003298689A1 (en) * | 2002-11-21 | 2004-06-18 | Wyeth | Methods for diagnosing rcc and other solid tumors |
| CA2432365A1 (en) * | 2003-06-30 | 2004-12-30 | Jack A. Schalken | Specific method of prostate cancer detection based on pca3, and kits therefore |
| WO2005084116A2 (en) * | 2004-01-27 | 2005-09-15 | Compugen Usa, Inc. | Calcium channel variants |
| WO2005084254A2 (en) * | 2004-02-27 | 2005-09-15 | Musc Foundation For Research Development | Enhanced detection of rna using a panel of truncated gene-specific primers for reverse transcription |
| US7566532B1 (en) * | 2004-07-02 | 2009-07-28 | Quest Diagnostics Investments Incorporated | Methods for detecting retroviruses |
| JP5244103B2 (en) * | 2006-08-09 | 2013-07-24 | ホームステッド クリニカル コーポレイション | Organ-specific protein and method of use thereof |
| JP5240945B2 (en) | 2006-11-28 | 2013-07-17 | ピクター リミテッド | Assay membranes and methods of use |
| US20080274458A1 (en) * | 2007-05-01 | 2008-11-06 | Latham Gary J | Nucleic acid quantitation methods |
| DK2414547T3 (en) | 2009-04-02 | 2014-06-16 | Fluidigm Corp | Multiprimer amplification method for bar coding of target nucleic acids |
| WO2010120803A2 (en) * | 2009-04-13 | 2010-10-21 | Somagenics Inc. | Methods and compositions for detection of small rnas |
| US9361426B2 (en) * | 2009-11-12 | 2016-06-07 | Esoterix Genetic Laboratories, Llc | Copy number analysis of genetic locus |
| EP2333104A1 (en) * | 2009-12-11 | 2011-06-15 | Lexogen GmbH | RNA analytics method |
| JP2012000107A (en) * | 2010-05-18 | 2012-01-05 | Takeshi Zama | Diagnosis of tumor by using new small rna as biomarker |
| US20130171649A1 (en) * | 2010-06-07 | 2013-07-04 | Manuel Mayr | Methods and means for predicting or diagnosing diabetes or cardiovascular disorders based on micro rna |
| US20130217585A1 (en) * | 2010-08-25 | 2013-08-22 | The Trustees Of The University Of Columbia In The City Of New York | Quantitative Total Definition of Biologically Active Sequence Elements |
| WO2012040784A1 (en) * | 2010-09-30 | 2012-04-05 | Chipdx Llc | Gene marker sets and methods for classification of cancer patients |
| US20140113297A1 (en) * | 2011-03-26 | 2014-04-24 | Oregon Health & Science University | Gene expression predictors of cancer prognosis |
-
2013
- 2013-06-28 CA CA2877864A patent/CA2877864C/en not_active Expired - Fee Related
- 2013-06-28 SG SG11201408434QA patent/SG11201408434QA/en unknown
- 2013-06-28 EP EP13810495.5A patent/EP2867376B1/en not_active Not-in-force
- 2013-06-28 AU AU2013281355A patent/AU2013281355B2/en not_active Ceased
- 2013-06-28 WO PCT/NZ2013/000114 patent/WO2014003580A1/en not_active Ceased
- 2013-06-28 US US13/930,852 patent/US20140005058A1/en not_active Abandoned
- 2013-06-28 NZ NZ629538A patent/NZ629538A/en not_active IP Right Cessation
- 2013-06-28 JP JP2015520101A patent/JP2015522277A/en active Pending
- 2013-06-28 CN CN201380044811.5A patent/CN104781415A/en active Pending
Non-Patent Citations (1)
| Title |
|---|
| None * |
Also Published As
| Publication number | Publication date |
|---|---|
| WO2014003580A1 (en) | 2014-01-03 |
| EP2867376A1 (en) | 2015-05-06 |
| EP2867376A4 (en) | 2015-10-28 |
| CN104781415A (en) | 2015-07-15 |
| US20140005058A1 (en) | 2014-01-02 |
| SG11201408434QA (en) | 2015-01-29 |
| CA2877864A1 (en) | 2014-01-03 |
| CA2877864C (en) | 2019-05-14 |
| AU2013281355A1 (en) | 2015-01-29 |
| NZ629538A (en) | 2016-10-28 |
| JP2015522277A (en) | 2015-08-06 |
| AU2013281355B2 (en) | 2018-04-05 |
Similar Documents
| Publication | Publication Date | Title |
|---|---|---|
| US20140005058A1 (en) | Methods and materials for the diagnosis of prostate cancers | |
| JP6745820B2 (en) | Prostate Cancer Prognosis Judgment Method | |
| CN106755344B (en) | Molecular marker for pancreatic cancer clinical prognosis diagnosis and application thereof | |
| KR102029775B1 (en) | Biomarkers for diagnosis of Non-muscle invasive bladder cancer and uses thereof | |
| CN101646783A (en) | Novel cancer marker | |
| Lian et al. | Screening of significantly hypermethylated genes in breast cancer using microarray-based methylated-CpG island recovery assay and identification of their expression levels | |
| CN103732759A (en) | Methods and nucleic acids for determining the prognosis of a cancer subject | |
| CN109182521B (en) | Application of circRNA as a marker for papillary thyroid carcinoma | |
| US20160355887A1 (en) | Gene expression profiling for the diagnosis of prostate cancer | |
| JP5769952B2 (en) | Highly sensitive detection method for EML4-ALK fusion gene | |
| WO2010118559A1 (en) | A method for screening cancer | |
| KR20200136640A (en) | Markers for diagnostic or prognosis predictive of squamous cell carcinoma and uses thereof | |
| CN107674916B (en) | Application of circular RNA in colorectal cancer biomarker | |
| CN108949992A (en) | A kind of biomarker relevant to esophageal squamous cell carcinoma and its classification | |
| CN108949969B (en) | Application of long-chain non-coding RNA in colorectal cancer | |
| CN110023510A (en) | MMP1 gene transcript and detection method as ovarian cancer prognosis diagnosis marker | |
| CN110157808A (en) | Application of a non-coding RNA related to the occurrence and development of laryngeal squamous cell carcinoma | |
| CN109022583A (en) | Application of hsa_circ_0021977 in the preparation and diagnosis of breast cancer products | |
| CN106701761A (en) | Long-chain non-coding RNA (Ribonucleic Acid) NR-027469.1 and preparation or diagnostic reagent or medicine or kit and application | |
| KR102108299B1 (en) | MicroRNA Biomarker for Predicting Lymph Node Metastasis of Gastric Cancer | |
| RU2393472C1 (en) | Diagnostic technique for clear cell renal adenocarcinoma and set for implementation thereof | |
| CN106148494A (en) | The application in colorectal cancer biomarker of a kind of circular rna | |
| CN103923984A (en) | Development and application of esophageal squamous carcinoma detection kit | |
| US20160340745A1 (en) | Gene expression profiling for the diagnosis of prostate cancer | |
| RU2390780C1 (en) | Diagnostic technique for non-small cell carcinoma of lung and kit for implementation thereof |
Legal Events
| Date | Code | Title | Description |
|---|---|---|---|
| PUAI | Public reference made under article 153(3) epc to a published international application that has entered the european phase |
Free format text: ORIGINAL CODE: 0009012 |
|
| 17P | Request for examination filed |
Effective date: 20150119 |
|
| AK | Designated contracting states |
Kind code of ref document: A1 Designated state(s): AL AT BE BG CH CY CZ DE DK EE ES FI FR GB GR HR HU IE IS IT LI LT LU LV MC MK MT NL NO PL PT RO RS SE SI SK SM TR |
|
| AX | Request for extension of the european patent |
Extension state: BA ME |
|
| RIN1 | Information on inventor provided before grant (corrected) |
Inventor name: ELTON, CLARE Inventor name: WATSON, JAMES DOUGLAS Inventor name: MUSGRAVE, DAVID REX |
|
| DAX | Request for extension of the european patent (deleted) | ||
| RA4 | Supplementary search report drawn up and despatched (corrected) |
Effective date: 20150928 |
|
| RIC1 | Information provided on ipc code assigned before grant |
Ipc: C12N 15/11 20060101ALI20150922BHEP Ipc: C12Q 1/68 20060101AFI20150922BHEP |
|
| 17Q | First examination report despatched |
Effective date: 20160530 |
|
| GRAP | Despatch of communication of intention to grant a patent |
Free format text: ORIGINAL CODE: EPIDOSNIGR1 |
|
| INTG | Intention to grant announced |
Effective date: 20170322 |
|
| GRAS | Grant fee paid |
Free format text: ORIGINAL CODE: EPIDOSNIGR3 |
|
| GRAA | (expected) grant |
Free format text: ORIGINAL CODE: 0009210 |
|
| AK | Designated contracting states |
Kind code of ref document: B1 Designated state(s): AL AT BE BG CH CY CZ DE DK EE ES FI FR GB GR HR HU IE IS IT LI LT LU LV MC MK MT NL NO PL PT RO RS SE SI SK SM TR |
|
| REG | Reference to a national code |
Ref country code: GB Ref legal event code: FG4D |
|
| REG | Reference to a national code |
Ref country code: CH Ref legal event code: EP Ref country code: AT Ref legal event code: REF Ref document number: 926001 Country of ref document: AT Kind code of ref document: T Effective date: 20170915 |
|
| REG | Reference to a national code |
Ref country code: IE Ref legal event code: FG4D |
|
| REG | Reference to a national code |
Ref country code: DE Ref legal event code: R096 Ref document number: 602013026302 Country of ref document: DE |
|
| REG | Reference to a national code |
Ref country code: NL Ref legal event code: MP Effective date: 20170906 |
|
| REG | Reference to a national code |
Ref country code: LT Ref legal event code: MG4D |
|
| PG25 | Lapsed in a contracting state [announced via postgrant information from national office to epo] |
Ref country code: SE Free format text: LAPSE BECAUSE OF FAILURE TO SUBMIT A TRANSLATION OF THE DESCRIPTION OR TO PAY THE FEE WITHIN THE PRESCRIBED TIME-LIMIT Effective date: 20170906 Ref country code: LT Free format text: LAPSE BECAUSE OF FAILURE TO SUBMIT A TRANSLATION OF THE DESCRIPTION OR TO PAY THE FEE WITHIN THE PRESCRIBED TIME-LIMIT Effective date: 20170906 Ref country code: FI Free format text: LAPSE BECAUSE OF FAILURE TO SUBMIT A TRANSLATION OF THE DESCRIPTION OR TO PAY THE FEE WITHIN THE PRESCRIBED TIME-LIMIT Effective date: 20170906 Ref country code: NO Free format text: LAPSE BECAUSE OF FAILURE TO SUBMIT A TRANSLATION OF THE DESCRIPTION OR TO PAY THE FEE WITHIN THE PRESCRIBED TIME-LIMIT Effective date: 20171206 Ref country code: HR Free format text: LAPSE BECAUSE OF FAILURE TO SUBMIT A TRANSLATION OF THE DESCRIPTION OR TO PAY THE FEE WITHIN THE PRESCRIBED TIME-LIMIT Effective date: 20170906 |
|
| REG | Reference to a national code |
Ref country code: AT Ref legal event code: MK05 Ref document number: 926001 Country of ref document: AT Kind code of ref document: T Effective date: 20170906 |
|
| PG25 | Lapsed in a contracting state [announced via postgrant information from national office to epo] |
Ref country code: GR Free format text: LAPSE BECAUSE OF FAILURE TO SUBMIT A TRANSLATION OF THE DESCRIPTION OR TO PAY THE FEE WITHIN THE PRESCRIBED TIME-LIMIT Effective date: 20171207 Ref country code: RS Free format text: LAPSE BECAUSE OF FAILURE TO SUBMIT A TRANSLATION OF THE DESCRIPTION OR TO PAY THE FEE WITHIN THE PRESCRIBED TIME-LIMIT Effective date: 20170906 Ref country code: BG Free format text: LAPSE BECAUSE OF FAILURE TO SUBMIT A TRANSLATION OF THE DESCRIPTION OR TO PAY THE FEE WITHIN THE PRESCRIBED TIME-LIMIT Effective date: 20171206 Ref country code: ES Free format text: LAPSE BECAUSE OF FAILURE TO SUBMIT A TRANSLATION OF THE DESCRIPTION OR TO PAY THE FEE WITHIN THE PRESCRIBED TIME-LIMIT Effective date: 20170906 Ref country code: LV Free format text: LAPSE BECAUSE OF FAILURE TO SUBMIT A TRANSLATION OF THE DESCRIPTION OR TO PAY THE FEE WITHIN THE PRESCRIBED TIME-LIMIT Effective date: 20170906 |
|
| PG25 | Lapsed in a contracting state [announced via postgrant information from national office to epo] |
Ref country code: NL Free format text: LAPSE BECAUSE OF FAILURE TO SUBMIT A TRANSLATION OF THE DESCRIPTION OR TO PAY THE FEE WITHIN THE PRESCRIBED TIME-LIMIT Effective date: 20170906 |
|
| PG25 | Lapsed in a contracting state [announced via postgrant information from national office to epo] |
Ref country code: RO Free format text: LAPSE BECAUSE OF FAILURE TO SUBMIT A TRANSLATION OF THE DESCRIPTION OR TO PAY THE FEE WITHIN THE PRESCRIBED TIME-LIMIT Effective date: 20170906 Ref country code: PL Free format text: LAPSE BECAUSE OF FAILURE TO SUBMIT A TRANSLATION OF THE DESCRIPTION OR TO PAY THE FEE WITHIN THE PRESCRIBED TIME-LIMIT Effective date: 20170906 Ref country code: CZ Free format text: LAPSE BECAUSE OF FAILURE TO SUBMIT A TRANSLATION OF THE DESCRIPTION OR TO PAY THE FEE WITHIN THE PRESCRIBED TIME-LIMIT Effective date: 20170906 |
|
| PG25 | Lapsed in a contracting state [announced via postgrant information from national office to epo] |
Ref country code: EE Free format text: LAPSE BECAUSE OF FAILURE TO SUBMIT A TRANSLATION OF THE DESCRIPTION OR TO PAY THE FEE WITHIN THE PRESCRIBED TIME-LIMIT Effective date: 20170906 Ref country code: IS Free format text: LAPSE BECAUSE OF FAILURE TO SUBMIT A TRANSLATION OF THE DESCRIPTION OR TO PAY THE FEE WITHIN THE PRESCRIBED TIME-LIMIT Effective date: 20180106 Ref country code: SK Free format text: LAPSE BECAUSE OF FAILURE TO SUBMIT A TRANSLATION OF THE DESCRIPTION OR TO PAY THE FEE WITHIN THE PRESCRIBED TIME-LIMIT Effective date: 20170906 Ref country code: IT Free format text: LAPSE BECAUSE OF FAILURE TO SUBMIT A TRANSLATION OF THE DESCRIPTION OR TO PAY THE FEE WITHIN THE PRESCRIBED TIME-LIMIT Effective date: 20170906 Ref country code: SM Free format text: LAPSE BECAUSE OF FAILURE TO SUBMIT A TRANSLATION OF THE DESCRIPTION OR TO PAY THE FEE WITHIN THE PRESCRIBED TIME-LIMIT Effective date: 20170906 Ref country code: AT Free format text: LAPSE BECAUSE OF FAILURE TO SUBMIT A TRANSLATION OF THE DESCRIPTION OR TO PAY THE FEE WITHIN THE PRESCRIBED TIME-LIMIT Effective date: 20170906 |
|
| REG | Reference to a national code |
Ref country code: DE Ref legal event code: R097 Ref document number: 602013026302 Country of ref document: DE |
|
| REG | Reference to a national code |
Ref country code: FR Ref legal event code: PLFP Year of fee payment: 6 |
|
| PLBE | No opposition filed within time limit |
Free format text: ORIGINAL CODE: 0009261 |
|
| STAA | Information on the status of an ep patent application or granted ep patent |
Free format text: STATUS: NO OPPOSITION FILED WITHIN TIME LIMIT |
|
| PG25 | Lapsed in a contracting state [announced via postgrant information from national office to epo] |
Ref country code: DK Free format text: LAPSE BECAUSE OF FAILURE TO SUBMIT A TRANSLATION OF THE DESCRIPTION OR TO PAY THE FEE WITHIN THE PRESCRIBED TIME-LIMIT Effective date: 20170906 |
|
| 26N | No opposition filed |
Effective date: 20180607 |
|
| PG25 | Lapsed in a contracting state [announced via postgrant information from national office to epo] |
Ref country code: SI Free format text: LAPSE BECAUSE OF FAILURE TO SUBMIT A TRANSLATION OF THE DESCRIPTION OR TO PAY THE FEE WITHIN THE PRESCRIBED TIME-LIMIT Effective date: 20170906 |
|
| REG | Reference to a national code |
Ref country code: CH Ref legal event code: PL |
|
| REG | Reference to a national code |
Ref country code: BE Ref legal event code: MM Effective date: 20180630 |
|
| PG25 | Lapsed in a contracting state [announced via postgrant information from national office to epo] |
Ref country code: LU Free format text: LAPSE BECAUSE OF NON-PAYMENT OF DUE FEES Effective date: 20180628 Ref country code: MC Free format text: LAPSE BECAUSE OF FAILURE TO SUBMIT A TRANSLATION OF THE DESCRIPTION OR TO PAY THE FEE WITHIN THE PRESCRIBED TIME-LIMIT Effective date: 20170906 |
|
| REG | Reference to a national code |
Ref country code: IE Ref legal event code: MM4A |
|
| PG25 | Lapsed in a contracting state [announced via postgrant information from national office to epo] |
Ref country code: IE Free format text: LAPSE BECAUSE OF NON-PAYMENT OF DUE FEES Effective date: 20180628 Ref country code: CH Free format text: LAPSE BECAUSE OF NON-PAYMENT OF DUE FEES Effective date: 20180630 Ref country code: LI Free format text: LAPSE BECAUSE OF NON-PAYMENT OF DUE FEES Effective date: 20180630 |
|
| PG25 | Lapsed in a contracting state [announced via postgrant information from national office to epo] |
Ref country code: BE Free format text: LAPSE BECAUSE OF NON-PAYMENT OF DUE FEES Effective date: 20180630 |
|
| PGFP | Annual fee paid to national office [announced via postgrant information from national office to epo] |
Ref country code: FR Payment date: 20190625 Year of fee payment: 7 |
|
| PGFP | Annual fee paid to national office [announced via postgrant information from national office to epo] |
Ref country code: GB Payment date: 20190627 Year of fee payment: 7 Ref country code: DE Payment date: 20190627 Year of fee payment: 7 |
|
| PG25 | Lapsed in a contracting state [announced via postgrant information from national office to epo] |
Ref country code: MT Free format text: LAPSE BECAUSE OF NON-PAYMENT OF DUE FEES Effective date: 20180628 |
|
| PG25 | Lapsed in a contracting state [announced via postgrant information from national office to epo] |
Ref country code: TR Free format text: LAPSE BECAUSE OF FAILURE TO SUBMIT A TRANSLATION OF THE DESCRIPTION OR TO PAY THE FEE WITHIN THE PRESCRIBED TIME-LIMIT Effective date: 20170906 |
|
| PG25 | Lapsed in a contracting state [announced via postgrant information from national office to epo] |
Ref country code: PT Free format text: LAPSE BECAUSE OF FAILURE TO SUBMIT A TRANSLATION OF THE DESCRIPTION OR TO PAY THE FEE WITHIN THE PRESCRIBED TIME-LIMIT Effective date: 20170906 |
|
| PG25 | Lapsed in a contracting state [announced via postgrant information from national office to epo] |
Ref country code: CY Free format text: LAPSE BECAUSE OF FAILURE TO SUBMIT A TRANSLATION OF THE DESCRIPTION OR TO PAY THE FEE WITHIN THE PRESCRIBED TIME-LIMIT Effective date: 20170906 Ref country code: HU Free format text: LAPSE BECAUSE OF FAILURE TO SUBMIT A TRANSLATION OF THE DESCRIPTION OR TO PAY THE FEE WITHIN THE PRESCRIBED TIME-LIMIT; INVALID AB INITIO Effective date: 20130628 Ref country code: MK Free format text: LAPSE BECAUSE OF NON-PAYMENT OF DUE FEES Effective date: 20170906 |
|
| PG25 | Lapsed in a contracting state [announced via postgrant information from national office to epo] |
Ref country code: AL Free format text: LAPSE BECAUSE OF FAILURE TO SUBMIT A TRANSLATION OF THE DESCRIPTION OR TO PAY THE FEE WITHIN THE PRESCRIBED TIME-LIMIT Effective date: 20170906 |
|
| REG | Reference to a national code |
Ref country code: DE Ref legal event code: R119 Ref document number: 602013026302 Country of ref document: DE |
|
| GBPC | Gb: european patent ceased through non-payment of renewal fee |
Effective date: 20200628 |
|
| PG25 | Lapsed in a contracting state [announced via postgrant information from national office to epo] |
Ref country code: FR Free format text: LAPSE BECAUSE OF NON-PAYMENT OF DUE FEES Effective date: 20200630 Ref country code: GB Free format text: LAPSE BECAUSE OF NON-PAYMENT OF DUE FEES Effective date: 20200628 |
|
| PG25 | Lapsed in a contracting state [announced via postgrant information from national office to epo] |
Ref country code: DE Free format text: LAPSE BECAUSE OF NON-PAYMENT OF DUE FEES Effective date: 20210101 |