EP2851002A1 - Device for automatic mapping of complex fractionated atrial electrogram - Google Patents
Device for automatic mapping of complex fractionated atrial electrogram Download PDFInfo
- Publication number
- EP2851002A1 EP2851002A1 EP14183365.7A EP14183365A EP2851002A1 EP 2851002 A1 EP2851002 A1 EP 2851002A1 EP 14183365 A EP14183365 A EP 14183365A EP 2851002 A1 EP2851002 A1 EP 2851002A1
- Authority
- EP
- European Patent Office
- Prior art keywords
- deflection
- signal
- electrogram
- deflections
- evaluation unit
- Prior art date
- Legal status (The legal status is an assumption and is not a legal conclusion. Google has not performed a legal analysis and makes no representation as to the accuracy of the status listed.)
- Withdrawn
Links
Images



Classifications
-
- A—HUMAN NECESSITIES
- A61—MEDICAL OR VETERINARY SCIENCE; HYGIENE
- A61B—DIAGNOSIS; SURGERY; IDENTIFICATION
- A61B5/00—Measuring for diagnostic purposes; Identification of persons
- A61B5/24—Detecting, measuring or recording bioelectric or biomagnetic signals of the body or parts thereof
- A61B5/316—Modalities, i.e. specific diagnostic methods
- A61B5/318—Heart-related electrical modalities, e.g. electrocardiography [ECG]
- A61B5/339—Displays specially adapted therefor
- A61B5/341—Vectorcardiography [VCG]
-
- A—HUMAN NECESSITIES
- A61—MEDICAL OR VETERINARY SCIENCE; HYGIENE
- A61B—DIAGNOSIS; SURGERY; IDENTIFICATION
- A61B18/00—Surgical instruments, devices or methods for transferring non-mechanical forms of energy to or from the body
- A61B18/04—Surgical instruments, devices or methods for transferring non-mechanical forms of energy to or from the body by heating
- A61B18/12—Surgical instruments, devices or methods for transferring non-mechanical forms of energy to or from the body by heating by passing a current through the tissue to be heated, e.g. high-frequency current
- A61B18/14—Probes or electrodes therefor
- A61B18/1492—Probes or electrodes therefor having a flexible, catheter-like structure, e.g. for heart ablation
-
- A—HUMAN NECESSITIES
- A61—MEDICAL OR VETERINARY SCIENCE; HYGIENE
- A61B—DIAGNOSIS; SURGERY; IDENTIFICATION
- A61B34/00—Computer-aided surgery; Manipulators or robots specially adapted for use in surgery
- A61B34/20—Surgical navigation systems; Devices for tracking or guiding surgical instruments, e.g. for frameless stereotaxis
-
- A—HUMAN NECESSITIES
- A61—MEDICAL OR VETERINARY SCIENCE; HYGIENE
- A61B—DIAGNOSIS; SURGERY; IDENTIFICATION
- A61B5/00—Measuring for diagnostic purposes; Identification of persons
- A61B5/24—Detecting, measuring or recording bioelectric or biomagnetic signals of the body or parts thereof
- A61B5/25—Bioelectric electrodes therefor
- A61B5/279—Bioelectric electrodes therefor specially adapted for particular uses
- A61B5/28—Bioelectric electrodes therefor specially adapted for particular uses for electrocardiography [ECG]
- A61B5/283—Invasive
-
- A—HUMAN NECESSITIES
- A61—MEDICAL OR VETERINARY SCIENCE; HYGIENE
- A61B—DIAGNOSIS; SURGERY; IDENTIFICATION
- A61B5/00—Measuring for diagnostic purposes; Identification of persons
- A61B5/24—Detecting, measuring or recording bioelectric or biomagnetic signals of the body or parts thereof
- A61B5/316—Modalities, i.e. specific diagnostic methods
- A61B5/318—Heart-related electrical modalities, e.g. electrocardiography [ECG]
- A61B5/346—Analysis of electrocardiograms
- A61B5/349—Detecting specific parameters of the electrocardiograph cycle
-
- A—HUMAN NECESSITIES
- A61—MEDICAL OR VETERINARY SCIENCE; HYGIENE
- A61B—DIAGNOSIS; SURGERY; IDENTIFICATION
- A61B5/00—Measuring for diagnostic purposes; Identification of persons
- A61B5/24—Detecting, measuring or recording bioelectric or biomagnetic signals of the body or parts thereof
- A61B5/316—Modalities, i.e. specific diagnostic methods
- A61B5/318—Heart-related electrical modalities, e.g. electrocardiography [ECG]
- A61B5/367—Electrophysiological study [EPS], e.g. electrical activation mapping or electro-anatomical mapping
-
- A—HUMAN NECESSITIES
- A61—MEDICAL OR VETERINARY SCIENCE; HYGIENE
- A61B—DIAGNOSIS; SURGERY; IDENTIFICATION
- A61B18/00—Surgical instruments, devices or methods for transferring non-mechanical forms of energy to or from the body
- A61B2018/00571—Surgical instruments, devices or methods for transferring non-mechanical forms of energy to or from the body for achieving a particular surgical effect
- A61B2018/00577—Ablation
-
- A—HUMAN NECESSITIES
- A61—MEDICAL OR VETERINARY SCIENCE; HYGIENE
- A61B—DIAGNOSIS; SURGERY; IDENTIFICATION
- A61B18/00—Surgical instruments, devices or methods for transferring non-mechanical forms of energy to or from the body
- A61B2018/00636—Sensing and controlling the application of energy
- A61B2018/00773—Sensed parameters
- A61B2018/00839—Bioelectrical parameters, e.g. ECG, EEG
-
- A—HUMAN NECESSITIES
- A61—MEDICAL OR VETERINARY SCIENCE; HYGIENE
- A61B—DIAGNOSIS; SURGERY; IDENTIFICATION
- A61B18/00—Surgical instruments, devices or methods for transferring non-mechanical forms of energy to or from the body
- A61B2018/00636—Sensing and controlling the application of energy
- A61B2018/00904—Automatic detection of target tissue
-
- A—HUMAN NECESSITIES
- A61—MEDICAL OR VETERINARY SCIENCE; HYGIENE
- A61B—DIAGNOSIS; SURGERY; IDENTIFICATION
- A61B5/00—Measuring for diagnostic purposes; Identification of persons
- A61B5/24—Detecting, measuring or recording bioelectric or biomagnetic signals of the body or parts thereof
- A61B5/316—Modalities, i.e. specific diagnostic methods
- A61B5/318—Heart-related electrical modalities, e.g. electrocardiography [ECG]
- A61B5/346—Analysis of electrocardiograms
- A61B5/349—Detecting specific parameters of the electrocardiograph cycle
- A61B5/361—Detecting fibrillation
Definitions
- the invention relates to a device for monitoring and evaluating electrogram signals that represent electric activities of a heart chamber or intracardiac electrograms, in particular atrial intracardiac electrograms.
- Intracardiac electrograms can be picked up by electrode leads or catheters that comprise one or more electrode poles for picking-up electric potentials originating from the myocardium of a respective heart chamber (atrium or ventricle).
- Myocardial cells depolarize and contract in response to natural or artificial stimulation.
- depolarization of the muscle cells of the myocardium occurs nearly simultaneously leading to a contraction of the respective heart chamber.
- the change of electric potentials that co-occur with the depolarization and repolarization can be picked-up and form time-varying electrograms.
- a muscle cell is unsusceptible for another stimulation. The time period is called refractory period of the muscle cell.
- a means to prevent such disorganized electric conduction and depolarization is known as ablation whereby local lesions of the myocardial tissue are induced in order to interrupt electric conduction of stimuli at the sites of respective lesions.
- ablation whereby local lesions of the myocardial tissue are induced in order to interrupt electric conduction of stimuli at the sites of respective lesions.
- monitoring of the electric potentials in a heart chamber, aka mapping is carried out.
- CFAE Complex fractionated atrial electrograms
- CFAE CFAE-guided AF ablation in humans.
- the CFAE is defined in two ways.
- One definition of CFAE is - " fractionated electrograms composed of two deflections or more, and / or perturbation of the baseline with continuous deflection of a prolonged activation complex over a 10-s recording period.
- Another definition is - “atrial electrograms with a very short cycle length ( ⁇ 120 ms) averaged over a 10-s recording period.
- CFAE is defined as the mean of time intervals between the marked deflections being less than 120 ms.
- Another method counts ICL which is the number of intervals (usually of 50-120 ms) between tagged intrinsic local activations within a sampling period, and AIPI which refers to the average of all intervals between 2 successive tagged deflections of >50 ms.
- ICL is the number of intervals (usually of 50-120 ms) between tagged intrinsic local activations within a sampling period
- AIPI refers to the average of all intervals between 2 successive tagged deflections of >50 ms.
- CFAE is defined by ICL ⁇ 5 and AIPI ⁇ 100 ms.
- a third definition of CFAE is the presence of 2 or more successive tagged deflections with interval ⁇ 50 ms and expressed as number of deflections or percentage of continuous activity. Yet a fourth definition of CFAE is that the electrograms show atrial complexes of >50 ms with more than 3 deviations from baseline.
- the CFAE is also defined based on dominant frequency (DF) analysis.
- DF dominant frequency
- the principle is to transform the signal from the time domain to the frequency domain. Subsequently, the highest peak in the spectrum is identified as the DF. The location with the highest DF value is subject to ablation. Grzeda et al. (Heart Rhythm 2009; 6:1475-82 ) shows that the DF method seems more robust than the time-domain method in identifying the CFAE sites.
- Ciaccio et al. (Circ Arrhythm Electrophysiol. 2011; 4:470-7 ) extends the analysis of CFAE by focusing on the spatial and temporal repeatability of CFAE patterns. Ciaccio et al. combines two independent methods, linear prediction and Fourier reconstruction, to quantify the repeatability of CFAE. Ciaccio et al. finds the degree of repeatability is site-specific and different in paroxysmal compared with longstanding AF.
- Ng et al. J Cardiovasc Electrophysiol. 2010; 21:649-55 ) evaluates Shannon's entropy (ShEn) and the Kolmogorov-Smirnov (K-S) test as statistical methods to quantify complexity of AF electrograms, and compares these measures with fractional intervals in distinguishing CFAE from non-CFAE signals.
- ShEn Shannon's entropy
- K-S Kolmogorov-Smirnov
- Lin et al. (Circ Arrhythm Electrophysiol. 2012; 5:949-56 ) applies histogram analysis for substrate mapping in patients with persistent AF. Instead of relying on the mean fractionation interval (FI), Lin et al. focuses on evaluating the kurtosis and skewness of the FI histogram in order to characterize the temporal variation of the FI.
- FI mean fractionation interval
- WO 2012/021022 A1 presents a simulated arrhythmia catheter ablation system comprising a modeling unit, a pattern-producing unit, a mapping unit, an analysis unit, and a surgical unit.
- the modeling unit reproduces an atrial model by using heart image data.
- the pattern-producing unit produces an arrhythmia electrical-wave pattern on the atrial model.
- the mapping unit produces an atrial-site-specific electrical-signal map on the atrial model on which the arrhythmias electrical-wave pattern has been produced.
- the analysis unit discerns a core site of an electrical-wave vortex by using the atrial-site-specific electrical-signal map.
- the surgical unit carries out simulated catheter ablation at the core site of the electrical-wave vortex as discerned in the analysis unit.
- US 7,904,143 B2 shows methods and a medical apparatus for identifying CFAE locations.
- the method locates an arrhythmogenic focus in a heart of a living subject by obtaining training electrical signal data from respective training locations of a training set of hearts, which are automatically analyzed to identify training complex fractionated electrograms (CFAEs) therein.
- a plurality of observers determines the medical significance of the CFAEs, which is recorded and a first estimation is generated at the respective training locations by fitting a mixed regression model to the training CFAEs and the determinations of medical significance.
- patient electrical signal data from respective locations of a patient heart are obtained and automatically analyzed to identify CFAEs.
- the mixed regression model is applied on the CFAEs to obtain second estimations of medical significance and an indication that one or more of the respective locations of the patient heart are medically significant are displayed.
- US 8,315,696 B2 shows a method and a mapping apparatus for mapping complex fractionated electrograms by a probe at respective locations in a chamber of a heart of a subject.
- the mapping apparatus comprises a probe and a processor.
- the probe is configured to sense electrical activity in a chamber of a heart of a subject.
- the processor is configured to receive and process electrical inputs from the probe at multiple locations in the chamber.
- the processor identifies complex fractionated electrograms and measures at each location a respective contact quality between the probe and tissue in the chamber.
- the processor creates a map of the CFAE in the chamber using the electrical inputs and measured contact quality to distinguish between active and passive CFAEs.
- the apparatus can comprise an energy generator for ablation of sites at which CFAE were detected while contact quality satisfied a predetermined contact criterion.
- CFAE defined by different algorithms may represent different aspects of the underlying pathophysiology of atrial fibrillation (AF). For example, it has been shown that there is poor anatomic overlap between CFAE defined by multi-component/continuous electrograms (EGMs) and CFAE defined by AF cycle length ⁇ 120 ms ( Lee et al., Heart Rhythm 2011; 8:1714-9 ).
- EMMs multi-component/continuous electrograms
- the object of the invention is to produce an improved device for monitoring and evaluating electrogram signals representing electric activities of a heart chamber.
- the device comprises a signal input that is connected or can be connected to a mapping catheter and a signal processing and evaluation unit for processing and evaluating electrogram signals received by the signal input.
- the mapping catheter comprises at least one electrode pole for picking up electric potentials and generating electrogram signals from the picked up electric potentials.
- the signal processing and evaluation unit is configured to perform a number of steps when an electrogram signal is received by the signal input.
- the steps include identifying waveform deflections in the electrogram signal, measuring deflection intervals between each pair of consecutive deflection complexes in the electrogram signal, measuring at least one metric that characterizes a morphology of a deflection complex in the electrogram signal, generating a multi-dimensional deflection vector of at least two dimensions for each identified deflection, with at least one element being the deflection interval, determining a distance between each pair of consecutive deflections from the multi-dimensional deflection vectors, and determining a cumulative distance between deflections in a time window of predetermined length.
- the distance can for example be a weighted city block distance, a weighted Euclidean distance, or the like, wherein the distance between each pair of consecutive deflections is a distance between two multi-dimensional deflection vectors associated with two consecutive deflections.
- the degree of complex fractionated atrial electrogram (CFAE) for a segment of an atrial electrogram (EGM) signal is calculated based on the cumulative distance between deflections within the segment.
- One aspect of the invention is that it provides a novel means to quantify the degree of CFAE based on multi-dimensional assessment of the regularity of the EGM deflections, which yields an improved measure for detection of CFAE.
- This invention is advantageous in that it comprises not only temporal domain analysis of the fractionation intervals, but also an analysis of the fractionated wave amplitude and/or other metrics that characterize the fractionated morphology of the deflection complexes in the electrogram signals.
- the degree of CFAE at each site can be measured in real time through a novel distance measure which assesses the regularity of deflection waves in a multi-dimensional space. By mapping the degree of CFAE, targeted atrial fibrillation ablation can be applied for more effective therapy.
- the device is configured to convert quasi non-discrete sampled values of preselected dimensions of the multi-dimensional deflection vector to discrete values.
- the quasi non-discrete sampled values are the sample values obtained from a measurement device, e.g., the mapping catheter.
- the discrete values have a much lower resolution than the quasi non-discrete sampled values and can for example be obtained by coarse-graining of the quasi non-discrete sampled values or the like.
- the device can be configured to determine a distance between each pair of consecutive deflections based on the converted discrete values of the multi-dimensional deflection vector.
- the signal processing and evaluation unit is configured to limit the converted discrete values of the multi-dimensional deflection vector to a predefined range with predetermined upper and lower interval thresholds.
- the signal processing and evaluation unit is configured to bin converted discrete values according to a predefined bin width.
- the deflection interval can be limited to a range between 20 ms and 140 ms and a bin width can be set to 10 ms resulting in 14 bins.
- Similar limiting and coarse-graining operations can be performed for quasi non-discrete parameters, such as for example metrics extracted from a frequency domain or a complexity measure.
- the signal processing and evaluation unit can be configured to process position signals, which represent electrode poles location coordinates.
- the signal processing and evaluation unit can also be configured to process electrogram signals and position signals.
- each position signal is associated to at least one corresponding electrogram signal of the corresponding electrode pole.
- the signal processing and evaluation unit can be configured to associate a location coordinate represented by the position signal to the determined distance between each pair of consecutive deflections.
- the signal processing and evaluation unit can also include a module that is configured to perform the processing and evaluation of the position signals.
- the device can be operatively connected to or comprise a display unit.
- the display unit can be configured to display a distribution of determined cumulative distances between deflections at different electrode pole locations in a reconstructed anatomical model of a heart chamber.
- the display unit can also be configured to display scatter plots of deflection vectors associated with a plural of deflection complexes within a time window of an electrogram signal.
- the display unit can further be configured to display other data received from the device.
- the device comprises or is operatively connected to an ablation unit.
- the ablation unit is preferably configured for targeting the electrode poles location coordinates or probing sites with the highest determined cumulative distance between deflections for ablation.
- the ablation unit can also be configured to target sites in dependence of other parameters.
- the signal processing and evaluation unit is configured to perform the identification of waveform deflections through an adaptive threshold method.
- a deflection complex is detected in the adaptive threshold method when the amplitude of the electrogram signal crosses a threshold value which is adaptive to a previously detected deflection peak amplitude.
- one metric that characterizes the morphology of a deflection complex in the electrogram signal measured by the signal processing and evaluation unit is a peak-to-peak amplitude.
- the metric can also be the number of zero crossings within the deflection complex, the number of local peaks in the deflection complex, where a local peak is found if the slope of the signal changes from positive to negative, or from negative to positive, the absolute area under the deflection complex, the width of the deflection complex, the ratio of the positive peak amplitude to the negative peak amplitude of the deflection complex or the like.
- the morphology of the deflection complex can be characterized by a metric extracted by some basis of a vector space, such as from the frequency domain, leading to metrics such as a dominant frequency, a bandwidth of the frequency spectrum, and a ratio between dominant frequency to the bandwidth of the frequency spectrum or the like.
- the morphology of the deflection complex can be characterized by metrics that measure the complexity of the deflection complex, such as Shannon's entropy, approximate entropy, or the like.
- each deflection complex is associated with one or more measured metrics that characterize the morphological feature of the deflection complex.
- the distance between each pair of consecutive deflections is calculated by means of a weighted city block distance.
- the weight factors are preferably positive integers.
- the coordinate values along the i-th dimension are preferably discrete.
- the distance between each pair of consecutive deflections is calculated by another distance measure, for example weighted Euclidean distance or the like.
- the window length of an electrogram signal segment can be predefined or user programmable.
- the window length is preferably larger than 1 s, preferably between 3 s and 10 s.
- the signal processing and evaluation unit is configured to continually evaluate electrogram signals received by the signal input over a moving window of the electrogram signal, so that the degree of CFAE in that channel can be measured and displayed in real time.
- the device can be used to determine sites in a heart chamber which show complex fractionated atrial electrograms.
- the device is connected to or comprises an ablation unit, which is configured to ablate sites in a heart chamber which show complex fractionated atrial electrograms.
- the signal processing and evaluation unit comprises a deflection detection unit, a parameter measurement unit, and a parameter evaluation unit.
- the deflection detection unit can be configured for identifying waveform deflections in the electrogram signal.
- the parameter measurement unit can be configured for measuring deflection intervals between each pair of consecutive deflection complexes in the electrogram signal and measuring at least one metric that characterizes the morphology of a deflection complex in the electrogram signal.
- the parameter evaluation unit can be configured for a number of tasks or steps including, generating a multi-dimensional deflection vector of at least two dimensions for each identified deflection, wherein at least one element is the deflection interval, limiting and coarse-graining preselected dimensions of coordinate values, determining a distance between each pair of consecutive deflections from the multi-dimensional deflection vectors, and determining a cumulative distance between deflections in a time window of predetermined length.
- the signal processing and evaluation unit can also comprise a module for each task or step performed by the deflection detection unit, the parameter measurement unit, and the parameter evaluation unit of the signal processing and evaluation unit. Alternatively some of the steps can also be performed by an alternative unit of modules of the signal processing and evaluation unit.
- a preferred method to operate a device or monitor electrical activities in a heart chamber comprises the following steps: receiving an electrogram signal, identifying waveform deflections in the electrogram signal, measuring deflection intervals between each pair of consecutive deflection complexes in the electrogram signal, measuring at least one metric that characterizes the morphology of a deflection complex in the electrogram signal, generating a multi-dimensional deflection vector of at least two dimensions for each identified deflection, wherein at least one element is the deflection interval, limiting and coarse-graining preselected dimensions of coordinate values, determining a distance between each pair of consecutive deflections from the multi-dimensional deflection vectors, and determining a cumulative distance between deflections in a time window of predetermined length.
- the step of limiting and coarse-graining preselected dimensions of coordinate values is omitted.
- the method can also comprise a step of receiving a position signal.
- the position signal represents an electrode pole location.
- the method comprises a step of associating the electrode pole location represented by the position signal to an electrogram signal.
- the method comprises a step of associating the electrode pole location represented by the position signal to the determined distance between each pair of consecutive deflections or the cumulative distance.
- a method for a mapping catheter which probes different sites of a heart chamber to obtain each site's location coordinate, and quantify the degree of CFAE at each probed atrial site.
- a map of the CFAE in the atrial chamber can thus be created and the sites with the highest degree of CFAE are targeted for ablation.
- the method to quantify the degree of CFAE is preferably based on not only temporal domain analysis of the fractionation intervals, but also the analysis of the fractionated wave amplitude and/or other metrics that characterize the fractionated morphology of the deflection complexes in the electrogram signals. Scatter plots can be created to visualize the temporal-amplitude distribution of the fractionated waves, and distance measures can be calculated to quantify the degree of CFAE. Other metrics of the fractionated electrogram can also be measured and incorporated to quantify the CFAE in a multi-dimensional space. Most preferably the CFAE is quantified based on at least two independent dimensions of atrial electrogram signal.
- Fig. 1 shows a block diagram of a device 10, which is operatively connected to a mapping catheter 12, a display unit 14 and an ablation unit 16.
- the mapping catheter 12 is equipped with a plurality of electrode poles 18 which can sense electrical activities at different sites of a heart chamber.
- the mapping catheter 12 is also equipped with position sensors 20 that can obtain each probing site's and electrode poles location coordinate. Electrogram signals and position signals acquired by the mapping catheter 12 are transmitted to a signal input 22 of the device 10.
- the signals received by the signal input 22 are processed in a signal processing and evaluation unit 24.
- the signal processing and evaluation unit 24 comprises modules 26, 28, 30, 32, 34, 36 and 38, which can be grouped in or included in a deflection detection unit 26' for detecting waveform deflections in the electrogram signal, a parameter measurement unit 29 for measuring parameters in the electrogram signal, and a parameter evaluation unit 33 for evaluating the parameters measured in the parameter measurement unit 29.
- Waveform deflection identification module 26 is adapted to identify waveform deflections in electrogram signals.
- the deflection detection unit 26' can be adapted to perform the tasks of the module 26.
- Deflection interval measurement module 28 is adapted for measuring deflection intervals between each pair of consecutive deflection complexes in the electrogram signal.
- Metric measurement module 30 is adapted for measuring metrics that characterize morphologies of deflection complexes in the electrogram signal.
- the parameter measurement unit 29 can be adapted to perform the tasks of the modules 28 and 30.
- Deflection vector generation module 32 is adapted for generating multi-dimensional deflection vectors of at least two dimensions for each identified deflection, wherein at least one element is the deflection interval.
- Coarse-graining module 34 is adapted for limiting and coarse-graining preselected dimensions of coordinate values e.g. by forming discrete values from respective sampled and thus quasi non-discrete measured values.
- Distance determination module 36 is adapted for determining a distance between the multi-dimensional deflection vectors that represent each pair of consecutive deflections.
- Cumulative distance determination module 38 is adapted for determining a cumulative distance between deflections in a time window of predetermined length.
- the parameter evaluation unit 33 can be adapted to perform some or all of the tasks of modules 32, 34, 36 and 38.
- the cumulative distance determined in module 38 can be used to quantify the complex fractionated atrial electrogram (CFAE) on different probing sites.
- the CFAE data can be transmitted to the display unit 14, which is adapted to display the distribution of calculated CFAE at different atrial sites in a reconstructed anatomical model of the atrial chamber. Further the CFAE data can be transmitted to the ablation unit 16, which is adapted for targeting the sites or electrode pole locations with the highest degree of CFAE, respectively cumulative distance between deflections, for ablation.
- the device 10 can also comprise the mapping catheter 12, the display unit 14 and/or the ablation unit 16. It is also possible, that the mapping catheter 12 is equipped with only one electrode pole 18 and one or more position sensors 20. If the mapping catheter 12 is equipped with only one electrode pole 18 the mapping has to be performed by variation of the position of the mapping catheter 12.
- the position signal can be processed and evaluated in the signal processing and evaluation unit 24 or in a module of the signal processing and evaluation unit 24.
- the signal processing and evaluation unit 24 can be adapted to associate each position signal to at least one corresponding electrogram signal and/or to associate a location coordinate represented by the position signal to the determined distance between each pair of consecutive deflections.
- the method to quantify the degree of CFAE is based on multi-dimensional analysis of the atrial electrogram.
- the details of the method to quantify the degree of CFAE, respectively the details to determine the cumulative distance, are described below.
- FIG. 2 is a flowchart that shows the steps of quantifying CFAE with the device components/modules in which the steps are performed.
- the system acquires the local atrial electrogram (EGM) from the electrodes poles 18 that are close to the probing site, which include the EGM in an electrogram signal and transmit it to the signal input 22 of the device 10.
- the waveform deflections in the acquired atrial electrogram signal are then identified in module 26, for example by a peak detection algorithm, preferably through a depolarization detection algorithm.
- the depolarization detection algorithm can be implemented through an adaptive threshold method, in which a deflection complex is detected when the EGM amplitude crosses a threshold value which is adaptive to the previously detected deflection peak amplitude.
- a predefined refractory window can be applied to prevent the algorithm from detecting another threshold crossing that is too close to the previously detected deflection complex.
- the deflection intervals between each pair of consecutive deflection complexes are measured in module 28.
- Each deflection is associated with one deflection interval.
- the deflection interval associated with a deflection complex can be the interval immediately preceding the deflection complex or the interval immediately after the deflection complex.
- the metrics that characterize the morphology of the deflection complex are measured in module 30.
- One exemplary metric is the peak-to-peak amplitude of the deflection complex.
- Another exemplary metric is the number of zero crossings within the deflection complex.
- Yet another metric is the number of local peaks in the deflection complex, where a local peak is found if the slope of the signal changes from positive to negative, or from negative to positive.
- Other metrics that characterize the shape of the deflection complex include, but are not limited to, the absolute area under the deflection complex, the width of the deflection complex, the ratio of the positive peak amplitude to the negative peak amplitude of the deflection complex, or the like.
- the morphology of the deflection complex can also be characterized by the metrics extracted by some basis, such as from the frequency domain. For example, a frequency spectrum of the deflection complex can be calculated, from which metrics such as a dominant frequency, a bandwidth of the spectrum, and a ratio between dominant frequency to a bandwidth of the spectrum, or the like can be obtained. Yet the morphology of the deflection complex can further be characterized by metrics that measure the complexity of the deflection complex, such as Shannon's entropy, approximate entropy, or the like. Therefore, each deflection complex is associated with one or more measured metrics that characterize the morphological feature of the deflection complex.
- a multi-dimensional deflection vector is generated in module 32.
- At least one element of the deflection vector is the deflection interval associated with a deflection complex.
- Other elements of the deflection vector comprise the measured metrics that characterize the morphology of the deflection complex as described above.
- the deflection complex k can be associated with a constructed two-dimensional deflection vector (L k , A k ), where L k is the deflection interval associated with the deflection complex k, and A k is peak-peak amplitude of the deflection complex k.
- the deflection complex k can be associated with a constructed three-dimensional deflection vector (L k , A k , X k ) where L k is the deflection interval associated with the deflection complex k, A k is peak-peak amplitude of the deflection complex k, and X k is number of zero-crossings within the deflection complex k.
- the deflection complex k can be associated with a constructed four-dimensional deflection vector (L k , A k , X k , P k ) where L k is the deflection interval associated with the deflection complex k, A k is peak-peak amplitude of the deflection complex k, X k is number of zero-crossings within the deflection complex k, and P k is number of local peaks within the deflection complex k.
- the dimension of the deflection vector can vary depending on the number of metrics measured from the deflection complexes, but is always greater than 1.
- the deflection intervals are limited to predefined range with predetermined upper and lower interval thresholds, and are binned according to predefined bin width.
- the deflection interval can be limited to the range between 20-140 ms, and the bin width can be set to 10 ms.
- each deflection interval (DI) can be assigned to one of the following 14 discrete bins: DI ⁇ 20 ms, 20 ⁇ DI ⁇ 30 ms, 30 ⁇ DI ⁇ 40 ms, ..., 130 ⁇ DI ⁇ 140 ms, DI>140 ms.
- the deflection interval can be replaced with the corresponding bin index ranging from 1 to 14.
- peak-peak amplitude PA
- the amplitude value can also be limited to a range, e.g., 0.1-1.0 mV.
- the bin width is set to 0.1 mV
- the peak-peak amplitude can be binned to one of 11 discrete bins: PA ⁇ 0.1 mV, 0.1 ⁇ PA ⁇ 0.2 mV, 0.2 ⁇ PA ⁇ 0.3 mV, ..., 0.9 ⁇ A ⁇ 1.0 mV, PA>1.0 mV.
- the peak-peak amplitude can be replaced with the corresponding bin index ranging from 1 to 11.
- limit values such as those based on error minimization
- bin widths whose edges are based on a log scale for example
- similar limiting and coarse-graining operations can be performed.
- the distance between each pair of consecutive deflections is determined in module 36.
- the distance between each pair of consecutive deflections is calculated by means of a weighted city block distance.
- the weight factors are preferably positive integers. If all weight factors are set to 1, then the coordinate differences in all dimensions are treated equally. On the other hand, if the weight factors are set to different values, then they apply different weights to different dimensional measures. For example, if the weight factor for the deflection interval is set to 2, whereas the weight factor for the peak-peak amplitude is set to 1, then the impact of difference in deflection interval is twice as that of difference in peak-peak amplitude.
- weighted city block distance is used in this example, it should be understood that other distance measures, such as weighted Euclidean distance, can also be used. Preferably discrete values are used in calculating the distance. Thus the difference between two deflection intervals is not measured in milliseconds. Instead the module 36 measures the difference between the corresponding bin indexes, thus the distance has no unit. Similarly, the difference between two peak-peak amplitude values is not measured in millivolt. Instead, the module 36 measures the difference between the corresponding bin indexes, thus the difference between two peak-peak amplitude values has no unit.
- the CFAE for a segment of atrial EGM is determined based on the cumulative distance between deflections within the segment in module 38.
- the window length of the EGM segment is predefined or user programmable, preferably larger than 1 s, more preferably in a range between 3 s and 10 s.
- Most preferably the CFAE is continually evaluated over a moving window of the atrial EGM, so that the degree of CFAE in that channel can be measured and displayed in real time.
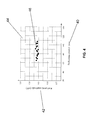
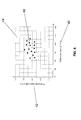
- the figures 3 to 6 illustrate the concept of this invention based on a 2D coordinate system, where one dimension is the deflection interval 40, and another dimension is the peak-peak deflection amplitude 42.
- the 2D plot is divided into grids of predefined resolution in both axes (deflection interval resolution: 10 ms, peak-peak amplitude resolution: 0.1 mV), with square bins 44 having a size of 10 ms times 0.1 mV.
- Figure 3 illustrates a scatter plot of the deflection vectors 46 associated with a plural of deflection complexes within a window of atrial EGM that has regular deflection intervals 40 and stable peak-peak amplitude 42.
- the deflection vectors 46 are concentrated in a condensed area within 2 square bins 44. The distance between each pair of consecutive deflections is small, limited to about 1 bin in either horizontal or vertical axis. Consequently, the CFAE, or the cumulative distance between deflections is small, indicating the corresponding atrial EGM is not fractionated.
- Figure 4 illustrates a scatter plot of the deflection vectors 46 associated with a plural of deflection complexes within a window of atrial EGM that has irregular deflection intervals 40 but regular peak-peak amplitude 42.
- the deflection vectors 46 are concentrated in a narrow row within 1 square bin 44 but widely spread in multiple columns within 5 square bins 44, covering a total scatter area of 5 square bins 44.
- the distance between each pair of consecutive deflections is moderate, limited along vertical axis but large along horizontal axis. Consequently, the CFAE, or the cumulative distance between deflections is moderate, indicating the corresponding atrial EGM is partially fractionated.
- Figure 5 illustrates a scatter plot of the deflection vectors 46 associated with a plural of deflection complexes within a window of atrial EGM that has regular deflection intervals 40 but irregular peak-peak amplitude 42.
- the deflection vectors 46 are concentrated column-wise within 2 square bins 44 but widely spread in multiple rows within 5 square bins 44 and cover a total scatter area of 10 square bins 44.
- the distance between each pair of consecutive deflections is moderate, limited in horizontal axis but large in vertical axis. Consequently, the CFAE, or the cumulative distance between deflections is moderate, indicating the corresponding atrial EGM is partially fractionated.
- Figure 6 illustrates a scatter plot of the deflection vectors 46 associated with a plural of deflection complexes within a window of atrial EGM that has both irregular deflection intervals 40 and irregular peak-peak amplitude 42.
- the deflection vectors 46 are sparsely scattered in the plot, meaning they are widely spread column-wise within 4 to 6 square bins 44 and also widely spread in multiple rows within 3 square bins 44 and cover a total scatter area of 14 square bins 44.
- the distance between each pair of consecutive deflections is large in both horizontal axis and vertical axis. Consequently, the CFAE, or the cumulative distance between deflections is large, indicating the corresponding atrial EGM is highly fractionated.
- the scatter plots can be used to visualize the temporal-amplitude distribution of the fractionated waves.
- the trajectories i.e. the lines between each pair of adjacent deflection vectors
- the distances between pairs of deflection vectors can also be plotted to reveal the transition from one deflection vector to another, and the distances between pairs of deflection vectors.
- other dimensions of the coordinates can also be used to construct the scatter plots to reveal the degree of fractionation.
- other methods to characterize the spatial distribution of the scatter plot such as the eccentricity of the best fit ellipse surrounding the samples, the slope of the best fit linear regression line, the non-empty cells/rows/columns, or the like, can also be used.
Landscapes
- Health & Medical Sciences (AREA)
- Life Sciences & Earth Sciences (AREA)
- Surgery (AREA)
- Engineering & Computer Science (AREA)
- Cardiology (AREA)
- Public Health (AREA)
- General Health & Medical Sciences (AREA)
- Veterinary Medicine (AREA)
- Animal Behavior & Ethology (AREA)
- Biomedical Technology (AREA)
- Heart & Thoracic Surgery (AREA)
- Medical Informatics (AREA)
- Molecular Biology (AREA)
- Physics & Mathematics (AREA)
- Biophysics (AREA)
- Pathology (AREA)
- Nuclear Medicine, Radiotherapy & Molecular Imaging (AREA)
- Plasma & Fusion (AREA)
- Otolaryngology (AREA)
- Robotics (AREA)
- Physiology (AREA)
- Measurement And Recording Of Electrical Phenomena And Electrical Characteristics Of The Living Body (AREA)
Abstract
Description
- The invention relates to a device for monitoring and evaluating electrogram signals that represent electric activities of a heart chamber or intracardiac electrograms, in particular atrial intracardiac electrograms.
- Intracardiac electrograms can be picked up by electrode leads or catheters that comprise one or more electrode poles for picking-up electric potentials originating from the myocardium of a respective heart chamber (atrium or ventricle). Myocardial cells depolarize and contract in response to natural or artificial stimulation. In a healthy heart chamber, depolarization of the muscle cells of the myocardium occurs nearly simultaneously leading to a contraction of the respective heart chamber. The change of electric potentials that co-occur with the depolarization and repolarization can be picked-up and form time-varying electrograms. In a certain time period after depolarization a muscle cell is unsusceptible for another stimulation. The time period is called refractory period of the muscle cell. In a healthy heart, electric conduction of stimulation pulses causes the myocardium to contract in a coordinated manner. However, if the electric conduction is affected, an uncoordinated contraction of muscle cells may occur wherein a part of the muscle cells contract while others already are refractory and become stimulated with a certain delay, which can lead to fibrillation of the affected heart chamber, for example AF (atrial fibrillation).
- A means to prevent such disorganized electric conduction and depolarization is known as ablation whereby local lesions of the myocardial tissue are induced in order to interrupt electric conduction of stimuli at the sites of respective lesions. To determine myocardial sites to be treated by means of ablation, monitoring of the electric potentials in a heart chamber, aka mapping, is carried out.
- Complex fractionated atrial electrograms (CFAE) have been identified as targets for AF ablation. Several catheter-based cardiac mapping systems have been developed that incorporate the features to map and identify areas associated with CFAE, which may function either as the drivers or the necessary substrate required for AF maintenance. However, there is no universal agreement on the precise definition of CFAE.
- Nademanee et al. (JACC 2004; 43:2044-53) presents CFAE-guided AF ablation in humans. The CFAE is defined in two ways. One definition of CFAE is - "fractionated electrograms composed of two deflections or more, and/or perturbation of the baseline with continuous deflection of a prolonged activation complex over a 10-s recording period. " Another definition is - "atrial electrograms with a very short cycle length (≤120 ms) averaged over a 10-s recording period. "
- Lau et al. (J Cardiac Electrophysiol 2012; 23: 980-7) shows a systematic review of several methods to define CFAE based on time domain measurement. One method defines CFAE as the mean of time intervals between the marked deflections being less than 120 ms. Another method counts ICL which is the number of intervals (usually of 50-120 ms) between tagged intrinsic local activations within a sampling period, and AIPI which refers to the average of all intervals between 2 successive tagged deflections of >50 ms. CFAE is defined by ICL ≥ 5 and AIPI < 100 ms. A third definition of CFAE is the presence of 2 or more successive tagged deflections with interval <50 ms and expressed as number of deflections or percentage of continuous activity. Yet a fourth definition of CFAE is that the electrograms show atrial complexes of >50 ms with more than 3 deviations from baseline.
- Besides the time domain methods, the CFAE is also defined based on dominant frequency (DF) analysis. The principle is to transform the signal from the time domain to the frequency domain. Subsequently, the highest peak in the spectrum is identified as the DF. The location with the highest DF value is subject to ablation. Grzeda et al. (Heart Rhythm 2009; 6:1475-82) shows that the DF method seems more robust than the time-domain method in identifying the CFAE sites.
- Ciaccio et al. (Circ Arrhythm Electrophysiol. 2011; 4:470-7) extends the analysis of CFAE by focusing on the spatial and temporal repeatability of CFAE patterns. Ciaccio et al. combines two independent methods, linear prediction and Fourier reconstruction, to quantify the repeatability of CFAE. Ciaccio et al. finds the degree of repeatability is site-specific and different in paroxysmal compared with longstanding AF.
- Ng et al. (J Cardiovasc Electrophysiol. 2010; 21:649-55) evaluates Shannon's entropy (ShEn) and the Kolmogorov-Smirnov (K-S) test as statistical methods to quantify complexity of AF electrograms, and compares these measures with fractional intervals in distinguishing CFAE from non-CFAE signals. Ng et al. shows that ShEn could be used to automatically rank and classify CFAE electrograms, and has comparable performance to fractional intervals.
- Lin et al. (Circ Arrhythm Electrophysiol. 2012; 5:949-56) applies histogram analysis for substrate mapping in patients with persistent AF. Instead of relying on the mean fractionation interval (FI), Lin et al. focuses on evaluating the kurtosis and skewness of the FI histogram in order to characterize the temporal variation of the FI.
-
WO 2012/021022 A1 presents a simulated arrhythmia catheter ablation system comprising a modeling unit, a pattern-producing unit, a mapping unit, an analysis unit, and a surgical unit. The modeling unit reproduces an atrial model by using heart image data. The pattern-producing unit produces an arrhythmia electrical-wave pattern on the atrial model. The mapping unit produces an atrial-site-specific electrical-signal map on the atrial model on which the arrhythmias electrical-wave pattern has been produced. The analysis unit discerns a core site of an electrical-wave vortex by using the atrial-site-specific electrical-signal map. The surgical unit carries out simulated catheter ablation at the core site of the electrical-wave vortex as discerned in the analysis unit. - In
US 2007/197929 A1 an apparatus and a method to automatically detect and map areas of complex fractionated electrograms are presented. Electrical signal data are obtained from respective locations of a heart and automatically analyzed to identify complex fractionated electrograms. Information derived from the signal data indicative of a spatial distribution of complex fractionated electrograms in a heart is displayed. Voltage peaks having amplitudes within a predefined voltage range can be identified and peak-to-peak intervals between the identified voltage peaks that occur within a predefined time range can be identified. Location information can be obtained using a position sensor. A functional map of a heart that is coded according to average or shortest durations of the complex fractionated electrograms or according to numbers of the complex fractionated electrograms detected in respective locations can be displayed. -
US 7,904,143 B2 shows methods and a medical apparatus for identifying CFAE locations. The method locates an arrhythmogenic focus in a heart of a living subject by obtaining training electrical signal data from respective training locations of a training set of hearts, which are automatically analyzed to identify training complex fractionated electrograms (CFAEs) therein. A plurality of observers determines the medical significance of the CFAEs, which is recorded and a first estimation is generated at the respective training locations by fitting a mixed regression model to the training CFAEs and the determinations of medical significance. In a next step patient electrical signal data from respective locations of a patient heart are obtained and automatically analyzed to identify CFAEs. The mixed regression model is applied on the CFAEs to obtain second estimations of medical significance and an indication that one or more of the respective locations of the patient heart are medically significant are displayed. -
US 8,315,696 B2 shows a method and a mapping apparatus for mapping complex fractionated electrograms by a probe at respective locations in a chamber of a heart of a subject. The mapping apparatus comprises a probe and a processor. The probe is configured to sense electrical activity in a chamber of a heart of a subject. The processor is configured to receive and process electrical inputs from the probe at multiple locations in the chamber. The processor identifies complex fractionated electrograms and measures at each location a respective contact quality between the probe and tissue in the chamber. The processor creates a map of the CFAE in the chamber using the electrical inputs and measured contact quality to distinguish between active and passive CFAEs. The apparatus can comprise an energy generator for ablation of sites at which CFAE were detected while contact quality satisfied a predetermined contact criterion. - It is likely that CFAE defined by different algorithms may represent different aspects of the underlying pathophysiology of atrial fibrillation (AF). For example, it has been shown that there is poor anatomic overlap between CFAE defined by multi-component/continuous electrograms (EGMs) and CFAE defined by AF cycle length <120 ms (Lee et al., Heart Rhythm 2011; 8:1714-9).
- Most methods, including time domain methods and dominant frequency method, characterize CFAE based on the fractionation intervals, ignoring information related to the amplitude variation of the electrograms. Other features of the electrogram morphology that reflect fractionated signal complex, such as the number of local peaks in a complex, the number of zero-crossings in a complex, the frequency content of a complex, or the like are also ignored.
- Although the amplitude information is taken into consideration when quantifying the atrial electrogram complexity (Ng et al. J Cardiovasc Electrophysiol. 2010; 21:649-55) or repeatability (Ciaccio et al. Circ Arrhythm Electrophysiol. 2011; 4:470-7), every data sample of the electrograms, including those in the signal baseline is included in the calculation, thus rendering these methods subject to the influence of recording noise, as well as the far-field components generated from distant atrial sites. Moreover, the clinical utility of these methods has not been confirmed.
- The object of the invention is to produce an improved device for monitoring and evaluating electrogram signals representing electric activities of a heart chamber.
- This object is achieved by a device for monitoring and evaluating electrogram signals representing electric activities of a heart chamber. The device comprises a signal input that is connected or can be connected to a mapping catheter and a signal processing and evaluation unit for processing and evaluating electrogram signals received by the signal input. The mapping catheter comprises at least one electrode pole for picking up electric potentials and generating electrogram signals from the picked up electric potentials. The signal processing and evaluation unit is configured to perform a number of steps when an electrogram signal is received by the signal input. The steps include identifying waveform deflections in the electrogram signal, measuring deflection intervals between each pair of consecutive deflection complexes in the electrogram signal, measuring at least one metric that characterizes a morphology of a deflection complex in the electrogram signal, generating a multi-dimensional deflection vector of at least two dimensions for each identified deflection, with at least one element being the deflection interval, determining a distance between each pair of consecutive deflections from the multi-dimensional deflection vectors, and determining a cumulative distance between deflections in a time window of predetermined length.
- The distance can for example be a weighted city block distance, a weighted Euclidean distance, or the like, wherein the distance between each pair of consecutive deflections is a distance between two multi-dimensional deflection vectors associated with two consecutive deflections. The degree of complex fractionated atrial electrogram (CFAE) for a segment of an atrial electrogram (EGM) signal is calculated based on the cumulative distance between deflections within the segment.
- One aspect of the invention is that it provides a novel means to quantify the degree of CFAE based on multi-dimensional assessment of the regularity of the EGM deflections, which yields an improved measure for detection of CFAE. This invention is advantageous in that it comprises not only temporal domain analysis of the fractionation intervals, but also an analysis of the fractionated wave amplitude and/or other metrics that characterize the fractionated morphology of the deflection complexes in the electrogram signals. The degree of CFAE at each site can be measured in real time through a novel distance measure which assesses the regularity of deflection waves in a multi-dimensional space. By mapping the degree of CFAE, targeted atrial fibrillation ablation can be applied for more effective therapy.
- In a preferred embodiment the device is configured to convert quasi non-discrete sampled values of preselected dimensions of the multi-dimensional deflection vector to discrete values. The quasi non-discrete sampled values are the sample values obtained from a measurement device, e.g., the mapping catheter. The discrete values have a much lower resolution than the quasi non-discrete sampled values and can for example be obtained by coarse-graining of the quasi non-discrete sampled values or the like. The device can be configured to determine a distance between each pair of consecutive deflections based on the converted discrete values of the multi-dimensional deflection vector. Preferably the signal processing and evaluation unit is configured to limit the converted discrete values of the multi-dimensional deflection vector to a predefined range with predetermined upper and lower interval thresholds. In a preferred embodiment the signal processing and evaluation unit is configured to bin converted discrete values according to a predefined bin width. For example the deflection interval can be limited to a range between 20 ms and 140 ms and a bin width can be set to 10 ms resulting in 14 bins. Similar limiting and coarse-graining operations can be performed for quasi non-discrete parameters, such as for example metrics extracted from a frequency domain or a complexity measure.
- The signal processing and evaluation unit can be configured to process position signals, which represent electrode poles location coordinates. The signal processing and evaluation unit can also be configured to process electrogram signals and position signals. Preferably each position signal is associated to at least one corresponding electrogram signal of the corresponding electrode pole. In one embodiment the signal processing and evaluation unit can be configured to associate a location coordinate represented by the position signal to the determined distance between each pair of consecutive deflections. The signal processing and evaluation unit can also include a module that is configured to perform the processing and evaluation of the position signals.
- The device can be operatively connected to or comprise a display unit. The display unit can be configured to display a distribution of determined cumulative distances between deflections at different electrode pole locations in a reconstructed anatomical model of a heart chamber. The display unit can also be configured to display scatter plots of deflection vectors associated with a plural of deflection complexes within a time window of an electrogram signal. The display unit can further be configured to display other data received from the device.
- In a preferred embodiment the device comprises or is operatively connected to an ablation unit. The ablation unit is preferably configured for targeting the electrode poles location coordinates or probing sites with the highest determined cumulative distance between deflections for ablation. The ablation unit can also be configured to target sites in dependence of other parameters.
- In one embodiment the signal processing and evaluation unit is configured to perform the identification of waveform deflections through an adaptive threshold method. Preferably a deflection complex is detected in the adaptive threshold method when the amplitude of the electrogram signal crosses a threshold value which is adaptive to a previously detected deflection peak amplitude.
- In a preferred embodiment one metric that characterizes the morphology of a deflection complex in the electrogram signal measured by the signal processing and evaluation unit is a peak-to-peak amplitude. The metric can also be the number of zero crossings within the deflection complex, the number of local peaks in the deflection complex, where a local peak is found if the slope of the signal changes from positive to negative, or from negative to positive, the absolute area under the deflection complex, the width of the deflection complex, the ratio of the positive peak amplitude to the negative peak amplitude of the deflection complex or the like. In addition or alternatively the morphology of the deflection complex can be characterized by a metric extracted by some basis of a vector space, such as from the frequency domain, leading to metrics such as a dominant frequency, a bandwidth of the frequency spectrum, and a ratio between dominant frequency to the bandwidth of the frequency spectrum or the like. Further the morphology of the deflection complex can be characterized by metrics that measure the complexity of the deflection complex, such as Shannon's entropy, approximate entropy, or the like. Preferably each deflection complex is associated with one or more measured metrics that characterize the morphological feature of the deflection complex.
- In a preferred embodiment, the distance between each pair of consecutive deflections is calculated by means of a weighted city block distance. The weighted city block distance between A and B can be defined as:

- The window length of an electrogram signal segment can be predefined or user programmable. The window length is preferably larger than 1 s, preferably between 3 s and 10 s. In a preferred embodiment the signal processing and evaluation unit is configured to continually evaluate electrogram signals received by the signal input over a moving window of the electrogram signal, so that the degree of CFAE in that channel can be measured and displayed in real time.
- The device can be used to determine sites in a heart chamber which show complex fractionated atrial electrograms. Preferably the device is connected to or comprises an ablation unit, which is configured to ablate sites in a heart chamber which show complex fractionated atrial electrograms.
- In a preferred embodiment the signal processing and evaluation unit comprises a deflection detection unit, a parameter measurement unit, and a parameter evaluation unit. The deflection detection unit can be configured for identifying waveform deflections in the electrogram signal. The parameter measurement unit can be configured for measuring deflection intervals between each pair of consecutive deflection complexes in the electrogram signal and measuring at least one metric that characterizes the morphology of a deflection complex in the electrogram signal. The parameter evaluation unit can be configured for a number of tasks or steps including, generating a multi-dimensional deflection vector of at least two dimensions for each identified deflection, wherein at least one element is the deflection interval, limiting and coarse-graining preselected dimensions of coordinate values, determining a distance between each pair of consecutive deflections from the multi-dimensional deflection vectors, and determining a cumulative distance between deflections in a time window of predetermined length. The signal processing and evaluation unit can also comprise a module for each task or step performed by the deflection detection unit, the parameter measurement unit, and the parameter evaluation unit of the signal processing and evaluation unit. Alternatively some of the steps can also be performed by an alternative unit of modules of the signal processing and evaluation unit.
- A preferred method to operate a device or monitor electrical activities in a heart chamber comprises the following steps: receiving an electrogram signal, identifying waveform deflections in the electrogram signal, measuring deflection intervals between each pair of consecutive deflection complexes in the electrogram signal, measuring at least one metric that characterizes the morphology of a deflection complex in the electrogram signal, generating a multi-dimensional deflection vector of at least two dimensions for each identified deflection, wherein at least one element is the deflection interval, limiting and coarse-graining preselected dimensions of coordinate values, determining a distance between each pair of consecutive deflections from the multi-dimensional deflection vectors, and determining a cumulative distance between deflections in a time window of predetermined length. In alternative method the step of limiting and coarse-graining preselected dimensions of coordinate values is omitted.
- The method can also comprise a step of receiving a position signal. Preferably the position signal represents an electrode pole location. In one embodiment, the method comprises a step of associating the electrode pole location represented by the position signal to an electrogram signal. Preferably the method comprises a step of associating the electrode pole location represented by the position signal to the determined distance between each pair of consecutive deflections or the cumulative distance.
- In one preferred embodiment a method is provided for a mapping catheter which probes different sites of a heart chamber to obtain each site's location coordinate, and quantify the degree of CFAE at each probed atrial site. A map of the CFAE in the atrial chamber can thus be created and the sites with the highest degree of CFAE are targeted for ablation. The method to quantify the degree of CFAE is preferably based on not only temporal domain analysis of the fractionation intervals, but also the analysis of the fractionated wave amplitude and/or other metrics that characterize the fractionated morphology of the deflection complexes in the electrogram signals. Scatter plots can be created to visualize the temporal-amplitude distribution of the fractionated waves, and distance measures can be calculated to quantify the degree of CFAE. Other metrics of the fractionated electrogram can also be measured and incorporated to quantify the CFAE in a multi-dimensional space. Most preferably the CFAE is quantified based on at least two independent dimensions of atrial electrogram signal.
- The above and other aspects, features and advantages of the present invention will be more apparent from the following more particular description thereof, presented in conjunction with the following drawings wherein:
- Figure 1
- is a schematic block diagram of a device according to the invention;
- Figure 2
- is a flow chart illustrating the operation of the device of
Figure 1 ; - Figure 3
- is a first example of a scatter plot of deflection vectors which shows a CFAE corresponding to a non fractionated atrial EGM;
- Figure 4
- is a second example of a scatter plot of deflection vectors which shows a CFAE corresponding to a partially fractionated atrial EGM;
- Figure 5
- is a third example of a scatter plot of deflection vectors which shows a CFAE corresponding to a partially fractionated atrial EGM;
- Figure 6
- is a fourth example of a scatter plot of deflection vectors which shows a CFAE corresponding to a highly fractionated atrial EGM;
- The following description is of the best mode presently contemplated for carrying out the invention. This description is not to be taken in a limiting sense, but is made merely for the purpose of describing the general principles of the invention. The scope of the invention should be determined with reference to the claims.
-
Fig. 1 shows a block diagram of adevice 10, which is operatively connected to amapping catheter 12, adisplay unit 14 and anablation unit 16. Themapping catheter 12 is equipped with a plurality ofelectrode poles 18 which can sense electrical activities at different sites of a heart chamber. Themapping catheter 12 is also equipped withposition sensors 20 that can obtain each probing site's and electrode poles location coordinate. Electrogram signals and position signals acquired by themapping catheter 12 are transmitted to asignal input 22 of thedevice 10. The signals received by thesignal input 22 are processed in a signal processing andevaluation unit 24. The signal processing andevaluation unit 24 comprisesmodules deflection detection unit 26' for detecting waveform deflections in the electrogram signal, aparameter measurement unit 29 for measuring parameters in the electrogram signal, and aparameter evaluation unit 33 for evaluating the parameters measured in theparameter measurement unit 29. - Waveform
deflection identification module 26 is adapted to identify waveform deflections in electrogram signals. Thedeflection detection unit 26' can be adapted to perform the tasks of themodule 26. - Deflection
interval measurement module 28 is adapted for measuring deflection intervals between each pair of consecutive deflection complexes in the electrogram signal.Metric measurement module 30 is adapted for measuring metrics that characterize morphologies of deflection complexes in the electrogram signal. Theparameter measurement unit 29 can be adapted to perform the tasks of themodules - Deflection
vector generation module 32 is adapted for generating multi-dimensional deflection vectors of at least two dimensions for each identified deflection, wherein at least one element is the deflection interval. Coarse-graining module 34 is adapted for limiting and coarse-graining preselected dimensions of coordinate values e.g. by forming discrete values from respective sampled and thus quasi non-discrete measured values.Distance determination module 36 is adapted for determining a distance between the multi-dimensional deflection vectors that represent each pair of consecutive deflections. Cumulativedistance determination module 38 is adapted for determining a cumulative distance between deflections in a time window of predetermined length. Theparameter evaluation unit 33 can be adapted to perform some or all of the tasks ofmodules - A detailed description of the performed tasks of the
modules evaluation unit 24 is presented in the description ofFig. 2 . - The cumulative distance determined in
module 38 can be used to quantify the complex fractionated atrial electrogram (CFAE) on different probing sites. The CFAE data can be transmitted to thedisplay unit 14, which is adapted to display the distribution of calculated CFAE at different atrial sites in a reconstructed anatomical model of the atrial chamber. Further the CFAE data can be transmitted to theablation unit 16, which is adapted for targeting the sites or electrode pole locations with the highest degree of CFAE, respectively cumulative distance between deflections, for ablation. - The
device 10 can also comprise themapping catheter 12, thedisplay unit 14 and/or theablation unit 16. It is also possible, that themapping catheter 12 is equipped with only oneelectrode pole 18 and one ormore position sensors 20. If themapping catheter 12 is equipped with only oneelectrode pole 18 the mapping has to be performed by variation of the position of themapping catheter 12. The position signal can be processed and evaluated in the signal processing andevaluation unit 24 or in a module of the signal processing andevaluation unit 24. The signal processing andevaluation unit 24 can be adapted to associate each position signal to at least one corresponding electrogram signal and/or to associate a location coordinate represented by the position signal to the determined distance between each pair of consecutive deflections. - The method to quantify the degree of CFAE is based on multi-dimensional analysis of the atrial electrogram. The details of the method to quantify the degree of CFAE, respectively the details to determine the cumulative distance, are described below.
-
Figure 2 is a flowchart that shows the steps of quantifying CFAE with the device components/modules in which the steps are performed. First, the system acquires the local atrial electrogram (EGM) from theelectrodes poles 18 that are close to the probing site, which include the EGM in an electrogram signal and transmit it to thesignal input 22 of thedevice 10. The waveform deflections in the acquired atrial electrogram signal are then identified inmodule 26, for example by a peak detection algorithm, preferably through a depolarization detection algorithm. As known in the art, the depolarization detection algorithm can be implemented through an adaptive threshold method, in which a deflection complex is detected when the EGM amplitude crosses a threshold value which is adaptive to the previously detected deflection peak amplitude. In addition, after the detection of an atrial depolarization complex, a predefined refractory window can be applied to prevent the algorithm from detecting another threshold crossing that is too close to the previously detected deflection complex. - After the EGM deflections are detected through a peak detection algorithm, the deflection intervals between each pair of consecutive deflection complexes are measured in
module 28. Each deflection is associated with one deflection interval. The deflection interval associated with a deflection complex can be the interval immediately preceding the deflection complex or the interval immediately after the deflection complex. - Then the metrics that characterize the morphology of the deflection complex are measured in
module 30. One exemplary metric is the peak-to-peak amplitude of the deflection complex. Another exemplary metric is the number of zero crossings within the deflection complex. Yet another metric is the number of local peaks in the deflection complex, where a local peak is found if the slope of the signal changes from positive to negative, or from negative to positive. Other metrics that characterize the shape of the deflection complex include, but are not limited to, the absolute area under the deflection complex, the width of the deflection complex, the ratio of the positive peak amplitude to the negative peak amplitude of the deflection complex, or the like. Yet the morphology of the deflection complex can also be characterized by the metrics extracted by some basis, such as from the frequency domain. For example, a frequency spectrum of the deflection complex can be calculated, from which metrics such as a dominant frequency, a bandwidth of the spectrum, and a ratio between dominant frequency to a bandwidth of the spectrum, or the like can be obtained. Yet the morphology of the deflection complex can further be characterized by metrics that measure the complexity of the deflection complex, such as Shannon's entropy, approximate entropy, or the like. Therefore, each deflection complex is associated with one or more measured metrics that characterize the morphological feature of the deflection complex. - Then, for each identified EGM deflection, a multi-dimensional deflection vector is generated in
module 32. At least one element of the deflection vector is the deflection interval associated with a deflection complex. Other elements of the deflection vector comprise the measured metrics that characterize the morphology of the deflection complex as described above. For example, the deflection complex k can be associated with a constructed two-dimensional deflection vector (Lk, Ak), where Lk is the deflection interval associated with the deflection complex k, and Ak is peak-peak amplitude of the deflection complex k. In another example, the deflection complex k can be associated with a constructed three-dimensional deflection vector (Lk, Ak, Xk) where Lk is the deflection interval associated with the deflection complex k, Ak is peak-peak amplitude of the deflection complex k, and Xk is number of zero-crossings within the deflection complex k. Yet in another example, the deflection complex k can be associated with a constructed four-dimensional deflection vector (Lk, Ak, Xk, Pk) where Lk is the deflection interval associated with the deflection complex k, Ak is peak-peak amplitude of the deflection complex k, Xk is number of zero-crossings within the deflection complex k, and Pk is number of local peaks within the deflection complex k. Clearly, the dimension of the deflection vector can vary depending on the number of metrics measured from the deflection complexes, but is always greater than 1. - Next, preselected dimensions of coordinate that are quasi non-discrete sampled values are converted to discrete values through limiting and coarse-graining operations in
module 34. Preferably, the deflection intervals are limited to predefined range with predetermined upper and lower interval thresholds, and are binned according to predefined bin width. For example, the deflection interval can be limited to the range between 20-140 ms, and the bin width can be set to 10 ms. Then each deflection interval (DI) can be assigned to one of the following 14 discrete bins: DI<20 ms, 20≤DI<30 ms, 30≤DI<40 ms, ..., 130≤DI<140 ms, DI>140 ms. Accordingly, the deflection interval can be replaced with the corresponding bin index ranging from 1 to 14. Similarly, if peak-peak amplitude (PA) is one dimension of the coordinate, then the amplitude value can also be limited to a range, e.g., 0.1-1.0 mV. If the bin width is set to 0.1 mV, then the peak-peak amplitude can be binned to one of 11 discrete bins: PA<0.1 mV, 0.1≤PA<0.2 mV, 0.2≤PA<0.3 mV, ..., 0.9≤A<1.0 mV, PA>1.0 mV. Accordingly, the peak-peak amplitude can be replaced with the corresponding bin index ranging from 1 to 11. Other limit values (such as those based on error minimization) and bin widths (whose edges are based on a log scale for example) can be similarly applied. For other quasi non-discrete parameters, such as the metrics extracted from the frequency domain or the complexity measures, similar limiting and coarse-graining operations can be performed. - Then the distance between each pair of consecutive deflections is determined in
module 36. Preferably the distance between each pair of consecutive deflections is calculated by means of a weighted city block distance. Denote A=[a(1), a(2), ... a(n)] and B=[b(1), b(2), ... b(n)] are two n-dimensional deflection vectors associated with two consecutive deflections, where a(i) and b(i) represent the respective discrete coordinate values along the i-th dimension (for i = 1...n). The weighted city block distance between A and B is defined as:
module 36 measures the difference between the corresponding bin indexes, thus the distance has no unit. Similarly, the difference between two peak-peak amplitude values is not measured in millivolt. Instead, themodule 36 measures the difference between the corresponding bin indexes, thus the difference between two peak-peak amplitude values has no unit. - The CFAE for a segment of atrial EGM is determined based on the cumulative distance between deflections within the segment in
module 38. The window length of the EGM segment is predefined or user programmable, preferably larger than 1 s, more preferably in a range between 3 s and 10 s. Most preferably the CFAE is continually evaluated over a moving window of the atrial EGM, so that the degree of CFAE in that channel can be measured and displayed in real time. - The
figures 3 to 6 illustrate the concept of this invention based on a 2D coordinate system, where one dimension is thedeflection interval 40, and another dimension is the peak-peak deflection amplitude 42. The 2D plot is divided into grids of predefined resolution in both axes (deflection interval resolution: 10 ms, peak-peak amplitude resolution: 0.1 mV), withsquare bins 44 having a size of 10 ms times 0.1 mV. -
Figure 3 illustrates a scatter plot of thedeflection vectors 46 associated with a plural of deflection complexes within a window of atrial EGM that hasregular deflection intervals 40 and stable peak-peak amplitude 42. Thedeflection vectors 46 are concentrated in a condensed area within 2square bins 44. The distance between each pair of consecutive deflections is small, limited to about 1 bin in either horizontal or vertical axis. Consequently, the CFAE, or the cumulative distance between deflections is small, indicating the corresponding atrial EGM is not fractionated. -
Figure 4 illustrates a scatter plot of thedeflection vectors 46 associated with a plural of deflection complexes within a window of atrial EGM that hasirregular deflection intervals 40 but regular peak-peak amplitude 42. Thedeflection vectors 46 are concentrated in a narrow row within 1square bin 44 but widely spread in multiple columns within 5square bins 44, covering a total scatter area of 5square bins 44. The distance between each pair of consecutive deflections is moderate, limited along vertical axis but large along horizontal axis. Consequently, the CFAE, or the cumulative distance between deflections is moderate, indicating the corresponding atrial EGM is partially fractionated. -
Figure 5 illustrates a scatter plot of thedeflection vectors 46 associated with a plural of deflection complexes within a window of atrial EGM that hasregular deflection intervals 40 but irregular peak-peak amplitude 42. Thedeflection vectors 46 are concentrated column-wise within 2square bins 44 but widely spread in multiple rows within 5square bins 44 and cover a total scatter area of 10square bins 44. The distance between each pair of consecutive deflections is moderate, limited in horizontal axis but large in vertical axis. Consequently, the CFAE, or the cumulative distance between deflections is moderate, indicating the corresponding atrial EGM is partially fractionated. -
Figure 6 illustrates a scatter plot of thedeflection vectors 46 associated with a plural of deflection complexes within a window of atrial EGM that has bothirregular deflection intervals 40 and irregular peak-peak amplitude 42. Thedeflection vectors 46 are sparsely scattered in the plot, meaning they are widely spread column-wise within 4 to 6square bins 44 and also widely spread in multiple rows within 3square bins 44 and cover a total scatter area of 14square bins 44. The distance between each pair of consecutive deflections is large in both horizontal axis and vertical axis. Consequently, the CFAE, or the cumulative distance between deflections is large, indicating the corresponding atrial EGM is highly fractionated. - The scatter plots can be used to visualize the temporal-amplitude distribution of the fractionated waves. Optionally, the trajectories (i.e. the lines between each pair of adjacent deflection vectors) can also be plotted to reveal the transition from one deflection vector to another, and the distances between pairs of deflection vectors. It should be understood that other dimensions of the coordinates can also be used to construct the scatter plots to reveal the degree of fractionation. It should also be understood that other methods to characterize the spatial distribution of the scatter plot, such as the eccentricity of the best fit ellipse surrounding the samples, the slope of the best fit linear regression line, the non-empty cells/rows/columns, or the like, can also be used.
- Although an exemplary embodiment of the present invention has been shown and described, it should be apparent to those of ordinary skill that a number of changes and modifications to the invention may be made without departing from the spirit and scope of the invention. All such changes, modifications and alterations should therefore be recognized as falling within the scope of the present invention.
Claims (14)
- A device (10) for monitoring and evaluating electrogram signals representing electric activities of a heart chamber, said device (10) comprising
a signal input (22) that is connected or can be connected to a mapping catheter (12) comprising at least one electrode pole (18) for picking up electric potentials and generating electrogram signals from the picked up electric potentials, and
a signal processing and evaluation unit (24) for processing and evaluating electrogram signals received at the signal input (22),
wherein the signal processing and evaluation unit (24) is configured to perform the following steps when an electrogram signal is received by the signal input (22):- identifying waveform deflections in the electrogram signal,- measuring deflection intervals between each pair of consecutive deflection complexes in the electrogram signal,- measuring at least one metric that characterizes the morphology of a deflection complex in the electrogram signal,- generating a multi-dimensional deflection vector of at least two dimensions for each identified deflection, wherein at least one element is the deflection interval,- determining a distance between each pair of consecutive deflections from the multi-dimensional deflection vectors, and- determining a cumulative distance between deflections in a time window of predetermined length. - A device (10) according to claim 1, wherein the signal processing and evaluation unit (24) is further configured to convert quasi non-discrete sampled values of preselected dimensions of the multi-dimensional deflection vector to discrete values and to determine a distance between each pair of consecutive deflections based on the converted discrete values of the multi-dimensional deflection vector.
- A device (10) according to claim 2, wherein the signal processing and evaluation unit (24) is configured to limit the converted discrete values of the multi-dimensional deflection vector to a predefined range with predetermined upper and lower interval thresholds, and to bin the converted discrete values according to predefined bin width.
- A device (10) according to at least one of the claims 1 to 3, wherein the signal processing and evaluation unit (24) is configured to process electrogram signals in combination with position signals, which represent electrode poles location coordinates and wherein each position signal is associated to at least one corresponding electrogram signal of the corresponding electrode pole (18).
- A device (10) according to claim 4, wherein the signal processing and evaluation unit (24) is configured to associate a location coordinate represented by the position signal to the determined distance between each pair of consecutive deflections.
- A device (10) according to at least one of the claims 1 to 5, wherein the device (10) is operatively connected to a display unit (14), which is configured to display a distribution of determined cumulative distances between deflections at different electrode pole locations in a reconstructed anatomical model of a heart chamber.
- A device (10) according to at least one of the claims 1 to 6, wherein the device (10) is operatively connected to an ablation unit (16), which is configured for targeting the electrode pole location with the highest determined cumulative distance between deflections for ablation.
- A device (10) according to at least one of the claims 1 to 7, wherein the signal processing and evaluation unit (24) is configured to perform the identification of waveform deflections through an adaptive threshold method, in which a deflection complex is detected when an amplitude of the electrogram signal crosses a threshold value which is adaptive to a previously detected deflection peak amplitude.
- A device (10) according to at least one of the claims 1 to 8, wherein one metric that characterizes a morphology of a deflection complex in the electrogram signal measured by the signal processing and evaluation unit (24) is a peak-to-peak amplitude.
- A device (10) according to at least one of the claims 1 to 9, wherein the signal processing and evaluation unit (24) is configured to determine the distance between each pair of consecutive deflections by means of a weighted city block distance.
- A device (10) according to at least one of the claims 1 to 10, wherein the signal processing and evaluation unit (24) is configured to continually evaluate electrogram signals received by the signal input.
- A device (10) according to at least one of the claims 1 to 11, wherein one metric that characterizes a morphology of a deflection complex in the electrogram signal measured by the signal processing and evaluation unit (24) is a metric extracted by some basis of a vector space.
- A device (10) according to at least one of the claims 1 to 11, wherein one metric that characterizes a morphology of a deflection complex in the electrogram signal measured by the signal processing and evaluation unit (24) is a metric which measures the complexity of the deflection complex.
- A device (10) according to at least one of the claims 1 to 13, wherein the signal processing and evaluation unit (24) comprises
a deflection detection unit (26') for identifying waveform deflections in the electrogram signal,
a parameter measurement unit (29) for measuring deflection intervals between each pair of consecutive deflection complexes in the electrogram signal and measuring at least one metric that characterizes the morphology of a deflection complex in the electrogram signal, and
a parameter evaluation unit (33) for generating a multi-dimensional deflection vector of at least two dimensions for each identified deflection, wherein at least one element is the deflection interval, determining a distance between each pair of consecutive deflections from the multi-dimensional deflection vectors, and determining a cumulative distance between deflections in a time window of predetermined length.
Applications Claiming Priority (1)
| Application Number | Priority Date | Filing Date | Title |
|---|---|---|---|
| US201361878052P | 2013-09-16 | 2013-09-16 |
Publications (1)
| Publication Number | Publication Date |
|---|---|
| EP2851002A1 true EP2851002A1 (en) | 2015-03-25 |
Family
ID=51564437
Family Applications (1)
| Application Number | Title | Priority Date | Filing Date |
|---|---|---|---|
| EP14183365.7A Withdrawn EP2851002A1 (en) | 2013-09-16 | 2014-09-03 | Device for automatic mapping of complex fractionated atrial electrogram |
Country Status (2)
| Country | Link |
|---|---|
| US (1) | US9456759B2 (en) |
| EP (1) | EP2851002A1 (en) |
Cited By (1)
| Publication number | Priority date | Publication date | Assignee | Title |
|---|---|---|---|---|
| EP3766416A1 (en) * | 2019-07-16 | 2021-01-20 | Biosense Webster (Israel) Ltd | Mapping atrial fibrillation using fragmentation index |
Families Citing this family (25)
| Publication number | Priority date | Publication date | Assignee | Title |
|---|---|---|---|---|
| US11389232B2 (en) | 2006-06-28 | 2022-07-19 | Kardium Inc. | Apparatus and method for intra-cardiac mapping and ablation |
| US9119633B2 (en) | 2006-06-28 | 2015-09-01 | Kardium Inc. | Apparatus and method for intra-cardiac mapping and ablation |
| US8906011B2 (en) | 2007-11-16 | 2014-12-09 | Kardium Inc. | Medical device for use in bodily lumens, for example an atrium |
| US9198592B2 (en) | 2012-05-21 | 2015-12-01 | Kardium Inc. | Systems and methods for activating transducers |
| US10827977B2 (en) | 2012-05-21 | 2020-11-10 | Kardium Inc. | Systems and methods for activating transducers |
| US9017320B2 (en) | 2012-05-21 | 2015-04-28 | Kardium, Inc. | Systems and methods for activating transducers |
| EP3122246B1 (en) | 2014-03-25 | 2022-05-04 | Acutus Medical, Inc. | Cardiac analysis user interface system and method |
| US10368936B2 (en) | 2014-11-17 | 2019-08-06 | Kardium Inc. | Systems and methods for selecting, activating, or selecting and activating transducers |
| US10722184B2 (en) | 2014-11-17 | 2020-07-28 | Kardium Inc. | Systems and methods for selecting, activating, or selecting and activating transducers |
| US10004418B2 (en) | 2015-01-23 | 2018-06-26 | Medtronic, Inc. | Atrial arrhythmia episode detection in a cardiac medical device |
| US9675261B2 (en) | 2015-01-23 | 2017-06-13 | Medtronic, Inc. | Atrial arrhythmia episode detection in a cardiac medical device |
| US10213125B2 (en) | 2015-01-23 | 2019-02-26 | Medtronic, Inc. | Atrial arrhythmia episode detection in a cardiac medical device |
| US9901276B2 (en) | 2015-02-18 | 2018-02-27 | Medtronic, Inc. | Method and apparatus for identifying sick sinus syndrome in an implantable cardiac monitoring device |
| US9962102B2 (en) | 2015-02-18 | 2018-05-08 | Medtronic, Inc. | Method and apparatus for atrial arrhythmia episode detection |
| US10039469B2 (en) | 2016-03-30 | 2018-08-07 | Medtronic, Inc. | Atrial arrhythmia episode detection in a cardiac medical device |
| US10045710B2 (en) | 2016-03-30 | 2018-08-14 | Medtronic, Inc. | Atrial arrhythmia episode detection in a cardiac medical device |
| EP3612081B1 (en) * | 2017-04-18 | 2025-07-30 | Boston Scientific Scimed Inc. | Annotation histogram for electrophysiological signals |
| ES2706537B2 (en) * | 2017-09-29 | 2020-08-05 | Univ Madrid Carlos Iii | SYSTEM AND METHOD FOR THE AUTOMATIC DETECTION OF ABNORMAL ELECTROPHYSIOLOGICAL PATTERNS |
| AU2019209440A1 (en) * | 2018-01-21 | 2020-09-03 | Acutus Medical, Inc. | System for identifying cardiac conduction patterns |
| US11844616B2 (en) * | 2019-08-13 | 2023-12-19 | Biosense Webster (Israel) Ltd. | Enhanced visualization of organ electrical activity |
| JP7252109B2 (en) * | 2019-10-07 | 2023-04-04 | Cyberdyne株式会社 | Diagnostic support system and control program |
| CN113349923B (en) * | 2021-08-11 | 2021-12-07 | 上海微创电生理医疗科技股份有限公司 | Ablation system |
| US11969255B2 (en) | 2021-12-12 | 2024-04-30 | Biosense Webster (Israel) Ltd. | Detection of fractionated signals in stable arrhythmias |
| US12653439B2 (en) * | 2022-07-27 | 2026-06-16 | Biosense Webster (Israel) Ltd. | Method and system for identification of fractionated signals |
| IT202400013279A1 (en) | 2024-06-11 | 2024-09-11 | Lorenzo Gigli | SYSTEM FOR THE CHARACTERIZATION OF THE ELECTROPHYSIOLOGICAL SUBSTRATE IN ATRIAL FIBRILLATION |
Citations (8)
| Publication number | Priority date | Publication date | Assignee | Title |
|---|---|---|---|---|
| US5891048A (en) * | 1996-06-18 | 1999-04-06 | Biotronik Mess- Und Therapiegeraete Gmbh & Co. Ingenieurbuero Berlin | Signal detector |
| US20050171447A1 (en) * | 2001-12-21 | 2005-08-04 | Esperer Hans D. | Method and device for the automateddetection and differentiation of cardiac rhythm disturbances |
| US20060247547A1 (en) * | 2005-04-29 | 2006-11-02 | Shantanu Sarkar | Method and apparatus for detection of tachyarrhythmia using cycle lengths |
| US20070197929A1 (en) | 2006-01-12 | 2007-08-23 | Joshua Porath | Mapping of complex fractionated atrial electrogram |
| EP2179690A1 (en) * | 2008-10-24 | 2010-04-28 | BIOTRONIK CRM Patent AG | Heart monitoring device and method |
| US7904143B2 (en) | 2008-07-07 | 2011-03-08 | Biosense Webster, Inc. | Binary logistic mixed model for complex fractionated atrial electrogram procedures |
| WO2012021022A1 (en) | 2010-08-13 | 2012-02-16 | 연세대학교 산학협력단 | Simulated arrhythmia catheter ablation system |
| US8315696B2 (en) | 2010-12-09 | 2012-11-20 | Biosense Webster (Israel), Ltd. | Identifying critical CFAE sites using contact measurement |
Family Cites Families (1)
| Publication number | Priority date | Publication date | Assignee | Title |
|---|---|---|---|---|
| US8676305B2 (en) * | 2012-03-21 | 2014-03-18 | Biosense Webster (Israel) Ltd. | Automated analysis of complex fractionated electrograms |
-
2014
- 2014-08-25 US US14/468,267 patent/US9456759B2/en not_active Expired - Fee Related
- 2014-09-03 EP EP14183365.7A patent/EP2851002A1/en not_active Withdrawn
Patent Citations (8)
| Publication number | Priority date | Publication date | Assignee | Title |
|---|---|---|---|---|
| US5891048A (en) * | 1996-06-18 | 1999-04-06 | Biotronik Mess- Und Therapiegeraete Gmbh & Co. Ingenieurbuero Berlin | Signal detector |
| US20050171447A1 (en) * | 2001-12-21 | 2005-08-04 | Esperer Hans D. | Method and device for the automateddetection and differentiation of cardiac rhythm disturbances |
| US20060247547A1 (en) * | 2005-04-29 | 2006-11-02 | Shantanu Sarkar | Method and apparatus for detection of tachyarrhythmia using cycle lengths |
| US20070197929A1 (en) | 2006-01-12 | 2007-08-23 | Joshua Porath | Mapping of complex fractionated atrial electrogram |
| US7904143B2 (en) | 2008-07-07 | 2011-03-08 | Biosense Webster, Inc. | Binary logistic mixed model for complex fractionated atrial electrogram procedures |
| EP2179690A1 (en) * | 2008-10-24 | 2010-04-28 | BIOTRONIK CRM Patent AG | Heart monitoring device and method |
| WO2012021022A1 (en) | 2010-08-13 | 2012-02-16 | 연세대학교 산학협력단 | Simulated arrhythmia catheter ablation system |
| US8315696B2 (en) | 2010-12-09 | 2012-11-20 | Biosense Webster (Israel), Ltd. | Identifying critical CFAE sites using contact measurement |
Non-Patent Citations (8)
| Title |
|---|
| CIACCIO ET AL., CIRC ARRHYTHM ELECTROPHYSIOL., vol. 4, 2011, pages 470 - 7 |
| GRZEDA ET AL., HEART RHYTHM, vol. 6, 2009, pages 1475 - 82 |
| LAU ET AL., J CARDIAC ELECTROPHYSIOL, vol. 23, 2012, pages 980 - 7 |
| LEE ET AL., HEART RHYTHM, vol. 8, 2011, pages 1714 - 9 |
| LIN ET AL., CIRC ARRHYTHM ELECTROPHYSIOL., vol. 5, 2012, pages 949 - 56 |
| MAYANK KUMAR ET AL: "Computerized detection & classification of ECG signals", EMERGING TRENDS IN ELECTRICAL ENGINEERING AND ENERGY MANAGEMENT (ICETEEEM), 2012 INTERNATIONAL CONFERENCE ON, IEEE, 13 December 2012 (2012-12-13), pages 126 - 130, XP032354873, ISBN: 978-1-4673-4633-7, DOI: 10.1109/ICETEEEM.2012.6494465 * |
| NADEMANEE ET AL., JACC, vol. 43, 2004, pages 2044 - 53 |
| NG ET AL., J CARDIOVASC ELECTROPHYSIOL., vol. 21, 2010, pages 649 - 55 |
Cited By (4)
| Publication number | Priority date | Publication date | Assignee | Title |
|---|---|---|---|---|
| EP3766416A1 (en) * | 2019-07-16 | 2021-01-20 | Biosense Webster (Israel) Ltd | Mapping atrial fibrillation using fragmentation index |
| US10905349B1 (en) | 2019-07-16 | 2021-02-02 | Biosense Webster (Israel) Ltd. | Mapping atrial fibrillation using fragmentation index |
| CN112315486A (en) * | 2019-07-16 | 2021-02-05 | 伯恩森斯韦伯斯特(以色列)有限责任公司 | Mapping atrial fibrillation using fragmentation index |
| CN112315486B (en) * | 2019-07-16 | 2026-01-13 | 伯恩森斯韦伯斯特(以色列)有限责任公司 | Mapping atrial fibrillation using fragmentation index |
Also Published As
| Publication number | Publication date |
|---|---|
| US20150080752A1 (en) | 2015-03-19 |
| US9456759B2 (en) | 2016-10-04 |
Similar Documents
| Publication | Publication Date | Title |
|---|---|---|
| US9456759B2 (en) | Device for automatic mapping of complex fractionated atrial electrogram | |
| US10368767B2 (en) | Medical devices for mapping cardiac tissue | |
| US20230334077A1 (en) | Automatic pattern acquisition | |
| US10004413B2 (en) | Signal analysis related to treatment sites | |
| CN101292870B (en) | Automated pace-mapping for identification of cardiac arrhythmic conductive pathways and foci | |
| CA2573691C (en) | Mapping of complex fractionated atrial electrogram | |
| JP2017514597A (en) | Medical device for mapping heart tissue | |
| JP2017520286A (en) | Medical device for mapping heart tissue | |
| CN103263262B (en) | System and method for measuring heart rate of fetus | |
| CN103690156A (en) | Heart rate acquiring method and electrocardiosignal processing method | |
| EP4091547B1 (en) | Medical apparatus for diagnostic and site determination of cardiac arrhythmias | |
| CN112469334B (en) | Detection of areas exhibiting irregular electrophysiological activity | |
| US11331033B2 (en) | Systems and methods for treating cardiac arrhythmia | |
| AU2013201678A1 (en) | Automated analysis of complex fractionated electrograms | |
| US20220015682A1 (en) | Algorithmic techniques for deduction of functional characteristics of cardiac tissue in cardiac electrical fibrillation from a densely packed array of high-resolution electrodes | |
| KR20150081763A (en) | Method and system for r wave detection from electrocardiogram | |
| KR101626855B1 (en) | device and method for diagnosing cardiac arrhythmia using body surface potential mapping | |
| US12279877B2 (en) | Systems and methods for treating cardiac arrhythmia | |
| EP4525722A1 (en) | Apparatus for monitoring activation in the heart | |
| Szilagyi et al. | Sensibility analysis of the Arruda localization method | |
| Miklós et al. | An enhanced method for accessory pathway localization in case of Wolff-Parkinson-White syndrome | |
| Rogers et al. | Quantitative analysis of complex rhythms | |
| WO2010114854A1 (en) | Power approach to biomedical signal analysis | |
| AU2014250609A1 (en) | Accurate time annotation of intracardiac ecg signals |
Legal Events
| Date | Code | Title | Description |
|---|---|---|---|
| PUAI | Public reference made under article 153(3) epc to a published international application that has entered the european phase |
Free format text: ORIGINAL CODE: 0009012 |
|
| 17P | Request for examination filed |
Effective date: 20140903 |
|
| AK | Designated contracting states |
Kind code of ref document: A1 Designated state(s): AL AT BE BG CH CY CZ DE DK EE ES FI FR GB GR HR HU IE IS IT LI LT LU LV MC MK MT NL NO PL PT RO RS SE SI SK SM TR |
|
| AX | Request for extension of the european patent |
Extension state: BA ME |
|
| R17P | Request for examination filed (corrected) |
Effective date: 20150911 |
|
| RBV | Designated contracting states (corrected) |
Designated state(s): AL AT BE BG CH CY CZ DE DK EE ES FI FR GB GR HR HU IE IS IT LI LT LU LV MC MK MT NL NO PL PT RO RS SE SI SK SM TR |
|
| STAA | Information on the status of an ep patent application or granted ep patent |
Free format text: STATUS: EXAMINATION IS IN PROGRESS |
|
| 17Q | First examination report despatched |
Effective date: 20191010 |
|
| STAA | Information on the status of an ep patent application or granted ep patent |
Free format text: STATUS: THE APPLICATION IS DEEMED TO BE WITHDRAWN |
|
| 18D | Application deemed to be withdrawn |
Effective date: 20210323 |