EP2822603B1 - Diagnostic marker compounds and their use - Google Patents
Diagnostic marker compounds and their use Download PDFInfo
- Publication number
- EP2822603B1 EP2822603B1 EP13709993.3A EP13709993A EP2822603B1 EP 2822603 B1 EP2822603 B1 EP 2822603B1 EP 13709993 A EP13709993 A EP 13709993A EP 2822603 B1 EP2822603 B1 EP 2822603B1
- Authority
- EP
- European Patent Office
- Prior art keywords
- lactic acid
- conjugated
- measurement
- rare earth
- level
- Prior art date
- Legal status (The legal status is an assumption and is not a legal conclusion. Google has not performed a legal analysis and makes no representation as to the accuracy of the status listed.)
- Active
Links
Images





Classifications
-
- A—HUMAN NECESSITIES
- A61—MEDICAL OR VETERINARY SCIENCE; HYGIENE
- A61K—PREPARATIONS FOR MEDICAL, DENTAL OR TOILETRY PURPOSES
- A61K49/00—Preparations for testing in vivo
- A61K49/001—Preparation for luminescence or biological staining
- A61K49/0013—Luminescence
- A61K49/0017—Fluorescence in vivo
- A61K49/0019—Fluorescence in vivo characterised by the fluorescent group, e.g. oligomeric, polymeric or dendritic molecules
-
- A—HUMAN NECESSITIES
- A61—MEDICAL OR VETERINARY SCIENCE; HYGIENE
- A61K—PREPARATIONS FOR MEDICAL, DENTAL OR TOILETRY PURPOSES
- A61K49/00—Preparations for testing in vivo
- A61K49/0004—Screening or testing of compounds for diagnosis of disorders, assessment of conditions, e.g. renal clearance, gastric emptying, testing for diabetes, allergy, rheuma, pancreas functions
-
- A—HUMAN NECESSITIES
- A61—MEDICAL OR VETERINARY SCIENCE; HYGIENE
- A61B—DIAGNOSIS; SURGERY; IDENTIFICATION
- A61B5/00—Measuring for diagnostic purposes; Identification of persons
- A61B5/0059—Measuring for diagnostic purposes; Identification of persons using light, e.g. diagnosis by transillumination, diascopy, fluorescence
-
- A—HUMAN NECESSITIES
- A61—MEDICAL OR VETERINARY SCIENCE; HYGIENE
- A61B—DIAGNOSIS; SURGERY; IDENTIFICATION
- A61B5/00—Measuring for diagnostic purposes; Identification of persons
- A61B5/0059—Measuring for diagnostic purposes; Identification of persons using light, e.g. diagnosis by transillumination, diascopy, fluorescence
- A61B5/0071—Measuring for diagnostic purposes; Identification of persons using light, e.g. diagnosis by transillumination, diascopy, fluorescence by measuring fluorescence emission
-
- A—HUMAN NECESSITIES
- A61—MEDICAL OR VETERINARY SCIENCE; HYGIENE
- A61B—DIAGNOSIS; SURGERY; IDENTIFICATION
- A61B5/00—Measuring for diagnostic purposes; Identification of persons
- A61B5/0059—Measuring for diagnostic purposes; Identification of persons using light, e.g. diagnosis by transillumination, diascopy, fluorescence
- A61B5/0075—Measuring for diagnostic purposes; Identification of persons using light, e.g. diagnosis by transillumination, diascopy, fluorescence by spectroscopy, i.e. measuring spectra, e.g. Raman spectroscopy, infrared absorption spectroscopy
-
- A—HUMAN NECESSITIES
- A61—MEDICAL OR VETERINARY SCIENCE; HYGIENE
- A61B—DIAGNOSIS; SURGERY; IDENTIFICATION
- A61B5/00—Measuring for diagnostic purposes; Identification of persons
- A61B5/145—Measuring characteristics of blood in vivo, e.g. gas concentration or pH-value ; Measuring characteristics of body fluids or tissues, e.g. interstitial fluid or cerebral tissue
- A61B5/14546—Measuring characteristics of blood in vivo, e.g. gas concentration or pH-value ; Measuring characteristics of body fluids or tissues, e.g. interstitial fluid or cerebral tissue for measuring analytes not otherwise provided for, e.g. ions, cytochromes
-
- A—HUMAN NECESSITIES
- A61—MEDICAL OR VETERINARY SCIENCE; HYGIENE
- A61B—DIAGNOSIS; SURGERY; IDENTIFICATION
- A61B5/00—Measuring for diagnostic purposes; Identification of persons
- A61B5/145—Measuring characteristics of blood in vivo, e.g. gas concentration or pH-value ; Measuring characteristics of body fluids or tissues, e.g. interstitial fluid or cerebral tissue
- A61B5/1455—Measuring characteristics of blood in vivo, e.g. gas concentration or pH-value ; Measuring characteristics of body fluids or tissues, e.g. interstitial fluid or cerebral tissue using optical sensors, e.g. spectral photometrical oximeters
-
- A—HUMAN NECESSITIES
- A61—MEDICAL OR VETERINARY SCIENCE; HYGIENE
- A61K—PREPARATIONS FOR MEDICAL, DENTAL OR TOILETRY PURPOSES
- A61K47/00—Medicinal preparations characterised by the non-active ingredients used, e.g. carriers or inert additives; Targeting or modifying agents chemically bound to the active ingredient
- A61K47/50—Medicinal preparations characterised by the non-active ingredients used, e.g. carriers or inert additives; Targeting or modifying agents chemically bound to the active ingredient the non-active ingredient being chemically bound to the active ingredient, e.g. polymer-drug conjugates
- A61K47/51—Medicinal preparations characterised by the non-active ingredients used, e.g. carriers or inert additives; Targeting or modifying agents chemically bound to the active ingredient the non-active ingredient being chemically bound to the active ingredient, e.g. polymer-drug conjugates the non-active ingredient being a modifying agent
- A61K47/52—Medicinal preparations characterised by the non-active ingredients used, e.g. carriers or inert additives; Targeting or modifying agents chemically bound to the active ingredient the non-active ingredient being chemically bound to the active ingredient, e.g. polymer-drug conjugates the non-active ingredient being a modifying agent the modifying agent being an inorganic compound, e.g. an inorganic ion that is complexed with the active ingredient
-
- A—HUMAN NECESSITIES
- A61—MEDICAL OR VETERINARY SCIENCE; HYGIENE
- A61B—DIAGNOSIS; SURGERY; IDENTIFICATION
- A61B2560/00—Constructional details of operational features of apparatus; Accessories for medical measuring apparatus
- A61B2560/02—Operational features
- A61B2560/0223—Operational features of calibration, e.g. protocols for calibrating sensors
-
- A—HUMAN NECESSITIES
- A61—MEDICAL OR VETERINARY SCIENCE; HYGIENE
- A61B—DIAGNOSIS; SURGERY; IDENTIFICATION
- A61B5/00—Measuring for diagnostic purposes; Identification of persons
- A61B5/0059—Measuring for diagnostic purposes; Identification of persons using light, e.g. diagnosis by transillumination, diascopy, fluorescence
- A61B5/0077—Devices for viewing the surface of the body, e.g. camera, magnifying lens
Definitions
- the present invention relates to the monitoring of biological substances, for examples non-invasive monitoring in animals, such as monitoring biomarkers, metabolites, proteins, enzymes and cytokines,. Specifically, the invention further relates to such monitoring using rare earth metal-conjugated marker compounds. The invention further relates to such monitoring using spectroscopic methods, such as laser spectroscopy or Raman spectroscopy. The invention further relates to the use of such monitoring in disease states, such as cardiovascular, microvascular and macrovascular diseases, neuropsychiatric diseases, neurological diseases and cancer. The invention further relates to novel rare-earth metal-conjugated marker compounds and processes for their preparation.
- Cardiovascular diseases and stroke and related neurological diseases are the major causes of death and long-term disability throughout the world. As major risk factors, atherosclerosis and diabetes contribute substantially to these medical conditions. Although MRI, CAT scans and ultrasound are used at major hospitals for imaging and are supplemented by NMR, FT-IR or mass spectroscopy for chemical analysis, they are not suitable for the "point-of-care" where the early diagnosis may benefit primary prevention and treatment of these diseases. At present there is no easily accessible diagnosis for warning potential patient population which enables identification of onset and occurrence of these diseases. The poor prognosis of patients suffering from stroke, cardiac ischemia or cancer results from the lack of early diagnosis and effective therapies.
- One approach is based on non-invasive trans-cutaneous measurement, for example using laser spectroscopy, of metabolites/enzymes which have been conjugated with rare-earth metals for enabling strong signal generation for transcutaneous analysis for example, when excited with an external laser source thus providing novel pathways for non-invasive detection and imaging through skin.
- measurement may be made in vivo or in a sample of biological material obtained from said animal.
- samples of biological material include blood, serum, urine, biopsied material etc.
- Non-invasive measurements can be made at any point of an animal suitable for excitation and detection of the rare earth metal-conjugated marker, for example points adjacent to a blood vessel such as superficial blood vessels or the carotid artery or adjacent to organs of the animal body.
- the measurement of a disease condition includes the detection and/or the measurement of the progression of and/or predicting the risk of developing such a disease condition.
- one or more rare earth conjugated marker may be use to measure one or more metabolites. Where more than one metabolites is measured markers may be conjugated to different rare earth metals to aid in resolving different metabolites.
- Disease conditions comprise any disease condition for which a rare-earth tagged marker facilitates the detection and/or measurement of the progression of and/or predicting the risk of a disease.
- the disease condition is selected from: cardiovascular diseases, neuropsychiatric diseases, neurological diseases and cancer.
- Cardiovascular disease is used to classify numerous conditions that affect the heart, heart valves, blood, and vasculature of the body, including coronary artery disease (CAD).
- Cardiovascular diseases include endothelial dysfunction, coronary artery disease, carotid artery disease, angina pectoris, myocardial infarction, atherosclerosis, congestive heart failure, hypertension, cerebrovascular disease, stroke, transient ischemic attacks, deep vein thrombosis, peripheral artery disease, cardiomyopathy, arrhythmias, aortic stenosis, and aneurysm.
- Such diseases frequently involve atherosclerosis.
- neurological diseases include: Alzheimer's disease, mild cognitive impairment, dementia, age-related cognitive decline, stroke, traumatic brain injury, spinal cord injury.
- neuropsychiatric diseases including depression, anxiety, schizophrenia and the like and conditions which show nerve cell dysfunction leading to cognitive, behavioral, and mood disorders.
- Markers conjugated to rare earth metals are suitable for measurement in-vitro and in-vivo in most animal tissues and body fluids.
- Examples include brain tissue such as brain homogenates and brain tumour tissue, cerebrospinal fluid, ischemic tissue such as ischemic cardiac tissue, ischemic optic nerve and ischemic artery, vein and blood vessels, atherosclerotic tissue, cancer tissue, blood, urine.
- Methods of the invention can be used to measure both large molecules, such a proteins and small molecules such as amino acids both in-vitro and in-vivo, particularly in the non-invasive measurement of molecules in-vivo.
- large molecules such as proteins and small molecules such as amino acids both in-vitro and in-vivo, particularly in the non-invasive measurement of molecules in-vivo.
- small molecules such as amino acids both in-vitro and in-vivo, particularly in the non-invasive measurement of molecules in-vivo.
- small molecules such as amino acids both in-vitro and in-vivo, particularly in the non-invasive measurement of molecules in-vivo.
- examples of such molecules include:
- Such molecules can be used in the detection and/or diagnosis of a number of disease conditions, for example:
- detection and/or diagnosis of a disease condition may be facilitated by the measurement of one molecules or more than one molecule.
- the rare earth metal is selected from: Ce 4+,3+ , Yb 3+ , Eu 3+ , Sm 3+ , Tm 3+ , Tb 3+ , Er 3+ , Ho 3+ , Dy 3+ , Pr 3+ and Nd 3+ .
- the rare earth metal is selected from: cerium, europium and ytterbium.
- a method for the non-invasive measurement of a metabolite in an animal which comprises:
- Administration of a rare earth conjugated marker may be by any suitable route for example, orally or by injection.
- Non-invasive analysis of metabolites using rare-earth tagged molecules can be used to direct therapy.
- a method of treating a disease comprising using a rare earth metal-conjugated marker to detect the level or change in level of a metabolite and using the level or change in level of the metabolite to direct therapy.
- a pathological areas comprises areas where tissue may be removed to aid in treatment of a patient. Such areas include cancerous tissue and atherosclerotic tissue.
- Treatment of a disease condition comprises an activity directed by a medical practitioner, such as a doctor or nurse, for example, administration of a pharmacologically active substance, reducing or increasing the dose of a pharmacologically active substance, ceasing administration of a pharmacologically active substance or hospitalisation, defining appropriate surgical intervention or defining the site of surgical intervention.
- a pharmacologically active substance may comprise one or more pharmacologically active substances.
- a photoluminescence intensity ratio (PLIR) imaging technique may be used to calculate the level or a change in level of the metabolite.
- the PLIR imaging technique may be used to detect biomarkers indicative of disease in a given medium, more preferably to detect the amounts of biomarkers indicative of disease in a given medium.
- PLIR may be used to detect the one or more biomarker for atherosclerosis.
- the or each biomarker may be any suitable biomarker indicative of atherosclerosis.
- the or each biomarker may be phospholipids and/or lactic acids, suitably, lactic acid.
- the or each biomarker may be conjugated with any suitable rare earth metal.
- the rare earth metal is selected from one or more of Ce 4+,3+ , Yb 3+ , Eu 3+ , Sm 3+ , Tm 3+ , Tb 3+ , Er 3+ , Ho 3+ , Dy 3+ , Pr 3+ or Nd 3+ , particularly preferred being Eu 3+ .
- the photoluminescence intensity ratio (PLIR) for Eu 3+ -conjugated lactic acid is defined as I 616 /I 591 , i.e. the ratio of the intensity of the fluorescence emission peak at 616nm to the intensity of the fluorescence emission peak at 591nm. Emission at 616nm gives rise to red light and emission at 591nm gives rise to yellow light. An increase in the fluorescence emission at 616nm will lead to an increase in the PLIR and resulting images will appear more red in colour.
- a plot of PLIR versus lactic acid concentration, at a given Eu 3+ concentration, can be used as a calibration for the determination of the concentration of lactic acid based on the measured PLIR.
- the lactic acid concentration may be given in any suitable form. Preferably the lactic acid concentration is given as a molar fraction. Under either high lactic acid concentrations or low lactic acid concentrations, an increase in lactic acid concentration will lead to an increase in PLIR and the resulting images will appear more red in colour.
- the above mentioned method is not limited to the detection of Eu 3+ conjugated lactic acid. It will be clear to a person skilled in the art that the emission wavelengths used to calculate the PLIR will change depending on the rare earth metal and/or the metabolite.
- Eu 3+ for use in the treatment of a disease condition in an animal comprising:
- rare earth tagged molecules were not toxic to cells.
- the rare earth tagged molecules were cytoprotective for cells.
- a rare earth tagged markers as a cytoprotective.
- rare earth metal conjugated compounds are prepared by mixing a salt of a rare earth metal (for example, a nitrate salt, an acetate salt or a chloride salt) with said compound in a suitable solvent such as water or a suitable buffer followed by separation of the rare earth metal conjugated compound from the free rare earth metal ions.
- a salt of a rare earth metal for example, a nitrate salt, an acetate salt or a chloride salt
- Rare earth tagged markers are be measured by Raman spectroscopy or Laser spectroscopy.
- the imaging system may utilize single or plurality, monochromatic or multi-wavelength (e.g. white light) light(s) for imaging. Images may be detected by a 2-D sensor, or camera for real-time targeting and feedback on a surface, or subsurface of tissue.
- monochromatic or multi-wavelength e.g. white light
- Raman spectroscopy has been used for many years to probe the molecular structure and biochemistry of various biological tissues [ Motz et al, (2005) J. Biomed. Opt 10:1-7 .].
- the technique relies on inelastic scattering, or Raman scattering, of UV, visible or near-infrared light to provide information about the concentration of and the structure, bonding and local environment in organic and inorganic species by recording a spectrum of characteristic peaks due to their molecular vibrations.
- Raman scattering can also be excited by X-ray radiation that is commonly available from synchrotron sources [ de Groot (2001) Chemical Reviews 101: 1779-1808 ].
- the vibrational spectrum is excited by illuminating a sample with monochromatic light that is usually provided by a laser.
- the incident probe laser light beam is focused on or inside the sample using a lens, or alternatively directed to the sample using an optical fibre.
- the light beam interacts with the sample, producing vibrational excitations that result in the incident laser wavelength and energy being shifted away from their initial values by small amounts corresponding to the vibrational energies of the sample.
- the result is a scattering of radiation from the excited region within the sample containing the spectrum of inelastically or Raman scattered wavelengths that correspond to the vibrational spectrum.
- Laser spectroscopy refers to a branch of spectroscopy in which a laser is used as an intense, monochromatic light source; using tunable lasers and other types of coherent emission sources, such as optical parametric oscillators. This allows selective excitation of atomic or molecular species. increasing the resolution and sensitivity of conventional spectroscopic techniques. For more information the reader is referred to:
- Spectroscopic methods of the invention use wavelengths in the range about 600nm to about 2100nm.
- wavelengths which utilise the optical transparency of mammalian skin (about 600 to about 1400 nm) window In further embodiments:
- energies up to about 500mW can be used with methods of the invention. Although when a focussed laser are used energies less than 50mW are usually used. For example in the range about 1mW to about 50mW, such as about 1mW to about 25mW, about 1mW to about 10mW, about 10mW to about 20mW.
- 'about' when used in this specification refers to a tolerance of ⁇ 10%, of the stated value, i.e. about 50% encompasses any value in the range 45% to 55%, In further embodiments 'about' refers to a tolerance of ⁇ 5%, ⁇ 2%, ⁇ 1%, ⁇ 0.5%, ⁇ 0.2% or 0.1% of the stated value.
- 'animal' refers to any biological organism, for example, a mammal, such as humans, non-human primates such as monkeys, dogs, cats, horses, sheep, goats, cows, rabbits, pigs and rodents, for example mice and rats.
- the animal is a human.
- the animal is a mouse or a rat.
- 'cytoprotective' refers to a chemical compounds which protects cells against harmful agents. For example, the protection of cells against free radicals.
- laser-based analysis refers to any technique which comprises applying a laser to a biological material and measuring the energy absorbed/scattered or energy emitted from the material, for example inputting energy at a first wavelength and measuring energy emitted at a second wavelength or across a range of wavelengths.
- laser based analysis include laser spectroscopy and Raman spectroscopy.
- the term 'marker' refers to any compound which facilitates measurement of a metabolite, for example a metabolite conjugated to a rare earth metal.
- 'metabolite' refers to any molecule within the animal body involved in the biochemical processes of said animal, for example small molecules with a molecular weight of less than 500 Daltons such as glucose and lactate, peptides, lipids and proteins.
- the term 'rare earth element' or 'rare earth metal' refers to a set of seventeen chemical elements in the periodic table, specifically the fifteen lanthanides plus scandium and yttrium.
- the rare earth elements comprise: Cerium (Ce), Dysprosium (Dy), Erbium (Er), Europium (Eu), Gadolinium (Gd), Holmium (Ho), Neodymium (Nd), Praseodymium (Pr), Samarium (Sm), , Terbium (Tb), Thulium (Tm) and Ytterbium (Yb).
- 'small molecule metabolite' refers to a metabolite with a molecular weight of less than 500 Daltons.
- 'mole fraction' refers to the ratio of the number of moles of a substance in a mixture or solution to the total number of moles of all the components in the mixture or solution.
- PLIR photoluminescence intensity ratio
- Yb(NO 3 ) 3 solutions were prepared in phosphate buffered saline (PBS, pH7.2) varying from 0.01M to 1M without any significant change from the initial pH of the buffer solution.
- PBS phosphate buffered saline
- the wavelength of maximum absorption of Yb(NO 3 ) 3 dissolved in 7.2pH buffer was consistent for all the concentrations analysed, with 7 concentrations having a maximum peak at 970nm and the remaining 3 at 971nm. It was clear from the initial pH trial that Yb(NO 3 ) 3 is a hydrogen donor, which is why as its concentration increases in water, the pH of its solutions decreases.
- Yb(NO 3 ) 3 is adequately buffered in the 7.2pH buffer to remain within the target range (6.5 -7.5 pH) for the highest concentration of ytterbium solution that is intended to be used (1M).
- phospholipid L- ⁇ -Lecithin, Egg Yolk (from Merck Chemicals Ltd)
- 100 ⁇ M solutions were prepared either in distilled deionised water or in a cell culture medium of supplemented Ham's F 12 medium and Eagle's minimal essential medium as, described as SH, by Webster et al. (2004, Brain Res Mol Brain Res, 130: 161-169 ).
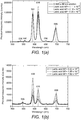
- FIG. 1(a) shows the Fluorescence emission spectra of 0.5M europium nitrate alone and when coupled with lactic acid with, lactic acid in lower concentration when excited at 395 nm.
- Figure 1(b) shows the Fluorescence emission spectra of 0.5M europium nitrate alone and when coupled with lactic acid where the lactic acid is in higher concentration when excited at 395 nm.
- the photoluminescence intensity ratio (PLIR), defined by the ratio of the fluorescence intensity at 616 nm to the fluorescence intensity at 591 nm (I 616 /I 591 ) and may represent the chemical environment of the Eu 3+ ion. As shown in Figures 1(a) and 1(b) , the PLIR reverses when the mole fraction of lactic acid is very high compared to when the mole fraction is low, such that the PLIR >1 at low lactic acid concentrations and the PLIR ⁇ 1 at high lactic acid concentrations.
- Figure 1(a) shows that the main peak emission of Eu 3+ conjugated-lactic acid is at 616nm when the concentration of lactic acid expressed in mole fraction is less than about 5x10 -6 . Therefore, at low concentrations of lactic acid the PLIR is greater than 1, as plotted in Figure 7(a).
- Figure 7(a) also shows the corresponding PLIR variation with the europium nitrate mole fraction which is around 9x10 -3 . The plot shown in Figure 7(a) can therefore be used for calibration of the amount of lactic acid based on the measured PLIR under these conditions. When the fluorescence image is recorded under these conditions the image will be predominately reddish as shown in Figure 6(c) .
- Figure 1(b) shows the photoluminescence intensity when the mole fraction of lactic acid is at higher concentrations and the corresponding PLIR is plotted in Figure 7(b) .
- the main peak fluorescence emission of Eu 3+ conjugated-lactic acid is at 593nm when the concentration of lactic acid expressed in mole fraction is of the order of 10 -3 . Therefore, at high concentrations of lactic acid the PLIR is less than 1, as plotted in Figure 7(b) .
- the plot shown in Figure 7(b) can therefore be used for calibration of the amount of lactic acid based on the measured PLIR under these conditions.
- the image will be yellowish as shown in Figure 6(b) and the spectrum peaks at 593nm instead of 616 nm as shown in Figure 1(b) .
- the MTT Cell Proliferation Assay is a colorimetric assay system which measures the reduction of a yellow tetrazolium component (MTT) into an insoluble purple formazan product by the mitochondria of viable cells which are solubilized by the addition of a detergent, The colour can then be quantified by spectrophotometric means. For each cell type a linear relationship between cell number and absorbance is established, enabling accurate, straightforward quantification of changes in proliferation.
- MTT Cell Proliferation Assay is a colorimetric assay system which measures the reduction of a yellow tetrazolium component (MTT) into an insoluble purple formazan product by the mitochondria of viable cells which are solubilized by the addition of a detergent, The colour can then be quantified by spectrophotometric means. For each cell type a linear relationship between cell number and absorbance is established, enabling accurate, straightforward quantification of changes in proliferation.
- MTT yellow tetrazolium component
- Human neuroblastoma cells from the SH-SY5Y cell-line (European Collection of Cell Cultures, Porton Down, Wiltshire, UK), of passage 8 to 10). These were cultured in SH medium (see Example 1) in 500ml tissue culture flasks under incubation at 37°C until the confluence was deemed at least 75% under microscopic analysis. Twenty-four hours before the cells were needed for treatment, cells were cultured in 96-well plates to approximately 50% confluency or greater. Experiments were carried out when all of the cell groups showed a similar confluency when viewed under the microscope.
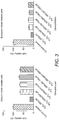
- cerium nitrate is a more potent antioxidant-based cytoprotective agent compared to europium nitrate. The results are shown in Figure 3 .
- SH-SY5Y cells were grown as above, harvested in PBS without Ca 2+ or Mg 2+ and subcultured on glass coverslips. After 3-4 days in culture cells were washed in PBS then fixed in 4% paraformaldehyde. After three 10 minute washes in PBS cells were permeabilized with 0.02% Triton-X100 in PBS supplemented with 10% goat serum. The cells were then incubated at 4°C, overnight in the presence of 1000 ⁇ M cerium nitrate and 1000 ⁇ M europium nitrate solution. Cells untreated with either cerium nitrate or europium nitrate were used as a control.
- mice were killed by decapitation under appropriate anaesthesia. Brains, arteries and blood were removed, rapidly frozen on dry ice and stored at -80°C for conjugation study. Conjugation of cerium and europium with mouse brain tissue and atherosclerotic tissue was obtained by homogenising 50mg of tissue in Tris saline buffer (pH7.4) and mixing with different dilutions (1 ⁇ M, 10uM, 100 ⁇ M) of the europium nitrate and cerium nitrate. The mixers were kept on a shaker table for 24 hours. The tissue was then mounted onto a slide and coverslipped using Vectashield mounting medium and examined using a Zeiss laser scanning confocal microscope (LSM 510).
- LSM 510 Zeiss laser scanning confocal microscope
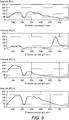
- Fluorescence emission spectrum of europium nitrate was obtained by exciting with a diode laser of 405nm and it gives 3 emissions at 448 nm, 535 nm and 588nm. Thereafter conjugation of the europium with phospholipids was assessed by first mixing phospholipids with 100 ⁇ M europium nitrate analysing under confocal microscope. Two emissions were observed i.e. at 448nm and 674 nm shown in Figure 5 , Therefore, europium conjugation with phospholipids will give two emission peaks near 448nm and 674nm.
- Brain tissue exposed to 0. 1 ⁇ M concentration of europium nitrate showed a large number of fluorescent peaks ( ⁇ 10 peaks in a 100 ⁇ m 2 area) as shown in Figure 11(a) .
- the white circles indicate Eu 3+ ions which are conjugated to lipid regions of the brain. This was more than that seen in brain tissue exposed to 1mM of europium nitrate solution ( Figure 11 (b) ).
- the brain tissue controls did not show any evidence of fluorescence under the microscope ( Figure 11(a) ).
- mice For this 10- to 1.2-week-old (25-30 g) C57BL/6J mice (Harlan-Olac, Bicester, UK) recived intraperitoneal injection of 02.ml of 100 ⁇ M europium nitrate in distilled water). After 24 hours mice were perfused transcardially with 0.9% saline followed by 4% paraformaldehyde. Brains, arteries, heart, liver kidneys were removed, post-fixed and 50 ⁇ m sections were cut on a vibratome (Leica Microsystems, Germany) The sections were mounted on slides, dried at 4°C, cover slipped using vectashield mounting medium and examined using a Zeiss laser scanning confocal microscope (LSM 510).
- LSM 510 Zeiss laser scanning confocal microscope
- the confocal image of mouse artery showed some spots with blue emissions. Fluorescence spectra were obtained and the spectra was compare with aq europium nitrate as shown in the Figure 8 and similar peak emission are observed which shows that europium is conjugating to the endothelial tissue in artery. Following intra peritoneal injection of rare earth ions, all the mice appeared completely healthy and behaved normally. For the mice injected with europium nitrate solution, a very low level of europium ions were found to be present in the cardiac and lung, tissue with the highest number of peaks seen in a 100 ⁇ m 2 area being ⁇ 1 for both the heart and lung tissue.
- the liver tissue showed a much higher concentration of fluorescence than the heart and lung tissue, with the highest number of fluorescent peaks in a 1 00 ⁇ m 2 area being ⁇ 10. At higher magnifications it was evident that the europium ions had entered the hepatocytes in the liver tissue.
- the brain tissue also showed a large amount of fluorescence under the microscope, with the highest number of fluorescent peaks per 100 ⁇ m 2 area being ⁇ 20.
- the carotid artery of an atherosclerotic mouse was conjugated with europium nitrate solution (100 ⁇ M) dissolved in Tris saline buffer, mounted onto a slide and a coverslip added using vectashield mounting medium. Sections were viewed on an Axiolmager Z.1 epifluorescence microscope (Carl Zeiss, Welwyn Garden City, UK).
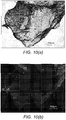
- Figure 10(b) shows a fluorescent image with DAPI filter which allows the emission range of 470-500nm
- the white circles seen in Figure 10(a) indicate the conjugation of the europium with lipid regions of the artery which can be compared to the blue marks in the Fluorescence microscope image shown in Figure 10(b) .
- IP injection of europium and cerium nitrate solution we have found europium and cerium labelling in the brain tissue ( Figure 9 ) suggesting that these lanthanides cross the blood brain barrier.
Landscapes
- Health & Medical Sciences (AREA)
- Life Sciences & Earth Sciences (AREA)
- Physics & Mathematics (AREA)
- Engineering & Computer Science (AREA)
- Veterinary Medicine (AREA)
- Public Health (AREA)
- General Health & Medical Sciences (AREA)
- Animal Behavior & Ethology (AREA)
- Biomedical Technology (AREA)
- Pathology (AREA)
- Molecular Biology (AREA)
- Heart & Thoracic Surgery (AREA)
- Surgery (AREA)
- Medical Informatics (AREA)
- Biophysics (AREA)
- Epidemiology (AREA)
- Chemical & Material Sciences (AREA)
- Spectroscopy & Molecular Physics (AREA)
- Optics & Photonics (AREA)
- Diabetes (AREA)
- Endocrinology (AREA)
- Gastroenterology & Hepatology (AREA)
- Rheumatology (AREA)
- Toxicology (AREA)
- Urology & Nephrology (AREA)
- Inorganic Chemistry (AREA)
- Bioinformatics & Cheminformatics (AREA)
- Medicinal Chemistry (AREA)
- Pharmacology & Pharmacy (AREA)
- Investigating, Analyzing Materials By Fluorescence Or Luminescence (AREA)
- Investigating Or Analysing Biological Materials (AREA)
Description
- The present invention relates to the monitoring of biological substances, for examples non-invasive monitoring in animals, such as monitoring biomarkers, metabolites, proteins, enzymes and cytokines,. Specifically, the invention further relates to such monitoring using rare earth metal-conjugated marker compounds. The invention further relates to such monitoring using spectroscopic methods, such as laser spectroscopy or Raman spectroscopy. The invention further relates to the use of such monitoring in disease states, such as cardiovascular, microvascular and macrovascular diseases, neuropsychiatric diseases, neurological diseases and cancer. The invention further relates to novel rare-earth metal-conjugated marker compounds and processes for their preparation.
- Cardiovascular diseases and stroke and related neurological diseases are the major causes of death and long-term disability throughout the world. As major risk factors, atherosclerosis and diabetes contribute substantially to these medical conditions. Although MRI, CAT scans and ultrasound are used at major hospitals for imaging and are supplemented by NMR, FT-IR or mass spectroscopy for chemical analysis, they are not suitable for the "point-of-care" where the early diagnosis may benefit primary prevention and treatment of these diseases. At present there is no easily accessible diagnosis for warning potential patient population which enables identification of onset and occurrence of these diseases. The poor prognosis of patients suffering from stroke, cardiac ischemia or cancer results from the lack of early diagnosis and effective therapies.
- We have developed laser-based methods for analysis of biomarkers in disease conditions such as cardiovascular, stroke and neuronal diseases. One approach is based on non-invasive trans-cutaneous measurement, for example using laser spectroscopy, of metabolites/enzymes which have been conjugated with rare-earth metals for enabling strong signal generation for transcutaneous analysis for example, when excited with an external laser source thus providing novel pathways for non-invasive detection and imaging through skin.
- In a first embodiment there is provided a method for the measurement of one or more metabolites in an animal according to
claim 1.. - In a further aspect of the first embodiment there is provided a method for the measurement of a disease condition according to the claims.
- In the first embodiment measurement may be made in vivo or in a sample of biological material obtained from said animal. Examples of samples of biological material include blood, serum, urine, biopsied material etc.
- In a further embodiment there is provided a method for the non-invasive measurement of one or more metabolites in an animal comprising the measurement of a rare earth metal-conjugated marker according to the claims.
- In a further embodiment there is provided a method for the non-invasive measurement of a disease condition comprising the measurement of a rare earth metal-conjugated marker according to the claims.
- In a further embodiment there is provided a method for the continuous in-vivo non-invasive measurement of one or more metabolites in an animal comprising the measurement of a rare earth metal-conjugated marker according to the claims.
- In a further embodiment there is provided for the continuous in-vivo non-invasive measurement of a disease condition comprising the measurement of a rare earth metal-conjugated marker according to the claims.
- Non-invasive measurements can be made at any point of an animal suitable for excitation and detection of the rare earth metal-conjugated marker, for example points adjacent to a blood vessel such as superficial blood vessels or the carotid artery or adjacent to organs of the animal body.
- For the avoidance of doubt the measurement of a disease condition includes the detection and/or the measurement of the progression of and/or predicting the risk of developing such a disease condition.
- For the avoidance of doubt in methods of the invention one or more rare earth conjugated marker may be use to measure one or more metabolites. Where more than one metabolites is measured markers may be conjugated to different rare earth metals to aid in resolving different metabolites.
- Disease conditions comprise any disease condition for which a rare-earth tagged marker facilitates the detection and/or measurement of the progression of and/or predicting the risk of a disease. In one embodiment the disease condition is selected from: cardiovascular diseases, neuropsychiatric diseases, neurological diseases and cancer.
- Cardiovascular disease (CVD) is used to classify numerous conditions that affect the heart, heart valves, blood, and vasculature of the body, including coronary artery disease (CAD). Cardiovascular diseases include endothelial dysfunction, coronary artery disease, carotid artery disease, angina pectoris, myocardial infarction, atherosclerosis, congestive heart failure, hypertension, cerebrovascular disease, stroke, transient ischemic attacks, deep vein thrombosis, peripheral artery disease, cardiomyopathy, arrhythmias, aortic stenosis, and aneurysm. Such diseases frequently involve atherosclerosis.
- Examples of neurological diseases include: Alzheimer's disease, mild cognitive impairment, dementia, age-related cognitive decline, stroke, traumatic brain injury, spinal cord injury. Examples of neuropsychiatric diseases including depression, anxiety, schizophrenia and the like and conditions which show nerve cell dysfunction leading to cognitive, behavioral, and mood disorders.
- Markers conjugated to rare earth metals are suitable for measurement in-vitro and in-vivo in most animal tissues and body fluids. Examples include brain tissue such as brain homogenates and brain tumour tissue, cerebrospinal fluid, ischemic tissue such as ischemic cardiac tissue, ischemic optic nerve and ischemic artery, vein and blood vessels, atherosclerotic tissue, cancer tissue, blood, urine.
- Methods of the invention can be used to measure both large molecules, such a proteins and small molecules such as amino acids both in-vitro and in-vivo, particularly in the non-invasive measurement of molecules in-vivo. Examples of such molecules include:
- (i) Amino acids and related compounds such as taurine, glutamine, N-acetyl-L-asparate (NAA), homocysteine
- (ii) Lipids such as phospholipids e.g. phosphatidylcholine and related intermediates such phosphocholine;
- (iii) Lipid binding proteins such as lipoprotein A, HDL, LDL;
- (iv) Peptides/ Proteins such as PARK 7, Nucleoside Diphosphate Kinase A (NDKA), amyloid beta peptide, Tau (e.g. hyperphosphorylated Tau), CD68, CD64, carcino-embryonic antigen (CEA), tumor-associated glycoprotein 72 (Tag72), folate receptor-α,, Alpha actin, Toll-like receptors (TLRs) Creatine, Creatinine, amyloid precursor protein (APP), troponin, C-reactive protein, Fibrinogen, B-type natriuretic peptide (BNP)
- (v) Enzymes such as phospholipases such as phosopholipase A2, β-secretase, γ-secretase, succinate dehydrogenase (SDH), fumarate hydratase (FH), neprilysin (NEP), endothelin-converting enzyme (ECE), insulysin (IDE), angiotensin-converting enzyme (ACE) and matrix metalloproteinases 1-9 (MMP 1-9), Creatine kinase (CK), creatine kinase isoenzyme MB (CKMB)
- (vi) Cytokines such as IL(1-6) and TNFα;
- (vii) Other small molecule metabolites such as lactate, glucose, acetyladehyde hydrate, acetate, choline, inositol
Note MMP 1-9 refers tomatrix metalloproteinase 1,matrix metalloproteinase 2 andmatrix metalloproteinase 3 etc up to and including matrix metalloproteinase 9.
Note IL(1-6) refers tointerleukin 1,interleukin 2,interleukin 3 etc up to and including interleukin 6. - Such molecules can be used in the detection and/or diagnosis of a number of disease conditions, for example:
- Cardiac disease: C-reactive protein, Creatine kinase (CK), creatine kinase isoenzyme MB (CKMB), troponin;
- Stroke: PARK 7, Nucleoside Diphosphate Kinase A (NDKA), phospholipases such as phosopholipase A2, homocysteine;
- Atherosclerosis: CD68, phosopholipase A2, Lipopronin, endothelin-converting enzyme (ECE);
- Alzheimer's disease/vascular dementia: amyloid precursor protein (APP), β-secretase, γ-secretase, amyloid beta peptide, Tau (e.g. hyperphosphorylated Tau);
- Cancer: succinate dehydrogenase (SDH), fumarate hydratase (FH), carcino-embryonic antigen (CEA), tumor-associated glycoprotein 72 (Tag72), folate receptor-α.
- In methods of the invention, detection and/or diagnosis of a disease condition may be facilitated by the measurement of one molecules or more than one molecule.
- In methods of the invention measurement of molecules in the millimolar and micromolar range is envisaged. In addition, measurement of molecules in the picomolar range is envisaged.
- In one embodiment the rare earth metal is selected from: Ce4+,3+, Yb3+, Eu3+, Sm3+, Tm3+, Tb3+, Er3+, Ho3+, Dy3+, Pr3+ and Nd3+. In a further embodiment the rare earth metal is selected from: cerium, europium and ytterbium.
- In a further embodiment of the invention, there is provided a method for the non-invasive measurement of a metabolite in an animal which comprises:
- (i) administering a rare-earth tagged metal marker to said animal;
- (ii) optically coupling a body part of said animal with a light source and a light detector;
- (iii) detecting a rare earth metal-conjugated marker to generate an optical signal; and
- (iv) processing said optical signal to calculate a level or change in level of the metabolite;
and optionally:correlating the level or change in level of said metabolite to a disease condition, wherein the measurement uses laser spectroscopy or Raman spectroscopy, and wherein the excitation and measurement are in the range of about 600nm to about 2100nm. - Administration of a rare earth conjugated marker may be by any suitable route for example, orally or by injection.
- In a further embodiment of the invention there is provided a method for the non-invasive measurement of a metabolite in an animal which comprises:
- (i) optically coupling a body part of said animal with a light source and a light detector;
- (ii) detecting a rare earth metal-conjugated marker to generate an optical signal; and
- (iii) processing said optical signal to calculate a level or change in level of the metabolite;
- Non-invasive analysis of metabolites using rare-earth tagged molecules can be used to direct therapy.
- Therefore, according to a further aspect of the invention there is provided a method of treating a disease comprising using a rare earth metal-conjugated marker to detect the level or change in level of a metabolite and using the level or change in level of the metabolite to direct therapy.
- A pathological areas comprises areas where tissue may be removed to aid in treatment of a patient. Such areas include cancerous tissue and atherosclerotic tissue.
- Treatment of a disease condition comprises an activity directed by a medical practitioner, such as a doctor or nurse, for example, administration of a pharmacologically active substance, reducing or increasing the dose of a pharmacologically active substance, ceasing administration of a pharmacologically active substance or hospitalisation, defining appropriate surgical intervention or defining the site of surgical intervention.
- For the avoidance of doubt a pharmacologically active substance may comprise one or more pharmacologically active substances.
- In one embodiment of the present invention a photoluminescence intensity ratio (PLIR) imaging technique may be used to calculate the level or a change in level of the metabolite. In a preferred embodiment the PLIR imaging technique may be used to detect biomarkers indicative of disease in a given medium, more preferably to detect the amounts of biomarkers indicative of disease in a given medium.
- In a non-limiting example PLIR may be used to detect the one or more biomarker for atherosclerosis. The or each biomarker may be any suitable biomarker indicative of atherosclerosis. For example, in one embodiment the or each biomarker may be phospholipids and/or lactic acids, suitably, lactic acid. The or each biomarker may be conjugated with any suitable rare earth metal. Preferably, the rare earth metal is selected from one or more of Ce4+,3+, Yb3+, Eu3+, Sm3+, Tm3+, Tb3+, Er3+, Ho3+, Dy3+, Pr3+ or Nd3+, particularly preferred being Eu3+.
- The photoluminescence intensity ratio (PLIR) for Eu3+-conjugated lactic acid is defined as I616/I591, i.e. the ratio of the intensity of the fluorescence emission peak at 616nm to the intensity of the fluorescence emission peak at 591nm. Emission at 616nm gives rise to red light and emission at 591nm gives rise to yellow light. An increase in the fluorescence emission at 616nm will lead to an increase in the PLIR and resulting images will appear more red in colour.
- At lower lactic acid concentrations the main fluorescence peak emission of Eu3+ conjugated to lactic acid is at 616nm. Therefore at low lactic acid concentrations the PLIR >1. At higher lactic acid concentrations the main fluorescence peak emission is at 593 nm. Therefore at high lactic acid concentrations the PLIR <1. A plot of PLIR versus lactic acid concentration, at a given Eu3+ concentration, can be used as a calibration for the determination of the concentration of lactic acid based on the measured PLIR. The lactic acid concentration may be given in any suitable form. Preferably the lactic acid concentration is given as a molar fraction. Under either high lactic acid concentrations or low lactic acid concentrations, an increase in lactic acid concentration will lead to an increase in PLIR and the resulting images will appear more red in colour.
- For the avoidance of doubt the above mentioned method is not limited to the detection of Eu3+ conjugated lactic acid. It will be clear to a person skilled in the art that the emission wavelengths used to calculate the PLIR will change depending on the rare earth metal and/or the metabolite.
- According to yet a further aspect of the present invention there is provided Eu3+ for use in the treatment of a disease condition in an animal comprising:
- (i) administering Eu3+ or a source thereof to said animal;
- (ii) optically coupling a body part of said animal with a light source and a light detector;
- (iii) detecting Eu3+-conjugated lactic acid to generate an optical signal;
- (iv) processing said optical signal to
- a calculate a level or change in level of Eu3+-conjugated lactic acid; and or
- b calculate the position of Eu3+-conjugated lactic acid;
- (v) using said position, level or change in level of lactic acid to aid in treatment of atherosclerosis
wherein the level or change in level of Eu3+-conjugated lactic acid in step (iv) is determined using the photoluminescence intensity ratio (=I616/I591)., and wherein the Eu3+-conjugated lactic acid is detected in step (iii) using laser spectroscopy or Raman spectroscopy, and wherein the excitation and measurement are in the range of about 600nm to about 2100nm. - Contrary to expectation we found that rare earth tagged molecules were not toxic to cells. In fact we observed that the rare earth tagged molecules were cytoprotective for cells. Thus, according to further aspect of the invention there is provided the use of a rare earth tagged markers as a cytoprotective.
- In general rare earth metal conjugated compounds are prepared by mixing a salt of a rare earth metal (for example, a nitrate salt, an acetate salt or a chloride salt) with said compound in a suitable solvent such as water or a suitable buffer followed by separation of the rare earth metal conjugated compound from the free rare earth metal ions.
- Rare earth tagged markers are be measured by Raman spectroscopy or Laser spectroscopy.
- The imaging system may utilize single or plurality, monochromatic or multi-wavelength (e.g. white light) light(s) for imaging. Images may be detected by a 2-D sensor, or camera for real-time targeting and feedback on a surface, or subsurface of tissue.
- Raman spectroscopy has been used for many years to probe the molecular structure and biochemistry of various biological tissues [Motz et al, (2005) J. Biomed. Opt 10:1-7.]. The technique relies on inelastic scattering, or Raman scattering, of UV, visible or near-infrared light to provide information about the concentration of and the structure, bonding and local environment in organic and inorganic species by recording a spectrum of characteristic peaks due to their molecular vibrations. Raman scattering can also be excited by X-ray radiation that is commonly available from synchrotron sources [de Groot (2001) Chemical Reviews 101: 1779-1808]. Typically, the vibrational spectrum is excited by illuminating a sample with monochromatic light that is usually provided by a laser. The incident probe laser light beam is focused on or inside the sample using a lens, or alternatively directed to the sample using an optical fibre. The light beam interacts with the sample, producing vibrational excitations that result in the incident laser wavelength and energy being shifted away from their initial values by small amounts corresponding to the vibrational energies of the sample. The result is a scattering of radiation from the excited region within the sample containing the spectrum of inelastically or Raman scattered wavelengths that correspond to the vibrational spectrum. Further details of the physical nature of the Raman scattering process and its application to understanding or monitoring the vibrational modes and molecular structures in samples and materials with applications including molecular biochemistry, medicine and biology are discussed and described in several standard textbooks including
- (i) Tobin, M. G. 1971. Laser Raman Spectroscopy. Wiley-Interscience, New York.
- (ii) Hendra, P. J., C. Jones, and G. Warnes. 1991. Fourier Transform Raman Spectroscopy. Ellis Harwood, N.Y; and
- (iii) Long, D. A. 2002. The Raman Effect. John Wiley and Sons, New York.
- Laser spectroscopy refers to a branch of spectroscopy in which a laser is used as an intense, monochromatic light source; using tunable lasers and other types of coherent emission sources, such as optical parametric oscillators. This allows selective excitation of atomic or molecular species. increasing the resolution and sensitivity of conventional spectroscopic techniques. For more information the reader is referred to:
- (i) W. Demtröder, Laser Spectroscopy, 3rd Edition. (Springer, 2003).
- Spectroscopic methods of the invention use wavelengths in the range about 600nm to about 2100nm. In particular, wavelengths which utilise the optical transparency of mammalian skin (about 600 to about 1400 nm) window. In further embodiments:
- (i) Excitation in the range of about 600nm to 1300nm;
- (ii) Excitation in the range about 1500 nm to about 2000nm
- (iii) Excitation at about 980nm;
- (iv) Measurement in the range about 800nm to about 1400nm;
- (v) Excitation in the range about 800nm to about 1400nm and measurement in the range about 800nm to about 1400nm;
- (vi) Excitation in the range about 930nm to about 980nm and measurement in the range about 970nm to about 1200nm;
- In general energies up to about 500mW can be used with methods of the invention. Although when a focussed laser are used energies less than 50mW are usually used. For example in the range about 1mW to about 50mW, such as about 1mW to about 25mW, about 1mW to about 10mW, about 10mW to about 20mW.
- The term 'about' when used in this specification refers to a tolerance of ±10%, of the stated value, i.e. about 50% encompasses any value in the range 45% to 55%, In further embodiments 'about' refers to a tolerance of ±5%, ±2%, ±1%, ±0.5%, ±0.2% or 0.1% of the stated value.
- The term 'animal' refers to any biological organism, for example, a mammal, such as humans, non-human primates such as monkeys, dogs, cats, horses, sheep, goats, cows, rabbits, pigs and rodents, for example mice and rats. In one embodiment the animal is a human. In a further embodiment the animal is a mouse or a rat.
- The term 'cytoprotective' refers to a chemical compounds which protects cells against harmful agents. For example, the protection of cells against free radicals.
- The term 'laser-based analysis' refers to any technique which comprises applying a laser to a biological material and measuring the energy absorbed/scattered or energy emitted from the material, for example inputting energy at a first wavelength and measuring energy emitted at a second wavelength or across a range of wavelengths. Examples of laser based analysis include laser spectroscopy and Raman spectroscopy.
- The term 'marker' refers to any compound which facilitates measurement of a metabolite, for example a metabolite conjugated to a rare earth metal.
- The term 'metabolite' refers to any molecule within the animal body involved in the biochemical processes of said animal, for example small molecules with a molecular weight of less than 500 Daltons such as glucose and lactate, peptides, lipids and proteins.
- The term 'rare earth element' or 'rare earth metal' refers to a set of seventeen chemical elements in the periodic table, specifically the fifteen lanthanides plus scandium and yttrium. The rare earth elements comprise: Cerium (Ce), Dysprosium (Dy), Erbium (Er), Europium (Eu), Gadolinium (Gd), Holmium (Ho), Neodymium (Nd), Praseodymium (Pr), Samarium (Sm), , Terbium (Tb), Thulium (Tm) and Ytterbium (Yb).
- The term 'small molecule metabolite' refers to a metabolite with a molecular weight of less than 500 Daltons.
- The term 'mole fraction' refers to the ratio of the number of moles of a substance in a mixture or solution to the total number of moles of all the components in the mixture or solution.
- The term 'photoluminescence intensity ratio (PLIR)' refers to the ratio of the intensity of two different fluorescence emission peaks at a given rare earth metal concentration.
- The following non-limiting examples are described with reference to the following figures.
- Figure 1
- shows the emission spectrum of Eu3+ doped lactic acid in two different concentration ranges:
- (a) the fluorescence emission spectra of 0.5M europium nitrate alone and in the presence of a variation of concentrations of lactic acid when excited at 395 nm. The mole fraction of lactic acid is of the order of 10-6
- (b) the fluorescence emission spectra of 0.5M europium nitrate in the presence of a variation of concentrations of lactic acid when excited at 395 nm. The mole fraction of lactic acid is of the order of 10-3
- Figure 2
- These graphs represent the cell viability of neuroblastoma cells using the MTT assay (Experiment 2) in the presence of a variation of concentrations of ytterbium nitrate for 24 hours (a) and 5 days (b) compared to a control average. The concentrations are plotted on the x-axis where the control population were not administered any ytterbium nitrate. The bar represents the Mean for the viability compared to the control average, with the Standard Error of the Mean also shown above the bar.
For (a) n=32 and for (b) n= 16. All groups were compared with the Mean at a level of significance p<0.05. **=p<0.01. - Figure 3
- shows cytoprotective test results for SH-SY5Y cells treated with cerium or europium nitrate solution for 24 hours after treatment with hydrogen peroxide for 24 hours.
- Figure 4
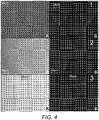
- shows fluorescence microscopy images of untreated SH-SY5Y cells (1), previously treated with 1000µM cerium nitrate for 24 hours (2), and previously treated with 1000µM europium nitrate for 24 hours (3).
- Figure 5
- shows
- (a) confocal image of 100µM aq europium nitrate mixed with phospholipids when excited with diode laser at 405nm
- (b) fluorescence emission spectra for 100µM aq europium nitrate from a confocal image of 100µM aq europium nitrate mixed with phospholipids when excited with diode laser at 405nm.
- Figure 6.
- shows confocal laser scanning microscope images of a phospholipid control (a), Eu3+ conjugated phospholipid (b) and Eu3+ conjugated lactic acid (c). Images were taken in the wavelength range 570 to 650 nm with a diode laser at 405 nm. The image of phospholipids conjugated with Eu3+ is predominantly yellow-orange and that of Eu3+ conjugated lactic acid is predominantly reddish in colour.
- Figure 7;
- shows the photoluminescence intensity ratiometric (PLIR=I616/I591) determination principle.
- (a) Photoluminescence intensity ratio corresponding to PLIR>1 for mole fraction of lactic acid in solution with lactic acid in lower concentration (left Y-axis) and for mole fraction of europium nitrate in solution (right Y-axis).
- (b) Photoluminescence intensity ratio corresponding to PLIR<1 case for mole fraction of lactic acid in solution with lactic acid in higher concentration (left Y-axis) and for mole fraction of europium nitrate in solution (right Y-axis).
- Figure 8
- shows (a) confocal image of (0.2ml) 100µM europium nitrate with mouse artery when excited with diode laser at 405nm. (b) Fluorescence emission spectra for 100µM aq europium nitrate with mouse artery
- Figure 9
- shows Cerebellum sections following IP administration of europium nitrate.
- Figure 10
- shows a mouse carotid artery treated with 100µM europium as seen under:
- (a) bright field microscopy; and
- (b) under fluorescence microscopy using a DAPI filter (which allows emission in the range 470nm-500nm)
- Figure 11
- shows confocal laser scanning microscope images of mouse brain tissue exposed to different concentrations of europium nitrate at 20x magnification. E represents the presence of europium ions.
- (a) 0.1µM europium nitrate (also showing 6x magnification of image)
- (b) 1mM europium nitrate
- (c) control (no europium nitrate)
-
- DAPI
- 4',6-diainidino-2-phenylindole
- MTT
- 3-(4,5-Dimethylthiazol-2-yl)-2,5-Diphenyltetrazolium Bromide
- PBS
- Phosphate-buffered saline
- RE
- Rare earth metal
- UV
- ultraviolet
- VIS
- visible
- For conjugation studies using ytterbium nitrate Yb(NO3)3 this was first dissolved in distilled water (0.01M) which provided a pH of 5.66, outside of the desirable range of 6.5 to 7.5 which is close to physiological ranges. Titration between ytterbium nitrate solution and NaOH was unsuccessfully performed in an attempt to neutralise the acidity.
- Yb(NO3)3 solutions were prepared in phosphate buffered saline (PBS, pH7.2) varying from 0.01M to 1M without any significant change from the initial pH of the buffer solution. When analysed for UV/VIS, the wavelength of maximum absorption of Yb(NO3)3 dissolved in 7.2pH buffer was consistent for all the concentrations analysed, with 7 concentrations having a maximum peak at 970nm and the remaining 3 at 971nm. It was clear from the initial pH trial that Yb(NO3)3 is a hydrogen donor, which is why as its concentration increases in water, the pH of its solutions decreases.
- The results from the final trial suggest that Yb(NO3)3 is adequately buffered in the 7.2pH buffer to remain within the target range (6.5 -7.5 pH) for the highest concentration of ytterbium solution that is intended to be used (1M). For conjugation with phospholipid (L-α-Lecithin, Egg Yolk (from Merck Chemicals Ltd)), 100µM solutions were prepared either in distilled deionised water or in a cell culture medium of supplemented Ham's F 12 medium and Eagle's minimal essential medium as, described as SH, by Webster et al. (2004, Brain Res Mol Brain Res, 130: 161-169). to maintain the physiological environment of the cells and added to 10 ml Yb(NO3)3 solution prepared in PBS (7.2pH). After 24 hr 1µg of 8.4% phospholipase A2 powder from bovine pancreas (Sigma)was manually mixed into Yb(NO3)3 and phospholipid solutions after 10 minutes of thawing from a frozen state at room temperature. This mixing occured within minutes of the analysis to prevent any adaptation, including denaturing, of the enzyme's molecular structure prior to use.
- Europium was also couple to lactate. Measurements were taken and analysed at two different lactic acid concentration ranges.
Figure 1(a) shows the Fluorescence emission spectra of 0.5M europium nitrate alone and when coupled with lactic acid with, lactic acid in lower concentration when excited at 395 nm.Figure 1(b) shows the Fluorescence emission spectra of 0.5M europium nitrate alone and when coupled with lactic acid where the lactic acid is in higher concentration when excited at 395 nm. The photoluminescence intensity ratio (PLIR), defined by the ratio of the fluorescence intensity at 616 nm to the fluorescence intensity at 591 nm (I616/I591) and may represent the chemical environment of the Eu3+ ion. As shown inFigures 1(a) and 1(b) , the PLIR reverses when the mole fraction of lactic acid is very high compared to when the mole fraction is low, such that the PLIR >1 at low lactic acid concentrations and the PLIR <1 at high lactic acid concentrations. -
Figure 1(a) shows that the main peak emission of Eu3+ conjugated-lactic acid is at 616nm when the concentration of lactic acid expressed in mole fraction is less than about 5x10⁻⁶. Therefore, at low concentrations of lactic acid the PLIR is greater than 1, as plotted inFigure 7(a). Figure 7(a) also shows the corresponding PLIR variation with the europium nitrate mole fraction which is around 9x10⁻³. The plot shown inFigure 7(a) can therefore be used for calibration of the amount of lactic acid based on the measured PLIR under these conditions. When the fluorescence image is recorded under these conditions the image will be predominately reddish as shown inFigure 6(c) .Figure 1(b) shows the photoluminescence intensity when the mole fraction of lactic acid is at higher concentrations and the corresponding PLIR is plotted inFigure 7(b) . As shown inFigure 1(b) the main peak fluorescence emission of Eu3+ conjugated-lactic acid is at 593nm when the concentration of lactic acid expressed in mole fraction is of the order of 10-3. Therefore, at high concentrations of lactic acid the PLIR is less than 1, as plotted inFigure 7(b) . The plot shown inFigure 7(b) can therefore be used for calibration of the amount of lactic acid based on the measured PLIR under these conditions. The image will be yellowish as shown inFigure 6(b) and the spectrum peaks at 593nm instead of 616 nm as shown inFigure 1(b) . - We confirmed the cell viability of 5SH5Y cells in a variation of concentrations of ytterbium nitrate using the MTT assay. The MTT Cell Proliferation Assay is a colorimetric assay system which measures the reduction of a yellow tetrazolium component (MTT) into an insoluble purple formazan product by the mitochondria of viable cells which are solubilized by the addition of a detergent, The colour can then be quantified by spectrophotometric means. For each cell type a linear relationship between cell number and absorbance is established, enabling accurate, straightforward quantification of changes in proliferation. Cells derived from a sympathetic tumour were used as they proliferate rapidly (labelled human neuroblastoma cells from the SH-SY5Y cell-line (European Collection of Cell Cultures, Porton Down, Wiltshire, UK), of passage 8 to 10). These were cultured in SH medium (see Example 1) in 500ml tissue culture flasks under incubation at 37°C until the confluence was deemed at least 75% under microscopic analysis. Twenty-four hours before the cells were needed for treatment, cells were cultured in 96-well plates to approximately 50% confluency or greater. Experiments were carried out when all of the cell groups showed a similar confluency when viewed under the microscope. Cells were then treated with with various concentrations (1µM, 10µM, 100µM, 1000µM and 10,000µM) of ytterbium nitrate solutions prepared in SH medium for 24 hours and 5 days. The final volume of each well after any treatment was kept at 100 µL. 11 µL Thiazolyl Blue Tetrazolium Bromide (5 mg/mL, MTT, Sigma) made up in sterile PBS was added to each well (10% by volume) and the cells were incubated at 37°C for 3 hours. An equal volume (111 µl per well) of solubilizing solution (24 ml propan-1-ol/isopropyl alcohol (Sigma) + 1.0 ml 1 M HCl) was added to each well to lyse the cells, and the contents thoroughly mixed by pipetting. Absorbance was measured at 570 nm.
- The effect on cell viability was recorded after 24 hours and also over 5 days using various concentrations of ytterbium nitrate solutions. Over a 24 hour period all concentrations of ytterbium nitrate solution had a notable effect on the viability of the cell population compared to the control. The trail involving 10,000µM showed this level of ytterbium to be detrimental to cell survival and proliferation, whereas all the others were shown to be beneficial.
- One-way ANOVA (and nonparametric) statistical test with a Dunnett post test was completed on the data, with significance defined as p<0.05. This test was chosen as it is able to make multiple group comparisons and was performed through the software GraphPad Prism. The cell viability results are shown in
Figure 2 (a, b). We also performed the cytotoxicity test for europium and cerium. Our results show that both lanthanides are significantly non-toxic when compared with control (untreated cells). However cytotoxic effects of both compounds were observed at 10,000µM concentration at 5 days of treatment. - Cytoprotective effect tests were performed on SH-SY5Y cells that had previously been exposed to hydrogen peroxide for 24 hours. Hydrogen peroxide (H2O2) is a strong oxidant, and its activity is based on hydroxide radical's action on DNA strand ((Jonas et al, 1989, Biochem.J., 264, 651-655.). Cells were cultured in 96-well plates to approximately 50% confluency or greater. Experiments were carried out when all of the cell groups showed a similar confluency when viewed under the microscope. To kill the cells, 500µM of hydrogen peroxide (dissolved in SH medium) were added to
cell culture 24 hours prior to additions of cerium and europium nitrate (dissolved in SH medium), and this concentration is deemed adequate to kill a considerable number of cells to measure good cytoprotective test result (Gülden et al, 2010, Free Radic Biol Med. 49:1298-305). Cell viability was measured after 24 hours exposure to cerium and europium nitrate using the MTT assay as described above. - Further data interpretation and statistical analysis by using one-way ANOVA and Dunnett post-test (n=80, 95% confidence) shows that both lanthanides especially cerium significantly inhibiting hydrogen peroxide's cytotoxicity. Based on the cytoprotective test results, cerium nitrate is a more potent antioxidant-based cytoprotective agent compared to europium nitrate. The results are shown in
Figure 3 . - For confocal laser scanning microscopy SH-SY5Y cells were grown as above, harvested in PBS without Ca2+ or Mg2+ and subcultured on glass coverslips. After 3-4 days in culture cells were washed in PBS then fixed in 4% paraformaldehyde. After three 10 minute washes in PBS cells were permeabilized with 0.02% Triton-X100 in PBS supplemented with 10% goat serum. The cells were then incubated at 4°C, overnight in the presence of 1000 µM cerium nitrate and 1000 µM europium nitrate solution. Cells untreated with either cerium nitrate or europium nitrate were used as a control. After 24 hours coverslips were mounted on slides using Vectashield (Vector Laboratories Ltd, Burlingame, CA, USA) and examined using a Zeiss laser scanning confocal microscope (LSM 510). The results are shown in
Figure 4 , - For in vitro tissue and in vivo experiments, 10- to 12-week-old (25-30 g) C57BL/6J mice (Harlan-Olac, Bicester, UK) were used under appropriate United Kingdom Home Office personal and project licenses and adhered to regulations as specified in the Animals (Scientific Procedures) Act (1986) and according to institutional ethical guidelines.
- The mice were killed by decapitation under appropriate anaesthesia. Brains, arteries and blood were removed, rapidly frozen on dry ice and stored at -80°C for conjugation study. Conjugation of cerium and europium with mouse brain tissue and atherosclerotic tissue was obtained by homogenising 50mg of tissue in Tris saline buffer (pH7.4) and mixing with different dilutions (1µM, 10uM, 100µM) of the europium nitrate and cerium nitrate. The mixers were kept on a shaker table for 24 hours. The tissue was then mounted onto a slide and coverslipped using Vectashield mounting medium and examined using a Zeiss laser scanning confocal microscope (LSM 510).
- Fluorescence emission spectrum of europium nitrate was obtained by exciting with a diode laser of 405nm and it gives 3 emissions at 448 nm, 535 nm and 588nm. Thereafter conjugation of the europium with phospholipids was assessed by first mixing phospholipids with 100µM europium nitrate analysing under confocal microscope. Two emissions were observed i.e. at 448nm and 674 nm shown in
Figure 5 , Therefore, europium conjugation with phospholipids will give two emission peaks near 448nm and 674nm. - Brain tissue exposed to 0. 1 µM concentration of europium nitrate showed a large number of fluorescent peaks (≥10 peaks in a 100 µm2 area) as shown in
Figure 11(a) . The white circles indicate Eu3+ ions which are conjugated to lipid regions of the brain. This was more than that seen in brain tissue exposed to 1mM of europium nitrate solution (Figure 11 (b) ). The brain tissue controls did not show any evidence of fluorescence under the microscope (Figure 11(a) ). - For this 10- to 1.2-week-old (25-30 g) C57BL/6J mice (Harlan-Olac, Bicester, UK) recived intraperitoneal injection of 02.ml of 100µM europium nitrate in distilled water). After 24 hours mice were perfused transcardially with 0.9% saline followed by 4% paraformaldehyde. Brains, arteries, heart, liver kidneys were removed, post-fixed and 50µm sections were cut on a vibratome (Leica Microsystems, Germany) The sections were mounted on slides, dried at 4°C, cover slipped using vectashield mounting medium and examined using a Zeiss laser scanning confocal microscope (LSM 510).
- The confocal image of mouse artery showed some spots with blue emissions. Fluorescence spectra were obtained and the spectra was compare with aq europium nitrate as shown in the
Figure 8 and similar peak emission are observed which shows that europium is conjugating to the endothelial tissue in artery. Following intra peritoneal injection of rare earth ions, all the mice appeared completely healthy and behaved normally. For the mice injected with europium nitrate solution, a very low level of europium ions were found to be present in the cardiac and lung, tissue with the highest number of peaks seen in a 100 µm2 area being ≤ 1 for both the heart and lung tissue. The liver tissue showed a much higher concentration of fluorescence than the heart and lung tissue, with the highest number of fluorescent peaks in a 1 00 µm2 area being <10. At higher magnifications it was evident that the europium ions had entered the hepatocytes in the liver tissue. The brain tissue also showed a large amount of fluorescence under the microscope, with the highest number of fluorescent peaks per 100 µm2 area being ≥20. - The carotid artery of an atherosclerotic mouse was conjugated with europium nitrate solution (100µM) dissolved in Tris saline buffer, mounted onto a slide and a coverslip added using vectashield mounting medium. Sections were viewed on an Axiolmager Z.1 epifluorescence microscope (Carl Zeiss, Welwyn Garden City, UK).
Figure 10(b) shows a fluorescent image with DAPI filter which allows the emission range of 470-500nm, The white circles seen inFigure 10(a) indicate the conjugation of the europium with lipid regions of the artery which can be compared to the blue marks in the Fluorescence microscope image shown inFigure 10(b) . Following IP injection of europium and cerium nitrate solution we have found europium and cerium labelling in the brain tissue (Figure 9 ) suggesting that these lanthanides cross the blood brain barrier.
(iv) correlating the level or change in level of said metabolite to a disease condition, wherein the measurement uses laser spectroscopy or Raman spectroscopy, and wherein the excitation and measurement are in the range of about 600nm to about 2100nm
Claims (14)
- A method for the measurement of one or more metabolites in an animal comprising the measurement of a rare earth metal-conjugated marker, wherein the measurement uses laser spectroscopy or Raman spectroscopy, and wherein the excitation and measurement are in the range of about 600nm to about 2100nm, wherein "about" is ±10% of the stated value.
- A method according to Claim 1 wherein the measurement correlates with a disease condition.
- A method according to Claim 1 or Claim 2 wherein the measurement is a non-invasive measurement in an animal.
- A method according to Claim 2 or Claim 3 wherein the disease condition is selected from cardiovascular diseases, neuropsychiatric diseases, neurological diseases and cancer.
- A method according to any one of the previous claims wherein the metabolite is selected from(i) a metabolite having a molecular weight of less than 500 Daltons;(ii) a lipid;(iii) a peptide;(iv) a protein; and(v) an enzyme
- A method according to Claim 5 wherein the metabolite is selected from:(i) an amino acid or related compounds selected from taurine, glutamine, N-acetyl-L-asparate (NAA),and homocysteine;(ii) Lipids and related intermediates selected from phosphatidylcholine and phosphocholine;(iii) lipid binding proteins selected from lipoprotein A, HDL and LDL;(iv) Peptides/ Proteins selected from PARK 7, Nucleoside Diphosphate Kinase A (NDKA), amyloid beta peptide, Tau (e.g. hyperphosphorylated Tau), CD68, CD64, carcino-embryonic antigen (CEA), tumor-associated glycoprotein 72 (Tag72), folate receptor-α,, Alpha actin, Toll-like receptors (TLRs) Creatine, Creatinine, amyloid precursor protein (APP), troponin, C-reactive protein, Fibrinogen and B-type natriuretic peptide (BNP)(v) Enzymes selected from phospholipases, β-secretase, Y-secretase, succinate dehydrogenase (SDH), fumarate hydratase (FH), neprilysin (NEP), endothelin-converting enzyme (ECE), insulysin (IDE), angiotensin-converting enzyme (ACE) and matrix metalloproteinase 1-9 (MMP 1-9), Creatine kinase (CK) and creatine kinase isoenzyme MB (CKMB)(vi) Cytokines selected from IL(1-6) and TNFα; and(vii) small molecule metabolites selected from lactate, glucose, acetyladehyde hydrate, acetate, choline, inositol
- A method according to any preceding claim, wherein the marker is lactic acid.
- A method according to any one of the previous claims wherein the rare earth metal is selected from Cerium, Dysprosium, Erbium, Europium, Gadolinium, Holmium, Neodymium Praseodymium, Samarium, Terbium, Thulium and Ytterbium.
- A method according to Claim 7 wherein the rare earth metal is selected from Ce4+,3+, Yb3+, EU3+, Sm3+, Tm3+, Tb3+ and Nd3+.
- A method according to any preceding claim, wherein the rare earth metal is Eu3+.
- A method according to any preceding claim wherein the rare earth metal-conjugated marker is Eu3+-conjugated lactic acid.
- A method according to any preceding claim, wherein the photoluminescence intensity ratio (PLIR) imaging technique is used to calculate the level or a change in level of the metabolite.
- A method according to claim 12, wherein the rare earth metal-conjugated marker is Eu3+-conjugated lactic acid and the photoluminescence intensity ratio (PLIR) is defined as I616/I591.
- Eu3+ for use in the treatment of a disease condition in an animal comprising:(i) administering Eu3+ to said animal;(ii) optically coupling a body part of said animal with a light source and a light detector;(iii) detecting Eu3+-conjugated lactic acid to generate an optical signal;(iv) processing said optical signal to(a) calculate a level or change in level of Eu3+-conjugated lactic acid; and or(b) calculate the position of Eu3+-conjugated lactic acid;(v) using said position, level or change in level of lactic acid to aid in treatment of atherosclerosis
wherein the level or change in level of Eu3+-conjugated lactic acid in step (iv) is determined using the photoluminescence intensity ratio (=I616/I591),
and wherein the Eu3+-conjugated lactic acid is detected in step (iii) using laser spectroscopy or Raman spectroscopy, and wherein the excitation and measurement are in the range of about 600nm to about 2100nm, wherein "about" is ±10% of the stated value.
Applications Claiming Priority (2)
| Application Number | Priority Date | Filing Date | Title |
|---|---|---|---|
| GBGB1204014.3A GB201204014D0 (en) | 2012-03-07 | 2012-03-07 | Diagnostic marker compounds and their use |
| PCT/GB2013/050560 WO2013132252A1 (en) | 2012-03-07 | 2013-03-07 | Diagnostic marker compounds and their use |
Publications (2)
| Publication Number | Publication Date |
|---|---|
| EP2822603A1 EP2822603A1 (en) | 2015-01-14 |
| EP2822603B1 true EP2822603B1 (en) | 2019-07-31 |
Family
ID=46003269
Family Applications (1)
| Application Number | Title | Priority Date | Filing Date |
|---|---|---|---|
| EP13709993.3A Active EP2822603B1 (en) | 2012-03-07 | 2013-03-07 | Diagnostic marker compounds and their use |
Country Status (4)
| Country | Link |
|---|---|
| US (1) | US10080811B2 (en) |
| EP (1) | EP2822603B1 (en) |
| GB (1) | GB201204014D0 (en) |
| WO (1) | WO2013132252A1 (en) |
Families Citing this family (4)
| Publication number | Priority date | Publication date | Assignee | Title |
|---|---|---|---|---|
| WO2016054079A1 (en) | 2014-09-29 | 2016-04-07 | Zyomed Corp. | Systems and methods for blood glucose and other analyte detection and measurement using collision computing |
| US9554738B1 (en) | 2016-03-30 | 2017-01-31 | Zyomed Corp. | Spectroscopic tomography systems and methods for noninvasive detection and measurement of analytes using collision computing |
| US10670609B2 (en) * | 2017-09-22 | 2020-06-02 | Government Of The United States, As Represented By The Secretary Of The Air Force | Ytterbium as a surrogate cation to measure calcium flux |
| EP4725412A1 (en) | 2024-10-12 | 2026-04-15 | Walletmed Limited | Implant and method of metabolite measurement |
Family Cites Families (7)
| Publication number | Priority date | Publication date | Assignee | Title |
|---|---|---|---|---|
| US20070037224A1 (en) * | 2005-08-11 | 2007-02-15 | Hamer Peter J | Quantitative assays for PDGFR-beta in body fluids |
| WO2007113386A1 (en) | 2006-03-31 | 2007-10-11 | Karyon-Ctt Ltd | Peptide conjugates |
| US8372435B2 (en) * | 2008-06-23 | 2013-02-12 | Princeton University | Modular monolayer coatings for selective attachment of nanoparticles to biomolecules |
| WO2010031471A1 (en) | 2008-09-19 | 2010-03-25 | Inbio Prof. Jürgen Büddefeld Dr. Peter Klauth Prof. Manfred Rietz Gbr | Method for marking and/or identifying biomolecules |
| GB0901556D0 (en) * | 2009-01-30 | 2009-03-11 | Univ Durham | Responsive luminescent lanthanide compounds |
| WO2011075786A1 (en) * | 2009-12-23 | 2011-06-30 | Avipep Pty Ltd | Immuno-conjugates and methods for producing them 2 |
| US20110237942A1 (en) * | 2010-03-25 | 2011-09-29 | Tamotsu Zako | Bioimaging method using near-infrared (nir) fluorescent material |
-
2012
- 2012-03-07 GB GBGB1204014.3A patent/GB201204014D0/en not_active Ceased
-
2013
- 2013-03-07 US US14/382,728 patent/US10080811B2/en not_active Expired - Fee Related
- 2013-03-07 EP EP13709993.3A patent/EP2822603B1/en active Active
- 2013-03-07 WO PCT/GB2013/050560 patent/WO2013132252A1/en not_active Ceased
Non-Patent Citations (1)
| Title |
|---|
| None * |
Also Published As
| Publication number | Publication date |
|---|---|
| WO2013132252A1 (en) | 2013-09-12 |
| US10080811B2 (en) | 2018-09-25 |
| GB201204014D0 (en) | 2012-04-18 |
| US20150045664A1 (en) | 2015-02-12 |
| EP2822603A1 (en) | 2015-01-14 |
Similar Documents
| Publication | Publication Date | Title |
|---|---|---|
| Esipova et al. | Oxyphor 2P: a high-performance probe for deep-tissue longitudinal oxygen imaging | |
| Prinzen et al. | Optical and magnetic resonance imaging of cell death and platelet activation using annexin A5-functionalized quantum dots | |
| Pautke et al. | Characterization of eight different tetracyclines: advances in fluorescence bone labeling | |
| Amharref et al. | Discriminating healthy from tumor and necrosis tissue in rat brain tissue samples by Raman spectral imaging | |
| Matthäus et al. | In vivo characterization of atherosclerotic plaque depositions by Raman-probe spectroscopy and in vitro coherent anti-stokes Raman scattering microscopic imaging on a rabbit model | |
| Kubánková et al. | Microscopic viscosity of neuronal plasma membranes measured using fluorescent molecular rotors: effects of oxidative stress and neuroprotection | |
| Mazurek et al. | Characteristics of fluorescent intraoperative dyes helpful in gross total resection of high-grade gliomas—a systematic review | |
| Harmatys et al. | In vivo imaging of bone using a deep-red fluorescent molecular probe bearing multiple iminodiacetate groups | |
| Galli et al. | Vibrational spectroscopic imaging and multiphoton microscopy of spinal cord injury | |
| US12062422B2 (en) | System, method and computer-accessible medium for use of heavy water as a probe for imaging metabolic activities | |
| Morisaki et al. | Application of Raman spectroscopy for visualizing biochemical changes during peripheral nerve injury in vitro and in vivo | |
| US10080811B2 (en) | Diagnostic marker compounds and their use | |
| Surmacki et al. | Label-free monitoring of tissue biochemistry following traumatic brain injury using Raman spectroscopy | |
| Gvazava et al. | Label-free high-resolution photothermal optical infrared spectroscopy for spatiotemporal chemical analysis in fresh, hydrated living tissues and embryos | |
| US20170340756A1 (en) | Pharmaceutical formulation having reverse thermal gelation properties for local delivery of nanoparticles | |
| Moon et al. | Multiplex protein imaging with secondary ion mass spectrometry using metal oxide nanoparticle-conjugated antibodies | |
| Liu et al. | Reactive oxygen species-responsive sequentially targeted AIE fluorescent probe for precisely identifying the atherosclerotic plaques | |
| Álvarez-Marimon et al. | Synchrotron X-ray fluorescence and FTIR signatures for amyloid fibrillary and nonfibrillary plaques | |
| Semyachkina-Glushkovskaya et al. | Low-level laser treatment induces the blood-brain barrier opening and the brain drainage system activation: delivery of liposomes into mouse glioblastoma | |
| EP2437792B1 (en) | Imaging of myelin basic protein | |
| Chiou et al. | Fluorescent silica nanoparticles to label metastatic tumor cells in mineralized bone microenvironments | |
| Li et al. | Optomagnetic heater-thermometer nanoplatform for tumor magnetothermal therapy with operando temperature feedback | |
| Monterrubio-Ledezma et al. | Rescue of mitochondrial function in Hutchinson-Gilford progeria syndrome by the pharmacological modulation of exportin CRM1 | |
| Vasilev et al. | Feasibility of photodynamic therapy for glioblastoma with the Mitochondria-Targeted Photosensitizer Tetramethylrhodamine Methyl Ester (TMRM) | |
| Yang et al. | Amyloid‑β guided responsive theranostic fluorescent probe for imaging of endogenous hydrogen peroxide in Alzheimer disease |
Legal Events
| Date | Code | Title | Description |
|---|---|---|---|
| PUAI | Public reference made under article 153(3) epc to a published international application that has entered the european phase |
Free format text: ORIGINAL CODE: 0009012 |
|
| 17P | Request for examination filed |
Effective date: 20141002 |
|
| AK | Designated contracting states |
Kind code of ref document: A1 Designated state(s): AL AT BE BG CH CY CZ DE DK EE ES FI FR GB GR HR HU IE IS IT LI LT LU LV MC MK MT NL NO PL PT RO RS SE SI SK SM TR |
|
| AX | Request for extension of the european patent |
Extension state: BA ME |
|
| DAX | Request for extension of the european patent (deleted) | ||
| STAA | Information on the status of an ep patent application or granted ep patent |
Free format text: STATUS: EXAMINATION IS IN PROGRESS |
|
| 17Q | First examination report despatched |
Effective date: 20180223 |
|
| GRAP | Despatch of communication of intention to grant a patent |
Free format text: ORIGINAL CODE: EPIDOSNIGR1 |
|
| STAA | Information on the status of an ep patent application or granted ep patent |
Free format text: STATUS: GRANT OF PATENT IS INTENDED |
|
| RIC1 | Information provided on ipc code assigned before grant |
Ipc: A61K 49/00 20060101AFI20190114BHEP Ipc: A61K 47/52 20170101ALI20190114BHEP |
|
| INTG | Intention to grant announced |
Effective date: 20190212 |
|
| GRAS | Grant fee paid |
Free format text: ORIGINAL CODE: EPIDOSNIGR3 |
|
| GRAA | (expected) grant |
Free format text: ORIGINAL CODE: 0009210 |
|
| STAA | Information on the status of an ep patent application or granted ep patent |
Free format text: STATUS: THE PATENT HAS BEEN GRANTED |
|
| AK | Designated contracting states |
Kind code of ref document: B1 Designated state(s): AL AT BE BG CH CY CZ DE DK EE ES FI FR GB GR HR HU IE IS IT LI LT LU LV MC MK MT NL NO PL PT RO RS SE SI SK SM TR |
|
| REG | Reference to a national code |
Ref country code: CH Ref legal event code: EP Ref country code: GB Ref legal event code: FG4D |
|
| REG | Reference to a national code |
Ref country code: DE Ref legal event code: R096 Ref document number: 602013058451 Country of ref document: DE |
|
| REG | Reference to a national code |
Ref country code: AT Ref legal event code: REF Ref document number: 1160240 Country of ref document: AT Kind code of ref document: T Effective date: 20190815 |
|
| REG | Reference to a national code |
Ref country code: IE Ref legal event code: FG4D |
|
| REG | Reference to a national code |
Ref country code: NL Ref legal event code: MP Effective date: 20190731 |
|
| REG | Reference to a national code |
Ref country code: LT Ref legal event code: MG4D |
|
| REG | Reference to a national code |
Ref country code: AT Ref legal event code: MK05 Ref document number: 1160240 Country of ref document: AT Kind code of ref document: T Effective date: 20190731 |
|
| PG25 | Lapsed in a contracting state [announced via postgrant information from national office to epo] |
Ref country code: FI Free format text: LAPSE BECAUSE OF FAILURE TO SUBMIT A TRANSLATION OF THE DESCRIPTION OR TO PAY THE FEE WITHIN THE PRESCRIBED TIME-LIMIT Effective date: 20190731 Ref country code: LT Free format text: LAPSE BECAUSE OF FAILURE TO SUBMIT A TRANSLATION OF THE DESCRIPTION OR TO PAY THE FEE WITHIN THE PRESCRIBED TIME-LIMIT Effective date: 20190731 Ref country code: SE Free format text: LAPSE BECAUSE OF FAILURE TO SUBMIT A TRANSLATION OF THE DESCRIPTION OR TO PAY THE FEE WITHIN THE PRESCRIBED TIME-LIMIT Effective date: 20190731 Ref country code: HR Free format text: LAPSE BECAUSE OF FAILURE TO SUBMIT A TRANSLATION OF THE DESCRIPTION OR TO PAY THE FEE WITHIN THE PRESCRIBED TIME-LIMIT Effective date: 20190731 Ref country code: NO Free format text: LAPSE BECAUSE OF FAILURE TO SUBMIT A TRANSLATION OF THE DESCRIPTION OR TO PAY THE FEE WITHIN THE PRESCRIBED TIME-LIMIT Effective date: 20191031 Ref country code: BG Free format text: LAPSE BECAUSE OF FAILURE TO SUBMIT A TRANSLATION OF THE DESCRIPTION OR TO PAY THE FEE WITHIN THE PRESCRIBED TIME-LIMIT Effective date: 20191031 Ref country code: NL Free format text: LAPSE BECAUSE OF FAILURE TO SUBMIT A TRANSLATION OF THE DESCRIPTION OR TO PAY THE FEE WITHIN THE PRESCRIBED TIME-LIMIT Effective date: 20190731 Ref country code: PT Free format text: LAPSE BECAUSE OF FAILURE TO SUBMIT A TRANSLATION OF THE DESCRIPTION OR TO PAY THE FEE WITHIN THE PRESCRIBED TIME-LIMIT Effective date: 20191202 Ref country code: AT Free format text: LAPSE BECAUSE OF FAILURE TO SUBMIT A TRANSLATION OF THE DESCRIPTION OR TO PAY THE FEE WITHIN THE PRESCRIBED TIME-LIMIT Effective date: 20190731 |
|
| PG25 | Lapsed in a contracting state [announced via postgrant information from national office to epo] |
Ref country code: IS Free format text: LAPSE BECAUSE OF FAILURE TO SUBMIT A TRANSLATION OF THE DESCRIPTION OR TO PAY THE FEE WITHIN THE PRESCRIBED TIME-LIMIT Effective date: 20191130 Ref country code: ES Free format text: LAPSE BECAUSE OF FAILURE TO SUBMIT A TRANSLATION OF THE DESCRIPTION OR TO PAY THE FEE WITHIN THE PRESCRIBED TIME-LIMIT Effective date: 20190731 Ref country code: AL Free format text: LAPSE BECAUSE OF FAILURE TO SUBMIT A TRANSLATION OF THE DESCRIPTION OR TO PAY THE FEE WITHIN THE PRESCRIBED TIME-LIMIT Effective date: 20190731 Ref country code: GR Free format text: LAPSE BECAUSE OF FAILURE TO SUBMIT A TRANSLATION OF THE DESCRIPTION OR TO PAY THE FEE WITHIN THE PRESCRIBED TIME-LIMIT Effective date: 20191101 Ref country code: LV Free format text: LAPSE BECAUSE OF FAILURE TO SUBMIT A TRANSLATION OF THE DESCRIPTION OR TO PAY THE FEE WITHIN THE PRESCRIBED TIME-LIMIT Effective date: 20190731 Ref country code: RS Free format text: LAPSE BECAUSE OF FAILURE TO SUBMIT A TRANSLATION OF THE DESCRIPTION OR TO PAY THE FEE WITHIN THE PRESCRIBED TIME-LIMIT Effective date: 20190731 |
|
| PG25 | Lapsed in a contracting state [announced via postgrant information from national office to epo] |
Ref country code: TR Free format text: LAPSE BECAUSE OF FAILURE TO SUBMIT A TRANSLATION OF THE DESCRIPTION OR TO PAY THE FEE WITHIN THE PRESCRIBED TIME-LIMIT Effective date: 20190731 |
|
| PG25 | Lapsed in a contracting state [announced via postgrant information from national office to epo] |
Ref country code: EE Free format text: LAPSE BECAUSE OF FAILURE TO SUBMIT A TRANSLATION OF THE DESCRIPTION OR TO PAY THE FEE WITHIN THE PRESCRIBED TIME-LIMIT Effective date: 20190731 Ref country code: DK Free format text: LAPSE BECAUSE OF FAILURE TO SUBMIT A TRANSLATION OF THE DESCRIPTION OR TO PAY THE FEE WITHIN THE PRESCRIBED TIME-LIMIT Effective date: 20190731 Ref country code: PL Free format text: LAPSE BECAUSE OF FAILURE TO SUBMIT A TRANSLATION OF THE DESCRIPTION OR TO PAY THE FEE WITHIN THE PRESCRIBED TIME-LIMIT Effective date: 20190731 Ref country code: RO Free format text: LAPSE BECAUSE OF FAILURE TO SUBMIT A TRANSLATION OF THE DESCRIPTION OR TO PAY THE FEE WITHIN THE PRESCRIBED TIME-LIMIT Effective date: 20190731 Ref country code: IT Free format text: LAPSE BECAUSE OF FAILURE TO SUBMIT A TRANSLATION OF THE DESCRIPTION OR TO PAY THE FEE WITHIN THE PRESCRIBED TIME-LIMIT Effective date: 20190731 |
|
| PG25 | Lapsed in a contracting state [announced via postgrant information from national office to epo] |
Ref country code: SM Free format text: LAPSE BECAUSE OF FAILURE TO SUBMIT A TRANSLATION OF THE DESCRIPTION OR TO PAY THE FEE WITHIN THE PRESCRIBED TIME-LIMIT Effective date: 20190731 Ref country code: SK Free format text: LAPSE BECAUSE OF FAILURE TO SUBMIT A TRANSLATION OF THE DESCRIPTION OR TO PAY THE FEE WITHIN THE PRESCRIBED TIME-LIMIT Effective date: 20190731 Ref country code: IS Free format text: LAPSE BECAUSE OF FAILURE TO SUBMIT A TRANSLATION OF THE DESCRIPTION OR TO PAY THE FEE WITHIN THE PRESCRIBED TIME-LIMIT Effective date: 20200224 Ref country code: CZ Free format text: LAPSE BECAUSE OF FAILURE TO SUBMIT A TRANSLATION OF THE DESCRIPTION OR TO PAY THE FEE WITHIN THE PRESCRIBED TIME-LIMIT Effective date: 20190731 |
|
| REG | Reference to a national code |
Ref country code: DE Ref legal event code: R097 Ref document number: 602013058451 Country of ref document: DE |
|
| PLBE | No opposition filed within time limit |
Free format text: ORIGINAL CODE: 0009261 |
|
| STAA | Information on the status of an ep patent application or granted ep patent |
Free format text: STATUS: NO OPPOSITION FILED WITHIN TIME LIMIT |
|
| PG2D | Information on lapse in contracting state deleted |
Ref country code: IS |
|
| PG25 | Lapsed in a contracting state [announced via postgrant information from national office to epo] |
Ref country code: IS Free format text: LAPSE BECAUSE OF FAILURE TO SUBMIT A TRANSLATION OF THE DESCRIPTION OR TO PAY THE FEE WITHIN THE PRESCRIBED TIME-LIMIT Effective date: 20191030 |
|
| 26N | No opposition filed |
Effective date: 20200603 |
|
| PG25 | Lapsed in a contracting state [announced via postgrant information from national office to epo] |
Ref country code: SI Free format text: LAPSE BECAUSE OF FAILURE TO SUBMIT A TRANSLATION OF THE DESCRIPTION OR TO PAY THE FEE WITHIN THE PRESCRIBED TIME-LIMIT Effective date: 20190731 |
|
| REG | Reference to a national code |
Ref country code: DE Ref legal event code: R119 Ref document number: 602013058451 Country of ref document: DE |
|
| PG25 | Lapsed in a contracting state [announced via postgrant information from national office to epo] |
Ref country code: MC Free format text: LAPSE BECAUSE OF FAILURE TO SUBMIT A TRANSLATION OF THE DESCRIPTION OR TO PAY THE FEE WITHIN THE PRESCRIBED TIME-LIMIT Effective date: 20190731 |
|
| REG | Reference to a national code |
Ref country code: CH Ref legal event code: PL |
|
| REG | Reference to a national code |
Ref country code: BE Ref legal event code: MM Effective date: 20200331 |
|
| PG25 | Lapsed in a contracting state [announced via postgrant information from national office to epo] |
Ref country code: LU Free format text: LAPSE BECAUSE OF NON-PAYMENT OF DUE FEES Effective date: 20200307 |
|
| PG25 | Lapsed in a contracting state [announced via postgrant information from national office to epo] |
Ref country code: DE Free format text: LAPSE BECAUSE OF NON-PAYMENT OF DUE FEES Effective date: 20201001 Ref country code: LI Free format text: LAPSE BECAUSE OF NON-PAYMENT OF DUE FEES Effective date: 20200331 Ref country code: IE Free format text: LAPSE BECAUSE OF NON-PAYMENT OF DUE FEES Effective date: 20200307 Ref country code: CH Free format text: LAPSE BECAUSE OF NON-PAYMENT OF DUE FEES Effective date: 20200331 Ref country code: FR Free format text: LAPSE BECAUSE OF NON-PAYMENT OF DUE FEES Effective date: 20200331 |
|
| PG25 | Lapsed in a contracting state [announced via postgrant information from national office to epo] |
Ref country code: BE Free format text: LAPSE BECAUSE OF NON-PAYMENT OF DUE FEES Effective date: 20200331 |
|
| GBPC | Gb: european patent ceased through non-payment of renewal fee |
Effective date: 20200307 |
|
| PG25 | Lapsed in a contracting state [announced via postgrant information from national office to epo] |
Ref country code: GB Free format text: LAPSE BECAUSE OF NON-PAYMENT OF DUE FEES Effective date: 20200307 |
|
| PG25 | Lapsed in a contracting state [announced via postgrant information from national office to epo] |
Ref country code: MT Free format text: LAPSE BECAUSE OF FAILURE TO SUBMIT A TRANSLATION OF THE DESCRIPTION OR TO PAY THE FEE WITHIN THE PRESCRIBED TIME-LIMIT Effective date: 20190731 Ref country code: CY Free format text: LAPSE BECAUSE OF FAILURE TO SUBMIT A TRANSLATION OF THE DESCRIPTION OR TO PAY THE FEE WITHIN THE PRESCRIBED TIME-LIMIT Effective date: 20190731 |
|
| PG25 | Lapsed in a contracting state [announced via postgrant information from national office to epo] |
Ref country code: MK Free format text: LAPSE BECAUSE OF FAILURE TO SUBMIT A TRANSLATION OF THE DESCRIPTION OR TO PAY THE FEE WITHIN THE PRESCRIBED TIME-LIMIT Effective date: 20190731 |