EP2800966B1 - Dielectric spectroscopy methods and apparatus - Google Patents
Dielectric spectroscopy methods and apparatus Download PDFInfo
- Publication number
- EP2800966B1 EP2800966B1 EP13700802.5A EP13700802A EP2800966B1 EP 2800966 B1 EP2800966 B1 EP 2800966B1 EP 13700802 A EP13700802 A EP 13700802A EP 2800966 B1 EP2800966 B1 EP 2800966B1
- Authority
- EP
- European Patent Office
- Prior art keywords
- cells
- property data
- frequency
- electrical property
- permittivity
- Prior art date
- Legal status (The legal status is an assumption and is not a legal conclusion. Google has not performed a legal analysis and makes no representation as to the accuracy of the status listed.)
- Active
Links
Images






Classifications
-
- G—PHYSICS
- G01—MEASURING; TESTING
- G01N—INVESTIGATING OR ANALYSING MATERIALS BY DETERMINING THEIR CHEMICAL OR PHYSICAL PROPERTIES
- G01N27/00—Investigating or analysing materials by the use of electric, electrochemical, or magnetic means
- G01N27/02—Investigating or analysing materials by the use of electric, electrochemical, or magnetic means by investigating impedance
- G01N27/22—Investigating or analysing materials by the use of electric, electrochemical, or magnetic means by investigating impedance by investigating capacitance
-
- G—PHYSICS
- G01—MEASURING; TESTING
- G01N—INVESTIGATING OR ANALYSING MATERIALS BY DETERMINING THEIR CHEMICAL OR PHYSICAL PROPERTIES
- G01N33/00—Investigating or analysing materials by specific methods not covered by groups G01N1/00 - G01N31/00
- G01N33/48—Biological material, e.g. blood, urine; Haemocytometers
- G01N33/483—Physical analysis of biological material
- G01N33/487—Physical analysis of biological material of liquid biological material
- G01N33/48707—Physical analysis of biological material of liquid biological material by electrical means
- G01N33/48735—Investigating suspensions of cells, e.g. measuring microbe concentration
-
- C—CHEMISTRY; METALLURGY
- C12—BIOCHEMISTRY; BEER; SPIRITS; WINE; VINEGAR; MICROBIOLOGY; ENZYMOLOGY; MUTATION OR GENETIC ENGINEERING
- C12M—APPARATUS FOR ENZYMOLOGY OR MICROBIOLOGY; APPARATUS FOR CULTURING MICROORGANISMS FOR PRODUCING BIOMASS, FOR GROWING CELLS OR FOR OBTAINING FERMENTATION OR METABOLIC PRODUCTS, i.e. BIOREACTORS OR FERMENTERS
- C12M41/00—Means for regulation, monitoring, measurement or control, e.g. flow regulation
- C12M41/30—Means for regulation, monitoring, measurement or control, e.g. flow regulation of concentration
- C12M41/36—Means for regulation, monitoring, measurement or control, e.g. flow regulation of concentration of biomass, e.g. colony counters or by turbidity measurements
-
- C—CHEMISTRY; METALLURGY
- C12—BIOCHEMISTRY; BEER; SPIRITS; WINE; VINEGAR; MICROBIOLOGY; ENZYMOLOGY; MUTATION OR GENETIC ENGINEERING
- C12M—APPARATUS FOR ENZYMOLOGY OR MICROBIOLOGY; APPARATUS FOR CULTURING MICROORGANISMS FOR PRODUCING BIOMASS, FOR GROWING CELLS OR FOR OBTAINING FERMENTATION OR METABOLIC PRODUCTS, i.e. BIOREACTORS OR FERMENTERS
- C12M41/00—Means for regulation, monitoring, measurement or control, e.g. flow regulation
- C12M41/46—Means for regulation, monitoring, measurement or control, e.g. flow regulation of cellular or enzymatic activity or functionality, e.g. cell viability
-
- G—PHYSICS
- G01—MEASURING; TESTING
- G01N—INVESTIGATING OR ANALYSING MATERIALS BY DETERMINING THEIR CHEMICAL OR PHYSICAL PROPERTIES
- G01N27/00—Investigating or analysing materials by the use of electric, electrochemical, or magnetic means
- G01N27/02—Investigating or analysing materials by the use of electric, electrochemical, or magnetic means by investigating impedance
- G01N27/026—Dielectric impedance spectroscopy
-
- G—PHYSICS
- G01—MEASURING; TESTING
- G01N—INVESTIGATING OR ANALYSING MATERIALS BY DETERMINING THEIR CHEMICAL OR PHYSICAL PROPERTIES
- G01N27/00—Investigating or analysing materials by the use of electric, electrochemical, or magnetic means
- G01N27/02—Investigating or analysing materials by the use of electric, electrochemical, or magnetic means by investigating impedance
- G01N27/22—Investigating or analysing materials by the use of electric, electrochemical, or magnetic means by investigating impedance by investigating capacitance
- G01N27/221—Investigating or analysing materials by the use of electric, electrochemical, or magnetic means by investigating impedance by investigating capacitance by investigating the dielectric properties
-
- G—PHYSICS
- G01—MEASURING; TESTING
- G01N—INVESTIGATING OR ANALYSING MATERIALS BY DETERMINING THEIR CHEMICAL OR PHYSICAL PROPERTIES
- G01N33/00—Investigating or analysing materials by specific methods not covered by groups G01N1/00 - G01N31/00
- G01N33/48—Biological material, e.g. blood, urine; Haemocytometers
- G01N33/483—Physical analysis of biological material
- G01N33/4833—Physical analysis of biological material of solid biological material, e.g. tissue samples, cell cultures
Definitions
- the disclosed technology relates to methods and apparatus for predicting biological properties, such as viable biomass in a population of cells using an electrical signal.
- cell counting is performed by mixing an aliquot of a population of cells with trypan blue dye and counting cells disposed on a hemocytometer stage using a microscope. The viable cell density is then determined by visual counting methods.
- hemocytometer techniques are error-prone and require a manual sample of the bioreactor contents. Consequently, a number of alternate analytical techniques have been developed, including techniques that count cells based on electrical impedance as well as techniques that use trypan blue exclusion.
- Dielectric spectroscopy (DS) techniques measure the electrical impedance of a sample by applying a time-varying signal to the sample via electrodes.
- DS techniques can provide information about cell structure and properties, including intracellular contents, membrane shape and polarizability, and other cellular properties.
- the dielectric properties of biological cells can provide information regarding the cellular and molecular state of a given population of cells.
- the dielectric properties of biological cells are mainly characterized by the beta-dispersion, a dielectric relaxation phenomenon, which is observed in the medium and high frequency (HF) range of the radio spectrum.
- the beta-dispersion mechanism is due to Maxwell-Wagner polarization (interfacial polarization) at the external and internal interfaces of the phospholipid membrane, and is caused by the ability of biological cell membranes to impede electrical current. Additional contributions to the beta-dispersion may be observed due to the presence of organelles, heterogeneity of the cell population, and other phenomena.
- the present invention relates to methods and apparatus for determining a biological property, such as viable biomass, using a frequency-swept electrical measuring device (e.g. , a permittivity probe), and using biological properties, such as viable biomass as measured by an alternative analytical technique (such as trypan blue dye exclusion ( e.g ., viable biomass measured using an automated cell counter)) as a calibration.
- a frequency-swept electrical measuring device e.g. , a permittivity probe
- biological properties such as viable biomass as measured by an alternative analytical technique (such as trypan blue dye exclusion (e.g ., viable biomass measured using an automated cell counter)) as a calibration.
- Methods and apparatus are disclosed for correlating a viable cell volume as measured by trypan blue dye exclusion and a viable cell volume as determined by capacitance-based methods. Certain embodiments of these techniques use information measured across a dielectric spectrum to estimate the viable cell volume a priori.
- Devices to measure the impedance of a sample can be used to predict biomass by measuring the change in capacitance of a system. These measuring devices also have the capability to measure a dielectric spectrum by measuring relative permittivity of a system using signals applied across a number of different frequencies.
- the accuracy of using measured capacitances of the system to predict viable biomass begins to diverge in comparison to other methods (e.g ., trypan blue dye exclusion).
- trypan blue dye exclusion e.g ., trypan blue dye exclusion.
- a divergence in the value measured between the two methods is observed that is roughly proportional to the viability of the culture. This divergence can be interpreted as being caused by cells that cannot exclude the dye in the trypan blue exclusion method retaining intact, or partially intact, cell membranes. This cell membrane retention produces a residual capacitance signal, even though these cells are considered nonviable according to trypan blue dye exclusion.
- Dielectric spectroscopy is a non-invasive technique that can be used to illuminate cell-level behavior, for example, in bioreactor cell growth processes.
- Dielectric spectroscopy can provide a data-rich cell-level snapshot of the cells in a bioreactor.
- measuring devices used in performing dielectric spectroscopy operate by detecting a capacitance, or ability to store electrical charge, of cells in a population ( e.g., a suspension of cells) as a function of frequency applied to the measuring device. This measuring can be accomplished by performing a frequency scan, or in many cases only measuring a single capacitance value.
- Viable biomass can be predicted via measurement of one or more capacitance values which are indicative of the total magnitude (or intensity, and also called the dielectric increment) of the beta-dispersion curve.
- the current state-of-the-art assumes the measured properties are only due to viable cells, and therefore uses a capacitance measurement which is indicative of the dielectric increment to predict biomass as measured by an alternate analytical technique, including offline cell counting methods, such as trypan blue dye exclusion (e.g ., using a Cedex analyzer).
- offline cell counting methods such as trypan blue dye exclusion (e.g ., using a Cedex analyzer).
- trypan blue dye exclusion e.g ., using a Cedex analyzer
- the relationship is applied to subsequent capacitance measurements to predict biological property data. This prediction generally proves valid when measuring viable biomass when the cells are maintaining a constant viability.
- the method breaks down, however, when the viability of the cells begin to change, resulting in divergences between the capacitance-based predicted viability and the viability as measured using an alternate analytical technique.
- measuring devices that can be used in performing dielectric spectroscopy are readily discernible to one of ordinary skill in the art.
- two-terminal electrode, four-terminal electrode, coaxial chamber, single-head dielectric, and multi-wire measuring devices can be used in certain embodiments of the disclosed technology.
- measuring devices include a signal generator, receiver, and signal analyzer coupled to an electrode or probe for measuring electromagnetic properties of a sample.
- the resulting capacitance(s), or dielectric spectrum will be affected by cell attributes such as morphology, membrane charge, organelles, health, and/or buildup of metabolites within the cell, and the resulting capacitance(s) can therefore yield information about these attributes in real-time.
- the disclosed technology allows for the accurate measurement of cell viability over the life cycle of a cell culture, not just during the growth phase.
- This can allow for a feeding scheme where feeds are based on biomass and hence cell demand.
- extra-cellular reactions of a bioproduct with feed components can produce unacceptable amounts of product impurities, but some amount of feed component must be added to continue to produce the product.
- a variable feed based on cell biomass e.g ., viable cell volume
- the present invention provides therefore a method and an apparatus for determining a biological property of cells suspended in a liquid media according to independent claims 1 and 13, respectively. Preferred embodiments of the invention are set forth in the dependent claims.
- Some of the disclosed methods can be implemented with computer-executable instructions stored on one or more computer-readable storage media (e.g ., non-transitory computer-readable media, such as one or more volatile memory components (such as DRAM or SRAM), or nonvolatile memory components (such as hard drives) and executed on a computer.
- Any of the computer-executable instructions for implementing the disclosed techniques as well as any data created and used during implementation of the disclosed embodiments can be stored on one or more computer-readable media (e.g ., non-transitory computer-readable media).
- the computer-executable instructions can be part of, for example, a dedicated software application or a software application that is accessed or downloaded via a web browser or other software application (such as a remote computing application).
- Such software can be executed, for example, on a single local computer (e.g ., any suitable commercially-available computer) or in a network environment (e.g ., via the Internet, a wide-area network, a local-area network, a client-server network (such as a cloud computing network), or other such network) using one or more network computers.
- a single local computer e.g ., any suitable commercially-available computer
- a network environment e.g ., via the Internet, a wide-area network, a local-area network, a client-server network (such as a cloud computing network), or other such network) using one or more network computers.
- capacitor and “permittivity” are treated as equivalent for the purposes of the present disclosure, for reasons that will be readily apparent to one of ordinary skill in the relevant art.
- viable biomass and “viable cell volume,” “biovolume,” and “viable volume fraction” are treated as equivalent for the purposes of the present disclosure, for reasons that will be readily apparent to one of ordinary skill in the relevant art.
- magnitude refers to the intensity, or distance between the low and high frequency plateaus, of the beta-dispersion curve obtained when measuring an electrical property of a sample of cells.
- frequency dependence refers to a relation between the frequency of a signal applied to a sample of cells to measure an electrical property and the measurements of the electrical property thereby obtained.
- Devices to measure the electrical properties of a population of cells can be used to predict biological property data (e.g., cell viability characteristics and biomass characteristics such as viable cell volume (VCV)) by measuring changes in capacitance and/or permittivity of a system.
- biological property data e.g., cell viability characteristics and biomass characteristics such as viable cell volume (VCV)
- VCV viable cell volume
- These measuring devices e.g ., permittivity probes
- VCV viable cell volume
- permittivity probes can scan across various frequencies and create a dielectric spectrum.
- divergences between the capacitance-based predicted viability and the viability as measured by trypan blue exclusion e.g. , using a Cedex analyzer
- frequency scanning data are collected over time in a fed-batch culture of cells (e.g. , mammalian cells).
- the frequency scans are normalized (e.g. , to a range of 0.0 to 1.0) by dividing the measured permittivity values by the maximum measured permittivity value.
- a difference in the relative shapes of the beta-dispersion curves e.g. , the dielectric spectrum consisting of measured permittivity as a function of frequency
- This shape difference in the beta-dispersion can be quantified by taking an integral ratio of the upper portion of the curve compared to the whole curve for a plurality of time points.
- the integral ratio value is then correlated to the observed divergence between the trypan blue exclusion and capacitance values.
- the observed correlation tends to be linear. This correlation can be used to correct for divergences observed during subsequent runs, as the slope and intercept remains relatively constant between runs.
- embodiments of the disclosed technology allow for accurate measurements of cell viability characteristics (e.g ., viable cell volume) over the entire lifetime of the culture, not just during the growth phase.
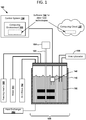
- FIG. 1 is a schematic of a suitable system 100 for growing a culture of cells in accordance with some embodiments of the disclosed technology. Viability of the culture cells can be predicted using, for example, any of the methods described in FIGS. 2-9 and accompanying descriptions.
- an exemplary bioreactor system 100 for making a bioproduct includes a bioreactor 105 having a vessel 110 capable of providing an aseptic environment suitable for containing a population of cells 120 that can produce the bioproduct.
- the population of cells 120 contains media and at least one undissolved species, either as a suspension or adhered to a substrate.
- the population of cells 120 includes a mixture of cells dispersed in a liquid media (forming a suspension).
- the system 100 also contains a sampling system 130 (e.g. , a flow cytometer) operably connected to the vessel 110 and capable of extracting a sample from the vessel.
- the system 100 also includes a measuring device 140 (e.g. , a permittivity probe, or other measuring device suitable for measuring an electrical property of the population of cells 120) operably connected to the vessel 110, the measuring device being configured to measure an electrical property of the population of cells 120 in the vessel and generate a corresponding signal in response.
- a measuring device 140 e.g. , a permittivity probe,
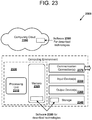
- a control system 150 includes a computing environment 155, and, in some examples, the control system can transmit and receive data and/or computer-readable instructions from computing resources in a computing cloud 157.
- Software 158 for implementing the described technologies, including computer-readable instructions, can be stored on a computer-readable storage medium in the computing environment 155 and/or computing cloud 157.
- the control system 150 can use the computing environment 155 to analyze signals received from the measuring device 140 and generate output signal(s) capable of controlling one or more input and/or output devices 160-165 that are configured to measure or alter environmental conditions within the vessel 110.
- devices 160-162 can be used for controlling and/or removing: feeding media, water, and acid or base solutions, respectively.
- a heat exchanger 163 can be used to heat or cool the vessel 120.
- a motor 164 is connected to an impeller shaft 165, which can be used to agitate the population of cells 120 (or to agitate the media in the bioreactor). In other examples, a magnetic impeller or other suitable stirring/agitation mechanism can be used. Not all signal and power connections between the devices 160-165 and the control system 150 are depicted in FIG. 1 .
- the bioproduct is selected from foods, beverages, biofuels, bioenergy, bio-based ethanol, biodiesel, bio-based adhesives, biochemicals, biotherapeutics, biodegradable plastics, or mixtures thereof.
- the bioproduct is a biotherapeutic.
- the bioproduct is a biotherapeutic selected from pharmaceuticals, therapeutic proteins, protein fragments, antibodies, vaccines, or mixtures thereof.
- the vessel is selected from anaerobic fermenters, aerobic fermenters, stirred-tank reactors, adherent bioreactors, wave-type bioreactors, and disposable bioreactors.
- the population of cells comprises live cells, dead cells, cell fragments, solid substrates having cells adhered thereto, particles, or mixtures thereof.
- the live cells can include bacteria, yeast, animal cells, mammalian cells, e-coli cells, or mixtures thereof.
- the population of cells includes animal cells. In other embodiments, the population of cells includes mammalian cells.
- biological properties of the population of cells can be selected by adjusting media-level properties and/or cell-level properties.
- properties of the population of cells that can be measured and/or adjusted include viable cell volume (VCV), packed viable cell volume (PVCV), viable cell density (VCD), viable cell concentration (VCC), viability, cell health, or mixtures thereof.
- properties of the population of cells that can be adjusted include pH, dissolved oxygen, osmolality, nutrient concentrations, ammonia/ammonium, lactate/lactic acid, pCO2, electrolytes (such as K+, Ca++, and/or Na+), amino acids, NAD/NADH, impurities, purity, phenotypes, metabolic states, cell cycle, or mixtures thereof.
- suitable input devices that can be coupled to the control system 150 include pH probes, dissolved oxygen meters, ion-selective electrodes, osmometry devices, high-performance liquid chromatographs, gas chromatographs, ion chromatographs, conductivity meters, Raman spectroscopes, near infrared spectroscopes, dielectric spectroscopes, fluorometers, ultraviolet/visible spectroscopes, capacitance probes, luminescence meters, redox probes, flow cytometers, hemocytometers, electro-rotators, electrophoresis probes, dielectrophoresis probes, or mixtures thereof.
- suitable output devices that can be configured to alter at least one property of the population of cells include mixing/agitation systems, temperature-control systems, gas pumps, nutrient pumps, product removal systems, impurity removal systems, pH adjustment systems, or mixtures thereof.
- control system 150 is configured to alter at least one property of the population of cells within the vessel resulting in an improvement in at least one of bioproduct yield, bioproduct purity, bioproduct production rate, reduced cost, reduced energy consumption, or reduced waste generation, relative to a system that is controlled manually.
- an aseptic sampling system is operably connected to the control system.
- Bioproducts are made in bioreactors, which are systems that support a biologically active environment.
- bioreactors include fermenters (anaerobic or aerobic), stirred-tank reactors, adherent bioreactors, wave-type bioreactors, and disposable bioreactors.
- a bioreactor can include, for example, a large fermentation chamber for growing organisms that can be used to produce bioproducts.
- Bioreactors generally contain whole broth comprising a population of cells.
- whole broth means the contents of the bioreactor (or a portion thereof), including “media” and “undissolved” or “adhered” species.
- media means the liquid phase, including all dissolved substances, such as nutrients, dissolved organics, ionic species, etc.
- undissolved or “adhered” species means the live cells, dead cells, cell fragments, solid substrates having cells adhered thereto, or other particles present in the whole broth.
- bio-therapeutic proteins can be produced from genetically modified mammalian cells within a bioreactor. Such production can be from cell lines of established cell cultures, such as, for example, CHO or NS0. These cells express the protein of interest and subsequently secrete the protein into the media. In many instances, mammalian cells are grown in a fed-batch process. However, it should be understood that the methods and systems disclosed herein can be applicable in perfusion-type cell culture systems or other such systems.
- bioreactors can be configured to adjust or control inputs to the bioreactor, including, for example, one or more of the following variables of pH, dissolved oxygen (DO), reactant/nutrient concentrations, temperature, or agitation.
- Such bioreactors can include stirred-tank type reactors, as well as adherent bioreactors, wave-type bioreactors, or disposable bioreactors.
- Bioreactors are typically equipped with a means for mixing or agitating the population of cells in the bioreactor, including using mechanical mixing, circulation pumps, shifting baffle plates, mechanical vibration schemes, ultrasonic agitation, acoustic agitators, gas bubble agitators, vortex generators, cavitation pumping, or combinations thereof. Bioreactors also typically are equipped with heat exchangers for maintaining or controlling the temperature in the bioreactor.
- the present application discloses improved methods of using the frequency dependence of electrical property data measured at two or more frequencies to determine a biological property of cells more accurately than prior art methods that rely only on measurements of the magnitude of an electrical property.
- FIG. 2 is a flow chart 200 that outlines an exemplary method of determining a relationship between biological property data for a population of cells and a value representative of electrical property data for a population of cells. According to the present invention, a value representing the frequency dependence of said electrical property data is generated.
- electrical property data are received representing at least one electrical property of a population of cells.
- the electrical property data are obtained by applying an electrical signal to the cells at more than two signal frequencies.
- the electrical property data is obtained by applying a frequency-varying signal to a population of cells with a measuring device.
- Suitable electrical properties that can be measured with a measuring device include capacitance, permittivity, dielectric constant, resistance, impedance, voltage, or current.
- a permittivity probe capable of applying a number of different frequencies to a suspension of cells in a bioreactor, such as the Futura line of biomass sensors and the Biomass Monitor 200 (manufactured by Aber Instruments of the United Kingdom), and the Fogale Biomass System (manufactured by Fogale Nanotech of France) can be used to measure permittivity or capacitance of the cells when applying a frequency-varying signal.
- suitable measuring devices include external electrodes placed on the outside or inside of the bioreactor and connected to an appropriate signal generator and receiver.
- the measurements are obtained by applying a frequency-varying signal (e.g. , a sine wave having a frequency that is varied across a selected frequency range, or at two or more selected frequencies) to the population of cells while measuring an electrical property such as permittivity or capacitance.
- a frequency-varying signal e.g. , a sine wave having a frequency that is varied across a selected frequency range, or at two or more selected frequencies
- a number of selected frequencies can be used, for example, frequencies between 50 kHz and 10 MHz.
- the measured permittivity of the population of cells will vary depending on the frequency of the applied signal used to measure permittivity.
- the permittivity can range from a high measurement of 4 ⁇ 10 -9 Farads per meter (F/m) at a low frequency of 50 kHz to a low measurement of 1 ⁇ 10 -11 F/m at a high frequency of 10 MHz.
- the terms "low frequency” and "high frequency” are relative, and do not necessarily refer to an absolute low or high frequency.
- biological property data for measurements observed in the cells are obtained using an alternative analytical method.
- Exemplary biological property data include viable cell volume (VCV), packed viable cell volume (PVCV), viable cell density (VCD), viable cell concentration (VCC), viability, cell health, level of apoptosis, or mixtures thereof.
- alternate analytical techniques refers to techniques for obtaining calibration measurements based on analyzing cell biomass in ways other than measuring at least one electrical property of a cell population by applying a frequency-varying signal to the cell population with a measuring device.
- Alternate analytical techniques suitable for performing such calibration measurements include, but are not limited to: enumeration using a hemocytometer, trypan blue exclusion, caspases for measuring cell apoptosis, fluorescence-activated cell sorting using flow cytometry, or other techniques known to one of ordinary skill in the art.
- the method After receiving the biological property data, the method proceeds to process block 230.
- values representative of the electrical property data as a function of frequency received at process block 210 are generated.
- the value representative of the electrical property data as a function of frequency represents a shape.
- the shape of the electrical property data refers to the curve obtained from plotting the electrical property data as a function of frequency and thus represents the frequency dependence of the electrical property.
- An example is the beta-dispersion curve obtained by plotting permittivity versus frequency. The beta-dispersion curve is frequency dependent. Values representative of the shape of the electrical property data are generated by appropriate data reduction over the frequencies at which electrical property data are measured.
- the representative value may be generated by fitting a curve to the electrical property data, by multi-variate analysis, by determining the slope of a line corresponding to the electrical property data, or by determining a ratio of the electrical property data measured at different frequencies.
- the representative value is generated by determining an area ratio under the curve derived from the electrical property data.
- the representative values represent a shape corresponding to the spectrum of electrical property data taken over two or more signal frequencies at which the respective electrical property data were obtained. In said examples, the representative values represent an area ratio.
- the value representative of the shape can be obtained by fitting the beta-dispersion curve to a mathematical function such as a line, polynomial, Taylor series expansion, or other methods apparent to those familiar with curve fitting, fitting the beta-dispersion curve to a model of physical relevance such as a single or multiple term Cole-Cole model, Debye model, Davidson-Cole model, or Hoviciak-Negami model, analyzing the electrical property data using multivariate methods (multi-variate or latent variable analysis), or other methods that are capable of quantifying the shape of a curve.
- a mathematical function such as a line, polynomial, Taylor series expansion, or other methods apparent to those familiar with curve fitting
- fitting the beta-dispersion curve to a model of physical relevance such as a single or multiple term Cole-Cole model, Debye model, Davidson-Cole model, or H192iak-Negami model
- multivariate methods multi-variate or latent variable analysis
- a relationship between the biological property data and the representative values of the shape of the electrical property data are determined.
- the relationship includes a correlation between the biological property data and the shape of the electrical property data, and such a correlation can be determined using the techniques described for process block 230.
- the correlation describes the relationship between the shape of the electrical property of the cells measured at two or more frequencies and measurements of biological property data, such as VCV, PVCV, VCD, VCC, viability, cell health, or level of apoptosis.
- the relationship includes a correlation generated based on permittivity measurements received at process block 210 and calibration measurements determined using an alternate analytical technique.
- the relationship generated at process block 240 can be applied to generate one or more corrected measurements based on the electrical property data received at process block 210. For example, if the relationship includes a correlation in the form of a slope-intercept equation, the equation can be used to calculate corrected measurements based on the electrical property data. The generated correlation (between the electrical property data and biological property data) can be applied to future electrical property measurements to predict biological property values.
- the method of the invention can utilize electrical property data obtained by applying a signal to the cells at two frequencies.
- FIG. 3 is a graph 300 that indicates a frequency dependence of the electrical property data to frequency by illustrating a plot of cell viability versus a permittivity ratio when using a high frequency of 6.451 MHz, and a low frequency of 1.391 MHz.
- the data are given in Table 1.
- the cell viability can be determined using trypan blue dye exclusion as measured by a flow cytometer.
- the value representative of the electrical property data can be determined by taking a ratio of the permittivity measured at the high frequency relative to the permittivity measured at the low frequency.
- the relationship between the value representative of the electrical property data (or shape of the beta dispersion curve) and the biological property data (in this case cell viability) can be determined by forming a linear relationship between the permittivity ratio and the cell viability, as shown by the equation shown in FIG. 3 .
- This new correlation can be used to predict biological property data (e.g. , cell viability) in subsequent tests.
- FIG. 4 describes a method for combining measurements of both the magnitude and shape of the measured beta-dispersion curve from a calibration experiment to achieve a more accurate prediction of viable biomass compared to using just magnitude alone.
- the magnitude parameter is correlated to the biomass first, a model is fit to that correlation, and the shape parameter is used subsequently to describe the divergence (or distance) of each measurement from the magnitude model.
- electrical property data are obtained by applying a signal to cells in a bioreactor at multiple frequencies. These electrical property data are obtained across the beta-dispersion curve such as to allow measurement of both the shape and magnitude (dielectric increment as described above).
- the magnitude of the beta dispersion is quantified.
- Methods for quantifying the magnitude of the beta-dispersion include measurement of permittivity at a single frequency on the beta-dispersion curve, measurement of the difference between the low and high frequency plateaus of the beta-dispersion, or any other methods suitable for quantifying the magnitude of the beta-dispersion curve.
- the shape of the beta-dispersion curve is quantified.
- the magnitude of the beta-dispersion is related to biological property data obtained using alternative analytical techniques, such as those previously described, and other techniques readily ascertainable to those of ordinary skill in the relevant art.
- a relationship between the magnitude of the beta-dispersion and the biological property data is determined.
- the relationship between the magnitude of the beta dispersion curve and the biological property data can be determined as follows: a linear relationship during all or a portion of the life cycle of the cells, a linear relationship during the growth phase of the cells, or other methods readily apparent to those skilled in the art.
- the relationship between the magnitude of the beta-dispersion curve and the biological property data is a linear model fit to the biological property data during the growth phase.
- the divergence between the relationship developed in block 440 and the biological property data is determined.
- the divergence is calculated by the difference between the biological property data measured by an alternative analytical technique and the predicted biological property data using the linear relationship determined during the growth phase of the cells.
- process block 460 the shape of the beta-dispersion curve from block 425 is combined with the divergence in block 450 to develop a new relationship to predict biological property data.
- the new relationship developed from block 460 is used to develop a new correlation to predict biological property data in subsequent tests (e.g. , a new population of cells).
- These correlations one relating magnitude of the beta-dispersion to biological property data, the other relating shape of the beta-dispersion to divergence from the first correlation
- VCV ⁇ ⁇ C + ⁇ ⁇ SF + k
- VCV is the predicted biological property data (in this case, viable cell volume)
- ⁇ is a constant of proportionality fit to the data
- C is a value quantifying the magnitude of the beta-dispersion curve
- ⁇ is a constant of proportionality fit to the data
- SF is a value quantifying the shape of the beta-dispersion curve
- k is an offset value (which may be neglected in many cases).
- C and SF can be used besides this simple linear combination, which are readily ascertainable to those of ordinary skill in the relevant art.
- FIG. 5 is a flow chart 500 that outlines an exemplary method of receiving measurements obtained by applying a frequency-varying signal to a population of cells with a measuring device, calculating divergences between the received electrical property measurements and a number of calibration measurements, and determining a relationship or correlation between the permittivity response as a function of the frequency varying signal and the divergence for generating a more accurate prediction of a viable cell volume for the population, as can be used in certain embodiments of the disclosed technology.
- data representing a number of measurements of an electrical property of a population of cells are received.
- the measurements can be obtained by applying a frequency-varying signal (e.g ., a sine wave having a frequency that is varied across a selected frequency range, or at two or more selected frequencies) to the population of cells while measuring an electrical property such as permittivity or capacitance.
- a frequency-varying signal e.g ., a sine wave having a frequency that is varied across a selected frequency range, or at two or more selected frequencies
- a number of selected frequencies can be used, for example, frequencies between 50 kHz and 10 MHz.
- the measured permittivity of the population of cells will vary depending on the frequency of the applied signal used to measure permittivity.
- the permittivity can range from a high measurement of 4 ⁇ 10 -9 Farads per meter (F/m) at a low frequency of 50 kHz to a low measurement of 1 ⁇ 10 -11 F/m at a high frequency of 10 MHz.
- the terms "low frequency” and "high frequency” are relative, and do not necessarily refer to an absolute low or high frequency.
- electrical property data as a function of frequency can be obtained.
- the permittivity response as a function of frequency such as the beta dispersion curve, can be measured.
- the cells can be mammalian cells (e.g. from the CHO or NS0 cell lines) suspended in a nutrient solution.
- the data collected at process block 510 can be collected over a period on the order of seconds, minutes, hours, or days, as is suited to the species of cells in the population and environmental conditions.
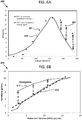
- the predicted viable cell volume (VCV) of the population (as measured by the Aber Biomass Monitor 200 which determines VCV based on linear correlation between a measurement of the magnitude of the beta dispersion and the actual VCV measurements will begin to diverge from the actual VCV measured by trypan blue exclusion over the life cycle of the population, as illustrated in the chart 600 of FIG. 6A.
- FIG. 6A illustrates viable cell volume measured using the prior art probe and by Cedex, an automated cell counting device which uses trypan blue exclusion to determine VCV by image analysis.
- the permittivity probe VCV prediction is indicated by square sample points ( e.g ., points 601 and 602), and the VCV measured by trypan blue exclusion is indicated by a line 605.
- the alternate analytical technique in this case trypan blue exclusion method
- a calibration (in other words, a relationship) is calculated between the electrical property data as a function of frequency collected at process block 510 and measurements determined using an alternate analytical technique, in this case the trypan blue exclusion method.
- an alternate analytical technique in this case the trypan blue exclusion method.
- Certain cell populations exhibit a differing permittivity response for similar biomass volumes depending on the life cycle stage of the cells.
- the permittivity response as a function of frequency, or beta dispersion curve can be used to identify the stage of the life cycle of the cell. For example, some cell populations exhibit differing permittivity responses before and after peak growth has been achieved.
- alternate analytical techniques refers to techniques for obtaining calibration measurements based on analyzing cell biomass in ways other than measuring at least one electrical property of a cell population by applying a frequency-varying signal to the cell population with a measuring device.
- Alternate analytical techniques suitable for performing such calibration measurements include, but are not limited to: enumeration using a hemocytometer, trypan blue exclusion, caspases for measuring cell apoptosis, fluorescence-activated cell sorting using flow cytometry, or other techniques known to one of ordinary skill in the art.
- FIG. 6B illustrates that the same viable cell volume will generate different permittivity values at a single frequency depending on the life cycle stage of the cells. In FIG. 6B , the permittivity measured at a single frequency is plotted against viable cell volume.
- FIG. 6B shows observed divergences between permittivities measured at a single frequency by the prior art probe during the growth phase of a culture (indicated by a first portion 612 of a data series), and permittivities measured during phases of stationary and decreasing viability phases (indicated by a second portion 614 of a data series), after peak biomass volume (here, after peak VCV) has been achieved.
- Such a divergence is typically caused by changes in the structure of the cell wall as the health of the cells in the culture decreases.
- a calibration or relationship using the permittivity response as a function of frequency may be determined in order to improve the accuracy of future measurements of viable cell volume using the electrical property data.
- step 530 of FIG. 5 this is accomplished by characterizing the frequency dependence of the measured permittivity response by generating a value that is representative of the shape of the beta dispersion curve.
- a relationship is then determined between the frequency dependence of the permittivity response (that is, the value representative of the shape of the beta dispersion curve) and the viable cell volume as measured using the alternate analytical method, in this case the trypan blue exclusion method as measured by Cedex.
- the relationship is determined by correlating the value representative of the shape of the beta dispersion curve with the observed divergence between the magnitude of permittivity measured at a single frequency and the viable cell volume as measured using the alternate analytical method, in this case the trypan blue exclusion method as measured by Cedex.
- This relationship allows for the correction of the observed divergence between the viable cell volume as predicted by the prior art permittivity probe measured at a single frequency and the viable cell volume measured using trypan blue exclusion in future measurements of viable cell volume using only permittivity measurements.
- the calibration determined at process block 530 can then be used for measuring cell properties in other cell populations.
- FIG. 7 is a flow chart 700 that outlines an exemplary method of correlating an area ratio based on permittivity measurements obtained using a permittivity probe to measurements obtained using an alternate analytical technique, as can be used in certain embodiments of the disclosed technology.
- a number of permittivity measurements ⁇ are received that are obtained by applying a frequency-varying signal to a population of cells using a suitable measuring device.
- a permittivity probe capable of applying a number of different frequencies to a suspension of cells in a bioreactor, such as the Futura line of biomass sensors and the Biomass Monitor 200 (manufactured by Aber Instruments of the United Kingdom), and the Fogale Biomass System (manufactured by Fogale Nanotech of France) can be used.
- suitable measuring devices include external electrodes placed on the outside or inside of the bioreactor and connected to an appropriate signal generator and receiver.
- Suitable frequencies and techniques for applying a frequency-varying signal to a population of cells as described above regarding process block 710 can be employed.
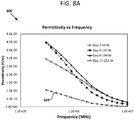
- An example of a number of permittivity measurements obtained by applying a frequency-varying signal using a permittivity probe are shown in chart 800 of FIG. 8A .
- four data series corresponding to measurements made at four different time periods are shown.
- the measured permittivity generally decreases as sampling signal frequency is increased, but each data series exhibits a different shape. That is, the permittivity response observed as a function of frequency is different for each of the different electrical property data series taken at the different time points.
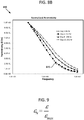
- the permittivity measurements ⁇ across all frequency spectra can be normalized to a range from 0.0 to 1.0 using the equation shown in FIG. 9 .
- each permittivity measurement ⁇ is normalized by dividing by the maximum measured permittivity ⁇ max for a set of measurements to produce a normalized permittivity ⁇ N .
- the normalized permittivity ⁇ N will be used for determining area ratios R A , as described below regarding process blocks 730-750.
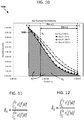
- An example of four data series of normalized permittivity measurements ⁇ N are shown in chart 850 of FIG. 8B . As shown, each of the four data series has been corrected to range from 0.0 to 1.0 ( e.g ., normalized data series 870 corresponds to data series 820 of FIG. 8A ). The data series 820 was measured 66 hours into the life cycle of the cell culture. In other examples, the permittivity measurements are not normalized.
- the method proceeds to process block 720.
- a divergence is calculated between the permittivity measurements obtained at process block 710 and calibration measurements determined using an alternate analytical technique in a similar fashion to those described above regarding process block 520. For example, the divergence between the magnitude of the permittivity measured at a single frequency and the biological property measured using the alternate analytical technique (in this case viable cell volume) is calculated for each of the measured time points. After the divergence has been calculated, the method proceeds to process block 730.
- a value representative of the permittivity response as a function of frequency, or shape of the electrical property data is calculated using area ratios under the permittivity versus frequency curves.
- a first area a 1 is determined by integrating a number of permittivity measurements (or samples) taken between a selected low frequency f L and a selected high frequency f H .
- the highest and lowest frequencies are the highest and lowest frequencies applied to the population of cells when measuring permittivities.
- other high and low frequencies are used as the selected frequencies.
- the permittivity measurements are normalized, as discussed above regarding process block 710.
- the first area a 1 can be calculated using any suitable technique, including quadrature polynomial interpolation, adaptive quadrature interpolation, extrapolation, and/or Monte Carlo analysis. After calculating the first area a 1 , the method proceeds to process block 740. For example, the chart 1000 of FIG. 10 shows this first area a 1 as first normalized data series 1020 for the range f L to f H .
- a second area a 2 is determined by integrating a number of permittivity measurements (or samples) taken between a selected frequency f Q and either the low frequency f L or the high frequency f H used for calculating the first area a 1 at process block 730.
- the frequency f Q is selected to be between f L and f H .
- the selected frequency is predetermined at a fixed frequency (e.g ., 808.5 kHz) or as a proportion of the frequency ( e.g., f Q is selected to include the upper three-fourths of the frequency range between f L and f H ).
- the frequency f Q is selected based at least in part on the permittivity samples using a sensitivity analysis.
- the frequency point at the knee is used as the selected frequency f Q as an appropriate region to correct for unhealthy cells in the population.
- an inflection point along the curve of the permittivity samples is used as the selected frequency f Q .
- the frequency f Q is selected based on previously-measured permittivity data. Integration of the area underneath the curve formed by the permittivity samples can be performed in a similar manner as described regarding process block 740. For example, the chart 1000 of FIG.
- the method proceeds to process block 750.
- an area ratio R A is calculated.
- the area ratio R A is a value that is representative of the shape of the permittivity versus frequency curves shown in FIG. 10 .
- the second area a 2 divided by the first area a 1 is used as the area ratio R A .
- An example equation for calculating the area ratio R A for an integral between a selected frequency f Q and a high frequency f H is shown in FIG. 11 .
- An example equation for calculating the area ratio R A for an integral between a low frequency f L and a selected frequency f Q is shown in FIG. 12 .
- Other area ratio calculations can be used.
- An area ratio R A can be calculated for each set of permittivity measurements obtained at a particular point in time.
- data for permittivity measurements might be obtained every 12 hours for a cell population over a period of 10 days, and a corresponding area ratio R A is calculated for each set of frequency-swept permittivity measurements. After a number of area ratios R A are calculated, the method proceeds to process block 760.
- a number of area ratios R A calculated at process block 750 are correlated to calibration measurements determined using the alternate analytical technique at process block 720.
- viable cell volume VCV
- an automated cell counter e.g. , a Cedex analyzer
- the calibration measurements are not limited to VCV, but in some examples can include other biomass properties such as packed viable cell volume (PVCV), viable cell density (VCD), viable cell concentration (VCC), viability, cell health, level of apoptosis, or other suitable measurements.
- the correlation can be calculated using a suitable technique, including linear correlation methods (e.g ., using Pearson's linear correlation), non-linear correlation (e.g ., using Spearman's rank correlation), or matrix correlation techniques.
- linear correlation methods e.g ., using Pearson's linear correlation
- non-linear correlation e.g ., using Spearman's rank correlation
- matrix correlation techniques e.g ., matrix correlation techniques.
- a correlation in slope-intercept form is calculated, while in other examples, more complex correlations are used.
- the correlations thus calculated can be used to correct divergences observed in other cell cultures using permittivity measurements, or measurements of other suitable electrical properties. That is, the viable cell volume predicted using the magnitude of the permittivity measured at frequency f c can be corrected using the correlation between the area ratio and the divergence to correct the viable cell volume predicted using only the magnitude of the measured permittivity.
- FIG. 13A includes a chart 1360 that illustrates a number of measurements and calculations over a culture time of 250 hours based on performing the exemplary method of FIG. 7 .
- a line 1361 indicates the calculated area ratios for the upper three-fourths of frequencies (as shown, above 808.5 kHz).
- a number of sample points e.g ., sample points 1362 and 1363) indicate cell viability (as measured using a Cedex analyzer).
- a line 1364 indicates predicted viability calculated using area ratios based on frequencies above 808.5 kHz using the method described in FIG. 7 .
- FIG. 13B includes a chart 1370 that depicts a corresponding correlation 1371 generated between area ratios for the upper three-fourths of frequencies (as shown, area ratios calculated for frequencies above 808.5 kHz) and percent cell viability (as measured using a Cedex analyzer).
- values representative of the shape of the electrical property data can be correlated to the biological property (percent viability) measured using an alternate analytical technique.
- the electrical property measurements made using a frequency-swept measuring device can be used to form a fit to biological property data obtained using alternate analytical techniques, and the resulting correlation can be used in subsequent measurements to obtain more accurate predictions of the biological property.
- FIG. 14 is a flow chart 1400 illustrating an example of receiving a first set of electrical property measurements for a population of cells and applying a correlation to the first set of measurements to generate a prediction of cell viability, as can be used in some examples of the disclosed technology.
- a first set of electrical property measurements are received, the measurements being obtained from applying a frequency-varying signal to a first population of cells with a measuring device.
- a permittivity probe can be used to measure permittivity or capacitance of the first population when applying a frequency-varying signal using similar techniques to those described above regarding process block 510.
- Suitable electrical properties that can be measured with a measuring device include capacitance, permittivity, dielectric constant, resistance, impedance, voltage, or current.
- a correlation is received based on a second set of electrical property measurements for a second set of cells.
- the correlation can be determined using the techniques described above regarding FIG. 7 .
- the received correlation describes the relationship between an electrical property of the cell population and measurements of cell biomass, such as VCV, PVCV, VCD, VCC, viability, cell health, or level of apoptosis.
- the correlation received at process block 1420 is applied to generate one or more corrected measurements based on the first set of measurements received at process block 1410.
- the correlation is in the form of a slope-intercept equation
- the equation can be used to calculate corrected measurements based on normalized permittivities based on the first set of electrical property measurements.
- a more accurate measurement of cell state can be obtained in the first population, without the use of the alternate analytical technique(s) used to produce the correlation.
- FIGS. 15A-15B illustrate a flow chart 1500 outlining another, further detailed, example of predicting divergence of electrical properties for a population of cells to correct cell viability predictions, as can be used with certain examples of the disclosed technology.
- Charts depicting data associated with an example population of cells analyzed using the exemplary method depicted in the flow chart 1500 are shown in FIGS. 6A and 6B , FIGS. 8A and 8B , FIG. 10 , FIGS. 13A and 13B , and FIGS. 16A-E .
- These charts are not limited to this example method, however, and also can be used to illustrate other embodiments of the disclosed technology.
- permittivity of a first population of cells is measured at one or more selected frequencies over a period of time.
- a permittivity probe can be used to measure the capacitance at multiple frequencies during the life cycle of a population of mammalian cells, in a similar fashion to that described above regarding process block 210.
- a capacitance, or other electrical property, of a population of cells can be measured at one or more selected frequencies over a period of time.
- a number of viable cell volume measurements are measured offline for a second population of cells over a period of time using an alternate analytical method. For example, a similar population of cells of the same species as measured at process block 1510 can be measured using trypan blue exclusion or other methods previously mentioned. The measurements made at process block 1510 and 1511 need not occur during the same time period. For example, the viable cell volume measurements can be performed weeks or months before the capacitance measurements made at process block 1510. After measuring the capacitances and viable cell volumes at process block 1510 and 1511, the method proceeds to process block 1520.
- permittivity data (e.g ., based on the capacitance measured at process block 1510) are received (e.g. , at a suitable computing environment).
- the capacitance values measured at process block 1510 can be expressed as capacitance, permittivity, or other suitable electrical property.
- the permittivity data can be normalized before being received, or received in absolute or relative values and normalized using the computing environment. After receiving the permittivity data, the method proceeds to process block 1530.
- the received permittivity data based on the measured capacitances from process block 1510 are compared to the viable cell volume data measured at process block 1511.
- a chart 1650 of the permittivities at a single frequency can be plotted along a y -axis vs. viable cell volumes (expressed in ⁇ L per mL) along an x -axis, where the viable cell volumes are measured using the alternate analytical method at process block 1511.
- a lower portion 1651 of the charted permittivities represents measurements taken during the growth phase of the population of cells, while the upper portion 1652 represents measurements taken after the growth phase.
- FIG. 16A depicts a clear divergence of permittivity vs. viable cell volume based on the life cycle of the cells in the population.
- one or more "healthy" points on the permittivity plot are selected to develop a linear correlation vs. capacitance.
- the healthy points are selected as the points that correspond to the growth phase of the culture.
- the healthy points can be selected in a number of ways. For example, a person can analyze the data and select the healthy points. Alternatively, the healthy points can be detected by comparing previously-measured permittivities. For example, when permittivity begins to fall, the growth phase is determined to have passed, and only previous permittivity samples are considered. In other examples, the healthy points can be determined based on when the viable cell volume measurements from process block 1511 begin to decrease. As shown in FIG.
- a data point 1681 in the lower portion of the data series has been determined to be a healthy point during the growth phase, while another data point 1682 of the data series has been determined to be a measurement taken after the peak viable cell volume has been achieved in the first population of cells.
- the method proceeds to process block 1534.
- the divergence (e.g., the divergences indicated by arrows 1685, 1686, and 1687 in FIG. 16C ) of each measurement from the linear correlation generated at process block 1532 is calculated.
- the divergences can be filtered to select non-healthy points, by only keeping divergences above a certain absolute or percentage threshold. In other examples, all the divergences are kept for later correlation. After calculating the divergences of one or more samples from the linear correlation, the method proceeds to process block 1540.
- the divergences calculated at process block 1534 are correlated with an area ratio to produce a correlation for use with subsequent analyses of cell populations. That is, the divergences are correlated with a value representative of the shape of the beta dispersion curve corresponding to the respective time point at which the permittivity was measured.
- the area ratios can be calculated in a similar fashion as the area ratios discussed above regarding FIG. 7 .
- An example of a correlation between area ratios in the upper three-quarters of the frequency spectrum used to measure the population of cells, and the divergences calculated at process block 1534, is shown in the chart 1690 of FIG. 16D . As shown, the divergences exhibit a nearly linear correlation (represented by a line 1691) to the selected area ratios.
- This correlation between the area ratios and the divergence between magnitude of the permittivity data and the actual viable cell volume can be used for subsequent runs for similar cells in order to correct the viable cell volume predicted by permittivity values only, especially after growth phases, where greater divergences are observed between the viable cell volume predicted by the magnitude of the permittivity and the actual cell volume as measured by the trypan blue exclusion method.
- the correlation can be stored in a computer-readable storage media for use by, for example, a computing environment coupled to a bioreactor control system, or, alternatively, the correlation can be stored on computer-readable storage media in a computing cloud, for example, at a website hosted by a probe manufacturer or cell line provider.
- FIG. 15B illustrates an additional technique that can be performed once the correlation has been generated at process block 1540.
- the techniques associated with process blocks 1570-1580 can be performed by a different entity than the one performing the method associated with process blocks 1510-1540, or by the same entity.
- capacitances (or, alternatively, permittivities) for a second population of cells are measured at two or more selected frequencies over a number of periods of time.
- a permittivity probe can be used to measure the capacitance at multiple frequencies during the life cycle of a population of mammalian cells, in a similar fashion to that described above regarding process block 510.
- the selected frequencies and/or time periods are the same as those used for the measurements made at process block 1510, while in other examples, the selected frequencies and/or time periods are different.
- a permittivity at a single selected frequency is measured for the second population of cells (which is indicative of the magnitude of the beta-dispersion).
- the viable cell volume predicted by this permittivity measurement is corrected based on the permittivities measured using the frequency varying signal at process block 1570.
- the change in shape of the permittivity vs. frequency curve indicates a time where the permittivity to viable cell volume relationship begins to diverge.
- the correlation generated at process block 1540 is applied to calculate a divergence of the measurements made at process blocks 1570 and/or 1571 from the correlation.
- the prediction of viable cell volume based on permittivity measurements made at process blocks 1570 and/or 1571 can be corrected, without using alternate analytical methods.
- a chart 1695 of FIG. 16E shows an example of the biovolume (e.g ., data point 1696) as measured by a Cedex analyzer (using trypan blue exclusion), the uncorrected predicted biovolume (e.g ., data series 1697) as measured by a permittivity probe, and the corrected predicted biovolume (e.g ., data series 1698) based on the techniques described above.
- FIG. 17 is a flow chart illustrating an example of growing cells in a conductive medium, receiving a biomass (e.g ., VCV) prediction based on a correlation between two measurement techniques, including applying a frequency varying signal to the conductive medium, and adjusting conditions of the conductive medium based on the cell viability prediction.
- a biomass e.g ., VCV
- a population of cells is grown in a conductive medium, using, for example, the bioreactor system 100 described above regarding FIG. 1 .
- the cells can be grown in an aseptic environment in communication with a permittivity probe at least partially immersed in the population. In other embodiments, the probe can be immersed or otherwise interact with the population for only limited durations of time.
- the method proceeds to process block 1720.
- a corrected prediction of cell biomass (e.g ., VCV) is received based on a correlation of two measurement techniques.
- the technique of applying a frequency varying signal to the conductive medium of process block 1710 can be used as the first technique for one of the measurements, and an offline measurement technique, such as trypan blue exclusion, can be used as the second measurement technique.
- the correlation can be linear or nonlinear, and can be based on the techniques discussed above regarding FIGS. 2 , 7 and 15A-B .
- the prediction can be generated locally ( e.g. , by a control system having a computing environment) or remotely ( e.g ., in a computing cloud). After a prediction of cell biomass is received, the method proceeds to process block 1730.
- one or more environmental conditions of the population of cells are adjusted based on the prediction of cell biomass generated at process block 1720.
- feeding media, water, acid or base solutions, or other inputs can be increased, decreased, withheld, or added.
- Other inputs can also be adjusted, such as the temperature of the bioreactor or agitation of the cell population.
- Outputs from the bioreactor can also be adjusted.
- a sample of cells from the cell population can be acquired, or a determined fraction of the cell population volume removed from the bioreactor.
- the inputs and/or outputs can be selected for example, to improve the rate of cell growth, to improve cell health, or to retard or stop cell growth.
- a bioproduct can be produced based on the correlation of the first measurement technique to the second measurement technique.
- Apoptosis (programmed cell death) is a highly-regulated, well-defined biological process. Apoptosis leads to characteristic changes in cell morphology and cell death, for example, blebbing, cell shrinking, and nuclear fragmentation. Apoptosis is essential for multicellular life, and defects in the apoptosis process can lead to fatal diseases such as cancer.
- Detection and measurement of apoptosis is useful for a number of reasons. For example, dead cells do not produce proteins or other byproducts as living cells do. Some of the causes of apoptosis are well-understood to those of ordinary skill in the art. For example, nutrient deprivation, waste accumulation, and process conditions, including oxidative stress, hypoxia, and shear, are causes of apoptosis.
- Table 2 lists a number of stain targets, along with a corresponding apoptosis phase for detecting the stain targets.
- Table 2 Stain Target Apoptosis Phase DNA Very late (dead) Caspase 3 Middle Caspase 6 Middle Caspase 9 Middle Phosphatidyl-serine Early
- FIG. 18 is a flow chart 1800 that outlines an exemplary method of receiving electrical measurements obtained by applying a frequency-varying signal to two different population of cells with a measuring device, one of the populations being grown in an apoptosis-induced environment, and predicting the level of apoptosis in one of the populations, as can be used in certain embodiments of the disclosed technology.
- FIG. 19A is a chart 1900 that illustrates the viability of cells (along the y- axis) in two different cell populations over a period of time (along the x -axis) in an example experiment corresponding to the method of FIG. 18 .
- a first line 1910 indicates the viability of a first population of cells, which has apoptosis induced using addition of a staurosporine agent. In this case, a 1 ⁇ M concentration of staurosporine was used.
- a second line 1915 indicates the viability of a second population of cells, which is a control population that is not induced using a staurosporine agent.
- data representing a number of measurements of an electrical property of a first population of cells are received.
- the measurements can be obtained by applying a frequency-varying signal (e.g. , a sine wave having a frequency that is varied across a selected frequency range, or at two or more selected frequencies) to the population of cells while measuring an electrical property such as permittivity or capacitance.
- a frequency-varying signal e.g. , a sine wave having a frequency that is varied across a selected frequency range, or at two or more selected frequencies
- a number of selected frequencies can be used, for example, frequencies between 50 kHz and 10 MHz.
- the measured permittivity of the population of cells will vary depending on the frequency of the applied signal used to measure permittivity.
- the permittivity can range from a high measurement of 4 ⁇ 10 -9 Farads per meter (F/m) at a low frequency of 50 kHz to a low measurement of 1 ⁇ 10 -11 F/m at a high frequency of 10 MHz.
- the terms "low frequency” and "high frequency” are relative, and do not necessarily refer to an absolute low or high frequency.
- the cells can be mammalian cells (e.g. from the CHO or NS0 cell lines) suspended in a nutrient solution.
- the data collected at process block 1810 can be collected over a period on the order of seconds, minutes, hours, or days, as is suited to the species of cells in the population and environmental conditions.
- the normalized permittivity (plotted on the y -axis) of the population of cells is measured at a number of different frequencies (plotted on the x -axis) at the following time periods after initiation of cell growth: day 3, day 6, day 8, and day 11 (870).
- the shape of the curve thus obtained shifts over time, due to changes in the cellular structure of the cell population.
- apoptosis is induced in the first population of cells by adding an apoptosis inducing agent to the environment. For example, as shown in FIG. 19A , apoptosis is induced in the first population of cells at a time indicated by a dashed line 1919.
- a second set of measurements of an electrical property for a second population of cells is received using similar techniques to those discussed regarding process block 1810.
- the second population of cells has differing environmental conditions than those used for the first population of cells at process block 1810.
- the second population of cells can be a control population, that does not have apoptosis induced using an agent.
- the second line 1915 indicates the viability of the control population.
- FIG. 19B is a chart 1930 that illustrates viable cell density (VCD) (left y -axis) and cell viability percentage (right y -axis) plotted over time (x-axis) for the first and second measurements of the first and second populations of cells received at process block 1810 and 1820.
- VCD viable cell density
- FIG. 19B the first population of cells that is treated with staurosporine at day 14 (at a time 1933 indicated by a dashed line) exhibits declining VCD (data series 1931) and viability percentage (data series 1932).
- the untreated second population of cells exhibits declining VCD (data series 1935) and viability percentage (data series 1936), but at a substantially reduced rate of decline.
- a dashed box 1939 indicates the time period of FIG. 19B that is illustrated in more detail in FIGS. 19C-G .
- the first set of measurements for the first population of cells and the second set of measurements for the second population of cells are compared.
- a number of normalized capacitance measurements (on the y -axis) for the second set of measurements received at process block 1820 are plotted against the frequency at which the measurements were obtained (x-axis), respectively.
- a slight drift to the right is observed from measurements obtained at time 1933 (line 1945) and after 60 hours of cell growth (line 1946) after time 1933.
- the chart 1950 of FIG. 19D illustrates the first set of measurements obtained from the first population of cells that has an apoptosis-inducing agent added at day 14 of cell growth. As shown, a more substantial drift to the right is observed from measurements (line 1955) obtained at the time 1933 of adding staurosporine cell growth to 60 hours after the staurosporine addition (line 1956).
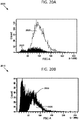
- FIGS. 20A and 20B are charts 2000 and 2010 of histograms of cell counts (y-axis) plotted against FSC (forward scattering) measurements obtained using a flow cytometer at day 2 and day 10 of cell growth of the first population of apoptosis induced cells, respectively.
- a first histogram 2020 indicates the population of healthy cells and a second histogram 2025 indicates the population of unhealthy cells, as determined by measuring FCS using a flow cytometer after 48 hours of cell growth in the first population of cells (before inducing apoptosis).
- a third histogram 2030 indicates the population of healthy cells and a fourth histogram 2035 indicates the population of unhealthy cells, as determined by measuring FCS using a flow cytometer after 10 days of cell growth in the first population of cells.
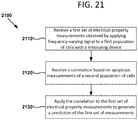
- FIG. 21 is a flow chart 2100 that outlines an exemplary method of applying a correlation of permittivity measurements obtained at varying frequencies to measurements of a biological property obtained using an an alternate analytical technique, as can be used in certain embodiments of the disclosed technology.
- a number of permittivity measurements are received that are obtained by applying a frequency-varying signal to a population of cells using a suitable measuring device, as previously described. Suitable frequencies and techniques for applying a frequency-varying signal to a population of cells as described above regarding process block 2110 can be employed.
- the permittivity measurements across all frequency spectra can be normalized to a range from 0.0 to 1.0. After obtaining a number of permittivity measurements and (optionally) normalizing the permittivity measurements, the method proceeds to process block 2120.
- a correlation is received that has been calculated between the permittivity measurements obtained at process block 2110 and calibration measurements determined using an alternate analytical technique in a similar fashion to those described above, e.g ., regarding process blocks 760 or 1420. After the divergence has been calculated, the method proceeds to process block 2130.
- a first area a 1 is determined by integrating a number of permittivity measurements (or samples) taken between a selected low frequency f L and a selected high frequency f H .
- the highest and lowest frequencies are the highest and lowest frequencies applied to the population of cells when measuring permittivities.
- other high and low frequencies are used as the selected frequencies.
- the permittivity measurements are normalized, as discussed above regarding process block 2110.
- the first area a 1 can be calculated using any suitable technique, including quadrature polynomial interpolation, adaptive quadrature interpolation, extrapolation, and/or Monte Carlo analysis.
- FIGS. 19E and 19F are graphs 1960 and 1980 that illustrate relationships between the correlation received and an area ratio, as described above regarding process block 2130.
- a control cell population exhibits a relatively stable area ratio 1970 over time.
- an apoptosis-induced cell population exhibits an increase in area ratio 1975 after an apoptosis-inducing agent is added at time 1990. Based on these observations, the change in the beta dispersion curve can be correlated and used to predict cell viability due to apoptosis in the first set of measurements obtained at process block 2110.
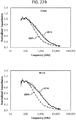
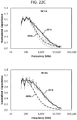
- FIGS. 22A-C is a series of charts illustrating changes in dielectric spectra for two cell populations over a 28-hour period.
- Data series for the first cell population, which has had apoptosis induced using staurosporine induction, are indicated by solid lines ( e.g ., lines 2210-2216).
- Data series for the second, control cell population, which has not had apoptosis induced are indicated by dashed lines ( e.g. , lines 2220-2226).
- VCV viable cell volume
- an automated cell counter e.g. , a Cedex analyzer
- a cell staining technique e.g ., having a DNA, caspase 3, caspase 6, caspase 9, or phosphatidyl-serine stain target
- any of a number of suitable alternate analytical techniques can be used.
- the calibration measurements are not limited to VCV, but in some examples can include other biomass properties such as packed viable cell volume (PVCV), viable cell density (VCD), viable cell concentration (VCC), viability, cell health, level of apoptosis, or other suitable measurements.
- the correlation can be calculated using a suitable technique, including linear correlation methods (e.g., using Pearson's linear correlation), non-linear correlation (e.g., using Spearman's rank correlation), or matrix correlation techniques.
- linear correlation methods e.g., using Pearson's linear correlation
- non-linear correlation e.g., using Spearman's rank correlation
- matrix correlation techniques e.g., a correlation in slope-intercept form is calculated, while in other examples, more complex correlations are used.
- the correlations thus calculated can be used to correct for divergences observed in other cell cultures using permittivity measurements, or measurements of other suitable electrical properties.
- FIG. 23 illustrates a generalized example of a suitable computing environment 2300 in which described embodiments, techniques, and technologies can be implemented.
- the computing environment 2300 can be used to generate correlations and predict viable cell volumes, as described above.
- the computing environment 2300 is not intended to suggest any limitation as to scope of use or functionality of the technology, as the technology can be implemented in diverse general-purpose or special-purpose computing environments.
- the disclosed technology can be implemented with other computer system configurations, including hand held devices, multiprocessor systems, microprocessor-based or programmable consumer electronics, network PCs, minicomputers, mainframe computers, and the like.
- the disclosed technology can also be practiced in distributed computing environments where tasks are performed by remote processing devices that are linked through a communications network.
- program modules can be located in both local and remote memory storage devices.
- the computing environment 2300 includes at least one central processing unit 2310 and memory 2320.
- the central processing unit 2310 executes computer-executable instructions and can be a real or a virtual processor. In a multi-processing system, multiple processing units execute computer-executable instructions to increase processing power and as such, multiple processors can be running simultaneously.
- the memory 2320 can be volatile memory (e.g. , registers, cache, RAM), non-volatile memory (e.g. , ROM, EEPROM, flash memory, etc.), or some combination of the two.
- the memory 2320 stores software 2380 that can, for example, implement the technologies described herein.
- a computing environment can have additional features.
- the computing environment 2300 includes storage 2340, one or more input devices 2350, one or more output devices 2360, and one or more communication connections 2370.
- An interconnection mechanism such as a bus, a controller, or a network, interconnects the components of the computing environment 2300.
- operating system software provides an operating environment for other software executing in the computing environment 2300, and coordinates activities of the components of the computing environment 2300.
- the storage 2340 can be removable or non-removable, and includes magnetic disks, magnetic tapes or cassettes, CD-ROMs, CD-RWs, DVDs, or any other medium which can be used to store information and that can be accessed within the computing environment 2300.
- the storage 2340 stores instructions for the software 2380 and data (e.g ., measurement data or correlation data), which can be used to implement technologies described herein.
- the input device(s) 2350 can be a touch input device, such as a keyboard, keypad, mouse, touch screen display, pen, or trackball, a voice input device, a scanning device, or another device, that provides input to the computing environment 2300.
- the input device(s) 2350 can be a sound card or similar device that accepts audio input in analog or digital form, or a CD-ROM reader that provides audio samples to the computing environment 2300.
- the output device(s) 2360 can be a display, printer, speaker, CD-writer, or another device that provides output from the computing environment 2300.
- the communication connection(s) 2370 enable communication over a communication medium (e.g ., a connecting network) to another computing entity.
- the communication medium conveys information such as computer-executable instructions, compressed graphics information, video, or other data in a modulated data signal.
- the input device(s) 2350, output device(s) 2360, and communication connection(s) 2370 can be used with a control system to control inputs and/or outputs for a bioreactor.
- input devices can be used with a control system for modulating feeding media, water, acid/base solutions, heat, and agitation for an aseptic bioreactor.
- output devices can be used with a control system for sampling or removing cells or fluid from a cell population on a bioreactor or to operate a flow cytometer.
- a communication connection 2370 such as an RS-232, USB, Ethernet, or other suitable connection, is used to control bioreactor operation and to adjust environmental conditions.
- Some embodiments of the disclosed methods can be performed using computer-executable instructions implementing all or a portion of the disclosed technology in a computing cloud 2390. For example, generating correlations and predicting cell viability can be performed on servers located in the computing cloud 2390.
- Computer-readable media are any available media that can be accessed within a computing environment 2300.
- computer-readable media include memory 2320 and/or storage 2340.
- the term computer-readable storage media includes the media for data storage such as memory 2320 and storage 2340, and not transmission media carrying modulated data signals or transitory signals.
- Any of the methods described herein can be performed via one or more computer-readable media (e.g ., storage or other tangible media) comprising ( e.g. , having or storing) computer-executable instructions for performing ( e.g ., causing a computing device to perform) such methods. Operation can be fully automatic, semi-automatic, or involve manual intervention.
- computer-readable media e.g ., storage or other tangible media
- Operation can be fully automatic, semi-automatic, or involve manual intervention.
Landscapes
- Chemical & Material Sciences (AREA)
- Health & Medical Sciences (AREA)
- Life Sciences & Earth Sciences (AREA)
- Engineering & Computer Science (AREA)
- Biomedical Technology (AREA)
- Physics & Mathematics (AREA)
- General Health & Medical Sciences (AREA)
- Analytical Chemistry (AREA)
- Biochemistry (AREA)
- Wood Science & Technology (AREA)
- Bioinformatics & Cheminformatics (AREA)
- Zoology (AREA)
- Organic Chemistry (AREA)
- General Physics & Mathematics (AREA)
- Immunology (AREA)
- Pathology (AREA)
- Microbiology (AREA)
- Genetics & Genomics (AREA)
- General Engineering & Computer Science (AREA)
- Sustainable Development (AREA)
- Biotechnology (AREA)
- Electrochemistry (AREA)
- Chemical Kinetics & Catalysis (AREA)
- Hematology (AREA)
- Medicinal Chemistry (AREA)
- Biophysics (AREA)
- Food Science & Technology (AREA)
- Urology & Nephrology (AREA)
- Molecular Biology (AREA)
- Cell Biology (AREA)
- Optics & Photonics (AREA)
- Spectroscopy & Molecular Physics (AREA)
- Investigating Or Analyzing Materials By The Use Of Electric Means (AREA)
Description
- This application claims priority to
U.S. Provisional Application No. 61/584,141, filed January 6, 2012 U.S. Provisional Application No. 61/699,805 filed September 11, 2012 U.S. Provisional Application No. 61/703,103, filed September 19, 2012 - The disclosed technology relates to methods and apparatus for predicting biological properties, such as viable biomass in a population of cells using an electrical signal.
- Traditionally, cell counting is performed by mixing an aliquot of a population of cells with trypan blue dye and counting cells disposed on a hemocytometer stage using a microscope. The viable cell density is then determined by visual counting methods. Such hemocytometer techniques are error-prone and require a manual sample of the bioreactor contents. Consequently, a number of alternate analytical techniques have been developed, including techniques that count cells based on electrical impedance as well as techniques that use trypan blue exclusion.
- Dielectric spectroscopy (DS) techniques measure the electrical impedance of a sample by applying a time-varying signal to the sample via electrodes. DS techniques can provide information about cell structure and properties, including intracellular contents, membrane shape and polarizability, and other cellular properties.
- The dielectric properties of biological cells can provide information regarding the cellular and molecular state of a given population of cells. The dielectric properties of biological cells are mainly characterized by the beta-dispersion, a dielectric relaxation phenomenon, which is observed in the medium and high frequency (HF) range of the radio spectrum. The beta-dispersion mechanism is due to Maxwell-Wagner polarization (interfacial polarization) at the external and internal interfaces of the phospholipid membrane, and is caused by the ability of biological cell membranes to impede electrical current. Additional contributions to the beta-dispersion may be observed due to the presence of organelles, heterogeneity of the cell population, and other phenomena.
- DS techniques to estimate dielectric properties of biological cells are discussed at, for example,
U.S. Patent Nos. 4,810,650 ,4,965,206 ,6,496,020 ,6,596,507 , and7,930,110 . In the known techniques to estimate biological property data, electrical property data are received by applying a signal to a solution of cells across multiple frequencies. SOLEY A ET AL: "On-line monitoring of yeast cell growth by impedance spectroscopy", JOURNAL OF BIOTECHNOLOGY, vol. 118, 10 September 2005, pages 398-405 and MICHAL DABROS ET AL: "Cole-Cole, linear and multivariate modeling of capacitance data for on-line monitoring of biomass", BIOPROCESS AND BIOSYSTEMS ENGINEERING, vol. 32, 11 June 2008, pages 161-173 disclose other examples of implementation of dielectric spectroscopy for monitoring dielectric properties of biological cells. - A need exists for non-destructive screening techniques to associate physical cell-specific phenomena with cell and molecular biology phenomena. Cell-based screening is a powerful method that uses living cells to test the effect of different nutrients, toxicants, and environmental factors on the cellular and molecular phenotype of cells. Thus, there is ample opportunity for the development of tools that permit systematic prediction of cell viability characteristics.
- The present invention relates to methods and apparatus for determining a biological property, such as viable biomass, using a frequency-swept electrical measuring device (e.g., a permittivity probe), and using biological properties, such as viable biomass as measured by an alternative analytical technique (such as trypan blue dye exclusion (e.g., viable biomass measured using an automated cell counter)) as a calibration.
- Methods and apparatus are disclosed for correlating a viable cell volume as measured by trypan blue dye exclusion and a viable cell volume as determined by capacitance-based methods. Certain embodiments of these techniques use information measured across a dielectric spectrum to estimate the viable cell volume a priori.
- Devices to measure the impedance of a sample can be used to predict biomass by measuring the change in capacitance of a system. These measuring devices also have the capability to measure a dielectric spectrum by measuring relative permittivity of a system using signals applied across a number of different frequencies. With some forms of biomass, when the viability of the culture begins to decrease, the accuracy of using measured capacitances of the system to predict viable biomass begins to diverge in comparison to other methods (e.g., trypan blue dye exclusion). A divergence in the value measured between the two methods is observed that is roughly proportional to the viability of the culture. This divergence can be interpreted as being caused by cells that cannot exclude the dye in the trypan blue exclusion method retaining intact, or partially intact, cell membranes. This cell membrane retention produces a residual capacitance signal, even though these cells are considered nonviable according to trypan blue dye exclusion.
- Dielectric spectroscopy is a non-invasive technique that can be used to illuminate cell-level behavior, for example, in bioreactor cell growth processes. Dielectric spectroscopy can provide a data-rich cell-level snapshot of the cells in a bioreactor. For example, measuring devices used in performing dielectric spectroscopy operate by detecting a capacitance, or ability to store electrical charge, of cells in a population (e.g., a suspension of cells) as a function of frequency applied to the measuring device. This measuring can be accomplished by performing a frequency scan, or in many cases only measuring a single capacitance value. Viable biomass can be predicted via measurement of one or more capacitance values which are indicative of the total magnitude (or intensity, and also called the dielectric increment) of the beta-dispersion curve. The dielectric increment is known to relate directly to biological property data (e.g., total biovolume) of the system via the relationship

- The current state-of-the-art assumes the measured properties are only due to viable cells, and therefore uses a capacitance measurement which is indicative of the dielectric increment to predict biomass as measured by an alternate analytical technique, including offline cell counting methods, such as trypan blue dye exclusion (e.g., using a Cedex analyzer). In the prior art methods, a relationship is determined between the magnitude of the beta-dispersion and a measured biological property.
- The relationship is applied to subsequent capacitance measurements to predict biological property data. This prediction generally proves valid when measuring viable biomass when the cells are maintaining a constant viability. The method breaks down, however, when the viability of the cells begin to change, resulting in divergences between the capacitance-based predicted viability and the viability as measured using an alternate analytical technique.
- Suitable measuring devices that can be used in performing dielectric spectroscopy are readily discernible to one of ordinary skill in the art. For example, two-terminal electrode, four-terminal electrode, coaxial chamber, single-head dielectric, and multi-wire measuring devices can be used in certain embodiments of the disclosed technology. In some examples, measuring devices include a signal generator, receiver, and signal analyzer coupled to an electrode or probe for measuring electromagnetic properties of a sample. The resulting capacitance(s), or dielectric spectrum, will be affected by cell attributes such as morphology, membrane charge, organelles, health, and/or buildup of metabolites within the cell, and the resulting capacitance(s) can therefore yield information about these attributes in real-time.
- In some embodiments, the disclosed technology allows for the accurate measurement of cell viability over the life cycle of a cell culture, not just during the growth phase. This can allow for a feeding scheme where feeds are based on biomass and hence cell demand. For example, extra-cellular reactions of a bioproduct with feed components can produce unacceptable amounts of product impurities, but some amount of feed component must be added to continue to produce the product. Thus, a variable feed based on cell biomass (e.g., viable cell volume) can allow for finer control of feed components in such situations.
- The present invention provides therefore a method and an apparatus for determining a biological property of cells suspended in a liquid media according to
independent claims 1 and 13, respectively. Preferred embodiments of the invention are set forth in the dependent claims. - The foregoing and other objects, features, and advantages of the invention will become more apparent from the following detailed description, which proceeds with reference to the accompanying figures.
-
-
FIG. 1 is a schematic of a suitable system in which described embodiments, techniques, and technologies can be implemented. -
FIG. 2 is a flow chart that illustrates a generalized example for determining relationships between biological property data and electrical property data of cells. -
FIG. 3 is a graph illustrating viability versus permittivity ratio for determining a relationship between biological property data and electrical property data obtained at two-frequencies. -
FIG. 4 is a flow chart that illustrates a method for combining measurements of the magnitude and shape of the electrical property data for obtaining a new correlation to predict biological property data in subsequent tests. -
FIG. 5 is a flow chart that illustrates a generalized example of a method of calculating divergences between received measurements and calibration measurements. -
FIGS. 6A-B are charts illustrating experimental results obtained using exemplary methods of predicting viable cell volume obtained in accordance with the disclosed technology. -
FIG. 7 is a flow chart that illustrates a generalized example of a method of correlating divergences for a number of permittivity measurements. -
FIG. 8A is a graph illustrating a series of permittivity versus frequency curves (spectra) taken at different time points, whileFIG. 8B is a graph illustrating a series of normalized permittivity versus frequency spectra taken at different time points. -
FIG. 9 illustrates an exemplary equation for normalizing permittivity data. -
FIG. 10 is a graph illustrating generating a permittivity area ratio based on different frequency portions of one of the spectra fromFIG. 8B . -
FIGS. 11 and 12 illustrate exemplary equations for determining a permittivity area ratio using electrical property data. -
FIGS. 13A and 13B are graphs illustrating experimental results obtained using exemplary methods of predicting viable cell volume obtained in accordance with the disclosed technology. -
FIG. 14 is a flow chart that illustrates a generalized example for determining relationships between biological property data and electrical property data of cells. -
FIGS. 15A-B illustrate a flow chart for a further detailed example of correlating and applying divergences of viable cell volumes calculated using an alternate analytical technique. -
FIGS. 16A-E are charts illustrating experimental results obtained using exemplary methods of predicting viable cell volume obtained in accordance with the disclosed technology. -
FIG. 17 is a flow chart that illustrates a generalized example of a method of growing cells in a conductive medium. -
FIG. 18 is a flow chart that illustrates a generalized example of a method of comparing measurements between two populations of cells, as can be used in certain embodiments of the disclosed technology. -
FIGS. 19A-F are graphs illustrating various measurements obtained over time for cell populations as can be observed using the method outlined inFIG. 18 . -
FIGS. 20A and B are graphs illustrating various measurements obtained over time for cell populations as can be observed using the method outlined inFIG. 18 . -
FIG. 21 is a flow chart that illustrates a generalized example of a method of applying a correlation based on an alternate analytical method to generate a prediction using a number of permittivity measurements. -
FIGS. 22A-C are a series of graphs illustrating changes in dielectric spectra that can be observed in certain examples of the disclosed technology. -
FIG. 23 illustrates a generalized example of a suitable computing environment in which described embodiments, techniques, and technologies can be implemented. - This disclosure is set forth in the context of representative embodiments that are not intended to be limiting in any way.
- As used in this application and in the claims, the singular forms "a," "an," and "the" include the plural forms unless the context clearly dictates otherwise. Additionally, the term "includes" means "comprises."
- Some of the disclosed methods can be implemented with computer-executable instructions stored on one or more computer-readable storage media (e.g., non-transitory computer-readable media, such as one or more volatile memory components (such as DRAM or SRAM), or nonvolatile memory components (such as hard drives) and executed on a computer. Any of the computer-executable instructions for implementing the disclosed techniques as well as any data created and used during implementation of the disclosed embodiments can be stored on one or more computer-readable media (e.g., non-transitory computer-readable media). The computer-executable instructions can be part of, for example, a dedicated software application or a software application that is accessed or downloaded via a web browser or other software application (such as a remote computing application). Such software can be executed, for example, on a single local computer (e.g., any suitable commercially-available computer) or in a network environment (e.g., via the Internet, a wide-area network, a local-area network, a client-server network (such as a cloud computing network), or other such network) using one or more network computers.
- For clarity, only certain selected aspects of the software-based implementations are described. Other details that are well known in the art are omitted. For example, it should be understood that the disclosed technology is not limited to any specific computer language or program. Likewise, the disclosed technology is not limited to any particular computer or type of hardware. Certain details of suitable computers and hardware are well-known and need not be set forth in detail in this disclosure.
- Theories of operation, scientific principles, or other theoretical descriptions presented herein in reference to the systems, methods, and apparatus of this disclosure have been provided for the purposes of better understanding and are not intended to be limiting in scope. The systems, methods, and apparatus in the appended claims are not limited to those systems, methods, and apparatus that function in the manner described by such theories of operation.
- Unless otherwise specified, the terms "capacitance" and "permittivity" are treated as equivalent for the purposes of the present disclosure, for reasons that will be readily apparent to one of ordinary skill in the relevant art. Further, unless otherwise specified, the terms "viable biomass," "viable cell volume," "biovolume," and "viable volume fraction" are treated as equivalent for the purposes of the present disclosure, for reasons that will be readily apparent to one of ordinary skill in the relevant art.
- As used in this application and in the claims, the term "magnitude" refers to the intensity, or distance between the low and high frequency plateaus, of the beta-dispersion curve obtained when measuring an electrical property of a sample of cells. As used in this application and in the claims, the term "frequency dependence" refers to a relation between the frequency of a signal applied to a sample of cells to measure an electrical property and the measurements of the electrical property thereby obtained.
- Any trademarks used herein are used for illustrative purposes only and are the property of their respective owners.
- Devices to measure the electrical properties of a population of cells can be used to predict biological property data (e.g., cell viability characteristics and biomass characteristics such as viable cell volume (VCV)) by measuring changes in capacitance and/or permittivity of a system. These measuring devices (e.g., permittivity probes) can scan across various frequencies and create a dielectric spectrum. However, with some types of cells, divergences between the capacitance-based predicted viability and the viability as measured by trypan blue exclusion (e.g., using a Cedex analyzer) are observed.
- In one example of the disclosed technology, in order to compensate for this disparity, frequency scanning data are collected over time in a fed-batch culture of cells (e.g., mammalian cells). The frequency scans are normalized (e.g., to a range of 0.0 to 1.0) by dividing the measured permittivity values by the maximum measured permittivity value. A difference in the relative shapes of the beta-dispersion curves (e.g., the dielectric spectrum consisting of measured permittivity as a function of frequency) is observed in the high frequency region during the decreasing viability phase of the culture lifetime (the phase where the divergence is observed). This shape difference in the beta-dispersion can be quantified by taking an integral ratio of the upper portion of the curve compared to the whole curve for a plurality of time points.
- In one embodiment, the integral ratio value is then correlated to the observed divergence between the trypan blue exclusion and capacitance values. The observed correlation tends to be linear. This correlation can be used to correct for divergences observed during subsequent runs, as the slope and intercept remains relatively constant between runs. Thus, embodiments of the disclosed technology allow for accurate measurements of cell viability characteristics (e.g., viable cell volume) over the entire lifetime of the culture, not just during the growth phase.
-
FIG. 1 is a schematic of asuitable system 100 for growing a culture of cells in accordance with some embodiments of the disclosed technology. Viability of the culture cells can be predicted using, for example, any of the methods described inFIGS. 2-9 and accompanying descriptions. - As shown in
FIG. 1 , anexemplary bioreactor system 100 for making a bioproduct includes abioreactor 105 having avessel 110 capable of providing an aseptic environment suitable for containing a population ofcells 120 that can produce the bioproduct. The population ofcells 120 contains media and at least one undissolved species, either as a suspension or adhered to a substrate. In some examples, the population ofcells 120 includes a mixture of cells dispersed in a liquid media (forming a suspension). Thesystem 100 also contains a sampling system 130 (e.g., a flow cytometer) operably connected to thevessel 110 and capable of extracting a sample from the vessel. Thesystem 100 also includes a measuring device 140 (e.g., a permittivity probe, or other measuring device suitable for measuring an electrical property of the population of cells 120) operably connected to thevessel 110, the measuring device being configured to measure an electrical property of the population ofcells 120 in the vessel and generate a corresponding signal in response. - A
control system 150 is provided that includes acomputing environment 155, and, in some examples, the control system can transmit and receive data and/or computer-readable instructions from computing resources in acomputing cloud 157.Software 158 for implementing the described technologies, including computer-readable instructions, can be stored on a computer-readable storage medium in thecomputing environment 155 and/or computingcloud 157. Thecontrol system 150 can use thecomputing environment 155 to analyze signals received from the measuringdevice 140 and generate output signal(s) capable of controlling one or more input and/or output devices 160-165 that are configured to measure or alter environmental conditions within thevessel 110. For example, devices 160-162 can be used for controlling and/or removing: feeding media, water, and acid or base solutions, respectively. Aheat exchanger 163 can be used to heat or cool thevessel 120. Amotor 164 is connected to animpeller shaft 165, which can be used to agitate the population of cells 120 (or to agitate the media in the bioreactor). In other examples, a magnetic impeller or other suitable stirring/agitation mechanism can be used. Not all signal and power connections between the devices 160-165 and thecontrol system 150 are depicted inFIG. 1 . - In some embodiments, the bioproduct is selected from foods, beverages, biofuels, bioenergy, bio-based ethanol, biodiesel, bio-based adhesives, biochemicals, biotherapeutics, biodegradable plastics, or mixtures thereof. In other embodiments, the bioproduct is a biotherapeutic. In still other embodiments, the bioproduct is a biotherapeutic selected from pharmaceuticals, therapeutic proteins, protein fragments, antibodies, vaccines, or mixtures thereof.
- In some examples, the vessel is selected from anaerobic fermenters, aerobic fermenters, stirred-tank reactors, adherent bioreactors, wave-type bioreactors, and disposable bioreactors.
- In some examples, the population of cells comprises live cells, dead cells, cell fragments, solid substrates having cells adhered thereto, particles, or mixtures thereof. The live cells can include bacteria, yeast, animal cells, mammalian cells, e-coli cells, or mixtures thereof. In some embodiments, the population of cells includes animal cells. In other embodiments, the population of cells includes mammalian cells.
- In some examples, biological properties of the population of cells can be selected by adjusting media-level properties and/or cell-level properties. In some embodiments, properties of the population of cells that can be measured and/or adjusted include viable cell volume (VCV), packed viable cell volume (PVCV), viable cell density (VCD), viable cell concentration (VCC), viability, cell health, or mixtures thereof. In other embodiments, properties of the population of cells that can be adjusted include pH, dissolved oxygen, osmolality, nutrient concentrations, ammonia/ammonium, lactate/lactic acid, pCO2, electrolytes (such as K+, Ca++, and/or Na+), amino acids, NAD/NADH, impurities, purity, phenotypes, metabolic states, cell cycle, or mixtures thereof.
- In some examples, suitable input devices that can be coupled to the
control system 150 include pH probes, dissolved oxygen meters, ion-selective electrodes, osmometry devices, high-performance liquid chromatographs, gas chromatographs, ion chromatographs, conductivity meters, Raman spectroscopes, near infrared spectroscopes, dielectric spectroscopes, fluorometers, ultraviolet/visible spectroscopes, capacitance probes, luminescence meters, redox probes, flow cytometers, hemocytometers, electro-rotators, electrophoresis probes, dielectrophoresis probes, or mixtures thereof. - In some examples, suitable output devices that can be configured to alter at least one property of the population of cells include mixing/agitation systems, temperature-control systems, gas pumps, nutrient pumps, product removal systems, impurity removal systems, pH adjustment systems, or mixtures thereof.
- In some embodiments, the
control system 150 is configured to alter at least one property of the population of cells within the vessel resulting in an improvement in at least one of bioproduct yield, bioproduct purity, bioproduct production rate, reduced cost, reduced energy consumption, or reduced waste generation, relative to a system that is controlled manually. In some embodiments, an aseptic sampling system is operably connected to the control system. - Bioproducts are made in bioreactors, which are systems that support a biologically active environment. Examples of bioreactors include fermenters (anaerobic or aerobic), stirred-tank reactors, adherent bioreactors, wave-type bioreactors, and disposable bioreactors. A bioreactor can include, for example, a large fermentation chamber for growing organisms that can be used to produce bioproducts.
- Bioreactors generally contain whole broth comprising a population of cells. As used herein, the term "whole broth" means the contents of the bioreactor (or a portion thereof), including "media" and "undissolved" or "adhered" species. As used herein, the term "media" means the liquid phase, including all dissolved substances, such as nutrients, dissolved organics, ionic species, etc. As used herein, the term "undissolved" or "adhered" species means the live cells, dead cells, cell fragments, solid substrates having cells adhered thereto, or other particles present in the whole broth.
- In some examples, bio-therapeutic proteins can be produced from genetically modified mammalian cells within a bioreactor. Such production can be from cell lines of established cell cultures, such as, for example, CHO or NS0. These cells express the protein of interest and subsequently secrete the protein into the media. In many instances, mammalian cells are grown in a fed-batch process. However, it should be understood that the methods and systems disclosed herein can be applicable in perfusion-type cell culture systems or other such systems.
- In some instances, bioreactors can be configured to adjust or control inputs to the bioreactor, including, for example, one or more of the following variables of pH, dissolved oxygen (DO), reactant/nutrient concentrations, temperature, or agitation. Such bioreactors can include stirred-tank type reactors, as well as adherent bioreactors, wave-type bioreactors, or disposable bioreactors.
- Bioreactors are typically equipped with a means for mixing or agitating the population of cells in the bioreactor, including using mechanical mixing, circulation pumps, shifting baffle plates, mechanical vibration schemes, ultrasonic agitation, acoustic agitators, gas bubble agitators, vortex generators, cavitation pumping, or combinations thereof. Bioreactors also typically are equipped with heat exchangers for maintaining or controlling the temperature in the bioreactor.
- The present application discloses improved methods of using the frequency dependence of electrical property data measured at two or more frequencies to determine a biological property of cells more accurately than prior art methods that rely only on measurements of the magnitude of an electrical property.
-
FIG. 2 is aflow chart 200 that outlines an exemplary method of determining a relationship between biological property data for a population of cells and a value representative of electrical property data for a population of cells. According to the present invention, a value representing the frequency dependence of said electrical property data is generated. - At
process block 210, electrical property data are received representing at least one electrical property of a population of cells. The electrical property data are obtained by applying an electrical signal to the cells at more than two signal frequencies. - The electrical property data is obtained by applying a frequency-varying signal to a population of cells with a measuring device. Suitable electrical properties that can be measured with a measuring device include capacitance, permittivity, dielectric constant, resistance, impedance, voltage, or current. For example, a permittivity probe capable of applying a number of different frequencies to a suspension of cells in a bioreactor, such as the Futura line of biomass sensors and the Biomass Monitor 200 (manufactured by Aber Instruments of the United Kingdom), and the Fogale Biomass System (manufactured by Fogale Nanotech of France) can be used to measure permittivity or capacitance of the cells when applying a frequency-varying signal. Alternatively, suitable measuring devices include external electrodes placed on the outside or inside of the bioreactor and connected to an appropriate signal generator and receiver.
- According to the present invention, the measurements are obtained by applying a frequency-varying signal (e.g., a sine wave having a frequency that is varied across a selected frequency range, or at two or more selected frequencies) to the population of cells while measuring an electrical property such as permittivity or capacitance. A number of selected frequencies can be used, for example, frequencies between 50 kHz and 10 MHz. The measured permittivity of the population of cells will vary depending on the frequency of the applied signal used to measure permittivity. For example, the permittivity can range from a high measurement of 4×10⁻⁹ Farads per meter (F/m) at a low frequency of 50 kHz to a low measurement of 1×10-11 F/m at a high frequency of 10 MHz. As used herein, the terms "low frequency" and "high frequency" are relative, and do not necessarily refer to an absolute low or high frequency.
- After receiving the electrical property data, the method proceeds to process block 220.
- At
process block 220, biological property data for measurements observed in the cells are obtained using an alternative analytical method. Exemplary biological property data include viable cell volume (VCV), packed viable cell volume (PVCV), viable cell density (VCD), viable cell concentration (VCC), viability, cell health, level of apoptosis, or mixtures thereof. - In general, the term "alternate analytical techniques" refers to techniques for obtaining calibration measurements based on analyzing cell biomass in ways other than measuring at least one electrical property of a cell population by applying a frequency-varying signal to the cell population with a measuring device. Alternate analytical techniques suitable for performing such calibration measurements include, but are not limited to: enumeration using a hemocytometer, trypan blue exclusion, caspases for measuring cell apoptosis, fluorescence-activated cell sorting using flow cytometry, or other techniques known to one of ordinary skill in the art.
- After receiving the biological property data, the method proceeds to process block 230.
- At
process block 230, values representative of the electrical property data as a function of frequency received at process block 210 are generated. According to the present invention, the value representative of the electrical property data as a function of frequency represents a shape. In one embodiment, the shape of the electrical property data refers to the curve obtained from plotting the electrical property data as a function of frequency and thus represents the frequency dependence of the electrical property. An example is the beta-dispersion curve obtained by plotting permittivity versus frequency. The beta-dispersion curve is frequency dependent. Values representative of the shape of the electrical property data are generated by appropriate data reduction over the frequencies at which electrical property data are measured. For examples outside the scope of the present invention, the representative value may be generated by fitting a curve to the electrical property data, by multi-variate analysis, by determining the slope of a line corresponding to the electrical property data, or by determining a ratio of the electrical property data measured at different frequencies. According to the present invention, the representative value is generated by determining an area ratio under the curve derived from the electrical property data. In some examples outside the scope of the present invention, the representative values represent a shape corresponding to the spectrum of electrical property data taken over two or more signal frequencies at which the respective electrical property data were obtained. In said examples, the representative values represent an area ratio. In said examples, the value representative of the shape can be obtained by fitting the beta-dispersion curve to a mathematical function such as a line, polynomial, Taylor series expansion, or other methods apparent to those familiar with curve fitting, fitting the beta-dispersion curve to a model of physical relevance such as a single or multiple term Cole-Cole model, Debye model, Davidson-Cole model, or Havriliak-Negami model, analyzing the electrical property data using multivariate methods (multi-variate or latent variable analysis), or other methods that are capable of quantifying the shape of a curve. - After generating the representative values, the method proceeds to process block 240.
- At
process block 240, a relationship between the biological property data and the representative values of the shape of the electrical property data are determined. In some embodiments, the relationship includes a correlation between the biological property data and the shape of the electrical property data, and such a correlation can be determined using the techniques described forprocess block 230. Thus, the correlation describes the relationship between the shape of the electrical property of the cells measured at two or more frequencies and measurements of biological property data, such as VCV, PVCV, VCD, VCC, viability, cell health, or level of apoptosis. - In some examples of the disclosed technology, the relationship includes a correlation generated based on permittivity measurements received at
process block 210 and calibration measurements determined using an alternate analytical technique. - The relationship generated at process block 240 can be applied to generate one or more corrected measurements based on the electrical property data received at
process block 210. For example, if the relationship includes a correlation in the form of a slope-intercept equation, the equation can be used to calculate corrected measurements based on the electrical property data. The generated correlation (between the electrical property data and biological property data) can be applied to future electrical property measurements to predict biological property values. - In an example outside the scope of the present invention, the method of the invention can utilize electrical property data obtained by applying a signal to the cells at two frequencies.
FIG. 3 is agraph 300 that indicates a frequency dependence of the electrical property data to frequency by illustrating a plot of cell viability versus a permittivity ratio when using a high frequency of 6.451 MHz, and a low frequency of 1.391 MHz. The data are given in Table 1.Table 1 Cell Culture Time (hr) Electrical Property Data Biological Property Data Permittivity at 6.451 MHz Permittivity at 1.391 MHz Value Representative of Electrical Property Data Cell Viability (%) 66 0.054 0.377 0.14 97.7 137 0.066 0.377 0.18 94.8 194 0.114 0.479 0.24 69.8 252 0.156 0.556 0.28 32.3 - The cell viability can be determined using trypan blue dye exclusion as measured by a flow cytometer.
- The value representative of the electrical property data can be determined by taking a ratio of the permittivity measured at the high frequency relative to the permittivity measured at the low frequency.
- The relationship between the value representative of the electrical property data (or shape of the beta dispersion curve) and the biological property data (in this case cell viability) can be determined by forming a linear relationship between the permittivity ratio and the cell viability, as shown by the equation shown in
FIG. 3 . This new correlation can be used to predict biological property data (e.g., cell viability) in subsequent tests. -
FIG. 4 describes a method for combining measurements of both the magnitude and shape of the measured beta-dispersion curve from a calibration experiment to achieve a more accurate prediction of viable biomass compared to using just magnitude alone. In general terms, the magnitude parameter is correlated to the biomass first, a model is fit to that correlation, and the shape parameter is used subsequently to describe the divergence (or distance) of each measurement from the magnitude model. - In
process block 410, electrical property data are obtained by applying a signal to cells in a bioreactor at multiple frequencies. These electrical property data are obtained across the beta-dispersion curve such as to allow measurement of both the shape and magnitude (dielectric increment as described above). - In
process block 420, the magnitude of the beta dispersion is quantified. Methods for quantifying the magnitude of the beta-dispersion include measurement of permittivity at a single frequency on the beta-dispersion curve, measurement of the difference between the low and high frequency plateaus of the beta-dispersion, or any other methods suitable for quantifying the magnitude of the beta-dispersion curve. - In
process block 425, the shape of the beta-dispersion curve is quantified. - In
process block 430, the magnitude of the beta-dispersion is related to biological property data obtained using alternative analytical techniques, such as those previously described, and other techniques readily ascertainable to those of ordinary skill in the relevant art. - In
process block 440, a relationship between the magnitude of the beta-dispersion and the biological property data is determined. The relationship between the magnitude of the beta dispersion curve and the biological property data can be determined as follows: a linear relationship during all or a portion of the life cycle of the cells, a linear relationship during the growth phase of the cells, or other methods readily apparent to those skilled in the art. - The relationship between the magnitude of the beta-dispersion curve and the biological property data is a linear model fit to the biological property data during the growth phase. In
process block 450, the divergence between the relationship developed inblock 440 and the biological property data is determined. In this example, the divergence is calculated by the difference between the biological property data measured by an alternative analytical technique and the predicted biological property data using the linear relationship determined during the growth phase of the cells. - In
process block 460, the shape of the beta-dispersion curve fromblock 425 is combined with the divergence inblock 450 to develop a new relationship to predict biological property data. - In
process block 470, the new relationship developed fromblock 460 is used to develop a new correlation to predict biological property data in subsequent tests (e.g., a new population of cells). These correlations (one relating magnitude of the beta-dispersion to biological property data, the other relating shape of the beta-dispersion to divergence from the first correlation) can be used in subsequent measurements of the beta-dispersion obtained from cells to obtain an improved prediction of biological property data from the current state-of-the-art. - The resulting prediction of viable cell volume therefore can be expressed in the form of the following equation:

- Where VCV is the predicted biological property data (in this case, viable cell volume), α is a constant of proportionality fit to the data, C is a value quantifying the magnitude of the beta-dispersion curve, β is a constant of proportionality fit to the data, SF is a value quantifying the shape of the beta-dispersion curve, and k is an offset value (which may be neglected in many cases). Other combinations of C and SF can be used besides this simple linear combination, which are readily ascertainable to those of ordinary skill in the relevant art.
-
FIG. 5 is aflow chart 500 that outlines an exemplary method of receiving measurements obtained by applying a frequency-varying signal to a population of cells with a measuring device, calculating divergences between the received electrical property measurements and a number of calibration measurements, and determining a relationship or correlation between the permittivity response as a function of the frequency varying signal and the divergence for generating a more accurate prediction of a viable cell volume for the population, as can be used in certain embodiments of the disclosed technology. - At
process block 510, data representing a number of measurements of an electrical property of a population of cells are received. The measurements can be obtained by applying a frequency-varying signal (e.g., a sine wave having a frequency that is varied across a selected frequency range, or at two or more selected frequencies) to the population of cells while measuring an electrical property such as permittivity or capacitance. A number of selected frequencies can be used, for example, frequencies between 50 kHz and 10 MHz. The measured permittivity of the population of cells will vary depending on the frequency of the applied signal used to measure permittivity. For example, the permittivity can range from a high measurement of 4×10⁻⁹ Farads per meter (F/m) at a low frequency of 50 kHz to a low measurement of 1×10-11 F/m at a high frequency of 10 MHz. As used herein, the terms "low frequency" and "high frequency" are relative, and do not necessarily refer to an absolute low or high frequency. In this way, electrical property data as a function of frequency can be obtained. For example, the permittivity response as a function of frequency, such as the beta dispersion curve, can be measured. - The cells can be mammalian cells (e.g. from the CHO or NS0 cell lines) suspended in a nutrient solution.
- The data collected at process block 510 can be collected over a period on the order of seconds, minutes, hours, or days, as is suited to the species of cells in the population and environmental conditions.
- With certain cells, the predicted viable cell volume (VCV) of the population (as measured by the
Aber Biomass Monitor 200 which determines VCV based on linear correlation between a measurement of the magnitude of the beta dispersion and the actual VCV measurements will begin to diverge from the actual VCV measured by trypan blue exclusion over the life cycle of the population, as illustrated in thechart 600 ofFIG. 6A. FIG. 6A illustrates viable cell volume measured using the prior art probe and by Cedex, an automated cell counting device which uses trypan blue exclusion to determine VCV by image analysis. As shown, the permittivity probe VCV prediction is indicated by square sample points (e.g., points 601 and 602), and the VCV measured by trypan blue exclusion is indicated by aline 605. After measurement data using the alternate analytical technique (in this case trypan blue exclusion method) has been collected, the method proceeds to process block 520. - At
process block 520, a calibration (in other words, a relationship) is calculated between the electrical property data as a function of frequency collected atprocess block 510 and measurements determined using an alternate analytical technique, in this case the trypan blue exclusion method. Certain cell populations exhibit a differing permittivity response for similar biomass volumes depending on the life cycle stage of the cells. Thus, the permittivity response as a function of frequency, or beta dispersion curve, can be used to identify the stage of the life cycle of the cell. For example, some cell populations exhibit differing permittivity responses before and after peak growth has been achieved. - In general, the term "alternate analytical techniques" refers to techniques for obtaining calibration measurements based on analyzing cell biomass in ways other than measuring at least one electrical property of a cell population by applying a frequency-varying signal to the cell population with a measuring device. Alternate analytical techniques suitable for performing such calibration measurements include, but are not limited to: enumeration using a hemocytometer, trypan blue exclusion, caspases for measuring cell apoptosis, fluorescence-activated cell sorting using flow cytometry, or other techniques known to one of ordinary skill in the art.
- By comparing differences in permittivity response (as a function of frequency) as measured by an electrical measuring device applying a frequency varying-signal, to a measurement of biomass volume generated by an alternate analytical technique, a calibration (or relationship) can be calculated between the permittivity response and the actual biomass volume.
FIG. 6B illustrates that the same viable cell volume will generate different permittivity values at a single frequency depending on the life cycle stage of the cells. InFIG. 6B , the permittivity measured at a single frequency is plotted against viable cell volume.FIG. 6B shows observed divergences between permittivities measured at a single frequency by the prior art probe during the growth phase of a culture (indicated by afirst portion 612 of a data series), and permittivities measured during phases of stationary and decreasing viability phases (indicated by asecond portion 614 of a data series), after peak biomass volume (here, after peak VCV) has been achieved. Such a divergence is typically caused by changes in the structure of the cell wall as the health of the cells in the culture decreases. - A calibration or relationship using the permittivity response as a function of frequency may be determined in order to improve the accuracy of future measurements of viable cell volume using the electrical property data. Turning to step 530 of
FIG. 5 , this is accomplished by characterizing the frequency dependence of the measured permittivity response by generating a value that is representative of the shape of the beta dispersion curve. A relationship is then determined between the frequency dependence of the permittivity response (that is, the value representative of the shape of the beta dispersion curve) and the viable cell volume as measured using the alternate analytical method, in this case the trypan blue exclusion method as measured by Cedex. In particular, the relationship is determined by correlating the value representative of the shape of the beta dispersion curve with the observed divergence between the magnitude of permittivity measured at a single frequency and the viable cell volume as measured using the alternate analytical method, in this case the trypan blue exclusion method as measured by Cedex. This relationship allows for the correction of the observed divergence between the viable cell volume as predicted by the prior art permittivity probe measured at a single frequency and the viable cell volume measured using trypan blue exclusion in future measurements of viable cell volume using only permittivity measurements. The calibration determined at process block 530 can then be used for measuring cell properties in other cell populations. -
FIG. 7 is aflow chart 700 that outlines an exemplary method of correlating an area ratio based on permittivity measurements obtained using a permittivity probe to measurements obtained using an alternate analytical technique, as can be used in certain embodiments of the disclosed technology. - At
process block 710, a number of permittivity measurements ε are received that are obtained by applying a frequency-varying signal to a population of cells using a suitable measuring device. For example, a permittivity probe capable of applying a number of different frequencies to a suspension of cells in a bioreactor, such as the Futura line of biomass sensors and the Biomass Monitor 200 (manufactured by Aber Instruments of the United Kingdom), and the Fogale Biomass System (manufactured by Fogale Nanotech of France) can be used. Alternatively, suitable measuring devices include external electrodes placed on the outside or inside of the bioreactor and connected to an appropriate signal generator and receiver. Suitable frequencies and techniques for applying a frequency-varying signal to a population of cells as described above regarding process block 710 can be employed. An example of a number of permittivity measurements obtained by applying a frequency-varying signal using a permittivity probe are shown inchart 800 ofFIG. 8A . As shown, four data series corresponding to measurements made at four different time periods (here, atdays - The permittivity measurements ε across all frequency spectra can be normalized to a range from 0.0 to 1.0 using the equation shown in
FIG. 9 . Thus, each permittivity measurement ε is normalized by dividing by the maximum measured permittivity εmax for a set of measurements to produce a normalized permittivity εN . The normalized permittivity εN will be used for determining area ratios R A, as described below regarding process blocks 730-750. An example of four data series of normalized permittivity measurements εN are shown inchart 850 ofFIG. 8B . As shown, each of the four data series has been corrected to range from 0.0 to 1.0 (e.g., normalizeddata series 870 corresponds todata series 820 ofFIG. 8A ). Thedata series 820 was measured 66 hours into the life cycle of the cell culture. In other examples, the permittivity measurements are not normalized. - After obtaining a number of permittivity measurements and (optionally) normalizing the permittivity measurements, the method proceeds to process block 720.
- At
process block 720, a divergence is calculated between the permittivity measurements obtained atprocess block 710 and calibration measurements determined using an alternate analytical technique in a similar fashion to those described above regardingprocess block 520. For example, the divergence between the magnitude of the permittivity measured at a single frequency and the biological property measured using the alternate analytical technique (in this case viable cell volume) is calculated for each of the measured time points. After the divergence has been calculated, the method proceeds to process block 730. - In process blocks 730 to 750, a value representative of the permittivity response as a function of frequency, or shape of the electrical property data, is calculated using area ratios under the permittivity versus frequency curves. At
process block 730, a first area a 1 is determined by integrating a number of permittivity measurements (or samples) taken between a selected low frequency f L and a selected high frequency f H. In some examples, the highest and lowest frequencies are the highest and lowest frequencies applied to the population of cells when measuring permittivities. In other examples, other high and low frequencies are used as the selected frequencies. In some examples, the permittivity measurements are normalized, as discussed above regardingprocess block 710. The first area a 1 can be calculated using any suitable technique, including quadrature polynomial interpolation, adaptive quadrature interpolation, extrapolation, and/or Monte Carlo analysis. After calculating the first area a 1, the method proceeds to process block 740. For example, thechart 1000 ofFIG. 10 shows this first area a 1 as first normalizeddata series 1020 for the range f L to f H. - At
process block 740, a second area a 2 is determined by integrating a number of permittivity measurements (or samples) taken between a selected frequency f Q and either the low frequency f L or the high frequency f H used for calculating the first area a 1 atprocess block 730. The frequency f Q is selected to be between f L and f H. In some examples, the selected frequency is predetermined at a fixed frequency (e.g., 808.5 kHz) or as a proportion of the frequency (e.g., f Q is selected to include the upper three-fourths of the frequency range between f L and f H). In other examples, the frequency f Q is selected based at least in part on the permittivity samples using a sensitivity analysis. For example, if the shape of a curve of the permittivity samples includes a "knee", or sharp change in the measured permittivity as a function of frequency (specifically in this case, an inflection point), the frequency point at the knee is used as the selected frequency f Q as an appropriate region to correct for unhealthy cells in the population. In other examples, an inflection point along the curve of the permittivity samples is used as the selected frequency f Q. In other examples, the frequency f Q is selected based on previously-measured permittivity data. Integration of the area underneath the curve formed by the permittivity samples can be performed in a similar manner as described regardingprocess block 740. For example, thechart 1000 ofFIG. 10 depicts this second area a 2 for the first normalizeddata series 1020 for the range f Q to f H. As shown inFIG. 10 , the first area a 1 comprises all of the area of the second area a 2, as well as additional area to the left of f Q. After calculating the second area a 2, the method proceeds to process block 750. - At
process block 750, an area ratio R A is calculated. The area ratio R A is a value that is representative of the shape of the permittivity versus frequency curves shown inFIG. 10 . For example, the second area a 2 divided by the first area a 1 is used as the area ratio R A. An example equation for calculating the area ratio R A for an integral between a selected frequency f Q and a high frequency f H is shown inFIG. 11 . An example equation for calculating the area ratio R A for an integral between a low frequency f L and a selected frequency f Q is shown inFIG. 12 . Other area ratio calculations can be used. An area ratio R A can be calculated for each set of permittivity measurements obtained at a particular point in time. For example, data for permittivity measurements might be obtained every 12 hours for a cell population over a period of 10 days, and a corresponding area ratio R A is calculated for each set of frequency-swept permittivity measurements. After a number of area ratios R A are calculated, the method proceeds to process block 760. - At
process block 760, a number of area ratios R A calculated at process block 750 are correlated to calibration measurements determined using the alternate analytical technique atprocess block 720. For example, viable cell volume (VCV), measured using an automated cell counter (e.g., a Cedex analyzer), can be used to automatically count cells to determine VCV using typan blue exclusion. As will be readily understood to one of ordinary skill in the art, any of a number of suitable alternate analytical techniques can be used. Further, the calibration measurements are not limited to VCV, but in some examples can include other biomass properties such as packed viable cell volume (PVCV), viable cell density (VCD), viable cell concentration (VCC), viability, cell health, level of apoptosis, or other suitable measurements. The correlation can be calculated using a suitable technique, including linear correlation methods (e.g., using Pearson's linear correlation), non-linear correlation (e.g., using Spearman's rank correlation), or matrix correlation techniques. Thus, in some examples, a correlation in slope-intercept form is calculated, while in other examples, more complex correlations are used. The correlations thus calculated can be used to correct divergences observed in other cell cultures using permittivity measurements, or measurements of other suitable electrical properties. That is, the viable cell volume predicted using the magnitude of the permittivity measured at frequency fc can be corrected using the correlation between the area ratio and the divergence to correct the viable cell volume predicted using only the magnitude of the measured permittivity. -
FIG. 13A includes achart 1360 that illustrates a number of measurements and calculations over a culture time of 250 hours based on performing the exemplary method ofFIG. 7 . As shown, aline 1361 indicates the calculated area ratios for the upper three-fourths of frequencies (as shown, above 808.5 kHz). A number of sample points (e.g.,sample points 1362 and 1363) indicate cell viability (as measured using a Cedex analyzer). Aline 1364 indicates predicted viability calculated using area ratios based on frequencies above 808.5 kHz using the method described inFIG. 7 . -
FIG. 13B includes achart 1370 that depicts acorresponding correlation 1371 generated between area ratios for the upper three-fourths of frequencies (as shown, area ratios calculated for frequencies above 808.5 kHz) and percent cell viability (as measured using a Cedex analyzer). Thus, as shown, values representative of the shape of the electrical property data (the area ratios under the permittivity versus frequency curves) can be correlated to the biological property (percent viability) measured using an alternate analytical technique. The electrical property measurements made using a frequency-swept measuring device can be used to form a fit to biological property data obtained using alternate analytical techniques, and the resulting correlation can be used in subsequent measurements to obtain more accurate predictions of the biological property. -
FIG. 14 is aflow chart 1400 illustrating an example of receiving a first set of electrical property measurements for a population of cells and applying a correlation to the first set of measurements to generate a prediction of cell viability, as can be used in some examples of the disclosed technology. - At
process block 1410, a first set of electrical property measurements (or samples) are received, the measurements being obtained from applying a frequency-varying signal to a first population of cells with a measuring device. For example, a permittivity probe can be used to measure permittivity or capacitance of the first population when applying a frequency-varying signal using similar techniques to those described above regardingprocess block 510. Suitable electrical properties that can be measured with a measuring device include capacitance, permittivity, dielectric constant, resistance, impedance, voltage, or current. After obtaining the first set of measurements, the method proceeds to processblock 1420. - At
process block 1420, a correlation is received based on a second set of electrical property measurements for a second set of cells. For example, the correlation can be determined using the techniques described above regardingFIG. 7 . Thus, the received correlation describes the relationship between an electrical property of the cell population and measurements of cell biomass, such as VCV, PVCV, VCD, VCC, viability, cell health, or level of apoptosis. After the correlation is received, the method proceeds to processblock 1430. - At
process block 1430, the correlation received atprocess block 1420 is applied to generate one or more corrected measurements based on the first set of measurements received atprocess block 1410. For example, if the correlation is in the form of a slope-intercept equation, the equation can be used to calculate corrected measurements based on normalized permittivities based on the first set of electrical property measurements. Thus, a more accurate measurement of cell state can be obtained in the first population, without the use of the alternate analytical technique(s) used to produce the correlation. -
FIGS. 15A-15B illustrate aflow chart 1500 outlining another, further detailed, example of predicting divergence of electrical properties for a population of cells to correct cell viability predictions, as can be used with certain examples of the disclosed technology. Charts depicting data associated with an example population of cells analyzed using the exemplary method depicted in theflow chart 1500 are shown inFIGS. 6A and 6B ,FIGS. 8A and8B ,FIG. 10 ,FIGS. 13A and 13B , andFIGS. 16A-E . These charts are not limited to this example method, however, and also can be used to illustrate other embodiments of the disclosed technology. - At
process block 1510, permittivity of a first population of cells is measured at one or more selected frequencies over a period of time. For example, a permittivity probe can be used to measure the capacitance at multiple frequencies during the life cycle of a population of mammalian cells, in a similar fashion to that described above regardingprocess block 210. In other examples, a capacitance, or other electrical property, of a population of cells can be measured at one or more selected frequencies over a period of time. - At
process block 1511, a number of viable cell volume measurements are measured offline for a second population of cells over a period of time using an alternate analytical method. For example, a similar population of cells of the same species as measured atprocess block 1510 can be measured using trypan blue exclusion or other methods previously mentioned. The measurements made atprocess block process block 1510. After measuring the capacitances and viable cell volumes atprocess block block 1520. - At
process block 1520, permittivity data (e.g., based on the capacitance measured at process block 1510) are received (e.g., at a suitable computing environment). The capacitance values measured atprocess block 1510 can be expressed as capacitance, permittivity, or other suitable electrical property. The permittivity data can be normalized before being received, or received in absolute or relative values and normalized using the computing environment. After receiving the permittivity data, the method proceeds to processblock 1530. - At
process block 1530, the received permittivity data based on the measured capacitances fromprocess block 1510 are compared to the viable cell volume data measured atprocess block 1511. As shown inFIG. 16A , achart 1650 of the permittivities at a single frequency (expressed in pF per cm) can be plotted along a y-axis vs. viable cell volumes (expressed in µL per mL) along an x-axis, where the viable cell volumes are measured using the alternate analytical method atprocess block 1511. As shown, alower portion 1651 of the charted permittivities represents measurements taken during the growth phase of the population of cells, while theupper portion 1652 represents measurements taken after the growth phase. Thus,FIG. 16A depicts a clear divergence of permittivity vs. viable cell volume based on the life cycle of the cells in the population. - At
process block 1532, one or more "healthy" points on the permittivity plot are selected to develop a linear correlation vs. capacitance. The healthy points are selected as the points that correspond to the growth phase of the culture. The healthy points can be selected in a number of ways. For example, a person can analyze the data and select the healthy points. Alternatively, the healthy points can be detected by comparing previously-measured permittivities. For example, when permittivity begins to fall, the growth phase is determined to have passed, and only previous permittivity samples are considered. In other examples, the healthy points can be determined based on when the viable cell volume measurements fromprocess block 1511 begin to decrease. As shown inFIG. 16C , adata point 1681 in the lower portion of the data series has been determined to be a healthy point during the growth phase, while anotherdata point 1682 of the data series has been determined to be a measurement taken after the peak viable cell volume has been achieved in the first population of cells. After a linear correlation is generated for the healthy points (represented inFIG. 16C as a line 1683), the method proceeds to processblock 1534. - At
process block 1534, the divergence (e.g., the divergences indicated byarrows FIG. 16C ) of each measurement from the linear correlation generated atprocess block 1532 is calculated. In some examples, the divergences can be filtered to select non-healthy points, by only keeping divergences above a certain absolute or percentage threshold. In other examples, all the divergences are kept for later correlation. After calculating the divergences of one or more samples from the linear correlation, the method proceeds to processblock 1540. - At
process block 1540, the divergences calculated atprocess block 1534 are correlated with an area ratio to produce a correlation for use with subsequent analyses of cell populations. That is, the divergences are correlated with a value representative of the shape of the beta dispersion curve corresponding to the respective time point at which the permittivity was measured. For example, the area ratios can be calculated in a similar fashion as the area ratios discussed above regardingFIG. 7 . An example of a correlation between area ratios in the upper three-quarters of the frequency spectrum used to measure the population of cells, and the divergences calculated atprocess block 1534, is shown in thechart 1690 ofFIG. 16D . As shown, the divergences exhibit a nearly linear correlation (represented by a line 1691) to the selected area ratios. Thus, a relationship is established between the area ratios, or value representative of the shape of the permittivity versus frequency data, and the biological property data measured by the alternate analytical technique, in this case based on the divergences between the biological property data measured by the alternate analytical technique and permittivity measured at a single frequency. - This correlation between the area ratios and the divergence between magnitude of the permittivity data and the actual viable cell volume can be used for subsequent runs for similar cells in order to correct the viable cell volume predicted by permittivity values only, especially after growth phases, where greater divergences are observed between the viable cell volume predicted by the magnitude of the permittivity and the actual cell volume as measured by the trypan blue exclusion method. The correlation can be stored in a computer-readable storage media for use by, for example, a computing environment coupled to a bioreactor control system, or, alternatively, the correlation can be stored on computer-readable storage media in a computing cloud, for example, at a website hosted by a probe manufacturer or cell line provider.
-
FIG. 15B illustrates an additional technique that can be performed once the correlation has been generated atprocess block 1540. The techniques associated with process blocks 1570-1580 can be performed by a different entity than the one performing the method associated with process blocks 1510-1540, or by the same entity. - At
process block 1570 capacitances (or, alternatively, permittivities) for a second population of cells are measured at two or more selected frequencies over a number of periods of time. For example, a permittivity probe can be used to measure the capacitance at multiple frequencies during the life cycle of a population of mammalian cells, in a similar fashion to that described above regardingprocess block 510. In some examples, the selected frequencies and/or time periods are the same as those used for the measurements made atprocess block 1510, while in other examples, the selected frequencies and/or time periods are different. - At
process block 1571, a permittivity at a single selected frequency is measured for the second population of cells (which is indicative of the magnitude of the beta-dispersion). The viable cell volume predicted by this permittivity measurement is corrected based on the permittivities measured using the frequency varying signal atprocess block 1570. The change in shape of the permittivity vs. frequency curve indicates a time where the permittivity to viable cell volume relationship begins to diverge. After the permittivities have been measured at process blocks 1570 and 1571, the method proceeds to processblock 1580. - At
process block 1580, the correlation generated atprocess block 1540 is applied to calculate a divergence of the measurements made at process blocks 1570 and/or 1571 from the correlation. Thus, by using this correlation, the prediction of viable cell volume based on permittivity measurements made at process blocks 1570 and/or 1571 can be corrected, without using alternate analytical methods. - Once divergences have been calculated, attributes of the second population of cells, such as viable cell volume (VCV), packed viable cell volume (PVCV), viable cell density (VCD), viable cell concentration (VCC), viability, cell health, or level of apoptosis can be predicted. A
chart 1695 ofFIG. 16E shows an example of the biovolume (e.g., data point 1696) as measured by a Cedex analyzer (using trypan blue exclusion), the uncorrected predicted biovolume (e.g., data series 1697) as measured by a permittivity probe, and the corrected predicted biovolume (e.g., data series 1698) based on the techniques described above. -
FIG. 17 is a flow chart illustrating an example of growing cells in a conductive medium, receiving a biomass (e.g., VCV) prediction based on a correlation between two measurement techniques, including applying a frequency varying signal to the conductive medium, and adjusting conditions of the conductive medium based on the cell viability prediction. - At
process block 1710, a population of cells is grown in a conductive medium, using, for example, thebioreactor system 100 described above regardingFIG. 1 . The cells can be grown in an aseptic environment in communication with a permittivity probe at least partially immersed in the population. In other embodiments, the probe can be immersed or otherwise interact with the population for only limited durations of time. After the cell environment is configured as desired for cell growth, the method proceeds to processblock 1720. - At
process block 1720, a corrected prediction of cell biomass (e.g., VCV) is received based on a correlation of two measurement techniques. For example, the technique of applying a frequency varying signal to the conductive medium ofprocess block 1710 can be used as the first technique for one of the measurements, and an offline measurement technique, such as trypan blue exclusion, can be used as the second measurement technique. The correlation can be linear or nonlinear, and can be based on the techniques discussed above regardingFIGS. 2 ,7 and15A-B . The prediction can be generated locally (e.g., by a control system having a computing environment) or remotely (e.g., in a computing cloud). After a prediction of cell biomass is received, the method proceeds to processblock 1730. - At
process block 1730, one or more environmental conditions of the population of cells are adjusted based on the prediction of cell biomass generated atprocess block 1720. For example, feeding media, water, acid or base solutions, or other inputs can be increased, decreased, withheld, or added. Other inputs can also be adjusted, such as the temperature of the bioreactor or agitation of the cell population. Outputs from the bioreactor can also be adjusted. For example, a sample of cells from the cell population can be acquired, or a determined fraction of the cell population volume removed from the bioreactor. The inputs and/or outputs can be selected for example, to improve the rate of cell growth, to improve cell health, or to retard or stop cell growth. Thus, a bioproduct can be produced based on the correlation of the first measurement technique to the second measurement technique. - Apoptosis (programmed cell death) is a highly-regulated, well-defined biological process. Apoptosis leads to characteristic changes in cell morphology and cell death, for example, blebbing, cell shrinking, and nuclear fragmentation. Apoptosis is essential for multicellular life, and defects in the apoptosis process can lead to fatal diseases such as cancer.
- Detection and measurement of apoptosis is useful for a number of reasons. For example, dead cells do not produce proteins or other byproducts as living cells do. Some of the causes of apoptosis are well-understood to those of ordinary skill in the art. For example, nutrient deprivation, waste accumulation, and process conditions, including oxidative stress, hypoxia, and shear, are causes of apoptosis.
- Table 2 lists a number of stain targets, along with a corresponding apoptosis phase for detecting the stain targets.
Table 2 Stain Target Apoptosis Phase DNA Very late (dead) Caspase 3 Middle Caspase 6 Middle Caspase 9 Middle Phosphatidyl-serine Early -
FIG. 18 is aflow chart 1800 that outlines an exemplary method of receiving electrical measurements obtained by applying a frequency-varying signal to two different population of cells with a measuring device, one of the populations being grown in an apoptosis-induced environment, and predicting the level of apoptosis in one of the populations, as can be used in certain embodiments of the disclosed technology. -
FIG. 19A is achart 1900 that illustrates the viability of cells (along the y-axis) in two different cell populations over a period of time (along the x-axis) in an example experiment corresponding to the method ofFIG. 18 . As shown, afirst line 1910 indicates the viability of a first population of cells, which has apoptosis induced using addition of a staurosporine agent. In this case, a 1 µM concentration of staurosporine was used. Asecond line 1915 indicates the viability of a second population of cells, which is a control population that is not induced using a staurosporine agent. - At
process block 1810, data representing a number of measurements of an electrical property of a first population of cells are received. The measurements can be obtained by applying a frequency-varying signal (e.g., a sine wave having a frequency that is varied across a selected frequency range, or at two or more selected frequencies) to the population of cells while measuring an electrical property such as permittivity or capacitance. A number of selected frequencies can be used, for example, frequencies between 50 kHz and 10 MHz. The measured permittivity of the population of cells will vary depending on the frequency of the applied signal used to measure permittivity. For example, the permittivity can range from a high measurement of 4×10⁻⁹ Farads per meter (F/m) at a low frequency of 50 kHz to a low measurement of 1×10-11 F/m at a high frequency of 10 MHz. As used herein, the terms "low frequency" and "high frequency" are relative, and do not necessarily refer to an absolute low or high frequency. The cells can be mammalian cells (e.g. from the CHO or NS0 cell lines) suspended in a nutrient solution. - The data collected at
process block 1810 can be collected over a period on the order of seconds, minutes, hours, or days, as is suited to the species of cells in the population and environmental conditions. As shown in thechart 850 ofFIG. 8B , the normalized permittivity (plotted on the y-axis) of the population of cells is measured at a number of different frequencies (plotted on the x-axis) at the following time periods after initiation of cell growth: day 3,day 6,day 8, and day 11 (870). The shape of the curve thus obtained shifts over time, due to changes in the cellular structure of the cell population. - At a designated time period, apoptosis is induced in the first population of cells by adding an apoptosis inducing agent to the environment. For example, as shown in
FIG. 19A , apoptosis is induced in the first population of cells at a time indicated by a dashedline 1919. - At
process block 1820, a second set of measurements of an electrical property for a second population of cells is received using similar techniques to those discussed regardingprocess block 1810. The second population of cells has differing environmental conditions than those used for the first population of cells atprocess block 1810. For example, the second population of cells can be a control population, that does not have apoptosis induced using an agent. Thesecond line 1915 indicates the viability of the control population. -
FIG. 19B is achart 1930 that illustrates viable cell density (VCD) (left y-axis) and cell viability percentage (right y-axis) plotted over time (x-axis) for the first and second measurements of the first and second populations of cells received atprocess block FIG. 19B , the first population of cells that is treated with staurosporine at day 14 (at atime 1933 indicated by a dashed line) exhibits declining VCD (data series 1931) and viability percentage (data series 1932). The untreated second population of cells exhibits declining VCD (data series 1935) and viability percentage (data series 1936), but at a substantially reduced rate of decline. A dashedbox 1939 indicates the time period ofFIG. 19B that is illustrated in more detail inFIGS. 19C-G . - At
process block 1830, the first set of measurements for the first population of cells and the second set of measurements for the second population of cells are compared. As shown in thechart 1940 ofFIG. 19C , a number of normalized capacitance measurements (on the y-axis) for the second set of measurements received atprocess block 1820 are plotted against the frequency at which the measurements were obtained (x-axis), respectively. A slight drift to the right is observed from measurements obtained at time 1933 (line 1945) and after 60 hours of cell growth (line 1946) aftertime 1933. - The
chart 1950 ofFIG. 19D illustrates the first set of measurements obtained from the first population of cells that has an apoptosis-inducing agent added atday 14 of cell growth. As shown, a more substantial drift to the right is observed from measurements (line 1955) obtained at thetime 1933 of adding staurosporine cell growth to 60 hours after the staurosporine addition (line 1956). - At
process block 1840, a predicted level of apoptosis is generated based on viability measurements obtained using an alternative method. For example, a correlation to viability measurements obtained using staining techniques can be used.FIGS. 20A and 20B arecharts day 2 andday 10 of cell growth of the first population of apoptosis induced cells, respectively. - As shown in
FIG. 20A , afirst histogram 2020 indicates the population of healthy cells and asecond histogram 2025 indicates the population of unhealthy cells, as determined by measuring FCS using a flow cytometer after 48 hours of cell growth in the first population of cells (before inducing apoptosis). As shown inFIG. 20B , athird histogram 2030 indicates the population of healthy cells and afourth histogram 2035 indicates the population of unhealthy cells, as determined by measuring FCS using a flow cytometer after 10 days of cell growth in the first population of cells. - By comparing differences in permittivity response of a measuring device to a prediction of biomass volume generated by an alternate analytical technique, a calibration can be calculated.
-
FIG. 21 is aflow chart 2100 that outlines an exemplary method of applying a correlation of permittivity measurements obtained at varying frequencies to measurements of a biological property obtained using an an alternate analytical technique, as can be used in certain embodiments of the disclosed technology. - At
process block 2110, a number of permittivity measurements are received that are obtained by applying a frequency-varying signal to a population of cells using a suitable measuring device, as previously described. Suitable frequencies and techniques for applying a frequency-varying signal to a population of cells as described above regardingprocess block 2110 can be employed. - The permittivity measurements across all frequency spectra can be normalized to a range from 0.0 to 1.0. After obtaining a number of permittivity measurements and (optionally) normalizing the permittivity measurements, the method proceeds to process
block 2120. - At
process block 2120, a correlation is received that has been calculated between the permittivity measurements obtained atprocess block 2110 and calibration measurements determined using an alternate analytical technique in a similar fashion to those described above, e.g., regarding process blocks 760 or 1420. After the divergence has been calculated, the method proceeds to processblock 2130. - At
process block 2130, the correlation received atprocess block 2120 is applied to generate a prediction of apoptosis in the first population of cells. In some examples, a first area a 1 is determined by integrating a number of permittivity measurements (or samples) taken between a selected low frequency f L and a selected high frequency f H. In some examples, the highest and lowest frequencies are the highest and lowest frequencies applied to the population of cells when measuring permittivities. In other examples, other high and low frequencies are used as the selected frequencies. In some examples, the permittivity measurements are normalized, as discussed above regardingprocess block 2110. The first area a 1 can be calculated using any suitable technique, including quadrature polynomial interpolation, adaptive quadrature interpolation, extrapolation, and/or Monte Carlo analysis. -
FIGS. 19E and 19F aregraphs process block 2130. As shown inFIG. 19E , a control cell population exhibits a relativelystable area ratio 1970 over time. As shown inFIG. 19F , an apoptosis-induced cell population exhibits an increase inarea ratio 1975 after an apoptosis-inducing agent is added attime 1990. Based on these observations, the change in the beta dispersion curve can be correlated and used to predict cell viability due to apoptosis in the first set of measurements obtained atprocess block 2110. -
FIGS. 22A-C is a series of charts illustrating changes in dielectric spectra for two cell populations over a 28-hour period. Data series for the first cell population, which has had apoptosis induced using staurosporine induction, are indicated by solid lines (e.g., lines 2210-2216). Data series for the second, control cell population, which has not had apoptosis induced, are indicated by dashed lines (e.g., lines 2220-2226). - A number of different analytical methods can be used to observe cell viability. For example, viable cell volume (VCV), measured using an automated cell counter (e.g., a Cedex analyzer), can be used to automatically count cells to determine VCV using trypan blue exclusion. In some examples, a cell staining technique (e.g., having a DNA, caspase 3,
caspase 6, caspase 9, or phosphatidyl-serine stain target) can be employed. As will be readily understood to one of ordinary skill in the art, any of a number of suitable alternate analytical techniques can be used. Further, the calibration measurements are not limited to VCV, but in some examples can include other biomass properties such as packed viable cell volume (PVCV), viable cell density (VCD), viable cell concentration (VCC), viability, cell health, level of apoptosis, or other suitable measurements. The correlation can be calculated using a suitable technique, including linear correlation methods (e.g., using Pearson's linear correlation), non-linear correlation (e.g., using Spearman's rank correlation), or matrix correlation techniques. Thus, in some examples, a correlation in slope-intercept form is calculated, while in other examples, more complex correlations are used. The correlations thus calculated can be used to correct for divergences observed in other cell cultures using permittivity measurements, or measurements of other suitable electrical properties. -
FIG. 23 illustrates a generalized example of asuitable computing environment 2300 in which described embodiments, techniques, and technologies can be implemented. For example, thecomputing environment 2300 can be used to generate correlations and predict viable cell volumes, as described above. - The
computing environment 2300 is not intended to suggest any limitation as to scope of use or functionality of the technology, as the technology can be implemented in diverse general-purpose or special-purpose computing environments. For example, the disclosed technology can be implemented with other computer system configurations, including hand held devices, multiprocessor systems, microprocessor-based or programmable consumer electronics, network PCs, minicomputers, mainframe computers, and the like. The disclosed technology can also be practiced in distributed computing environments where tasks are performed by remote processing devices that are linked through a communications network. In a distributed computing environment, program modules can be located in both local and remote memory storage devices. - With reference to
FIG. 23 , thecomputing environment 2300 includes at least onecentral processing unit 2310 andmemory 2320. InFIG. 23 , this mostbasic configuration 2330 is included within a dashed line. Thecentral processing unit 2310 executes computer-executable instructions and can be a real or a virtual processor. In a multi-processing system, multiple processing units execute computer-executable instructions to increase processing power and as such, multiple processors can be running simultaneously. Thememory 2320 can be volatile memory (e.g., registers, cache, RAM), non-volatile memory (e.g., ROM, EEPROM, flash memory, etc.), or some combination of the two. Thememory 2320stores software 2380 that can, for example, implement the technologies described herein. A computing environment can have additional features. For example, thecomputing environment 2300 includesstorage 2340, one ormore input devices 2350, one ormore output devices 2360, and one ormore communication connections 2370. An interconnection mechanism (not shown) such as a bus, a controller, or a network, interconnects the components of thecomputing environment 2300. Typically, operating system software (not shown) provides an operating environment for other software executing in thecomputing environment 2300, and coordinates activities of the components of thecomputing environment 2300. - The
storage 2340 can be removable or non-removable, and includes magnetic disks, magnetic tapes or cassettes, CD-ROMs, CD-RWs, DVDs, or any other medium which can be used to store information and that can be accessed within thecomputing environment 2300. Thestorage 2340 stores instructions for thesoftware 2380 and data (e.g., measurement data or correlation data), which can be used to implement technologies described herein. - The input device(s) 2350 can be a touch input device, such as a keyboard, keypad, mouse, touch screen display, pen, or trackball, a voice input device, a scanning device, or another device, that provides input to the
computing environment 2300. For audio, the input device(s) 2350 can be a sound card or similar device that accepts audio input in analog or digital form, or a CD-ROM reader that provides audio samples to thecomputing environment 2300. The output device(s) 2360 can be a display, printer, speaker, CD-writer, or another device that provides output from thecomputing environment 2300. - The communication connection(s) 2370 enable communication over a communication medium (e.g., a connecting network) to another computing entity. The communication medium conveys information such as computer-executable instructions, compressed graphics information, video, or other data in a modulated data signal.
- The input device(s) 2350, output device(s) 2360, and communication connection(s) 2370 can be used with a control system to control inputs and/or outputs for a bioreactor. For example, input devices can be used with a control system for modulating feeding media, water, acid/base solutions, heat, and agitation for an aseptic bioreactor. Further, output devices can be used with a control system for sampling or removing cells or fluid from a cell population on a bioreactor or to operate a flow cytometer. In some examples, a
communication connection 2370, such as an RS-232, USB, Ethernet, or other suitable connection, is used to control bioreactor operation and to adjust environmental conditions. - Some embodiments of the disclosed methods can be performed using computer-executable instructions implementing all or a portion of the disclosed technology in a
computing cloud 2390. For example, generating correlations and predicting cell viability can be performed on servers located in thecomputing cloud 2390. - Computer-readable media are any available media that can be accessed within a
computing environment 2300. By way of example, and not limitation, with thecomputing environment 2300, computer-readable media includememory 2320 and/orstorage 2340. As should be readily understood, the term computer-readable storage media includes the media for data storage such asmemory 2320 andstorage 2340, and not transmission media carrying modulated data signals or transitory signals. - Any of the methods described herein can be performed via one or more computer-readable media (e.g., storage or other tangible media) comprising (e.g., having or storing) computer-executable instructions for performing (e.g., causing a computing device to perform) such methods. Operation can be fully automatic, semi-automatic, or involve manual intervention.
- Having described and illustrated the principles of our innovations in the detailed description and accompanying drawings, it will be recognized that the various embodiments can be modified in arrangement and detail without departing from such principles. It should be understood that the programs, processes, or methods described herein are not related or limited to any particular type of computing environment, unless indicated otherwise. Various types of general purpose or specialized computing environments can be used with or perform operations in accordance with the teachings described herein. Elements of embodiments shown in software can be implemented in hardware and vice versa.
Claims (13)
- A method for determining a biological property of cells suspended in a liquid media, the method comprising:receiving electrical property data of the cells obtained by applying a signal to said cells at more than two signal frequencies;receiving biological property data of the cells obtained using an alternate analytical technique;generating at least one value representative of frequency dependence of said electrical property data;determining a relationship between said biological property data and said value representative of said electrical property data,wherein said value is generated by determining an area ratio under the curve derived from the electrical property data, wherein said value representative of said electrical property data represents a shape of said electrical property data relative to frequency; andwherein said relationship is used to adjust one or more environmental conditions of said cells.
- The method of claim 1, wherein said electrical property data and said biological property data are obtained at more than two time points, and said value is generated at each respective time point.
- The method of any one of the preceding claims, wherein said value is generated by:determining a first area (a1 ) by calculating an integral of said at least one electrical property between a low frequency (fL ) of said signal and a high frequency (fH ) of said signal;determining a second area (a2 ) by calculating an integral of said at least one electrical property between a selected frequency (fQ ) and said high frequency (fH ) or between said selected frequency (fQ ) and said low frequency (fL ), said selected frequency (fQ ) being greater than said low frequency (fL ) and less than said high frequency (fH ); andcalculating an area ratio based on said first area (a1 ) and said second area (a2 ).
- The method of any one of the preceding claims, wherein said relationship comprises a correlation between said biological property data and said electrical property data.
- The method of any one of the preceding claims, wherein said relationship is determined based on a divergence between the magnitude of said electrical property data and said biological property data.
- The method of any one of the preceding claims, wherein said relationship is applied to subsequent electrical property data taken from a new population of said cells to predict biological property data for said new population of said cells.
- The method of any one of the preceding claims, wherein said value is representative of both a magnitude and the frequency-dependence of said electrical property data.
- The method of any one of the preceding claims wherein a magnitude of said electrical property data is determined, and said value is used together with said magnitude to determine said biological property of said cells.
- The method of any one of the preceding claims, wherein said electrical property data includes at least one or more of the following: capacitance, permittivity, dielectric constant, resistance, impedance, voltage, or current.
- The method of any one of the preceding claims, wherein said biological property data includes at least one or more of the following: viable cell volume (VCV), packed viable cell volume (PVCV), viable cell density (VCD), viable cell concentration (VCC), viability, cell health, or the level of apoptosis.
- The method of any one of the preceding claims, wherein the one or more environmental conditions include at least one or more of the following: feed rate, temperature, agitation rate, atmospheric conditions, pH, or lighting conditions.
- The method of any one of the preceding claims, wherein said method further comprises applying a correlation to said electrical property data to generate a prediction of apoptosis for said cells, said applying comprising calculating area ratios based on at least one of the following equations:

- An apparatus comprising:a reactor for growing cells in a conductive medium;a measuring device coupled to the reactor and being configured to apply a frequency-varying electrical signal to the conductive medium to measure electrical properties of said cells;one or more processing resources coupled to said measuring device; andone or more computer-readable storage media storing computer-readable instructions that when executed by said processing resources cause said apparatus to perform the method of any one of claims 1-12.
Applications Claiming Priority (4)
| Application Number | Priority Date | Filing Date | Title |
|---|---|---|---|
| US201261584141P | 2012-01-06 | 2012-01-06 | |
| US201261699805P | 2012-09-11 | 2012-09-11 | |
| US201261703103P | 2012-09-19 | 2012-09-19 | |
| PCT/US2013/020397 WO2013103901A1 (en) | 2012-01-06 | 2013-01-04 | Dielectric spectroscopy methods and apparatus |
Publications (2)
| Publication Number | Publication Date |
|---|---|
| EP2800966A1 EP2800966A1 (en) | 2014-11-12 |
| EP2800966B1 true EP2800966B1 (en) | 2021-09-29 |
Family
ID=47595071
Family Applications (1)
| Application Number | Title | Priority Date | Filing Date |
|---|---|---|---|
| EP13700802.5A Active EP2800966B1 (en) | 2012-01-06 | 2013-01-04 | Dielectric spectroscopy methods and apparatus |
Country Status (4)
| Country | Link |
|---|---|
| US (1) | US9568449B2 (en) |
| EP (1) | EP2800966B1 (en) |
| ES (1) | ES2898637T3 (en) |
| WO (1) | WO2013103901A1 (en) |
Cited By (1)
| Publication number | Priority date | Publication date | Assignee | Title |
|---|---|---|---|---|
| WO2024091061A1 (en) * | 2022-10-28 | 2024-05-02 | 이화여자대학교 산학협력단 | Device for thermoamperometry and thermocoulometry, and analysis method using same |
Families Citing this family (16)
| Publication number | Priority date | Publication date | Assignee | Title |
|---|---|---|---|---|
| US10536357B2 (en) | 2015-06-05 | 2020-01-14 | Cisco Technology, Inc. | Late data detection in data center |
| US10142353B2 (en) | 2015-06-05 | 2018-11-27 | Cisco Technology, Inc. | System for monitoring and managing datacenters |
| DE102016203576A1 (en) * | 2016-03-04 | 2017-09-07 | Hamilton Bonaduz Ag | Method for calibrating impedance-spectroscopic biomass sensors and use of a suspension for carrying out such a method |
| WO2019071076A1 (en) | 2017-10-06 | 2019-04-11 | Lonza Ltd. | Automated control of cell culture using raman spectroscopy |
| HUE058924T2 (en) * | 2017-10-16 | 2022-09-28 | Regeneron Pharma | Perfusion procedures |
| CN107657396A (en) * | 2017-11-08 | 2018-02-02 | 海南省林业科学研究所 | A kind of artificial forest biomass modeling method |
| JP6741031B2 (en) * | 2018-01-17 | 2020-08-19 | 横河電機株式会社 | Cell inspection device, cell inspection method, program, and recording medium |
| US11898135B1 (en) * | 2019-07-01 | 2024-02-13 | CCLabs Pty Ltd | Closed-loop perfusion circuit for cell and tissue cultures |
| US12019040B2 (en) | 2019-09-30 | 2024-06-25 | Cornell University | System and devices for monitoring cell-containing materials and methods of their use |
| WO2021097281A1 (en) | 2019-11-15 | 2021-05-20 | Lonza Ltd | Process and system for producing an inoculum |
| WO2022031452A1 (en) * | 2020-08-06 | 2022-02-10 | Sanofi | Systems and methods for controlling oxygen levels |
| EP4018838B1 (en) * | 2020-12-23 | 2024-05-22 | Red Bull GmbH | Plant for the production of aqueous foodstuff, use of a ft-nir- spectrometer in a plant for the production of aqueous foodstuff, mixing device for a plant for the production of aqueous foodstuff and method for the preparation of aqueous foodstuff |
| KR20230136735A (en) * | 2021-01-21 | 2023-09-26 | 사토리우스 스테딤 바이오테크 게엠베하 | Application of dielectric probes in suspension culture aggregates containing cell aggregates |
| CA3222382A1 (en) * | 2021-06-09 | 2022-12-15 | Amgen Inc. | Assessing packed cell volume for cell cultures |
| JP2023070758A (en) * | 2021-11-10 | 2023-05-22 | 株式会社テイエルブイ | Conductivity detector |
| US20250043232A1 (en) * | 2021-12-02 | 2025-02-06 | Merck Patent Gmbh | Model-based analytical tool for bioreactors |
Family Cites Families (14)
| Publication number | Priority date | Publication date | Assignee | Title |
|---|---|---|---|---|
| CA929121A (en) | 1970-05-08 | 1973-06-26 | National Research Council Of Canada | Non-ramified culture growing apparatus |
| GB8622747D0 (en) | 1986-09-22 | 1986-10-29 | Ici Plc | Determination of biomass |
| GB8622748D0 (en) | 1986-09-22 | 1986-10-29 | Ici Plc | Determination of biomass |
| FR2617286B1 (en) | 1987-06-26 | 1991-08-30 | Commissariat Energie Atomique | SAMPLING DEVICE COMPRISING A STERILIZABLE SAMPLING HEAD MOUNTED ON A BIOREACTOR |
| EP0630471A1 (en) | 1992-03-10 | 1994-12-28 | BARNS, Christopher | Apparatus for determining the physical and/or chemical properties of a sample, particularly of blood |
| US5296197A (en) | 1992-07-09 | 1994-03-22 | Nl Technologies, Limited | Automated sample extractor or feeder/inoculator for bioreactors and similar equipment |
| GB2329711B (en) | 1997-09-27 | 2002-07-17 | Univ Wales Aberystwyth The | Capacitance measurement of a dielectric medium |
| US6300108B1 (en) | 1999-07-21 | 2001-10-09 | The Regents Of The University Of California | Controlled electroporation and mass transfer across cell membranes |
| AU5234601A (en) | 2000-04-14 | 2001-10-30 | Nanotec Solution | Device and method for determining characteristics of a biomass |
| US7635586B2 (en) | 2003-11-26 | 2009-12-22 | Broadley-James Corporation | Integrated bio-reactor monitor and control system |
| FR2874264B1 (en) | 2004-08-16 | 2006-11-24 | Nanotec Solution Soc Civ Ile | METHOD AND DEVICE FOR DETERMINING BIOMASS IN A MEDIUM, IN PARTICULAR A MEDIUM CONTAINING BIOLOGICAL CELLS, AND MEASURING APPARATUS USING THE SAME |
| FR2917498B1 (en) | 2007-06-15 | 2009-10-02 | Nanotec Solution Soc Civ Ile | METHOD AND SYSTEM FOR COUNTING CELLS ONLINE AND IN SITU IN A BIOLOGICAL CULTURE MEDIUM |
| EP2409130B1 (en) | 2009-03-20 | 2013-12-04 | Pbs Biotech, Inc. | Automatable aseptic sample withdrawal system |
| WO2011038008A2 (en) | 2009-09-23 | 2011-03-31 | Groton Biosystems, Llc | Method and apparatus for sterile sampling for gmp reactor applications |
-
2013
- 2013-01-04 ES ES13700802T patent/ES2898637T3/en active Active
- 2013-01-04 US US14/370,734 patent/US9568449B2/en active Active
- 2013-01-04 EP EP13700802.5A patent/EP2800966B1/en active Active
- 2013-01-04 WO PCT/US2013/020397 patent/WO2013103901A1/en not_active Ceased
Cited By (1)
| Publication number | Priority date | Publication date | Assignee | Title |
|---|---|---|---|---|
| WO2024091061A1 (en) * | 2022-10-28 | 2024-05-02 | 이화여자대학교 산학협력단 | Device for thermoamperometry and thermocoulometry, and analysis method using same |
Also Published As
| Publication number | Publication date |
|---|---|
| US20150019140A1 (en) | 2015-01-15 |
| WO2013103901A1 (en) | 2013-07-11 |
| US9568449B2 (en) | 2017-02-14 |
| ES2898637T3 (en) | 2022-03-08 |
| EP2800966A1 (en) | 2014-11-12 |
Similar Documents
| Publication | Publication Date | Title |
|---|---|---|
| US9568449B2 (en) | Dielectric spectroscopy methods and apparatus | |
| Cannizzaro et al. | On‐line biomass monitoring of CHO perfusion culture with scanning dielectric spectroscopy | |
| Schmidt | Optimization and scale up of industrial fermentation processes | |
| US10836991B2 (en) | Systems and methods for producing bioproducts | |
| Justice et al. | Process control in cell culture technology using dielectric spectroscopy | |
| Mandenius et al. | Mini‐review: Soft sensors as means for PAT in the manufacture of bio‐therapeutics | |
| Soley et al. | On-line monitoring of yeast cell growth by impedance spectroscopy | |
| Chrysanthopoulos et al. | Metabolomics for high-resolution monitoring of the cellular physiological state in cell culture engineering | |
| Ma et al. | Real-time monitoring and control of CHO cell apoptosis by in situ multifrequency scanning dielectric spectroscopy | |
| Günerken et al. | Flow cytometry to estimate the cell disruption yield and biomass release of Chlorella sp. during bead milling | |
| Marison et al. | The choice of suitable online analytical techniques and data processing for monitoring of bioprocesses | |
| CN115985404A (en) | Method and apparatus for monitoring and automatically controlling a bioreactor | |
| CN121780777A (en) | Dynamic monosaccharide control method | |
| Tibayrenc et al. | Assessing yeast viability from cell size measurements? | |
| Veloso et al. | Online analysis for industrial bioprocesses: broth analysis | |
| Paul et al. | Investigation of cell line specific responses to pH inhomogeneity and consequences for process design | |
| Schiewe et al. | Real‐time monitoring of biomass during Escherichia coli high‐cell‐density cultivations by in‐line photon density wave spectroscopy | |
| Maskow et al. | Observation of non-linear biomass–capacitance correlations: reasons and implications for bioprocess control | |
| CA2791211C (en) | Metabolic rate indicator for cellular populations | |
| Magnússon et al. | Determining the linear correlation between dielectric spectroscopy and viable biomass concentration in filamentous fungal fermentations | |
| EP4692296A1 (en) | Cell culture device, culture conditions determination device, and culture conditions determination method | |
| Agar et al. | Measurements and models of synchronous growth of fission yeast induced by temperature oscillations | |
| WO2025026963A1 (en) | Model supported bioprocess monitoring using raman spectroscopy | |
| AT520272A1 (en) | Measuring method for determining yeast vitality and cell number | |
| Wang et al. | Study of the interaction of CTZAMB–Cu (II) with DNA and the determination of DNA |
Legal Events
| Date | Code | Title | Description |
|---|---|---|---|
| PUAI | Public reference made under article 153(3) epc to a published international application that has entered the european phase |
Free format text: ORIGINAL CODE: 0009012 |
|
| 17P | Request for examination filed |
Effective date: 20140728 |
|
| AK | Designated contracting states |
Kind code of ref document: A1 Designated state(s): AL AT BE BG CH CY CZ DE DK EE ES FI FR GB GR HR HU IE IS IT LI LT LU LV MC MK MT NL NO PL PT RO RS SE SI SK SM TR |
|
| DAX | Request for extension of the european patent (deleted) | ||
| STAA | Information on the status of an ep patent application or granted ep patent |
Free format text: STATUS: EXAMINATION IS IN PROGRESS |
|
| 17Q | First examination report despatched |
Effective date: 20171102 |
|
| RIC1 | Information provided on ipc code assigned before grant |
Ipc: C12M 1/34 20060101ALI20210308BHEP Ipc: G01N 33/483 20060101ALI20210308BHEP Ipc: G01N 27/22 20060101AFI20210308BHEP |
|
| GRAP | Despatch of communication of intention to grant a patent |
Free format text: ORIGINAL CODE: EPIDOSNIGR1 |
|
| STAA | Information on the status of an ep patent application or granted ep patent |
Free format text: STATUS: GRANT OF PATENT IS INTENDED |
|
| RAP3 | Party data changed (applicant data changed or rights of an application transferred) |
Owner name: BEND RESEARCH, INC. |
|
| RIN1 | Information on inventor provided before grant (corrected) |
Inventor name: BREIT, JEFFERY, F. Inventor name: GRAHAM, LISA Inventor name: CARROLL, ADAM, S. Inventor name: DOWNEY, BRANDON, J. |
|
| INTG | Intention to grant announced |
Effective date: 20210421 |
|
| GRAS | Grant fee paid |
Free format text: ORIGINAL CODE: EPIDOSNIGR3 |
|
| GRAA | (expected) grant |
Free format text: ORIGINAL CODE: 0009210 |
|
| STAA | Information on the status of an ep patent application or granted ep patent |
Free format text: STATUS: THE PATENT HAS BEEN GRANTED |
|
| AK | Designated contracting states |
Kind code of ref document: B1 Designated state(s): AL AT BE BG CH CY CZ DE DK EE ES FI FR GB GR HR HU IE IS IT LI LT LU LV MC MK MT NL NO PL PT RO RS SE SI SK SM TR |
|
| REG | Reference to a national code |
Ref country code: GB Ref legal event code: FG4D |
|
| REG | Reference to a national code |
Ref country code: DE Ref legal event code: R096 Ref document number: 602013079447 Country of ref document: DE |
|
| REG | Reference to a national code |
Ref country code: CH Ref legal event code: EP Ref country code: AT Ref legal event code: REF Ref document number: 1434617 Country of ref document: AT Kind code of ref document: T Effective date: 20211015 |
|
| REG | Reference to a national code |
Ref country code: IE Ref legal event code: FG4D |
|
| REG | Reference to a national code |
Ref country code: LT Ref legal event code: MG9D |
|
| PG25 | Lapsed in a contracting state [announced via postgrant information from national office to epo] |
Ref country code: HR Free format text: LAPSE BECAUSE OF FAILURE TO SUBMIT A TRANSLATION OF THE DESCRIPTION OR TO PAY THE FEE WITHIN THE PRESCRIBED TIME-LIMIT Effective date: 20210929 Ref country code: SE Free format text: LAPSE BECAUSE OF FAILURE TO SUBMIT A TRANSLATION OF THE DESCRIPTION OR TO PAY THE FEE WITHIN THE PRESCRIBED TIME-LIMIT Effective date: 20210929 Ref country code: FI Free format text: LAPSE BECAUSE OF FAILURE TO SUBMIT A TRANSLATION OF THE DESCRIPTION OR TO PAY THE FEE WITHIN THE PRESCRIBED TIME-LIMIT Effective date: 20210929 Ref country code: RS Free format text: LAPSE BECAUSE OF FAILURE TO SUBMIT A TRANSLATION OF THE DESCRIPTION OR TO PAY THE FEE WITHIN THE PRESCRIBED TIME-LIMIT Effective date: 20210929 Ref country code: NO Free format text: LAPSE BECAUSE OF FAILURE TO SUBMIT A TRANSLATION OF THE DESCRIPTION OR TO PAY THE FEE WITHIN THE PRESCRIBED TIME-LIMIT Effective date: 20211229 Ref country code: BG Free format text: LAPSE BECAUSE OF FAILURE TO SUBMIT A TRANSLATION OF THE DESCRIPTION OR TO PAY THE FEE WITHIN THE PRESCRIBED TIME-LIMIT Effective date: 20211229 Ref country code: LT Free format text: LAPSE BECAUSE OF FAILURE TO SUBMIT A TRANSLATION OF THE DESCRIPTION OR TO PAY THE FEE WITHIN THE PRESCRIBED TIME-LIMIT Effective date: 20210929 |
|
| REG | Reference to a national code |
Ref country code: NL Ref legal event code: MP Effective date: 20210929 |
|
| REG | Reference to a national code |
Ref country code: AT Ref legal event code: MK05 Ref document number: 1434617 Country of ref document: AT Kind code of ref document: T Effective date: 20210929 |
|
| PG25 | Lapsed in a contracting state [announced via postgrant information from national office to epo] |
Ref country code: LV Free format text: LAPSE BECAUSE OF FAILURE TO SUBMIT A TRANSLATION OF THE DESCRIPTION OR TO PAY THE FEE WITHIN THE PRESCRIBED TIME-LIMIT Effective date: 20210929 Ref country code: GR Free format text: LAPSE BECAUSE OF FAILURE TO SUBMIT A TRANSLATION OF THE DESCRIPTION OR TO PAY THE FEE WITHIN THE PRESCRIBED TIME-LIMIT Effective date: 20211230 |
|
| REG | Reference to a national code |
Ref country code: ES Ref legal event code: FG2A Ref document number: 2898637 Country of ref document: ES Kind code of ref document: T3 Effective date: 20220308 |
|
| PG25 | Lapsed in a contracting state [announced via postgrant information from national office to epo] |
Ref country code: AT Free format text: LAPSE BECAUSE OF FAILURE TO SUBMIT A TRANSLATION OF THE DESCRIPTION OR TO PAY THE FEE WITHIN THE PRESCRIBED TIME-LIMIT Effective date: 20210929 |
|
| PG25 | Lapsed in a contracting state [announced via postgrant information from national office to epo] |
Ref country code: IS Free format text: LAPSE BECAUSE OF FAILURE TO SUBMIT A TRANSLATION OF THE DESCRIPTION OR TO PAY THE FEE WITHIN THE PRESCRIBED TIME-LIMIT Effective date: 20220129 Ref country code: SK Free format text: LAPSE BECAUSE OF FAILURE TO SUBMIT A TRANSLATION OF THE DESCRIPTION OR TO PAY THE FEE WITHIN THE PRESCRIBED TIME-LIMIT Effective date: 20210929 Ref country code: RO Free format text: LAPSE BECAUSE OF FAILURE TO SUBMIT A TRANSLATION OF THE DESCRIPTION OR TO PAY THE FEE WITHIN THE PRESCRIBED TIME-LIMIT Effective date: 20210929 Ref country code: PT Free format text: LAPSE BECAUSE OF FAILURE TO SUBMIT A TRANSLATION OF THE DESCRIPTION OR TO PAY THE FEE WITHIN THE PRESCRIBED TIME-LIMIT Effective date: 20220131 Ref country code: PL Free format text: LAPSE BECAUSE OF FAILURE TO SUBMIT A TRANSLATION OF THE DESCRIPTION OR TO PAY THE FEE WITHIN THE PRESCRIBED TIME-LIMIT Effective date: 20210929 Ref country code: NL Free format text: LAPSE BECAUSE OF FAILURE TO SUBMIT A TRANSLATION OF THE DESCRIPTION OR TO PAY THE FEE WITHIN THE PRESCRIBED TIME-LIMIT Effective date: 20210929 Ref country code: EE Free format text: LAPSE BECAUSE OF FAILURE TO SUBMIT A TRANSLATION OF THE DESCRIPTION OR TO PAY THE FEE WITHIN THE PRESCRIBED TIME-LIMIT Effective date: 20210929 Ref country code: CZ Free format text: LAPSE BECAUSE OF FAILURE TO SUBMIT A TRANSLATION OF THE DESCRIPTION OR TO PAY THE FEE WITHIN THE PRESCRIBED TIME-LIMIT Effective date: 20210929 Ref country code: AL Free format text: LAPSE BECAUSE OF FAILURE TO SUBMIT A TRANSLATION OF THE DESCRIPTION OR TO PAY THE FEE WITHIN THE PRESCRIBED TIME-LIMIT Effective date: 20210929 |
|
| REG | Reference to a national code |
Ref country code: DE Ref legal event code: R097 Ref document number: 602013079447 Country of ref document: DE |
|
| PG25 | Lapsed in a contracting state [announced via postgrant information from national office to epo] |
Ref country code: DK Free format text: LAPSE BECAUSE OF FAILURE TO SUBMIT A TRANSLATION OF THE DESCRIPTION OR TO PAY THE FEE WITHIN THE PRESCRIBED TIME-LIMIT Effective date: 20210929 |
|
| PLBE | No opposition filed within time limit |
Free format text: ORIGINAL CODE: 0009261 |
|
| STAA | Information on the status of an ep patent application or granted ep patent |
Free format text: STATUS: NO OPPOSITION FILED WITHIN TIME LIMIT |
|
| PG25 | Lapsed in a contracting state [announced via postgrant information from national office to epo] |
Ref country code: MC Free format text: LAPSE BECAUSE OF FAILURE TO SUBMIT A TRANSLATION OF THE DESCRIPTION OR TO PAY THE FEE WITHIN THE PRESCRIBED TIME-LIMIT Effective date: 20210929 |
|
| 26N | No opposition filed |
Effective date: 20220630 |
|
| REG | Reference to a national code |
Ref country code: BE Ref legal event code: MM Effective date: 20220131 |
|
| PG25 | Lapsed in a contracting state [announced via postgrant information from national office to epo] |
Ref country code: LU Free format text: LAPSE BECAUSE OF NON-PAYMENT OF DUE FEES Effective date: 20220104 |
|
| PG25 | Lapsed in a contracting state [announced via postgrant information from national office to epo] |
Ref country code: SI Free format text: LAPSE BECAUSE OF FAILURE TO SUBMIT A TRANSLATION OF THE DESCRIPTION OR TO PAY THE FEE WITHIN THE PRESCRIBED TIME-LIMIT Effective date: 20210929 Ref country code: BE Free format text: LAPSE BECAUSE OF NON-PAYMENT OF DUE FEES Effective date: 20220131 |
|
| PG25 | Lapsed in a contracting state [announced via postgrant information from national office to epo] |
Ref country code: IT Free format text: LAPSE BECAUSE OF FAILURE TO SUBMIT A TRANSLATION OF THE DESCRIPTION OR TO PAY THE FEE WITHIN THE PRESCRIBED TIME-LIMIT Effective date: 20210929 |
|
| REG | Reference to a national code |
Ref country code: DE Ref legal event code: R081 Ref document number: 602013079447 Country of ref document: DE Owner name: LONZA BEND INC., BEND, US Free format text: FORMER OWNER: BEND RESEARCH, INC., BEND, OR, US |
|
| PG25 | Lapsed in a contracting state [announced via postgrant information from national office to epo] |
Ref country code: HU Free format text: LAPSE BECAUSE OF FAILURE TO SUBMIT A TRANSLATION OF THE DESCRIPTION OR TO PAY THE FEE WITHIN THE PRESCRIBED TIME-LIMIT; INVALID AB INITIO Effective date: 20130104 |
|
| REG | Reference to a national code |
Ref country code: ES Ref legal event code: PC2A Owner name: LONZA BEND INC. Effective date: 20240403 |
|
| PG25 | Lapsed in a contracting state [announced via postgrant information from national office to epo] |
Ref country code: SM Free format text: LAPSE BECAUSE OF FAILURE TO SUBMIT A TRANSLATION OF THE DESCRIPTION OR TO PAY THE FEE WITHIN THE PRESCRIBED TIME-LIMIT Effective date: 20210929 Ref country code: MK Free format text: LAPSE BECAUSE OF FAILURE TO SUBMIT A TRANSLATION OF THE DESCRIPTION OR TO PAY THE FEE WITHIN THE PRESCRIBED TIME-LIMIT Effective date: 20210929 Ref country code: CY Free format text: LAPSE BECAUSE OF FAILURE TO SUBMIT A TRANSLATION OF THE DESCRIPTION OR TO PAY THE FEE WITHIN THE PRESCRIBED TIME-LIMIT Effective date: 20210929 |
|
| PG25 | Lapsed in a contracting state [announced via postgrant information from national office to epo] |
Ref country code: MT Free format text: LAPSE BECAUSE OF FAILURE TO SUBMIT A TRANSLATION OF THE DESCRIPTION OR TO PAY THE FEE WITHIN THE PRESCRIBED TIME-LIMIT Effective date: 20210929 |
|
| PG25 | Lapsed in a contracting state [announced via postgrant information from national office to epo] |
Ref country code: TR Free format text: LAPSE BECAUSE OF FAILURE TO SUBMIT A TRANSLATION OF THE DESCRIPTION OR TO PAY THE FEE WITHIN THE PRESCRIBED TIME-LIMIT Effective date: 20210929 |
|
| REG | Reference to a national code |
Ref country code: CH Ref legal event code: U11 Free format text: ST27 STATUS EVENT CODE: U-0-0-U10-U11 (AS PROVIDED BY THE NATIONAL OFFICE) Effective date: 20260201 |
|
| PGFP | Annual fee paid to national office [announced via postgrant information from national office to epo] |
Ref country code: GB Payment date: 20260126 Year of fee payment: 14 |
|
| PGFP | Annual fee paid to national office [announced via postgrant information from national office to epo] |
Ref country code: ES Payment date: 20260210 Year of fee payment: 14 |
|
| PGFP | Annual fee paid to national office [announced via postgrant information from national office to epo] |
Ref country code: IE Payment date: 20260120 Year of fee payment: 14 Ref country code: DE Payment date: 20260127 Year of fee payment: 14 |
|
| PGFP | Annual fee paid to national office [announced via postgrant information from national office to epo] |
Ref country code: FR Payment date: 20260127 Year of fee payment: 14 |
|
| PGFP | Annual fee paid to national office [announced via postgrant information from national office to epo] |
Ref country code: CH Payment date: 20260201 Year of fee payment: 14 |