EP2800427A2 - Power management in a cellular communication system - Google Patents
Power management in a cellular communication system Download PDFInfo
- Publication number
- EP2800427A2 EP2800427A2 EP14163610.0A EP14163610A EP2800427A2 EP 2800427 A2 EP2800427 A2 EP 2800427A2 EP 14163610 A EP14163610 A EP 14163610A EP 2800427 A2 EP2800427 A2 EP 2800427A2
- Authority
- EP
- European Patent Office
- Prior art keywords
- power
- sub
- cell
- transmit power
- threshold value
- Prior art date
- Legal status (The legal status is an assumption and is not a legal conclusion. Google has not performed a legal analysis and makes no representation as to the accuracy of the status listed.)
- Granted
Links
Images








Classifications
-
- H—ELECTRICITY
- H04—ELECTRIC COMMUNICATION TECHNIQUE
- H04W—WIRELESS COMMUNICATION NETWORKS
- H04W52/00—Power management, e.g. Transmission Power Control [TPC] or power classes
- H04W52/04—Transmission power control [TPC]
- H04W52/18—TPC being performed according to specific parameters
- H04W52/26—TPC being performed according to specific parameters using transmission rate or quality of service QoS [Quality of Service]
-
- H—ELECTRICITY
- H04—ELECTRIC COMMUNICATION TECHNIQUE
- H04W—WIRELESS COMMUNICATION NETWORKS
- H04W52/00—Power management, e.g. Transmission Power Control [TPC] or power classes
- H04W52/02—Power saving arrangements
- H04W52/0209—Power saving arrangements in terminal devices
- H04W52/0212—Power saving arrangements in terminal devices managed by the network, e.g. network or access point is leader and terminal is follower
-
- H—ELECTRICITY
- H04—ELECTRIC COMMUNICATION TECHNIQUE
- H04W—WIRELESS COMMUNICATION NETWORKS
- H04W52/00—Power management, e.g. Transmission Power Control [TPC] or power classes
- H04W52/04—Transmission power control [TPC]
- H04W52/18—TPC being performed according to specific parameters
- H04W52/26—TPC being performed according to specific parameters using transmission rate or quality of service QoS [Quality of Service]
- H04W52/265—TPC being performed according to specific parameters using transmission rate or quality of service QoS [Quality of Service] taking into account the quality of service QoS
-
- H—ELECTRICITY
- H04—ELECTRIC COMMUNICATION TECHNIQUE
- H04W—WIRELESS COMMUNICATION NETWORKS
- H04W52/00—Power management, e.g. Transmission Power Control [TPC] or power classes
- H04W52/04—Transmission power control [TPC]
- H04W52/30—Transmission power control [TPC] using constraints in the total amount of available transmission power
- H04W52/34—TPC management, i.e. sharing limited amount of power among users or channels or data types, e.g. cell loading
- H04W52/346—TPC management, i.e. sharing limited amount of power among users or channels or data types, e.g. cell loading distributing total power among users or channels
-
- H—ELECTRICITY
- H04—ELECTRIC COMMUNICATION TECHNIQUE
- H04W—WIRELESS COMMUNICATION NETWORKS
- H04W52/00—Power management, e.g. Transmission Power Control [TPC] or power classes
- H04W52/04—Transmission power control [TPC]
- H04W52/38—TPC being performed in particular situations
- H04W52/42—TPC being performed in particular situations in systems with time, space, frequency or polarisation diversity
-
- H—ELECTRICITY
- H04—ELECTRIC COMMUNICATION TECHNIQUE
- H04W—WIRELESS COMMUNICATION NETWORKS
- H04W72/00—Local resource management
- H04W72/04—Wireless resource allocation
- H04W72/044—Wireless resource allocation based on the type of the allocated resource
- H04W72/0473—Wireless resource allocation based on the type of the allocated resource the resource being transmission power
-
- H—ELECTRICITY
- H04—ELECTRIC COMMUNICATION TECHNIQUE
- H04W—WIRELESS COMMUNICATION NETWORKS
- H04W72/00—Local resource management
- H04W72/50—Allocation or scheduling criteria for wireless resources
- H04W72/54—Allocation or scheduling criteria for wireless resources based on quality criteria
-
- H—ELECTRICITY
- H04—ELECTRIC COMMUNICATION TECHNIQUE
- H04W—WIRELESS COMMUNICATION NETWORKS
- H04W52/00—Power management, e.g. Transmission Power Control [TPC] or power classes
- H04W52/04—Transmission power control [TPC]
- H04W52/06—TPC algorithms
- H04W52/14—Separate analysis of uplink or downlink
- H04W52/143—Downlink power control
-
- Y—GENERAL TAGGING OF NEW TECHNOLOGICAL DEVELOPMENTS; GENERAL TAGGING OF CROSS-SECTIONAL TECHNOLOGIES SPANNING OVER SEVERAL SECTIONS OF THE IPC; TECHNICAL SUBJECTS COVERED BY FORMER USPC CROSS-REFERENCE ART COLLECTIONS [XRACs] AND DIGESTS
- Y02—TECHNOLOGIES OR APPLICATIONS FOR MITIGATION OR ADAPTATION AGAINST CLIMATE CHANGE
- Y02D—CLIMATE CHANGE MITIGATION TECHNOLOGIES IN INFORMATION AND COMMUNICATION TECHNOLOGIES [ICT], I.E. INFORMATION AND COMMUNICATION TECHNOLOGIES AIMING AT THE REDUCTION OF THEIR OWN ENERGY USE
- Y02D30/00—Reducing energy consumption in communication networks
- Y02D30/70—Reducing energy consumption in communication networks in wireless communication networks
Definitions
- This invention relates to a cellular communications networks, and in particular to methods for controlling a power allocation in a base station of a cell in a cellular communications network across a plurality of sub-bands.
- the invention also relates to base stations in such a network.
- the 3rd Generation Partnership Project (3GPP) provides a means for evolved Node Bs (eNBs) to communicate with each other.
- eNBs evolved Node Bs
- 3GPP 3rd Generation Partnership Project
- HetNet heterogeneous network
- Fourth Generation (4G) cellular systems such as Long-Term Evolution (LTE) systems are currently being developed in order to improve both system performance and data rates achieved for UEs compared to that achieved by Third Generation (3G) cellular systems.
- LTE Long-Term Evolution
- 3G Third Generation
- the 4G systems are designed to improve system performance and data rates achieved for UEs, it is also important to improve the performance experienced by UEs at the edge of cells in the network.
- One of the most effective ways to make such an improvement is via power and interference management.
- power and interference management is designed to improve the overall performance of systems and the performance experienced by UEs by reducing unnecessary interference.
- the aim of this is to reduce as much power as possible in order to meet a certain satisfaction objective.
- By eliminating unnecessary transmit power it is possible to significantly improve the energy efficiency of a network.
- improvement in the energy efficiency of a single base station would not necessarily have a significant impact on the amount of money saved.
- the money saving that is achieved by improving the energy efficiency of basestations in a network having many basestations can be particularly large.
- a cellular communications network comprises more than a single cell, which means that each cell is likely to be surrounded by neighbouring cells.
- the serving basestation the basestation that is currently serving it
- the call quality experienced by that UE degrades due to a weakening in the quality of the signal received from the serving cell and due to an increase in the interference experienced from the neighbouring cells to which the UE is becoming closer.
- This type of interference is often referred to as inter-cell interference, and the mitigation of this interference is particularly important to improve the performance experienced by UEs at the edge of cells in the network.
- LTE systems It is more complicated to manage interference in LTE systems than it is to manage interference in 3G systems (such as Wideband Code Division Multiple Access (WCDMA) systems) because LTE systems involve power allocation in both the time and the frequency domain whereas 3G systems only involve power allocation in the time domain.
- WCDMA Wideband Code Division Multiple Access
- An existing method for the mitigation of inter-cell interference in a cellular communications network is based on Fractional Frequency Reuse (FFR) in which UEs in the centre of each cell of the network are allocated the same frequency, whereas UEs at the edge of cells are allocated with a subset of frequencies that are different from those of the immediate neighbour cell.
- FFR Fractional Frequency Reuse
- this existing method for the mitigation of inter-cell interference suffers from many drawbacks.
- it is necessary to carefully plan the subset of frequencies used for the UEs at the edge of cells in the network which can be a complex and time consuming process.
- the subset of frequencies are allocated statically during the network planning stage.
- This method is especially not suitable for femto-cells in which basestations are deployed in an ad hoc manner.
- this method does not take into account the dynamic distributions of traffic in the network, which can result in the spectrum of frequencies being underutilised.
- MCS modulation and coding schemes
- HetNet heterogeneous network
- femto-cells small cells
- macro cells co-exist.
- direct communication between cells may not easily be achievable (for example, since HetNets include cells that would operate under different protocols).
- Another example is in the case of inter-vendor femto cell deployment. In this situation, it is not clear whether a standard X2-interface exists between femto cells belonging to different vendors. Even if a standard X2-interface did exist, there is no guarantee that each femto cell would react appropriately according to the expectation of another.
- the present invention refines the existing algorithms discussed above to take into account the notion of energy saving.
- the present invention takes into account a factor relating to the happiness of the users of the network to continually adjust the power with the aim of saving energy.
- the invention particularly concentrates on the benefits that can be achieved at the edge of cells in the network while providing continuous refinement of power with the aim of reducing power consumption in the network.
- the present invention improves the performance experienced by UEs at the edge of cells in the network (thereby increasing the range of the cells) while eliminating unnecessary power consumption (through energy saving) in an autonomous fashion without any need for explicit communications with neighbouring cells.
- This eliminates the need to establish communication links among neighbour cells for interference the purpose of interference mitigation.
- direct interfaces such as the X2-interface
- each cell is able to autonomously perform a power allocation strategy of its own.
- each individual cell is able to adapt its own power to a desired level without the need for external communication.
- HetNet heterogeneous network
- the present invention provides a method for adjusting the downlink transmit power of networks (for example, LTE networks) in an intelligent way, which does not require dedicated interfaces among basestations of the network for interference mitigation purposes, and which significantly reduces power consumption.
- networks for example, LTE networks
- the present invention achieves energy saving at the same time as improving performance at the edge of cells in an autonomous way without the need for any exchange of information among basestations.
- the present invention is compatible with schemes where communication links exist between peer nodes as well as between nodes of different layers. It is also compatible with schemes operated at a different time scale, and in agreement with the theory surrounding the coexistence of multi-layer SON operations.
- a method for controlling a power allocation in a base station of a cell in a cellular communications network across a plurality of sub-bands comprising the steps of:
- the step of allocating the total transmit power may comprise: distributing the total transmit power across the sub-bands according to an algorithm which may produce an uneven distribution of the total transmit power across the sub-bands.
- the algorithm may be adapted to allocate a transmit power to a sub-band based on the frequency of the sub-band.
- the step of allocating the total transmit power may comprise distributing the total transmit power evenly across the sub-bands.
- the step of allocating the total transmit power may comprise, for each sub-band, determining whether a power currently allocated to the sub-band exceeds a second threshold value; and distributing the total transmit power across the sub-bands by allocating a power to each sub-band according to whether the power currently allocated to said sub-band exceeds the second threshold value.
- the step of distributing the total transmit power across the sub-bands may comprise allocating a first power to said sub-band.
- the first power may be greater than the second threshold value.
- the step of distributing the total transmit power across the sub-bands may comprise allocating a second power to said sub-band.
- the second power may be less than the second threshold value.
- the long-term performance may be a factor relating to a happiness of users in the cell.
- the happiness factor may be defined based on an average happiness of users in the cell.
- the happiness factor may be defined based on a weighted average happiness of users in the cell.
- the happiness factor may be defined based on a standard deviation of the happiness of users in the cell.
- the happiness factor may be defined based on a percentile of the happiness of users in the cell.
- the happiness factor may be defined based on a ratio of each user's average bit rate to the user's required bit rate.
- the happiness factor may be based on a scaling factor that introduces a degree of conservativeness.
- the long-term performance may be determined based on a sum of a Packet Data Convergence Protocol (PDCP) packet delay for each bearer established for the basestation per delay budget for the cell.
- PDCP Packet Data Convergence Protocol
- the long term performance may be determined based on the sum of the Packet Data Convergence Protocol (PDCP) packet delay for each bearer established for the basestation that meets a certain Quality of Service (QoS) requirement, per delay budget for the cell.
- PDCP Packet Data Convergence Protocol
- QoS Quality of Service
- the long term performance may be determined based on a sum of a percentile of a Packet Data Convergence Protocol (PDCP) packet delay for each bearer established for the basestation per delay budget for the cell.
- PDCP Packet Data Convergence Protocol
- the long term performance may be determined based on the sum of the percentile of the Packet Data Convergence Protocol (PDCP) packet delay for each bearer established for the basestation that meets a certain Quality of Service (QoS) requirement, per delay budget for that cell.
- PDCP Packet Data Convergence Protocol
- QoS Quality of Service
- the sum may be a weighted sum.
- the method may further comprise the step of adapting the total transmit power based on a short-term performance achieved by the cell.
- the step of adapting the total transmit power based on a short-term performance of the cell may comprise, determining whether the short-term performance achieved by the cell exceeds a third threshold value, and adapting the total transmit power according to whether the short-term performance achieved by the cell exceeds the third threshold value.
- the step of adapting the total transmit power may comprise increasing the total transmit power.
- the short-term performance may be determined in the same way as the long term performance at a particular time.
- the short-term performance may be determined in the same way as the long-term performance over a shorter period of time.
- a basestation configured to operate in accordance with the method of the first aspect of the invention.
- a computer program product containing code configured to cause a basestation to operate in accordance with the method of the first aspect of the invention.
- FIG. 1 shows a part of a cellular communication network 10, operating in accordance with the invention.
- the network 10 includes macrolayer base stations, or enhanced Node B's (eNBs), 12, 14, serving respective cells 16, 18, it being appreciated that there is a region of overlap between the two cells 16, 18, in which a user equipment device would be able to establish a connection with either of the base stations 12, 14.
- eNBs enhanced Node B's
- femtocell base stations Located within the cells 16, 18 are a number of femtocell base stations, or Home enhanced Node B's (HeNBs), 20, 22, 24, 26, 28, 30, 32, 34, each serving a respective cell in its immediate vicinity.
- HeNBs Home enhanced Node B's
- Figure 1 shows only a small number of such femtocells for the purposes of clarity.
- the femtocells might be individually owned by customers of the cellular network, or they might be under the common management of the premises in which they are located, such as a shopping mall, university campus, office park or large office building.
- a bearer is established between a HeNB and a UE for the transmission of data packets.
- a bearer is an Internet Protocol (IP) packet flow with a defined quality of service (QoS).
- IP Internet Protocol
- QoS quality of service
- FIG 2 shows in more detail the form of one of the base stations in the network.
- the base station 40 shown in Figure 1 might be a macrolayer base station or a femtocell base station.
- the base station 40 has transceiver circuitry 42, for converting signals to and from the formats required for transmission over the air interface.
- the base station may be intended to form part of an LTE network, and the transceiver circuitry would therefore convert the signals to and from the formats required for this.
- An antenna 44 is connected to the transceiver circuitry 42.
- the base station also has interface circuitry 46, for connection to the rest of the network.
- the interface circuitry 46 might for example be suitable for converting signals to and from the formats required for transmission over a broadband internet connection.
- the interface circuitry 46 might for example be suitable for converting signals to and from the formats required for transmission over a dedicated link to the core network of the cellular communications network.
- a modem 48 is connected between the transceiver circuitry 42 and the interface circuitry 46, for processing the signals and extracting relevant data therefrom.
- the modem 48, the transceiver circuitry 42 and the interface circuitry 46 operate under the control of a processor 50, as described in more detail below.
- One of the aspects of the operation of the base station 40 that is controlled by the processor 50 is the control of a power allocation in the base station 40 across a plurality of sub-bands.
- each sub-band consists of a fixed number of sub-carriers.
- time is slotted, and that transmissions within each cell are synchronized, so that intra-cell interference is not present.
- Two generic quantities are particularly relevant to an inter-cell interference coordination scheme for LTE-based systems.
- the first one is the concept of utility, which generally quantifies the level of satisfaction of the entity involved.
- U k ⁇ i U k,i .
- the second quantity is the transmit power.
- OFDMA Orthogonal Frequency Division Multiple Access
- the transmit power is expected to be frequency dependent.
- P k,j be the power allocated in sub-band j of cell k
- the maximum power cell k can have is P k , i.e. ⁇ j P k,j ⁇
- the whole problem of inter-cell interference coordination reduces to how P k,j , ⁇ j is allocated for each k in order to improve or maximize U.
- D j (k) corresponds to the aggregate sensitivity of the utility function to all cells due to the perturbation of its own transmit power at sub-band j .
- the downlink power adjustment algorithm takes account of the quality of service (QoS) experienced by the users.
- QoS quality of service
- a common utility function for cell k is typically defined as the sum of the logarithms of the average bit rates over all users within the cell k.
- This utility function is rooted in economics, and is motivated by the fact that a fixed increase in bit rate is more important for low bit rate than for users who are already enjoying a high bit rate.
- Another advantage of such a function is that it is smooth and continuously differentiable, thereby simplifying the complexity in computing the utility sensitivity.
- such a utility function does not readily provide a means to incorporate QoS into the power adjustment mechanism. For example, consider three users served by a base station, having bit rates of 1 Mbps, 2Mbps, and 3Mbps respectively.
- H k,i R ⁇ k , i R ⁇ k , i
- Figure 3 shows the probability density function of H k .
- H k 1
- the area of Region A in Figure 3 indicates the probability that the true happiness is below unity.
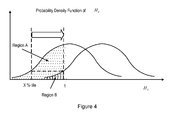
- Figure 4 illustrates a more general way to increase conservativeness, by defining H k as the X th percentile of H k,i , ⁇ i. Under this definition, only X % of the happiness would fall below unity as shown in Figure 4 .
- MCS Modulation and Coding Scheme
- each cell actively assigns the sub-carriers, power, and MCS jointly in order to minimize the overall cell downlink transmit power, subject to a certain throughput constraint.
- a scheme allows the cell to assign resources autonomously, it requires frequency UE measurement reports that include the SINR as well as downlink interference power across each frequency resource unit.
- the eNB attempts to perform a discrete optimization. However, since discrete optimization is typically computationally intensive, the computation cost is high even though the algorithm is faster. Also, the scheme requires that the downlink interference power as well as the SINR across the whole bandwidth is signalled back to the eNB from all UEs.
- the output of the optimization is not predictable in that the output of one optimization instance may give rise to a different power distribution across the bandwidth compared to the next instance. Such changes in power allocation give rise to rapid changes in the inter-cell interference patterns, which reduce the reliability of the UE measurements.
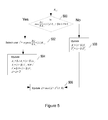
- the algorithm maintains the "virtual throughput" X i , the value of the power P j specific to a sub-band j for all j , and a variable Z (which is an accumulating parameter).
- the accumulating parameter Z represents the accumulated sum of a virtual power parameter P , which is described in more detail below.
- a small averaging parameter ⁇ is chosen in conjunction with n v such that the product of ⁇ and n v is constant.
- the algorithm runs continuously such that the initial values of the parameters X i , P j and Z are not critical.
- bit rate R i , j specific to a sub-band j that can be supported by a user i and the maximum power P * that the cell can provide are provided.
- bit rate R i,j it is determined whether the maximum value of the product of the partial derivative of the global utility function U of the system with respect to the "virtual throughput" X i experienced by user i (where U is a function on X i ), the total number of sub-bands J and the bit rate R i,j specific to a sub-band j that can be supported by a user i minus the product of the averaging parameter ⁇ , the variable Z, the virtual power parameter P and a normalizing factor ⁇ is greater than or equal to zero (step 500). In other words, it is determined whether the following condition is met: max i ⁇ ⁇ U ⁇ X i X ⁇ J ⁇ R i , j - ⁇ ⁇ ⁇ ⁇ Z ⁇ P ⁇ ⁇ 0
- the quantity P is a virtual power parameter such that P * / J ⁇ P ⁇ P * .
- the quantity ⁇ is a normalization coefficient that is used to normalize the term ZP such that a better stability can be achieved.
- a user i * is selected such that the quantity ⁇ U ⁇ X i X ⁇ R i , j is the largest (step 502).
- X i * ⁇ ⁇ J ⁇ R i * + 1 - ⁇ ⁇ X i *
- X i 1 - ⁇ ⁇ X i , ⁇ i ⁇ i *
- P ⁇ j ⁇ ⁇ P ⁇ + 1 - ⁇ ⁇ P ⁇ j
- Z ⁇ Z + P ⁇ .
- the variable X j * is updated for the selected user i * by including the estimated rate JR i * , j in the averaging.
- the quantity (1 - ⁇ ) X i* is a fraction (1- ⁇ ) taken of the previous value of the "virtual throughput" X i* experienced by the user i *.
- the quantity (1- ⁇ ) X i is a fraction (1- ⁇ ) taken of a previous value of the "virtual throughput" X i experienced by another user i .
- the quantity (1- ⁇ ) P j is a fraction (1- ⁇ ) taken of a previous value of the virtual power P j specific to sub-band j .
- step 500 If, on the other hand, it is determined in step 500 that the condition defined in Equation (7) is not satisfied (i.e. if the quantity defined in Equation (7) is less than zero), it is considered that it would be not be beneficial to include the sub-band j in the sub-bands to which power is to be allocated. Thus, in this case, no current value is included in the averaging for both bit rate and power.
- the accumulating parameter Z is updated irrespective of whether the condition defined in Equation (7) is satisfied.
- the autonomous algorithm of Figure 5 (referred to as "Algo. 1" in the Figures) is run in order to compute the potential transmit power that can be assigned to each sub-band (step 600).
- Two counters N 1 and N 2 are provided, which accumulate events of un-satisfaction and satisfaction respectively over a certain period of time. These accumulated events are representative of a long-term performance measure of the cell. From these accumulated events, it is determined whether a long-term performance achieved by the cell is satisfactory (step 602). For example, it is determined whether the long-term performance achieved by the cell exceeds a first threshold value.
- the long-term performance measure of the cell can be based on the true happiness H k of the cell that is defined in Equation (5), where the happiness specific to a user is defined in Equation (3).
- the long-term performance measure of the cell can be based on a percentile of happiness, as described with reference to Figure 4 .
- the delay budget ⁇ k,l is a delay deadline before which a packet is expected to be received by cell k. A smaller value of the delay budget ⁇
- the long-term performance measure is based on the performance that a user or a bearer in the cell can achieve using the radio resources that have been allocated. Since a bearer may make use of one or multiple sub-bands, the long-term performance measure may correspond to a particular sub-band (for example, where a bearer makes use of only one sub-band) or may correspond to a plurality of sub-bands (for example, where a bearer makes use of multiple sub-bands).
- the re-excitation branch is followed at step 604.
- the re-excitation branch it is determined whether a current happiness level is met. In other words, it is determined whether a short-term performance achieved by the cell exceeds a second threshold value.
- the counter values themselves at any given time define the short-term performance measure.
- the short-term performance measure could, for example, be calculated using Equations (10) and (11) by setting the value of ⁇ k to be much shorter than that used for the long-term performance measure.
- the short-term performance measure may be sub-band specific (for example, where a bearer makes use of only one sub-band) or may not be sub-band specific (for example, where a bearer makes use of multiple sub-bands). If the short term performance level is not met (i.e.
- the total transmit power to be allocated across the sub-bands in the autonomous algorithm of Figure 5 in the next scheduling period is increased (step 606).
- the performance achieved locally i.e. the performance experienced by users within the cell
- the counters N 1 and N 2 are modified accordingly in order to update the long-term performance measure of the cell (step 606).
- the total transmit power to be allocated across the sub-bands in the autonomous algorithm of Figure 5 in the next scheduling period is decreased (step 606).
- the counters N 1 and N 2 are modified accordingly in order to update the long-term performance measure of the cell (step 606).
- correspond to the number of sub-bands in the sets ⁇ l and ⁇ h , respectively.
- the transmit power P j to be allocated to a sub-band j is set as a first power P l .
- the transmit power P j to be allocated to a sub-band j is set as a second power P h , which is equal to the total transmit power P ⁇ minus the product of the number of sub-bands
- the first power P l is less than the third threshold value th 1 and the second power P h is greater than the third threshold value th 1 .
- the total transmit power may be distributed in this way when the power profile from the algorithm of Figure 5 is available. Instead of two power levels, multiple power levels can be incorporated.
- Figure 7 illustrates an example of a power profile produced by the algorithm of Figure 5 ("Algo 1") and an example of an adjusted power profile produced according to Equation (12) when the long-term performance achieved by the cell is less than the first threshold value.
- the power profiles show how the total transmit power is distributed across the sub-bands, i.e. the values of power allocated to each sub-band.
- the total transmit power is distributed evenly across the sub-bands (step 608).
- the total transmit power may be distributed in this way when the power profile from the algorithm of Figure 5 is unavailable.
- the total transmit power may be adjusted. While the neighbouring cells are using a specific power profile across the sub-bands in order to ensure a good level of orthogonality, the cell with a low long-term performance evenly re-distributes the power across the sub-bands. Such a uniform distribution of power allows the usage of more sub-bands, including those potentially not used by the neighbours. While this can potentially cause an increase in the level of interference experienced by neighbour cells, it can also potentially improve the performance experienced by users in the cell that had a low long-term performance. Once the long-term performance becomes satisfactory, the local optimization can then be invoked.
- the total transmit power for input into the autonomous algorithm of Figure 5 is updated (step 610) and the process is then repeated in the next scheduling period by again running the algorithm of Figure 5 (step 600).
- the local optimization branch is followed at step 604.
- the local optimization branch it is determined whether a current happiness level is met. In other words, it is determined whether a short-term performance achieved by the cell exceeds a second threshold value.
- the total transmit power to be allocated across the sub-bands in the autonomous algorithm of Figure 5 in the next scheduling period is increased (step 612). In this way, the performance achieved locally (i.e. the performance experienced by users within the cell) is improved.
- the counters N 1 and N 2 are modified accordingly in order to update the long-term performance measure of the cell (step 612).
- the total transmit power to be allocated across the sub-bands in the autonomous algorithm of Figure 5 in the next scheduling period is decreased (step 612).
- the counters N 1 and N 2 are modified accordingly in order to update the long-term performance measure of the cell (step 612).
- the total transmit power is distributed across the sub-bands based on the results of the autonomous algorithm of Figure 5 (step 614).
- This algorithm of Figure 5 may produce an uneven distribution of transmit power across the sub-bands.
- the transmit power is sub-band specific.
- the algorithm of Figure 5 is used to "orthogonalise" the transmit powers among basestations of the network so as to avoid interference between basestations as much as possible. For example, where a basestation allocates a high power distribution to a particular sub-band, a neighbouring basestation would allocate a low power distribution to that particular sub-band.
- the same performance can be maintained while the interference with other cells can be reduced.
- the total transmit power for input into the autonomous algorithm of Figure 5 is updated (step 610) and the process is then repeated in the next scheduling period by again running the algorithm of Figure 5 (step 600).
- the power to be allocated across the sub-bands in the algorithm of Figure 5 (i.e. the power that is subsequently input into the algorithm of Figure 5 in the next scheduling period) is adjusted based on whether the long-term satisfaction and the short-term satisfaction achieved by the cell are satisfactory. This maintains an optimum performance level locally (i.e. an optimum performance level experienced by users within the cell) and thus protects the stability associated with the cell.
- the power could also be increased within the algorithm of Figure 5 at a sub-band level.
- the counter N 1 is set to zero
- the counter N 2 is set to a maximum value N 2 max
- the power P ⁇ is set to a maximum value
- ⁇ P ⁇ is set to ⁇ P ⁇ , where P ⁇ is the total power to be shared among sub-bands and ⁇ is a fraction (i.e. a value between 0 and 1).
- the step size ⁇ P ⁇ is set to a fraction of the total power P ⁇ .
- the autonomous algorithm of Figure 5 is run in order to compute the potential transmit power P j that can be assigned to each sub-band (step 902).
- the total transmit power P ⁇ is increased by an amount a 2 ⁇ P ⁇ (limited by a maximum power P max ), the counter N 1 is incremented by one (limited by the maximum count and the counter N 2 is reset to zero.
- a 2 is a variable that scales the step size ⁇ P ⁇ to be used for the power adjustment.
- step 910 the algorithm waits for the next occasion to update (step 912) and the process is then repeated in the next scheduling period by again running the algorithm of Figure 5 (step 902).
- the predetermined value ⁇ H ⁇ is the product of a hysteresis factor ⁇ and the predetermined value H ⁇ .
- the hysteresis factor ⁇ may, for example, be a value slightly larger than one (such as a value of 1.2, etc).
- step 912 the algorithm waits for the next occasion to update (step 912) and the process is then repeated in the next scheduling period by again running the algorithm of Figure 5 (step 902).
- the total transmit power P ⁇ is decreased by an amount a 2 ⁇ P ⁇ (limited by a minimum power P min ), the counter N 1 is reset to zero, and the counter N 2 is incremented by one (limited by the maximum count N 2 max ).
- step 910 the algorithm waits for the next occasion to update (step 912) and the process is then repeated in the next scheduling period by again running the algorithm of Figure 5 (step 902).
- the total transmit power P ⁇ is increased by an amount a 1 ⁇ P ⁇ (limited by a maximum power P max ), the counter N 1 is incremented by one (limited by the maximum count N 1 max ), and the counter N 2 is reset to zero.
- a 1 is a variable that scales the step size ⁇ P ⁇ to be used for the power adjustment.
- variables a 1 and a 2 are constant values that allow the flexibility to adjust the power for the local optimization branch (steps 918 to 924) and the re-excitation branch (steps 906 to 912) respectively at different rates, i.e. to allow the effective step size ⁇ P ⁇ used for the power adjustment to be different between the two branches.
- the algorithm waits for the next occasion to update (step 924) and the process is then repeated in the next scheduling period by again running the algorithm of Figure 5 (step 902).
- step 926 If it is determined that the happiness H is not less than the predetermined value H ⁇ , i.e. if the condition H ⁇ H ⁇ is not met, it is determined whether the happiness H is greater than or equal to ⁇ H ⁇ , i.e. it is checked whether the condition H ⁇ ⁇ H ⁇ is met (step 926).
- step 912 the algorithm waits for the next occasion to update (step 912) and the process is then repeated in the next scheduling period by again running the algorithm of Figure 5 (step 902).
- the total transmit power P ⁇ is decreased by an amount a 1 ⁇ P ⁇ (limited by a minimum power P min ), the counter N 1 is reset to zero, and the counter N 2 is incremented by one (limited by the maximum count N 2 max ).
- the algorithm waits for the next occasion to update (step 924) and the process is then repeated in the next scheduling period by again running the algorithm of Figure 5 (step 902).
- the total transmit power P j to be allocated to sub-band j is set (step 806 or 808) immediately after the long-term performance check is performed (step 804) in the embodiment shown in Figure 9 . Also, depending on which branch (step 806 or 808) is selected based on the result of the long-term performance check (in step 804), the variable a is set accordingly. As before, the variable a scales the effective step size to be used for the power adjustment.
- the Quality of Service (QoS) requirement is incorporated directly into the algorithm and it is possible to adjust the downlink power directly based on the current level of happiness achieved.
- QoS Quality of Service
- the power adjustment according to the invention is based on the total power. It should be noted that the power for the pilot channel and other control channels can be excluded, depending on the specific implementation.
- the total power P ⁇ is used as the input to the autonomous algorithm of Figure 5 instead of a fixed power P * that is used in existing methods.
- P * a fixed power that is used in existing methods.
- each power adjustment step according to the invention modifies the total power P ⁇ and allows the autonomous algorithm to compute the sub-band specific power P j , ⁇ j . This results in a much more stable and usable algorithm.
- the invention combines the benefits of resource orthogonalisation and improves the cell-specific happiness by re-introducing the full reuse when the happiness starts to degrade. At that point, the happiness tends to increase until it reaches a point (with some hysteresis) where the autonomous algorithm is reintroduced.
- the re-introduction of the autonomous algorithm allows the power adjustment to be performed at a slightly different initial condition, and thereby potentially drives the solution to an improved local optimum.
- the invention allows the power to continuously improve in the long run.
- the invention can be viewed as a state machine.
- the input to the autonomous algorithm of Figure 5 is R i,j , ⁇ i,j , which is the bit rate that can be achieved by sub-band j for user i .
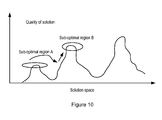
- the output of the algorithm is the sub-band specific power P j , ⁇ j . It is noted that the power P j , ⁇ j may be considered optimal only within a certain region of solution space, i.e. local optimal solution (as shown in Figure 10 ).
- the bit rates R i,j , ⁇ i,j are affected due to the change of the power distribution across the sub-bands.
- This "excitation” may cause the solution to potentially "jump” to a solution space in which a better solution quality can be found (as shown in Figure 10 ).
- the subsequent re-introduction of the autonomous algorithm of Figure 5 makes use of the new set of bit rates and outputs a potentially better set of power profiles P j , ⁇ j , as shown in Figure 10 .
- Figures 11-24 are numerical illustrations that show the benefit of the invention performed in a practical scenario.
- the scenario is based on a dual-stripe model such as that disclosed in, "interference Management in OFDMA Femtocells", Small Cell Forum, March 2010.
- One dual stripe apartment block is included, with four apartments per row, and the femto activation ratio of 1.0 and deployment ratio 1.0 are assumed.
- There is one HeNB in each activated apartment which is randomly distributed within the room, with four UEs being served by each HeNB.
- the 3km/hr Pedestrian A channel model is used.
- the maximum total downlink power is 20dBm for each HeNB.
- the value of the weighting parameter w is set to 8.
- Figure 11 illustrates a cumulative distribution function (CDF) of a user bit rate for various values of rate requirement and hysteresis parameter ⁇ , obtained with and without a re-excitation mechanism.
- CDF cumulative distribution function
- a reference case is included whereby power management is disabled and the total downlink power is fixed and uniformly distributed across the sub-bands. It can be seen that the average user bit rate for the reference case is very good. In this case, only 5% of users achieve approximately 20.0 bytes/TTI, which is significantly below the required bit rate. However, in comparison, even those 5% of users are able to achieve the required bit rate when the algorithm of the invention is employed.
- the inter-cell interference would have a greater impact on the UEs at the edge of the cells.
- the average user bit rate is generally lower when the algorithm of the invention is employed due to the restriction of the rate requirement.
- the sub-band power adjustment of the invention enables the power to be adapted in such a way that the power allocation among neighbours is relatively orthogonal among sub-bands. As expected, as the required bit rate decreases, the average user bit rate is reduced correspondingly. More importantly, as can be seen in Figure 11 , the performance improvement of users at the cell edge associated with invention is significant relative to those of the reference case. The invention prevents unnecessary energy being wasted on more central users that are already experiencing a satisfactory performance at the expense of the users at the cell edge. By redistributing the power appropriately, the performance experienced by users at the cell edge is improved while energy is saved.
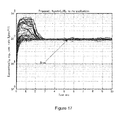
- Figures 12 and 13 illustrate a change in user bit rate for a bit rate requirement of 120 Bytes/TTI obtained with and without the re-excitation mechanism of the invention.
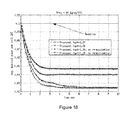
- Figure 14 illustrates a change in average downlink transmit power per Home enhanced Node B (HeNB).
- HeNB Home enhanced Node B
- the power associated with the reference case is constant.
- the re-excitation mechanism allows the power optimisation to be carried out opportunistically, and thereby allows power to be adapted depending on the current interference situation. The implication is that a significant power saving is possible.
- without employing the algorithm of the invention it is not possible to maintain a continuous power reduction at the selected required bit rate. In other words, only a small improvement on power efficiency can be achieved without the presence of the re-excitation mechanism of the invention.
- a higher value of the hysteresis value ⁇ improves the overall average cell performance at the expense of slightly higher power utilization.
- Figure 15 illustrates a CDF of a user bit rate for various values of hysteresis parameter ⁇ , obtained with and without a re-excitation mechanism, for the case of a smaller rate requirement.
- the algorithm with the re-excitation mechanism of the invention provides an improved performance compared to the algorithm without the re-excitation mechanism.
- Figures 16 and 17 illustrate a change in user bit rate for the case of the smaller rate requirement with and without a re-excitation mechanism respectively. It can be seen in Figures 16 and 17 that as long as there is sufficient power resource relative to the required bit rate, the user bit rates provide suitable coverage to the required target. The higher the required bit rate, the more variation there will be in the bit rate. This would result in more effort being required to sufficiently improve the bit rate of users that have the worst bit rate to meet the target bit rate. On the other hand, at a lower required bit rate, less effort would be required to improve the bit rate of those users.
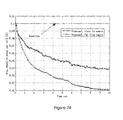
- Figure 18 illustrates a change in average downlink transmit power per Home enhanced Node B (HeNB) for the case of the smaller rate requirement for the cases with and without the re-excitation mechanism. It can be seen that although both the algorithm with the re-excitation mechanism and the algorithm without the re-excitation mechanism can maintain the user bit rate to the desired level shown in Figure 17 , the algorithm without the re-excitation mechanism still requires a much higher level of transmit power.
- HeNB Home enhanced Node B
- Figure 19 illustrates a CDF of a user bit rate for various values of hysteresis parameter ⁇ and a bit rate requirement of 120 Bytes/TTI with two different random seeds. As expected, some statistical variation occurs at the extreme ends of the bit rates. However, the results suggest that the average performance experienced as a result of the two different seeds are similar.
- Figure 20 illustrates a change in user bit rate for various values of hysteresis parameter ⁇ and a bit rate requirement of 120 Bytes/TTI with two different random seeds. Again, it can be seen that the dynamics of the algorithm due to the random seeds are similar, and that the statistical fluctuations should not have any impact on the conclusion of the results.
- a set of simulation cases have been performed in order to investigate the impact on performance due to the presence of the macro base station.
- the simulation involves placing the femto block close to a transmitter of a macrolayer basestation (as shown in Figure 21 ) and placing the femto block far away from the transmitter of the macrolayer basestation (as shown in Figure 22 ).
- the hysteresis is set to 1.50
- the macro antenna model is based on the cosine antenna model with a 3dB beamwidth of 60 degree
- the transmit power of the macrolayer basestation is 46dBm.
- Figure 23 illustrates a CDF of a user bit rate for a bit rate requirement of 120 Bytes/TTI in the case where the femto block is placed far away from the transmitter of the macrolayer basestation and the case where the femto block is placed close to the transmitter of the macrolayer basestation. It can be seen that, as expected, the user bit rate performance in the case where the femto block is close to macro transmitter is worse than that of the case where the femto block is far from the macro transmitter. However, the average performances between the two cases are very similar. This is expected since the happiness criterion is based on the average cell performance. Of course, if the happiness criterion is based on the X-percentile, then, as long as the resources are available, the X-percentile performance between the two cases should be similar.
- Figure 24 illustrates a change in average downlink transmit power per Home enhanced Node B (HeNB) for a bit rate requirement of 120 Bytes/TTI in the case where the femto block is placed far away from the transmitter of the macrolayer basestation and the case where the femto block is placed close to the transmitter of the macrolayer basestation. Due to the presence of the macrolayer basestation, the performance associated with the femto block that is close to the macrolayer basestation requires more power to maintain the required performance than the case where the femto block is far away. However, the results suggest that even when the femto block is very close to the macrolayer basestation, the increased macro interference does not deter the cell edge performance improvement or the energy saving. Although, a high transmit power is required to overcome the additional interference.
- HeNB Home enhanced Node B
- the invention is described in terms of performing power adaptations among cells autonomously, it is to be understood that the invention is also compatible with schemes where communication links between nodes exists.
- the invention could be employed in a deployment scenario with two layers (a macro layer and a small cells layer). In this case, only the nodes in the small cell layer may be using the autonomous algorithm of the invention.
- the algorithm of the invention assumes certain maximum and minimum powers for each cell as inputs. While the cell power across different sub-bands can be adaptively adjusted in order to provide good cell-edge protection and energy saving autonomously, the maximum and minimum powers could also be adjusted much more slowly (for example, depending on the time of the day, the traffic density conditions, etc).
- the invention may also be employed with a centralised entity whereby the entity may adjust the power range (i.e. by the adjustment of the maximum and minimum powers) with which each cell can operate.
- the centralised entity may, for example, employ a high level algorithm on a global level and the algorithm of the invention to perform its local optimization autonomously.
- the algorithm of the invention is also compatible with a self-organising network mechanism operating at a different time scale.
- the invention makes use of the QoS requirement to adjust the downlink transmit power in the frequency domain and incorporates the notion of "happiness" in an autonomous algorithm.
- the "happiness" level of the cell is continuously monitored and the autonomous algorithm is intelligently triggered to provide power adaptation.
- the intelligent way in which the algorithm of the invention adjusts downlink transmit power of a network significantly reduces power consumption, while still achieving the service requirement, and thereby reduces costs.
- the algorithm of the invention also improves the performance experienced by users at the cell-edge to provide improved cell-edge coverage, and thereby enhances the satisfaction of users at the cell edge and extends the cell range.
- the algorithm of the invention eliminates the need to establish communication links among neighbour cells for interference purposes. This greatly simplifies the deployment and planning from an interference point of view since the individual cell power would self-adapt to a desired level. This is particularly beneficial in the context of a HetNet.
- the algorithm of the invention is also compatible with schemes where communication links between peer nodes, as well as between nodes of different layers, exits.
- the algorithm of the invention is also compatible with schemes operated at a different time scale, and where there coexist multi-layer operations.
- the algorithm of the invention applies to any technology involving frequency domain power control.
- the algorithm of the invention applies to LTE.
Landscapes
- Engineering & Computer Science (AREA)
- Computer Networks & Wireless Communication (AREA)
- Signal Processing (AREA)
- Quality & Reliability (AREA)
- Mobile Radio Communication Systems (AREA)
Abstract
Description
- This invention relates to a cellular communications networks, and in particular to methods for controlling a power allocation in a base station of a cell in a cellular communications network across a plurality of sub-bands. The invention also relates to base stations in such a network.
- In cellular communications networks, it is important to improve the throughput that can be achieved by the network. However, it is also important to improve the satisfaction of users of the network by improving the performance that they experience. It is particularly important to improve the performance experienced by user equipments (UEs) at the edge of cells in the network. The reason for this is that UEs close to the centre of cells in the network are generally happy with the performance of the network, and further improvement to the performance experienced by these UEs would proportionally improve their satisfaction. However, it would require more effort to improve the performance experienced by UEs at the edge of cells in the network since these UEs would typically be less happy with the performance of the network. Therefore, a significantly greater overall satisfaction of users in the network could be achieved by improving the satisfaction level of users at the edge of cells in the network.
- In addition to improving the satisfaction levels of users of the cellular communications network, it is also important to employ measures for saving energy in the network. If energy is saved in a network, the amount of expenditure and operating costs for the network is reduced and, moreover, the impact on the environment (which has become an increasing concern due to rapidly rising energy consumption) is also reduced.
- Further to this, it is also important to ensure that basestations in the cellular communications network are able to communicate with each other effectively. The 3rd Generation Partnership Project (3GPP) provides a means for evolved Node Bs (eNBs) to communicate with each other. However, it is not often practical or the option is not always available in many deployment scenarios for a network to achieve direct communication between two eNBs. For example, this is true of a heterogeneous network (HetNet) in which cells of different sizes, different vendors, or even different technologies are deployed in potentially overlapping regions.
- In this type of network, it is possible for a large macro cell to convey information to smaller pico cells for interference purposes. However, it is rarely possible for a small pico cell to convey information to larger macro cells for interference purposes. This results in an asymmetric communication between cells, which makes the effective coordination of interference among cells of different sizes extremely difficult. Moreover, the small cells of the network are randomly deployed, which means that the small cells could reside both in the centre of the macro cell and at the edge of the macro cell. Therefore, signalling for Inter-Cell Interference Coordination (ICIC) purposes over a standard interface through which the basestations are connected (for example, over the X2-interface) requires more refinement due to the non-uniform geometry associated with a HetNet.
- Fourth Generation (4G) cellular systems such as Long-Term Evolution (LTE) systems are currently being developed in order to improve both system performance and data rates achieved for UEs compared to that achieved by Third Generation (3G) cellular systems. Although the 4G systems are designed to improve system performance and data rates achieved for UEs, it is also important to improve the performance experienced by UEs at the edge of cells in the network. One of the most effective ways to make such an improvement is via power and interference management.
- Generally, power and interference management is designed to improve the overall performance of systems and the performance experienced by UEs by reducing unnecessary interference. The aim of this is to reduce as much power as possible in order to meet a certain satisfaction objective. By eliminating unnecessary transmit power, it is possible to significantly improve the energy efficiency of a network. It is noted that improvement in the energy efficiency of a single base station would not necessarily have a significant impact on the amount of money saved. However, the money saving that is achieved by improving the energy efficiency of basestations in a network having many basestations can be particularly large.
- Typically, a cellular communications network comprises more than a single cell, which means that each cell is likely to be surrounded by neighbouring cells. As a UE in the network moves away from the basestation that is currently serving it (the serving basestation) towards a basestation of a neighbouring cell, the call quality experienced by that UE degrades due to a weakening in the quality of the signal received from the serving cell and due to an increase in the interference experienced from the neighbouring cells to which the UE is becoming closer. This type of interference is often referred to as inter-cell interference, and the mitigation of this interference is particularly important to improve the performance experienced by UEs at the edge of cells in the network. It is more complicated to manage interference in LTE systems than it is to manage interference in 3G systems (such as Wideband Code Division Multiple Access (WCDMA) systems) because LTE systems involve power allocation in both the time and the frequency domain whereas 3G systems only involve power allocation in the time domain.
- An existing method for the mitigation of inter-cell interference in a cellular communications network is based on Fractional Frequency Reuse (FFR) in which UEs in the centre of each cell of the network are allocated the same frequency, whereas UEs at the edge of cells are allocated with a subset of frequencies that are different from those of the immediate neighbour cell. As a result, the inter-cell interference experienced by UEs at the edge of cells is reduced significantly.
- However, this existing method for the mitigation of inter-cell interference suffers from many drawbacks. In particular, it is necessary to carefully plan the subset of frequencies used for the UEs at the edge of cells in the network which can be a complex and time consuming process. Typically, the subset of frequencies are allocated statically during the network planning stage. This method is especially not suitable for femto-cells in which basestations are deployed in an ad hoc manner. Furthermore, this method does not take into account the dynamic distributions of traffic in the network, which can result in the spectrum of frequencies being underutilised.
- An alternative method for the allocation of power and frequency resources allocates frequency, power, modulation and coding schemes (MCS) jointly for each UE in a cell in a centralized way. However, this type of approach requires a centralized entity, and the computation complexity is impractically high.
- The published paper entitled " Self-organizing Dynamic Fractional Frequency Reuse for Best-Effort Traffic Through Distributed Inter-cell Coordination", by A. L. Stolyar, and H. Viswanathan, in proceedings IEEE Infocomm, April 2009, discloses an existing algorithm for self-optimization of a network that aims to improve the overall capacity and/or cell edge data rates. The algorithm is gradient-based in that frequency reuse patterns are dynamically adapted based on the traffic distribution. As this approach is self-organizing among cells in a distributive manner, the time-consuming process of frequency planning is not required. Furthermore, this method not only provides a way to assign frequency in a distributive manner, it also allows the power to be adjusted dynamically in frequency, and thereby provides an extra degree of flexibility. The method allows eNBs to continuously and autonomously adjust their power based solely on standard UE feedbacks.
- However, while this existing approach is useful, it does not take into account the Quality of Service (QoS) experienced by UEs. As a result, the power allocation may not necessarily be tailored to the requirements of UEs and, as a result, the power efficiency in the network may be reduced. Moreover, the information exchange required in this existing algorithm is not readily supported by the standard X2-interface. In addition, this approach does not take into account the concept of energy saving, and the power allocation may not be optimal.
- Other existing algorithms have been known to take into account QoS requirements directly in power adjustment, provide a simpler message exchange among eNBs, and have been made compatible with the X2 interface. Such an algorithm is disclosed in the published paper entitled " Distributed Energy-Saving Mechanism for Self-Organizing Femto LTE Networks", by R. Kwan, in proceedings IEEE Vehicular Technology Conference (VTC) Fall, Quebec, Canada 2012. This existing algorithm suggests that it is possible to achieve significant power saving if the minimal amount of power suitable to meet the QoS requirements is allocated to basestations of the network. Of course, energy saving is only possible if the QoS requirement is not too high for the capacity of the system. The important aspect of this algorithm is that it is possible to maintain suitable performance levels for UEs at the edge of cells in the network while simultaneously providing a suitable level of power saving.
- The algorithms discussed above each require some level of communication among eNBs. However, there exist situations where the X2-interface will not always be available. One example is in a heterogeneous network (HetNet), where femto-cells, small cells, and macro cells co-exist. In a HetNet, direct communication between cells may not easily be achievable (for example, since HetNets include cells that would operate under different protocols). Another example is in the case of inter-vendor femto cell deployment. In this situation, it is not clear whether a standard X2-interface exists between femto cells belonging to different vendors. Even if a standard X2-interface did exist, there is no guarantee that each femto cell would react appropriately according to the expectation of another.
- There is thus a need for an autonomous algorithm that does not require the use of a standard X2-interface. There are algorithms that already exist that make this possible. However, these existing algorithms require certain sub-band specific feedback from UEs in the network, which is not compatible with 3GPP.
- The present invention refines the existing algorithms discussed above to take into account the notion of energy saving. In particular, the present invention takes into account a factor relating to the happiness of the users of the network to continually adjust the power with the aim of saving energy. The invention particularly concentrates on the benefits that can be achieved at the edge of cells in the network while providing continuous refinement of power with the aim of reducing power consumption in the network.
- Furthermore, the present invention improves the performance experienced by UEs at the edge of cells in the network (thereby increasing the range of the cells) while eliminating unnecessary power consumption (through energy saving) in an autonomous fashion without any need for explicit communications with neighbouring cells. This eliminates the need to establish communication links among neighbour cells for interference the purpose of interference mitigation. In this way, direct interfaces (such as the X2-interface) among cells in the network are not required because each cell is able to autonomously perform a power allocation strategy of its own. In other words, each individual cell is able to adapt its own power to a desired level without the need for external communication. This feature of the invention is particularly beneficial in a heterogeneous network (HetNet) since the downlink power of each cell in the heterogeneous network would adapt itself to the desired level. In this way, the need for complex planning of network deployments is eliminated.
- In summary, the present invention provides a method for adjusting the downlink transmit power of networks (for example, LTE networks) in an intelligent way, which does not require dedicated interfaces among basestations of the network for interference mitigation purposes, and which significantly reduces power consumption. This reduces costs while providing improved coverage at the edge of cells in the network, thereby enhancing the satisfaction of users at the edge of cells and increasing the cell range. The present invention achieves energy saving at the same time as improving performance at the edge of cells in an autonomous way without the need for any exchange of information among basestations.
- The present invention is compatible with schemes where communication links exist between peer nodes as well as between nodes of different layers. It is also compatible with schemes operated at a different time scale, and in agreement with the theory surrounding the coexistence of multi-layer SON operations.
- According to a first aspect of the present invention, there is provided a method for controlling a power allocation in a base station of a cell in a cellular communications network across a plurality of sub-bands, the method comprising the steps of:
- determining whether a long-term performance achieved by the cell exceeds a first threshold value; and
- allocating a total transmit power across the sub-bands according to whether the long-term performance achieved by the cell exceeds the first threshold value.
- If the long-term performance achieved by the cell is equal to or more than the first threshold value, the step of allocating the total transmit power may comprise: distributing the total transmit power across the sub-bands according to an algorithm which may produce an uneven distribution of the total transmit power across the sub-bands.
- The algorithm may be adapted to allocate a transmit power to a sub-band based on the frequency of the sub-band.
- If the long-term performance achieved by the cell is less than the first threshold value, the step of allocating the total transmit power may comprise distributing the total transmit power evenly across the sub-bands.
- If the long-term performance achieved by the cell is less than the first threshold value, the step of allocating the total transmit power may comprise, for each sub-band, determining whether a power currently allocated to the sub-band exceeds a second threshold value; and distributing the total transmit power across the sub-bands by allocating a power to each sub-band according to whether the power currently allocated to said sub-band exceeds the second threshold value.
- If the power currently allocated to a sub-band is greater than or equal to the second threshold value, the step of distributing the total transmit power across the sub-bands may comprise allocating a first power to said sub-band.
- The first power may be greater than the second threshold value.
- If the power currently allocated to a sub-band is less than the second threshold value, the step of distributing the total transmit power across the sub-bands may comprise allocating a second power to said sub-band.
- The second power may be less than the second threshold value.
- The long-term performance may be a factor relating to a happiness of users in the cell.
- The happiness factor may be defined based on an average happiness of users in the cell.
- The happiness factor may be defined based on a weighted average happiness of users in the cell.
- The happiness factor may be defined based on a standard deviation of the happiness of users in the cell.
- The happiness factor may be defined based on a percentile of the happiness of users in the cell.
- The happiness factor may be defined based on a ratio of each user's average bit rate to the user's required bit rate.
- The happiness factor may be based on a scaling factor that introduces a degree of conservativeness.
- The long-term performance may be determined based on a sum of a Packet Data Convergence Protocol (PDCP) packet delay for each bearer established for the basestation per delay budget for the cell.
- The long term performance may be determined based on the sum of the Packet Data Convergence Protocol (PDCP) packet delay for each bearer established for the basestation that meets a certain Quality of Service (QoS) requirement, per delay budget for the cell.
- The long term performance may be determined based on a sum of a percentile of a Packet Data Convergence Protocol (PDCP) packet delay for each bearer established for the basestation per delay budget for the cell.
- The long term performance may be determined based on the sum of the percentile of the Packet Data Convergence Protocol (PDCP) packet delay for each bearer established for the basestation that meets a certain Quality of Service (QoS) requirement, per delay budget for that cell.
- The sum may be a weighted sum.
- The method may further comprise the step of adapting the total transmit power based on a short-term performance achieved by the cell.
- The step of adapting the total transmit power based on a short-term performance of the cell may comprise, determining whether the short-term performance achieved by the cell exceeds a third threshold value, and adapting the total transmit power according to whether the short-term performance achieved by the cell exceeds the third threshold value.
- If the short-term performance achieved by the cell is less than the third threshold value the step of adapting the total transmit power may comprise increasing the total transmit power.
- The short-term performance may be determined in the same way as the long term performance at a particular time.
- The short-term performance may be determined in the same way as the long-term performance over a shorter period of time.
- According to a second aspect of the invention, there is provided a basestation configured to operate in accordance with the method of the first aspect of the invention.
- According to a third aspect of the invention, there is provided a computer program product containing code configured to cause a basestation to operate in accordance with the method of the first aspect of the invention.
- For a better understanding of the present invention, and to show how it may be put into effect, reference will now be made, by way of example, to the accompanying drawings, in which:-
-
Figure 1 shows a part of a cellular communications network; -
Figure 2 shows the form of a base station in the network ofFigure 1 ; -
Figure 3 is a diagram illustrating the effect of considering a happiness factor; -
Figure 4 is a diagram illustrating the effect of considering a modified happiness factor; -
Figure 5 is a flow chart, illustrating an algorithm for optimizing the power of a basestation; -
Figure 6 is a flow chart, illustrating a method for controlling a power allocation in a base station in accordance with the invention; -
Figure 7 is a diagram illustrating an example of a power profile produced by the algorithm illustrated inFigure 5 and an example of an adjusted power profile produced when a certain condition is not met; -
Figure 8 is a flow chart, illustrating an embodiment of the method for controlling a power allocation in a base station in accordance with the invention; -
Figure 9 is a flow chart, illustrating another embodiment of the method for controlling a power allocation in a base station in accordance with the invention; -
Figure 10 is a diagram illustrating a result of the effectiveness of the power allocation control method in accordance with the invention; -
Figure 11 illustrates a cumulative distribution function (CDF) of a user bit rate for various values of rate requirement and hysteresis parameter η, obtained with and without a re-excitation mechanism; -
Figure 12 illustrates a change in user bit rate for a bit rate requirement of 120 Bytes/TTI obtained without a re-excitation mechanism; -
Figure 13 illustrates a change in user bit rate for a bit rate requirement of 120 Bytes/TTI obtained with a re-excitation mechanism; -
Figure 14 illustrates a change in average downlink transmit power per Home enhanced Node B (HeNB); -
Figure 15 illustrates a CDF of a user bit rate for various values of hysteresis parameter - η, obtained with and without a re-excitation mechanism, for the case of a smaller rate requirement;
-
Figure 16 illustrates a change in user bit rate for the case of the smaller rate requirement with a re-excitation mechanism; -
Figure 17 illustrates a change in user bit rate for the case of the smaller rate requirement without a re-excitation mechanism; -
Figure 18 illustrates a change in average downlink transmit power per Home enhanced Node B (HeNB) for the case of the smaller rate requirement; -
Figure 19 illustrates a CDF of a user bit rate for various values of hysteresis parameter η and a bit rate requirement of 120 Bytes/TTI with two different random seeds; -
Figure 20 illustrates a change in user bit rate for various values of hysteresis parameter η and a bit rate requirement of 120 Bytes/TTI with two different random seeds; -
Figure 21 illustrates the result of a simulation of a femto block placed close to a transmitter of a macrolayer basestation; -
Figure 22 illustrates the result of a simulation of the femto block placed far away from the transmitter of the macrolayer basestation; -
Figure 23 illustrates a CDF of a user bit rate for a bit rate requirement of 120 Bytes/TTI in the case where the femto block is placed far away from the transmitter of the macrolayer basestation and the case where the femto block is placed close to the transmitter of the macrolayer basestation; and -
Figure 24 illustrates a change in average downlink transmit power per Home enhanced Node B (HeNB) for a bit rate requirement of 120 Bytes/TTI in the case where the femto block is placed far away from the transmitter of the macrolayer basestation and the case where the femto block is placed close to the transmitter of the macrolayer basestation. -
Figure 1 shows a part of acellular communication network 10, operating in accordance with the invention. Thenetwork 10 includes macrolayer base stations, or enhanced Node B's (eNBs), 12, 14, servingrespective cells cells base stations - Located within the
cells Figure 1 shows only a small number of such femtocells for the purposes of clarity. For example, the femtocells might be individually owned by customers of the cellular network, or they might be under the common management of the premises in which they are located, such as a shopping mall, university campus, office park or large office building. - A bearer is established between a HeNB and a UE for the transmission of data packets. A bearer is an Internet Protocol (IP) packet flow with a defined quality of service (QoS).
-
Figure 2 shows in more detail the form of one of the base stations in the network. Thebase station 40 shown inFigure 1 might be a macrolayer base station or a femtocell base station. - The
base station 40 hastransceiver circuitry 42, for converting signals to and from the formats required for transmission over the air interface. For example, the base station may be intended to form part of an LTE network, and the transceiver circuitry would therefore convert the signals to and from the formats required for this. Anantenna 44 is connected to thetransceiver circuitry 42. - The base station also has
interface circuitry 46, for connection to the rest of the network. Where thebase station 40 is a femtocell base station, theinterface circuitry 46 might for example be suitable for converting signals to and from the formats required for transmission over a broadband internet connection. Where thebase station 40 is a macrolayer base station, theinterface circuitry 46 might for example be suitable for converting signals to and from the formats required for transmission over a dedicated link to the core network of the cellular communications network. - A
modem 48 is connected between thetransceiver circuitry 42 and theinterface circuitry 46, for processing the signals and extracting relevant data therefrom. Themodem 48, thetransceiver circuitry 42 and theinterface circuitry 46 operate under the control of aprocessor 50, as described in more detail below. - One of the aspects of the operation of the
base station 40 that is controlled by theprocessor 50 is the control of a power allocation in thebase station 40 across a plurality of sub-bands. - We assume that there are K cells, with k ∈ K̃ = {1,2,.... K}, and J sub-bands j ∈ J̃ = {1,2,...J̃} in the system. Furthermore, we assume that each sub-band consists of a fixed number of sub-carriers. Also, it is assumed that time is slotted, and that transmissions within each cell are synchronized, so that intra-cell interference is not present. Two generic quantities are particularly relevant to an inter-cell interference coordination scheme for LTE-based systems.
- The first one is the concept of utility, which generally quantifies the level of satisfaction of the entity involved. Let U be a global utility function of the system, which is given by:

- It represents the sum of all utility functions among all cells, where Uk is the utility function of cell k, which is given by the sum of the utility Uk,i among all users for cell k, i.e. Uk = ∑ iUk,i. The idea is to find a way (or ways) to improve, or preferably maximize, the global utility function U.
- The second quantity is the transmit power. Here, in the context of Orthogonal Frequency Division Multiple Access (OFDMA) systems such as LTE, the transmit power is expected to be frequency dependent. Let P k,j be the power allocated in sub-band j of cell k, and the maximum power cell k can have is Pk, i.e. ∑ jPk,j ≤ The whole problem of inter-cell interference coordination reduces to how Pk,j , ∀j is allocated for each k in order to improve or maximize U.
- In A. L. Stolyar, H. Viswanathan, "Self-organizing Dynamic Fractional Frequency Reuse for Best-Effort Traffic Through Distributed Inter-cell Coordination", proceedings of IEEE Infocomm, April 2009, a gradient-based method is proposed, in which the global utility is improved sub-optimally in a distributive fashion. The main idea of the proposed method is as follows:
- Let Dj (m,k) = ∂Uk /∂Pm,j , i.e. the rate of change of the utility function Uk for cell k, with respect to the transmit power cell m has allocated for sub-band j. The quantity corresponds to the change of the level of satisfaction that a cell m would incur at sub-band j of cell k. For the purpose of discussion, this quantity will also be called the D value for simplicity. Obviously, an increase in Pm,j may potentially have negative impact on Uk when k≠m (i.e. cell m is a neighbour cell), as such an increase would give rise to additional interference at sub-band j coming from cell m, and vice versa. On the other hand, when k = m, an increase of power at sub-band j would enhance the signal quality at this particular sub-band, and would have a positive impact on its own utility.
- It can be noted that Dj(m,k) is not very useful if it is considered in only one cell at a time. However, when it is exchanged among neighbour cells, it allows the neighbour cells to know the level of impact caused in the other cells when a certain power level is allocated at each sub-band. By receiving Dj(m,k) from the neighbour cells, cell k would then aggregate them for each sub-band j, i.e.

- In other words, Dj(k) corresponds to the aggregate sensitivity of the utility function to all cells due to the perturbation of its own transmit power at sub-band j.
- When Dj(k)<0, a positive power increment would incur a negative impact on the aggregate satisfaction among all cells, and vice versa. The general idea proposed in the prior art document discussed above is for cell k to increase the power by selecting a sub-band associated with the largest positive value of Dj(k), and vice versa.
- Let δP > 0 be a fixed parameter, let Pk = ∑ jPk,j be the total power currently used, and let P̃k be the power limit. In each of np time slots, cell k updates the power sequentially as follows:
- 1. Set Pk,j* = max(Pk,j* - δP, 0), where j * is the sub-band index, such that Dj*(k) is the smallest among all j's, given that Dj(k) < 0 and Pk,j > 0.
- 2. If Pk < P̃k, set Pk,j* = Pk,j* + min(P̃k - Pk, δP), where j* is the sub-band index, such that Dj* (k) is the largest among all j's, where Dj(k) > 0.
- 3. If Pk = P̃k , and max jDj (k) > 0, set Pk,j* = max(Pk,j* - δP, 0), and Pk,j - Pk,j* + mm(P k,j*, δP), where Dj* (k) and Dj* (k) are the largest and smallest among those j's which are Pk,j > 0 and Dj* (k) < Dj (k).
- In this illustrated embodiment, the downlink power adjustment algorithm takes account of the quality of service (QoS) experienced by the users.
- A common utility function for cell k is typically defined as the sum of the logarithms of the average bit rates over all users within the cell k. This utility function is rooted in economics, and is motivated by the fact that a fixed increase in bit rate is more important for low bit rate than for users who are already enjoying a high bit rate. Another advantage of such a function is that it is smooth and continuously differentiable, thereby simplifying the complexity in computing the utility sensitivity. Despite the above advantages, such a utility function does not readily provide a means to incorporate QoS into the power adjustment mechanism. For example, consider three users served by a base station, having bit rates of 1 Mbps, 2Mbps, and 3Mbps respectively. If all three users only require a bit rate of 500kbps, it may not be efficient to provide more than necessary from the point of view of resource utilization. An unnecessarily high power generates an unnecessary level of interference, which would then have a knock-on effect on the neighbouring cells. In order to maintain a good level of satisfaction, the neighbours would require a higher power, thereby boosting the overall background interference. The reverse is also true: if a base station reduces its power to a level which just meets the user bit rate requirements, the level of interference to its neighbours would reduce. The neighbours, in turn, would require less power to maintain the call quality, thereby emitting lower interference to the original base station. As a result, the original base station, in turn, would then need less power to maintain the call quality. This process continues until the background interference, and, therefore, the transmit powers of all base stations, eventually settles to a lower level.
- The implication of the above process is important, as the idea of removing unnecessary power provides a "feedback" mechanism which eventually helps to further reduce the power requirement for a fixed QoS due to the lowering of the overall interference. This lowering of the power requirement translates to an energy saving for the network.
- One way to take the QoS into account is to modify the utility function. However, such an approach potentially makes the utility function more complex, and thereby complicates the sensitivity calculation. In this embodiment, we quantify whether a user's expectation is met by a quantity known as the "Happiness Factor", Hk,i , which is given by:

- Rk,i is the averaged bit rate achieved by user i in cell k, and
- Rk,i is the corresponding bit rate requirement, which can be directly proportional to the guaranteed bit rate (GBR) (for example as discussed in 3GPP TS 36.413, S1 Application Protocol (S1AP), or can be some function of the GBR.
- When Hk,i > 1, the user is experiencing a bit rate that exceeds expectation. The opposite is true when Hk,i < 1. Let Hk (n) be the weighted n -th moment of happiness of cell k, i.e.

- Nk is the number of users in cell k, and
- w k,i is a cell-specific weight for user i in cell k.
- This weight can be used to bias the emphasis among users within the cell, and follows the constraint
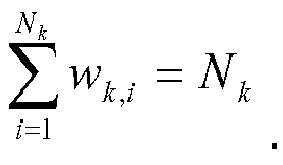
k =1,
- Note that
H k = 1 implies that the average happiness for cell k meets the expectation. However, it also implies that some users are below expectation, while some are above expectation. While the average is useful to quantify performance in general, a more refined approach is to provide a conservative margin to the average value such that

- The effect of offsetting the happiness factor in order to increase conservativeness for power adjustment is shown in
Figure 3. Figure 3 shows the probability density function of Hk. With power management operating such thatH k = 1, the area of Region A inFigure 3 indicates the probability that the true happiness is below unity. By offsetting the happiness factor by λkĤk, the probability that the true happiness is below unity reduces from the area of Region A to that of Region B. -
Figure 4 illustrates a more general way to increase conservativeness, by defining Hk as the Xth percentile of Hk,i , ∀i. Under this definition, only X % of the happiness would fall below unity as shown inFigure 4 . - Further details on the distributed algorithm based on the above mechanism can be found in " Distributed Energy-Saving Mechanism for Self-Organizing Femto LTE Networks", R. Kwan, IEEE Vehicular Technology Conference (VTC) Fall, Quebec, Canada 2012.
- Some distributed approaches have been provided that rely on local joint optimization of power, Modulation and Coding Scheme (MCS), and frequency resources. One example of such a distributed approach is described in " Distributed Resource Allocation for Femtocell Interference Coordination Via Power Minimisation", by A. Ladanyi et al., Proceedings of IEEE Globecom Workshop, December 2011.
- In this example, each cell actively assigns the sub-carriers, power, and MCS jointly in order to minimize the overall cell downlink transmit power, subject to a certain throughput constraint. Although such a scheme allows the cell to assign resources autonomously, it requires frequency UE measurement reports that include the SINR as well as downlink interference power across each frequency resource unit. Following the measurement reports from all UEs within the cell, the eNB attempts to perform a discrete optimization. However, since discrete optimization is typically computationally intensive, the computation cost is high even though the algorithm is faster. Also, the scheme requires that the downlink interference power as well as the SINR across the whole bandwidth is signalled back to the eNB from all UEs. Furthermore, the output of the optimization is not predictable in that the output of one optimization instance may give rise to a different power distribution across the bandwidth compared to the next instance. Such changes in power allocation give rise to rapid changes in the inter-cell interference patterns, which reduce the reliability of the UE measurements.
- A similar example of such a distributed approach is described in " Self-Organization for L TE Enterprise Femtocells", by G. de la Roche et al., Proceedings of IEEE Globecom Workshop, December 2010. In this example, the main objective is to minimise the total received interference within the cell by allocating the appropriate frequency resource units for all UEs. However, this approach suffers from a similar issue in that the interference experienced by each UE for every frequency resource unit needs to be fed-back to the eNB.
- In the previously mentioned document entitled " Self-organizing Dynamic Fractional Frequency Reuse for Best-Effort Traffic Through Distributed Inter-cell Coordination", by A. L. Stolyar, and H. Viswanathan, in proceedings IEEE Infocomm, April 2009, an autonomous algorithm is proposed using a non-trivial heuristics. As the algorithm is autonomous, the cell-specific index k is dropped for the sake of clarity. At the beginning of each power allocation period, the earlier proposed algorithm involves nv number of iterations. In each iteration, the algorithm sequentially picks a sub-band j and performs the method as shown in
Figure 5 . For each iteration the algorithm scans across each sub-band j = 1 to J. - The algorithm maintains the "virtual throughput" Xi , the value of the power
P j specific to a sub-band j for all j, and a variable Z (which is an accumulating parameter). The accumulating parameter Z represents the accumulated sum of a virtual power parameterP , which is described in more detail below. Typically, a small averaging parameter β is chosen in conjunction with nv such that the product of β and nv is constant. The algorithm runs continuously such that the initial values of the parameters Xi ,P j and Z are not critical. For simplicity, these parameters can be chosen as
P P */J, and Z = 0 , where Ri,j is the bit rate specific to a sub-band j that can be supported by a user i, J is the total number of sub-bands, and P * is the fixed maximum available power that the cell can provide. - With reference to
Figure 5 , the bit rate R i,j specific to a sub-band j that can be supported by a user i and the maximum power P * that the cell can provide are provided. - Given the bit rate Ri,j , it is determined whether the maximum value of the product of the partial derivative of the global utility function U of the system with respect to the "virtual throughput" Xi experienced by user i (where U is a function on Xi ), the total number of sub-bands J and the bit rate Ri,j specific to a sub-band j that can be supported by a user i minus the product of the averaging parameter β, the variable Z, the virtual power parameter
P and a normalizing factor α is greater than or equal to zero (step 500). In other words, it is determined whether the following condition is met:
- The quantity
P is a virtual power parameter such that P * / J ≤P ≤ P*. Alternatively, the virtual power parameterP can be written as
- For example, if the power is very small, the initial probability that the condition is true would be much higher than in the case of a much higher power. Also, as the algorithm does not take into account the unit used, the condition can be true for one type of unit and false for another type of unit. Thus, there is a possibility that the outcome of the check will be random, especially at the beginning of the algorithm. This can lead to an unstable algorithm without a normalization coefficient α. As an example of a value of the normalization coefficient α, to normalize the second term in the above expression, α could take on a value of α = 1/(P*2).
- If the condition is satisfied (i.e. if the quantity defined in Equation (7) is greater than or equal to zero), it is considered that it would be beneficial to include the sub-band j in the sub-bands to which power is to be allocated. In this case, a user i* is selected such that the quantity


- The variables X i*, Xi,
P j andZ are then updated for the selected user i* as follows (step 504):


- For example, as shown in Equation (9), the variable X j* is updated for the selected user i* by including the estimated rate JR i*, j in the averaging. The quantity (1 - β)Xi* , is a fraction (1- β) taken of the previous value of the "virtual throughput" Xi* experienced by the user i*. For all other users i (i.e. for ∀i ≠ i*), the updated average is Xi = (1-β)Xi. The quantity (1-β)Xi is a fraction (1-β) taken of a previous value of the "virtual throughput" Xi experienced by another user i. As the virtual power
P is now allocated to user i*, it is updated asP j = βP + (1- β)P j , and the temporary accumulating parameter Z is updated as Z = Z +P . The quantity (1-β)P j is a fraction (1-β) taken of a previous value of the virtual powerP j specific to sub-band j. - Finally, the accumulating parameter Z is updated as follows (step 506):

- If, on the other hand, it is determined in
step 500 that the condition defined in Equation (7) is not satisfied (i.e. if the quantity defined in Equation (7) is less than zero), it is considered that it would be not be beneficial to include the sub-band j in the sub-bands to which power is to be allocated. Thus, in this case, no current value is included in the averaging for both bit rate and power. In other words, the variables Xi andP j are updated as follows (step 508):

- As before, the accumulating parameter Z is updated as follows (step 506):

- In other words, the accumulating parameter Z is updated irrespective of whether the condition defined in Equation (7) is satisfied.
- The output of the algorithm is the sub-band-specific power allocation Pj =
P j, ∀j. - A more elaborate algorithm is proposed in " Greedy primal-dual algorithm for dynamic resource allocation in complex networks", by A. L. Stolyar, Queuing System, 2006.
- It should be noted that the autonomous algorithm proposed in " Self-organizing Dynamic Fractional Frequency Reuse for Best-Effort Traffic Through Distributed Inter-cell Coordination", by A. L. Stolyar, and H. Viswanathan, in proceedings IEEE Infocomm, April 2009, does not adjust the power directly based on Quality of Service (QoS) requirements or directly in response to the level of QoS experienced by users. However, it is possible to incorporate the QoS requirements in the utility function.
- A summary of the algorithm in accordance with the invention will now be described with reference to
Figure 6 . - With reference to
Figure 6 , the autonomous algorithm ofFigure 5 (referred to as "Algo. 1" in the Figures) is run in order to compute the potential transmit power that can be assigned to each sub-band (step 600). - Two counters N 1 and N 2 are provided, which accumulate events of un-satisfaction and satisfaction respectively over a certain period of time. These accumulated events are representative of a long-term performance measure of the cell. From these accumulated events, it is determined whether a long-term performance achieved by the cell is satisfactory (step 602). For example, it is determined whether the long-term performance achieved by the cell exceeds a first threshold value.
- The long-term performance measure of the cell can be based on the true happiness Hk of the cell that is defined in Equation (5), where the happiness specific to a user is defined in Equation (3). Alternatively, the long-term performance measure of the cell can be based on a percentile of happiness, as described with reference to
Figure 4 . - As another alternative, the long-term performance measure of the cell can be calculated as:


- The period τk can be set to reflect the level of the long-term performance measure required. Since different QoS classes may have different levels of importance, a class-specific weighting parameter wl can be introduced to take into account these differences. This weighting parameter is defined by

- As yet another alternative, the long-term performance measure of the cell can be calculated as:


- The long-term performance measure is based on the performance that a user or a bearer in the cell can achieve using the radio resources that have been allocated. Since a bearer may make use of one or multiple sub-bands, the long-term performance measure may correspond to a particular sub-band (for example, where a bearer makes use of only one sub-band) or may correspond to a plurality of sub-bands (for example, where a bearer makes use of multiple sub-bands).
- If it is determined that the long-term performance achieved by the cell is less than the first threshold value (i.e. if the statistics accumulated by the two counters do not suggest a good long-term performance), the re-excitation branch is followed at
step 604. In the re-excitation branch, it is determined whether a current happiness level is met. In other words, it is determined whether a short-term performance achieved by the cell exceeds a second threshold value. - While the accumulation of the counter values defines the long-term performance measure, the counter values themselves at any given time define the short-term performance measure. The short-term performance measure could, for example, be calculated using Equations (10) and (11) by setting the value of τk to be much shorter than that used for the long-term performance measure. As with the long-term performance measure, the short-term performance measure may be sub-band specific (for example, where a bearer makes use of only one sub-band) or may not be sub-band specific (for example, where a bearer makes use of multiple sub-bands). If the short term performance level is not met (i.e. if the short-term performance achieved by the cell is less than the second threshold value), the total transmit power to be allocated across the sub-bands in the autonomous algorithm of
Figure 5 in the next scheduling period is increased (step 606). In this way, the performance achieved locally (i.e. the performance experienced by users within the cell) is improved. In addition, the counters N 1 and N 2 are modified accordingly in order to update the long-term performance measure of the cell (step 606). - If the short term performance level is met (i.e. if the short-term performance achieved by the cell is equal to or more than the second threshold value), the total transmit power to be allocated across the sub-bands in the autonomous algorithm of
Figure 5 in the next scheduling period is decreased (step 606). In addition, the counters N 1 and N 2 are modified accordingly in order to update the long-term performance measure of the cell (step 606). - By further adapting the total transmit power based on a short-term performance achieved by the cell, it is possible to optimise the total transmit power required to provide a satisfactory short-term performance in order to improve the power efficiency of the cell.
- In both cases (i.e. irrespective of whether the short term performance level is met), the total transmit power is distributed across the sub-bands (step 608), as follows:
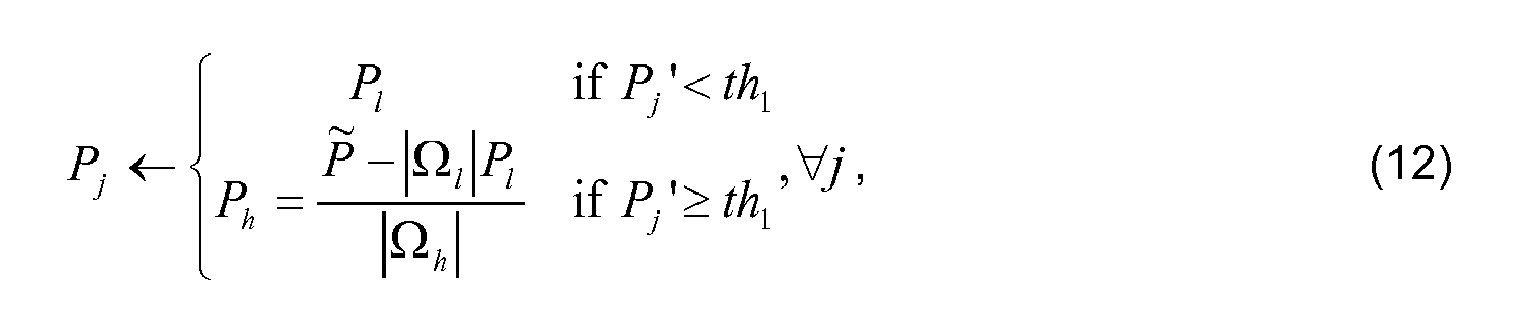
Figure 5 is less than the third threshold value th 1 , and Ω h defines a set of sub-bands where the power Pj ' currently allocated by the algorithm ofFigure 5 is equal to or above the third threshold value th 1 . |Ω l | and |Ω h | correspond to the number of sub-bands in the sets Ω l and Ω h , respectively. - In other words, if the power Pj ' currently allocated by the algorithm of
Figure 5 is below the third threshold value th 1 , then the transmit power Pj to be allocated to a sub-band j is set as a first power Pl . Similarly, if the power Pj ' currently allocated by the algorithm ofFigure 5 is greater than or equal to the third threshold value th 1 , the transmit power Pj to be allocated to a sub-band j is set as a second power Ph , which is equal to the total transmit power P̃ minus the product of the number of sub-bands |Ω l | where the power Pj ' currently allocated is less than the third threshold value th 1 and the first power Pl , divided by the number of sub-bands where the power Pj ' currently allocated is equal or above the third threshold value th 1 . The first power Pl is less than the third threshold value th 1 and the second power Ph is greater than the third threshold value th 1 . - The total transmit power may be distributed in this way when the power profile from the algorithm of
Figure 5 is available. Instead of two power levels, multiple power levels can be incorporated. -
Figure 7 illustrates an example of a power profile produced by the algorithm ofFigure 5 ("Algo 1") and an example of an adjusted power profile produced according to Equation (12) when the long-term performance achieved by the cell is less than the first threshold value. The power profiles show how the total transmit power is distributed across the sub-bands, i.e. the values of power allocated to each sub-band. - As shown in
Figure 7 , the power profile produced by the algorithm ofFigure 5 ("Algo 1") could result in a different power being allocated to each sub-band. In contrast, by distributing the total transmit power across the sub-bands according to Equation (12), any sub-band with a current power below the third threshold value th 1 will take on the first power Pl , and any sub-band with a current power above or equal to the third threshold value th 1 will take on the second power Ph . This provides a more flexible two-level pattern. - Alternatively, in both cases (i.e. irrespective of whether the short term performance level is met), the total transmit power is distributed evenly across the sub-bands (step 608). The total transmit power may be distributed in this way when the power profile from the algorithm of
Figure 5 is unavailable. - By distributing the total transmit power evenly across the sub-bands when the long-term performance achieved by the cell is unsatisfactory (i.e. when the long-term performance is less than the first threshold value), it is possible to make use of more frequency resources, at the expense of producing more interference with other cells, in order to improve the performance achieved by the cell.
- Even though a uniform power distribution is used, the total transmit power may be adjusted. While the neighbouring cells are using a specific power profile across the sub-bands in order to ensure a good level of orthogonality, the cell with a low long-term performance evenly re-distributes the power across the sub-bands. Such a uniform distribution of power allows the usage of more sub-bands, including those potentially not used by the neighbours. While this can potentially cause an increase in the level of interference experienced by neighbour cells, it can also potentially improve the performance experienced by users in the cell that had a low long-term performance. Once the long-term performance becomes satisfactory, the local optimization can then be invoked.
- Following the distribution of the total transmit power across the sub-bands (step 608), the total transmit power for input into the autonomous algorithm of
Figure 5 is updated (step 610) and the process is then repeated in the next scheduling period by again running the algorithm ofFigure 5 (step 600). - If it is determined that the long-term performance achieved by the cell is equal to or more than the first threshold value (i.e. if the statistics accumulated by the two counters suggest a good long-term performance), the local optimization branch is followed at
step 604. In the local optimization branch, it is determined whether a current happiness level is met. In other words, it is determined whether a short-term performance achieved by the cell exceeds a second threshold value. - If the short term performance level is not met (i.e. if the short-term performance achieved by the cell is less than the second threshold value), the total transmit power to be allocated across the sub-bands in the autonomous algorithm of
Figure 5 in the next scheduling period is increased (step 612). In this way, the performance achieved locally (i.e. the performance experienced by users within the cell) is improved. In addition, the counters N 1 and N 2 are modified accordingly in order to update the long-term performance measure of the cell (step 612). - If the short term performance level is met (i.e. if the short-term performance achieved by the cell is equal to or more than the second threshold value), the total transmit power to be allocated across the sub-bands in the autonomous algorithm of
Figure 5 in the next scheduling period is decreased (step 612). In addition, the counters N 1 and N 2 are modified accordingly in order to update the long-term performance measure of the cell (step 612). - In both cases (i.e. irrespective of whether the short term performance level is met), the total transmit power is distributed across the sub-bands based on the results of the autonomous algorithm of
Figure 5 (step 614). This algorithm ofFigure 5 may produce an uneven distribution of transmit power across the sub-bands. In this case, the transmit power is sub-band specific. The algorithm ofFigure 5 is used to "orthogonalise" the transmit powers among basestations of the network so as to avoid interference between basestations as much as possible. For example, where a basestation allocates a high power distribution to a particular sub-band, a neighbouring basestation would allocate a low power distribution to that particular sub-band. - By distributing the total transmit power across the sub-bands according to an algorithm which may produce an uneven distribution of the total transmit power across the sub-bands when the long-term performance achieved by the cell becomes satisfactory (i.e. when the long-term performance is equal to or more than the first threshold value), the same performance can be maintained while the interference with other cells can be reduced.
- Following the distribution of the total transmit power across the sub-bands (step 614), the total transmit power for input into the autonomous algorithm of
Figure 5 is updated (step 610) and the process is then repeated in the next scheduling period by again running the algorithm ofFigure 5 (step 600). - As described above, the power to be allocated across the sub-bands in the algorithm of
Figure 5 (i.e. the power that is subsequently input into the algorithm ofFigure 5 in the next scheduling period) is adjusted based on whether the long-term satisfaction and the short-term satisfaction achieved by the cell are satisfactory. This maintains an optimum performance level locally (i.e. an optimum performance level experienced by users within the cell) and thus protects the stability associated with the cell. However, in addition or alternatively, the power could also be increased within the algorithm ofFigure 5 at a sub-band level. - It is noted that the algorithm according to the invention could equally be used in combination with alternative algorithms to that of
Figure 5 . - Specific examples of the algorithm in accordance with the invention will now be described with reference to
Figures 8 and9 . - With reference to
Figure 8 , the autonomous algorithm ofFigure 5 is initialised and the counters N 1 and N 2, the total power P̃ to be shared among sub-bands (which is the input to the algorithm ofFigure 5 ), and the step size δP̃ for incrementing or decrementing the total power P̃ are initialised (step 900), as follows:

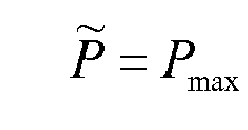

- In other words, the counter N 1 is set to zero, the counter N 2 is set to a
maximum value 
- The autonomous algorithm of
Figure 5 is run in order to compute the potential transmit powerP j that can be assigned to each sub-band (step 902). - It is checked whether the value of counter N 1 is less than a
maximum value 
maximum value 

- If one or both of these conditions are not met, it is determined whether the happiness H is less than a predetermined value H̃. In other words, it is determined whether the condition H < H̃ is met (step 906).
- If this condition is met, the total transmit power P̃ and the counters N 1 and N 2 are adapted (step 908) as follows:


- In other words, the total transmit power P̃ is increased by an amount a 2 δP̃ (limited by a maximum power P max), the counter N 1 is incremented by one (limited by the maximum count and the counter N 2 is reset to zero. Here, a 2 is a variable that scales the step size δP̃ to be used for the power adjustment.
- The total transmit power to be allocated to a sub-band j is then calculated by dividing the total transmit power by the total number of sub-bands J (i.e. by setting Pj = P̃/J) and the total transmit power is distributed accordingly (step 910). In this way, the total transmit power is distributed evenly across the sub-bands.
- Following the distribution of the total transmit power across the sub-bands (step 910), the algorithm waits for the next occasion to update (step 912) and the process is then repeated in the next scheduling period by again running the algorithm of
Figure 5 (step 902). - If it is determined that the happiness H is not less than the predetermined value H̃, i.e. if the condition H < H̃ is not met, it is determined whether the happiness is greater than or equal to a predetermined value ηH̃, i.e. it is checked whether the condition H ≥ ηH̃ is met (step 914). The predetermined value ηH̃ is the product of a hysteresis factor η and the predetermined value H̃. The hysteresis factor η may, for example, be a value slightly larger than one (such as a value of 1.2, etc).
- If the condition H ≥ ηH̃ is not met, the algorithm waits for the next occasion to update (step 912) and the process is then repeated in the next scheduling period by again running the algorithm of
Figure 5 (step 902). - If the condition H ≥ ηH̃ is met, the total transmit power P̃ and the counters N 1 and N 2 are adapted (step 916) as follows:


- In other words, the total transmit power P̃ is decreased by an amount a 2 δP̃ (limited by a minimum power Pmin ), the counter N 1 is reset to zero, and the counter N 2 is incremented by one (limited by the
maximum count 
- The total transmit power to be allocated to a sub-band j is then calculated by dividing the total transmit power by the total number of sub-bands J (i.e. by setting Pj = P̃/J) and the total transmit power is distributed accordingly (step 910). In this way, the total transmit power is distributed evenly across the sub-bands.
- Following the distribution of the total transmit power across the sub-bands (step 910), the algorithm waits for the next occasion to update (step 912) and the process is then repeated in the next scheduling period by again running the algorithm of
Figure 5 (step 902). - If both of the conditions of Equation (13) are met, it is determined whether the happiness H is less than a predetermined value H̃. In other words, it is determined whether the condition H < H̃ is met (step 918).
- If this condition is met, the total transmit power P̃ and the counters N 1 and N 2 are adapted (step 920) as follows:



- In other words, the total transmit power P̃ is increased by an amount a 1 δP̃ (limited by a maximum power P max), the counter N 1 is incremented by one (limited by the
maximum count 
- The variables a 1 and a 2 are constant values that allow the flexibility to adjust the power for the local optimization branch (
steps 918 to 924) and the re-excitation branch (steps 906 to 912) respectively at different rates, i.e. to allow the effective step size δP̃ used for the power adjustment to be different between the two branches. - The total transmit power to be allocated to sub-band j is then updated by setting Pj =
P j for sub-band j, whereP j is the power selected based on the results of the autonomous algorithm ofFigure 5 and the total transmit power is distributed across the sub-bands accordingly (step 922). - Following the distribution of the total transmit power across the sub-bands (step 922), the algorithm waits for the next occasion to update (step 924) and the process is then repeated in the next scheduling period by again running the algorithm of
Figure 5 (step 902). - If it is determined that the happiness H is not less than the predetermined value H̃, i.e. if the condition H < H̃ is not met, it is determined whether the happiness H is greater than or equal to ηH̃, i.e. it is checked whether the condition H ≥ ηH̃ is met (step 926).
- If the condition H ≥ ηH̃ is not met, the algorithm waits for the next occasion to update (step 912) and the process is then repeated in the next scheduling period by again running the algorithm of
Figure 5 (step 902). - If the condition H ≥ ηH̃ is met, the total transmit power P̃ and the counters N 1 and N 2 are adapted (step 928) as follows:


- In other words, the total transmit power P̃ is decreased by an amount a 1 δP̃ (limited by a minimum power P min), the counter N 1 is reset to zero, and the counter N 2 is incremented by one (limited by the
maximum count 
- The total transmit power to be allocated to sub-band j is then updated by setting Pj =
P j for sub-band j, whereP j is the power selected based on the results of the autonomous algorithm ofFigure 5 and the total transmit power is distributed across the sub-bands accordingly (step 922). - Following the distribution of the total transmit power across the sub-bands (step 922), the algorithm waits for the next occasion to update (step 924) and the process is then repeated in the next scheduling period by again running the algorithm of
Figure 5 (step 902). - With reference to
Figure 9 , another embodiment is provided that is similar to the embodiment shown inFigure 8 . In contrast to the embodiment shown inFigure 8 , the total transmit power Pj to be allocated to sub-band j is set (step 806 or 808) immediately after the long-term performance check is performed (step 804) in the embodiment shown inFigure 9 . Also, depending on which branch (step 806 or 808) is selected based on the result of the long-term performance check (in step 804), the variable a is set accordingly. As before, the variable a scales the effective step size to be used for the power adjustment. - The steps of
Figure 9 will not be described in detail for simplicity since the steps have already been described with reference toFigure 8 . - In the method according to the invention, the Quality of Service (QoS) requirement is incorporated directly into the algorithm and it is possible to adjust the downlink power directly based on the current level of happiness achieved. Unlike previous algorithms that are based on the exchange of information among eNBs where the power adjustment is on a per-sub-band basis, the power adjustment according to the invention is based on the total power. It should be noted that the power for the pilot channel and other control channels can be excluded, depending on the specific implementation.
- In other words, according to the invention, the total power P̃ is used as the input to the autonomous algorithm of
Figure 5 instead of a fixed power P* that is used in existing methods. The reason for this is that the adjustment of sub-band specific power would disrupt the integrity of the autonomous algorithm ofFigure 5 , and thereby affect the stability of the algorithm. Thus, each power adjustment step according to the invention modifies the total power P̃ and allows the autonomous algorithm to compute the sub-band specific power Pj, ∀j. This results in a much more stable and usable algorithm. - Also, existing algorithms attempt to orthogonalise the usage of frequency resources among eNBs in order to reduce or eliminate inter-cell interference by allocating nonoverlapping (or quasi-orthogonal if complete orthogonality cannot be achieved) resources among eNBs. However, although this provides a positive impact on cell edge performance, it is important to realise that there is a trade-off between cell edge performance and cell performance. In particular, by orthogonalising frequency resources, inter-cell interference is reduced but at the expense of lower utilization of resources, which would lower the performance that the cell can potentially achieve. This potentially lowers the level of cell-specific happiness.
- In contrast, the invention combines the benefits of resource orthogonalisation and improves the cell-specific happiness by re-introducing the full reuse when the happiness starts to degrade. At that point, the happiness tends to increase until it reaches a point (with some hysteresis) where the autonomous algorithm is reintroduced. The re-introduction of the autonomous algorithm allows the power adjustment to be performed at a slightly different initial condition, and thereby potentially drives the solution to an improved local optimum. Thus, the invention allows the power to continuously improve in the long run.
- The invention can be viewed as a state machine. As described previously, the input to the autonomous algorithm of
Figure 5 is Ri,j , ∀i,j, which is the bit rate that can be achieved by sub-band j for user i. The output of the algorithm is the sub-band specific power Pj , ∀j. It is noted that the power Pj, ∀j may be considered optimal only within a certain region of solution space, i.e. local optimal solution (as shown inFigure 10 ). - By introducing the "re-excitation", the bit rates Ri,j, ∀i,j are affected due to the change of the power distribution across the sub-bands. This "excitation" may cause the solution to potentially "jump" to a solution space in which a better solution quality can be found (as shown in
Figure 10 ). The subsequent re-introduction of the autonomous algorithm ofFigure 5 makes use of the new set of bit rates and outputs a potentially better set of power profiles Pj , ∀j, as shown inFigure 10 . -
Figures 11-24 are numerical illustrations that show the benefit of the invention performed in a practical scenario. - The scenario is based on a dual-stripe model such as that disclosed in, "interference Management in OFDMA Femtocells", Small Cell Forum, March 2010. One dual stripe apartment block is included, with four apartments per row, and the femto activation ratio of 1.0 and deployment ratio 1.0 are assumed. There is one HeNB in each activated apartment, which is randomly distributed within the room, with four UEs being served by each HeNB. The 3km/hr Pedestrian A channel model is used. The maximum total downlink power is 20dBm for each HeNB. The value of the weighting parameter w is set to 8.
-
Figure 11 illustrates a cumulative distribution function (CDF) of a user bit rate for various values of rate requirement and hysteresis parameter η, obtained with and without a re-excitation mechanism. In addition, a reference case is included whereby power management is disabled and the total downlink power is fixed and uniformly distributed across the sub-bands. It can be seen that the average user bit rate for the reference case is very good. In this case, only 5% of users achieve approximately 20.0 bytes/TTI, which is significantly below the required bit rate. However, in comparison, even those 5% of users are able to achieve the required bit rate when the algorithm of the invention is employed. - The behaviour of the baseline case is expected since full downlink power is used and there is no rate requirement which would limit the bit rate. Thus, users with good channel qualities tend to experience a satisfactory performance.
- As no inter-cell coordination is available, the inter-cell interference would have a greater impact on the UEs at the edge of the cells. On the other hand, the average user bit rate is generally lower when the algorithm of the invention is employed due to the restriction of the rate requirement. Thus, if the cell is happy, there is no incentive for a cell to maintain a higher transmit power than is necessary.
- The sub-band power adjustment of the invention enables the power to be adapted in such a way that the power allocation among neighbours is relatively orthogonal among sub-bands. As expected, as the required bit rate decreases, the average user bit rate is reduced correspondingly. More importantly, as can be seen in
Figure 11 , the performance improvement of users at the cell edge associated with invention is significant relative to those of the reference case. The invention prevents unnecessary energy being wasted on more central users that are already experiencing a satisfactory performance at the expense of the users at the cell edge. By redistributing the power appropriately, the performance experienced by users at the cell edge is improved while energy is saved. - Another important observation from
Figure 11 is that the algorithm without the re-excitation mechanism of the invention is not able to sustain the required bit rate requirement of 120bytes/TTI. In comparison, the algorithm of the invention is not only able to sustain the required bit rate of 120bytes/TTI, but is also able to sustain a bit rate of 150bytes/TTI. This shows that the re-excitation mechanism of the invention is able to improve the orthogonalisation of the sub-band power allocation among neighbour cells to thereby reduce inter-cell interference while simultaneously improving the power efficiency. - Also, from
Figure 11 , it can be seen that the hysteresis value η delays the power reduction when the cell-specific happiness is reached. Thus, a larger hysteresis value improves the overall average cell performance at the expense of slightly higher power utilization. -
Figures 12 and13 illustrate a change in user bit rate for a bit rate requirement of 120 Bytes/TTI obtained with and without the re-excitation mechanism of the invention. - In
Figure 12 , it can be seen that without the re-excitation mechanism, even the average performance cannot be maintained. This is because the orthogonalisation of power allocation across sub-bands among neighbouring cells is not well optimised. By improving the orthogonalisation of such power allocation (with the re-excitation mechanism), the required bit rate can on average be met, as shown inFigure 13 . -
Figure 14 illustrates a change in average downlink transmit power per Home enhanced Node B (HeNB). As expected, the power associated with the reference case is constant. In comparison, when the algorithm of the invention is employed, the power decreases over time. The re-excitation mechanism allows the power optimisation to be carried out opportunistically, and thereby allows power to be adapted depending on the current interference situation. The implication is that a significant power saving is possible. As suggested inFigure 14 , without employing the algorithm of the invention, it is not possible to maintain a continuous power reduction at the selected required bit rate. In other words, only a small improvement on power efficiency can be achieved without the presence of the re-excitation mechanism of the invention. Again, as expected, a higher value of the hysteresis value η improves the overall average cell performance at the expense of slightly higher power utilization. -
Figure 15 illustrates a CDF of a user bit rate for various values of hysteresis parameter η, obtained with and without a re-excitation mechanism, for the case of a smaller rate requirement. As shown inFigure 15 , the algorithm with the re-excitation mechanism of the invention provides an improved performance compared to the algorithm without the re-excitation mechanism. -
Figures 16 and17 illustrate a change in user bit rate for the case of the smaller rate requirement with and without a re-excitation mechanism respectively. It can be seen inFigures 16 and17 that as long as there is sufficient power resource relative to the required bit rate, the user bit rates provide suitable coverage to the required target. The higher the required bit rate, the more variation there will be in the bit rate. This would result in more effort being required to sufficiently improve the bit rate of users that have the worst bit rate to meet the target bit rate. On the other hand, at a lower required bit rate, less effort would be required to improve the bit rate of those users. -
Figure 18 illustrates a change in average downlink transmit power per Home enhanced Node B (HeNB) for the case of the smaller rate requirement for the cases with and without the re-excitation mechanism. It can be seen that although both the algorithm with the re-excitation mechanism and the algorithm without the re-excitation mechanism can maintain the user bit rate to the desired level shown inFigure 17 , the algorithm without the re-excitation mechanism still requires a much higher level of transmit power. -
Figure 19 illustrates a CDF of a user bit rate for various values of hysteresis parameter η and a bit rate requirement of 120 Bytes/TTI with two different random seeds. As expected, some statistical variation occurs at the extreme ends of the bit rates. However, the results suggest that the average performance experienced as a result of the two different seeds are similar. -
Figure 20 illustrates a change in user bit rate for various values of hysteresis parameter η and a bit rate requirement of 120 Bytes/TTI with two different random seeds. Again, it can be seen that the dynamics of the algorithm due to the random seeds are similar, and that the statistical fluctuations should not have any impact on the conclusion of the results. - A set of simulation cases have been performed in order to investigate the impact on performance due to the presence of the macro base station. The simulation involves placing the femto block close to a transmitter of a macrolayer basestation (as shown in
Figure 21 ) and placing the femto block far away from the transmitter of the macrolayer basestation (as shown inFigure 22 ). In this simulation, the hysteresis is set to 1.50, the macro antenna model is based on the cosine antenna model with a 3dB beamwidth of 60 degree, and the transmit power of the macrolayer basestation is 46dBm. -
Figure 23 illustrates a CDF of a user bit rate for a bit rate requirement of 120 Bytes/TTI in the case where the femto block is placed far away from the transmitter of the macrolayer basestation and the case where the femto block is placed close to the transmitter of the macrolayer basestation. It can be seen that, as expected, the user bit rate performance in the case where the femto block is close to macro transmitter is worse than that of the case where the femto block is far from the macro transmitter. However, the average performances between the two cases are very similar. This is expected since the happiness criterion is based on the average cell performance. Of course, if the happiness criterion is based on the X-percentile, then, as long as the resources are available, the X-percentile performance between the two cases should be similar. - It can also be seen that the cell-edge performances for the baseline cases are visibly worse than those of the proposed cases. On the other hand, the difference between average and cell edge performances of the baseline cases is much larger than that of the proposed cases. This observation points to the fact that, in the baseline case, unnecessary energy has been wasted to maintain the unnecessarily high bit rate while the cell edge users are experiencing poor performance. The results suggest that such degraded performance of the edge users and the energy wastage are not necessary even in the presence of a macrolayer basestation, if the proposed algorithm is applied.
- Finally,
Figure 24 illustrates a change in average downlink transmit power per Home enhanced Node B (HeNB) for a bit rate requirement of 120 Bytes/TTI in the case where the femto block is placed far away from the transmitter of the macrolayer basestation and the case where the femto block is placed close to the transmitter of the macrolayer basestation. Due to the presence of the macrolayer basestation, the performance associated with the femto block that is close to the macrolayer basestation requires more power to maintain the required performance than the case where the femto block is far away. However, the results suggest that even when the femto block is very close to the macrolayer basestation, the increased macro interference does not deter the cell edge performance improvement or the energy saving. Although, a high transmit power is required to overcome the additional interference. - Although the invention is described in terms of performing power adaptations among cells autonomously, it is to be understood that the invention is also compatible with schemes where communication links between nodes exists. For example, the invention could be employed in a deployment scenario with two layers (a macro layer and a small cells layer). In this case, only the nodes in the small cell layer may be using the autonomous algorithm of the invention.
- Also, the algorithm of the invention assumes certain maximum and minimum powers for each cell as inputs. While the cell power across different sub-bands can be adaptively adjusted in order to provide good cell-edge protection and energy saving autonomously, the maximum and minimum powers could also be adjusted much more slowly (for example, depending on the time of the day, the traffic density conditions, etc).
- The invention may also be employed with a centralised entity whereby the entity may adjust the power range (i.e. by the adjustment of the maximum and minimum powers) with which each cell can operate. The centralised entity may, for example, employ a high level algorithm on a global level and the algorithm of the invention to perform its local optimization autonomously. Thus, the algorithm of the invention is also compatible with a self-organising network mechanism operating at a different time scale.
- The invention makes use of the QoS requirement to adjust the downlink transmit power in the frequency domain and incorporates the notion of "happiness" in an autonomous algorithm. The "happiness" level of the cell is continuously monitored and the autonomous algorithm is intelligently triggered to provide power adaptation.
- The intelligent way in which the algorithm of the invention adjusts downlink transmit power of a network significantly reduces power consumption, while still achieving the service requirement, and thereby reduces costs. The algorithm of the invention also improves the performance experienced by users at the cell-edge to provide improved cell-edge coverage, and thereby enhances the satisfaction of users at the cell edge and extends the cell range.
- Furthermore, the algorithm of the invention eliminates the need to establish communication links among neighbour cells for interference purposes. This greatly simplifies the deployment and planning from an interference point of view since the individual cell power would self-adapt to a desired level. This is particularly beneficial in the context of a HetNet. However, the algorithm of the invention is also compatible with schemes where communication links between peer nodes, as well as between nodes of different layers, exits. The algorithm of the invention is also compatible with schemes operated at a different time scale, and where there coexist multi-layer operations.
- The algorithm of the invention applies to any technology involving frequency domain power control. In particular, the algorithm of the invention applies to LTE.
Claims (16)
- A method for controlling a power allocation in a base station of a cell in a cellular communications network across a plurality of sub-bands, the method comprising the steps of:determining whether a long-term performance achieved by the cell exceeds a first threshold value; andallocating a total transmit power across the sub-bands according to whether the long-term performance achieved by the cell exceeds the first threshold value.
- A method as claimed in claim 1, wherein:if the long-term performance achieved by the cell is equal to or more than the first threshold value, the step of allocating the total transmit power comprises:distributing the total transmit power across the sub-bands according to an algorithm which may produce an uneven distribution of the total transmit power across the sub-bands.
- A method as claimed in claim 2, wherein the algorithm is adapted to allocate a transmit power to a sub-band based on the frequency of the sub-band.
- A method as claimed in any of the preceding claims, wherein:if the long-term performance achieved by the cell is less than the first threshold value, the step of allocating the total transmit power comprises:distributing the total transmit power evenly across the sub-bands.
- A method as claimed in any of claims 1-3, wherein:if the long-term performance achieved by the cell is less than the first threshold value, the step of allocating the total transmit power comprises:for each sub-band, determining whether a power currently allocated to the sub-band exceeds a second threshold value; anddistributing the total transmit power across the sub-bands by allocating a power to each sub-band according to whether the power currently allocated to said sub-band exceeds the second threshold value.
- A method as claimed in 5, wherein:if the power currently allocated to a sub-band is greater than or equal to the second threshold value, the step of distributing the total transmit power across the sub-bands comprises:allocating a first power to said sub-band.
- A method as claimed in claim 6, wherein the first power is greater than the second threshold value.
- A method as claimed in any of claims 5-7, wherein:if the power currently allocated to a sub-band is less than the second threshold value, the step of distributing the total transmit power across the sub-bands comprises:allocating a second power to said sub-band.
- A method as claimed in claim 8, wherein the second power is less than the second threshold value.
- A method as claimed in any of the preceding claims, wherein the long-term performance is a factor relating to a happiness of users in the cell.
- A method as claimed in any of claims 1-4, wherein the long-term performance is determined based on the Packet Data Convergence Protocol (PDCP) packet delay for each bearer established for the basestation per delay budget for the cell.
- A method as claimed in any of the preceding claims, the method further comprising the step of:adapting the total transmit power based on a short-term performance achieved by the cell.
- A method as claimed in claim 12, wherein the step of adapting the total transmit power based on a short-term performance achieved by the cell comprises:determining whether the short-term performance achieved by the cell exceeds a third threshold value; andadapting the total transmit power according to whether the short-term performance achieved by the cell exceeds the third threshold value.
- A method as claimed in claim 13, wherein:if the short-term performance achieved by the cell is equal to or more than the third threshold value:decreasing the total transmit power.
- A method as claimed in claims 13 or 14, wherein:if the short-term performance achieved by the cell is less than the third threshold value:increasing the total transmit power.
- A basestation, configured to perform a method as claimed in any of claims 1-15.
Applications Claiming Priority (1)
| Application Number | Priority Date | Filing Date | Title |
|---|---|---|---|
| GB1307956.1A GB2513634B (en) | 2013-05-02 | 2013-05-02 | Power management in a cellular system |
Publications (3)
| Publication Number | Publication Date |
|---|---|
| EP2800427A2 true EP2800427A2 (en) | 2014-11-05 |
| EP2800427A3 EP2800427A3 (en) | 2016-01-13 |
| EP2800427B1 EP2800427B1 (en) | 2021-06-02 |
Family
ID=48627206
Family Applications (1)
| Application Number | Title | Priority Date | Filing Date |
|---|---|---|---|
| EP14163610.0A Active EP2800427B1 (en) | 2013-05-02 | 2014-04-04 | Power management in a cellular communication system |
Country Status (3)
| Country | Link |
|---|---|
| US (1) | US9226232B2 (en) |
| EP (1) | EP2800427B1 (en) |
| GB (1) | GB2513634B (en) |
Families Citing this family (5)
| Publication number | Priority date | Publication date | Assignee | Title |
|---|---|---|---|---|
| CN108737316B (en) * | 2013-03-13 | 2021-04-23 | 三菱电机株式会社 | Transmission device and transmission method |
| EP3032767B1 (en) | 2013-08-06 | 2019-07-03 | Mitsubishi Electric Corporation | Transmitting device, receiving device, and communication system |
| EP3264831B1 (en) * | 2016-06-29 | 2021-03-17 | Apple Inc. | Communication device and method for operating a communication device |
| EP3273634A1 (en) * | 2016-07-18 | 2018-01-24 | Panasonic Intellectual Property Corporation of America | Improved support of quality of service for v2x transmissions |
| US20240049128A1 (en) * | 2020-12-30 | 2024-02-08 | Telefonaktiebolaget Lm Ericsson (Publ) | First network node and method in a communication network for controlling power consumption |
Family Cites Families (8)
| Publication number | Priority date | Publication date | Assignee | Title |
|---|---|---|---|---|
| KR100717828B1 (en) * | 2005-12-09 | 2007-05-11 | 한국전자통신연구원 | Adaptive Transmission Power Allocation Method in Multi-User ODF System |
| WO2008026061A2 (en) * | 2006-08-31 | 2008-03-06 | Nokia Corporation | Method and apparatus for providing resource allocation using utility-based cross-layer optimization |
| JP5039593B2 (en) * | 2008-02-07 | 2012-10-03 | 株式会社エヌ・ティ・ティ・ドコモ | Wireless communication system, wireless communication method, and base station |
| US20130142177A1 (en) * | 2010-06-02 | 2013-06-06 | Nokia Corporation | Method and apparatus for adjacent-channel emission limit depending on synchronization of interfered receiver |
| EP2633726B1 (en) * | 2010-10-28 | 2018-01-03 | Telefonaktiebolaget LM Ericsson (publ) | Method and apparatus for uplink transmit power adjustment |
| EP2697913B1 (en) * | 2011-04-13 | 2016-10-12 | Telefonaktiebolaget LM Ericsson (publ) | Method and base station for power allocation in wireless system |
| US9264928B2 (en) * | 2011-11-04 | 2016-02-16 | Interdigital Patent Holdings, Inc. | Methods, apparatus and systems for minimization of drive tests (MDT) based on QoS verifications |
| GB2496908B (en) * | 2011-11-28 | 2017-04-26 | Ubiquisys Ltd | Power management in a cellular system |
-
2013
- 2013-05-02 GB GB1307956.1A patent/GB2513634B/en active Active
-
2014
- 2014-04-04 EP EP14163610.0A patent/EP2800427B1/en active Active
- 2014-04-14 US US14/252,405 patent/US9226232B2/en active Active
Non-Patent Citations (1)
| Title |
|---|
| None * |
Also Published As
| Publication number | Publication date |
|---|---|
| GB201307956D0 (en) | 2013-06-12 |
| GB2513634A (en) | 2014-11-05 |
| GB2513634B (en) | 2020-08-19 |
| EP2800427B1 (en) | 2021-06-02 |
| EP2800427A3 (en) | 2016-01-13 |
| US20140329534A1 (en) | 2014-11-06 |
| US9226232B2 (en) | 2015-12-29 |
Similar Documents
| Publication | Publication Date | Title |
|---|---|---|
| US9826487B2 (en) | Power management in a cellular system | |
| US9717010B2 (en) | Load estimation and load management in a cellular communications network | |
| Lee et al. | Mitigation of inter-femtocell interference with adaptive fractional frequency reuse | |
| JP5657765B2 (en) | Method for controlling operation in a cell of a wireless cellular network, base station and wireless cellular network | |
| EP2800427B1 (en) | Power management in a cellular communication system | |
| Hatoum et al. | QoS-based power control and resource allocation in OFDMA femtocell networks | |
| US10645702B2 (en) | Method and system for muting radio resources in a wireless communication system | |
| WO2014027170A2 (en) | Communication system and method | |
| Susanto et al. | Interference Management using power control for uplink transmission in femtocell-macrocell cellular communication network | |
| Abdelnasser et al. | Joint subchannel and power allocation in two-tier OFDMA HetNets with clustered femtocells | |
| Çakir et al. | Power adjustment based interference management in dense heterogeneous femtocell networks | |
| EP2779756B1 (en) | Control of user equipment to base station association to optimise network capacity utilisation | |
| Kosta et al. | A distributed method of inter-cell interference coordination (ICIC) based on dual decomposition for interference-limited cellular networks | |
| Kwan | Distributed energy-saving mechanism for self-organizing Femto LTE networks | |
| Mohammadi et al. | Spectrum allocation using fuzzy logic with optimal power in wireless network | |
| Madan et al. | Impact of coordination delay on distributed scheduling in LTE-A femtocell networks | |
| Burchardt et al. | Uplink interference protection and scheduling for energy efficient OFDMA networks | |
| Koleva et al. | Improved open loop power control for LTE uplink | |
| Vlacheas et al. | Autonomic downlink inter-cell interference coordination in LTE self-organizing networks | |
| Madan et al. | Uplink resource allocation for frequency selective channels and fractional power control in LTE | |
| Yu et al. | Dynamic frame configuration in TD-LTE heterogeneous cellular networks | |
| Ebrahim et al. | An uncoordinated frequency allocation scheme for future femtocell networks | |
| Xu et al. | Fuzzy-logic based Q-Learning interference management algorithms in two-tier networks | |
| Koleva et al. | Risk assessment based LTE hetnet uplink power and interference control | |
| Kwan et al. | On autonomous energy-saving mechanism for self-organizing LTE networks |
Legal Events
| Date | Code | Title | Description |
|---|---|---|---|
| PUAI | Public reference made under article 153(3) epc to a published international application that has entered the european phase |
Free format text: ORIGINAL CODE: 0009012 |
|
| 17P | Request for examination filed |
Effective date: 20140404 |
|
| AK | Designated contracting states |
Kind code of ref document: A2 Designated state(s): AL AT BE BG CH CY CZ DE DK EE ES FI FR GB GR HR HU IE IS IT LI LT LU LV MC MK MT NL NO PL PT RO RS SE SI SK SM TR |
|
| AX | Request for extension of the european patent |
Extension state: BA ME |
|
| PUAL | Search report despatched |
Free format text: ORIGINAL CODE: 0009013 |
|
| AK | Designated contracting states |
Kind code of ref document: A3 Designated state(s): AL AT BE BG CH CY CZ DE DK EE ES FI FR GB GR HR HU IE IS IT LI LT LU LV MC MK MT NL NO PL PT RO RS SE SI SK SM TR |
|
| AX | Request for extension of the european patent |
Extension state: BA ME |
|
| RIC1 | Information provided on ipc code assigned before grant |
Ipc: H04W 52/02 20090101ALI20151210BHEP Ipc: H04W 52/34 20090101ALI20151210BHEP Ipc: H04W 52/14 20090101ALN20151210BHEP Ipc: H04W 52/26 20090101AFI20151210BHEP |
|
| R17P | Request for examination filed (corrected) |
Effective date: 20160621 |
|
| RBV | Designated contracting states (corrected) |
Designated state(s): AL AT BE BG CH CY CZ DE DK EE ES FI FR GB GR HR HU IE IS IT LI LT LU LV MC MK MT NL NO PL PT RO RS SE SI SK SM TR |
|
| STAA | Information on the status of an ep patent application or granted ep patent |
Free format text: STATUS: EXAMINATION IS IN PROGRESS |
|
| 17Q | First examination report despatched |
Effective date: 20171107 |
|
| RAP1 | Party data changed (applicant data changed or rights of an application transferred) |
Owner name: CISCO TECHNOLOGY, INC. |
|
| GRAP | Despatch of communication of intention to grant a patent |
Free format text: ORIGINAL CODE: EPIDOSNIGR1 |
|
| STAA | Information on the status of an ep patent application or granted ep patent |
Free format text: STATUS: GRANT OF PATENT IS INTENDED |
|
| RIC1 | Information provided on ipc code assigned before grant |
Ipc: H04W 52/02 20090101ALI20201030BHEP Ipc: H04W 52/14 20090101ALN20201030BHEP Ipc: H04W 52/34 20090101ALI20201030BHEP Ipc: H04W 52/26 20090101AFI20201030BHEP |
|
| INTG | Intention to grant announced |
Effective date: 20201120 |
|
| GRAS | Grant fee paid |
Free format text: ORIGINAL CODE: EPIDOSNIGR3 |
|
| GRAA | (expected) grant |
Free format text: ORIGINAL CODE: 0009210 |
|
| STAA | Information on the status of an ep patent application or granted ep patent |
Free format text: STATUS: THE PATENT HAS BEEN GRANTED |
|
| REG | Reference to a national code |
Ref country code: CH Ref legal event code: EP |
|
| AK | Designated contracting states |
Kind code of ref document: B1 Designated state(s): AL AT BE BG CH CY CZ DE DK EE ES FI FR GB GR HR HU IE IS IT LI LT LU LV MC MK MT NL NO PL PT RO RS SE SI SK SM TR |
|
| REG | Reference to a national code |
Ref country code: GB Ref legal event code: FG4D |
|
| REG | Reference to a national code |
Ref country code: AT Ref legal event code: REF Ref document number: 1399644 Country of ref document: AT Kind code of ref document: T Effective date: 20210615 |
|
| REG | Reference to a national code |
Ref country code: IE Ref legal event code: FG4D |
|
| REG | Reference to a national code |
Ref country code: DE Ref legal event code: R096 Ref document number: 602014077844 Country of ref document: DE |
|
| REG | Reference to a national code |
Ref country code: LT Ref legal event code: MG9D |
|
| PG25 | Lapsed in a contracting state [announced via postgrant information from national office to epo] |
Ref country code: HR Free format text: LAPSE BECAUSE OF FAILURE TO SUBMIT A TRANSLATION OF THE DESCRIPTION OR TO PAY THE FEE WITHIN THE PRESCRIBED TIME-LIMIT Effective date: 20210602 Ref country code: LT Free format text: LAPSE BECAUSE OF FAILURE TO SUBMIT A TRANSLATION OF THE DESCRIPTION OR TO PAY THE FEE WITHIN THE PRESCRIBED TIME-LIMIT Effective date: 20210602 Ref country code: FI Free format text: LAPSE BECAUSE OF FAILURE TO SUBMIT A TRANSLATION OF THE DESCRIPTION OR TO PAY THE FEE WITHIN THE PRESCRIBED TIME-LIMIT Effective date: 20210602 Ref country code: BG Free format text: LAPSE BECAUSE OF FAILURE TO SUBMIT A TRANSLATION OF THE DESCRIPTION OR TO PAY THE FEE WITHIN THE PRESCRIBED TIME-LIMIT Effective date: 20210902 |
|
| REG | Reference to a national code |
Ref country code: NL Ref legal event code: MP Effective date: 20210602 |
|
| REG | Reference to a national code |
Ref country code: AT Ref legal event code: MK05 Ref document number: 1399644 Country of ref document: AT Kind code of ref document: T Effective date: 20210602 |
|
| PG25 | Lapsed in a contracting state [announced via postgrant information from national office to epo] |
Ref country code: GR Free format text: LAPSE BECAUSE OF FAILURE TO SUBMIT A TRANSLATION OF THE DESCRIPTION OR TO PAY THE FEE WITHIN THE PRESCRIBED TIME-LIMIT Effective date: 20210903 Ref country code: LV Free format text: LAPSE BECAUSE OF FAILURE TO SUBMIT A TRANSLATION OF THE DESCRIPTION OR TO PAY THE FEE WITHIN THE PRESCRIBED TIME-LIMIT Effective date: 20210602 Ref country code: NO Free format text: LAPSE BECAUSE OF FAILURE TO SUBMIT A TRANSLATION OF THE DESCRIPTION OR TO PAY THE FEE WITHIN THE PRESCRIBED TIME-LIMIT Effective date: 20210902 Ref country code: PL Free format text: LAPSE BECAUSE OF FAILURE TO SUBMIT A TRANSLATION OF THE DESCRIPTION OR TO PAY THE FEE WITHIN THE PRESCRIBED TIME-LIMIT Effective date: 20210602 Ref country code: RS Free format text: LAPSE BECAUSE OF FAILURE TO SUBMIT A TRANSLATION OF THE DESCRIPTION OR TO PAY THE FEE WITHIN THE PRESCRIBED TIME-LIMIT Effective date: 20210602 Ref country code: SE Free format text: LAPSE BECAUSE OF FAILURE TO SUBMIT A TRANSLATION OF THE DESCRIPTION OR TO PAY THE FEE WITHIN THE PRESCRIBED TIME-LIMIT Effective date: 20210602 |
|
| PG25 | Lapsed in a contracting state [announced via postgrant information from national office to epo] |
Ref country code: SK Free format text: LAPSE BECAUSE OF FAILURE TO SUBMIT A TRANSLATION OF THE DESCRIPTION OR TO PAY THE FEE WITHIN THE PRESCRIBED TIME-LIMIT Effective date: 20210602 Ref country code: SM Free format text: LAPSE BECAUSE OF FAILURE TO SUBMIT A TRANSLATION OF THE DESCRIPTION OR TO PAY THE FEE WITHIN THE PRESCRIBED TIME-LIMIT Effective date: 20210602 Ref country code: CZ Free format text: LAPSE BECAUSE OF FAILURE TO SUBMIT A TRANSLATION OF THE DESCRIPTION OR TO PAY THE FEE WITHIN THE PRESCRIBED TIME-LIMIT Effective date: 20210602 Ref country code: EE Free format text: LAPSE BECAUSE OF FAILURE TO SUBMIT A TRANSLATION OF THE DESCRIPTION OR TO PAY THE FEE WITHIN THE PRESCRIBED TIME-LIMIT Effective date: 20210602 Ref country code: PT Free format text: LAPSE BECAUSE OF FAILURE TO SUBMIT A TRANSLATION OF THE DESCRIPTION OR TO PAY THE FEE WITHIN THE PRESCRIBED TIME-LIMIT Effective date: 20211004 Ref country code: NL Free format text: LAPSE BECAUSE OF FAILURE TO SUBMIT A TRANSLATION OF THE DESCRIPTION OR TO PAY THE FEE WITHIN THE PRESCRIBED TIME-LIMIT Effective date: 20210602 Ref country code: RO Free format text: LAPSE BECAUSE OF FAILURE TO SUBMIT A TRANSLATION OF THE DESCRIPTION OR TO PAY THE FEE WITHIN THE PRESCRIBED TIME-LIMIT Effective date: 20210602 Ref country code: ES Free format text: LAPSE BECAUSE OF FAILURE TO SUBMIT A TRANSLATION OF THE DESCRIPTION OR TO PAY THE FEE WITHIN THE PRESCRIBED TIME-LIMIT Effective date: 20210602 Ref country code: AT Free format text: LAPSE BECAUSE OF FAILURE TO SUBMIT A TRANSLATION OF THE DESCRIPTION OR TO PAY THE FEE WITHIN THE PRESCRIBED TIME-LIMIT Effective date: 20210602 |
|
| REG | Reference to a national code |
Ref country code: DE Ref legal event code: R097 Ref document number: 602014077844 Country of ref document: DE |
|
| PLBE | No opposition filed within time limit |
Free format text: ORIGINAL CODE: 0009261 |
|
| STAA | Information on the status of an ep patent application or granted ep patent |
Free format text: STATUS: NO OPPOSITION FILED WITHIN TIME LIMIT |
|
| PG25 | Lapsed in a contracting state [announced via postgrant information from national office to epo] |
Ref country code: DK Free format text: LAPSE BECAUSE OF FAILURE TO SUBMIT A TRANSLATION OF THE DESCRIPTION OR TO PAY THE FEE WITHIN THE PRESCRIBED TIME-LIMIT Effective date: 20210602 |
|
| 26N | No opposition filed |
Effective date: 20220303 |
|
| PG25 | Lapsed in a contracting state [announced via postgrant information from national office to epo] |
Ref country code: AL Free format text: LAPSE BECAUSE OF FAILURE TO SUBMIT A TRANSLATION OF THE DESCRIPTION OR TO PAY THE FEE WITHIN THE PRESCRIBED TIME-LIMIT Effective date: 20210602 |
|
| PG25 | Lapsed in a contracting state [announced via postgrant information from national office to epo] |
Ref country code: IT Free format text: LAPSE BECAUSE OF FAILURE TO SUBMIT A TRANSLATION OF THE DESCRIPTION OR TO PAY THE FEE WITHIN THE PRESCRIBED TIME-LIMIT Effective date: 20210602 |
|
| REG | Reference to a national code |
Ref country code: CH Ref legal event code: PL |
|
| REG | Reference to a national code |
Ref country code: BE Ref legal event code: MM Effective date: 20220430 |
|
| PG25 | Lapsed in a contracting state [announced via postgrant information from national office to epo] |
Ref country code: MC Free format text: LAPSE BECAUSE OF FAILURE TO SUBMIT A TRANSLATION OF THE DESCRIPTION OR TO PAY THE FEE WITHIN THE PRESCRIBED TIME-LIMIT Effective date: 20210602 Ref country code: LU Free format text: LAPSE BECAUSE OF NON-PAYMENT OF DUE FEES Effective date: 20220404 Ref country code: LI Free format text: LAPSE BECAUSE OF NON-PAYMENT OF DUE FEES Effective date: 20220430 Ref country code: CH Free format text: LAPSE BECAUSE OF NON-PAYMENT OF DUE FEES Effective date: 20220430 |
|
| PG25 | Lapsed in a contracting state [announced via postgrant information from national office to epo] |
Ref country code: BE Free format text: LAPSE BECAUSE OF NON-PAYMENT OF DUE FEES Effective date: 20220430 |
|
| PG25 | Lapsed in a contracting state [announced via postgrant information from national office to epo] |
Ref country code: IE Free format text: LAPSE BECAUSE OF NON-PAYMENT OF DUE FEES Effective date: 20220404 |
|
| P01 | Opt-out of the competence of the unified patent court (upc) registered |
Effective date: 20230525 |
|
| PG25 | Lapsed in a contracting state [announced via postgrant information from national office to epo] |
Ref country code: HU Free format text: LAPSE BECAUSE OF FAILURE TO SUBMIT A TRANSLATION OF THE DESCRIPTION OR TO PAY THE FEE WITHIN THE PRESCRIBED TIME-LIMIT; INVALID AB INITIO Effective date: 20140404 |
|
| PG25 | Lapsed in a contracting state [announced via postgrant information from national office to epo] |
Ref country code: MK Free format text: LAPSE BECAUSE OF FAILURE TO SUBMIT A TRANSLATION OF THE DESCRIPTION OR TO PAY THE FEE WITHIN THE PRESCRIBED TIME-LIMIT Effective date: 20210602 Ref country code: CY Free format text: LAPSE BECAUSE OF FAILURE TO SUBMIT A TRANSLATION OF THE DESCRIPTION OR TO PAY THE FEE WITHIN THE PRESCRIBED TIME-LIMIT Effective date: 20210602 |
|
| PG25 | Lapsed in a contracting state [announced via postgrant information from national office to epo] |
Ref country code: MT Free format text: LAPSE BECAUSE OF FAILURE TO SUBMIT A TRANSLATION OF THE DESCRIPTION OR TO PAY THE FEE WITHIN THE PRESCRIBED TIME-LIMIT Effective date: 20210602 |
|
| PGFP | Annual fee paid to national office [announced via postgrant information from national office to epo] |
Ref country code: DE Payment date: 20250313 Year of fee payment: 12 |
|
| PGFP | Annual fee paid to national office [announced via postgrant information from national office to epo] |
Ref country code: FR Payment date: 20250402 Year of fee payment: 12 |
|
| PG25 | Lapsed in a contracting state [announced via postgrant information from national office to epo] |
Ref country code: TR Free format text: LAPSE BECAUSE OF FAILURE TO SUBMIT A TRANSLATION OF THE DESCRIPTION OR TO PAY THE FEE WITHIN THE PRESCRIBED TIME-LIMIT Effective date: 20210602 |
|
| PGFP | Annual fee paid to national office [announced via postgrant information from national office to epo] |
Ref country code: GB Payment date: 20260306 Year of fee payment: 13 |