EP2738554A1 - Novel biological information processing and analysis method for identifying and quantifying n-glycopeptides - Google Patents
Novel biological information processing and analysis method for identifying and quantifying n-glycopeptides Download PDFInfo
- Publication number
- EP2738554A1 EP2738554A1 EP13814404.3A EP13814404A EP2738554A1 EP 2738554 A1 EP2738554 A1 EP 2738554A1 EP 13814404 A EP13814404 A EP 13814404A EP 2738554 A1 EP2738554 A1 EP 2738554A1
- Authority
- EP
- European Patent Office
- Prior art keywords
- glycopeptide
- score
- quantification
- identification
- spectrum
- Prior art date
- Legal status (The legal status is an assumption and is not a legal conclusion. Google has not performed a legal analysis and makes no representation as to the accuracy of the status listed.)
- Granted
Links
Images








Classifications
-
- G—PHYSICS
- G16—INFORMATION AND COMMUNICATION TECHNOLOGY [ICT] SPECIALLY ADAPTED FOR SPECIFIC APPLICATION FIELDS
- G16B—BIOINFORMATICS, i.e. INFORMATION AND COMMUNICATION TECHNOLOGY [ICT] SPECIALLY ADAPTED FOR GENETIC OR PROTEIN-RELATED DATA PROCESSING IN COMPUTATIONAL MOLECULAR BIOLOGY
- G16B15/00—ICT specially adapted for analysing two-dimensional [2D] or three-dimensional [3D] molecular structures, e.g. structural or functional relations or structure alignment
-
- G—PHYSICS
- G01—MEASURING; TESTING
- G01N—INVESTIGATING OR ANALYSING MATERIALS BY DETERMINING THEIR CHEMICAL OR PHYSICAL PROPERTIES
- G01N30/00—Investigating or analysing materials by separation into components using adsorption, absorption or similar phenomena or using ion-exchange, e.g. chromatography or field flow fractionation
- G01N30/02—Column chromatography
- G01N30/62—Detectors specially adapted therefor
- G01N30/72—Mass spectrometers
-
- C—CHEMISTRY; METALLURGY
- C12—BIOCHEMISTRY; BEER; SPIRITS; WINE; VINEGAR; MICROBIOLOGY; ENZYMOLOGY; MUTATION OR GENETIC ENGINEERING
- C12Q—MEASURING OR TESTING PROCESSES INVOLVING ENZYMES, NUCLEIC ACIDS OR MICROORGANISMS; COMPOSITIONS OR TEST PAPERS THEREFOR; PROCESSES OF PREPARING SUCH COMPOSITIONS; CONDITION-RESPONSIVE CONTROL IN MICROBIOLOGICAL OR ENZYMOLOGICAL PROCESSES
- C12Q1/00—Measuring or testing processes involving enzymes, nucleic acids or microorganisms; Compositions therefor; Processes of preparing such compositions
- C12Q1/34—Measuring or testing processes involving enzymes, nucleic acids or microorganisms; Compositions therefor; Processes of preparing such compositions involving hydrolase
-
- C—CHEMISTRY; METALLURGY
- C12—BIOCHEMISTRY; BEER; SPIRITS; WINE; VINEGAR; MICROBIOLOGY; ENZYMOLOGY; MUTATION OR GENETIC ENGINEERING
- C12Q—MEASURING OR TESTING PROCESSES INVOLVING ENZYMES, NUCLEIC ACIDS OR MICROORGANISMS; COMPOSITIONS OR TEST PAPERS THEREFOR; PROCESSES OF PREPARING SUCH COMPOSITIONS; CONDITION-RESPONSIVE CONTROL IN MICROBIOLOGICAL OR ENZYMOLOGICAL PROCESSES
- C12Q1/00—Measuring or testing processes involving enzymes, nucleic acids or microorganisms; Compositions therefor; Processes of preparing such compositions
- C12Q1/34—Measuring or testing processes involving enzymes, nucleic acids or microorganisms; Compositions therefor; Processes of preparing such compositions involving hydrolase
- C12Q1/37—Measuring or testing processes involving enzymes, nucleic acids or microorganisms; Compositions therefor; Processes of preparing such compositions involving hydrolase involving peptidase or proteinase
-
- G—PHYSICS
- G01—MEASURING; TESTING
- G01N—INVESTIGATING OR ANALYSING MATERIALS BY DETERMINING THEIR CHEMICAL OR PHYSICAL PROPERTIES
- G01N30/00—Investigating or analysing materials by separation into components using adsorption, absorption or similar phenomena or using ion-exchange, e.g. chromatography or field flow fractionation
- G01N30/02—Column chromatography
- G01N30/86—Signal analysis
-
- G—PHYSICS
- G01—MEASURING; TESTING
- G01N—INVESTIGATING OR ANALYSING MATERIALS BY DETERMINING THEIR CHEMICAL OR PHYSICAL PROPERTIES
- G01N33/00—Investigating or analysing materials by specific methods not covered by groups G01N1/00 - G01N31/00
- G01N33/48—Biological material, e.g. blood, urine; Haemocytometers
- G01N33/50—Chemical analysis of biological material, e.g. blood, urine; Testing involving biospecific ligand binding methods; Immunological testing
- G01N33/68—Chemical analysis of biological material, e.g. blood, urine; Testing involving biospecific ligand binding methods; Immunological testing involving proteins, peptides or amino acids
-
- G—PHYSICS
- G01—MEASURING; TESTING
- G01N—INVESTIGATING OR ANALYSING MATERIALS BY DETERMINING THEIR CHEMICAL OR PHYSICAL PROPERTIES
- G01N33/00—Investigating or analysing materials by specific methods not covered by groups G01N1/00 - G01N31/00
- G01N33/48—Biological material, e.g. blood, urine; Haemocytometers
- G01N33/50—Chemical analysis of biological material, e.g. blood, urine; Testing involving biospecific ligand binding methods; Immunological testing
- G01N33/68—Chemical analysis of biological material, e.g. blood, urine; Testing involving biospecific ligand binding methods; Immunological testing involving proteins, peptides or amino acids
- G01N33/6803—General methods of protein analysis not limited to specific proteins or families of proteins
- G01N33/6848—Methods of protein analysis involving mass spectrometry
-
- G—PHYSICS
- G06—COMPUTING OR CALCULATING; COUNTING
- G06F—ELECTRIC DIGITAL DATA PROCESSING
- G06F17/00—Digital computing or data processing equipment or methods, specially adapted for specific functions
- G06F17/10—Complex mathematical operations
-
- H—ELECTRICITY
- H01—ELECTRIC ELEMENTS
- H01J—ELECTRIC DISCHARGE TUBES OR DISCHARGE LAMPS
- H01J49/00—Particle spectrometers or separator tubes
- H01J49/0027—Methods for using particle spectrometers
-
- H—ELECTRICITY
- H01—ELECTRIC ELEMENTS
- H01J—ELECTRIC DISCHARGE TUBES OR DISCHARGE LAMPS
- H01J49/00—Particle spectrometers or separator tubes
- H01J49/004—Combinations of spectrometers, tandem spectrometers, e.g. MS/MS, MSn
-
- G—PHYSICS
- G01—MEASURING; TESTING
- G01N—INVESTIGATING OR ANALYSING MATERIALS BY DETERMINING THEIR CHEMICAL OR PHYSICAL PROPERTIES
- G01N30/00—Investigating or analysing materials by separation into components using adsorption, absorption or similar phenomena or using ion-exchange, e.g. chromatography or field flow fractionation
- G01N30/02—Column chromatography
- G01N30/88—Integrated analysis systems specially adapted therefor, not covered by a single one of the groups G01N30/04 - G01N30/86
- G01N2030/8809—Integrated analysis systems specially adapted therefor, not covered by a single one of the groups G01N30/04 - G01N30/86 analysis specially adapted for the sample
- G01N2030/8813—Integrated analysis systems specially adapted therefor, not covered by a single one of the groups G01N30/04 - G01N30/86 analysis specially adapted for the sample biological materials
-
- G—PHYSICS
- G01—MEASURING; TESTING
- G01N—INVESTIGATING OR ANALYSING MATERIALS BY DETERMINING THEIR CHEMICAL OR PHYSICAL PROPERTIES
- G01N30/00—Investigating or analysing materials by separation into components using adsorption, absorption or similar phenomena or using ion-exchange, e.g. chromatography or field flow fractionation
- G01N30/02—Column chromatography
- G01N30/88—Integrated analysis systems specially adapted therefor, not covered by a single one of the groups G01N30/04 - G01N30/86
- G01N2030/8809—Integrated analysis systems specially adapted therefor, not covered by a single one of the groups G01N30/04 - G01N30/86 analysis specially adapted for the sample
- G01N2030/8813—Integrated analysis systems specially adapted therefor, not covered by a single one of the groups G01N30/04 - G01N30/86 analysis specially adapted for the sample biological materials
- G01N2030/8831—Integrated analysis systems specially adapted therefor, not covered by a single one of the groups G01N30/04 - G01N30/86 analysis specially adapted for the sample biological materials involving peptides or proteins
-
- G—PHYSICS
- G01—MEASURING; TESTING
- G01N—INVESTIGATING OR ANALYSING MATERIALS BY DETERMINING THEIR CHEMICAL OR PHYSICAL PROPERTIES
- G01N2400/00—Assays, e.g. immunoassays or enzyme assays, involving carbohydrates
-
- G—PHYSICS
- G01—MEASURING; TESTING
- G01N—INVESTIGATING OR ANALYSING MATERIALS BY DETERMINING THEIR CHEMICAL OR PHYSICAL PROPERTIES
- G01N2440/00—Post-translational modifications [PTMs] in chemical analysis of biological material
- G01N2440/38—Post-translational modifications [PTMs] in chemical analysis of biological material addition of carbohydrates, e.g. glycosylation, glycation
-
- G—PHYSICS
- G01—MEASURING; TESTING
- G01N—INVESTIGATING OR ANALYSING MATERIALS BY DETERMINING THEIR CHEMICAL OR PHYSICAL PROPERTIES
- G01N2560/00—Chemical aspects of mass spectrometric analysis of biological material
-
- G—PHYSICS
- G01—MEASURING; TESTING
- G01N—INVESTIGATING OR ANALYSING MATERIALS BY DETERMINING THEIR CHEMICAL OR PHYSICAL PROPERTIES
- G01N2570/00—Omics, e.g. proteomics, glycomics or lipidomics; Methods of analysis focusing on the entire complement of classes of biological molecules or subsets thereof, i.e. focusing on proteomes, glycomes or lipidomes
-
- H—ELECTRICITY
- H01—ELECTRIC ELEMENTS
- H01J—ELECTRIC DISCHARGE TUBES OR DISCHARGE LAMPS
- H01J49/00—Particle spectrometers or separator tubes
- H01J49/0027—Methods for using particle spectrometers
- H01J49/0036—Step by step routines describing the handling of the data generated during a measurement
Definitions
- the present invention relates to a novel bioinformatics platform for identification and quantification of N-linked glycopeptide based on mass spectrometry.
- One way is the identification and quantification of glycan by using chemical cleavage induced by an enzyme or a compound, and the other way is the identification and quantification of glycopeptide.
- the method for analyzing released glycan has a problem of not knowing glycosylation site-specific information.Should gylcopeptide can be identified and quantified as it is, not only tumor identificaiton and progression can be checked but also huge information on glycosylation site and N-linked sugar chain size and the numbers of growing side chain in addition to glycoprotein itself can be obtained.
- the method for analyzing glycosylation of glycoprotein includes the step of concentration of glycoprotein at protein level.
- a standard glycoprotein sample was used to execute and complete this invention.
- peptides and glycopeptides were obtained by hydrolyzing the said standard glycoprotein sample with trypsin. Then, those peptides were analyzed with high resolution mass spectrometer. The results of tandem mass spectrum (MS/MS) and mass spectrum (MS) were compared with glycopeptide database to identify and quantify the glycopeptides.
- GlycoSpectrumScan NandanDeshpande., et., al; GlycoSpectrumScan: Fishing Glycopeptides from MS Spectra of Protease Digests of Human Colostrum slgA. Journal of proteome research 2010, 9, 1063-1075 ), GlycoPep Grader ( Carrie L. Woodin. et., al; GlycoPep Grader: A Web-Based Utility for Assigning the Composition of N-Linked Glycopeptides. Analytical Chemistry, 2012 ), etc.
- glycopeptides of 281 glycoproteins ( Terry Farrah., et., al.; A High-Confidence Human Plasma Proteome Reference Set with Estimated Concentrations in PeptideAtlas. Molecular Cell Proteomics, 2011 ) existing at high concentration in human serum were stored, followed by modeling of theoretical isotopic distribution of such glycopeptides. The obtained results proceeded to database.
- isotopic distribution of glycopeptide was obtained by using MS/MS and MS as well, which was compared with glycopeptide database to identify glycopeptide accurately and to quantify such glycopeptide by calculating area in ion chromatograms.
- the present invention provides a novel bioinformatics platform for the identification and quantification of N-linked glycopeptide from glycoprotein, which comprises the following steps:
- the present invention provides a more efficient and accurate method for quantification of glycopeptide having specific sugar chain in a variety of samples, and hence this method can be effectively used for the techniques for prediction and diagnosis of cancer or disease by screening disease marker from various samples. This method is also useful for those who want to analyze glycopeptide and glyco-structure of glycoprotein biosimiliar therapeutics with high resolution mass spectrometer.
- the present invention provides a novel bioinformatics platform for the identification and quantification of N-linked glycopeptide from glycoprotein, which comprises the following steps:
- the present invention also provides a bioinformatics platform for more accurate and efficient identification and quantifiation of glycopeptide via comparison of isotopic distributions.
- the present invention provides a method for accurate identification of glycopeptide by using isotopic distribution after obtaining glycopeptidespectrum by using M-score and by confirming and evaluating the glycopeptide again by using Y-, E-, or Y'-score.
- glycopeptide is identified and quantified by the method comprising the following steps, but not always limited thereto:
- glycopeptide is preferably identified and quantified by the method comprising the following steps, but not always limited thereto:
- glycopeptide is preferably identified and quantified by the method comprising the following steps, but not always limited thereto.
- glycopeptide is preferably identified and quantified by the method comprising the following steps, but not always limited thereto:
- glycopeptide is preferably identified and quantified by the method comprising the following steps, but not always limited thereto:
- glycopeptide is preferably identified and quantified by the method comprising the following steps, but not always limited thereto:
- high resolution mass spectrometer is used in order to analyze those glycopeptidesqualitatively and quantitatively that are more complicated and have wide variety but exist at lower concentration than general peptides.
- M-score, S-score, E-score, Y-score, and y-score are used for the identificaion and quantification of glycopeptide.
- M-score is more efficient in analyzing not only general peptide spectrum but also glycopeptide spectrum.
- the said M-score can be calculated by the following mathematical formula 1.
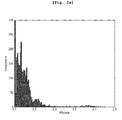
- Figure 2a illustrates the M-score distribution map of HCD spectra of the glycoprotein standard sample (RNaseB).
- RNaseB glycoprotein standard sample
- general peptides are presented in blue color and glycopeptides are presented in green color via manual evaluation.
- the correlation of sensitivity and specificity between general peptides and glycopeptides is presented by ROC(Receiver Operating Characteristic) curve , which is AUC(Area Under Curve) in Figure 2b whose value is 0.98.
- step 5 using S-score is advantageous in the identification of glycopeptide which is characterized by the screening and comparison of the theoretical isotopic distribution obtained from the database with the isotopic distribution obtained by experiments.
- the said S-score can be calculated by the following mathematical formula 2.
- the database is preferably established from glycoproteins by using theoretical isotopic distribution of glycopeptides, but not always limited thereto.
- step 5 of the above method similarity of the mass distribution of isotopes is preferably measured by using Euclidean distance and similarity of the strength distribution is preferably measured by using Pearsoncorrelation analysis in order to produce S-score, but not always limited thereto.
- Y-scoring is the process of confirming and evaluating the theoretical fragmentation of glycopeptide in tandem spectrum (CID and HCD).
- tandem spectrum is HCD spectrum
- Y'-score is preferably calculated by the following mathematical formula 4, but not always limited thereto.
- Y ⁇ - score Y - score + y - score
- y-score is calculated based on the theoretical distributions of b and y ions of peptides.
- Y'-score is the sum of Y-score and y-score.
- tandem spectrum is ETD spectrum
- E-score is preferably calculated by the following mathematical formula 5, but not always limited thereto.
- step 6 of the above method family N-glycopeptide is additionally predicted based on the glycopeptide accurately identified by using tandem spectrum (MS/MS).
- the identification and quantification of glycopeptide is preferably performed without tandem sepctrum(MS/MS) but using S-score and MS accuracy in MS1, but not always limited thereto.
- step 7 quantitative analysis is performed with the glycopeptides identified accurately by using the standard glycoprotein (RNaseB).
- the said quantitative analysis is performed by calculating area in ion chromatograms of each glycopeptide.Each data point for the calculation of area is the sum of three stongest isotope peaks. In the case that the number of data point is at least 7, gaussian distribution is applied and the area of the distribution is calculated and presented as quantitative value.
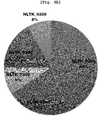
- NLTK_5200(5Hex 2HexNac) was 40%
- NLTK_6200(6Hex 2HexNac) was 26%
- NLTK_8200(8Hex 2HexNac) was 16%
- NLTK_7200(7Hex 2HexNac) was 11%
- NLTK_9200(9Hex 2HexNac) was 7%.
- the above quantitative distribution was consistent with that in a reference ( Kathryn R. Rebecchi., et., al; Label-Free Quantitation: A New Glycoproteomics Approach.
- the method of the present invention facilitates accurate identification and quantification of glycopeptides from the standard glycoprotein sample.
- the results of the qualitative analysis and quantitative analysis with glycopeptides performed in examples 1 and 2 are presented as correlation maps as shown in Figure 7a and Figure 7b .
- the results can be easily compared by comparing those maps.
- This method can be applied in many different attempts to analyze glycoprotein, and it is particularly expected to be very useful in the field of biosimilar.
- the standard glycoprotein sample was analyzed with mass spectrometerOrbitrap, but not always limited thereto.
- database was established with 281 glycoproteins found in human serum, but not always limited thereto.
- glycosylations of only 350 sugars were considered, but not always limited thereto.
- the step of analyzing the correlation among glycopeptides and mapping the similarity among the samples for comparison is additionally added after the identification and quantification in step 8, but not always limited thereto.
- the enzyme used for hydrolysis is selected from the group consisting of trypsin, Arg-C, Asp-N, Glu-C, Lys-C, and chymotrypsin, but not always limited thereto.
- the mass spectrometer used herein is selected from the group consisting of LTQ-FT, Orbitrap, Triple-Tof, Q-Tof, and QExactive, but not always limited thereto.
- the identification and quantification is performed by using the high resolution mass spectrometer with mass resolution of at least 10,000 and mass accuracy of up to 50 ppm, but not always limited thereto.
- glycopeptide for the quantification is selected by using S-score in MS1 spectra, but not always limited thereto.
- the strength of the glycopeptide selected from MS1 spectra for the quantification is presented as the sum of the strength of three strongest peaks theoretically expected, but not always limited thereto.
- glycoprotein herein is preferably extracted from serum, plasma, blood, urine, cerebrospinal fluid, amniotic fluid, synovial fluid, or lavage fluid, but not always limited thereto.
- the polypeptides prepared by the above sample preparation process proceeded to high resolution mass spectrometer Orbitrap (Thermo Finnigan), followed by LC/ESI-MS/MS. To examine reproducibility of each sample, the analysis was repeated three times.
- the mass spectrometer RAW file was converted to ms1 (TXT) and ms2 (MGF) files by using the freeware program RawExtractor v1.9(The Scripps Research Institute, La Jolla, CA) and MM File Conversion Tools v3.9(http://www.massmatrix.net/mm-cgi/downloads.py). Identification and quantification of glycopeptides of RNase B was performed based on each mass spectrometry result by using the novel bioinformatics platform for the identification and quantification of N-linked glycopeptide of the present invention.
- the standard glycoprotein sample AGP (Alpha1-Acid Glycoprotein) was purchased from Sigma-Aldrich. 6 high concentrated proteins were eliminated from plasma. The sample mix was prepared by spiking AGP in plasma as shown in Table 4. [Table 4] Sample No. 1 2 3 4 5 AGP 0.1 ⁇ g 0.25 ⁇ g 0.5 ⁇ g 1.0 ⁇ g 2.0 ⁇ g Depleted plasma 1.0 ⁇ g 1.0 ⁇ g 1.0 ⁇ g 1.0 ⁇ g 1.0 ⁇ g 1.0 ⁇ g
- the polypeptides prepared by the above sample preparation process proceeded to high resolution mass spectrometer Orbitrap (Thermo Finnigan), followed by LC/ESI-MS/MS.To examine reproducibility of each sample, the analysis was repeated three times.
- the mass spectrometer RAW file was converted to ms1 (TXT) and ms2 (MGF) files by using the freeware program RawExtractor v1.9 (The Scripps Research Institute, La Jolla, CA) and MM File Conversion Tools v3.9 (http://www.massmatrix.net/mm-cgi/downloads.py).
- Identification and quantification of glycopeptides of AGP was performed based on each mass spectrometry result by using the novel bioinformatics platform for the identification and quantification of N-linked glycopeptide of the present invention.
- the present invention can be effectively used for the development and examination of a novel biomarker for cancer diagnosis, and further can be effectively applied to biosimilar technique facilitating the analysis of glycopeptide and glucose structure of glycoprotein biotherapeutics.
Landscapes
- Life Sciences & Earth Sciences (AREA)
- Health & Medical Sciences (AREA)
- Engineering & Computer Science (AREA)
- Chemical & Material Sciences (AREA)
- Physics & Mathematics (AREA)
- Molecular Biology (AREA)
- Immunology (AREA)
- Analytical Chemistry (AREA)
- General Health & Medical Sciences (AREA)
- Biochemistry (AREA)
- Bioinformatics & Cheminformatics (AREA)
- General Physics & Mathematics (AREA)
- Proteomics, Peptides & Aminoacids (AREA)
- Biotechnology (AREA)
- Organic Chemistry (AREA)
- Biophysics (AREA)
- Biomedical Technology (AREA)
- Hematology (AREA)
- Bioinformatics & Computational Biology (AREA)
- Urology & Nephrology (AREA)
- Pathology (AREA)
- Spectroscopy & Molecular Physics (AREA)
- Microbiology (AREA)
- Wood Science & Technology (AREA)
- Zoology (AREA)
- Theoretical Computer Science (AREA)
- General Engineering & Computer Science (AREA)
- Cell Biology (AREA)
- Food Science & Technology (AREA)
- Medicinal Chemistry (AREA)
- Genetics & Genomics (AREA)
- Medical Informatics (AREA)
- Data Mining & Analysis (AREA)
- Evolutionary Biology (AREA)
- Mathematical Physics (AREA)
- Crystallography & Structural Chemistry (AREA)
- Computational Mathematics (AREA)
- Software Systems (AREA)
- Databases & Information Systems (AREA)
- Pure & Applied Mathematics (AREA)
Abstract
Description
- The present invention relates to a novel bioinformatics platform for identification and quantification of N-linked glycopeptide based on mass spectrometry.
- Human blood is a mixture of various proteins, among which at least 50% are glycoproteins. However, it is often not possible to cheracterize all glycopeptides in a sample because of the high complexity and diversity of glycoprotein samples, and the relative lower mass spectrometry intensities of glycopeptides in comparision to the non-glycopeptides. Ever since high resolution mass spectrometer was introduced, the analysis of glycan and glycoprotein has been advancing fast.Nevertheless, bioinformatics techniques necessary for the identification and quantification of glycoproteins are not yet up to date.It is known that many therapeutic proteins are glycosylated in a variety of forms and in very complicated ways.There are two main ways of techniques for the identification and quantification of glycosylation of such glycoproteins. One way is the identification and quantification of glycan by using chemical cleavage induced by an enzyme or a compound, and the other way is the identification and quantification of glycopeptide. However, the method for analyzing released glycan has a problem of not knowing glycosylation site-specific information.Should gylcopeptide can be identified and quantified as it is, not only tumor identificaiton and progression can be checked but also huge information on glycosylation site and N-linked sugar chain size and the numbers of growing side chain in addition to glycoprotein itself can be obtained.
- In general, the method for analyzing glycosylation of glycoprotein includes the step of concentration of glycoprotein at protein level. But in this invention, a standard glycoprotein sample was used to execute and complete this invention. Particularly, peptides and glycopeptides were obtained by hydrolyzing the said standard glycoprotein sample with trypsin. Then, those peptides were analyzed with high resolution mass spectrometer. The results of tandem mass spectrum (MS/MS) and mass spectrum (MS) were compared with glycopeptide database to identify and quantify the glycopeptides.
- The recent softwares for the screening of glycopeptide using MS/MS or MS are exemplified by Peptoonist (David Goldberg., et.. al; Automated N-Glycopeptide Identification Using a Combination of Single- and Tandem-MS. Journal of ), SimGlycan (http://glycotools.qa-bio.com/SimGlycan), GlycoMiner (Oliver Ozohanics., et., al; GlycoMiner: a new software tool to elucidate glycopeptide composition. Rapid Communications in Mass Spectrometry 2008, 22, 3245-3254), GlycoSpectrumScan (NandanDeshpande., et., al; GlycoSpectrumScan: Fishing Glycopeptides from MS Spectra of Protease Digests of Human Colostrum slgA. Journal of ), GlycoPep Grader (Carrie L. Woodin. et., al; GlycoPep Grader: A Web-Based Utility for Assigning the Composition of N-Linked Glycopeptides. Analytical Chemistry, 2012), etc.
- Since the above software programs were designed to identify glycopeptide by using tandem mass spectrum alone, there is a doubt in accurateprofiling of glycopeptide and also inconsistency in the quantitative analysis results is another problem. It has been an issue for them not to support various high resolution mass spectrometers.
- To overcome the above problems, the present inventors studied and completed a novel method for more efficient identification and quantification of comparatively low abundant glycopeptides, compared with general peptides, using mass spectrum. First of all, glycopeptides of 281 glycoproteins (Terry Farrah., et., al.; A High-Confidence Human Plasma Proteome Reference Set with Estimated Concentrations in PeptideAtlas. Molecular Cell Proteomics, 2011) existing at high concentration in human serum were stored, followed by modeling of theoretical isotopic distribution of such glycopeptides.The obtained results proceeded to database. In this invention, isotopic distribution of glycopeptide was obtained by using MS/MS and MS as well, which was compared with glycopeptide database to identify glycopeptide accurately and to quantify such glycopeptide by calculating area in ion chromatograms.
- It is an object of the present invention to provide a bioinformatics platform for more efficient and accurate identification and quantifcation of comparatively low abundant glycopeptides, compared with general peptides, using mass spectrum results.
- To achieve the above object, the present invention provides a novel bioinformatics platform for the identification and quantification of N-linked glycopeptide from glycoprotein, which comprises the following steps:
- obtaining mass spectrum by analzying polypeptides prepared by hydrolyzing glycoproteins with protease by usinghigh resolution mass spectrometer (step 1);
- converting the mass spectrum obtained in
step 1 into MS1 (Mass spectrum 1) and tandem spectrum (MS/MS) (step 2); - calculating M-score at each tandem spectrum selected from the group consisting of converted tandem spectrums showing Oxonium ion peak molecular weights of 129.06, 138.06, 145.05, 147.07, 163.06, 168.07, 186.08, 204.08, 274.09, 292.10, 350.15, 366.14, 454.16, 528.19, and 657.24 (step 3);
- selecting glycopeptide spectrum using the M-score obtained in step 3 (step 4);
- obtaining isotopic distribution in MS1 of the glycopeptide spectrum selected in
step 4, which is compared with the database to calculate S-score, and then identifying glycopeptide candidates by using the calculated S-core (step 5); - evaluating exact glycopeptide from the glycopeptide candidates identified in
step 5 by using E-score, Y-score, and Y'-score in tandem spectrum (step 6); - performing quantitative analysis with the glycopeptides evaluated in step 6 (step 7); and
- performing additional identification and quantification of family N-linkedglycopeptide via correlation analysis with those glycopeptides quantified in step 6 (step 8).
- As explained hereinbefore,the present invention provides a more efficient and accurate method for quantification of glycopeptide having specific sugar chain in a variety of samples, and hence this method can be effectively used for the techniques for prediction and diagnosis of cancer or disease by screening disease marker from various samples. This method is also useful for those who want to analyze glycopeptide and glyco-structure of glycoprotein biosimiliar therapeutics with high resolution mass spectrometer.
- The application of the preferred embodiments of the present invention is best understood with reference to the accompanying drawings, wherein:
-
Figure 1 is a flow chart illustrating the novel bioinformatics platform for the identification and quantification of N-linked glycopeptide from samples. -
Figure 2a is a diagram illustrating the M-score distribution of general peptides and glycopeptides according tostep 2 of the bioinformatics platform for the identification and quantification of N-linked glycopeptide of an example of the present invention performed with the standard glycoprotein. -
Figure 2b is a diagram illustrating the correlation between sensitivity and specificity of general peptides and glycopeptides ofstrep 2 of the bioinformatics platform for the identification and quantification of N-linked glycopeptide of an example of the present invention performed with the standard glycoprotein. -
Figure 3 is a diagram illustrating the correlation between sensitivity and specificity for the optimization of S-score obtained via comparison with the database instep 5 of the bioinformatics platform for the identification and quantification of N-linked glycopeptide of an example of the present invention performed with the standard glycoprotein. -
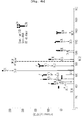
Figure 4a is a diagram illustrating the representative HCD spectrum of NLTK_5200, among the N-linked glycopeptides identified in an example of the present invention performed with the standard glycoprotein. -
Figure 4b is a diagram illustrating the representative CID spectrum of NLTK_5200, among the N-linked glycopeptides identified in an example of the present invention performed with the standard glycoprotein. -
Figure 5a is a diagram illustrating the representative HCD spectrum of SRNLTK_5200, among the N-linked glycopeptides identified in an example of the present invention performed with the standard glycoprotein. -
Figure 5b is a diagram illustrating the representative ETD spectrum of SRNLTK_5200, among the N-linked glycopeptides identified in an example of the present invention performed with the standard glycoprotein. -
Figure 6a is a diagram illustrating the pie graph presenting the relative amount of the glycopeptide quantified instep 7 of the bioinformatics platform for identification and quantification of N-linked glycopeptide of Example 1 performed with the standard glycoprotein. -
Figure 6b is a diagram illustrating the pie graph presenting the relative amount of the glycopeptide quantified instep 7 of the bioinformatics platform for identification and quantification of N-linked glycopeptide of Example 2 performed with the standard glycoprotein. -
Figure 7a is a diagram illustrating the corelation map obtained by correlation analysis of glycopeptide instep 8 of the bioinformatics platform for the identification and quantification of N-linked glycopeptide of Example 1 performed with the standard glycoprotein.The relative amount of glycopeptide is presented in red scale in node and the rim color is based on spectrum count. As shown in Table 1, when the number of tandem mass spectra count is 0, the color shows green, and when the number of tandem mass spectra count is 1, the color shows gray. Likewise, when the number is 2 or more, the color shows black. -
Figure 7b is a diagram illustrating the correlation map obtained by correlation analysis of glycopeptide instep 8 of the bioinformatics platform for the identification and quantification of N-linked glycopeptide of Example 2 performed with the standard glycoprotein.The relative amount of glycopeptide is presented in red scale in node and the rim color is based on spectrum count. As shown in Table 2, when the number of tandem mass spectra count is 0, the color shows green, and when the number of tandem mass spectra count is 1, the color shows gray. Likewise, when the number is 2 or more, the color shows black. -
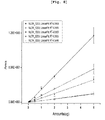
Figure 8 is a diagram illustrating the quantification of glycopeptide over the concentration in RNase B (Ribonuclease B) confirmed in the mixed sample of Example 3. -
Figure 9 is a diagram illustrating the quantification of glycopeptide over the concentration in AGP (Alpha1-Acid Glycoprotein) spiked in plasma as shown in Example 4. - To describe this invention in more detail, the terms used in this description are defined as follows:
- "Protease" indicates the enzyme that cuts the amino acid bond of glycoprotein containing glucose to give a peptide mixture.
- "Tandem mass spectrometry" is the method for analyzing mass of spectrum(MS/MS) of selected ions of interest ones or of high abundant ions from total mass spectrum(MS).
- "Isotopes" indicate chemical elements having the same atomic number but different atomic weights.
- "Isotope Grouping" indicates the grouping of those isotopes identified from the peak list obtained from experiments.
- "N-glycopeptide Isotopic Modeling" indicates the theoretical isotopic distribution of glycopeptides established from the database.
- "S-score (Similarity Score)" indicates the numerical value representing similarity between the isotope peak distribution obtained from experiments and the isotope peak distribution theoretically presumed from the database.
- "Delta" indicates the absolute value representing the difference between the theoretical mass and the real mass confirmed from experiments.
- Hereinafter, the present invention is described in detail.
- The present invention provides a novel bioinformatics platform for the identification and quantification of N-linked glycopeptide from glycoprotein, which comprises the following steps:
- obtaining mass spectrum by analzying polypeptides prepared by hydrolyzing glycoproteins with protease by using high resolution mass spectrometer (step 1);
- converting the mass spectrum obtained in
step 1 into MS1 (Mass spectrum 1) and tandem spectrum (MS/MS) (step 2); - calculating M-score at each tandem spectrum selected from the group consisting of converted tandem spectrums showing Oxonium ion peak molecular weights of 129.06, 138.06, 145.05, 147.07, 163.06, 168.07, 186.08, 204.08, 274.09, 292.10, 350.15, 366.14, 454.16, 528.19, and 657.24 (step 3);
- selecting glycopeptide spectrum using the M-score obtained in step 3 (step 4);
- obtaining isotopic distribution in MS1 of the glycopeptide spectrum selected in
step 4, which is compared with the database to calculate S-score, and then identifying glycopeptide candidates by using the calculated S-core (step 5); - evaluating exact glycopeptide from the glycopeptide candidates identified in
step 5 by using E-score, Y-score, and Y'-score in tandem spectrum (step 6); - performing quantitative analysis with the glycopeptides evaluated in step 6 (step 7); and
- performing additional identification and qantification of family N-glycopeptide via correlation analysis with those glycopeptides quantified in step 6 (step 8).
- The present invention also provides a bioinformatics platform for more accurate and efficient identification and quantifiation of glycopeptide via comparison of isotopic distributions. Particularly the present invention provides a method for accurate identification of glycopeptide by using isotopic distribution after obtaining glycopeptidespectrum by using M-score and by confirming and evaluating the glycopeptide again by using Y-, E-, or Y'-score.
- Hereinafter, the Examples of the present invention are described in more detail step by step using
Figure 1 as a reference. - In a preferred embodiment of the present invention, glycopeptide is identified and quantified by the method comprising the following steps, but not always limited thereto:
- 1) obtaining mass spectrum of polypeptide prepared by hydrolyzing glycoprotein with trypsin by analyzing with high resolution mass spectrometer Orbitrap;
- 2) converting the mass spectrometer RAW file obtained in
step 1 into ms1(TXT) file format by using RawExtractor v1.9, which is converted further into ms2 (MGF) file format by using MM File Conversion Tools v3.9; - 3) calculating M-score from each HCD (High energy Collision Dissociation) spectrumof the ms2 (MGF) file converted in
step 2; - 4) selecting glycopeptide spectrum that acquires at least 1.5 M-score among those obtained in
step 3; - 5) obtaining isotopic distribution in MS1 of the glycopeptide spectrum selected in
step 4, which is compared with the database, leading to the identification of glycopeptide candidate acquiring at least 98.0 S-score; - 6) evaluating glycopeptide accurately by using Y'-score in HCD spectrum and Y-score in CID (Collision Induced Dissociation) spectrum of those glycopeptide candidates identified in
step 5; - 7) performing quantitative analysis with the glycopeptides identified in
step 6; and - 8) performing additional identification and quantification of family N-glycopeptide via correlation analysis with the glycopeptides identified in
step 6. - In another preferred embodiment of the present invention, glycopeptide is preferably identified and quantified by the method comprising the following steps, but not always limited thereto:
- 1) obtaining mass spectrum of polypeptide prepared by hydrolyzing glycoprotein with trypsin by analyzing with high resolution mass spectrometer Orbitrap;
- 2) converting the mass spectrometer RAW file obtained in
step 1 into ms1(TXT) file format by using RawExtractor v1.9, which is converted further into ms2 (MGF) file format by using MM File Conversion Tools v3.9; - 3) calculating M-score from each HCD (High energy Collision Dissociation) spectrumof the ms2 (MGF) file converted in
step 2; - 4) selecting glycopeptide spectrum that acquires at least 1.5 M-score among those obtained in
step 3; - 5) obtaining isotopic distribution in MS1 of the glycopeptide spectrum selected in
step 4, which is compared with the database, leading to the identification of glycopeptide candidate acquiring at least 98.0 S-score; - 6) evaluating glycopeptide accurately by using Y'-score in HCD spectrum and E-score in ETD (Electron Transfer Dissociation) spectrum of those glycopeptide candidates identified in
step 5; - 7) performing quantitative analysis with the glycopeptides identified in
step 6; and - 8) performing additional identification and quantification of family N-glycopeptide via correlation analysis with the glycopeptides identified in
step 6. - In another preferred embodiment of the present invention, glycopeptide is preferably identified and quantified by the method comprising the following steps, but not always limited thereto.
- In another preferred embodiment of the present invention, glycopeptide is preferably identified and quantified by the method comprising the following steps, but not always limited thereto:
- 1) obtaining mass spectrum of polypeptide prepared by hydrolyzing glycoprotein with trypsin by analyzing with high resolution mass spectrometer Orbitrap;
- 2) converting the mass spectrometer RAW file obtained in
step 1 into ms1(TXT) file format by using RawExtractor v1.9, which is converted further into ms2 (MGF) file format by using MM File Conversion Tools v3.9; - 3) calculating M-score from each HCD (High energy Collision Dissociation) spctrumof the ms2 (MGF) file converted in
step 2; - 4) selecting glycopeptide spectrum that acquires at least 1.5 M-score among those obtained in
step 3; - 5) obtaining isotopic distribution in MS1 of the glycopeptide spectrum selected in
step 4, which is compared with the database, leading to the identification of glycopeptide candidate acquiring at least 98.0 S-score; - 6) evaluating glycopeptide accurately by using Y'-score in HCD tandem spectrum of those glycopeptide candidates identified in
step 5; - 7) performing quantitative analysis with the glycopeptides identified in
step 6; and - 8) performing additional identification and quantification of family N-glycopeptide via correlation analysis with the glycopeptides identified in
step 6. - In another preferred embodiment of the present invention, glycopeptide is preferably identified and quantified by the method comprising the following steps, but not always limited thereto:
- 1) obtaining mass spectrum of polypeptide prepared by hydrolyzing glycoprotein with trypsin by analyzing with high resolution mass spectrometer LTQ-FT;
- 2) converting the mass spectrometer RAW file obtained in
step 1 into ms1(TXT) file format by using RawExtractor v1.9, which is converted further into ms2 (MGF) file format by using MM File Conversion Tools v3.9; - 3) calculating M-score from each CID spctrumof the ms2 (MGF) file converted in
step 2; - 4) selecting glycopeptide spectrum that acquires at least 0.5 M-score among those obtained in
step 3; - 5) obtaining isotopic distribution in MS1 of the glycopeptide spectrum selected in
step 4, which is compared with the database, leading to the identification of glycopeptide candidate acquiring at least 98.0 S-score; - 6) evaluating glycopeptide accurately by using Y-score in CID tandem spectrum of those glycopeptide candidates identified in
step 5; - 7) performing quantitative analysis with the glycopeptides identified in
step 6; and - 8) performing additional identification and quantification of family N-glycopeptide via correlation analysis with the glycopeptides identified in
step 6. - In another preferred embodiment of the present invention, glycopeptide is preferably identified and quantified by the method comprising the following steps, but not always limited thereto:
- 1) obtaining mass spectrum of polypeptide prepared by hydrolyzing glycoprotein with trypsin by analyzing with high resolution mass spectrometer Q-Tof;
- 2) converting the mass spectrometer WIFF file obtained in
step 1 into ms1 (TXT) and ms2 (MGF) file format by using AB Science MS Data Convert v1.3 and ProteoWizard v2.1 (http://proteowizard.sourceforge.net/); - 3) calculating M-score from each CID spctrumof the ms2 (MGF) file converted in
step 2; - 4) selecting glycopeptide spectrum that acquires at least 1.5 M-score among those obtained in
step 3; - 5) obtaining isotopic distribution in MS1 of the glycopeptide spectrum selected in
step 4, which is compared with the database, leading to the identification of glycopeptide candidate acquiring at least 98.0 S-score; - 6) evaluating glycopeptide accurately by using Y-score in CID tandem spectrum of those glycopeptide candidates identified in
step 5; - 7) performing quantitative analysis with the glycopeptides identified in
step 6; and - 8) performing additional identification and quantification of family N-glycopeptide via correlation analysis with the glycopeptides identified in
step 6. - In this invention, high resolution mass spectrometer is used in order to analyze those glycopeptidesqualitatively and quantitatively that are more complicated and have wide variety but exist at lower concentration than general peptides. To analyse the results obtained from mass spectrometry faster and more accurately, M-score, S-score, E-score, Y-score, and y-score are used for the identificaion and quantification of glycopeptide.
- In the above method, using M-score, as shown in
step 3, is more efficient in analyzing not only general peptide spectrum but also glycopeptide spectrum. The said M-score can be calculated by the followingmathematical formula 1.
(N: number of observable oxonium ions;
n: number of observed oxonium ions;
Ii: ith peak intensityin repeatitive analysis; and
C: constant value). -
Figure 2a illustrates the M-score distribution map of HCD spectra of the glycoprotein standard sample (RNaseB). In this distribution map, general peptides are presented in blue color and glycopeptides are presented in green color via manual evaluation. The correlation of sensitivity and specificity between general peptides and glycopeptides is presented by ROC(Receiver Operating Characteristic) curve , which is AUC(Area Under Curve) inFigure 2b whose value is 0.98. - In the above method, as shown in
step 5, using S-score is advantageous in the identification of glycopeptide which is characterized by the screening and comparison of the theoretical isotopic distribution obtained from the database with the isotopic distribution obtained by experiments. The said S-score can be calculated by the followingmathematical formula 2.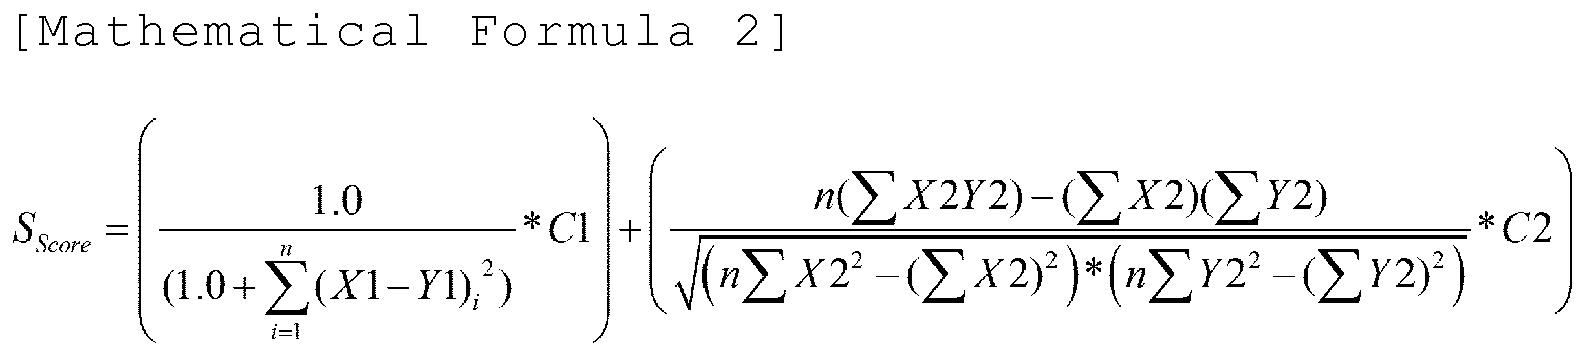
(X1: mass of nth peak among theoretical isotope peaks;
Y1: mass of nth peak among experimentally obtained isotope peaks;
X2: relative intensity of nth peak among theoretical isotope peaks;
Y2: relative intensity of nth peak among experimentally obtained isotope peaks;
C1: constant value; and
C2: constant value). - In
step 4 of the above method, the database is preferably established from glycoproteins by using theoretical isotopic distribution of glycopeptides, but not always limited thereto. - In
step 5 of the above method, similarity of the mass distribution of isotopes is preferably measured by using Euclidean distance and similarity of the strength distribution is preferably measured by using Pearsoncorrelation analysis in order to produce S-score, but not always limited thereto. - In
step 6 of the above method, Y-scoring is the process of confirming and evaluating the theoretical fragmentation of glycopeptide in tandem spectrum (CID and HCD). Herein, the said Y-score can be calculated by the following mathematical formula 3:
(N: the number of observableglycopeptide fragmentation;
n: the number of observedglycopeptide fragmentation; and
Ii: ith intensityin repeatitive analysis). - In
step 6 of the above method, tandem spectrum is HCD spectrum, and Y'-score is preferably calculated by the followingmathematical formula 4, but not always limited thereto.
- In this invention, y-score is calculated based on the theoretical distributions of b and y ions of peptides. Y'-score is the sum of Y-score and y-score.
- In
step 6 of the above method, tandem spectrum is ETD spectrum, and E-score is preferably calculated by the followingmathematical formula 5, but not always limited thereto.
(N: the number of observableglycopeptide fragmentation (c,z ions);
n: the number of observedglycopeptide fragmentation; and
Ii: ith intensityin repeatitive analysis). - In
step 6 of the above method, family N-glycopeptide is additionally predicted based on the glycopeptide accurately identified by using tandem spectrum (MS/MS). The identification and quantification of glycopeptide is preferably performed without tandem sepctrum(MS/MS) but using S-score and MS accuracy in MS1, but not always limited thereto. - In this invention, the present inventors presented the results of the identification and quantification of glycopeptides of the standard glycoprotein sample (RNaseB) by using HCD and CID spectrums obtained by high resolution mass spectrometer Orbitrap in Table 1.
[Table 1] Index Glycopept ide Retention Time m/z charge spctraCount DataPoint Area 1 NLTK_5_2_0_0 48.09 846.358 2 3 13 225582363 2 NLTK_6_2_0_0 47.96 927.384 2 6 22 142788155 3 NLTK_7_2_0_0 47.96 1008.410 2 3 19 59502538 4 NLTK_8_2_0_0 47.71 1089.436 2 16 20 89037692 5 NLTK_9_2_0_0 47.46 1170.463 2 2 11 41747091 6 NLTKDR_4_2_0_0 48.24 900.895 2 0 2 NA 7 NLTKDR_5_2_0_0 48.36 981.921 2 0 4 NA 8 NLTKDR_6_2_0_0 48.09 1062.948 2 1 6 NA - In
step 7, quantitative analysis is performed with the glycopeptides identified accurately by using the standard glycoprotein (RNaseB). The said quantitative analysis is performed by calculating area in ion chromatograms of each glycopeptide.Each data point for the calculation of area is the sum of three stongest isotope peaks. In the case that the number of data point is at least 7, gaussian distribution is applied and the area of the distribution is calculated and presented as quantitative value. Quantitative distribution of the standard glycoprotein sample (RNaseB) is presented as Venn diagram inFigure 6a .As shown inFigure 6a , NLTK_5200(5Hex 2HexNac) was 40%, NLTK_6200(6Hex 2HexNac) was 26%, NLTK_8200(8Hex 2HexNac) was 16%, NLTK_7200(7Hex 2HexNac) was 11%, and NLTK_9200(9Hex 2HexNac) was 7%.The above quantitative distribution was consistent with that in a reference (Kathryn R. Rebecchi., et., al; Label-Free Quantitation: A New Glycoproteomics Approach. J.Am.Soc.Mass.Spectrom, 2009, 20, 1048-1059). Additional identification and quantification of glycopeptides were performed via correlation analysis with the identified glycopeptides without using MS/MS.MS2 spectrum (Spectra Count) zero in Table 1 is the example of the additional identification and quantification of glycopeptides. In example 2, the identification and quantification of glycopeptides of the standard glycoprotein sample (RNase B) was performed by using HCD and ETD spectrum obtained by high resolution mass spectrometer Orbitrap, and the results are shown in Table 2.As shown inFigure 6b , similar quantitative distributions to the above were confirmed (NLTK_6200 (6Hex 2HexNac) was 22%, NLTK_8200 (8Hex 2HexNac) was 17%, and NLTK_7200 (7Hex 2HexNac) was 9%), which are presented in Table 2.[Table 2] In dex Glycopeptide Retention Time m/z charge spctraCount DataPoint Area 1 NLTK_5_2_0_0 47.84 846.358 2 3 10 292355774 2 NLTK_6_2_0_0 47.99 927.384 2 7 14 145015896 3 NLTK_7_2_0_0 47.53 1008.410 2 1 11 63240833 4 NLTK_8_2_0_0 47.16 1089.436 2 10 12 112879581 5 NLTK_9_2_0_0 47.37 1170.463 2 2 9 53643120 6 NLTKDR_4_2_0_0 47.86 900.895 2 0 2 NA 7 NLTKDR_5_2_0_0 48.10 981.921 2 1 4 NA 8 NLTKDR_6_2_0_0 47.84 1062.948 2 1 3 NA 9 NLTKDR_7_2_0_0 47.64 1143.974 2 0 NA - In conclusion, the method of the present invention facilitates accurate identification and quantification of glycopeptides from the standard glycoprotein sample.The results of the qualitative analysis and quantitative analysis with glycopeptides performed in examples 1 and 2 are presented as correlation maps as shown in
Figure 7a andFigure 7b .The results can be easily compared by comparing those maps. This method can be applied in many different attempts to analyze glycoprotein, and it is particularly expected to be very useful in the field of biosimilar. - In the present invention, the standard glycoprotein sample was analyzed with mass spectrometerOrbitrap, but not always limited thereto.
- In the present invention, database was established with 281 glycoproteins found in human serum, but not always limited thereto.
- In the present invention, glycosylations of only 350 sugars were considered, but not always limited thereto.
- In the above method, the step of analyzing the correlation among glycopeptides and mapping the similarity among the samples for comparison is additionally added after the identification and quantification in
step 8, but not always limited thereto. - In the above method, the enzyme used for hydrolysis is selected from the group consisting of trypsin, Arg-C, Asp-N, Glu-C, Lys-C, and chymotrypsin, but not always limited thereto.
- In the above method, the mass spectrometer used herein is selected from the group consisting of LTQ-FT, Orbitrap, Triple-Tof, Q-Tof, and QExactive, but not always limited thereto.
- In the above method, the identification and quantification is performed by using the high resolution mass spectrometer with mass resolution of at least 10,000 and mass accuracy of up to 50 ppm, but not always limited thereto.
- In the above method, glycopeptide for the quantification is selected by using S-score in MS1 spectra, but not always limited thereto.
- In the above method, the strength of the glycopeptide selected from MS1 spectra for the quantification is presented as the sum of the strength of three strongest peaks theoretically expected, but not always limited thereto.
- The glycoprotein herein is preferably extracted from serum, plasma, blood, urine, cerebrospinal fluid, amniotic fluid, synovial fluid, or lavage fluid, but not always limited thereto.
- Practical and presently preferred embodiments of the present invention are illustrative as shown in the following Examples, Experimental Examples and Manufacturing Examples.
- However, it will be appreciated that those skilled in the art, on consideration of this disclosure, may make modifications and improvements within the spirit and scope of the present invention.
- The standard glycoprotein samples, RNase B (Ribonuclease B) and AGP (Alpha1-Acid Glycoprotein), were purchased from Sigma-Aldrich. The said two samples were mixed as shown in Table 3.
[Table 3] Sample No. 1 2 3 4 5 6 7 RNase B 0.0375µg 0.075µg 0.15µg 0.5µg 1.0µg 2.0µg 5.0µg AGP 0.15µg 0.15µg 0.15µg 0.15µg 0.15µg 0.15µg 0.15µg - Each sample was hydrolyzed with trypsin at 37°C for overnight.
- The polypeptides prepared by the above sample preparation process proceeded to high resolution mass spectrometer Orbitrap (Thermo Finnigan), followed by LC/ESI-MS/MS. To examine reproducibility of each sample, the analysis was repeated three times. The mass spectrometer RAW file was converted to ms1 (TXT) and ms2 (MGF) files by using the freeware program RawExtractor v1.9(The Scripps Research Institute, La Jolla, CA) and MM File Conversion Tools v3.9(http://www.massmatrix.net/mm-cgi/downloads.py). Identification and quantification of glycopeptides of RNase B was performed based on each mass spectrometry result by using the novel bioinformatics platform for the identification and quantification of N-linked glycopeptide of the present invention.
- The standard glycoprotein sample AGP (Alpha1-Acid Glycoprotein) was purchased from Sigma-Aldrich. 6 high concentrated proteins were eliminated from plasma. The sample mix was prepared by spiking AGP in plasma as shown in Table 4.
[Table 4] Sample No. 1 2 3 4 5 AGP 0.1µg 0.25µg 0.5µg 1.0µg 2.0µg Depleted plasma 1.0µg 1.0µg 1.0µg 1.0µg 1.0µg - The polypeptides prepared by the above sample preparation process proceeded to high resolution mass spectrometer Orbitrap (Thermo Finnigan), followed by LC/ESI-MS/MS.To examine reproducibility of each sample, the analysis was repeated three times.The mass spectrometer RAW file was converted to ms1 (TXT) and ms2 (MGF) files by using the freeware program RawExtractor v1.9 (The Scripps Research Institute, La Jolla, CA) and MM File Conversion Tools v3.9 (http://www.massmatrix.net/mm-cgi/downloads.py).Identification and quantification of glycopeptides of AGP was performed based on each mass spectrometry result by using the novel bioinformatics platform for the identification and quantification of N-linked glycopeptide of the present invention.
- As explained hereinbefore, the present invention can be effectively used for the development and examination of a novel biomarker for cancer diagnosis, and further can be effectively applied to biosimilar technique facilitating the analysis of glycopeptide and glucose structure of glycoprotein biotherapeutics.
- Those skilled in the art will appreciate that the conceptions and specific embodiments disclosed in the foregoing description may be readily utilized as a basis for modifying or designing other embodiments for carrying out the same purposes of the present invention. Those skilled in the art will also appreciate that such equivalent embodiments do not depart from the spirit and scope of the invention as set forth in the appended Claims.
Claims (15)
- A novel bioinformatics platform for the identification and quantification of N-linked glycopeptide from glycoprotein, which comprises the following steps:obtaining mass spectrum by analzying polypeptides prepared by hydrolyzing glycoproteins with protease by using high resolution mass spectrometer (step 1);converting the mass spectrum obtained in step 1 into MS1 (Mass spectrum 1) and tandem spectrum (MS/MS) (step 2);calculating M-score at each tandem spectrum selected from the group consisting of converted tandem spectrums showing Oxonium ion peak molecular weights of 129.06, 138.06, 145.05, 147.07, 163.06, 168.07, 186.08, 204.08, 274.09, 292.10, 350.15, 366.14, 454.16, 528.19, and 657.24 (step 3);selecting glycopeptide spectrum using the M-score obtained in step 3 (step 4);obtaining isotopic distribution in MS1 of the glycopeptide spectrum selected in step 4, which is compared with the database to calculate S-score, and then identifying glycopeptide candidates by using the calculated S-core (step 5);evaluating exact glycopeptide from the glycopeptide candidates identified in step 5 by using E-score, Y-score, and Y'-score in tandem spectrum (step 6);performing quantitative analysis with the glycopeptides evaluated in step 6 (step 7); andperforming additional identification and qantification of family N-linked glycopeptide via correlation analysis with those glycopeptides quantified in step 6 (step 8).
- The novel bioinformatics platform for the identification and quantification of N-linked glycopeptide from glycoprotein according to claim 1, wherein the tandem spectrum is CID or HCD spectrum and the M-score is calculated by the following mathematical formula 1:

(N: number of observable oxonium ions;
n: number of observed oxonium ions;
Ii: ith peak intensityin repeatitive analysis; and
C: constant value). - The novel bioinformatics platform for the identification and quantification of N-linked glycopeptide from glycoprotein according to claim 1, wherein the calculation for the comparison of similarity of the theoretical isotopic distribution obtained from the database with the isotopic distribution obtained by experiment with MS1 S-score in step 5 is performed by the following mathematical formula 2:

(X1: mass of nth peak among theoretical isotope peaks;
Y1: mass of nth peak among experimentally obtained isotope peaks;
X2: relative intensity of nth peak among theoretical isotope peaks;
Y2: relative intensity of nth peak among experimentally obtained isotope peaks;
C1: constant value; and
C2: constant value). - The novel bioinformatics platform for the identification and quantification of N-linked glycopeptide from glycoprotein according to claim 1, wherein the database is established in step 4 from glycoproteins by using theoretical isotopic distribution of glycopeptides.
- The novel bioinformatics platform for the identification and quantification of N-linked glycopeptide from glycoprotein according to claim 3, wherein the similarity of the mass distribution of isotopes is measured by using Euclidean distance and the similarity of the strength distribution is measured by using Pearson correlation analysis in order to produce S-score in step 5.
- The novel bioinformatics platform for the identification and quantification of N-linked glycopeptide from glycoprotein according to claim 1, wherein the tandem spectrum in step 6 is CID or HCD spectrum and the Y-score is calcualted by the following mathematical formula 3:

(N: the number of observableglycopeptide fragmentation;
n: the number of observedglycopeptide fragmentation; and
Ii: ith intensityin repeatitive analysis). - The novel bioinformatics platform for the identification and quantification of N-linked glycopeptide from glycoprotein according to claim 1, wherein the tandem spectrum in step 6 is HCD spectrum and the Y'-score is calcualted by the following mathematical formula 4:

- The novel bioinformatics platform for the identification and quantification of N-linked glycopeptide from glycoprotein according to claim 1, wherein the tandem spectrum in step 6 is ETD spectrum and the E-score is calcualted by the following mathematical formula 5:

(N: the number of observable glycopeptide fragmentation (c,z ions);
n: the number of observedglycopeptide fragmentation; and
Ii: ith intensityin repeatitive analysis). - The novel bioinformatics platform for the identification and quantification of N-linked glycopeptide from glycoprotein according to claim 1, wherein the glycopeptide is identified and quantified without tandem sepctrum (MS/MS) but using S-score and MS accuracy in MS1 after the family N-glycopeptide is additionally predicted based on the glycopeptide accurately identified by using tandem spectrum (MS/MS) in step 6.
- The novel bioinformatics platform for the identification and quantification of N-linked glycopeptide from glycoprotein according to claim 1, wherein the correlation of all the glycopeptides is presented as a map representing the similarity among the samples for comparison after the identification and quantification in step 8.
- The novel bioinformatics platform for the identification and quantification of N-linked glycopeptide from glycoprotein according to claim 1, wherein the hydrolysis is performed by using the enzyme selected from the group consisting of trypsin, Arg-C, Asp-N, Glu-C, Lys-C, and chymotrypsin.
- The novel bioinformatics platform for the identification and quantification of N-linked glycopeptide from glycoprotein according to claim 1, wherein the mass spectrometer is the one selected from the group consisting of LTQ-FT, Orbitrap, Triple-Tof, Q-Tof, and QExactive.
- The novel bioinformatics platform for the identification and quantification of N-linked glycopeptide from glycoprotein according to claim 1, wherein the identification and quantification is performed by using the high resolution mass spectrometer with mass resolution of at least 10,000 and mass accuracy of up to 50 ppm.
- The novel bioinformatics platform for the identification and quantification of N-linked glycopeptide from glycoprotein according to claim 1, wherein the glycopeptide for the quantification is selected by using S-score in MS1 spectra.
- The novel bioinformatics platform for the identification and quantification of N-linked glycopeptide from glycoprotein according to claim 1, wherein the strength of the glycopeptide selected from MS1 spectra for the quantification is presented as the sum of the strength of three strongest peaks theoretically expected.
Applications Claiming Priority (2)
| Application Number | Priority Date | Filing Date | Title |
|---|---|---|---|
| KR1020120108011A KR101341591B1 (en) | 2012-09-27 | 2012-09-27 | Bioinformatics platform for high-throughput identification and quantification of n-glycopeptide |
| PCT/KR2013/000496 WO2014051220A1 (en) | 2012-09-27 | 2013-01-22 | Novel biological information processing and analysis method for identifying and quantifying n-glycopeptides |
Publications (3)
| Publication Number | Publication Date |
|---|---|
| EP2738554A1 true EP2738554A1 (en) | 2014-06-04 |
| EP2738554A4 EP2738554A4 (en) | 2014-07-30 |
| EP2738554B1 EP2738554B1 (en) | 2015-09-30 |
Family
ID=49988312
Family Applications (1)
| Application Number | Title | Priority Date | Filing Date |
|---|---|---|---|
| EP13814404.3A Active EP2738554B1 (en) | 2012-09-27 | 2013-01-22 | Biological information processing and analysis method for identifying and quantifying n-glycopeptides |
Country Status (6)
| Country | Link |
|---|---|
| US (1) | US9436797B2 (en) |
| EP (1) | EP2738554B1 (en) |
| JP (1) | JP5855264B2 (en) |
| KR (1) | KR101341591B1 (en) |
| CN (1) | CN103890578B (en) |
| WO (1) | WO2014051220A1 (en) |
Families Citing this family (9)
| Publication number | Priority date | Publication date | Assignee | Title |
|---|---|---|---|---|
| KR101341591B1 (en) | 2012-09-27 | 2013-12-16 | 한국기초과학지원연구원 | Bioinformatics platform for high-throughput identification and quantification of n-glycopeptide |
| CN105651853B (en) * | 2016-01-21 | 2018-08-07 | 江南大学 | A kind of characteristic N- connection sugar chains of subcellular structure and its application |
| KR102013913B1 (en) * | 2017-09-26 | 2019-10-21 | 한국기초과학지원연구원 | Bioinformatics platform for high-throughput identification and quantification of o-glycopeptide |
| KR101992395B1 (en) * | 2018-03-13 | 2019-06-24 | 한국기초과학지원연구원 | Mass spectrometry based bioinformatics platform for high-throughput identification of glycation proteins and advanced glycation end-products |
| EP3775928B1 (en) * | 2018-03-29 | 2023-05-24 | DH Technologies Development Pte. Ltd. | Analysis method for glycoproteins |
| CN110702916B (en) * | 2019-04-15 | 2022-06-21 | 四川大学华西医院 | Quantitative analysis method for integrating proteome and glycoprotein |
| CN110243985B (en) * | 2019-06-26 | 2021-12-14 | 南方科技大学 | A kind of mass spectrometry detection method of biomolecules |
| WO2023277230A1 (en) * | 2021-06-28 | 2023-01-05 | 주식회사 셀키 | Electronic device recommending artificial intelligence-based workflow in order to identify glycopeptide, and method for operating same |
| JP2025099611A (en) * | 2023-12-22 | 2025-07-03 | 株式会社日立ハイテク | Isotope distribution ratio evaluation program, isotope distribution ratio evaluation method, isotope distribution ratio evaluation device, and metabolic flux analyzer |
Family Cites Families (8)
| Publication number | Priority date | Publication date | Assignee | Title |
|---|---|---|---|---|
| US20040248317A1 (en) * | 2003-01-03 | 2004-12-09 | Sajani Swamy | Glycopeptide identification and analysis |
| US7332613B2 (en) * | 2003-06-06 | 2008-02-19 | President And Fellows Of Harvard College | Capture and release based isotope tagged peptides and methods for using the same |
| KR100611313B1 (en) | 2004-06-30 | 2006-08-10 | 고려대학교 산학협력단 | N-terminal substitution of polypeptide, amino acid sequencing and quantification method in polypeptide |
| WO2007109292A2 (en) * | 2006-03-21 | 2007-09-27 | Wisconsin Alumni Research Foundation | Ionizable isotopic labeling reagents for relative quantification by mass spectrometry |
| KR101070247B1 (en) * | 2009-01-30 | 2011-10-06 | 건국대학교 산학협력단 | A new biomarker protein and a new detection method in the biological fluid with preeclampsia using proteomics technology |
| WO2010120946A1 (en) * | 2009-04-14 | 2010-10-21 | Institute For Systems Biology | Improvements in mass spectrum-based identification and quantitation of proteins and peptides |
| JP5299060B2 (en) * | 2009-04-23 | 2013-09-25 | 株式会社島津製作所 | Glycopeptide structure analysis method and apparatus |
| KR101341591B1 (en) | 2012-09-27 | 2013-12-16 | 한국기초과학지원연구원 | Bioinformatics platform for high-throughput identification and quantification of n-glycopeptide |
-
2012
- 2012-09-27 KR KR1020120108011A patent/KR101341591B1/en active Active
-
2013
- 2013-01-22 WO PCT/KR2013/000496 patent/WO2014051220A1/en not_active Ceased
- 2013-01-22 EP EP13814404.3A patent/EP2738554B1/en active Active
- 2013-01-22 JP JP2014538734A patent/JP5855264B2/en active Active
- 2013-01-22 CN CN201380002424.5A patent/CN103890578B/en active Active
- 2013-01-22 US US13/884,233 patent/US9436797B2/en active Active
Also Published As
| Publication number | Publication date |
|---|---|
| JP5855264B2 (en) | 2016-02-09 |
| WO2014051220A1 (en) | 2014-04-03 |
| KR101341591B1 (en) | 2013-12-16 |
| CN103890578B (en) | 2016-04-20 |
| US9436797B2 (en) | 2016-09-06 |
| EP2738554A4 (en) | 2014-07-30 |
| CN103890578A (en) | 2014-06-25 |
| JP2014529750A (en) | 2014-11-13 |
| EP2738554B1 (en) | 2015-09-30 |
| US20150186595A1 (en) | 2015-07-02 |
Similar Documents
| Publication | Publication Date | Title |
|---|---|---|
| EP2738554B1 (en) | Biological information processing and analysis method for identifying and quantifying n-glycopeptides | |
| Li et al. | A software suite for the generation and comparison of peptide arrays from sets of data collected by liquid chromatography-mass spectrometry* S | |
| Xie et al. | Liquid chromatography-mass spectrometry-based quantitative proteomics | |
| Baldwin | Protein identification by mass spectrometry: issues to be considered | |
| US11181531B2 (en) | Bioinformatics platform for high-throughput identification and quantification of O-glycopeptide | |
| McDonnell et al. | Imaging mass spectrometry data reduction: automated feature identification and extraction | |
| JP4768189B2 (en) | Methods for non-targeted complex sample analysis | |
| Rebecchi et al. | Label-free quantitation: a new glycoproteomics approach | |
| US11764044B2 (en) | Deconvolution of mass spectrometry data | |
| EP1623351A2 (en) | Computational method and system for mass spectral analysis | |
| Duncan et al. | Proteomics as a tool for clinically relevant biomarker discovery and validation | |
| US7555393B2 (en) | Evaluating the probability that MS/MS spectral data matches candidate sequence data | |
| US20230113788A1 (en) | System based on learning peptide properties for predicting spectral profile of peptide-producing ions in liquid chromatograph-mass spectrometry | |
| Noy et al. | Improved model-based, platform-independent feature extraction for mass spectrometry | |
| CN104820011A (en) | Protein post-translational modification positioning method | |
| KR20100088217A (en) | A new biomarker protein and a new detection method in the biological fluid with preeclampsia using proteomics technology | |
| WO2005057208A1 (en) | Methods of identifying peptides and proteins | |
| US20170370942A1 (en) | Highly multiplexed absolute quantification of molecules on the single cell level | |
| KR101311412B1 (en) | New Bioinformatics Platform for High-Throughput Profiling of N-Glycans | |
| GB2608678A (en) | Processing of spatially resolved, ion-spectrometric measurement signal data to determine molecular content scores in two-dimensional samples | |
| WO2004090552A1 (en) | Screening method for protein variants using mass spectrometry | |
| JP5679257B2 (en) | Measurement data acquisition and evaluation method | |
| US20260057966A1 (en) | Precise de novo sequencing method for top-down proteomics | |
| Li et al. | Informatics for mass spectrometry-based protein characterization | |
| V Nefedov et al. | Bioinformatics tools for mass spectrometry-based high-throughput quantitative proteomics platforms |
Legal Events
| Date | Code | Title | Description |
|---|---|---|---|
| PUAI | Public reference made under article 153(3) epc to a published international application that has entered the european phase |
Free format text: ORIGINAL CODE: 0009012 |
|
| 17P | Request for examination filed |
Effective date: 20140113 |
|
| AK | Designated contracting states |
Kind code of ref document: A1 Designated state(s): AL AT BE BG CH CY CZ DE DK EE ES FI FR GB GR HR HU IE IS IT LI LT LU LV MC MK MT NL NO PL PT RO RS SE SI SK SM TR |
|
| A4 | Supplementary search report drawn up and despatched |
Effective date: 20140627 |
|
| RIC1 | Information provided on ipc code assigned before grant |
Ipc: G06F 19/00 20110101ALI20140623BHEP Ipc: G01N 33/68 20060101ALI20140623BHEP Ipc: G06F 17/10 20060101ALI20140623BHEP Ipc: C12Q 1/34 20060101ALI20140623BHEP Ipc: G01N 30/72 20060101AFI20140623BHEP |
|
| GRAP | Despatch of communication of intention to grant a patent |
Free format text: ORIGINAL CODE: EPIDOSNIGR1 |
|
| DAX | Request for extension of the european patent (deleted) | ||
| INTG | Intention to grant announced |
Effective date: 20150430 |
|
| GRAS | Grant fee paid |
Free format text: ORIGINAL CODE: EPIDOSNIGR3 |
|
| GRAA | (expected) grant |
Free format text: ORIGINAL CODE: 0009210 |
|
| AK | Designated contracting states |
Kind code of ref document: B1 Designated state(s): AL AT BE BG CH CY CZ DE DK EE ES FI FR GB GR HR HU IE IS IT LI LT LU LV MC MK MT NL NO PL PT RO RS SE SI SK SM TR |
|
| REG | Reference to a national code |
Ref country code: CH Ref legal event code: EP Ref country code: GB Ref legal event code: FG4D |
|
| REG | Reference to a national code |
Ref country code: AT Ref legal event code: REF Ref document number: 752715 Country of ref document: AT Kind code of ref document: T Effective date: 20151015 Ref country code: CH Ref legal event code: NV Representative=s name: OFFICE ERNEST T. FREYLINGER S.A., CH |
|
| REG | Reference to a national code |
Ref country code: IE Ref legal event code: FG4D |
|
| REG | Reference to a national code |
Ref country code: DE Ref legal event code: R096 Ref document number: 602013003319 Country of ref document: DE |
|
| PG25 | Lapsed in a contracting state [announced via postgrant information from national office to epo] |
Ref country code: NO Free format text: LAPSE BECAUSE OF FAILURE TO SUBMIT A TRANSLATION OF THE DESCRIPTION OR TO PAY THE FEE WITHIN THE PRESCRIBED TIME-LIMIT Effective date: 20151230 Ref country code: LT Free format text: LAPSE BECAUSE OF FAILURE TO SUBMIT A TRANSLATION OF THE DESCRIPTION OR TO PAY THE FEE WITHIN THE PRESCRIBED TIME-LIMIT Effective date: 20150930 Ref country code: LV Free format text: LAPSE BECAUSE OF FAILURE TO SUBMIT A TRANSLATION OF THE DESCRIPTION OR TO PAY THE FEE WITHIN THE PRESCRIBED TIME-LIMIT Effective date: 20150930 Ref country code: FI Free format text: LAPSE BECAUSE OF FAILURE TO SUBMIT A TRANSLATION OF THE DESCRIPTION OR TO PAY THE FEE WITHIN THE PRESCRIBED TIME-LIMIT Effective date: 20150930 Ref country code: GR Free format text: LAPSE BECAUSE OF FAILURE TO SUBMIT A TRANSLATION OF THE DESCRIPTION OR TO PAY THE FEE WITHIN THE PRESCRIBED TIME-LIMIT Effective date: 20151231 |
|
| REG | Reference to a national code |
Ref country code: NL Ref legal event code: MP Effective date: 20150930 |
|
| REG | Reference to a national code |
Ref country code: LT Ref legal event code: MG4D |
|
| REG | Reference to a national code |
Ref country code: AT Ref legal event code: MK05 Ref document number: 752715 Country of ref document: AT Kind code of ref document: T Effective date: 20150930 |
|
| PG25 | Lapsed in a contracting state [announced via postgrant information from national office to epo] |
Ref country code: HR Free format text: LAPSE BECAUSE OF FAILURE TO SUBMIT A TRANSLATION OF THE DESCRIPTION OR TO PAY THE FEE WITHIN THE PRESCRIBED TIME-LIMIT Effective date: 20150930 Ref country code: SE Free format text: LAPSE BECAUSE OF FAILURE TO SUBMIT A TRANSLATION OF THE DESCRIPTION OR TO PAY THE FEE WITHIN THE PRESCRIBED TIME-LIMIT Effective date: 20150930 Ref country code: RS Free format text: LAPSE BECAUSE OF FAILURE TO SUBMIT A TRANSLATION OF THE DESCRIPTION OR TO PAY THE FEE WITHIN THE PRESCRIBED TIME-LIMIT Effective date: 20150930 |
|
| PG25 | Lapsed in a contracting state [announced via postgrant information from national office to epo] |
Ref country code: SK Free format text: LAPSE BECAUSE OF FAILURE TO SUBMIT A TRANSLATION OF THE DESCRIPTION OR TO PAY THE FEE WITHIN THE PRESCRIBED TIME-LIMIT Effective date: 20150930 Ref country code: ES Free format text: LAPSE BECAUSE OF FAILURE TO SUBMIT A TRANSLATION OF THE DESCRIPTION OR TO PAY THE FEE WITHIN THE PRESCRIBED TIME-LIMIT Effective date: 20150930 Ref country code: IT Free format text: LAPSE BECAUSE OF FAILURE TO SUBMIT A TRANSLATION OF THE DESCRIPTION OR TO PAY THE FEE WITHIN THE PRESCRIBED TIME-LIMIT Effective date: 20150930 Ref country code: CZ Free format text: LAPSE BECAUSE OF FAILURE TO SUBMIT A TRANSLATION OF THE DESCRIPTION OR TO PAY THE FEE WITHIN THE PRESCRIBED TIME-LIMIT Effective date: 20150930 Ref country code: IS Free format text: LAPSE BECAUSE OF FAILURE TO SUBMIT A TRANSLATION OF THE DESCRIPTION OR TO PAY THE FEE WITHIN THE PRESCRIBED TIME-LIMIT Effective date: 20160130 Ref country code: NL Free format text: LAPSE BECAUSE OF FAILURE TO SUBMIT A TRANSLATION OF THE DESCRIPTION OR TO PAY THE FEE WITHIN THE PRESCRIBED TIME-LIMIT Effective date: 20150930 Ref country code: EE Free format text: LAPSE BECAUSE OF FAILURE TO SUBMIT A TRANSLATION OF THE DESCRIPTION OR TO PAY THE FEE WITHIN THE PRESCRIBED TIME-LIMIT Effective date: 20150930 |
|
| PG25 | Lapsed in a contracting state [announced via postgrant information from national office to epo] |
Ref country code: RO Free format text: LAPSE BECAUSE OF FAILURE TO SUBMIT A TRANSLATION OF THE DESCRIPTION OR TO PAY THE FEE WITHIN THE PRESCRIBED TIME-LIMIT Effective date: 20150930 Ref country code: BE Free format text: LAPSE BECAUSE OF NON-PAYMENT OF DUE FEES Effective date: 20160131 Ref country code: PL Free format text: LAPSE BECAUSE OF FAILURE TO SUBMIT A TRANSLATION OF THE DESCRIPTION OR TO PAY THE FEE WITHIN THE PRESCRIBED TIME-LIMIT Effective date: 20150930 Ref country code: PT Free format text: LAPSE BECAUSE OF FAILURE TO SUBMIT A TRANSLATION OF THE DESCRIPTION OR TO PAY THE FEE WITHIN THE PRESCRIBED TIME-LIMIT Effective date: 20160201 Ref country code: AT Free format text: LAPSE BECAUSE OF FAILURE TO SUBMIT A TRANSLATION OF THE DESCRIPTION OR TO PAY THE FEE WITHIN THE PRESCRIBED TIME-LIMIT Effective date: 20150930 |
|
| REG | Reference to a national code |
Ref country code: DE Ref legal event code: R097 Ref document number: 602013003319 Country of ref document: DE |
|
| PLBE | No opposition filed within time limit |
Free format text: ORIGINAL CODE: 0009261 |
|
| STAA | Information on the status of an ep patent application or granted ep patent |
Free format text: STATUS: NO OPPOSITION FILED WITHIN TIME LIMIT |
|
| PG25 | Lapsed in a contracting state [announced via postgrant information from national office to epo] |
Ref country code: LU Free format text: LAPSE BECAUSE OF FAILURE TO SUBMIT A TRANSLATION OF THE DESCRIPTION OR TO PAY THE FEE WITHIN THE PRESCRIBED TIME-LIMIT Effective date: 20160122 Ref country code: DK Free format text: LAPSE BECAUSE OF FAILURE TO SUBMIT A TRANSLATION OF THE DESCRIPTION OR TO PAY THE FEE WITHIN THE PRESCRIBED TIME-LIMIT Effective date: 20150930 |
|
| 26N | No opposition filed |
Effective date: 20160701 |
|
| PG25 | Lapsed in a contracting state [announced via postgrant information from national office to epo] |
Ref country code: MC Free format text: LAPSE BECAUSE OF FAILURE TO SUBMIT A TRANSLATION OF THE DESCRIPTION OR TO PAY THE FEE WITHIN THE PRESCRIBED TIME-LIMIT Effective date: 20150930 |
|
| REG | Reference to a national code |
Ref country code: FR Ref legal event code: ST Effective date: 20160930 |
|
| REG | Reference to a national code |
Ref country code: IE Ref legal event code: MM4A |
|
| PG25 | Lapsed in a contracting state [announced via postgrant information from national office to epo] |
Ref country code: FR Free format text: LAPSE BECAUSE OF NON-PAYMENT OF DUE FEES Effective date: 20160201 Ref country code: SI Free format text: LAPSE BECAUSE OF FAILURE TO SUBMIT A TRANSLATION OF THE DESCRIPTION OR TO PAY THE FEE WITHIN THE PRESCRIBED TIME-LIMIT Effective date: 20150930 |
|
| PG25 | Lapsed in a contracting state [announced via postgrant information from national office to epo] |
Ref country code: BE Free format text: LAPSE BECAUSE OF FAILURE TO SUBMIT A TRANSLATION OF THE DESCRIPTION OR TO PAY THE FEE WITHIN THE PRESCRIBED TIME-LIMIT Effective date: 20150930 |
|
| PG25 | Lapsed in a contracting state [announced via postgrant information from national office to epo] |
Ref country code: IE Free format text: LAPSE BECAUSE OF NON-PAYMENT OF DUE FEES Effective date: 20160122 |
|
| PG25 | Lapsed in a contracting state [announced via postgrant information from national office to epo] |
Ref country code: MT Free format text: LAPSE BECAUSE OF FAILURE TO SUBMIT A TRANSLATION OF THE DESCRIPTION OR TO PAY THE FEE WITHIN THE PRESCRIBED TIME-LIMIT Effective date: 20150930 |
|
| PG25 | Lapsed in a contracting state [announced via postgrant information from national office to epo] |
Ref country code: SM Free format text: LAPSE BECAUSE OF FAILURE TO SUBMIT A TRANSLATION OF THE DESCRIPTION OR TO PAY THE FEE WITHIN THE PRESCRIBED TIME-LIMIT Effective date: 20150930 Ref country code: HU Free format text: LAPSE BECAUSE OF FAILURE TO SUBMIT A TRANSLATION OF THE DESCRIPTION OR TO PAY THE FEE WITHIN THE PRESCRIBED TIME-LIMIT; INVALID AB INITIO Effective date: 20130122 Ref country code: CY Free format text: LAPSE BECAUSE OF FAILURE TO SUBMIT A TRANSLATION OF THE DESCRIPTION OR TO PAY THE FEE WITHIN THE PRESCRIBED TIME-LIMIT Effective date: 20150930 |
|
| PG25 | Lapsed in a contracting state [announced via postgrant information from national office to epo] |
Ref country code: TR Free format text: LAPSE BECAUSE OF FAILURE TO SUBMIT A TRANSLATION OF THE DESCRIPTION OR TO PAY THE FEE WITHIN THE PRESCRIBED TIME-LIMIT Effective date: 20150930 Ref country code: MK Free format text: LAPSE BECAUSE OF FAILURE TO SUBMIT A TRANSLATION OF THE DESCRIPTION OR TO PAY THE FEE WITHIN THE PRESCRIBED TIME-LIMIT Effective date: 20150930 Ref country code: MT Free format text: LAPSE BECAUSE OF FAILURE TO SUBMIT A TRANSLATION OF THE DESCRIPTION OR TO PAY THE FEE WITHIN THE PRESCRIBED TIME-LIMIT Effective date: 20160131 |
|
| PG25 | Lapsed in a contracting state [announced via postgrant information from national office to epo] |
Ref country code: BG Free format text: LAPSE BECAUSE OF FAILURE TO SUBMIT A TRANSLATION OF THE DESCRIPTION OR TO PAY THE FEE WITHIN THE PRESCRIBED TIME-LIMIT Effective date: 20150930 |
|
| PG25 | Lapsed in a contracting state [announced via postgrant information from national office to epo] |
Ref country code: AL Free format text: LAPSE BECAUSE OF FAILURE TO SUBMIT A TRANSLATION OF THE DESCRIPTION OR TO PAY THE FEE WITHIN THE PRESCRIBED TIME-LIMIT Effective date: 20150930 |
|
| PGFP | Annual fee paid to national office [announced via postgrant information from national office to epo] |
Ref country code: GB Payment date: 20241223 Year of fee payment: 13 |
|
| PGFP | Annual fee paid to national office [announced via postgrant information from national office to epo] |
Ref country code: DE Payment date: 20241223 Year of fee payment: 13 |
|
| PGFP | Annual fee paid to national office [announced via postgrant information from national office to epo] |
Ref country code: CH Payment date: 20250201 Year of fee payment: 13 |