EP2713874B1 - Gait asymmetry measurement - Google Patents
Gait asymmetry measurement Download PDFInfo
- Publication number
- EP2713874B1 EP2713874B1 EP20120792991 EP12792991A EP2713874B1 EP 2713874 B1 EP2713874 B1 EP 2713874B1 EP 20120792991 EP20120792991 EP 20120792991 EP 12792991 A EP12792991 A EP 12792991A EP 2713874 B1 EP2713874 B1 EP 2713874B1
- Authority
- EP
- European Patent Office
- Prior art keywords
- points
- steps
- pairs
- pair
- display
- Prior art date
- Legal status (The legal status is an assumption and is not a legal conclusion. Google has not performed a legal analysis and makes no representation as to the accuracy of the status listed.)
- Not-in-force
Links
Images




Classifications
-
- A—HUMAN NECESSITIES
- A61—MEDICAL OR VETERINARY SCIENCE; HYGIENE
- A61B—DIAGNOSIS; SURGERY; IDENTIFICATION
- A61B5/00—Measuring for diagnostic purposes; Identification of persons
- A61B5/103—Measuring devices for testing the shape, pattern, colour, size or movement of the body or parts thereof, for diagnostic purposes
- A61B5/11—Measuring movement of the entire body or parts thereof, e.g. head or hand tremor or mobility of a limb
- A61B5/112—Gait analysis
-
- A—HUMAN NECESSITIES
- A61—MEDICAL OR VETERINARY SCIENCE; HYGIENE
- A61B—DIAGNOSIS; SURGERY; IDENTIFICATION
- A61B5/00—Measuring for diagnostic purposes; Identification of persons
- A61B5/103—Measuring devices for testing the shape, pattern, colour, size or movement of the body or parts thereof, for diagnostic purposes
- A61B5/11—Measuring movement of the entire body or parts thereof, e.g. head or hand tremor or mobility of a limb
- A61B5/1121—Determining geometric values, e.g. centre of rotation or angular range of movement
- A61B5/1122—Determining geometric values, e.g. centre of rotation or angular range of movement of movement trajectories
-
- A—HUMAN NECESSITIES
- A61—MEDICAL OR VETERINARY SCIENCE; HYGIENE
- A61B—DIAGNOSIS; SURGERY; IDENTIFICATION
- A61B5/00—Measuring for diagnostic purposes; Identification of persons
- A61B5/72—Signal processing specially adapted for physiological signals or for diagnostic purposes
-
- A—HUMAN NECESSITIES
- A61—MEDICAL OR VETERINARY SCIENCE; HYGIENE
- A61B—DIAGNOSIS; SURGERY; IDENTIFICATION
- A61B5/00—Measuring for diagnostic purposes; Identification of persons
- A61B5/74—Details of notification to user or communication with user or patient; User input means
- A61B5/742—Details of notification to user or communication with user or patient; User input means using visual displays
-
- A—HUMAN NECESSITIES
- A61—MEDICAL OR VETERINARY SCIENCE; HYGIENE
- A61B—DIAGNOSIS; SURGERY; IDENTIFICATION
- A61B2562/00—Details of sensors; Constructional details of sensor housings or probes; Accessories for sensors
- A61B2562/02—Details of sensors specially adapted for in-vivo measurements
- A61B2562/0219—Inertial sensors, e.g. accelerometers, gyroscopes, tilt switches
Definitions
- the present invention relates to the measurement of gait and in particular to the measurement of asymmetry in gait.
- Variability is always present in human movement. Commonly variability is seen as noise, thus is unwanted and removed by data processing. Variability analysis has been used to indentify human gait patterns, but also for clinical purposes such as analysing pathological gait. Studies have found increased step time variability in elderly subjects compared to young adults. Increase in stride-to-stride variability within elderly subjects has also been found.
- Parkinson's disease a progressive disorder of the central nervous system, presents with resting tremor, short slow steps, decreased centre of mass (CoM) movement and an increase in variability of temporospatial parameters of gait such as stride length and step time.
- Research has also shown that people with idiopathic Parkinson's disease have a higher gait asymmetry compared to age matched controls.
- Studies have also been carried out which suggest that gait asymmetry is common when looking at temporospatial parameters in both typically developed adults (TDA) and PD.
- TDA typically developed adults
- fractal analysis has been used, which relies on longer walks (i.e. 2 and 6 minute walking tests).
- An issue with these studies is that the data sets required are relatively large. Gathering this amount of data can be seen as time consuming and therefore rather stressful for the participant, especially those with clinical conditions.
- inertial measurement unit IMU
- CoM centre of mass
- the present invention provides a system for measuring variation in the gait of a subject, the system comprising measuring means arranged to measure variations in the position of the subject while the subject takes a series of steps.
- the position may be a vertical position, but may be position in any direction, or along any axis.
- the direction or axis may be close to vertical, or may be a horizontal direction or axis.
- the system may further comprise processing means.
- the system may further comprise display means.
- the processing means may be arranged to identify a plurality of points in a first one of the steps and a plurality of points in a second one of the steps.
- the processing means may be arranged to identify a plurality of pairs of the points. Each pair may comprise one point in each of the steps.
- the processing means may be arranged to determine a value of height for each of the points in each of the pairs.
- the processing means may be arranged to control the display means to produce a display plotting the heights of the two points in each pair against each other.
- the processing means may be arranged to identify the first and second steps as consecutive steps in the series. However, the first and second steps may be selected from anywhere in the series. Where the system is arranged to measure asymmetry between the legs of a subject, the first and second steps may be selected to be on different legs. However in some cases they may be different steps on the same leg where variation over time between steps on the same leg is being measured.
- the processing means may be arranged to identify each pair of points so that the time interval between the two points in each pair is the same. Alternatively the time interval may be different for different pairs of points. There may be some other relationship between the pairs of points, such as their relative position within the step cycle.
- the processing means may be arranged to identify a series of points through the series of steps and to include each of the series of points in one of the pairs. This allows the use of a constant (or regularly varying) sampling interval throughout the test walking period.
- the processing means may be arranged to define a coordinate system having two axes representing the heights of the two points in a pair. This can allow the heights of each pair of points to be represented by a position within the coordinate system.
- the processing means may be arranged to identify the positions in the coordinate system for each of the pairs of points.
- the processing means may be arranged to control the display so as to indicate those positions, for example by means of respective markers.
- the markers may comprise dots or crosses or be of any other suitable shape.
- the processing means may be arranged to analyse the positions associated with the pairs of points and to calculate a parameter of the positions.
- the parameter may be a statistical parameter, for example a standard deviation of distance from a point or a line, or it may be an average position.
- the processing means may be arranged to calculate the position of a line having a predetermined relationship to the positions associated with the pairs of the points.
- the line may be a straight line, or it may be a curve. For example it may be an oval, or a circle.
- the processing means may be arranged to control the display to display the line.
- the present invention further provides a method of measuring variation in the gait of a subject.
- the method includes measuring variations in vertical position of the subject while the subject takes a series of steps.
- the method may comprise any one or more of: identifying a plurality of points in a first one of the steps and a plurality of points in a second one of the steps; identifying a plurality of pairs of the points, each pair comprising one point in each of the steps; determining a value of height for each of the points in each of the pairs; and, producing a display plotting the heights of the two points in each pair against each other.
- the first and second steps may be identified as consecutive steps in the series.
- the pairs of points may be identified so that the time interval between the two points in each pair is the same.
- the method may include identifying a series of points through the series of steps and including each of the series of points in one of the pairs.
- the method may include defining a coordinate system having two axes representing the heights of the two points in a pair, so that the heights of each pair of points can be represented by a position within the coordinate system.
- the method may include identifying the positions in the coordinate system for each of the pairs of points, and controlling the display so as to indicate those positions.
- the method may include analysing the positions associated with the pairs of points and calculating a parameter of the positions.
- the method may include calculating the position of a line having a predetermined relationship to the positions of the points, and controlling the display to display the line.
- the present invention further provides a system for measuring variation in the gait of a subject, the system comprising a memory arranged to store data recording variations in vertical position of the subject while the subject takes a series of steps, processing means, and display means.
- the processing means may be arranged to identify a plurality of points in a first one of the steps and a plurality of points in a second one of the steps.
- the processing means may be arranged to identify a plurality of pairs of the points, each pair comprising one point in each of the steps.
- the processing means may be arranged to determine a value of height for each of the points in each of the pairs.
- the processing means may be arranged to control the display means to produce a display plotting the heights of the two points in each pair against each other.
- an inertial measurement unit (IMU) 10 is attached to a subject 14 by means of adhesive tape 12 .
- the IMU is of a known form and comprises a number of accelerometers and is arranged to identify the vertical direction using the accelerometers and to measure acceleration in the vertical direction. It is then arranged to calculate vertical velocity and hence vertical position continuously and to store the calculated vertical position at a series of sample points in time.
- the vertical position can be relative to any reference position or height, which in this case is the position of the CoM at the start of measurement when the subject is standing still.
- the measured vertical position is measured and defined by the IMU 10 as a CoM excursion, which is the difference between the actual vertical position of the CoM of the subject at a point in time and the reference, starting vertical position of the CoM.
- a computer system 20 is arranged to receive the CoM excursion data collected over a test period and analyse it and use it to generate various displays which are arranged to help with the identification of various characteristics of the gait of the subject.
- the computer system comprises a processor 22, a memory 24 and a display screen 26.
- the memory is arranged to store the data collected by the IMU 10, and also to store a program which controls the processing of the data by the processor 22 and controls the display screen 26. It will be appreciated that the amount of processing of the raw sensor signals that is carried out in the IMU 10 and the amount that is done by the computer system 20 is arbitrary.
- the CoM movement of the subject can be described using an inverted pendulum model of the gait of the subject.
- This model describes the mechanical energetic state during a gait cycle in which the CoM excursion plotted as a function of time behaves like a sine wave having a sequence of peaks and troughs, with each step producing one cycle of the sine wave from the bottom of one trough to the bottom of the next.
- any height measure will give the same basic shape, with the reference height relative to which the height is measured being to some extent arbitrary.
- FIG. 3 A computer generated example of a plot of CoM excursion as a function of time is shown in Figure 3 .
- This shows simulated results for a series of nine walking steps with CoM excursion from the starting point shown on the vertical axis and time on the horizontal axis, with the step length increasing after the first three, and the next three steps.
- Sample frequency in the simulation is set as 100Hz which corresponds to the sample rate for the inertial measurement unit (IMU). This is a suitable sample frequency for gait measurement but in practice the sample rate of the IMU can vary, for example up to 120Hz, or higher if particularly high resolution is required. Therefore the time interval between sample height measurements is equal to 0.01seconds.
- the plot of Figure 3 is over a period of 5 seconds. Therefore there are 500 sample points on the plot, and as there are nine steps there are about 55 sample points per step.
- the computer system 22 is arranged to compare the CoM excursion for each sample point in each step with the CoM excursion at the corresponding point in the previous step. It will be appreciated that this compares the CoM excursion for a step on one leg with a corresponding CoM excursion for a step on the other leg.
- the plot of Figure 3 is copied and shifted by one step length, resulting in two CoM excursion plots superimposed on each other as shown. Each point on one of the curves is therefore aligned with the corresponding sample point in the previous step in the other curve. Where a step is the same as the previous step, the curves are aligned, and where there is a difference between one step and the next this can be seen as a divergence between the two curves.
- the computer is then arranged to generate a two dimensional plot (referred to herein as a non-linear plot) of the CoM excursion for each point on one axis (the horizontal axis) against the CoM excursion for the corresponding point one step previously on a perpendicular axis (the vertical axis).
- the plot will include a point on the line at 45° through the point (0,0).
- the points in the third peak and third trough where the maximum excursion of the current step is 1.5cm and of the previous step is 1.0cm will generate a line passing through (0,0) and the point (1.5,1).
- This plot shows a line joining each of the points that is produced for a respective sample time in the CoM excursion plot.
- the shape of the cluster of points, or the line joining them as in the plot of Figure 7 can be analysed to determine various parameters of the plot which in turn can be used as a measure of various characteristics of the gait of the subject.
- each step is considered as a sine wave and the time within each step is defined as a fraction of the whole of that step, such as in terms of an angle between 0 and 360°, then the pairs of points could be selected as those having the same relative (angular) position with in the step cycle.
- a circle is fitted onto the data in order to find the origins of the cloud ( x 0 , y 0 ,) with the radius (SD A ) of the given data cloud as shown in equation (2)
- An ellipse is fitted around the spread of data based on two standard deviations one SD A of position measured in the direction parallel to the best fit straight line, which is the length of the ellipse, and the other SD B of position measured in the direction perpendicular to the best fit straight line, which is the width of the ellipse.
- Ratio ⁇ derived between SD A and SD B is determined to describe the ellipse.
- angle ⁇ shows the direction of the best fit straight line through the data points indicating a level of symmetry as shown in Figure 8 .
- FIG. 9 shows non-linear plots based on equal sine waves (frequency 10.1Hz, amplitude 5cm) while being out of phase by 180 0 (A), 225 0 (B) 270 0 (C), 315 0 (D), 360 0 (E), 45 0 (F), 90 0 (G) and 135 0 (H). It becomes clear that the sine wave produced data clouds rotate around their own axes (anti-clockwise) with change in phase shift.
- CoM vertical displacement can be variable with differing limb or stride length.
- two sign waves were generated with an amplitude of 5cm and 7cm respectively which represents typical human walking.
- the remaining configurations were similar to the previously used sine wave.
- Figure 10 shows the generated plots where it becomes visible that any variance in the CoM excursion results in a change in ⁇ .
- Figure 10 shows non-linear plots based on two sine waves (frequency 10.1Hz, amplitude 5 and 7cm) with different while being out of phase by 180 0 (A), 170 0 (B) 360 0 (C) and 90 0 (D).
- the IMU 10 In use, to measure the variability of gait of a subject, the IMU 10 is strapped to the subject, and the subject walks a short distance, for example around 10 meters. During this time the IMU calculates and stores the height data for each of the sample points. The data is then input from the IMU to the computer 20 which is arranged to select pairs of sample points as described above and to generate a data set associating the two heights for each pair of sample points, for example as simple height values, or as coordinates on a plot such as the non-linear plot of Figure 5 . The computer is then arranged to control the display screen 26 to display the non-linear plot of data points, each point having a position defined by the two height values of its respective pair of sample points.
- the computer is also arranged to calculate the best fit straight line, circle, and oval, as described above with reference to Figure 8 , and to display those superimposed on the plot of the data points as shown in Figure 11 .
- the values of ⁇ , SD A , SD B and ⁇ are also calculated and displayed on the screen.
- the plot itself or the numerical values calculated, or both can then be used as measures of parameters of the gait of the subject.
- the computer system can be arranged to analyse the data in various different ways whilst still providing a similar measurement of gait variability.
- the data can be divided into separate steps and the first point in the left leg step plotted against the first point in the right leg step, and subsequent pairs of point plotted against each other.
- the data can be separated into left leg and right leg steps, and then the left leg step data combined to form a first sine wave and the right leg data combined to form a second sine wave, and then corresponding points in the two sine waves plotted against each other.
- contralateral data i.e.
- ipsilateral data comparison is made in which the data for one step of one leg is compared with data for a different step of the same leg.
- the data can be divided into left and right leg steps, each of which is combined together to form left and right leg plots each being an approximate sine wave over several steps.
- the left leg plot is then shifted so that each left leg step is compared with the previous left leg step, and the same is done for the right leg data.
- a Parkinson's Disease Questionnaire was administered for people with PD before partaking in this study. Participants walked over a ten-metre walkway free of obstacles at their self selected walking speed. Participants started at a static position at the zero-point and came to a complete stop at the ten-metre line. The duration of the walk was recorded by a stopwatch. An IMU was placed over the projected CoM located over the fourth lumbar vertebrae, measuring at a sample frequency of 100Hz.
- IMU data was analysed by a program written in LabVIEW 8.5 (National Instruments, Ireland) to obtain vertical position. Temporal and spatial gait parameters were calculated according to Zijlstra's inverted pendulum model resulting in stride length and walking speed (v I ). ⁇ , SD A , SD B and ⁇ were derived by applying the non-linear method described above.
- TDA and PD group were compared using an independent t-test on stride length and walking speed as well as ⁇ , SD A and SD B . Furthermore a Pearson's regression test was used to test for a relationship between walking speed and ⁇ for both PD and TDA. ⁇ was tested by an independent t-test between PD and TDA.
- Table 1 descriptive measurements showing mean for Barthel Index (BI) and Parkinson's disease questionnaire (PDQ) for typical developed adults (TDA) and people with Parkinson's disease (PD) where an asterisk shows a significant difference between groups (p ⁇ 0.05). Sex is indicated as the number of males (M) taking part.
- BI Barthel Index
- PDQ Parkinson's disease questionnaire
- TDA developed adults
- PD people with Parkinson's disease
- Sex is indicated as the number of males (M) taking part.
- ⁇ is affected by a change in step length
- SD A is affected by a change in step frequency as well as step length
- SD B is affected by a change in step frequency
- ⁇ is the ratio between SD A and SD B defined as SD A / SD B .
- Table 2 Outcomes from non-linear method applied to gait in typical developed adults (TDA) and Parkinson's disease (PD) showing the angle ( ⁇ ) of the least square fit with SDA and SDB describing the standard deviations of the non-linear plot with ratio ⁇ .
- An asterisk indicates a significant difference between both groups.
- step length has been reported as one of the key features of PD gait. Indeed, it has also been suggested that variability analysis may be used to closely monitor and describe gait disorders than measurements based on mean values of temporospatial walking parameters. The results of this study support this as, whilst there was no difference in step length, ⁇ and SD A showed a significant difference between TDA and PD. Thus PD could be differentiated from TDA based on CoM variability ( Figure 12 ). The significant difference in SD A may be due to increased step length variability reflected in CoM excursion. Although it should be noted that walking speed was significantly reduced for PD when compared to TDA, which has been reported previously.
- Novel methods have often been used to look into gait in more depth. For example fractal dynamic analysis has been used in TDA and PD to explore stride-to-stride fluctuations. An increase in stride-to-stride variability both in stride length as step time has been observed in early and late stages of PD. Our findings are in agreement with these previous findings by showing an increase in stride length variability (SD A ) as well as an increase in stride-to-stride symmetry ( ⁇ ) within a variety of PD. Despite a visual decrease in SD A and SD B in Figure 12 , only SD A shows a significant difference between PD and TDA. This could be explained by the reduced stride length which has also been reported by PD research. Furthermore it is noticeable that the ratio ⁇ does not show a significant difference between PD and TDA. This indicates that the symmetry variability (SD B ) decreases by reducing stride length variability (SD A ).
- embodiments of the present invention may provide a valuable measure for clinical use. Whilst the study described above was conducted for PD this method has the potential to indicate the severity of gait impairment in PD and other populations. The present invention can therefore provide a methodology that can assist in early diagnosis in people with PD and monitor their gait during deep brain stimulation. It may also be possible to use these gait parameters to more accurately monitor efficiency of medication in PD.
Landscapes
- Health & Medical Sciences (AREA)
- Life Sciences & Earth Sciences (AREA)
- Physics & Mathematics (AREA)
- Engineering & Computer Science (AREA)
- Molecular Biology (AREA)
- General Health & Medical Sciences (AREA)
- Biophysics (AREA)
- Pathology (AREA)
- Veterinary Medicine (AREA)
- Biomedical Technology (AREA)
- Heart & Thoracic Surgery (AREA)
- Medical Informatics (AREA)
- Public Health (AREA)
- Surgery (AREA)
- Animal Behavior & Ethology (AREA)
- Physiology (AREA)
- Oral & Maxillofacial Surgery (AREA)
- Dentistry (AREA)
- Geometry (AREA)
- Artificial Intelligence (AREA)
- Computer Vision & Pattern Recognition (AREA)
- Psychiatry (AREA)
- Signal Processing (AREA)
- Measurement Of The Respiration, Hearing Ability, Form, And Blood Characteristics Of Living Organisms (AREA)
- Length Measuring Devices By Optical Means (AREA)
- Length Measuring Devices With Unspecified Measuring Means (AREA)
Description
- The present invention relates to the measurement of gait and in particular to the measurement of asymmetry in gait.
- Variability is always present in human movement. Commonly variability is seen as noise, thus is unwanted and removed by data processing. Variability analysis has been used to indentify human gait patterns, but also for clinical purposes such as analysing pathological gait. Studies have found increased step time variability in elderly subjects compared to young adults. Increase in stride-to-stride variability within elderly subjects has also been found.
- Parkinson's disease (PD), a progressive disorder of the central nervous system, presents with resting tremor, short slow steps, decreased centre of mass (CoM) movement and an increase in variability of temporospatial parameters of gait such as stride length and step time. Research has also shown that people with idiopathic Parkinson's disease have a higher gait asymmetry compared to age matched controls. Studies have also been carried out which suggest that gait asymmetry is common when looking at temporospatial parameters in both typically developed adults (TDA) and PD. In these studies fractal analysis has been used, which relies on longer walks (i.e. 2 and 6 minute walking tests). An issue with these studies is that the data sets required are relatively large. Gathering this amount of data can be seen as time consuming and therefore rather stressful for the participant, especially those with clinical conditions.
- As described, for example, in
WO2010/073044 inertial measurement unit (IMU) technology can be used to measure centre of mass (CoM) movement, providing a quick and relatively cheap way of gathering larger amounts of data over relative few steps where a high sample frequency is used. - The present invention provides a system for measuring variation in the gait of a subject, the system comprising measuring means arranged to measure variations in the position of the subject while the subject takes a series of steps. The position may be a vertical position, but may be position in any direction, or along any axis. The direction or axis may be close to vertical, or may be a horizontal direction or axis. The system may further comprise processing means. The system may further comprise display means. The processing means may be arranged to identify a plurality of points in a first one of the steps and a plurality of points in a second one of the steps. The processing means may be arranged to identify a plurality of pairs of the points. Each pair may comprise one point in each of the steps. The processing means may be arranged to determine a value of height for each of the points in each of the pairs. The processing means may be arranged to control the display means to produce a display plotting the heights of the two points in each pair against each other.
- The processing means may be arranged to identify the first and second steps as consecutive steps in the series. However, the first and second steps may be selected from anywhere in the series. Where the system is arranged to measure asymmetry between the legs of a subject, the first and second steps may be selected to be on different legs. However in some cases they may be different steps on the same leg where variation over time between steps on the same leg is being measured.
- The processing means may be arranged to identify each pair of points so that the time interval between the two points in each pair is the same. Alternatively the time interval may be different for different pairs of points. There may be some other relationship between the pairs of points, such as their relative position within the step cycle.
- The processing means may be arranged to identify a series of points through the series of steps and to include each of the series of points in one of the pairs. This allows the use of a constant (or regularly varying) sampling interval throughout the test walking period.
- The processing means may be arranged to define a coordinate system having two axes representing the heights of the two points in a pair. This can allow the heights of each pair of points to be represented by a position within the coordinate system. The processing means may be arranged to identify the positions in the coordinate system for each of the pairs of points. The processing means may be arranged to control the display so as to indicate those positions, for example by means of respective markers. The markers may comprise dots or crosses or be of any other suitable shape.
- The processing means may be arranged to analyse the positions associated with the pairs of points and to calculate a parameter of the positions. The parameter may be a statistical parameter, for example a standard deviation of distance from a point or a line, or it may be an average position.
- The processing means may be arranged to calculate the position of a line having a predetermined relationship to the positions associated with the pairs of the points. The line may be a straight line, or it may be a curve. For example it may be an oval, or a circle. The processing means may be arranged to control the display to display the line.
- The present invention further provides a method of measuring variation in the gait of a subject. The method includes measuring variations in vertical position of the subject while the subject takes a series of steps. The method may comprise any one or more of: identifying a plurality of points in a first one of the steps and a plurality of points in a second one of the steps; identifying a plurality of pairs of the points, each pair comprising one point in each of the steps; determining a value of height for each of the points in each of the pairs; and, producing a display plotting the heights of the two points in each pair against each other.
- The first and second steps may be identified as consecutive steps in the series. The pairs of points may be identified so that the time interval between the two points in each pair is the same.
- The method may include identifying a series of points through the series of steps and including each of the series of points in one of the pairs.
- The method may include defining a coordinate system having two axes representing the heights of the two points in a pair, so that the heights of each pair of points can be represented by a position within the coordinate system.
- The method may include identifying the positions in the coordinate system for each of the pairs of points, and controlling the display so as to indicate those positions.
- The method may include analysing the positions associated with the pairs of points and calculating a parameter of the positions.
- The method may include calculating the position of a line having a predetermined relationship to the positions of the points, and controlling the display to display the line.
- The present invention further provides a system for measuring variation in the gait of a subject, the system comprising a memory arranged to store data recording variations in vertical position of the subject while the subject takes a series of steps, processing means, and display means. The processing means may be arranged to identify a plurality of points in a first one of the steps and a plurality of points in a second one of the steps. The processing means may be arranged to identify a plurality of pairs of the points, each pair comprising one point in each of the steps. The processing means may be arranged to determine a value of height for each of the points in each of the pairs. The processing means may be arranged to control the display means to produce a display plotting the heights of the two points in each pair against each other.
- Preferred embodiments of the present invention will now be described by way of example only with reference to the accompanying drawings.
-
-
Figure 1 is a diagram of a subject with an inertial measurement unit used in an embodiment of the invention; -
Figure 2 is a diagram of a computer system according to an embodiment of the invention arranged to analyse data from the IMU ofFigure 1 ; -
Figure 3 is a computer simulated plot of height of the CoM of the subject ofFigure 1 as a function of time with variation in step length; -
Figure 4 shows the plot ofFigure 3 superimposed on a copy of the same plot shifted in time by the duration of one step; -
Figure 5 is a plot of CoM excursion from the shifted plot as a function of the CoM excursion from the original plot, with values for each step on the horizontal axis plotted against values for the previous step on the vertical axis; -
Figure 6 is a plot of measured height of the CoM of the subject ofFigure 1 during walking as a function of time; -
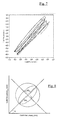
Figure 7 is a plot similar toFigure 5 for the data ofFigure 6 ; -
Figure 8 is a diagram showing parameters of the plot ofFigure 7 which can be quantified in an embodiment of the invention; -
Figures 9a - 9h are computer simulated plots similar to that ofFigure 5 for sine waves of equal amplitude and wavelength, but out of phase by 1800 (a), 2250 (b), 2700 (c), 3150 (d), 3600 (e), 450 (f), 90° (g) and 1350 (h); -
Figures 10a -d are computer simulated plots similar to that ofFigure 5 for two sine waves (frequency 10.1Hz,amplitude 5 and 7cm) being out of phase by 1800 (a), 1700 (b) 3600 (c) and 900 (d); -
Figures 11a and 11b are computer simulated plots based on three sine waves (constant amplitude of 5cm and phase shift of 180°) representing a change in step length (a) and step frequency (b); and -
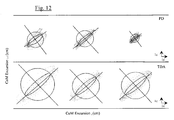
Figure 12 is a set of three plots similar to that ofFigure 5 for PD sufferers and three plots for typically developed adults generated from measured data. - Referring to
Figure 1 an inertial measurement unit (IMU) 10 is attached to a subject 14 by means ofadhesive tape 12 . The IMU is of a known form and comprises a number of accelerometers and is arranged to identify the vertical direction using the accelerometers and to measure acceleration in the vertical direction. It is then arranged to calculate vertical velocity and hence vertical position continuously and to store the calculated vertical position at a series of sample points in time. The vertical position can be relative to any reference position or height, which in this case is the position of the CoM at the start of measurement when the subject is standing still. In this embodiment the measured vertical position is measured and defined by theIMU 10 as a CoM excursion, which is the difference between the actual vertical position of the CoM of the subject at a point in time and the reference, starting vertical position of the CoM. - Referring to
Figure 2 acomputer system 20 is arranged to receive the CoM excursion data collected over a test period and analyse it and use it to generate various displays which are arranged to help with the identification of various characteristics of the gait of the subject. The computer system comprises aprocessor 22, amemory 24 and adisplay screen 26. In conventional manner the memory is arranged to store the data collected by theIMU 10, and also to store a program which controls the processing of the data by theprocessor 22 and controls thedisplay screen 26. It will be appreciated that the amount of processing of the raw sensor signals that is carried out in theIMU 10 and the amount that is done by thecomputer system 20 is arbitrary. - The CoM movement of the subject can be described using an inverted pendulum model of the gait of the subject. This model describes the mechanical energetic state during a gait cycle in which the CoM excursion plotted as a function of time behaves like a sine wave having a sequence of peaks and troughs, with each step producing one cycle of the sine wave from the bottom of one trough to the bottom of the next. It will be appreciated that any height measure will give the same basic shape, with the reference height relative to which the height is measured being to some extent arbitrary. In this embodiment of the invention further analysis using a non-linear method is performed on the CoM excursion data by the
computer system 20, whereby CoM Excursion (CoM Excursioni) at each point in one step is plotted against the CoM Excursion (CoM Excursioni-1) for the same point in the previous step. - A computer generated example of a plot of CoM excursion as a function of time is shown in
Figure 3 . This shows simulated results for a series of nine walking steps with CoM excursion from the starting point shown on the vertical axis and time on the horizontal axis, with the step length increasing after the first three, and the next three steps. Sample frequency in the simulation is set as 100Hz which corresponds to the sample rate for the inertial measurement unit (IMU). This is a suitable sample frequency for gait measurement but in practice the sample rate of the IMU can vary, for example up to 120Hz, or higher if particularly high resolution is required. Therefore the time interval between sample height measurements is equal to 0.01seconds. The plot ofFigure 3 is over a period of 5 seconds. Therefore there are 500 sample points on the plot, and as there are nine steps there are about 55 sample points per step. - Referring to
Figure 4 , in order to measure variation in gait, thecomputer system 22 is arranged to compare the CoM excursion for each sample point in each step with the CoM excursion at the corresponding point in the previous step. It will be appreciated that this compares the CoM excursion for a step on one leg with a corresponding CoM excursion for a step on the other leg. In order to do this, the plot ofFigure 3 is copied and shifted by one step length, resulting in two CoM excursion plots superimposed on each other as shown. Each point on one of the curves is therefore aligned with the corresponding sample point in the previous step in the other curve. Where a step is the same as the previous step, the curves are aligned, and where there is a difference between one step and the next this can be seen as a divergence between the two curves. - Referring to
Figure 5 , the computer is then arranged to generate a two dimensional plot (referred to herein as a non-linear plot) of the CoM excursion for each point on one axis (the horizontal axis) against the CoM excursion for the corresponding point one step previously on a perpendicular axis (the vertical axis). For all cases where the two excursions are equal, the plot will include a point on the line at 45° through the point (0,0). The points in the third peak and third trough where the maximum excursion of the current step is 1.5cm and of the previous step is 1.0cm will generate a line passing through (0,0) and the point (1.5,1). The points in the sixth peak and sixth trough where the maximum excursion of the current step is 2cm and of the previous step is 1.5cm will generate a line passing through (0,0) and the point (2,1.5). It will be appreciated that in this example as the two superimposed plots are in phase, because the steps are of a constant frequency, the lines on the plot ofFigure 5 all pass though the point (0,0). However if the steps vary in period, then the original and shifted curves will not cross the horizontal axis at the same time, so a plot similar toFigure 5 will not pass through that point. - This is illustrated further with reference to
Figure 6 which shows a plot of actual measured CoM excursion as a function of sample number, with a sampling frequency of 100Hz, for a real subject walking for 10m. Superficially it can be seen that the oscillations in CoM excursion alternate between higher and lower amplitudes, suggesting a difference between the steps of the left and right legs, though there is obviously significant variation in the steps for each leg. Plotting the CoM excursion (CoM Excursion i) for each sample point against the CoM excursion (CoM Excursion i-1) for the sample point a fixed time (approximately equal to one step length) earlier results in a plot shown inFigure 7 . This plot shows a line joining each of the points that is produced for a respective sample time in the CoM excursion plot. The shape of the cluster of points, or the line joining them as in the plot ofFigure 7 , can be analysed to determine various parameters of the plot which in turn can be used as a measure of various characteristics of the gait of the subject. - It will be appreciated that, for the shape of the cluster to be analysed in a useful way, there need to be sufficient points in the plot, and therefore sufficient sample points of measured height. In the plot of
Figure 6 there are approximately 40 sample points per step. Fewer sample points could be used, but an average of at least 10 per step is needed over the test period to be able to gather sufficient data over a relatively short test time. Also while it is simplest and desirable for the sample points to be equally spaced in time, there can be some variation in the time interval between sample points, for example to have more sample points around specific parts of the step cycle. In some cases each pair of points may be selected on the basis of their position within the step cycle. For example if each step is considered as a sine wave and the time within each step is defined as a fraction of the whole of that step, such as in terms of an angle between 0 and 360°, then the pairs of points could be selected as those having the same relative (angular) position with in the step cycle. - In order to better understand this analysis the theoretical exploration of these CoM plots by means of generated sine waves was performed in LabVIEW8.5 by means of a sine-generator which varied frequency, amplitude and phase shift. In order to mimic changes typically observed over a 10 metre walk the following components were altered:
- 1) Phase shift was generated with 45 degree steps in order to explore potential phase shifts of the vertical CoM during human walking (
Figure 9 ) - 2) Amplitude ranges from 5 to 7cm, which represent typical vertical CoM movement during human walking (
Figure 10 ) - 3) Frequency values vary between 10-10.4Hz, representing the change in walking frequency during a 10 metre walk (
Figure 11 ). - For each case a non-linear plot similar to that of
Figures 5 and7 was produced and analysed. - The analysis used for these plots will now be described with reference to
Figure 8 , and it will be appreciated that thecomputer 20 is arranged to perform this analysis on each set of data obtained from measurement of a subject over a short walking distance, and that the parameters identified can be used by thecomputer system 20 to analyse the measurement data from the subject. - A least square best fit straight line is plotted against the cloud of points in the CoM excursion plot and the line is plotted as a function f = ax + b, where a is the gradient of the line and b is the intercept.
- The gradient is converted to an angle β (degrees) measured from the horizontal axis in the anticlockwise direction towards the vertical axis as shown in equation (1).

- A computer generated sine wave which assumes consistency and therefore no variability, would result in a value of β = 45 0 .
- A circle is fitted onto the data in order to find the origins of the cloud (x0, y0 ,) with the radius (SDA) of the given data cloud as shown in equation (2)

- An ellipse is fitted around the spread of data based on two standard deviations one SDA of position measured in the direction parallel to the best fit straight line, which is the length of the ellipse, and the other SDB of position measured in the direction perpendicular to the best fit straight line, which is the width of the ellipse. Ratio ∀ derived between SDA and SDB is determined to describe the ellipse. Furthermore angle β shows the direction of the best fit straight line through the data points indicating a level of symmetry as shown in
Figure 8 . - Referring to
Figure 9 , two sine waves (being theoretically non variable) generated within LabVIEW8.5 containing a frequency of 10.1Hz, amplitude of 5cm with an intersect of 1cm, with zero phase shift between them, sampled at 100Hz will result in an angle β - 450 with an R2 value of 1.00, SDA of 4.98cm and SDB of 0. When changing the phase shift (in steps of 45 degrees) of CoMi-1 the plots will change according to the plots shown inFigures 9a to 9h . SpecificallyFigure 9 shows non-linear plots based on equal sine waves (frequency 10.1Hz, amplitude 5cm) while being out of phase by 1800 (A), 2250 (B) 2700 (C), 3150 (D), 3600 (E), 450 (F), 900 (G) and 1350 (H). It becomes clear that the sine wave produced data clouds rotate around their own axes (anti-clockwise) with change in phase shift. - CoM vertical displacement can be variable with differing limb or stride length. In order to explore the theoretical models two sign waves were generated with an amplitude of 5cm and 7cm respectively which represents typical human walking. The remaining configurations were similar to the previously used sine wave.
Figure 10 shows the generated plots where it becomes visible that any variance in the CoM excursion results in a change in β. SpecificallyFigure 10 shows non-linear plots based on two sine waves (frequency 10.1Hz,amplitude 5 and 7cm) with different while being out of phase by 1800 (A), 1700 (B) 3600 (C) and 900 (D). - Furthermore changes such as walking speed can be related to an increase in step length and cadence. Change in step length will result in a change of CoM vertical excursion when assuming the inverted pendulum model. The effects of the variability of step length is shown by creating three sine waves with different amplitudes (3, 5 and 7cm respectively) representing typical vertical CoM excursions during human walking which effect is visible in
Figure 11 a. Analysis with three sine waves with different frequency (10Hz, 10.1Hz and 10.2Hz), in which the change (steps of 0.1Hz) represents human gait step time or cadence variability is shown inFigure 11b . - In use, to measure the variability of gait of a subject, the
IMU 10 is strapped to the subject, and the subject walks a short distance, for example around 10 meters. During this time the IMU calculates and stores the height data for each of the sample points. The data is then input from the IMU to thecomputer 20 which is arranged to select pairs of sample points as described above and to generate a data set associating the two heights for each pair of sample points, for example as simple height values, or as coordinates on a plot such as the non-linear plot ofFigure 5 . The computer is then arranged to control thedisplay screen 26 to display the non-linear plot of data points, each point having a position defined by the two height values of its respective pair of sample points. The computer is also arranged to calculate the best fit straight line, circle, and oval, as described above with reference toFigure 8 , and to display those superimposed on the plot of the data points as shown inFigure 11 . The values of β, SDA, SDB and ∀ are also calculated and displayed on the screen. The plot itself or the numerical values calculated, or both can then be used as measures of parameters of the gait of the subject. - From the above analysis it will be clear that the computer system can be arranged to analyse the data in various different ways whilst still providing a similar measurement of gait variability. For example instead of each pair or sample points which are plotted against each other being a fixed number of samples (and hence a fixed time) apart, the data can be divided into separate steps and the first point in the left leg step plotted against the first point in the right leg step, and subsequent pairs of point plotted against each other. Alternatively the data can be separated into left leg and right leg steps, and then the left leg step data combined to form a first sine wave and the right leg data combined to form a second sine wave, and then corresponding points in the two sine waves plotted against each other. In a further alternative, rather then comparing contralateral data, i.e. data from opposite legs, ipsilateral data comparison is made in which the data for one step of one leg is compared with data for a different step of the same leg. For example the data can be divided into left and right leg steps, each of which is combined together to form left and right leg plots each being an approximate sine wave over several steps. The left leg plot is then shifted so that each left leg step is compared with the previous left leg step, and the same is done for the right leg data.
- Data collected from participants suffering from Parkinson's disease were analysed, and data from aged matched typical developed adults were also analysed.
- A Parkinson's Disease Questionnaire (PDQ) was administered for people with PD before partaking in this study. Participants walked over a ten-metre walkway free of obstacles at their self selected walking speed. Participants started at a static position at the zero-point and came to a complete stop at the ten-metre line. The duration of the walk was recorded by a stopwatch. An IMU was placed over the projected CoM located over the fourth lumbar vertebrae, measuring at a sample frequency of 100Hz.
- IMU data was analysed by a program written in LabVIEW 8.5 (National Instruments, Ireland) to obtain vertical position. Temporal and spatial gait parameters were calculated according to Zijlstra's inverted pendulum model resulting in stride length and walking speed (vI). β, SDA, SDB and ∀ were derived by applying the non-linear method described above.
- TDA and PD group were compared using an independent t-test on stride length and walking speed as well as β, SDA and SDB. Furthermore a Pearson's regression test was used to test for a relationship between walking speed and β for both PD and TDA. ∀ was tested by an independent t-test between PD and TDA.
- Descriptive measurements are displayed in Table 1.
Table 1 descriptive measurements showing mean for Barthel Index (BI) and Parkinson's disease questionnaire (PDQ) for typical developed adults (TDA) and people with Parkinson's disease (PD) where an asterisk shows a significant difference between groups (p<0.05). Sex is indicated as the number of males (M) taking part. Diagnosis n Sex PDQ scores Age (years) Diagnosis (years) Stride Length (m) Speed (ms-1) Cadence (steps/min) TDA 10 M = 6 66.4 ± 4.4 1.31 ± 0.17 1.36 ± 0.33 *121.2 ± 5.6 PD 14M=9 26 range 43-664.5 ± 6.9 6.3 ± 3.9 1.29 ± 0.21 1.14 ± 0.24 *111.5 ± 11.6 - From the theoretical exploration of this non-linear analysis it became clear that β is affected by a change in step length, SDA is affected by a change in step frequency as well as step length, SDB is affected by a change in step frequency and ∀ is the ratio between SDA and SDB defined as SDA /SDB.
- An independent t-test showed no significant difference for stride length and cadence between TDA and PD participants (p=.615 and p=.342). However, a difference was found for walking speed (p=.041). Moreover an independent t-test between the TDA and PD group revealed a significant difference for β (p=.010) and SDA (p=.004). No difference was found between groups for SDB (p=.385) and ∀ (p=.830). Results for each group can be found in Table 2.
Table 2 Outcomes from non-linear method applied to gait in typical developed adults (TDA) and Parkinson's disease (PD) showing the angle (β) of the least square fit with SDA and SDB describing the standard deviations of the non-linear plot with ratio ∀. An asterisk indicates a significant difference between both groups. Diagnosis β SDA SDB ∀ TDA 42.0 ± 1.8 * 1.9 ± 0.5 * 0.4 ± 0.1 4.6 ± 3.9 PD 39.4 ± 3.9 * 2.5 ± 0.5 * 0.3 ± 0.1 7.8 ± 2.0 - No correlation was found between β and walking speed for PD (r2=.001 p=.996) or TDA (r2=.060 p=.810). Three representative analysis figures for each condition are shown in
Figure 12 . - This study found that a non-linear analysis performed on CoM motion can be used to differentiate PD from TDA collected using IMUs over a 10 metre walk, whereas standard spatiotemporal parameters over the same distance could not. These findings are important as they promote the possibility of utilizing a non-linear variability analysis to objectively quantify gait variability and symmetry over a small sample frame, thus allowing people with PD at all stages of the disease to be monitored.
- Previously, reduced step length has been reported as one of the key features of PD gait. Indeed, it has also been suggested that variability analysis may be used to closely monitor and describe gait disorders than measurements based on mean values of temporospatial walking parameters. The results of this study support this as, whilst there was no difference in step length, β and SDA showed a significant difference between TDA and PD. Thus PD could be differentiated from TDA based on CoM variability (
Figure 12 ). The significant difference in SDA may be due to increased step length variability reflected in CoM excursion. Although it should be noted that walking speed was significantly reduced for PD when compared to TDA, which has been reported previously. - Considering the novelty of this approach in exploring gait, a range of simulated CoM motions were modelled and run through the non-linear analysis in order to better understand the changes observed in PD. Group stride length variance observed in the data collected during this research, was 17cm for TDA and 21cm for PD during a 10 metre walk without step initiation. Assuming a constant leg length an increase in stride length of 17 and 21cm TDA and PD would increase the vertical CoM excursion by approximately 0.3 and 0.5cm. As shown in
Figure 11a the effect of a simulated increase in step length of these values would change the angle of the non-linear plot by 3 and 5 degrees respectively. But it is worth noticing that this diversion in angle will only occur for one gait cycle when the change in step length occurred. Once the CoM excursion is symmetric and in phase between left and right after the asymmetrical cycle, β will return to 45 degrees. Therefore it becomes visible that is influenced by a change in step length, SDB is affected by a change in step frequency, SDA is affected by both a change in step length as well as step frequency and ∀ is the ratio between the change in step frequency versus step length. - As seen in
Figure 11b an increase in frequency will enlarge SDB as measured over the 10 metre walk. An increase of 0.2Hz walking frequency represents an increase of 12 steps per minute. As seen in Table 1 cadence variance is 5.6 for TDA and 11.6 for PD. A larger change in frequency results in a greater variance of SDB. Perfect symmetry in lower limb stepping frequency causes the plots to assume a SDB equal to zero. Indeed, with variability in CoM excursions due to step length variability in combination with step frequency variability a phase shift is expected. As shown inFigure 9 phase shifts will change β, SDA and SDB. During this study, however, no phase shift was detected within either TDA or PD measurements. - Novel methods have often been used to look into gait in more depth. For example fractal dynamic analysis has been used in TDA and PD to explore stride-to-stride fluctuations. An increase in stride-to-stride variability both in stride length as step time has been observed in early and late stages of PD. Our findings are in agreement with these previous findings by showing an increase in stride length variability (SDA) as well as an increase in stride-to-stride symmetry (β) within a variety of PD. Despite a visual decrease in SDA and SDB in
Figure 12 , only SDA shows a significant difference between PD and TDA. This could be explained by the reduced stride length which has also been reported by PD research. Furthermore it is noticeable that the ratio ∀ does not show a significant difference between PD and TDA. This indicates that the symmetry variability (SDB) decreases by reducing stride length variability (SDA). - Thus embodiments of the present invention may provide a valuable measure for clinical use. Whilst the study described above was conducted for PD this method has the potential to indicate the severity of gait impairment in PD and other populations. The present invention can therefore provide a methodology that can assist in early diagnosis in people with PD and monitor their gait during deep brain stimulation. It may also be possible to use these gait parameters to more accurately monitor efficiency of medication in PD.
Claims (15)
- A system for measuring variation in the gait of a subject, the system comprising measuring means arranged to measure variations in vertical position of the subject while the subject takes a series of steps, processing means, and display means, wherein the processing means is arranged to identify a plurality of points in a first one of the steps and a plurality of points in a second one of the steps, to identify a plurality of pairs of the points, each pair comprising one point in each of the steps, to determine a value of height for each of the points in each of the pairs, and to control the display means to produce a display plotting the heights of the two points in each pair against each other.
- A system according to claim 1 wherein the processing means is arranged to identify the first and second steps as consecutive steps in the series.
- A system according to claim 1 or claim 2 wherein the processing means is arranged to identify each pair of points so that the time interval between the two points in each pair is the same.
- A system according to any foregoing claim wherein the processing means is arranged to identify a series of points through the series of steps and to include each of the series of points in one of the pairs.
- A system according to any foregoing claim wherein the processing means is arranged to define a coordinate system having two axes representing the heights of the two points in a pair, so that the heights of each pair of points can be represented by a position within the coordinate system, and the processing means is arranged to identify the positions in the coordinate system for each of the pairs of points, and to control the display so as to indicate those positions.
- A system according to claim 5 wherein the processing means is arranged to analyse the positions associated with the pairs of points and to calculate a parameter of the positions.
- A system according to claim 5 or claim 6 wherein the processing means is arranged to calculate the position of a line having a predetermined relationship to the positions associated with the pairs of the points, and to control the display to display the line.
- A method of measuring variation in the gait of a subject, the method including measuring variations in vertical position of the subject while the subject takes a series of steps, identifying a plurality of points in a first one of the steps and a plurality of points in a second one of the steps, identifying a plurality of pairs of the points, each pair comprising one point in each of the steps, determining a value of height for each of the points in each of the pairs, and producing a display plotting the heights of the two points in each pair against each other.
- A method according to claim 8 wherein the first and second steps are identified as consecutive steps in the series.
- A method according to claim 8 or claim 9 wherein the pairs of points are identified so that the time interval between the two points in each pair is the same.
- A method according to any of claims 8 to 10 including identifying a series of points through the series of steps and including each of the series of points in one of the pairs.
- A method according to any of claims 8 to 11 further comprising defining a coordinate system having two axes representing the heights of the two points in a pair, so that the heights of each pair of points can be represented by a position within the coordinate system, and identifying the positions in the coordinate system for each of the pairs of points, and controlling the display so as to indicate those positions.
- A method according to claim 11 or claim 12 comprising analysing the positions associated with the pairs of points and calculating a parameter of the positions, or including calculating the position of a line having a predetermined relationship to the positions associated with the pairs of points, and controlling the display to display the line.
- A system for measuring variation in the gait of a subject, the system comprising a memory arranged to store data recording variations in vertical position of the subject while the subject takes a series of steps, processing means, and display means, wherein the processing means is arranged to identify a plurality of points in a first one of the steps and a plurality of points in a second one of the steps, to identify a plurality of pairs of the points, each pair comprising one point in each of the steps, to determine a value of height for each of the points in each of the pairs, and to control the display means to produce a display plotting the heights of the two points in each pair against each other.
- A system according to claim 14 further comprising any one or more of the features of claims 2 to 7.
Applications Claiming Priority (2)
| Application Number | Priority Date | Filing Date | Title |
|---|---|---|---|
| GBGB1108952.1A GB201108952D0 (en) | 2011-05-27 | 2011-05-27 | Gait asymmetry measurement |
| PCT/GB2012/051181 WO2012164262A2 (en) | 2011-05-27 | 2012-05-25 | Gait asymmetry measurement |
Publications (2)
| Publication Number | Publication Date |
|---|---|
| EP2713874A2 EP2713874A2 (en) | 2014-04-09 |
| EP2713874B1 true EP2713874B1 (en) | 2015-04-29 |
Family
ID=44310512
Family Applications (1)
| Application Number | Title | Priority Date | Filing Date |
|---|---|---|---|
| EP20120792991 Not-in-force EP2713874B1 (en) | 2011-05-27 | 2012-05-25 | Gait asymmetry measurement |
Country Status (6)
| Country | Link |
|---|---|
| US (1) | US20140114214A1 (en) |
| EP (1) | EP2713874B1 (en) |
| JP (1) | JP2014520255A (en) |
| ES (1) | ES2540980T3 (en) |
| GB (2) | GB201108952D0 (en) |
| WO (1) | WO2012164262A2 (en) |
Families Citing this family (8)
| Publication number | Priority date | Publication date | Assignee | Title |
|---|---|---|---|---|
| CN105122006A (en) * | 2013-02-01 | 2015-12-02 | 可信定位股份有限公司 | Method and system for varying step length estimation using nonlinear system identification |
| JP6236820B2 (en) * | 2013-03-21 | 2017-11-29 | カシオ計算機株式会社 | Portable terminal device, step counting method, and step counting program |
| JP6369811B2 (en) * | 2014-11-27 | 2018-08-08 | パナソニックIpマネジメント株式会社 | Gait analysis system and gait analysis program |
| CA3156908C (en) * | 2015-01-06 | 2024-06-11 | David Burton | Mobile wearable monitoring systems |
| US20180235516A1 (en) * | 2017-02-17 | 2018-08-23 | Veristride Inc. | Method and System for Determining Step Length |
| CN110876613B (en) * | 2019-09-27 | 2022-07-22 | 深圳先进技术研究院 | Human motion state identification method and system and electronic equipment |
| CN111568436B (en) * | 2020-05-29 | 2023-01-17 | 常州大学 | A Gait Symmetry Evaluation Method Based on Regression Rotation Angle |
| EP4154811B1 (en) * | 2021-09-22 | 2024-10-23 | Industrial Technology Research Institute | Gait evaluating system |
Family Cites Families (5)
| Publication number | Priority date | Publication date | Assignee | Title |
|---|---|---|---|---|
| US7503900B2 (en) * | 2003-07-03 | 2009-03-17 | Honda Motor Co., Ltd. | Kinematic quantification of gait asymmetry based on bilateral cyclograms |
| WO2007112092A2 (en) * | 2006-03-24 | 2007-10-04 | Medtronic, Inc. | Collecting gait information for evaluation and control of therapy |
| JP2010005033A (en) * | 2008-06-25 | 2010-01-14 | Panasonic Electric Works Co Ltd | Walking motion analyzer |
| GB0820874D0 (en) * | 2008-11-14 | 2008-12-24 | Europ Technology For Business | Assessment of gait |
| GB2467514A (en) * | 2008-12-23 | 2010-08-04 | Univ Oxford Brookes | Gait monitor for sensing vertical displacement |
-
2011
- 2011-05-27 GB GBGB1108952.1A patent/GB201108952D0/en not_active Ceased
-
2012
- 2012-05-25 ES ES12792991.7T patent/ES2540980T3/en active Active
- 2012-05-25 WO PCT/GB2012/051181 patent/WO2012164262A2/en not_active Ceased
- 2012-05-25 EP EP20120792991 patent/EP2713874B1/en not_active Not-in-force
- 2012-05-25 JP JP2014511957A patent/JP2014520255A/en active Pending
- 2012-05-25 GB GB1320917.6A patent/GB2505794A/en not_active Withdrawn
- 2012-05-25 US US14/122,344 patent/US20140114214A1/en not_active Abandoned
Also Published As
| Publication number | Publication date |
|---|---|
| GB201108952D0 (en) | 2011-07-13 |
| WO2012164262A2 (en) | 2012-12-06 |
| US20140114214A1 (en) | 2014-04-24 |
| EP2713874A2 (en) | 2014-04-09 |
| JP2014520255A (en) | 2014-08-21 |
| ES2540980T3 (en) | 2015-07-15 |
| GB201320917D0 (en) | 2014-01-08 |
| GB2505794A (en) | 2014-03-12 |
| WO2012164262A3 (en) | 2014-01-23 |
Similar Documents
| Publication | Publication Date | Title |
|---|---|---|
| US20140114214A1 (en) | Gait asymmetry measurement | |
| Quijoux et al. | A review of center of pressure (COP) variables to quantify standing balance in elderly people: Algorithms and open‐access code | |
| Esser et al. | Insights into gait disorders: walking variability using phase plot analysis, Parkinson's disease | |
| Koop et al. | Quantifying turning behavior and gait in Parkinson’s disease using mobile technology | |
| Godfrey et al. | Instrumenting gait with an accelerometer: A system and algorithm examination | |
| Manor et al. | Smartphone app–based assessment of gait during normal and dual-task walking: demonstration of validity and reliability | |
| Horak et al. | Role of body-worn movement monitor technology for balance and gait rehabilitation | |
| Lyden et al. | Validity of two wearable monitors to estimate breaks from sedentary time | |
| Mancini et al. | ISway: a sensitive, valid and reliable measure of postural control | |
| Cavanaugh et al. | Detecting altered postural control after cerebral concussion in athletes with normal postural stability | |
| Ellery et al. | Physical activity assessment tools for use in overweight and obese children | |
| Ribeiro De Souza et al. | A public data set of videos, inertial measurement unit, and clinical scales of freezing of gait in individuals with parkinson's disease during a turning-in-place task | |
| Ha et al. | Vojta approach affects neck stability and static balance in sitting position of children with hypotonia | |
| Dafkin et al. | The accuracy of subjective clinical assessments of the patellar reflex | |
| US11304649B2 (en) | System and method for self-assessment of physical capabilities and condition changes | |
| Zimatore et al. | Detecting metabolic thresholds from nonlinear analysis of heart rate time series: a review | |
| Betteridge et al. | Objectifying clinical gait assessment: using a single-point wearable sensor to quantify the spatiotemporal gait metrics of people with lumbar spinal stenosis | |
| Piergiovanni et al. | Effects of metronome walking on long-term attractor divergence and correlation structure of gait: a validation study in older people | |
| Zhu et al. | Validating an iOS-based rhythmic auditory cueing evaluation (iRACE) for Parkinson's disease | |
| CN108542355A (en) | A kind of bore hole 3D display vision induction motion sickness appraisal procedure | |
| JP2025507607A (en) | Method and device for determining cognitive impairment | |
| Calcagni et al. | Smartphone postural sway and pronator drift tests as measures of neurological disability | |
| Tawaki et al. | Classification of older and fall-experienced subjects by postural sway data using mass spring damper model | |
| Alattas et al. | Detecting and minimizing bad posture using postuino among engineering students | |
| Chockalingam et al. | Evaluation of quantitative measurement techniques for head tremor with thalamic deep brain stimulation |
Legal Events
| Date | Code | Title | Description |
|---|---|---|---|
| PUAI | Public reference made under article 153(3) epc to a published international application that has entered the european phase |
Free format text: ORIGINAL CODE: 0009012 |
|
| 17P | Request for examination filed |
Effective date: 20131121 |
|
| AK | Designated contracting states |
Kind code of ref document: A2 Designated state(s): AL AT BE BG CH CY CZ DE DK EE ES FI FR GB GR HR HU IE IS IT LI LT LU LV MC MK MT NL NO PL PT RO RS SE SI SK SM TR |
|
| GRAP | Despatch of communication of intention to grant a patent |
Free format text: ORIGINAL CODE: EPIDOSNIGR1 |
|
| DAX | Request for extension of the european patent (deleted) | ||
| INTG | Intention to grant announced |
Effective date: 20141205 |
|
| GRAS | Grant fee paid |
Free format text: ORIGINAL CODE: EPIDOSNIGR3 |
|
| GRAA | (expected) grant |
Free format text: ORIGINAL CODE: 0009210 |
|
| AK | Designated contracting states |
Kind code of ref document: B1 Designated state(s): AL AT BE BG CH CY CZ DE DK EE ES FI FR GB GR HR HU IE IS IT LI LT LU LV MC MK MT NL NO PL PT RO RS SE SI SK SM TR |
|
| REG | Reference to a national code |
Ref country code: GB Ref legal event code: FG4D |
|
| REG | Reference to a national code |
Ref country code: CH Ref legal event code: EP |
|
| REG | Reference to a national code |
Ref country code: AT Ref legal event code: REF Ref document number: 723990 Country of ref document: AT Kind code of ref document: T Effective date: 20150515 |
|
| REG | Reference to a national code |
Ref country code: IE Ref legal event code: FG4D |
|
| REG | Reference to a national code |
Ref country code: DE Ref legal event code: R096 Ref document number: 602012007062 Country of ref document: DE Effective date: 20150611 |
|
| REG | Reference to a national code |
Ref country code: ES Ref legal event code: FG2A Ref document number: 2540980 Country of ref document: ES Kind code of ref document: T3 Effective date: 20150715 |
|
| REG | Reference to a national code |
Ref country code: SE Ref legal event code: TRGR |
|
| REG | Reference to a national code |
Ref country code: NL Ref legal event code: VDEP Effective date: 20150429 |
|
| REG | Reference to a national code |
Ref country code: AT Ref legal event code: MK05 Ref document number: 723990 Country of ref document: AT Kind code of ref document: T Effective date: 20150429 |
|
| REG | Reference to a national code |
Ref country code: LT Ref legal event code: MG4D |
|
| PG25 | Lapsed in a contracting state [announced via postgrant information from national office to epo] |
Ref country code: NL Free format text: LAPSE BECAUSE OF FAILURE TO SUBMIT A TRANSLATION OF THE DESCRIPTION OR TO PAY THE FEE WITHIN THE PRESCRIBED TIME-LIMIT Effective date: 20150429 |
|
| PG25 | Lapsed in a contracting state [announced via postgrant information from national office to epo] |
Ref country code: LT Free format text: LAPSE BECAUSE OF FAILURE TO SUBMIT A TRANSLATION OF THE DESCRIPTION OR TO PAY THE FEE WITHIN THE PRESCRIBED TIME-LIMIT Effective date: 20150429 Ref country code: NO Free format text: LAPSE BECAUSE OF FAILURE TO SUBMIT A TRANSLATION OF THE DESCRIPTION OR TO PAY THE FEE WITHIN THE PRESCRIBED TIME-LIMIT Effective date: 20150729 Ref country code: PT Free format text: LAPSE BECAUSE OF FAILURE TO SUBMIT A TRANSLATION OF THE DESCRIPTION OR TO PAY THE FEE WITHIN THE PRESCRIBED TIME-LIMIT Effective date: 20150831 Ref country code: FI Free format text: LAPSE BECAUSE OF FAILURE TO SUBMIT A TRANSLATION OF THE DESCRIPTION OR TO PAY THE FEE WITHIN THE PRESCRIBED TIME-LIMIT Effective date: 20150429 Ref country code: HR Free format text: LAPSE BECAUSE OF FAILURE TO SUBMIT A TRANSLATION OF THE DESCRIPTION OR TO PAY THE FEE WITHIN THE PRESCRIBED TIME-LIMIT Effective date: 20150429 |
|
| PG25 | Lapsed in a contracting state [announced via postgrant information from national office to epo] |
Ref country code: IS Free format text: LAPSE BECAUSE OF FAILURE TO SUBMIT A TRANSLATION OF THE DESCRIPTION OR TO PAY THE FEE WITHIN THE PRESCRIBED TIME-LIMIT Effective date: 20150829 Ref country code: RS Free format text: LAPSE BECAUSE OF FAILURE TO SUBMIT A TRANSLATION OF THE DESCRIPTION OR TO PAY THE FEE WITHIN THE PRESCRIBED TIME-LIMIT Effective date: 20150429 Ref country code: AT Free format text: LAPSE BECAUSE OF FAILURE TO SUBMIT A TRANSLATION OF THE DESCRIPTION OR TO PAY THE FEE WITHIN THE PRESCRIBED TIME-LIMIT Effective date: 20150429 Ref country code: GR Free format text: LAPSE BECAUSE OF FAILURE TO SUBMIT A TRANSLATION OF THE DESCRIPTION OR TO PAY THE FEE WITHIN THE PRESCRIBED TIME-LIMIT Effective date: 20150730 Ref country code: LV Free format text: LAPSE BECAUSE OF FAILURE TO SUBMIT A TRANSLATION OF THE DESCRIPTION OR TO PAY THE FEE WITHIN THE PRESCRIBED TIME-LIMIT Effective date: 20150429 |
|
| REG | Reference to a national code |
Ref country code: CH Ref legal event code: PL |
|
| PG25 | Lapsed in a contracting state [announced via postgrant information from national office to epo] |
Ref country code: LI Free format text: LAPSE BECAUSE OF NON-PAYMENT OF DUE FEES Effective date: 20150531 Ref country code: DK Free format text: LAPSE BECAUSE OF FAILURE TO SUBMIT A TRANSLATION OF THE DESCRIPTION OR TO PAY THE FEE WITHIN THE PRESCRIBED TIME-LIMIT Effective date: 20150429 Ref country code: CH Free format text: LAPSE BECAUSE OF NON-PAYMENT OF DUE FEES Effective date: 20150531 Ref country code: MC Free format text: LAPSE BECAUSE OF FAILURE TO SUBMIT A TRANSLATION OF THE DESCRIPTION OR TO PAY THE FEE WITHIN THE PRESCRIBED TIME-LIMIT Effective date: 20150429 Ref country code: EE Free format text: LAPSE BECAUSE OF FAILURE TO SUBMIT A TRANSLATION OF THE DESCRIPTION OR TO PAY THE FEE WITHIN THE PRESCRIBED TIME-LIMIT Effective date: 20150429 |
|
| REG | Reference to a national code |
Ref country code: DE Ref legal event code: R097 Ref document number: 602012007062 Country of ref document: DE |
|
| REG | Reference to a national code |
Ref country code: IE Ref legal event code: MM4A |
|
| PG25 | Lapsed in a contracting state [announced via postgrant information from national office to epo] |
Ref country code: CZ Free format text: LAPSE BECAUSE OF FAILURE TO SUBMIT A TRANSLATION OF THE DESCRIPTION OR TO PAY THE FEE WITHIN THE PRESCRIBED TIME-LIMIT Effective date: 20150429 Ref country code: PL Free format text: LAPSE BECAUSE OF FAILURE TO SUBMIT A TRANSLATION OF THE DESCRIPTION OR TO PAY THE FEE WITHIN THE PRESCRIBED TIME-LIMIT Effective date: 20150429 Ref country code: RO Free format text: LAPSE BECAUSE OF NON-PAYMENT OF DUE FEES Effective date: 20150429 Ref country code: SK Free format text: LAPSE BECAUSE OF FAILURE TO SUBMIT A TRANSLATION OF THE DESCRIPTION OR TO PAY THE FEE WITHIN THE PRESCRIBED TIME-LIMIT Effective date: 20150429 |
|
| PLBE | No opposition filed within time limit |
Free format text: ORIGINAL CODE: 0009261 |
|
| STAA | Information on the status of an ep patent application or granted ep patent |
Free format text: STATUS: NO OPPOSITION FILED WITHIN TIME LIMIT |
|
| 26N | No opposition filed |
Effective date: 20160201 |
|
| PG25 | Lapsed in a contracting state [announced via postgrant information from national office to epo] |
Ref country code: IE Free format text: LAPSE BECAUSE OF NON-PAYMENT OF DUE FEES Effective date: 20150525 |
|
| REG | Reference to a national code |
Ref country code: FR Ref legal event code: PLFP Year of fee payment: 5 |
|
| PG25 | Lapsed in a contracting state [announced via postgrant information from national office to epo] |
Ref country code: SI Free format text: LAPSE BECAUSE OF FAILURE TO SUBMIT A TRANSLATION OF THE DESCRIPTION OR TO PAY THE FEE WITHIN THE PRESCRIBED TIME-LIMIT Effective date: 20150429 |
|
| PGFP | Annual fee paid to national office [announced via postgrant information from national office to epo] |
Ref country code: ES Payment date: 20160520 Year of fee payment: 5 Ref country code: GB Payment date: 20160526 Year of fee payment: 5 |
|
| PG25 | Lapsed in a contracting state [announced via postgrant information from national office to epo] |
Ref country code: BE Free format text: LAPSE BECAUSE OF FAILURE TO SUBMIT A TRANSLATION OF THE DESCRIPTION OR TO PAY THE FEE WITHIN THE PRESCRIBED TIME-LIMIT Effective date: 20150429 |
|
| PGFP | Annual fee paid to national office [announced via postgrant information from national office to epo] |
Ref country code: IT Payment date: 20160525 Year of fee payment: 5 Ref country code: FR Payment date: 20160530 Year of fee payment: 5 Ref country code: SE Payment date: 20160525 Year of fee payment: 5 |
|
| PGFP | Annual fee paid to national office [announced via postgrant information from national office to epo] |
Ref country code: DE Payment date: 20160801 Year of fee payment: 5 |
|
| PG25 | Lapsed in a contracting state [announced via postgrant information from national office to epo] |
Ref country code: MT Free format text: LAPSE BECAUSE OF FAILURE TO SUBMIT A TRANSLATION OF THE DESCRIPTION OR TO PAY THE FEE WITHIN THE PRESCRIBED TIME-LIMIT Effective date: 20150429 |
|
| PG25 | Lapsed in a contracting state [announced via postgrant information from national office to epo] |
Ref country code: SM Free format text: LAPSE BECAUSE OF FAILURE TO SUBMIT A TRANSLATION OF THE DESCRIPTION OR TO PAY THE FEE WITHIN THE PRESCRIBED TIME-LIMIT Effective date: 20150429 Ref country code: BG Free format text: LAPSE BECAUSE OF FAILURE TO SUBMIT A TRANSLATION OF THE DESCRIPTION OR TO PAY THE FEE WITHIN THE PRESCRIBED TIME-LIMIT Effective date: 20150429 Ref country code: HU Free format text: LAPSE BECAUSE OF FAILURE TO SUBMIT A TRANSLATION OF THE DESCRIPTION OR TO PAY THE FEE WITHIN THE PRESCRIBED TIME-LIMIT; INVALID AB INITIO Effective date: 20120525 |
|
| PG25 | Lapsed in a contracting state [announced via postgrant information from national office to epo] |
Ref country code: CY Free format text: LAPSE BECAUSE OF FAILURE TO SUBMIT A TRANSLATION OF THE DESCRIPTION OR TO PAY THE FEE WITHIN THE PRESCRIBED TIME-LIMIT Effective date: 20150429 |
|
| PG25 | Lapsed in a contracting state [announced via postgrant information from national office to epo] |
Ref country code: TR Free format text: LAPSE BECAUSE OF FAILURE TO SUBMIT A TRANSLATION OF THE DESCRIPTION OR TO PAY THE FEE WITHIN THE PRESCRIBED TIME-LIMIT Effective date: 20150429 |
|
| PG25 | Lapsed in a contracting state [announced via postgrant information from national office to epo] |
Ref country code: LU Free format text: LAPSE BECAUSE OF NON-PAYMENT OF DUE FEES Effective date: 20150525 |
|
| REG | Reference to a national code |
Ref country code: DE Ref legal event code: R119 Ref document number: 602012007062 Country of ref document: DE |
|
| REG | Reference to a national code |
Ref country code: SE Ref legal event code: EUG |
|
| GBPC | Gb: european patent ceased through non-payment of renewal fee |
Effective date: 20170525 |
|
| PG25 | Lapsed in a contracting state [announced via postgrant information from national office to epo] |
Ref country code: SE Free format text: LAPSE BECAUSE OF NON-PAYMENT OF DUE FEES Effective date: 20170526 |
|
| REG | Reference to a national code |
Ref country code: FR Ref legal event code: ST Effective date: 20180131 |
|
| PG25 | Lapsed in a contracting state [announced via postgrant information from national office to epo] |
Ref country code: GB Free format text: LAPSE BECAUSE OF NON-PAYMENT OF DUE FEES Effective date: 20170525 Ref country code: DE Free format text: LAPSE BECAUSE OF NON-PAYMENT OF DUE FEES Effective date: 20171201 |
|
| PG25 | Lapsed in a contracting state [announced via postgrant information from national office to epo] |
Ref country code: FR Free format text: LAPSE BECAUSE OF NON-PAYMENT OF DUE FEES Effective date: 20170531 Ref country code: IT Free format text: LAPSE BECAUSE OF NON-PAYMENT OF DUE FEES Effective date: 20170525 |
|
| PG25 | Lapsed in a contracting state [announced via postgrant information from national office to epo] |
Ref country code: MK Free format text: LAPSE BECAUSE OF FAILURE TO SUBMIT A TRANSLATION OF THE DESCRIPTION OR TO PAY THE FEE WITHIN THE PRESCRIBED TIME-LIMIT Effective date: 20150429 |
|
| REG | Reference to a national code |
Ref country code: ES Ref legal event code: FD2A Effective date: 20180629 |
|
| PG25 | Lapsed in a contracting state [announced via postgrant information from national office to epo] |
Ref country code: ES Free format text: LAPSE BECAUSE OF NON-PAYMENT OF DUE FEES Effective date: 20170526 |
|
| PG25 | Lapsed in a contracting state [announced via postgrant information from national office to epo] |
Ref country code: AL Free format text: LAPSE BECAUSE OF FAILURE TO SUBMIT A TRANSLATION OF THE DESCRIPTION OR TO PAY THE FEE WITHIN THE PRESCRIBED TIME-LIMIT Effective date: 20150429 |