EP2704745B1 - Methods of developing a prognosis for pancreatic cancer and predicting responsiveness to cancer therapeutics - Google Patents
Methods of developing a prognosis for pancreatic cancer and predicting responsiveness to cancer therapeutics Download PDFInfo
- Publication number
- EP2704745B1 EP2704745B1 EP12779776.9A EP12779776A EP2704745B1 EP 2704745 B1 EP2704745 B1 EP 2704745B1 EP 12779776 A EP12779776 A EP 12779776A EP 2704745 B1 EP2704745 B1 EP 2704745B1
- Authority
- EP
- European Patent Office
- Prior art keywords
- vegf
- cancer
- targeting agent
- expression level
- responsiveness
- Prior art date
- Legal status (The legal status is an assumption and is not a legal conclusion. Google has not performed a legal analysis and makes no representation as to the accuracy of the status listed.)
- Not-in-force
Links
Images


Classifications
-
- G—PHYSICS
- G01—MEASURING; TESTING
- G01N—INVESTIGATING OR ANALYSING MATERIALS BY DETERMINING THEIR CHEMICAL OR PHYSICAL PROPERTIES
- G01N33/00—Investigating or analysing materials by specific methods not covered by groups G01N1/00 - G01N31/00
- G01N33/48—Biological material, e.g. blood, urine; Haemocytometers
- G01N33/50—Chemical analysis of biological material, e.g. blood, urine; Testing involving biospecific ligand binding methods; Immunological testing
- G01N33/53—Immunoassay; Biospecific binding assay; Materials therefor
- G01N33/574—Immunoassay; Biospecific binding assay; Materials therefor for cancer
- G01N33/57407—Specifically defined cancers
- G01N33/57438—Specifically defined cancers of liver, pancreas or kidney
-
- A—HUMAN NECESSITIES
- A61—MEDICAL OR VETERINARY SCIENCE; HYGIENE
- A61K—PREPARATIONS FOR MEDICAL, DENTAL OR TOILETRY PURPOSES
- A61K31/00—Medicinal preparations containing organic active ingredients
- A61K31/70—Carbohydrates; Sugars; Derivatives thereof
- A61K31/7042—Compounds having saccharide radicals and heterocyclic rings
- A61K31/7052—Compounds having saccharide radicals and heterocyclic rings having nitrogen as a ring hetero atom, e.g. nucleosides, nucleotides
- A61K31/706—Compounds having saccharide radicals and heterocyclic rings having nitrogen as a ring hetero atom, e.g. nucleosides, nucleotides containing six-membered rings with nitrogen as a ring hetero atom
- A61K31/7064—Compounds having saccharide radicals and heterocyclic rings having nitrogen as a ring hetero atom, e.g. nucleosides, nucleotides containing six-membered rings with nitrogen as a ring hetero atom containing condensed or non-condensed pyrimidines
- A61K31/7068—Compounds having saccharide radicals and heterocyclic rings having nitrogen as a ring hetero atom, e.g. nucleosides, nucleotides containing six-membered rings with nitrogen as a ring hetero atom containing condensed or non-condensed pyrimidines having oxo groups directly attached to the pyrimidine ring, e.g. cytidine, cytidylic acid
-
- A—HUMAN NECESSITIES
- A61—MEDICAL OR VETERINARY SCIENCE; HYGIENE
- A61K—PREPARATIONS FOR MEDICAL, DENTAL OR TOILETRY PURPOSES
- A61K39/00—Medicinal preparations containing antigens or antibodies
- A61K39/395—Antibodies; Immunoglobulins; Immune serum, e.g. antilymphocytic serum
- A61K39/39533—Antibodies; Immunoglobulins; Immune serum, e.g. antilymphocytic serum against materials from animals
- A61K39/39558—Antibodies; Immunoglobulins; Immune serum, e.g. antilymphocytic serum against materials from animals against tumor tissues, cells, antigens
-
- C—CHEMISTRY; METALLURGY
- C07—ORGANIC CHEMISTRY
- C07K—PEPTIDES
- C07K16/00—Immunoglobulins [IGs], e.g. monoclonal or polyclonal antibodies
- C07K16/18—Immunoglobulins [IGs], e.g. monoclonal or polyclonal antibodies against material from animals or humans
- C07K16/22—Immunoglobulins [IGs], e.g. monoclonal or polyclonal antibodies against material from animals or humans against growth factors ; against growth regulators
-
- C—CHEMISTRY; METALLURGY
- C12—BIOCHEMISTRY; BEER; SPIRITS; WINE; VINEGAR; MICROBIOLOGY; ENZYMOLOGY; MUTATION OR GENETIC ENGINEERING
- C12Q—MEASURING OR TESTING PROCESSES INVOLVING ENZYMES, NUCLEIC ACIDS OR MICROORGANISMS; COMPOSITIONS OR TEST PAPERS THEREFOR; PROCESSES OF PREPARING SUCH COMPOSITIONS; CONDITION-RESPONSIVE CONTROL IN MICROBIOLOGICAL OR ENZYMOLOGICAL PROCESSES
- C12Q1/00—Measuring or testing processes involving enzymes, nucleic acids or microorganisms; Compositions therefor; Processes of preparing such compositions
- C12Q1/68—Measuring or testing processes involving enzymes, nucleic acids or microorganisms; Compositions therefor; Processes of preparing such compositions involving nucleic acids
- C12Q1/6876—Nucleic acid products used in the analysis of nucleic acids, e.g. primers or probes
- C12Q1/6883—Nucleic acid products used in the analysis of nucleic acids, e.g. primers or probes for diseases caused by alterations of genetic material
- C12Q1/6886—Nucleic acid products used in the analysis of nucleic acids, e.g. primers or probes for diseases caused by alterations of genetic material for cancer
-
- A—HUMAN NECESSITIES
- A61—MEDICAL OR VETERINARY SCIENCE; HYGIENE
- A61K—PREPARATIONS FOR MEDICAL, DENTAL OR TOILETRY PURPOSES
- A61K39/00—Medicinal preparations containing antigens or antibodies
- A61K2039/505—Medicinal preparations containing antigens or antibodies comprising antibodies
-
- C—CHEMISTRY; METALLURGY
- C12—BIOCHEMISTRY; BEER; SPIRITS; WINE; VINEGAR; MICROBIOLOGY; ENZYMOLOGY; MUTATION OR GENETIC ENGINEERING
- C12Q—MEASURING OR TESTING PROCESSES INVOLVING ENZYMES, NUCLEIC ACIDS OR MICROORGANISMS; COMPOSITIONS OR TEST PAPERS THEREFOR; PROCESSES OF PREPARING SUCH COMPOSITIONS; CONDITION-RESPONSIVE CONTROL IN MICROBIOLOGICAL OR ENZYMOLOGICAL PROCESSES
- C12Q2600/00—Oligonucleotides characterized by their use
- C12Q2600/106—Pharmacogenomics, i.e. genetic variability in individual responses to drugs and drug metabolism
-
- C—CHEMISTRY; METALLURGY
- C12—BIOCHEMISTRY; BEER; SPIRITS; WINE; VINEGAR; MICROBIOLOGY; ENZYMOLOGY; MUTATION OR GENETIC ENGINEERING
- C12Q—MEASURING OR TESTING PROCESSES INVOLVING ENZYMES, NUCLEIC ACIDS OR MICROORGANISMS; COMPOSITIONS OR TEST PAPERS THEREFOR; PROCESSES OF PREPARING SUCH COMPOSITIONS; CONDITION-RESPONSIVE CONTROL IN MICROBIOLOGICAL OR ENZYMOLOGICAL PROCESSES
- C12Q2600/00—Oligonucleotides characterized by their use
- C12Q2600/158—Expression markers
-
- G—PHYSICS
- G01—MEASURING; TESTING
- G01N—INVESTIGATING OR ANALYSING MATERIALS BY DETERMINING THEIR CHEMICAL OR PHYSICAL PROPERTIES
- G01N2333/00—Assays involving biological materials from specific organisms or of a specific nature
- G01N2333/435—Assays involving biological materials from specific organisms or of a specific nature from animals; from humans
- G01N2333/475—Assays involving growth factors
- G01N2333/485—Epidermal growth factor [EGF] (urogastrone)
Definitions
- pancreatic cancer is one of the leading causes of cancer related death worldwide.
- the clinical hallmarks of pancreatic cancer include marked desmoplasia, early metastases, cachexia, and hypercoagulability.
- the pathophysiology underlying these conditions has been associated with multiple factors associated with tumor angiogenesis and inflammation. While many angiogenic and inflammatory makers have been profiled in pancreatic cancer, these analyses have typically been limited by the size and quality of the available datasets, and by the technical limitations of standard assay ELISA methods, which significantly limited the number of factors that could be evaluated in a given sample. Having biomarkers or sets of biomarkers that can provide pancreatic cancer patients with a more accurate prognosis and predictions regarding the responsiveness to cancer therapies would be helpful to patients and to society.
- a cancer therapy including a VEGF targeting agent, methods of developing a prognosis for a subject diagnosed with pancreatic cancer, and methods of developing treatment plans for subjects with cancer.
- the invention is defined in the claims.
- methods of predicting responsiveness of a cancer in a subject to a cancer therapy including a VEGF targeting agent include determining the expression level of Ang-2 in a sample from the subject.
- the method may further comprise determining the expression level of at least one additional biomarker selected from SDF-1 and VEGF-D.
- the levels of the biomarkers are then compared to a reference level of the biomarker and the comparison is used to predict the responsiveness of the cancer to treatment with the cancer therapy including a VEGF targeting agent.
- the levels of VEGF-D are determined to be low (i.e. less than 1050 pg/mL)
- treatment with a cancer therapy including a VEGF targeting agent is predicted to be beneficial.
- VEGF-D if the levels of VEGF-D are determined to be in the mid- to high range (i.e. more than 1100 pg/mL), then treatment with a cancer therapy including a VEGF targeting agent is not predicted to be beneficial.
- the levels of ANG-2 and SDF-1 are low (i.e. 305 pg/mL and 1100 pg/mL, respectively), then treatment with a cancer therapy including a VEGF targeting agent is not predicted to be beneficial.
- the levels of SDF-1 are high (i.e. more than 1100 pg/mL) and the levels of OPN are low (i.e. less than 75 ng/mL), then treatment with a cancer therapy including a VEGF targeting agent is predicted to be beneficial.
- methods of developing treatment plans for subjects with cancer are provided.
- the prediction of the responsiveness of the cancer to treatment with a cancer therapy including a VEGF targeting agent is used to select a cancer therapy including a VEGF targeting agent if the cancer is predicted to respond to an anti-VEGF therapy.
- a prediction suggesting that a VEGF targeting agent will not be effective or will be counter-productive will result in development of a treatment plan excluding a VEGF targeting agent.
- methods of developing a prognosis for a subject diagnosed with pancreatic cancer include determining an expression level of IGFBP-1, PDGF-AA and at least one of IL-6 and CRP in a sample from the subject. The levels of the biomarkers are then compared to reference levels. Finally the comparison is used to determine a survival prognosis for the subject. In one embodiment, if the levels of IGFBP-1, PDGF-AA and IL-6 are low (i.e. less than 13,500 pg/ mL, 250 pg/mL and 20 pg/mL, respectively), then the survival prognosis is more than 6 months.
- the survival prognosis is more than 6 months.
- the levels of IGFBP-1, PDGF-AA and CRP are low (i.e. less than 13,500 pg/ mL, 250 pg/mL and 21,000 ng/mL, respectively)
- the survival prognosis is more than 6 months.
- the levels of PAI-1 total and PEDF are also determined to be low (i.e. less than 28,000 pg/mL and 3,600 ng/mL, respectively) then the survival prognosis is more than 6 months.
- Articles "a” and “an” are used herein to refer to one or to more than one (i.e. at least one) of the grammatical object of the article.
- an element means at least one element and can include more than one element.
- Methods of predicting responsiveness of a cancer in a subject to a cancer therapy including a VEGF targeting agent, methods of developing a prognosis for a subject diagnosed with pancreatic cancer, and methods of developing treatment plans for subjects with cancer are provided herein.
- the methods all rely on detecting or determining the expression level of at least one biomarker or combinations of biomarkers in a sample from a subject diagnosed with cancer.
- the cancer is a solid tumor.
- the present methods permit the personalization of therapy amongst cancer patients, wherein a subject's biomarker profile is predictive of, or indicative of, treatment efficacy and or survival.
- the methods disclosed herein can be used in combination with assessment of conventional clinical factors, such as tumor size, tumor grade, lymph node status, family history, and analysis of expression level of additional biomarkers. In this manner, the methods of the present disclosure permit a more accurate evaluation of prognosis and cancer therapy effectiveness.
- the method includes determining the expression levels of the proteins or the RNA transcripts for the biomarkers provided herein in Tables 5-13 in a sample from a patient with cancer.
- Biomarker expression in some instances may be normalized against the expression levels of all proteins or RNA transcripts in the sample, or against a reference set of proteins or RNA transcripts in the sample.
- the level of expression of the biomarkers is indicative of the prognosis for the subject or predictive of the effectiveness of a particular treatment.
- the methods of the present disclosure can also be used to assist in selecting appropriate courses of treatment and to identify patients that would benefit from a particular course of therapy.
- the expression of the particular biomarkers described herein provides insight into which cancer treatment regimens will be most effective for the patient. This information can be used to generate treatment plans for the patient to prolong survival and minimize side effects or cancer therapy related toxicity.
- prognostic performance of the biomarkers and/or other clinical parameters was assessed utilizing a Cox Proportional Hazards Model Analysis, which is a regression method for survival data that provides an estimate of the hazard ratio and its confidence interval.
- the Cox model is a well-recognized statistical technique for exploring the relationship between the survival of a patient and particular variables. This statistical method permits estimation of the hazard (i.e., risk) of individuals given their prognostic variables (e.g., expression level of particular biomarkers, as described herein). Survival data are commonly presented as Kaplan-Meier curves or plots.
- the "hazard ratio" is the risk of death at any given time point for patients displaying particular prognostic variables.
- the term “subject” and “patient” are used interchangeably and refer to both human and non-human animals.
- the term “non-human animals” of the disclosure includes all vertebrates, e.g., mammals and non-mammals, such as nonhuman primates, sheep, dog, cat, horse, cow, chickens, amphibians, reptiles, and the like.
- the subject is a human patient. More preferably, the subject is a human patient diagnosed with cancer or undergoing, or about to undergo, a cancer treatment regimen.
- the biomarkers of the present disclosure include proteins and genes encoding the proteins.
- the biomarkers analyzed are provided in Table 1 along with an indication of the commonly used abbreviations for each marker.
- Such biomarkers include DNA comprising the entire or partial sequence of the nucleic acid sequence encoding the biomarker, or the complement of such a sequence.
- the biomarker nucleic acids also include RNA comprising the entire or partial sequence of the nucleic acid sequences encoding the proteins of interest.
- a biomarker protein comprises the entire or partial amino acid sequence of any of the biomarker proteins or polypeptides. Table 1.
- fragments and variants of biomarker genes and proteins are also encompassed by the present invention.
- fragment is intended a portion of the polynucleotide or a portion of the amino acid sequence and hence protein encoded thereby.
- Polynucleotides that are fragments of a biomarker nucleotide sequence generally comprise at least 10, 15, 20, 50, 75, 100, 150, 200, 250, 300, 350, 400, 450, 500, 550, 600, 650, 700, 800, 900, 1,000, 1,200, or 1,500 contiguous nucleotides, or up to the number of nucleotides present in a full-length biomarker polynucleotide disclosed herein.
- a fragment of a biomarker polynucleotide will generally encode at least 15, 25, 30, 50, 100, 150, 200, or 250 contiguous amino acids, or up to the total number of amino acids present in a full-length biomarker protein of the invention.
- "Variant” is intended to mean substantially similar sequences. Generally, variants of a particular biomarker of the invention will have at least about 40%, 45%, 50%, 55%, 60%, 65%, 70%, 75%, 80%, 85%, 90%, 91%, 92%, 93%, 94%, 95%, 96%, 97%, 98%, 99% or more sequence identity to that biomarker as determined by sequence alignment programs.
- a “biomarker” is a gene or protein whose level of expression in a sample is altered compared to that of a normal or healthy sample or is indicative of a condition.
- the biomarkers disclosed herein are genes and proteins whose expression level correlates with cancer, particularly pancreatic cancer, prognosis or responsiveness of the cancer to a cancer therapy including a VEGF targeting agent.
- the methods for predicting or prognosticating a cancer therapy in a subject includes collecting a patient body sample.
- the sample may or may not include cells.
- the methods described herein may be performed without requiring a tissue sample or biopsy and need not contain any cancer cells.
- plasma was used.
- Sample is intended to include any sampling of cells, tissues, or bodily fluids in which expression of a biomarker can be detected. Examples of such samples include, but are not limited to, biopsies, smears, blood, lymph, urine, saliva, or any other bodily secretion or derivative thereof.
- Blood can include whole blood, plasma (citrate, EDTA, heparin), serum, or any derivative of blood. Samples may be obtained from a patient by a variety of techniques available to those skilled in the art. Methods for collecting various samples are well known in the art.
- detecting expression of biomarkers can be detected on a nucleic acid level (e.g., as an RNA transcript) or a protein level.
- detecting or determining expression is intended determining the quantity or presence of a protein or its RNA transcript for at least one of the biomarkers of Table 1.
- detecting expression encompasses instances where a biomarker is determined not to be expressed, not to be detectably expressed, expressed at a low level, expressed at a normal level, or overexpressed.
- Methods suitable for detecting or determining the expression levels of biomarkers include, but are not limited to, ELISA, immunofluorescence, FACS analysis, Western blot, magnetic immunoassays, and both antibody-based microarrays and non-antibody-based microarrays.
- ELISA immunofluorescence
- FACS analysis Western blot
- magnetic immunoassays and both antibody-based microarrays and non-antibody-based microarrays.
- the gold standard for detection of growth factors and cytokines in blood was the use of ELISAs; however, multiplex technology offers an attractive alternative approach for cytokine and growth factor analysis.
- the advantages of multiplex technology compared to traditional ELISA assays are conservation of patient sample, increased sensitivity, and significant savings in cost, time and labor.
- Luminex bead-based systems are the most established, being used to detect circulating cytokines and growth factors in both mice and humans. This method is based on the use of microparticles that have been precoated with specific antibodies. These particles are then mixed with sample and the captured analytes are detected using specific secondary antibodies. This allows for up to 100 different analytes to be measured simultaneously in a single microplate well.
- the advantages of this flow cytometry-based method compared to traditional ELISA assays are in the conservation of patient samples as well as significant savings in terms of cost and labor.
- An alternative, plate-based system is produced by Meso Scale Discovery (MSD).
- This system utilizes its proprietary Multi-Array® and Multi-Spot® microplates with electrodes directly integrated into the plates. This enables the MSD system to have ultra-sensitive detection limits, high specificity, and low background signal.
- Another plate-based multiplex system is the SearchLight Plus CCD Imaging System produced by Aushon Biosystems. This novel multiplexing technology allows for the measurement of up to 16 different analytes simultaneously in a single microplate well.
- the assay design is similar to a sandwich ELISA where the capture antibodies are pre-spotted into individual wells of a 96-well plate. Samples or standards are added which bind to the specific capture antibodies and are detected using Aushon's patented SuperSignal ELISA Femto Chemiluminescent Substrate.
- Methods for detecting expression of the biomarkers described herein are not limited to protein expression.
- Gene expression profiling including methods based on hybridization analysis of polynucleotides, methods based on sequencing of polynucleotides, immunohistochemistry methods, and proteomics-based methods may also be used.
- the most commonly used methods known in the art for the quantification of mRNA expression in a sample include northern blotting and in situ hybridization ( Parker and Barnes, Methods Mol. Biol.
- RNAse protection assays Hod, Biotechniques 13:852-54, 1992
- PCR-based methods such as reverse transcription PCR(RT-PCR) ( Weis et al., TIG 8:263-64, 1992 ), and array-based methods ( Schena et al., Science 270:467-70, 1995 ).
- antibodies may be employed that can recognize specific duplexes, including DNA duplexes, RNA duplexes, and DNA-RNA hybrid duplexes, or DNA-protein duplexes.
- Representative methods for sequencing-based gene expression analysis include Serial Analysis of Gene Expression (SAGE) and gene expression analysis by massively parallel signature sequencing.
- probe refers to any molecule that is capable of selectively binding to a specifically intended target biomolecule, for example, a nucleotide transcript or a protein encoded by or corresponding to a biomarker. Probes can be synthesized by one of skill in the art, or derived from appropriate biological preparations. Probes may be specifically designed to be labeled. Examples of molecules that can be utilized as probes include, but are not limited to, RNA, DNA, proteins, antibodies, and organic molecules.
- predicting responsiveness refers to providing a probability based analysis of how a particular subject will respond to a cancer therapy.
- the prediction of responsiveness is not a guarantee or absolute, only a statistically probable indication of the responsiveness of the subject.
- the prediction of responsiveness to a cancer therapy including a VEGF targeting agent may indicate that the subject is likely to be responsive to a cancer therapy including a VEGF targeting agent or alternatively may indicate that the subject is not likely to be responsive to a cancer therapy including a VEGF targeting agent.
- the prediction may indicate that inclusion of a VEGF targeting agent in a cancer therapy regime may be counter-productive and lead to a worse result for the subject than if no therapy was used or a placebo was used.
- Responsiveness includes but is not limited to, any measure of a likelihood of clinical benefit.
- clinical benefits include an increase in overall survival, an increase in progression free survival, an increase in time to progression, increased tumor response, decreased symptoms, or other quality of life benefits.
- a VEGF targeting agent includes any therapeutic agent targeting VEGF family members or any member of the VEGF receptor class of proteins.
- antibodies specific for VEGF particularly VEGF-A, antibody-conjugated or other bioreagents capable of blocking VEGF mediated signaling, such as VEGF-R binding or competitive inhibitors, small molecules, aptamers, iRNAs, and other non-antibody-based therapeutic reagents.
- Anti-VEGF agents that are currently FDA approved include bevacizumab (AvastinTM), sunitinib (SutentTM), sorafenib (NexavarTM), pazopanib (VotrientTM), ranibizumab (LucentisTM), pegaptanib (MacugenTM) and Axitinib (InlyteTM).
- Bevacizumab is a monoclonal antibody against VEGF that is FDA approved for the treatment of metastatic colorectal cancer, lung cancer, , renal cell cancer, and glioblastoma.
- Sunitinib is a small molecule tyrosine kinase inhibitor that blocks VEGF, PDGF, and cKIT receptors; sunitinib is FDA approved for the treatment of renal cell carcinoma and GI Stromal tumors (GIST). Sorafenib is a small molecule tyrosine kinase inhibitor that blocks VEGF, PDGF, and cKIT receptors as well as the oncogene Raf; sorafenib is FDA approved for the treatment of renal cell carcinoma and hepatocellular carcinoma.
- Pazopanib is a small molecule tyrosine kinase inhibitor that blocks VEGF, PDGF, and cKIT receptors; pazopanib is FDA approved for the treatment of renal cell carcinoma.
- Ranibizumab (LucentisTM) is a Fab fragment antibody that binds VEGF; ranibizumab is FDA approved for the treatment neovascular (wet) age related macular degeneration (AMD).
- Pegaptanib (MacugenTM) is a pegylated RNA aptamer that FDA approved for the treatment neovascular (wet) age related macular degeneration (AMD).
- Axitinib (InlyteTM) is a small molecule tyrosine kinase inhibitor capable of inhibiting VEGFR1, VEGFR2, VEGFR3, PDGFR and cKIT that is FDA approved for treatment of renal cell carcinoma. Multiple other VEGF and other angiogenesis inhibitors are in various stages of clinical development.
- the VEGF targeting agents may be used in combination with other cancer therapeutics in a cancer therapy regimen. Combination therapy does not require that multiple cancer therapeutics be administered simultaneously, but only that the subjects are treated with more than one therapeutic agent during a time span, such as one month, two months or more.
- the VEGF targeting agent may be used in combination with DNA synthesis or DNA repair inhibitors such as nucleoside analogs.
- gemcitabine was used, but those of skill in the art will appreciate that a wide variety of cancer therapeutic agents are available and that such agents are often used in combination such that a DNA synthesis inhibitor and other classes of anticancer agents, including but not limited to, other DNA damaging agents, anti-metabolites, hormonal therapies, and signal transduction inhibitors, is combined with a VEGF targeting agent in a cancer therapy.
- the patients were treated with gemcitabine + placebo or gemcitabine + bevacizumab.
- the cancer may be selected from any cancer in which a VEGF targeting agent is being considered for therapeutic purposes.
- the cancer may be a solid tumor.
- Cancers for which predictions may be made include but are not limited to pancreatic, colorectal, liver, esophageal, gastric, small bowel, cholangiocarcinoma, lung, head and neck, thyroid, melanoma, breast, renal, bladder, ovarian, uterine, prostate, lymphomas, leukemias, neuroendocrine, glioblastoma or any other form of brain cancer.
- the expression level of at least one biomarker selected from ANG-2, SDF-1 and VEGF-D in a sample from the subject is determined using any one of the detection methods described above. Then the level in the sample from the subject is compared to a reference level of the biomarker.
- the reference level may be determined empirically such as it was in the Examples, by comparison to the levels found in a set of samples from cancer patients treated with cancer therapies including or excluding a VEGF targeting agent with known clinical outcomes for the patients.
- the reference level may be a level of the biomarker found in samples, such as plasma samples, which becomes a standard and can be used as a predictor for new samples.
- the median cut-off levels reported in the Examples may now serve as reference levels for comparison.
- the coefficients of variation were calculated for each biomarker and may be used to set reference levels. For example, a coefficient of variation of 20% would indicate that the median value could be altered by 20% and used as a reference level for the analysis.
- the expression level of ANG-2 and at least one of SDF-1, FGFb, OPN, HGF and VCAM-1 are determined.
- low levels of ANG-2 in combination with either low levels of SDF-1, FGFb or VCAM-1 or high levels of OPN or HGF are predictive of lack of responsiveness of the cancer to treatment including a VEGF targeting agent.
- the prediction indicates unfavorability of including a VEGF targeting agent in the cancer therapy when the expression level of Ang-2 is less than 305 pg/mL (310, 320, 330, 340, 350, 400, 450, or 500 pg/mL) and the expression level of SDF-1 is less than 1100 pg/mL (1200, 1300, 1400, 1500, 1600, 1700, or 2000 pg/mL), FGFb is less than 30 pg/mL (35, 40, 45, 50, 60, 70, 80, 90, or 100 pg/mL), VCAM-1 is less than 1,700 ng/mL (1800, 1900, 2000, 2500, or 3000 ng/mL), OPN is more than 73 ng/mL (70, 65, 60, 55, or 50 ng/mL) or HGF is more than 800 pg/mL (810, 790, 780, 770, 760, or 750 pg/mL).
- the expression level of SDF-1 and OPN are determined.
- high levels of SDF-1 and low levels of OPN are predictive of responsiveness to a VEGF targeting agent.
- the prediction favors responsiveness of the cancer to a cancer therapy including a VEGF targeting agent when the expression level of SDF-1 is more than 1100 pg/mL (1050, 1000, 950, 900, 850, or 800 pg/mL) and OPN is less than 75 ng/mL (80, 85, 90, 95, or 100 ng/mL).
- Responsiveness to a VEGF targeting agent indicates a significant increase in clinical benefit for subjects treated with a VEGF targeting agent.
- the expression level of SDF-1 and at least one of PDGF-AA, IGFBP-3, VEGF-R1 or MCP-1 are determined.
- low levels of SDF-1 in combination with either low levels of MCP-1 or high levels of PDGF-AA, IGFBP-3, or VEGF-R1 are predictive of lack of responsiveness of the cancer to treatment including a VEGF targeting agent.
- the prediction indicates unfavorability of including a VEGF targeting agent in the cancer therapy when the expression level of SDF-1 is less than 1100 ng/mL (1200, 1300, 1400, 1500, 1600, 1700, or 2000 pg/mL) and the expression level of MCP-1 is less than 525 pg/mL (550, 575, 600, 650, 700, or 750 pg/mL), PDGF-AA is more than 230 pg/mL (200, 175, 150, 125, 100, 75, or 50 pg/mL), IGFBP-3 is more than 700,000 ng/mL (650,000, 600,000, 550,000, 500,000 or 450,000 ng/mL) or VEGF-R1 is more than 120 pg/mL (100, 90, 80, 70 or 60 pg/mL). Lack of responsiveness to a VEGF targeting agent indicates a significant increase in clinical benefit for subjects not treated with a VEGF targeting agent.
- the expression level of HGF and at least one of MCP-1 or IGF-1 are determined.
- high levels of HGF in combination with either low levels of MCP-1 or high levels of IGF-1 are predictive of lack of responsiveness of the cancer to treatment including a VEGF targeting agent.
- the prediction indicates unfavorability of including a VEGF targeting agent in the cancer therapy when the expression level of HGF is more than 800 pg/mL (750, 700, 650, 600 or 550 pg/mL) and the expression level of MCP-1 is less than 525 pg/mL (550, 575, 600, 650, 700, or 750 pg/mL) or IGF-1 is more than 690 pg/mL (675, 650, 625, 600, 550, 500 pg/mL).
- Lack of responsiveness to a VEGF targeting agent indicates a significant increase in clinical benefit for subjects not treated with a VEGF targeting agent.
- the expression level of VEGF-C and GROa are determined.
- low levels of VEGF-C in combination with high levels of GROa are predictive of lack of responsiveness of the cancer to treatment including a VEGF targeting agent.
- the prediction indicates unfavorability of including a VEGF targeting agent in the cancer therapy when the expression level of VEGF-C is less than 575 pg/mL (600, 625, 650, 675, 700 or 725 pg/mL) and the expression level of GROa is more than 70 pg/mL (65, 60, 55, 50, or 45 pg/mL).
- low levels of VEGF-D are predictive of responsiveness to a VEGF targeting agent.
- the prediction favors responsiveness to a cancer therapy including a VEGF targeting agent when the expression level of VEGF-D is less than 1050 pg/mL (1075, 1100, 1125, 1150, 1175, 1200, or 1250 pg/mL). Responsiveness to a VEGF targeting agent indicates a significant increase in clinical benefit for subjects treated with a VEGF targeting agent.
- median to high levels of VEGF-D are predictive of lack of responsiveness of the cancer to treatment including a VEGF targeting agent.
- the prediction is unfavorable for responsiveness to a cancer therapy including a VEGF targeting agent when the expression level of VEGF-D is more than 1100 pg/mL (1075, 1050, 1025, 1000, 950, or 900 pg/mL).
- Lack of responsiveness to a VEGF targeting agent indicates a significant increase in clinical benefit for subjects not treated with a VEGF targeting agent.
- the levels of SDF-1, ANG-2 and OPN may all be determined in a sample from the subject. The levels may be compared to the reference levels and a prediction made. The prediction is favorable for responsiveness to a cancer therapy including a VEGF targeting agent if the SDF-1 levels are high, and the OPN levels are low.
- a sample with low SDF-1 and low ANG-2 will be predictive of lack of effectiveness of a VEGF targeting agent.
- the test may further include VEGF-D, such that inclusion of a VEGF targeting agent is predictable to be favorable if the VEGF-D and OPN levels are low and the SDF-1 levels are high.
- VEGF-D levels are not low, but instead are in the mid to high range as compared to the reference levels and the sample has low SDF-1 and low ANG-2, then a VEGF targeting agent will be predicted to not be effective as part of the cancer therapy.
- Methods of developing a prognosis, in particular a survival or progression free survival prognosis, for a subject with pancreatic cancer is also provided herein.
- the prognosis is independent of cancer therapeutic or cancer treatment regimen employed.
- the subject may have localized, advanced or metastatic cancer.
- the method includes determining or detecting the expression level of biomarkers including IGFBP-1, PDGF-AA and at least one of IL-6 and CRP in a sample from the subject. The levels of the biomarkers present in the sample are then compared to reference levels as described above. Finally by comparison to the reference levels a prognosis for the subject can be determined.
- the expression levels of IGFBP-1, PDGF-AA and IL-6 or CRP are measured and low levels are indicative of a better prognosis and high levels are indicative of poor prognosis.
- the survival prognosis for the subject is less than 6 months when the expression level of IGFBP-1 is more than 13,000 pg/mL (12,750, 12,500, 12,000, 11,000, 10,000, 9,000 pg/mL), PDGF-AA is more than 225 pg/mL (200, 175, 150, 125, 100 or 75 pg/mL) and either IL-6 is more than 15 pg/mL (12, 10, 8, or 6 pg/mL) or CRP is more than 20,000 ng/mL (19,000, 18,000, 17,000, 16,000 or 15,000 ng/mL).
- the survival prognosis for the subject is more than 6 months when the expression level of IGFBP-1 is less than 13,500 pg/mL (13,250, 14,000, 15,000, 16,000, 17,000 pg/mL), PDGF-AA is less than 250 pg/mL (275, 300, 325, 350 or 400 pg/mL) and either IL-6 is less than 20 pg/mL (25, 30, 40, 50, 60, or 70 pg/mL) or CRP is less than 21,000 ng/mL (22,000, 23,000, 24,000, 25,000 or 26,000 ng/mL).
- the expression level of IGFBP-1, PDGF-AA and CRP and the expression level of at least one of PAI-1-total and PEDF are determined and low levels are indicative of a better prognosis and high levels are indicative of a poor prognosis.
- the survival prognosis for the subject is less than 6 months when the expression level of IGFBP-1 is more than 13,000 pg/mL (12,750, 12,500, 12,000, 11,000, 10,000, 9,000 pg/mL), PDGF-AA is more than 225 pg/mL (200, 175, 150, 125, 100 or 75 pg/mL), CRP is more than 20,000 ng/mL (19,000, 18,000, 17,000, 16,000 or 15,000 ng/mL), PAI-1 total is more than 27,000pg/mL (26,000, 25,000, 24,000, 23,000 or 22,000 pg/mL) and PEDF is more than 3,500 ng/mL (3250, 3000, 2750, 2500, or 2000 ng/mL).
- the survival prognosis for the subject is more than 6 months when the expression level of IGFBP-1 is less than 13,500 pg/mL (13,250, 14,000, 15,000, 16,000, 17,000 pg/mL), PDGF-AA is less than 250 pg/mL (275, 300, 325, 350 or 400 pg/mL), CRP is less than 21,000 ng/mL (22,000, 23,000, 24,000, 25,000 or 26,000 ng/mL), PAI-1 total is less than 28,000 pg/mL (29,000, 30,000, 31,000 or 32,000 pg/mL) and PEDF is less than 3,600 ng/mL (3750, 4000, 4250, 4500, or 5000 ng/mL).
- the subject is being treated with gemcitabine alone.
- the expression level of IGFBP-1, PDGF-AA and IL-6 and at least one of PDGF-BB and TSP-2 are determined.
- low levels of the biomarkers are indicative of a better prognosis and high levels are indicative of a poor prognosis.
- the survival prognosis for the subject is less than 6 months when the expression level of IGFBP-1 is more than 13,000 pg/mL (12,750, 12,500, 12,000, 11,000, 10,000, 9,000 pg/mL), PDGF-AA is more than 225 pg/mL (200, 175, 150, 125, 100 or 75 pg/mL), IL-6 is more than 15 pg/mL (12, 10, 8, or 6 pg/mL), PDGF-BB is more than 180 pg/mL (175, 150, 125, 100, or 75 pg/mL) and TSP-2 is more than 20,000 pg/mL (19,000, 18,000, 17,000, 16,000 or 15,000 pg/mL).
- the survival prognosis for the subject is more than 6 months when the expression level of IGFBP-1 is less than 13,500 pg/mL (13,250, 14,000, 15,000, 16,000, 17,000 pg/mL), PDGF-AA is less than 250 pg/mL (275, 300, 325, 350 or 400 pg/mL), IL-6 is less than 20 pg/mL (25, 30, 40, 50, 60, or 70 pg/mL), PDGF-BB is less than 190 pg/mL (200, 225, 250, 300, 350 or 400 pg/mL) and TSP-2 is less than 21,000 pg/mL (22,000, 23,000, 24,000, 25,000 or 26,000 pg/mL).
- the subject is being treated with gemcitabine and a VEGF targeting agent.
- the expression level of at least one of ICAM-1, Ang2, IL-8, TSP-2, VCAM-1, PAI-1, and IGF-1 are determined.
- low levels of ICAM-1, Ang2, IL-8, TSP-2, VCAM-1, or PAI-1-active as compared to the reference level are indicative of a better prognosis and high levels of ICAM-1, Ang2, IL-8, TSP-2, VCAM-1, or PAI-1-active as compared to the reference level are indicative of a poor prognosis.
- high levels of IGF-1 as compared to the reference level is indicative of a better prognosis and low levels of IGF-1 as compared to the reference level is indicative of a poor prognosis.
- the survival prognosis for the subject is less than 6 months when the expression level of IGFBP-1 is more than 13,000 pg/mL (12,750, 12,500, 12,000, 11,000, 10,000, 9,000 pg/mL), or ICAM-1 is more than 350 ng/mL (300, 275, 250, 225, or 200 ng/mL), or Ang2 is more than 300 pg/mL (275, 250, 225, 200, 175 or 150 pg/mL), or CRP is more than 20,000 ng/mL(19,000, 18,000, 17,000, 16,000 or 15,000 ng/mL), or IL-8 is more than 49 pg/mL (45, 40, 35, 30 or 25 pg/mL), or IL-6 is more than 17 pg/mL(15, 12, 10, 8, or 6 pg/mL), or TSP-2 is more than 20,000 pg/mL (19,000, 18,000, 17,000, 16,000 or 15,000 pg
- survival prognosis for the subject is more than 6 months when the expression level of IGFBP-1 is less than 13,500 pg/mL (13,250, 14,000, 15,000, 16,000, 17,000 pg/mL), or ICAM-1 is less than 360 ng/mL (375, 400, 425, 450, 475, or 500 ng/mL), or Ang2 is less than 305 pg/mL (310, 320, 330, 340, 350, 400, 450, or 500 pg/mL), or CRP is less than 21,000 ng/mL (22,000, 23,000, 24,000, 25,000 or 26,000 ng/mL), or IL-8 is less than 50 pg/mL (55, 60, 65, 70, 75, 80 or 85 pg/mL), or IL-6 is less than 18 pg/mL (20, 25, 30, 40, 50, 60, or 70 pg/mL), or TSP-2 is less than 21,000 pg/mL (2
- Treatment plans may be developed using the predictions of the responsiveness of the cancer to treatment with a cancer therapy including an antibody specific for VEGF-A obtained using the methods described herein to determine whether treatment of the subject with a cancer therapy including a VEGF targeting agent may be beneficial.
- the treatment plan will include a VEGF targeting agent if such a therapeutic is expected to be beneficial and the treatment plan will not include a VEGF targeting agent if it is not predicted to be clinically beneficial to the subject as described above.
- Gemcitabine 1,000mg/m 2 was administered intravenously over 30 minutes on days 1, 8, and 15 of a 28-day cycle.
- Bevacizumab (10 mg/kg) or placebo was given intravenously after gemcitabine on days 1 and 15 of each cycle.
- Bevacizumab or placebo dose was initially given over 90 minutes, and if no infusion reaction occurred, the second dose was given over 60 minutes, and subsequent doses were given over 30 minutes. Treatment continued until progressive disease, unacceptable toxicities, or withdrawal of consent.
- Peripheral venous blood was collected from consenting patients into lavender (EDTA anticoagulant) vacutainers for plasma isolation. The tubes were centrifuged at 2500 g for 15 minutes within 30 minutes of collection. Plasma was aliquoted into cryovials, snap frozen, and samples shipped for centralized storage at the CALGB Pathology Coordinating Office. Before analysis, all patient samples were shipped to our laboratory (Duke/CALGB Molecular Reference Lab), thawed on ice, re-aliquoted based on specific assay requirements and stored at -80°C. All assays were performed in triplicate after 2 freeze-thaw cycles only and all analysis was conducted while blinded to clinical outcome.
- biomarkers were analyzed using Searchlight platform (Aushon Biosystems, Inc., Billerica, MA) following manufacturer's protocol. Markers are listed in Table 1 above. Additional ELISA assays were conducted for IGF-1 (Immunodiagnostic Systems, Inc.; Scottsdale, Az) and TGF ⁇ RIII (R&D Systems, Inc.). Plasma samples were thawed on ice, centrifuged at 20,000 x g for 5 min to remove precipitate and loaded onto SearchLight plates with standard protein controls. Samples and standards were incubated at room temperature for 1 hour with shaking at 950 rpm (Lab-Line Titer Plate Shaker, Model 4625, Barnstead, Dubuque, IA).
- Plates were washed three times using a plate washer (Biotek Instruments, Inc., Model ELx405, Winooski, VT), biotinylated secondary antibody added, and incubated for 30 min. After washes, streptavidin-HRP was added, incubated for 30 min, washed again, and SuperSignal substrate added. Images were taken within 10 min, followed by image analysis using SearchLight array analyst software.
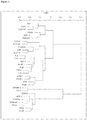
- Patterns of expression were analyzed at baseline and were correlated with overall survival (OS) and progression free survival (PFS) using univariate Cox proportional hazard regression models and multivariate Cox models with leave-one-out cross validation. Spearman's rank correlation coefficients were calculated for all pairs of analytes. Unsupervised hierarchical clustering of analytes was also performed to produce dendrogram plots. Data indicate that several analyte clusters reflect known biological categories. This data is summarized in Figure 1 below.
- the primary endpoint of interest will be overall survival (OS) with correlation to the blood analytes; however, progression-free survival (PFS) was evaluated.
- OS overall survival
- PFS progression-free survival
- Cox regression analysis was performed to assess the prognostic value of blood analytes for the clinical endpoints of interest.
- Cox regression models were performed for Gem+Placebo and Gem+Bev separately.
- Raw, continuous analytes intensities for baseline measures were used. Summary statistics included the hazard ratios and associated confidence intervals.
- the inclusion of potential confounding factors was explored. These factors included; gender, extent of disease (locally advanced vs metastatic), age (continuous), and performance status (0, 1, 2).
- prognostic models were built with multivariate Cox regression analysis using the most informative analytes chosen from leave-one-out cross-validation for Gem+Placebo and Gem+Bev separately.
- the training samples were used to build a Cox regression model for predicting the survival of the testing samples.
- the predicted survival times were used to split the groups in half into high and low risk groups. Kaplan-Meier estimates of the hazard profiles for these two groups were produced.
- IGFBP-1 IGFBP-1, ICAM-1, Ang-2, CRP, IL-8, TSP-2, VCAM-1, PAI1 active, and IGF-1 were significantly correlated with progression free survival in the gemcitabine/placebo group (Table 6). All markers remained significant (p ⁇ 0.05) after accounting for multiple parameter testing using bonferroni correction methodologies. Table 5.
- TSP-2, CRP, IL-6, IGFBP-1, Ang-2, ICAM-1, VCAM-1, and IGF-1 were significantly correlated with overall survival in the gemcitabine/bevacizumab group (Table 7).
- TSP-2, CRP, IL-6, IGFBP-1, Ang-2, ICAM-1, and VCAM-1 were significantly correlated with progression free survival in the gemcitabine/bevacizumab group (Table 8). It should be noted that high consistency was observed across both cohorts. All of these factors were unfavorable prognostic markers, where higher levels were associated with a less favorable outcome. The only notable exception was IGF-1, where higher levels were associated with a more favorable outcome.
- Tables 9 and 10 are composite lists of analytes that are prognostic for overall survival and progression free survival irrespective of treatment condition, respectively. Table 7.
- Multivariate prognostic models for OS were developed using a leave one out, cross-validation approach. Using this methodology, two 5-analyte models for risk were developed, one for the gemcitabine + placebo cohort, and another for gemcitabine + bevacizumab cohort (see Table 11).
- the gemcitabine + placebo model for OS consisted of IGFBP-1, CRP, PDGF-AA, PAI1-total, and PEDF. This model was associated with a hazard ratio of 2.0, with corresponding median survivals of 3.3 and 7.3 months for the high and low risk groups, respectively.
- the gemcitabine + bevacizumab model consisted of IGFBP-1, IL-6, PDGF-AA, PDGF-BB, and TSP-2.
- VEGF-D was seen to be predictive across both sides of the Q1 split.
- Table 12. Univariate Overall Survival Predictive Markers at baseline (EDTAs) for Gem+Bev vs Gem+Placebo Gem+Placebo Gem+Bev Analyte Cutoff p-value HR 95% CI Median Survival 95% CI Median Survival 95% CI Ang2 ⁇ median 0.0346 1.4 (1.02, 1.92) 9.6 (8.1, 10.6) 7.0 (5.7, 8.7) SDF-1 ⁇ median 0.0273 1.4 (1.04, 1.94) 8.4 (6.3, 9.7) 5.4 (4.8, 7.4) SDF-1 ⁇ Q1 0.0304 1.6 (1.04, 2.56) 9.2 (5.9, 10.7) 4.9 (3.3, 7.9) VEGF-D > Q1 0.0346 1.3 (1.04, 1.74) 6.9 (5.7, 9.0) 5.8 (4.8, 7.1) VEGF-D ⁇ Q1 0.0332 0.6 (0.39, 0.96) 5.4 (3.6,
- the model was associated with a hazard ratio of 0.55, with corresponding median survivals of 5.1 and 9.0 months for the gemcitabine + placebo group (shown in dashed lines) and gemcitabine + bevacizumab (shown in solid lines), respectively.
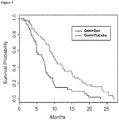
- the bivariate model which most strongly predicted for worse survival in the gemcitabine + bevacizumab group was found to be SDF1 ( ⁇ median) and Ang2 ( ⁇ median). See Figure 5 .
- This model was associated with a hazard ratio of 2.2, with corresponding median survivals of 10.4 and 6.7 months for the gemcitabine + placebo group (shown in dashed lines) and gemcitabine + bevacizumab (shown in solid lines). Table 13.
- This multiplex angiome analysis of CALGB 80303 is one of the largest such analyses reported to date, and the first in metastatic pancreatic cancer.
- technical analyses were robust with good sensitivity and low variability, which were generally comparable to single kit ELISAs.
- Unsupervised hierarchical clustering identified potential patterns of analyte expression, with suggested grouping among VEGF/PDGF family members, TGF ⁇ family members, and various inflammatory and coagulation factors.
- Such analyses particularly across cancer types and in the settings of tumor response and progression, may provide novel insights into the co and counter regulation of these factors and their underlying biology.
- prognostic markers were identified. This analysis is the largest and most comprehensive to date. These laboratory based prognostic markers were more powerful than traditional clinical factors and they remained highly statistically significant even after adjustment for known clinical factors. Most of these markers are involved in tumor related angiogenesis, inflammation, and coagulation, confirming the clinical importance of the underlying pathophysiology of pancreatic cancer. Indeed, ras mutations, which are present in approximately 90% of pancreatic adenocarcinomas, have been associated with the up-regulation of multiple factors related to inflammation and inflammatory angiogenesis and targeting these factors has been shown to inhibit the growth of xenograft and genetically modified mouse models of pancreatic cancer. Clinical trials with agents that inhibit these pathways are ongoing in various cancers, including pancreatic cancer; however, the value of targeting these factors in patients with pancreatic cancer is not yet known.
- VEGF-D vascular endothelial growth factor
- SDF1 and Ang2 were identified on univariate analyses as potential predictors of resistance to bevacizumab. Bivariate analyses confirmed the potential importance of these findings, and suggested that high levels of SDF1 and low levels of OPN may predict for sensitivity to bevacizumab.
- Ang2 was noted to have significant general prognostic importance, while SDF1 was not.
- Ang2 and SDF1 are known to promote angiogenesis and thus the finding that low levels of these factors are associated with lack of benefit from bevacizumab may appear somewhat counterintuitive.
- these factors are also associated with active angiogenesis and are known to be regulated by VEGF.
- VEGF vascular endothelial growth factor
- VEGF-D was identified as a strong candidate for predicting sensitivity and resistance to bevacizumab in this population.
- Other candidates were also identified, highlighting the known complexity of tumor angiogenesis and pancreatic cancer.
Description
- The goal of all targeted therapies and personalized medicine in general is to define which patients are most or least likely to benefit or have toxicity from a given treatment and to provide patients with a more accurate prognosis. Similarly, almost all cancer patients develop resistance to any given therapy; defining the mechanisms of this resistance helps direct the use of other therapies, including combination regimens to delay, prevent, or overcome this resistance.
- Clinically, there have been several reports of biomarkers whose expression levels change in response to treatment. Multiple groups have shown that increased levels of various angiogenesis factors, including VEGF, correlate with worse prognosis or outcome in general. Similarly, several groups have described in patients changes in various angiogenesis factors with anti-VEGF treatment, including VEGF, PlGF, SDF1, Ang2, and sVEGFR2, among others. Many of these changes are seen in preclinical models, even in non-tumor bearing mice suggesting these responses are at least partially host derived. In preclinical models, factors mediating resistance to anti-VEGF therapy have been described. In the clinic, however, markers that predict which patients will derive greater or lesser benefit from anti-VEGF therapy have been elusive. This may relate to many factors, including technical limitations in assay methods and target abundance or stability. The difficulty in identifying such biomarkers may also relate to the context and complexity of co- and counter- regulation of angiogenesis. Lastly, this information can only be reliably derived from large randomized trials.
- By way of example, pancreatic cancer is one of the leading causes of cancer related death worldwide. Despite modest benefits associated with currently available treatments, the median survival for patients with metastatic pancreatic adenocarcinoma remains under 1 year (6-9 months). The clinical hallmarks of pancreatic cancer include marked desmoplasia, early metastases, cachexia, and hypercoagulability. The pathophysiology underlying these conditions has been associated with multiple factors associated with tumor angiogenesis and inflammation. While many angiogenic and inflammatory makers have been profiled in pancreatic cancer, these analyses have typically been limited by the size and quality of the available datasets, and by the technical limitations of standard assay ELISA methods, which significantly limited the number of factors that could be evaluated in a given sample. Having biomarkers or sets of biomarkers that can provide pancreatic cancer patients with a more accurate prognosis and predictions regarding the responsiveness to cancer therapies would be helpful to patients and to society.
- Provided herein are methods of predicting responsiveness of a cancer in a subject to a cancer therapy including a VEGF targeting agent, methods of developing a prognosis for a subject diagnosed with pancreatic cancer, and methods of developing treatment plans for subjects with cancer. The invention is defined in the claims.
- In one aspect, methods of predicting responsiveness of a cancer in a subject to a cancer therapy including a VEGF targeting agent are provided. These methods include determining the expression level of Ang-2 in a sample from the subject. The method may further comprise determining the expression level of at least one additional biomarker selected from SDF-1 and VEGF-D. The levels of the biomarkers are then compared to a reference level of the biomarker and the comparison is used to predict the responsiveness of the cancer to treatment with the cancer therapy including a VEGF targeting agent. In one embodiment, if the levels of VEGF-D are determined to be low (i.e. less than 1050 pg/mL), then treatment with a cancer therapy including a VEGF targeting agent is predicted to be beneficial. In another embodiment, if the levels of VEGF-D are determined to be in the mid- to high range (i.e. more than 1100 pg/mL), then treatment with a cancer therapy including a VEGF targeting agent is not predicted to be beneficial. In another embodiment, if the levels of ANG-2 and SDF-1 are low (i.e. 305 pg/mL and 1100 pg/mL, respectively), then treatment with a cancer therapy including a VEGF targeting agent is not predicted to be beneficial. In another embodiment, if the levels of SDF-1 are high (i.e. more than 1100 pg/mL) and the levels of OPN are low (i.e. less than 75 ng/mL), then treatment with a cancer therapy including a VEGF targeting agent is predicted to be beneficial.
- In another aspect, methods of developing treatment plans for subjects with cancer are provided. In these methods the prediction of the responsiveness of the cancer to treatment with a cancer therapy including a VEGF targeting agent is used to select a cancer therapy including a VEGF targeting agent if the cancer is predicted to respond to an anti-VEGF therapy. In an alternative embodiment, a prediction suggesting that a VEGF targeting agent will not be effective or will be counter-productive will result in development of a treatment plan excluding a VEGF targeting agent.
- In yet another aspect, methods of developing a prognosis for a subject diagnosed with pancreatic cancer are provided. These methods include determining an expression level of IGFBP-1, PDGF-AA and at least one of IL-6 and CRP in a sample from the subject. The levels of the biomarkers are then compared to reference levels. Finally the comparison is used to determine a survival prognosis for the subject. In one embodiment, if the levels of IGFBP-1, PDGF-AA and IL-6 are low (i.e. less than 13,500 pg/ mL, 250 pg/mL and 20 pg/mL, respectively), then the survival prognosis is more than 6 months. In this embodiment, if the levels of PDGF-BB and TSP-2 are also determined to be low (i.e. less than 190 pg/mL and 21,000 pg/mL, respectively) then the survival prognosis is more than 6 months. In another embodiment, if the levels of IGFBP-1, PDGF-AA and CRP are low (i.e. less than 13,500 pg/ mL, 250 pg/mL and 21,000 ng/mL, respectively), then the survival prognosis is more than 6 months. In this embodiment, if the levels of PAI-1 total and PEDF are also determined to be low (i.e. less than 28,000 pg/mL and 3,600 ng/mL, respectively) then the survival prognosis is more than 6 months.
-
-
Figure 1 is a Spearman-based dendrogram showing the relatedness of the biomarkers analyzed in the Examples. -
Figure 2 is a set of Kaplan-Meier plots showing the survival data for the gemcitabine + placebo model (Figure 2A ) and the gemcitabine + bevacizumab model (Figure 2B ). The high risk groups from the multivariate analysis for each is shown in solid lines and the low risk group is shown in dashed lines. -
Figure 3 is a graph showing the hazard ratio plot for each of the biomarkers identified in the univariate analysis as predictive of responsiveness or lack thereof when treated with bevacizumab. -
Figure 4 is a Kaplan-Meier plot showing the survival data of subjects in the gemcitabine + bevacizumab group (solid line) distinguished by high SDF-1 and low OPN as compared to the gemcitabine + placebo group (dashed line). -
Figure 5 is a Kaplan-Meier plot showing the survival data of subjects is improved in the gemcitabine + placebo group (dashed lines) with low SDF-1 and low ANG-2 as compared to the gemcitabine + bevacizumab group (solid lines). - For the purposes of promoting an understanding of the principles of the present disclosure, reference will now be made to preferred embodiments and specific language will be used to describe the same. It will nevertheless be understood that no limitation of the scope of the disclosure is thereby intended.
- Articles "a" and "an" are used herein to refer to one or to more than one (i.e. at least one) of the grammatical object of the article. By way of example, "an element" means at least one element and can include more than one element.
- Unless otherwise defined, all technical terms used herein have the same meaning as commonly understood by one of ordinary skill in the art to which this disclosure belongs.
- We sought to identify which growth factors, cytokines, or other blood-based markers predict for sensitivity or resistance to a given therapy, particularly anti-VEGF therapy. In this case, we were particularly interested in determining which factors (or groups of factors) predict for sensitivity and acquired resistance to bevacizumab, and/or which factors predict for bevacizumab related toxicity. Describing patterns of co- and counter-regulation among these factors was thought to be critical to understanding this sensitivity and resistance.
- Methods of predicting responsiveness of a cancer in a subject to a cancer therapy including a VEGF targeting agent, methods of developing a prognosis for a subject diagnosed with pancreatic cancer, and methods of developing treatment plans for subjects with cancer are provided herein. The methods all rely on detecting or determining the expression level of at least one biomarker or combinations of biomarkers in a sample from a subject diagnosed with cancer. Suitably, the cancer is a solid tumor.
- Thus, the present methods permit the personalization of therapy amongst cancer patients, wherein a subject's biomarker profile is predictive of, or indicative of, treatment efficacy and or survival. The methods disclosed herein can be used in combination with assessment of conventional clinical factors, such as tumor size, tumor grade, lymph node status, family history, and analysis of expression level of additional biomarkers. In this manner, the methods of the present disclosure permit a more accurate evaluation of prognosis and cancer therapy effectiveness.
- In one embodiment, the method includes determining the expression levels of the proteins or the RNA transcripts for the biomarkers provided herein in Tables 5-13 in a sample from a patient with cancer. Biomarker expression in some instances may be normalized against the expression levels of all proteins or RNA transcripts in the sample, or against a reference set of proteins or RNA transcripts in the sample. The level of expression of the biomarkers is indicative of the prognosis for the subject or predictive of the effectiveness of a particular treatment.
- The methods of the present disclosure can also be used to assist in selecting appropriate courses of treatment and to identify patients that would benefit from a particular course of therapy. Thus, the expression of the particular biomarkers described herein provides insight into which cancer treatment regimens will be most effective for the patient. This information can be used to generate treatment plans for the patient to prolong survival and minimize side effects or cancer therapy related toxicity.
- In some embodiments described herein, prognostic performance of the biomarkers and/or other clinical parameters was assessed utilizing a Cox Proportional Hazards Model Analysis, which is a regression method for survival data that provides an estimate of the hazard ratio and its confidence interval. The Cox model is a well-recognized statistical technique for exploring the relationship between the survival of a patient and particular variables. This statistical method permits estimation of the hazard (i.e., risk) of individuals given their prognostic variables (e.g., expression level of particular biomarkers, as described herein). Survival data are commonly presented as Kaplan-Meier curves or plots. The "hazard ratio" is the risk of death at any given time point for patients displaying particular prognostic variables. See generally Spruance et al., Antimicrob. Agents & Chemo. 48:2787-92, 2004. Methods for assessing statistical significance are well known in the art and include, for example, using a log-rank test, Cox proportional hazards model and Kaplan-Meier curves. In some aspects of the invention, a p-value of less than 0.05 constitutes statistical significance.
- As used herein, the term "subject" and "patient" are used interchangeably and refer to both human and non-human animals. The term "non-human animals" of the disclosure includes all vertebrates, e.g., mammals and non-mammals, such as nonhuman primates, sheep, dog, cat, horse, cow, chickens, amphibians, reptiles, and the like. Preferably, the subject is a human patient. More preferably, the subject is a human patient diagnosed with cancer or undergoing, or about to undergo, a cancer treatment regimen.
- The biomarkers of the present disclosure include proteins and genes encoding the proteins. The biomarkers analyzed are provided in Table 1 along with an indication of the commonly used abbreviations for each marker. Such biomarkers include DNA comprising the entire or partial sequence of the nucleic acid sequence encoding the biomarker, or the complement of such a sequence. The biomarker nucleic acids also include RNA comprising the entire or partial sequence of the nucleic acid sequences encoding the proteins of interest. A biomarker protein comprises the entire or partial amino acid sequence of any of the biomarker proteins or polypeptides.
Table 1. Angiogenic Factors analyzed Soluble Angiogenic Factors Matrix-Derived Angiogenic Factors Markers of Coagulation Markers of Vascular Activation and Inflammation ANG-2 PEDF Osteopontin CRP Gro-a bFGF PlGF TGFb1 PAI-1 Active ICAM-1 HGF VEGF-A TGFb2 PAI-1 Total IL-6 IGFBP1 VEGF-C TSP2 IL-8 IGFBP3 VEGF-D MCP-1 PDGF-AA sVEGFR1 P-selectin PDGF-BB sVEGFR2 SDF-1 VCAM-1 Abbreviations: ANG-2, angiopoietin-2; bFGF, basic fibroblast growth factor; HGF, hepatocyte growth factor; IGFBP, insulin-like growth factor-binding protein; PDGF, platelet-derived growth factor; PEDF, pigment epithelium-derived factor; PlGF, placental growth factor; VEGF, vascular endothelial growth factor; sVEGFR, soluble vascular endothelial growth factor receptor; TGFβ, transforming growth factor beta; TSP, thrombospondin; CRP, c-reactive protein; PAI-1, plasminogen activator inhibitor-1; Gro-a; growth regulated oncogene-alpha; ICAM-1, intercellular adhesion molecule 1; IL, interleukin; MCP-1, macrophage chemoattractant protein-1; SDF-1 stromal cell-derived factor-1; VCAM-1, vascularcell adhesion molecule 1. - Fragments and variants of biomarker genes and proteins are also encompassed by the present invention. By "fragment" is intended a portion of the polynucleotide or a portion of the amino acid sequence and hence protein encoded thereby. Polynucleotides that are fragments of a biomarker nucleotide sequence generally comprise at least 10, 15, 20, 50, 75, 100, 150, 200, 250, 300, 350, 400, 450, 500, 550, 600, 650, 700, 800, 900, 1,000, 1,200, or 1,500 contiguous nucleotides, or up to the number of nucleotides present in a full-length biomarker polynucleotide disclosed herein. A fragment of a biomarker polynucleotide will generally encode at least 15, 25, 30, 50, 100, 150, 200, or 250 contiguous amino acids, or up to the total number of amino acids present in a full-length biomarker protein of the invention. "Variant" is intended to mean substantially similar sequences. Generally, variants of a particular biomarker of the invention will have at least about 40%, 45%, 50%, 55%, 60%, 65%, 70%, 75%, 80%, 85%, 90%, 91%, 92%, 93%, 94%, 95%, 96%, 97%, 98%, 99% or more sequence identity to that biomarker as determined by sequence alignment programs.
- A "biomarker" is a gene or protein whose level of expression in a sample is altered compared to that of a normal or healthy sample or is indicative of a condition. The biomarkers disclosed herein are genes and proteins whose expression level correlates with cancer, particularly pancreatic cancer, prognosis or responsiveness of the cancer to a cancer therapy including a VEGF targeting agent.
- In particular embodiments, the methods for predicting or prognosticating a cancer therapy in a subject includes collecting a patient body sample. The sample may or may not include cells. In particular, the methods described herein may be performed without requiring a tissue sample or biopsy and need not contain any cancer cells. In the Examples, plasma was used. "Sample" is intended to include any sampling of cells, tissues, or bodily fluids in which expression of a biomarker can be detected. Examples of such samples include, but are not limited to, biopsies, smears, blood, lymph, urine, saliva, or any other bodily secretion or derivative thereof. Blood can include whole blood, plasma (citrate, EDTA, heparin), serum, or any derivative of blood. Samples may be obtained from a patient by a variety of techniques available to those skilled in the art. Methods for collecting various samples are well known in the art.
- Any methods available in the art for detecting expression of biomarkers are encompassed herein. The expression of a biomarker of the invention can be detected on a nucleic acid level (e.g., as an RNA transcript) or a protein level. By "detecting or determining expression" is intended determining the quantity or presence of a protein or its RNA transcript for at least one of the biomarkers of Table 1. Thus, "detecting expression" encompasses instances where a biomarker is determined not to be expressed, not to be detectably expressed, expressed at a low level, expressed at a normal level, or overexpressed.
- Methods suitable for detecting or determining the expression levels of biomarkers are known to those of skill in the art and include, but are not limited to, ELISA, immunofluorescence, FACS analysis, Western blot, magnetic immunoassays, and both antibody-based microarrays and non-antibody-based microarrays. In the past, the gold standard for detection of growth factors and cytokines in blood was the use of ELISAs; however, multiplex technology offers an attractive alternative approach for cytokine and growth factor analysis. The advantages of multiplex technology compared to traditional ELISA assays are conservation of patient sample, increased sensitivity, and significant savings in cost, time and labor.
- Several multiplex platforms currently exist. The Luminex bead-based systems are the most established, being used to detect circulating cytokines and growth factors in both mice and humans. This method is based on the use of microparticles that have been precoated with specific antibodies. These particles are then mixed with sample and the captured analytes are detected using specific secondary antibodies. This allows for up to 100 different analytes to be measured simultaneously in a single microplate well. The advantages of this flow cytometry-based method compared to traditional ELISA assays are in the conservation of patient samples as well as significant savings in terms of cost and labor. An alternative, plate-based system is produced by Meso Scale Discovery (MSD). This system utilizes its proprietary Multi-Array® and Multi-Spot® microplates with electrodes directly integrated into the plates. This enables the MSD system to have ultra-sensitive detection limits, high specificity, and low background signal. Another plate-based multiplex system is the SearchLight Plus CCD Imaging System produced by Aushon Biosystems. This novel multiplexing technology allows for the measurement of up to 16 different analytes simultaneously in a single microplate well. The assay design is similar to a sandwich ELISA where the capture antibodies are pre-spotted into individual wells of a 96-well plate. Samples or standards are added which bind to the specific capture antibodies and are detected using Aushon's patented SuperSignal ELISA Femto Chemiluminescent Substrate.
- In evaluating the multiple systems currently available, our laboratory has focused on the SearchLight system for several reasons. First, the assay portfolio is well aligned with many of the targets we are interested in measuring and second, the plate-based system has several operational advantages over the flow-based Luminex system, including lower maintenance costs, ease of use, and simple-to-follow protocols. Notably any suitable assay may be used in the methods described herein. To date, we have used SearchLight technology to analyze 7 Phase I/II studies and one large Phase III studies (CALGB 80303). These multiplex analyses have been quality controlled to investigate ~ 40 analytes in various patient samples (i.e., serum, citrate plasma, EDTA plasma, and urine).
- We have worked to optimize the design of customized multiplex ELISA plates via extensive collaborations with SearchLight (recently acquired by Aushon Biosystems, Inc.). Considerable effort has been devoted in developing appropriately designed panels in order to evaluate over 40 regulators of tumor and normal angiogenesis (see Table 1 above). All plate designs were optimized for use in cancer patients in order to 1) limit cross-reactivity of the antibodies 2) optimize sensitivity and specificity and 3) maximize the linearity of the assay's dynamic range.
- Methods for detecting expression of the biomarkers described herein are not limited to protein expression. Gene expression profiling including methods based on hybridization analysis of polynucleotides, methods based on sequencing of polynucleotides, immunohistochemistry methods, and proteomics-based methods may also be used. The most commonly used methods known in the art for the quantification of mRNA expression in a sample include northern blotting and in situ hybridization (Parker and Barnes, Methods Mol. Biol. 106:247-83, 1999), RNAse protection assays (Hod, Biotechniques 13:852-54, 1992), PCR-based methods, such as reverse transcription PCR(RT-PCR) (Weis et al., TIG 8:263-64, 1992), and array-based methods (Schena et al., Science 270:467-70, 1995). Alternatively, antibodies may be employed that can recognize specific duplexes, including DNA duplexes, RNA duplexes, and DNA-RNA hybrid duplexes, or DNA-protein duplexes. Representative methods for sequencing-based gene expression analysis include Serial Analysis of Gene Expression (SAGE) and gene expression analysis by massively parallel signature sequencing.
- The term "probe" refers to any molecule that is capable of selectively binding to a specifically intended target biomolecule, for example, a nucleotide transcript or a protein encoded by or corresponding to a biomarker. Probes can be synthesized by one of skill in the art, or derived from appropriate biological preparations. Probes may be specifically designed to be labeled. Examples of molecules that can be utilized as probes include, but are not limited to, RNA, DNA, proteins, antibodies, and organic molecules.
- As used herein the term "predicting responsiveness" refers to providing a probability based analysis of how a particular subject will respond to a cancer therapy. The prediction of responsiveness is not a guarantee or absolute, only a statistically probable indication of the responsiveness of the subject. The prediction of responsiveness to a cancer therapy including a VEGF targeting agent may indicate that the subject is likely to be responsive to a cancer therapy including a VEGF targeting agent or alternatively may indicate that the subject is not likely to be responsive to a cancer therapy including a VEGF targeting agent. Alternatively, the prediction may indicate that inclusion of a VEGF targeting agent in a cancer therapy regime may be counter-productive and lead to a worse result for the subject than if no therapy was used or a placebo was used. Responsiveness includes but is not limited to, any measure of a likelihood of clinical benefit. For example, clinical benefits include an increase in overall survival, an increase in progression free survival, an increase in time to progression, increased tumor response, decreased symptoms, or other quality of life benefits.
- A VEGF targeting agent includes any therapeutic agent targeting VEGF family members or any member of the VEGF receptor class of proteins. In particular, antibodies specific for VEGF, particularly VEGF-A, antibody-conjugated or other bioreagents capable of blocking VEGF mediated signaling, such as VEGF-R binding or competitive inhibitors, small molecules, aptamers, iRNAs, and other non-antibody-based therapeutic reagents. Anti-VEGF agents that are currently FDA approved include bevacizumab (Avastin™), sunitinib (Sutent™), sorafenib (Nexavar™), pazopanib (Votrient™), ranibizumab (Lucentis™), pegaptanib (Macugen™) and Axitinib (Inlyte™). Bevacizumab is a monoclonal antibody against VEGF that is FDA approved for the treatment of metastatic colorectal cancer, lung cancer, , renal cell cancer, and glioblastoma. Sunitinib is a small molecule tyrosine kinase inhibitor that blocks VEGF, PDGF, and cKIT receptors; sunitinib is FDA approved for the treatment of renal cell carcinoma and GI Stromal tumors (GIST). Sorafenib is a small molecule tyrosine kinase inhibitor that blocks VEGF, PDGF, and cKIT receptors as well as the oncogene Raf; sorafenib is FDA approved for the treatment of renal cell carcinoma and hepatocellular carcinoma. Pazopanib (Votrient™) is a small molecule tyrosine kinase inhibitor that blocks VEGF, PDGF, and cKIT receptors; pazopanib is FDA approved for the treatment of renal cell carcinoma. Ranibizumab (Lucentis™) is a Fab fragment antibody that binds VEGF; ranibizumab is FDA approved for the treatment neovascular (wet) age related macular degeneration (AMD). Pegaptanib (Macugen™) is a pegylated RNA aptamer that FDA approved for the treatment neovascular (wet) age related macular degeneration (AMD). Axitinib (InlyteTM) is a small molecule tyrosine kinase inhibitor capable of inhibiting VEGFR1, VEGFR2, VEGFR3, PDGFR and cKIT that is FDA approved for treatment of renal cell carcinoma. Multiple other VEGF and other angiogenesis inhibitors are in various stages of clinical development.
- The VEGF targeting agents may be used in combination with other cancer therapeutics in a cancer therapy regimen. Combination therapy does not require that multiple cancer therapeutics be administered simultaneously, but only that the subjects are treated with more than one therapeutic agent during a time span, such as one month, two months or more. For example, the VEGF targeting agent may be used in combination with DNA synthesis or DNA repair inhibitors such as nucleoside analogs. In the Examples, gemcitabine was used, but those of skill in the art will appreciate that a wide variety of cancer therapeutic agents are available and that such agents are often used in combination such that a DNA synthesis inhibitor and other classes of anticancer agents, including but not limited to, other DNA damaging agents, anti-metabolites, hormonal therapies, and signal transduction inhibitors, is combined with a VEGF targeting agent in a cancer therapy. In the Examples, the patients were treated with gemcitabine + placebo or gemcitabine + bevacizumab.
- The cancer may be selected from any cancer in which a VEGF targeting agent is being considered for therapeutic purposes. In particular, the cancer may be a solid tumor. Cancers for which predictions may be made include but are not limited to pancreatic, colorectal, liver, esophageal, gastric, small bowel, cholangiocarcinoma, lung, head and neck, thyroid, melanoma, breast, renal, bladder, ovarian, uterine, prostate, lymphomas, leukemias, neuroendocrine, glioblastoma or any other form of brain cancer.
- In the methods described herein the expression level of at least one biomarker selected from ANG-2, SDF-1 and VEGF-D in a sample from the subject is determined using any one of the detection methods described above. Then the level in the sample from the subject is compared to a reference level of the biomarker. The reference level may be determined empirically such as it was in the Examples, by comparison to the levels found in a set of samples from cancer patients treated with cancer therapies including or excluding a VEGF targeting agent with known clinical outcomes for the patients. Alternatively, the reference level may be a level of the biomarker found in samples, such as plasma samples, which becomes a standard and can be used as a predictor for new samples. For example, the median cut-off levels reported in the Examples may now serve as reference levels for comparison. As noted in Table 3, the coefficients of variation were calculated for each biomarker and may be used to set reference levels. For example, a coefficient of variation of 20% would indicate that the median value could be altered by 20% and used as a reference level for the analysis.
- In one embodiment, the expression level of ANG-2 and at least one of SDF-1, FGFb, OPN, HGF and VCAM-1 are determined. In this embodiment, low levels of ANG-2 in combination with either low levels of SDF-1, FGFb or VCAM-1 or high levels of OPN or HGF are predictive of lack of responsiveness of the cancer to treatment including a VEGF targeting agent. The prediction indicates unfavorability of including a VEGF targeting agent in the cancer therapy when the expression level of Ang-2 is less than 305 pg/mL (310, 320, 330, 340, 350, 400, 450, or 500 pg/mL) and the expression level of SDF-1 is less than 1100 pg/mL (1200, 1300, 1400, 1500, 1600, 1700, or 2000 pg/mL), FGFb is less than 30 pg/mL (35, 40, 45, 50, 60, 70, 80, 90, or 100 pg/mL), VCAM-1 is less than 1,700 ng/mL (1800, 1900, 2000, 2500, or 3000 ng/mL), OPN is more than 73 ng/mL (70, 65, 60, 55, or 50 ng/mL) or HGF is more than 800 pg/mL (810, 790, 780, 770, 760, or 750 pg/mL). The lack of responsiveness to a VEGF targeting agent indicates a significant increase in clinical benefit to the subject when the subject is not treated with a VEGF targeting agent.
- In another embodiment, the expression level of SDF-1 and OPN are determined. In this embodiment, high levels of SDF-1 and low levels of OPN are predictive of responsiveness to a VEGF targeting agent. The prediction favors responsiveness of the cancer to a cancer therapy including a VEGF targeting agent when the expression level of SDF-1 is more than 1100 pg/mL (1050, 1000, 950, 900, 850, or 800 pg/mL) and OPN is less than 75 ng/mL (80, 85, 90, 95, or 100 ng/mL). Responsiveness to a VEGF targeting agent indicates a significant increase in clinical benefit for subjects treated with a VEGF targeting agent.
- In another embodiment, the expression level of SDF-1 and at least one of PDGF-AA, IGFBP-3, VEGF-R1 or MCP-1 are determined. In this embodiment, low levels of SDF-1 in combination with either low levels of MCP-1 or high levels of PDGF-AA, IGFBP-3, or VEGF-R1 are predictive of lack of responsiveness of the cancer to treatment including a VEGF targeting agent. The prediction indicates unfavorability of including a VEGF targeting agent in the cancer therapy when the expression level of SDF-1 is less than 1100 ng/mL (1200, 1300, 1400, 1500, 1600, 1700, or 2000 pg/mL) and the expression level of MCP-1 is less than 525 pg/mL (550, 575, 600, 650, 700, or 750 pg/mL), PDGF-AA is more than 230 pg/mL (200, 175, 150, 125, 100, 75, or 50 pg/mL), IGFBP-3 is more than 700,000 ng/mL (650,000, 600,000, 550,000, 500,000 or 450,000 ng/mL) or VEGF-R1 is more than 120 pg/mL (100, 90, 80, 70 or 60 pg/mL). Lack of responsiveness to a VEGF targeting agent indicates a significant increase in clinical benefit for subjects not treated with a VEGF targeting agent.
- In another embodiment, the expression level of HGF and at least one of MCP-1 or IGF-1 are determined. In this embodiment, high levels of HGF in combination with either low levels of MCP-1 or high levels of IGF-1 are predictive of lack of responsiveness of the cancer to treatment including a VEGF targeting agent. The prediction indicates unfavorability of including a VEGF targeting agent in the cancer therapy when the expression level of HGF is more than 800 pg/mL (750, 700, 650, 600 or 550 pg/mL) and the expression level of MCP-1 is less than 525 pg/mL (550, 575, 600, 650, 700, or 750 pg/mL) or IGF-1 is more than 690 pg/mL (675, 650, 625, 600, 550, 500 pg/mL). Lack of responsiveness to a VEGF targeting agent indicates a significant increase in clinical benefit for subjects not treated with a VEGF targeting agent.
- In another embodiment, the expression level of VEGF-C and GROa are determined. In this embodiment, low levels of VEGF-C in combination with high levels of GROa are predictive of lack of responsiveness of the cancer to treatment including a VEGF targeting agent. The prediction indicates unfavorability of including a VEGF targeting agent in the cancer therapy when the expression level of VEGF-C is less than 575 pg/mL (600, 625, 650, 675, 700 or 725 pg/mL) and the expression level of GROa is more than 70 pg/mL (65, 60, 55, 50, or 45 pg/mL).
- In another embodiment, low levels of VEGF-D are predictive of responsiveness to a VEGF targeting agent. In this embodiment, the prediction favors responsiveness to a cancer therapy including a VEGF targeting agent when the expression level of VEGF-D is less than 1050 pg/mL (1075, 1100, 1125, 1150, 1175, 1200, or 1250 pg/mL). Responsiveness to a VEGF targeting agent indicates a significant increase in clinical benefit for subjects treated with a VEGF targeting agent.
- In another embodiment, median to high levels of VEGF-D are predictive of lack of responsiveness of the cancer to treatment including a VEGF targeting agent. The prediction is unfavorable for responsiveness to a cancer therapy including a VEGF targeting agent when the expression level of VEGF-D is more than 1100 pg/mL (1075, 1050, 1025, 1000, 950, or 900 pg/mL). Lack of responsiveness to a VEGF targeting agent indicates a significant increase in clinical benefit for subjects not treated with a VEGF targeting agent.
- The predictive methods described herein may be combined to provide increased significance of the results. For example, the levels of SDF-1, ANG-2 and OPN may all be determined in a sample from the subject. The levels may be compared to the reference levels and a prediction made. The prediction is favorable for responsiveness to a cancer therapy including a VEGF targeting agent if the SDF-1 levels are high, and the OPN levels are low. Alternatively, a sample with low SDF-1 and low ANG-2 will be predictive of lack of effectiveness of a VEGF targeting agent. In another embodiment, the test may further include VEGF-D, such that inclusion of a VEGF targeting agent is predictable to be favorable if the VEGF-D and OPN levels are low and the SDF-1 levels are high. Alternatively, if the VEGF-D levels are not low, but instead are in the mid to high range as compared to the reference levels and the sample has low SDF-1 and low ANG-2, then a VEGF targeting agent will be predicted to not be effective as part of the cancer therapy.
- Methods of developing a prognosis, in particular a survival or progression free survival prognosis, for a subject with pancreatic cancer is also provided herein. In one embodiment, the prognosis is independent of cancer therapeutic or cancer treatment regimen employed. In one embodiment, the subject may have localized, advanced or metastatic cancer. The method includes determining or detecting the expression level of biomarkers including IGFBP-1, PDGF-AA and at least one of IL-6 and CRP in a sample from the subject. The levels of the biomarkers present in the sample are then compared to reference levels as described above. Finally by comparison to the reference levels a prognosis for the subject can be determined.
- In one embodiment, the expression levels of IGFBP-1, PDGF-AA and IL-6 or CRP are measured and low levels are indicative of a better prognosis and high levels are indicative of poor prognosis. In one embodiment, the survival prognosis for the subject is less than 6 months when the expression level of IGFBP-1 is more than 13,000 pg/mL (12,750, 12,500, 12,000, 11,000, 10,000, 9,000 pg/mL), PDGF-AA is more than 225 pg/mL (200, 175, 150, 125, 100 or 75 pg/mL) and either IL-6 is more than 15 pg/mL (12, 10, 8, or 6 pg/mL) or CRP is more than 20,000 ng/mL (19,000, 18,000, 17,000, 16,000 or 15,000 ng/mL). In another embodiment, the survival prognosis for the subject is more than 6 months when the expression level of IGFBP-1 is less than 13,500 pg/mL (13,250, 14,000, 15,000, 16,000, 17,000 pg/mL), PDGF-AA is less than 250 pg/mL (275, 300, 325, 350 or 400 pg/mL) and either IL-6 is less than 20 pg/mL (25, 30, 40, 50, 60, or 70 pg/mL) or CRP is less than 21,000 ng/mL (22,000, 23,000, 24,000, 25,000 or 26,000 ng/mL).
- In one embodiment, the expression level of IGFBP-1, PDGF-AA and CRP and the expression level of at least one of PAI-1-total and PEDF are determined and low levels are indicative of a better prognosis and high levels are indicative of a poor prognosis. The survival prognosis for the subject is less than 6 months when the expression level of IGFBP-1 is more than 13,000 pg/mL (12,750, 12,500, 12,000, 11,000, 10,000, 9,000 pg/mL), PDGF-AA is more than 225 pg/mL (200, 175, 150, 125, 100 or 75 pg/mL), CRP is more than 20,000 ng/mL (19,000, 18,000, 17,000, 16,000 or 15,000 ng/mL), PAI-1 total is more than 27,000pg/mL (26,000, 25,000, 24,000, 23,000 or 22,000 pg/mL) and PEDF is more than 3,500 ng/mL (3250, 3000, 2750, 2500, or 2000 ng/mL). The survival prognosis for the subject is more than 6 months when the expression level of IGFBP-1 is less than 13,500 pg/mL (13,250, 14,000, 15,000, 16,000, 17,000 pg/mL), PDGF-AA is less than 250 pg/mL (275, 300, 325, 350 or 400 pg/mL), CRP is less than 21,000 ng/mL (22,000, 23,000, 24,000, 25,000 or 26,000 ng/mL), PAI-1 total is less than 28,000 pg/mL (29,000, 30,000, 31,000 or 32,000 pg/mL) and PEDF is less than 3,600 ng/mL (3750, 4000, 4250, 4500, or 5000 ng/mL). In one embodiment, the subject is being treated with gemcitabine alone.
- In another embodiment, the expression level of IGFBP-1, PDGF-AA and IL-6 and at least one of PDGF-BB and TSP-2 are determined. In this embodiment, low levels of the biomarkers are indicative of a better prognosis and high levels are indicative of a poor prognosis. The survival prognosis for the subject is less than 6 months when the expression level of IGFBP-1 is more than 13,000 pg/mL (12,750, 12,500, 12,000, 11,000, 10,000, 9,000 pg/mL), PDGF-AA is more than 225 pg/mL (200, 175, 150, 125, 100 or 75 pg/mL), IL-6 is more than 15 pg/mL (12, 10, 8, or 6 pg/mL), PDGF-BB is more than 180 pg/mL (175, 150, 125, 100, or 75 pg/mL) and TSP-2 is more than 20,000 pg/mL (19,000, 18,000, 17,000, 16,000 or 15,000 pg/mL). The survival prognosis for the subject is more than 6 months when the expression level of IGFBP-1 is less than 13,500 pg/mL (13,250, 14,000, 15,000, 16,000, 17,000 pg/mL), PDGF-AA is less than 250 pg/mL (275, 300, 325, 350 or 400 pg/mL), IL-6 is less than 20 pg/mL (25, 30, 40, 50, 60, or 70 pg/mL), PDGF-BB is less than 190 pg/mL (200, 225, 250, 300, 350 or 400 pg/mL) and TSP-2 is less than 21,000 pg/mL (22,000, 23,000, 24,000, 25,000 or 26,000 pg/mL). In one embodiment, the subject is being treated with gemcitabine and a VEGF targeting agent.
- In another embodiment, the expression level of at least one of ICAM-1, Ang2, IL-8, TSP-2, VCAM-1, PAI-1, and IGF-1 are determined. In this embodiment, low levels of ICAM-1, Ang2, IL-8, TSP-2, VCAM-1, or PAI-1-active as compared to the reference level are indicative of a better prognosis and high levels of ICAM-1, Ang2, IL-8, TSP-2, VCAM-1, or PAI-1-active as compared to the reference level are indicative of a poor prognosis. In this embodiment, high levels of IGF-1 as compared to the reference level is indicative of a better prognosis and low levels of IGF-1 as compared to the reference level is indicative of a poor prognosis.
- In one embodiment, the survival prognosis for the subject is less than 6 months when the expression level of IGFBP-1 is more than 13,000 pg/mL (12,750, 12,500, 12,000, 11,000, 10,000, 9,000 pg/mL), or ICAM-1 is more than 350 ng/mL (300, 275, 250, 225, or 200 ng/mL), or Ang2 is more than 300 pg/mL (275, 250, 225, 200, 175 or 150 pg/mL), or CRP is more than 20,000 ng/mL(19,000, 18,000, 17,000, 16,000 or 15,000 ng/mL), or IL-8 is more than 49 pg/mL (45, 40, 35, 30 or 25 pg/mL), or IL-6 is more than 17 pg/mL(15, 12, 10, 8, or 6 pg/mL), or TSP-2 is more than 20,000 pg/mL (19,000, 18,000, 17,000, 16,000 or 15,000 pg/mL), or VCAM-1 is more than 1,600 ng/mL (1500, 1400, 1300, 1200 or 1100 ng/mL), or PAI-1-active is more than 2200 pg/mL (2100, 2000, 1900, 1800 or 1700 pg/mL), or IGF-1 is less than 700 pg/mL (750, 800, 850, 900, or 1000 pg/mL).
- In one embodiment, survival prognosis for the subject is more than 6 months when the expression level of IGFBP-1 is less than 13,500 pg/mL (13,250, 14,000, 15,000, 16,000, 17,000 pg/mL), or ICAM-1 is less than 360 ng/mL (375, 400, 425, 450, 475, or 500 ng/mL), or Ang2 is less than 305 pg/mL (310, 320, 330, 340, 350, 400, 450, or 500 pg/mL), or CRP is less than 21,000 ng/mL (22,000, 23,000, 24,000, 25,000 or 26,000 ng/mL), or IL-8 is less than 50 pg/mL (55, 60, 65, 70, 75, 80 or 85 pg/mL), or IL-6 is less than 18 pg/mL (20, 25, 30, 40, 50, 60, or 70 pg/mL), or TSP-2 is less than 21,000 pg/mL (22,000, 23,000, 24,000, 25,000 or 26,000 pg/mL), or VCAM-1 is less than 1,700 ng/mL (1800, 1900, 2000, 2100 or 2200 ng/mL), or PAI-1-active is less than 2300 pg/mL (2400, 2500, 2600, 2700, 2800 or 2900 pg/mL), or IGF-1 is more than 690 pg/mL (675, 650, 625, 600, 550, 500 or 450 pg/mL).
- Methods of developing a treatment plan for a subject with cancer are also provided herein. Treatment plans may be developed using the predictions of the responsiveness of the cancer to treatment with a cancer therapy including an antibody specific for VEGF-A obtained using the methods described herein to determine whether treatment of the subject with a cancer therapy including a VEGF targeting agent may be beneficial. The treatment plan will include a VEGF targeting agent if such a therapeutic is expected to be beneficial and the treatment plan will not include a VEGF targeting agent if it is not predicted to be clinically beneficial to the subject as described above.
- The following examples are meant only to be illustrative and are not meant as limitations on the scope of the invention or of the appended claims.
- Eligibility of patients evaluated in this correlative analysis was described previously (Kindler et al., J Clin Oncol 2010 28(22):3617-3622). Briefly, eligible patients had histologically- or cytologically-confirmed pancreatic adenocarcinoma not amenable to curative surgery. Measurable disease was not required. Prior chemotherapy for metastatic disease was not permitted. Adjuvant chemotherapy was allowed if it did not contain gemcitabine or bevacizumab, if it was given more than 4 weeks before enrollment, and if the patient had subsequent disease progression. Prior radiation was allowed if it was completed at least 4 weeks prior to enrollment and there was disease outside the radiation port. Patients were required to be at least 18 years of age and have a life expectancy of at least 12 weeks. Written informed consent was obtained from all patients participating in this correlative analysis. Table 2 provides the demographic information for the patients.
Table 2. Patient Characteristics Overall Whole population Overall EDTA population Gem + Placebo Gem + Bev % No. % No. % No. % No. patients 602 328 159 169 Age, years Median 64.1 64.0 65.5 63.1 Range 26.3 - 88.7 35.8 - 84.2 35.8 - 83.7 35.9 - 84.2 Gender male 55 55 48 62 Race white 88 89 91 88 ECOG PS 0 37 40 39 40 1 52 50 53 48 2 11 10 8 12 Extent of disease Locally adv. 12 12 12 12 Metastatic 88 88 88 88 Median OS (range) 5.9 (5.3 - 6.5) 6.1 (5.5 - 6.9) 6.3 (5.1 - 8.0) 5.9 (5.0 - 7.0) Median PFS (range) 3.5 (3.0-3.8) 3.8 (3.3 - 4.0) 3.5 (2.4 - 4.2) 3.8 (3.5 - 4.6) - Gemcitabine (1,000mg/m2) was administered intravenously over 30 minutes on
days days - Peripheral venous blood was collected from consenting patients into lavender (EDTA anticoagulant) vacutainers for plasma isolation. The tubes were centrifuged at 2500 g for 15 minutes within 30 minutes of collection. Plasma was aliquoted into cryovials, snap frozen, and samples shipped for centralized storage at the CALGB Pathology Coordinating Office. Before analysis, all patient samples were shipped to our laboratory (Duke/CALGB Molecular Reference Lab), thawed on ice, re-aliquoted based on specific assay requirements and stored at -80°C. All assays were performed in triplicate after 2 freeze-thaw cycles only and all analysis was conducted while blinded to clinical outcome.
- Thirty-two biomarkers were analyzed using Searchlight platform (Aushon Biosystems, Inc., Billerica, MA) following manufacturer's protocol. Markers are listed in Table 1 above. Additional ELISA assays were conducted for IGF-1 (Immunodiagnostic Systems, Inc.; Scottsdale, Az) and TGFβRIII (R&D Systems, Inc.). Plasma samples were thawed on ice, centrifuged at 20,000 x g for 5 min to remove precipitate and loaded onto SearchLight plates with standard protein controls. Samples and standards were incubated at room temperature for 1 hour with shaking at 950 rpm (Lab-Line Titer Plate Shaker, Model 4625, Barnstead, Dubuque, IA). Plates were washed three times using a plate washer (Biotek Instruments, Inc., Model ELx405, Winooski, VT), biotinylated secondary antibody added, and incubated for 30 min. After washes, streptavidin-HRP was added, incubated for 30 min, washed again, and SuperSignal substrate added. Images were taken within 10 min, followed by image analysis using SearchLight array analyst software.
- Data from the 328 patients of metastatic pancreatic cancer treated with gemcitabine and bevacizumab demonstrate that the methods are highly reproducible. For 23 of 29 targets analyzed in EDTA using SearchLight Technology, coefficients of variation were less than 20%. See Table 3. Both the TGFβRIII and IGF-1 assays were performed using standard ELISA procedures and had coefficients of variation below 5%.
Table 3: Coefficients of Variation for Analytes tested Analyte Average CV Analyte Average CV 1 TGFβ-RIII 2.60 17 ICAM-1 14.42 2 IGF-1 3.73 18 IGFBP-1 14.46 3 P-selectin 7.46 19 PEDF 14.68 4 IGFBP-3 7.94 20 ANG2 14.75 5 HGF 8.12 21 VEGF-R2 14.89 6 TSP-2 8.76 22 TGFβ2 15.20 7 SDF-1 9.44 23 PDGF-AA 17.69 8 VCAM-1 10.01 24 VEGF 17.90 9 PAI1 total 10.07 25 VEGF-C 19.01 10 MCP-1 10.37 26 FGFb 20.09 11 VEGF-D 10.69 27 PLGF 22.11 12 IL-6 10.72 28 OPN 22.98 13 PAI1 active 11.30 29 GROα 24.26 14 PDGF-BB 12.21 30 IL-8 24.70 15 TGFβ1 12.48 31 CRP 27.34 16 VEGF-R1 13.25 - Patterns of expression were analyzed at baseline and were correlated with overall survival (OS) and progression free survival (PFS) using univariate Cox proportional hazard regression models and multivariate Cox models with leave-one-out cross validation. Spearman's rank correlation coefficients were calculated for all pairs of analytes. Unsupervised hierarchical clustering of analytes was also performed to produce dendrogram plots. Data indicate that several analyte clusters reflect known biological categories. This data is summarized in
Figure 1 below. - Prior to statistical analysis, all data was initially reviewed for accuracy and quality. Any study samples that fell outside the linear portion of the standard curve were retested. Samples that read below the limit of detection were retested at a lower dilution, if possible. Samples that read above the linear portion of the standard curve were serially diluted and retested to obtain accurate measurements. Any analyte that did not meet the aforementioned criteria resulted in the sample being re-evaluated. In the case of samples reading below the assay's limit of detection that cannot be re-assayed, we have developed imputation methods to derive a number for such samples, allowing for inclusion into our statistical approaches.
- The primary endpoint of interest will be overall survival (OS) with correlation to the blood analytes; however, progression-free survival (PFS) was evaluated. Cox regression analysis was performed to assess the prognostic value of blood analytes for the clinical endpoints of interest. For each analyte, univariate Cox regression analysis was performed to assess the associations with OS and PFS (α=0.01). Cox regression models were performed for Gem+Placebo and Gem+Bev separately. Raw, continuous analytes intensities for baseline measures were used. Summary statistics included the hazard ratios and associated confidence intervals. For each analyte, the inclusion of potential confounding factors was explored. These factors included; gender, extent of disease (locally advanced vs metastatic), age (continuous), and performance status (0, 1, 2).
- For PFS and OS, prognostic models were built with multivariate Cox regression analysis using the most informative analytes chosen from leave-one-out cross-validation for Gem+Placebo and Gem+Bev separately. At each leave-one-out iteration, the training samples were used to build a Cox regression model for predicting the survival of the testing samples. The predicted survival times were used to split the groups in half into high and low risk groups. Kaplan-Meier estimates of the hazard profiles for these two groups were produced.
- Out of the 602 patients who accrued to the parent protocol, baseline EDTA plasma samples were available on 328 patients, 159 pts in the gemcitabine/placebo group and 169 in the gemcitabine/bevacizumab group. The clinical characteristics and outcomes of these patients were similar to those on the parent study. Additionally, the two cohorts in this correlative study had similar characteristics across both groups, except for a minor imbalance in gender (Table 2 above).
- Thirty-one factors related to angiogenesis, inflammation, and coagulation were evaluated; standard ELISAs were used to evaluate IGF-1 and TGFβRIII while the SearchLight system (Aushon BioSystems) was used to evaluate the remaining analytes. Multiplex analyses demonstrated good sensitivity and coefficient's of variation (CVs) were generally in the range of 10-30%. (Table 3). Only 2 analytes (P1GF and bFGF) had levels below the limits of quantification for greater than 10% of patients evaluated.
- The median and range (high/low) for all analytes at baseline are provided in Table 4. Analyte values are presented in pg/mL or ng/mL, unless otherwise noted and data is provided for the study as a whole, as well as separated based on assigned cohort (
trt 1= bevacizumab-treated cohort; trt 2= placebo control cohort).Table 4: Analyte concentrations measured including Median and Range Baseline Analyte trt N Median Min Max Ang2(pg/mL) All 328 301.42 9.85 3150.67 Ang2(pg/mL) 1 169 294.33 9.85 2761.5 Ang2(pg/mL) 2 159 308.33 25.5 3150.67 CRP(ng/mL) All 328 20178.5 14.2 942048 CRP(ng/mL) 1 169 23506 14.2 942048 CRP(ng/mL) 2 159 18406 31 854967 FGFb(pg/mL) All 328 25.6 0.86 1120.6 FGFb(pg/mL) 1 169 23.93 0.86 1120.6 FGFb(pg/mL) 2 159 27.18 0.86 511.33 GROα(pg/mL) All 328 70.8 7.33 769 GROα(pg/mL) 1 169 75.47 7.33 769 GROα(pg/mL) 2 159 62.27 7.6 448.4 HGF(pg/mL) All 328 817.37 251.6 100900 HGF(pg/mL) 1 169 842.53 251.6 57834 HGF(pg/mL) 2 159 782 267.13 100900 ICAM-1(ng/mL) All 328 354.97 2.83 2498.68 ICAM-1(ng/mL) 1 169 365.2 2.83 2498.68 ICAM-1(ng/mL) 2 159 337.7 22.8 1811.95 IGFBBP-3(ng/mL) All 328 709577 4216.67 2184373 IGFBBP-3(ng/mL) 1 169 713357 4216.67 1795190 IGFBBP-3(ng/mL) 2 159 699490 22260 2184373 IGFBP-1(pg/mL) All 328 13253.3 86.67 1028290 IGFBP-1(pg/mL) 1 169 13016.7 546.67 1028290 IGFBP-1(pg/mL) 2 159 14010 86.67 190060 IGF-1(pg/mL) All 328 697.02 56.64 3398.03 IGF-1(pg/mL) 1 169 704.51 56.64 3398.03 IGF-1(pg/mL) 2 159 637.25 126.34 1768.5 IL-6(pg/mL) All 328 17.47 2.8 1105.33 IL-6(pg/mL) 1 169 17.73 2.8 1105.33 IL-6(pg/mL) 2 159 17.2 3.07 691.2 IL-8(pg/mL) All 328 49.2 0.59 2061.93 IL-8(pg/mL) 1 169 47.33 0.6 2061.93 IL-8(pg/mL) 2 159 52.47 0.59 757.87 MCP-1(pg/mL) All 328 521.75 146.67 3445.5 MCP-1(pg/mL) 1 169 526.33 159 1653.67 MCP-1(pg/mL) 2 159 517 146.67 3445.5 OPN(ng/mL) All 328 74.06 1.55 1036.38 OPN(ng/mL) 1 169 75.55 1.55 1036.38 OPN(ng/mL) 2 159 69.32 1.56 292.35 PAI1-act(pg/mL) All 328 2295.2 3.8 31039.47 PAI1-act(pg/mL) 1 169 2110.33 3.8 29658.27 PAI1-act(pg/mL) 2 159 2517.73 121.07 31039.47 PAI1-tot(pg/mL) All 328 27861.7 175.77 259313.3 PAI1-tot(pg/mL) 1 169 29570 175.77 259313.3 PAI1-tot(pg/mL) 2 159 25866.7 5230 189496.7 PDGF-AA(pg/mL) All 328 239.2 0.47 5746.8 PDGF-AA(pg/mL) 1 169 242.13 0.47 5746.8 PDGF-AA(pg/mL) 2 159 219.93 14.87 3544.67 PDGFbb(pg/mL) All 328 185.4 0.27 2226.47 PDGFbb(pg/mL) 1 169 183.33 0.27 2226.47 PDGFbb(pg/mL) 2 159 190.27 5.85 1386.13 PEDF(pg/mL) All 328 3549283 2636.55 7855183 PEDF(pg/mL) 1 169 3562750 2636.55 7855183 PEDF(pg/mL) 2 159 3496300 225900 7364000 P-Selectin(ng/mL) All 328 53.59 3.63 624.47 P-Selectin(ng/mL) 1 169 52.61 3.63 624.47 P-Selectin(ng/mL) 2 159 54.27 8.64 376.42 PlGF(pg/mL) All 328 5 0.13 363.13 PlGF(pg/mL) 1 169 4.8 0.13 363.13 PlGF(pg/mL) 2 159 5.4 0.27 186.67 SDF-1(pg/mL) All 328 1103.03 11.25 36383.73 SDF-1(pg/mL) 1 169 1126.93 11.25 36383.73 SDF-1(pg/mL) 2 159 1021 88.6 5769 TGFβ1(pg/mL) All 326 36239.2 37.83 206971.7 TGFβ1(pg/mL) 1 168 37178.3 37.83 206971.7 TGFβ1(pg/mL) 2 158 32958.3 3818.33 192765 TGFβ2(pg/mL) All 328 56.73 5.6 1286.87 TGFβ2(pg/mL) 1 169 56.73 8.73 440.93 TGFβ2(pg/mL) 2 159 56.73 5.6 1286.87 TGFβ-R3(pg/mL) All 328 410.59 4.64 1011.55 TGFβ-R3(pg/mL) 1 169 411.15 4.64 1011.55 TGFβ-R3(pg/mL) 2 159 408.59 104.13 902.08 TSP-2(pg/mL) All 328 20689.1 1528.5 451368.7 TSP-2(pg/mL) 1 169 22708.7 1528.5 451368.7 TSP-2(pg/mL) 2 159 19353.3 5776 224395 VCAM-1(pg/mL) All 328 1614000 880 7971367 VCAM-1(pg/mL) 1 169 1621583 880 7199817 VCAM-1(pg/mL) 2 159 1599333 225900 7971367 VEGF(pg/mL) All 328 89.57 1.91 12678.2 VEGF(pg/mL) 1 169 95.93 1.91 12678.2 VEGF(pg/mL) 2 159 82.47 1.91 3090.2 VEGF-C(pg/mL) All 328 572.37 10.2 34037.87 VEGF-C(pg/mL) 1 169 588.53 10.2 34037.87 VEGF-C(pg/mL) 2 159 554.3 44.19 4732.27 VEGF-D(pg/mL) All 328 1558.1 70.31 25382.27 VEGF-D(pg/mL) 1 169 1574.07 70.31 13233.27 VEGF-D(pg/mL) 2 159 1553.73 159.93 25382.27 VEGF-R1(pg/mL) All 328 122.97 8.2 43692.6 VEGF-R1(pg/mL) 1 169 130.33 8.2 16940.47 VEGF-R1(pg/mL) 2 159 112.93 12.53 43692.6 VEGF-R2(pg/mL) All 328 3790.5 34.17 39032.83 VEGF-R2(pg/mL) 1 169 3806.67 34.17 39032.83 VEGF-R2(pg/mL) 2 159 3731.33 826.33 35116.17 - To identify patterns of expression among analytes, Spearmen correlations were performed on all analytes and the following dendrogram was generated (
Figure 1 ). Interesting and biologically relevant associations were noted. These include associations within the VEGF/PDGF families, as well as a broader association observed for multiple inflammatory markers. Strong correlation coefficients (>0.70) were noted for only two pairs of analytes; TGFβ1 and PDGF-AA (0.76), CRP and IL-6 (0.72). - Univariate and multivariate Cox regression models were used to identify markers with statistically significant prognostic impact. Due to observed treatment-by-analyte interactions, both univariate and multivariate prognostic analyses were conducted separately for the gemcitabine/placebo and the gemcitabine/bevacizumab groups. In the univariate analysis, IGFBP-1, ICAM-1, Ang-2, CRP, IL-8, TSP-2, VCAM-1, PAI1 active, IGF-1, PAI1-total and P-selectin were significantly correlated with overall survival in the gemcitabine/placebo group (Table 5). In the univariate analysis, IGFBP-1, ICAM-1, Ang-2, CRP, IL-8, TSP-2, VCAM-1, PAI1 active, and IGF-1 were significantly correlated with progression free survival in the gemcitabine/placebo group (Table 6). All markers remained significant (p<0.05) after accounting for multiple parameter testing using bonferroni correction methodologies.
Table 5. Baseline Univariate EDTA Prognostic Markers for Gem+Placebo (OS) < median > median < med vs > med p-value* Median Survival 95% CI Median Survival 95% CI Hazard ratio 95% CI IGFBP-1 1.2E-10 9.2 (7.3,9.9) 4.3 (3.1,5.7) 1.7 (1.2,2.4) ICAM-1 7.8E-08 8.4 (6.1,9.7) 4.8 (3.5,6.8) 1.4 (1.01,1.90) Ang2 1.5E-07 9.6 (7.7,10.4) 4.6 (3.3,5.8) 2.4 (1.7,3.3) CRP 6.9E-07 9.7 (8.1,10.6) 3.8 (2.9,4.8) 2.3 (1.6,3.1) IL-8 0.000013 8.7 (6.1,9.7) 5.0 (3.5,6.9) 1.3 (0.98,1.86) TSP-2 0.00007 9.0 (6.8,9.7) 4.6 (3.3,5.6) 1.6 (1.1,2.1) VCAM-1 0.00021 9.0 (6.7,9.7) 4.8 (3.6,5.9) 1.6 (1.2,2.3) PAI1-act 0.00043 8.1 (6.7,9.2) 4.8 (3.4,5.9) 1.3 (0.94,1.77) IGF-1 0.0012 4.2 (3.3,5.6) 9.0 (6.8,9.7) 0.65 (0.47,0.89) PAI1-tot 0.004 7.4 (5.9,9.6) 4.6 (3.3,7.7) 1.3 (0.98,1.84) P-Selectin 0.0062 8.5 (5.8,9.9) 5.7 (3.9,6.8) 1.6 (1.1,2.1) Above is a list of analytes that is prognostic univariately for overall survival using the Cox Proportional Hazard model. On the right hand side, it indicates the median survival time and its 95% CI for less than median and greater than median level of the analytes. All analytes presented remain significant (p<0.05) after accounting for multiple parameter testing using bonferroni correction methods.
*from Cox proportional hazard model using continuous analyte values.Table 6. Univariate Progression-Free Survival Prognostic Markers at baseline (EDTAs) for Gem+Placebo < median > median < med vs > med p-value* Median Survival 95% CI Median Survival 95% CI Hazard ratio 95% CI IGFBP-1 0.00001 4.2 (3.5,5.6) 2.5 (2.0,3.9) 1.4 (1.1,2.0) ICAM-1 6.9E-07 4.0 (2.8,5.5) 2.8 (2.0,4.2) 1.2 (0.85,1.62) Ang2 0.000046 4.9 (3.3,5.6) 2.2 (2.0,3.9) 1.7 (1.2,2.3) CRP 0.00013 5.5 (4.1,5.8) 2.1 (1.8,2.8) 2.1 (1.5,2.9) IL-8 0.000017 4.6 (3.7,5.5) 2.3 (2.0,3.6) 1.3 (0.97,1.8) TSP-2 0.0043 4.1 (2.7,5.5) 2.9 (2.1,4.2) 1.6 (1.1,2.1) VCAM-1 0.002 4.7 (2.7,5.8) 2.8 (2.1,3.9) 1.7 (1.2,2.3) PAI1-act 0.046 4.2 (2.9,5.5) 2.5 (2.0,4.0) 1.2 (0.88,1.67) IGF-1 0.006 2.4 (2.0,3.9) 4.6 (3.5,5.6) 0.69 (0.50,0.94) Above is a list of analytes that is prognostic univariately for overall survival using the Cox Proportional Hazard model. On the right hand side, it indicates the median survival time and its 95% CI for less than median and greater than median level of the analytes. All analytes presented remain significant (p<0.05) after accounting for multiple parameter testing using bonferroni correction methods.
*from Cox proportional hazard model using continuous analyte values. - TSP-2, CRP, IL-6, IGFBP-1, Ang-2, ICAM-1, VCAM-1, and IGF-1 were significantly correlated with overall survival in the gemcitabine/bevacizumab group (Table 7). TSP-2, CRP, IL-6, IGFBP-1, Ang-2, ICAM-1, and VCAM-1 were significantly correlated with progression free survival in the gemcitabine/bevacizumab group (Table 8). It should be noted that high consistency was observed across both cohorts. All of these factors were unfavorable prognostic markers, where higher levels were associated with a less favorable outcome. The only notable exception was IGF-1, where higher levels were associated with a more favorable outcome. Additionally, all of these markers remained prognostic after correction for known clinical prognostic variables, including age, race, gender and performance status. Tables 9 and 10 are composite lists of analytes that are prognostic for overall survival and progression free survival irrespective of treatment condition, respectively.
Table 7. Baseline Univariate EDTA Prognostic Markers for Gem+Bevacizumab (OS) < median > median < med vs > med p-value* Median Survival 95% CI Median Survival 95% CI Hazard ratio 95% CI TSP-2 2.6E-08 6.1 (5.2,7.4) 5.7 (4.1,7.1) 1.3 (0.9,1.7) CRP 2.7E-08 7.4 (5.9,9.5) 4.6 (3.5,5.8) 1.9 (1.4,2.6) IL-6 1.4E-07 8.4 (7.0,9.7) 3.8 (3.1,4.8) 2.3 (1.7,3.2) IGFBP-1 8.3E-07 8.0 (6.5,9.7) 4.1 (3.2,5.3) 2.2 (1.6,3.0) Ang2 1.7E-06 7.0 (5.5,15.0) 4.8 (3.8,6.5) 1.4 (1.1,2.0) ICAM-1 0.00027 6.8 (5.5,8.3) 5.0 (4.0,6.8) 1.5 (1.1,2.0) VCAM-1 0.0012 7.1 (5.5,8.1) 5.3 (4.1,6.5) 1.5 (1.1,2.0) IGF-1 0.0019 4.8 (3.7,5.9) 7.1 (5.7,8.1) 0.72 (0.53,0.97) Above is a list of analytes that is prognostic univariately for overall survival using the Cox Proportional Hazard model. On the right hand side, it indicates the median survival time and its 95% CI for less than median and greater than median level of the analytes. All analytes presented remain significant (p<0.05) after accounting for multiple parameter testing using bonferroni correction methods.
*from Cox proportional hazard model using continuous analyte values.Table 8. Univariate Progression-Free Survival Prognostic Markers at baseline (EDTAs) for Gem+Bev < median > median < med vs > med p-value* Median Survival 95% CI Median Survival 95% CI Hazard ratio 95% CI TSP-2 0.00000035 3.8 (3.5,5.7) 3.8 (2.8,5.0) 1.2 (0.88,1.64) CRP 0.0000075 5.5 (3.8,7.0) 3.3 (2.1,3.9) 1.7 (1.3,2.3) IL-6 0.0003 6.1 (5.0,7.3) 2.4 (2.0,3.8) 2.3 (1.7,3.1) IGFBP-1 0.000018 5.5 (3.8,7.0) 3.0 (2.0,3.8) 1.7 (1.3,2.3) Ang2 0.0000068 5.3 (3.8,6.9) 3.1 (2.0,4.0) 1.4 (1.002,1.85) ICAM-1 0.000044 4.3 (3.7,6.4) 3.7 (2.5,4.1) 1.4 (1,1.84) VCAM-1 0.014 3.9 (3.7,6.2) 3.8 (2.5,4.8) 1.3 (0.98,1.82) Above is a list of analytes that is prognostic univariately for progression free survival using the Cox Proportional Hazard model. On the right hand side, it indicates the median survival time and its 95% CI for less than median and greater than median level of the analytes. All analytes presented remain significant (p<0.05) after accounting for multiple parameter testing using bonferroni correction methods.
*from Cox proportional hazard model using continuous analyte valuesTable 9 Univariate Overall Survival Prognostic Markers at baseline (EDTAs) for Gem-based treatments < median > median < med vs > med p-value* Median Survival 95% CI Median Survival 95% CI Hazard ratio 95% CI CRP 3E-14 8.7 (7.4,9.7) 4.4 (3.6,5.0) 2.1 (1.7,2.6) Ang2 1.3E-13 8.1 (6.9,9.5) 4.6 (3.8,5.9) 1.8 (1.4,2.2) IGFBP-1 1.4E-12 8.7 (7.3,9.7) 4.2 (3.4,5.0) 1.9 (1.6,2.4) TSP-2 4.9E-12 7.3 (6.1,9.1) 5.0 (4.2,6.5) 1.4 (1.1,1.8) ICAM-1 1.5E-10 7.3 (6.4,9.0) 4.9 (4.3,6.3) 1.4 (1.1,1.8) IL-6 6E-8 9.3 (8.3,9.9) 3.8 (3.2,4.6) 2.4 (1.9,3.0) VCAM-1 8E-7 7.5 (6.9,9.1) 5.0 (4.3,5.9) 1.6 (1.3,1.9) IGF-1 0.000027 4.6 (3.7,5.4) 7.4 (6.7,8.6) 0.68 (0.55,0.85) PAI1-act 0.00011 7.2 (6.5,8.4) 5.0 (4.1,5.9) 1.3 (1.04,1.61) P-Selectin 0.0019 7.4 (6.1,9.1) 5.4 (4.7,6.3) 1.5 (1.2,1.8) OPN 0.0039 8.1 (6.8,9.5) 4.8 (4.3,5.9) 1.5 (1.2,1.8) MCP-1 0.0077 7.4 (6.4,9.1) 4.8 (4.1,6.0) 1.4 (1.1,1.7) PAI1-tot 0.0081 7.1 (6.0,9.0) 4.8 (4.1,6.5) 1.4 (1.1,1.7) Above is a list of analytes that is prognostic univariately for progression free survival using the Cox Proportional Hazard model. On the right hand side, it indicates the median survival time and its 95% CI for less than median and greater than median level of the analytes. All analytes presented remain significant (p<0.05) after accounting for multiple parameter testing using bonferroni correction methods.
*from Cox proportional hazard model using continuous analyte valuesTable 10 Univariate Progression-Free Survival Prognostic Markers at baseline (EDTAs) for Gem-based treatment < median > median < med vs > med p-value* Median Survival 95% CI Median Survival 95% CI Hazard ratio 95% CI CRP 5.8E-09 5.5 (4.0,5.8) 2.4 (2.1,3.3) 1.9 (1.5,2.3) Ang2 5.6E-10 5.2 (3.8,5.7) 2.5 (2.1,3.7) 1.5 (1.2,1.8) IGFBP-1 4.6E-10 4.8 (3.9,5.7) 2.7 (2.1,3.7) 1.6 (1.3,2.0) TSP-2 1.4E-08 3.9 (3.5,5.5) 3.5 (2.5,4.0) 1.3 (1.07,1.67) ICAM-1 1E-10 4.0 (3.7,5.5) 3.3 (2.5,3.9) 1.3 (1.01,1.57) IL-6 0.00062 5.5 (4.8,6.3) 2.2 (2.0,2.9) 2.3 (1.8,2.9) VCAM-1 0.000052 4.4 (3.7,5.6) 3.3 (2.5,3.9) 1.5 (1.2,1.9) IGF-1 0.0093 2.9 (2.3,3.8) 4.1 (3.8,5.5) 0.79 (0.64,0.99) PAI1-act 0.0071 3.9 (3.7,5.5) 3.3 (2.3,4.0) 1.3 (1.002,1.55) P-Selectin 0.1 3.9 (3.4,5.4) 3.7 (2.5,4.0) 1.3 (1.06,1.64) OPN 0.012 3.9 (3.5,5.5) 3.5 (2.8,4.0) 1.3 (1.04,1.63) MCP-1 0.000098 3.9 (3.5,5.5) 3.4 (2.4,4.0) 1.2 (1.00,1.55) PAI1-tot 0.14 3.9 (3.6,5.5) 3.4 (2.6,4.0) 1.2 (0.94,1.45) Above is a list of analytes that is prognostic univariately for progression free survival using the Cox Proportional Hazard model. On the right hand side, it indicates the median survival time and its 95% CI for less than median and greater than median level of the analytes. All analytes presented remain significant (p<0.05) after accounting for multiple parameter testing using bonferroni correction methods.
*from Cox proportional hazard model using continuous analyte values - Multivariate prognostic models for OS (and PFS) were developed using a leave one out, cross-validation approach. Using this methodology, two 5-analyte models for risk were developed, one for the gemcitabine + placebo cohort, and another for gemcitabine + bevacizumab cohort (see Table 11). The gemcitabine + placebo model for OS consisted of IGFBP-1, CRP, PDGF-AA, PAI1-total, and PEDF. This model was associated with a hazard ratio of 2.0, with corresponding median survivals of 3.3 and 7.3 months for the high and low risk groups, respectively. The gemcitabine + bevacizumab model consisted of IGFBP-1, IL-6, PDGF-AA, PDGF-BB, and TSP-2. This model was associated with a hazard ratio of 2.1, with corresponding median survivals of 3.6 and 7.2 months for the high and low risk groups, respectively. All analytes appeared in greater than 95% of the models derived during analysis. Furthermore, analytes were observed to be consistent across the models. This data is represented in the Kaplan-Meier plots shown in
Figure 2 . For both the gemcitabine + placebo model (panel A) and the gemcitabine + bevacizumab model (panel B) the high-risk groups are shown in solid lines, while the low risk groups are shown in dashed lines. In both cases, an approximate two-fold change in median survival was noted.Table 11. Baseline Multivariate EDTA Prognostic Models for Gem+Placebo and Gem+Bev (OS) High risk group Low risk group Models analytes p- value HR 95% CI N/ (cen) Median Survival 95% CI N/ (cen) Median Survival 95% CI Gem + Placebo IGFBP-1 CRP PDGF-AA PAI-1 total PEDF <.0001 2.0 (1.4, 2.7) 79 (0) 3.3 (2.6, 4.6) 79 (1) 7.3 (5.8, 8.6) Gem + Bev IGFBP-1 IL-6 PDGF-AA PDGF-BB TSP-2 <.0001 2.1 (1.5, 2.8) 85 (1) 3.6 (2.6, 4.7) 83 (0) 7.2 (5.8, 9.7) (cen) = censored - Predictive markers were identified using the Cox proportional hazards model. Analyte values were evaluated at both median and quartile cutpoints. Three markers were identified as being predictive for bevacizumab benefit (or lack of benefit); VEGF-D, SDF1, and Ang-2. See Table 12. We observed that low levels (below median) of both Ang-2 (p=0.035) and SDF-1 (p=0.027) predicted for greater benefit in the gemcitabine + placebo group (i.e., worse survival in the gemcitabine + bevacizumab group). Interestingly, when VEGF-D was evaluated using quartile cutpoints, low levels (below Q1, lowest 25% or less than 1092.35 pg/mL VEGF-D) predicted for benefit from bevacizumab (p=0.033) while higher levels (above Q1, top 75% or more than 1092.35 pg/mL VEGF-D) of VEGF-D predicted for lack of benefit from bevacizumab (p=0.035). The data is shown graphically in
Figure 3 . Again, low levels of Ang-2 and SDF-1 favored the placebo group, but a non-significant trend was noted for higher levels of these analytes predicting for benefit from bevacizumab. VEGF-D was seen to be predictive across both sides of the Q1 split.Table 12. Univariate Overall Survival Predictive Markers at baseline (EDTAs) for Gem+Bev vs Gem+Placebo Gem+Placebo Gem+Bev Analyte Cutoff p- value HR 95% CI Median Survival 95% CI Median Survival 95% CI Ang2 <median 0.0346 1.4 (1.02, 1.92) 9.6 (8.1, 10.6) 7.0 (5.7, 8.7) SDF-1 <median 0.0273 1.4 (1.04, 1.94) 8.4 (6.3, 9.7) 5.4 (4.8, 7.4) SDF-1 < Q1 0.0304 1.6 (1.04, 2.56) 9.2 (5.9, 10.7) 4.9 (3.3, 7.9) VEGF-D > Q1 0.0346 1.3 (1.04, 1.74) 6.9 (5.7, 9.0) 5.8 (4.8, 7.1) VEGF-D < Q1 0.0332 0.6 (0.39, 0.96) 5.4 (3.6, 9.4) 6.5 (5.0, 11.0) - Next, the predictive impact of analyte pairs was evaluated. All pairs tested contained a factor that was found to be predictive upon univariate analysis. This bivariate analysis identified 12 pairs of analytes that were statistically significant predictors of benefit or lack of benefit from bevacizumab after correction for multiple testing (Table 13). The bivariate model which most strongly predicted for improved survival in the gemcitabine + bevacizumab group was the combination of SDF-1b (>median) and OPN (<median). See
Figure 4 . The model was associated with a hazard ratio of 0.55, with corresponding median survivals of 5.1 and 9.0 months for the gemcitabine + placebo group (shown in dashed lines) and gemcitabine + bevacizumab (shown in solid lines), respectively. Alternatively, the bivariate model which most strongly predicted for worse survival in the gemcitabine + bevacizumab group was found to be SDF1 (< median) and Ang2 (< median). SeeFigure 5 . This model was associated with a hazard ratio of 2.2, with corresponding median survivals of 10.4 and 6.7 months for the gemcitabine + placebo group (shown in dashed lines) and gemcitabine + bevacizumab (shown in solid lines).Table 13. Bivariate Overall Survival Predictive Markers at baseline (EDTAs) for Gem+Bev vs Gem+placebo using a median cutoff. Gem+Placebo Gem+Bev Analyte cutoff Analyte cutoff p-value HR 95% CI N Median Survival 95% CI N Median Survival 95% CI SDF-1 <med PDGF-AA >med 0.0047 2.2 (1.3, 3.7) 29 (1) 7.7 (4.8, 9.1) 34 (0) 4.7 (3.8, 7.2) SDF-1 <med IGFBP-3 >med 0.0054 1.2 (1.9, 2.9) 45 (0) 8.6 (6.7, 10.6) 39 (0) 5.2 (4.8, 7.5) SDF-1 <med VEGF-R1 >med 0.0058 1.9 (1.2, 3.2) 34 (1) 9.1 (5.9, 12.4) 41 (0) 4.9 (4.1, 7.2) SDF-1 <med MCP-1 <med 0.0062 1.8 (1.2, 2.7) 49 (1) 9.7 (8.5, 12.9) 44 (0) 5.9 (4.8, 7.9) SDF-1* >med OPN* <med 0.0073 0.55 (0.35, 0.85) 39 (0) 5.1 (3.2, 8.1) 43 (0) 9.0 (5.8, 13.4) ANG-2 <med SDF-1 <med 0.0005 2.2 (1.4, 3.4) 46 (1) 10.4 (8.6, 15.0) 42 (0) 6.7 (4.9, 7.9) ANG-2 <med FGFb <med 0.0053 1.2 (1.9, 3.1) 30 (1) 10.5 (8.7, 19.1) 51 (0) 6.9 (5.7, 9.5) ANG-2 <med OPN >med 0.0055 2.1 (1.2, 3.6) 30 (1) 8.7 (6.8, 11.6) 36 (0) 5.4 (4.8, 7.2) ANG-2 <med HGF >med 0.0070 1.9 (1.2, 3.2) 35 (2) 7.4 (5.6, 9.9) 36 (0) 5.1 (4.2, 6.9) ANG-2 <med VCAM -1 <med 0.0092 1.7 (1.1, 2.6) 43 (0) 10.6 (9.4, 15.8) 52 (0) 7.0 (5.5, 9.5) HGF >med MCP-1 <med 0.0007 2.5 (1.5, 4.3) 34 (1) 8.0 (5.9, .9) 32 (0) 4.9 (4.2, 6.5) HGF >med IGF-1 >med 0.0068 2.0 (1.2, 3.4) 28 (0) 8.0 (6.8, 12.5) 36 (0) 5.0 (4.1, 7.1) VEGF-C <med GROα >med 0.0081 2.2 (1.2, 4.1) 21 (0) 9.1 (4.7, 14.8) 34 (0) 4.8 (3.2, 7.9) - This multiplex angiome analysis of CALGB 80303 is one of the largest such analyses reported to date, and the first in metastatic pancreatic cancer. In this large multicenter study, technical analyses were robust with good sensitivity and low variability, which were generally comparable to single kit ELISAs. Unsupervised hierarchical clustering identified potential patterns of analyte expression, with suggested grouping among VEGF/PDGF family members, TGFβ family members, and various inflammatory and coagulation factors. Such analyses, particularly across cancer types and in the settings of tumor response and progression, may provide novel insights into the co and counter regulation of these factors and their underlying biology.
- Multiple prognostic markers were identified. This analysis is the largest and most comprehensive to date. These laboratory based prognostic markers were more powerful than traditional clinical factors and they remained highly statistically significant even after adjustment for known clinical factors. Most of these markers are involved in tumor related angiogenesis, inflammation, and coagulation, confirming the clinical importance of the underlying pathophysiology of pancreatic cancer. Indeed, ras mutations, which are present in approximately 90% of pancreatic adenocarcinomas, have been associated with the up-regulation of multiple factors related to inflammation and inflammatory angiogenesis and targeting these factors has been shown to inhibit the growth of xenograft and genetically modified mouse models of pancreatic cancer. Clinical trials with agents that inhibit these pathways are ongoing in various cancers, including pancreatic cancer; however, the value of targeting these factors in patients with pancreatic cancer is not yet known.
- Multiple candidate markers of sensitivity and resistance to bevacizumab were also identified. The ability to assess for treatment interactions that can suggest such markers is a key advantage of randomized studies. The predictive importance of VEGF-D was highly statistically significant and low levels were associated with benefit from bevacizumab, and high levels were associated with resistance to bevacizumab. VEGF-D however was not found to be a general prognostic factor in this study. In addition to VEGF-D, low levels of SDF1 and Ang2 were identified on univariate analyses as potential predictors of resistance to bevacizumab. Bivariate analyses confirmed the potential importance of these findings, and suggested that high levels of SDF1 and low levels of OPN may predict for sensitivity to bevacizumab. Interestingly, Ang2 was noted to have significant general prognostic importance, while SDF1 was not. Ang2 and SDF1 are known to promote angiogenesis and thus the finding that low levels of these factors are associated with lack of benefit from bevacizumab may appear somewhat counterintuitive. However, these factors are also associated with active angiogenesis and are known to be regulated by VEGF. Thus the current data are consistent with the known biology of both Ang2 and SDF1 being VEGF context dependent.
- In conclusion, multiple factors with strong prognostic impact for patients with pancreatic cancer were identified in the current analysis. In addition, VEGF-D was identified as a strong candidate for predicting sensitivity and resistance to bevacizumab in this population. Other candidates were also identified, highlighting the known complexity of tumor angiogenesis and pancreatic cancer.
Claims (13)
- A method of predicting responsiveness of pancreatic cancer in a subject to a cancer therapy including a VEGF targeting agent comprising: determining an expression level of Ang-2 in a sample from the subject; comparing the expression level of Ang-2 in the sample to a reference level of Ang-2; and using the comparison to predict the responsiveness of the cancer to treatment with the cancer therapy including a VEGF targeting agent, wherein low levels of Ang-2 are predictive of lack of responsiveness of the cancer to treatment including a VEGF targeting agent.
- The method of claim 1, wherein the reference level is determined by analysis of a set of samples from cancer patients treated with cancer therapies including or excluding a VEGF targeting agent with known outcomes.
- The method of claim 1, further comprising determining an expression level of at least one additional biomarker selected from SDF-1 and VEGF-D in a sample from the subject; comparing the expression level of the biomarker in the sample to a reference level of the biomarker and predicting the responsiveness of the cancer to treatment with the cancer therapy including a VEGF targeting agent.
- The method of claim 3, wherein the additional biomarker is SDF-1 and wherein the prediction indicates lack of responsiveness to a VEGF targeting agent when the expression level of Ang-2 is less than 305 pg/mL and the expression level of SDF-1 is less than 1100 pg/mL.
- The method of claim 3, wherein the additional biomarker is VEGF-D and wherein the prediction favors responsiveness to a cancer therapy including a VEGF targeting agent when the expression level of VEGF-D is less than 1100 pg/mL and/or wherein the prediction indicates lack of responsiveness to a VEGF targeting agent when the expression level of VEGF-D is more than 1100 pg/mL.
- The method of claim 1, further comprising determining an expression level of at least one of SDF-1, FGFb, OPN, HGF and VCAM-1.
- The method of claim 6, wherein low levels of Ang-2 in combination with either low levels of SDF-1, FGFb or VCAM-1 or high levels of OPN or HGF are predictive of lack of responsiveness of the cancer to treatment including a VEGF targeting agent.
- The method of claim 6, wherein the prediction indicates lack of responsiveness to a VEGF targeting agent when the expression level of Ang-2 is less than 305 pg/mL and the expression level of SDF-1 is less than 1100 pg/mL, FGFb is less than 30 pg/mL, VCAM-1 is less than 1,700 ng/mL, OPN is more than 73 ng/mL or HGF is more than 800 pg/mL.
- The method of any one of the preceding claims, wherein the sample is blood, plasma, serum, or urine.
- The method of any one of the preceding claims, wherein the expression level of the biomarker determined is the protein or RNA expression level and optionally wherein the protein expression level is determined by a method selected from ELISA, immunofluorescence, FACS analysis, Western blot, magnetic immunoassays, and antibody-based microarrays or optionally wherein the RNA expression level is determined by a method selected from Northern blot, rtPCR, and quantitative or real-time rtPCR.
- A method of developing a treatment plan for a subject with cancer comprising using the prediction of the responsiveness of the cancer to treatment with a cancer therapy including an antibody specific for VEGF-A obtained from any one of claims 1-10 to determine whether treatment of the subject with a cancer therapy including a VEGF targeting agent may be beneficial.
- The method of claim 11, wherein the treatment plan will include a VEGF targeting agent if such a therapeutic is expected to be beneficial, optionally wherein the VEGF targeting agent is bevacizumab.
- The method of claim 11, wherein the treatment plan will not include a VEGF targeting agent if such a therapeutic is not predicted to be effective, optionally wherein the cancer therapy includes a nucleotide analog or inhibitor of DNA synthesis or repair, optionally gemcitabine.
Applications Claiming Priority (2)
| Application Number | Priority Date | Filing Date | Title |
|---|---|---|---|
| US201161482757P | 2011-05-05 | 2011-05-05 | |
| PCT/US2012/036779 WO2012151574A1 (en) | 2011-05-05 | 2012-05-07 | Methods of developing a prognosis for pancreatic cancer and predicting responsiveness to cancer therapeutics |
Publications (3)
| Publication Number | Publication Date |
|---|---|
| EP2704745A1 EP2704745A1 (en) | 2014-03-12 |
| EP2704745A4 EP2704745A4 (en) | 2014-10-15 |
| EP2704745B1 true EP2704745B1 (en) | 2016-12-14 |
Family
ID=47108077
Family Applications (1)
| Application Number | Title | Priority Date | Filing Date |
|---|---|---|---|
| EP12779776.9A Not-in-force EP2704745B1 (en) | 2011-05-05 | 2012-05-07 | Methods of developing a prognosis for pancreatic cancer and predicting responsiveness to cancer therapeutics |
Country Status (3)
| Country | Link |
|---|---|
| US (3) | US9255927B2 (en) |
| EP (1) | EP2704745B1 (en) |
| WO (1) | WO2012151574A1 (en) |
Families Citing this family (12)
| Publication number | Priority date | Publication date | Assignee | Title |
|---|---|---|---|---|
| EP2704745B1 (en) | 2011-05-05 | 2016-12-14 | Duke University | Methods of developing a prognosis for pancreatic cancer and predicting responsiveness to cancer therapeutics |
| US9869542B2 (en) | 2014-04-21 | 2018-01-16 | Axsun Technologies, Inc. | System and method for resampling optical coherence tomography signals in segments |
| RU2548321C1 (en) * | 2014-06-10 | 2015-04-20 | Государственное бюджетное образовательное учреждение дополнительного профессионального образования "Новокузнецкий государственный институт усовершенствования врачей" Министерства здравоохранения Российской Федерации | Method of assessing clinical course of acute biliary pancreatitis |
| WO2016126682A1 (en) * | 2015-02-03 | 2016-08-11 | Momenta Pharmaceuticals, Inc. | Methods of controlling therapeutic regimens |
| AU2017211247B2 (en) * | 2016-01-25 | 2023-03-09 | Sanofi | Method for predicting the outcome of a treatment with aflibercept of a patient suspected to suffer from a cancer by measuring the level of a plasma biomarker |
| WO2017190074A1 (en) * | 2016-04-28 | 2017-11-02 | The University Of Chicago | Lymphangiogenesis for therapeutic immunomodulation |
| WO2017201166A1 (en) * | 2016-05-17 | 2017-11-23 | Duke University | Methods of predicting responsiveness of a cancer to a vegf targeting agent and methods of prognosing and treating cancer |
| CA3066053A1 (en) * | 2017-06-04 | 2018-12-13 | Rappaport Family Institute For Research In The Medical Sciences | Method of predicting personalized response to cancer treatment with immune checkpoint inhibitors and kits therefor |
| EP3710466A2 (en) | 2017-11-13 | 2020-09-23 | The University of Chicago | Methods and compositions for the treatment of wounds |
| CN109234365A (en) * | 2018-11-13 | 2019-01-18 | 武汉科技大学 | A method of detection miR5100, CXCL-12 and IL-8 relative expression quantity |
| WO2023276869A1 (en) * | 2021-06-28 | 2023-01-05 | 学校法人 久留米大学 | Method for predicting prognosis after treatment with angiogenesis inhibitor, and combination therapy for cancer |
| WO2023017525A1 (en) | 2021-08-11 | 2023-02-16 | OncoHost Ltd. | Predicting patient response |
Family Cites Families (9)
| Publication number | Priority date | Publication date | Assignee | Title |
|---|---|---|---|---|
| DK1297016T3 (en) | 2000-05-12 | 2006-07-10 | Vlaams Interuniv Inst Biotech | Use of placental growth factor inhibitors to treat pathological angiogenesis, pathological arteriogenesis, inflammation, tumor formation and / or vascular leakage |
| EP2365077B1 (en) | 2004-03-12 | 2013-05-08 | Alnylam Pharmaceuticals, Inc. | iRNA agents targeting VEGF |
| KR20150097813A (en) | 2006-12-19 | 2015-08-26 | 제넨테크, 인크. | Vegf-specific antagonists for adjuvant and neoadjuvant therapy and the treatment of early stage tumors |
| WO2009155504A2 (en) * | 2008-06-20 | 2009-12-23 | The Children's Medical Center Corporation | Methods for the modulation of angiogenesis |
| JP2012501188A (en) | 2008-08-29 | 2012-01-19 | ジェネンテック, インコーポレイテッド | Diagnostic agents and treatments for VEGF-independent tumors |
| US20110257035A1 (en) * | 2008-10-21 | 2011-10-20 | Bayer Healthcare Llc | Identification of signature genes associated with hepatocellular carcinoma |
| US20110076271A1 (en) | 2009-07-13 | 2011-03-31 | Genentech, Inc. | Diagnostic methods and compositions for treatment of cancer |
| EP2293071A1 (en) * | 2009-09-07 | 2011-03-09 | Universität Zu Köln | Biomarker for colorectal cancer |
| EP2704745B1 (en) | 2011-05-05 | 2016-12-14 | Duke University | Methods of developing a prognosis for pancreatic cancer and predicting responsiveness to cancer therapeutics |
-
2012
- 2012-05-07 EP EP12779776.9A patent/EP2704745B1/en not_active Not-in-force
- 2012-05-07 WO PCT/US2012/036779 patent/WO2012151574A1/en active Application Filing
- 2012-05-07 US US14/115,825 patent/US9255927B2/en active Active
-
2016
- 2016-01-20 US US15/001,419 patent/US9869677B2/en active Active
-
2018
- 2018-01-11 US US15/868,541 patent/US10613091B2/en active Active
Non-Patent Citations (1)
| Title |
|---|
| None * |
Also Published As
| Publication number | Publication date |
|---|---|
| EP2704745A1 (en) | 2014-03-12 |
| EP2704745A4 (en) | 2014-10-15 |
| US20140127193A1 (en) | 2014-05-08 |
| US9869677B2 (en) | 2018-01-16 |
| WO2012151574A1 (en) | 2012-11-08 |
| US9255927B2 (en) | 2016-02-09 |
| US10613091B2 (en) | 2020-04-07 |
| US20180156804A1 (en) | 2018-06-07 |
| US20160146822A1 (en) | 2016-05-26 |
Similar Documents
| Publication | Publication Date | Title |
|---|---|---|
| US10613091B2 (en) | Methods of developing a prognosis for pancreatic cancer and predicting responsiveness to cancer therapeutics | |
| US20120094863A1 (en) | Biomarkers and methods for determining efficacy of anti-egfr antibodies in cancer therapy | |
| JP2010540960A (en) | Biological marker predicting anticancer response to insulin-like growth factor-1 receptor kinase inhibitor | |
| JP5963005B2 (en) | Plasma biomarkers for bevacizumab combination therapy for the treatment of pancreatic cancer | |
| US20200249235A1 (en) | Methods for diagnosing pancreatic cancer | |
| BRPI0707642A2 (en) | Urine Gene Expression Rates for Cancer Detection | |
| KR20130091750A (en) | Blood plasma biomarkers for bevacizumab combination therapies for treatment of breast cancer | |
| CA3082591A1 (en) | Markers for the diagnosis and treatment of non-alcoholic steatohepatitis (nash) and advanced liver fibrosis | |
| JP6622722B2 (en) | Pulmonary hypertension biomarker | |
| US20190331683A1 (en) | Biomarkers of Rapid Progression in Advanced Non-Small Cell Lung Cancer | |
| Neuzillet et al. | IGF1R activation and the in vitro antiproliferative efficacy of IGF1R inhibitor are inversely correlated with IGFBP5 expression in bladder cancer | |
| US20160024585A1 (en) | Methods of predicting responsiveness of a cancer to an agent and methods of determining a prognosis for a cancer patient | |
| US11499973B2 (en) | Methods of predicting responsiveness of a cancer to a VEGF targeting agent and methods of prognosing and treating cancer | |
| EP2309271A1 (en) | Methods for predicting the responsiveness of a patient affected with a tumor to a treatment with a tyrosine kinase inhibitor | |
| CN111417855A (en) | Methods for treating and diagnosing prostate cancer | |
| JP6899848B2 (en) | Biomarkers, test methods, and test kits for predicting the therapeutic effect of anti-VEGFR-2 antibody drugs | |
| US11921116B2 (en) | Enigma and CDH18 as companion diagnostics for CDK4 inhibitors | |
| US9823256B2 (en) | CXCR1 as a predictor of response to treatment with epidermal growth factor receptor therapeutic | |
| US20220082565A1 (en) | The fgf19-cholestyramine (f-cme) test as a two-stage method for routine cancer screening | |
| KR20230086462A (en) | Novel Biomarker for Predicting Therapeutic Response and Prognosis of Metastatic Breast Cancer To Chemotherapeutic Agents and Uses Thereof | |
| KR20230084061A (en) | Biomarker for predicting prognosis post-neoadjuvant chemotherapy of breast cancer patient and use thereof | |
| US20110269139A1 (en) | Biomarkers and methods for determining sensitivity to epidermal growth factor receptor modulators | |
| JP2017529074A (en) | ERCC1 isoform 3 mRNA and / or protein for use in diagnosing resistance to a therapeutic agent and method for diagnosing resistance to a therapeutic agent using this mRNA and / or protein | |
| KR20230086458A (en) | Novel Biomarker for Predicting Therapeutic Response and Prognosis of Metastatic Breast Cancer To Chemotherapeutic Agents and Uses Thereof |
Legal Events
| Date | Code | Title | Description |
|---|---|---|---|
| PUAI | Public reference made under article 153(3) epc to a published international application that has entered the european phase |
Free format text: ORIGINAL CODE: 0009012 |
|
| 17P | Request for examination filed |
Effective date: 20131121 |
|
| AK | Designated contracting states |
Kind code of ref document: A1 Designated state(s): AL AT BE BG CH CY CZ DE DK EE ES FI FR GB GR HR HU IE IS IT LI LT LU LV MC MK MT NL NO PL PT RO RS SE SI SK SM TR |
|
| RIN1 | Information on inventor provided before grant (corrected) |
Inventor name: PANG, HERBERT Inventor name: STARR, MARK D. Inventor name: HURWITZ, HERBERT I. Inventor name: NIXON, ANDREW B. |
|
| RIN1 | Information on inventor provided before grant (corrected) |
Inventor name: STARR, MARK D. Inventor name: HURWITZ, HERBERT I. Inventor name: PANG, HERBERT Inventor name: NIXON, ANDREW B. |
|
| DAX | Request for extension of the european patent (deleted) | ||
| A4 | Supplementary search report drawn up and despatched |
Effective date: 20140912 |
|
| RIC1 | Information provided on ipc code assigned before grant |
Ipc: A61K 39/395 20060101AFI20140908BHEP |
|
| 17Q | First examination report despatched |
Effective date: 20150826 |
|
| GRAP | Despatch of communication of intention to grant a patent |
Free format text: ORIGINAL CODE: EPIDOSNIGR1 |
|
| INTG | Intention to grant announced |
Effective date: 20160630 |
|
| RIN1 | Information on inventor provided before grant (corrected) |
Inventor name: HURWITZ, HERBERT I. Inventor name: STARR, MARK D. Inventor name: PANG, HERBERT Inventor name: NIXON, ANDREW B. |
|
| GRAS | Grant fee paid |
Free format text: ORIGINAL CODE: EPIDOSNIGR3 |
|
| GRAA | (expected) grant |
Free format text: ORIGINAL CODE: 0009210 |
|
| AK | Designated contracting states |
Kind code of ref document: B1 Designated state(s): AL AT BE BG CH CY CZ DE DK EE ES FI FR GB GR HR HU IE IS IT LI LT LU LV MC MK MT NL NO PL PT RO RS SE SI SK SM TR |
|
| REG | Reference to a national code |
Ref country code: GB Ref legal event code: FG4D |
|
| REG | Reference to a national code |
Ref country code: CH Ref legal event code: EP |
|
| REG | Reference to a national code |
Ref country code: IE Ref legal event code: FG4D |
|
| REG | Reference to a national code |
Ref country code: AT Ref legal event code: REF Ref document number: 852975 Country of ref document: AT Kind code of ref document: T Effective date: 20170115 |
|
| REG | Reference to a national code |
Ref country code: DE Ref legal event code: R096 Ref document number: 602012026660 Country of ref document: DE |
|
| PG25 | Lapsed in a contracting state [announced via postgrant information from national office to epo] |
Ref country code: LV Free format text: LAPSE BECAUSE OF FAILURE TO SUBMIT A TRANSLATION OF THE DESCRIPTION OR TO PAY THE FEE WITHIN THE PRESCRIBED TIME-LIMIT Effective date: 20161214 |
|
| REG | Reference to a national code |
Ref country code: LT Ref legal event code: MG4D |
|
| REG | Reference to a national code |
Ref country code: NL Ref legal event code: MP Effective date: 20161214 |
|
| PG25 | Lapsed in a contracting state [announced via postgrant information from national office to epo] |
Ref country code: LT Free format text: LAPSE BECAUSE OF FAILURE TO SUBMIT A TRANSLATION OF THE DESCRIPTION OR TO PAY THE FEE WITHIN THE PRESCRIBED TIME-LIMIT Effective date: 20161214 Ref country code: GR Free format text: LAPSE BECAUSE OF FAILURE TO SUBMIT A TRANSLATION OF THE DESCRIPTION OR TO PAY THE FEE WITHIN THE PRESCRIBED TIME-LIMIT Effective date: 20170315 Ref country code: NO Free format text: LAPSE BECAUSE OF FAILURE TO SUBMIT A TRANSLATION OF THE DESCRIPTION OR TO PAY THE FEE WITHIN THE PRESCRIBED TIME-LIMIT Effective date: 20170314 Ref country code: SE Free format text: LAPSE BECAUSE OF FAILURE TO SUBMIT A TRANSLATION OF THE DESCRIPTION OR TO PAY THE FEE WITHIN THE PRESCRIBED TIME-LIMIT Effective date: 20161214 |
|
| REG | Reference to a national code |
Ref country code: AT Ref legal event code: MK05 Ref document number: 852975 Country of ref document: AT Kind code of ref document: T Effective date: 20161214 |
|
| REG | Reference to a national code |
Ref country code: FR Ref legal event code: PLFP Year of fee payment: 6 |
|
| PG25 | Lapsed in a contracting state [announced via postgrant information from national office to epo] |
Ref country code: FI Free format text: LAPSE BECAUSE OF FAILURE TO SUBMIT A TRANSLATION OF THE DESCRIPTION OR TO PAY THE FEE WITHIN THE PRESCRIBED TIME-LIMIT Effective date: 20161214 Ref country code: RS Free format text: LAPSE BECAUSE OF FAILURE TO SUBMIT A TRANSLATION OF THE DESCRIPTION OR TO PAY THE FEE WITHIN THE PRESCRIBED TIME-LIMIT Effective date: 20161214 Ref country code: HR Free format text: LAPSE BECAUSE OF FAILURE TO SUBMIT A TRANSLATION OF THE DESCRIPTION OR TO PAY THE FEE WITHIN THE PRESCRIBED TIME-LIMIT Effective date: 20161214 |
|
| PG25 | Lapsed in a contracting state [announced via postgrant information from national office to epo] |
Ref country code: NL Free format text: LAPSE BECAUSE OF FAILURE TO SUBMIT A TRANSLATION OF THE DESCRIPTION OR TO PAY THE FEE WITHIN THE PRESCRIBED TIME-LIMIT Effective date: 20161214 |
|
| PG25 | Lapsed in a contracting state [announced via postgrant information from national office to epo] |
Ref country code: RO Free format text: LAPSE BECAUSE OF FAILURE TO SUBMIT A TRANSLATION OF THE DESCRIPTION OR TO PAY THE FEE WITHIN THE PRESCRIBED TIME-LIMIT Effective date: 20161214 Ref country code: EE Free format text: LAPSE BECAUSE OF FAILURE TO SUBMIT A TRANSLATION OF THE DESCRIPTION OR TO PAY THE FEE WITHIN THE PRESCRIBED TIME-LIMIT Effective date: 20161214 Ref country code: CZ Free format text: LAPSE BECAUSE OF FAILURE TO SUBMIT A TRANSLATION OF THE DESCRIPTION OR TO PAY THE FEE WITHIN THE PRESCRIBED TIME-LIMIT Effective date: 20161214 Ref country code: SK Free format text: LAPSE BECAUSE OF FAILURE TO SUBMIT A TRANSLATION OF THE DESCRIPTION OR TO PAY THE FEE WITHIN THE PRESCRIBED TIME-LIMIT Effective date: 20161214 Ref country code: IS Free format text: LAPSE BECAUSE OF FAILURE TO SUBMIT A TRANSLATION OF THE DESCRIPTION OR TO PAY THE FEE WITHIN THE PRESCRIBED TIME-LIMIT Effective date: 20170414 |
|
| PG25 | Lapsed in a contracting state [announced via postgrant information from national office to epo] |
Ref country code: AT Free format text: LAPSE BECAUSE OF FAILURE TO SUBMIT A TRANSLATION OF THE DESCRIPTION OR TO PAY THE FEE WITHIN THE PRESCRIBED TIME-LIMIT Effective date: 20161214 Ref country code: SM Free format text: LAPSE BECAUSE OF FAILURE TO SUBMIT A TRANSLATION OF THE DESCRIPTION OR TO PAY THE FEE WITHIN THE PRESCRIBED TIME-LIMIT Effective date: 20161214 Ref country code: PL Free format text: LAPSE BECAUSE OF FAILURE TO SUBMIT A TRANSLATION OF THE DESCRIPTION OR TO PAY THE FEE WITHIN THE PRESCRIBED TIME-LIMIT Effective date: 20161214 Ref country code: LU Free format text: LAPSE BECAUSE OF NON-PAYMENT OF DUE FEES Effective date: 20170531 Ref country code: ES Free format text: LAPSE BECAUSE OF FAILURE TO SUBMIT A TRANSLATION OF THE DESCRIPTION OR TO PAY THE FEE WITHIN THE PRESCRIBED TIME-LIMIT Effective date: 20161214 Ref country code: BG Free format text: LAPSE BECAUSE OF FAILURE TO SUBMIT A TRANSLATION OF THE DESCRIPTION OR TO PAY THE FEE WITHIN THE PRESCRIBED TIME-LIMIT Effective date: 20170314 Ref country code: IT Free format text: LAPSE BECAUSE OF FAILURE TO SUBMIT A TRANSLATION OF THE DESCRIPTION OR TO PAY THE FEE WITHIN THE PRESCRIBED TIME-LIMIT Effective date: 20161214 Ref country code: BE Free format text: LAPSE BECAUSE OF FAILURE TO SUBMIT A TRANSLATION OF THE DESCRIPTION OR TO PAY THE FEE WITHIN THE PRESCRIBED TIME-LIMIT Effective date: 20161214 Ref country code: PT Free format text: LAPSE BECAUSE OF FAILURE TO SUBMIT A TRANSLATION OF THE DESCRIPTION OR TO PAY THE FEE WITHIN THE PRESCRIBED TIME-LIMIT Effective date: 20170414 |
|
| REG | Reference to a national code |
Ref country code: DE Ref legal event code: R097 Ref document number: 602012026660 Country of ref document: DE |
|
| PLBE | No opposition filed within time limit |
Free format text: ORIGINAL CODE: 0009261 |
|
| STAA | Information on the status of an ep patent application or granted ep patent |
Free format text: STATUS: NO OPPOSITION FILED WITHIN TIME LIMIT |
|
| 26N | No opposition filed |
Effective date: 20170915 |
|
| PG25 | Lapsed in a contracting state [announced via postgrant information from national office to epo] |
Ref country code: DK Free format text: LAPSE BECAUSE OF FAILURE TO SUBMIT A TRANSLATION OF THE DESCRIPTION OR TO PAY THE FEE WITHIN THE PRESCRIBED TIME-LIMIT Effective date: 20161214 |
|
| REG | Reference to a national code |
Ref country code: CH Ref legal event code: PL |
|
| PG25 | Lapsed in a contracting state [announced via postgrant information from national office to epo] |
Ref country code: MC Free format text: LAPSE BECAUSE OF FAILURE TO SUBMIT A TRANSLATION OF THE DESCRIPTION OR TO PAY THE FEE WITHIN THE PRESCRIBED TIME-LIMIT Effective date: 20161214 |
|
| REG | Reference to a national code |
Ref country code: IE Ref legal event code: MM4A |
|
| PG25 | Lapsed in a contracting state [announced via postgrant information from national office to epo] |
Ref country code: LI Free format text: LAPSE BECAUSE OF NON-PAYMENT OF DUE FEES Effective date: 20170531 Ref country code: CH Free format text: LAPSE BECAUSE OF NON-PAYMENT OF DUE FEES Effective date: 20170531 Ref country code: SI Free format text: LAPSE BECAUSE OF FAILURE TO SUBMIT A TRANSLATION OF THE DESCRIPTION OR TO PAY THE FEE WITHIN THE PRESCRIBED TIME-LIMIT Effective date: 20161214 |
|
| PG25 | Lapsed in a contracting state [announced via postgrant information from national office to epo] |
Ref country code: LU Free format text: LAPSE BECAUSE OF NON-PAYMENT OF DUE FEES Effective date: 20170507 |
|
| PG25 | Lapsed in a contracting state [announced via postgrant information from national office to epo] |
Ref country code: IE Free format text: LAPSE BECAUSE OF NON-PAYMENT OF DUE FEES Effective date: 20170507 |
|
| REG | Reference to a national code |
Ref country code: FR Ref legal event code: PLFP Year of fee payment: 7 |
|
| PG25 | Lapsed in a contracting state [announced via postgrant information from national office to epo] |
Ref country code: MT Free format text: LAPSE BECAUSE OF NON-PAYMENT OF DUE FEES Effective date: 20170507 |
|
| PG25 | Lapsed in a contracting state [announced via postgrant information from national office to epo] |
Ref country code: HU Free format text: LAPSE BECAUSE OF FAILURE TO SUBMIT A TRANSLATION OF THE DESCRIPTION OR TO PAY THE FEE WITHIN THE PRESCRIBED TIME-LIMIT; INVALID AB INITIO Effective date: 20120507 |
|
| PG25 | Lapsed in a contracting state [announced via postgrant information from national office to epo] |
Ref country code: CY Free format text: LAPSE BECAUSE OF NON-PAYMENT OF DUE FEES Effective date: 20161214 |
|
| PG25 | Lapsed in a contracting state [announced via postgrant information from national office to epo] |
Ref country code: MK Free format text: LAPSE BECAUSE OF FAILURE TO SUBMIT A TRANSLATION OF THE DESCRIPTION OR TO PAY THE FEE WITHIN THE PRESCRIBED TIME-LIMIT Effective date: 20161214 |
|
| PG25 | Lapsed in a contracting state [announced via postgrant information from national office to epo] |
Ref country code: TR Free format text: LAPSE BECAUSE OF FAILURE TO SUBMIT A TRANSLATION OF THE DESCRIPTION OR TO PAY THE FEE WITHIN THE PRESCRIBED TIME-LIMIT Effective date: 20161214 |
|
| PG25 | Lapsed in a contracting state [announced via postgrant information from national office to epo] |
Ref country code: AL Free format text: LAPSE BECAUSE OF FAILURE TO SUBMIT A TRANSLATION OF THE DESCRIPTION OR TO PAY THE FEE WITHIN THE PRESCRIBED TIME-LIMIT Effective date: 20161214 |
|
| PGFP | Annual fee paid to national office [announced via postgrant information from national office to epo] |
Ref country code: DE Payment date: 20210527 Year of fee payment: 10 Ref country code: FR Payment date: 20210525 Year of fee payment: 10 |
|
| PGFP | Annual fee paid to national office [announced via postgrant information from national office to epo] |
Ref country code: GB Payment date: 20210527 Year of fee payment: 10 |
|
| REG | Reference to a national code |
Ref country code: DE Ref legal event code: R119 Ref document number: 602012026660 Country of ref document: DE |
|
| GBPC | Gb: european patent ceased through non-payment of renewal fee |
Effective date: 20220507 |
|
| PG25 | Lapsed in a contracting state [announced via postgrant information from national office to epo] |
Ref country code: FR Free format text: LAPSE BECAUSE OF NON-PAYMENT OF DUE FEES Effective date: 20220531 |
|
| PG25 | Lapsed in a contracting state [announced via postgrant information from national office to epo] |
Ref country code: GB Free format text: LAPSE BECAUSE OF NON-PAYMENT OF DUE FEES Effective date: 20220507 Ref country code: DE Free format text: LAPSE BECAUSE OF NON-PAYMENT OF DUE FEES Effective date: 20221201 |