EP2639645A2 - Image forming apparatus - Google Patents
Image forming apparatus Download PDFInfo
- Publication number
- EP2639645A2 EP2639645A2 EP13159740.3A EP13159740A EP2639645A2 EP 2639645 A2 EP2639645 A2 EP 2639645A2 EP 13159740 A EP13159740 A EP 13159740A EP 2639645 A2 EP2639645 A2 EP 2639645A2
- Authority
- EP
- European Patent Office
- Prior art keywords
- density
- signal
- pattern
- period
- fluctuation detecting
- Prior art date
- Legal status (The legal status is an assumption and is not a legal conclusion. Google has not performed a legal analysis and makes no representation as to the accuracy of the status listed.)
- Granted
Links
- 230000003287 optical effect Effects 0.000 claims abstract description 15
- 238000012937 correction Methods 0.000 claims description 132
- 230000000737 periodic effect Effects 0.000 claims description 13
- 230000008859 change Effects 0.000 claims description 7
- 238000010586 diagram Methods 0.000 description 61
- 238000012546 transfer Methods 0.000 description 59
- 238000000034 method Methods 0.000 description 22
- 238000012545 processing Methods 0.000 description 14
- 230000002441 reversible effect Effects 0.000 description 9
- 238000009826 distribution Methods 0.000 description 6
- 230000006870 function Effects 0.000 description 6
- 238000006243 chemical reaction Methods 0.000 description 5
- 230000008569 process Effects 0.000 description 5
- 230000000052 comparative effect Effects 0.000 description 4
- 239000004065 semiconductor Substances 0.000 description 4
- 230000007423 decrease Effects 0.000 description 3
- 230000003247 decreasing effect Effects 0.000 description 3
- 230000003111 delayed effect Effects 0.000 description 3
- 238000001514 detection method Methods 0.000 description 3
- 230000000694 effects Effects 0.000 description 3
- 230000001360 synchronised effect Effects 0.000 description 3
- 230000006399 behavior Effects 0.000 description 2
- 239000003086 colorant Substances 0.000 description 2
- 238000004140 cleaning Methods 0.000 description 1
- 238000007599 discharging Methods 0.000 description 1
- 239000011159 matrix material Substances 0.000 description 1
- 238000012986 modification Methods 0.000 description 1
- 230000004048 modification Effects 0.000 description 1
- 230000004044 response Effects 0.000 description 1
- 230000035945 sensitivity Effects 0.000 description 1
- 239000007787 solid Substances 0.000 description 1
- 238000011179 visual inspection Methods 0.000 description 1
Images











Classifications
-
- G—PHYSICS
- G03—PHOTOGRAPHY; CINEMATOGRAPHY; ANALOGOUS TECHNIQUES USING WAVES OTHER THAN OPTICAL WAVES; ELECTROGRAPHY; HOLOGRAPHY
- G03G—ELECTROGRAPHY; ELECTROPHOTOGRAPHY; MAGNETOGRAPHY
- G03G15/00—Apparatus for electrographic processes using a charge pattern
- G03G15/55—Self-diagnostics; Malfunction or lifetime display
- G03G15/553—Monitoring or warning means for exhaustion or lifetime end of consumables, e.g. indication of insufficient copy sheet quantity for a job
- G03G15/556—Monitoring or warning means for exhaustion or lifetime end of consumables, e.g. indication of insufficient copy sheet quantity for a job for toner consumption, e.g. pixel counting, toner coverage detection or toner density measurement
-
- G—PHYSICS
- G03—PHOTOGRAPHY; CINEMATOGRAPHY; ANALOGOUS TECHNIQUES USING WAVES OTHER THAN OPTICAL WAVES; ELECTROGRAPHY; HOLOGRAPHY
- G03G—ELECTROGRAPHY; ELECTROPHOTOGRAPHY; MAGNETOGRAPHY
- G03G15/00—Apparatus for electrographic processes using a charge pattern
- G03G15/50—Machine control of apparatus for electrographic processes using a charge pattern, e.g. regulating differents parts of the machine, multimode copiers, microprocessor control
- G03G15/5054—Machine control of apparatus for electrographic processes using a charge pattern, e.g. regulating differents parts of the machine, multimode copiers, microprocessor control by measuring the characteristics of an intermediate image carrying member or the characteristics of an image on an intermediate image carrying member, e.g. intermediate transfer belt or drum, conveyor belt
- G03G15/5058—Machine control of apparatus for electrographic processes using a charge pattern, e.g. regulating differents parts of the machine, multimode copiers, microprocessor control by measuring the characteristics of an intermediate image carrying member or the characteristics of an image on an intermediate image carrying member, e.g. intermediate transfer belt or drum, conveyor belt using a test patch
Definitions
- the present invention relates to image forming apparatuses which form an image onto a medium such as paper, etc.
- An image forming apparatus represented by a laser beam printer wherein a light beam emitted from a light source is deflected and scanned in a main scanning direction by a deflecting and scanning unit, and is collected toward a drum (a photosensitive body) which has a face to be scanned, and a latent image is formed on a drum surface.
- the latent image on the drum surface is transferred onto an intermediate transfer belt which is placed between the drum and a developing roller and an image which corresponds to the latent image is formed onto the intermediate transfer belt.
- density fluctuations may occur in a main scanning direction and a sub-scanning direction, respectively.
- One possible cause of the density fluctuations is process gap (PG) fluctuations.
- PG process gap
- the density fluctuations of the image in the main scanning direction are considered.
- parallel characteristics of the drum (the photosensitive body) and the developing roller are possible.
- variations occur in capabilities of developing onto the drum, possibly causing density fluctuations with respect to the main scanning direction.
- the density fluctuations linearly change in the main scanning direction.
- the density fluctuations of the image in the sub-scanning direction are considered.
- One factor for this may be decentering of the drum. For example, when a slight movement of an axle of the drum occurs, positions at which a distance from a rotational axle of the drum to a surface differs occur, so that positions occur in which there is a difference in a gap between the drum and the developing roller. This difference in the gap becomes a developing variation, which would affect the image as the density fluctuations in the sub-scanning direction.
- a different factor may be circularity of the drum. For example, assume that there is a drum B with low circularity relative to a drum A, which is circular. Then, with the drum B, at a time of rotation thereof, a difference occurs in a gap between the drum and the developing roller depending on a rotational angle, which may become a factor for fluctuations in developing. Due to the above-described factors, density fluctuations in the sub-scanning direction occur for an image formed on the drum surface. These density fluctuations become periodic, which occurs with a rotational period of the drum.
- Factors for the density fluctuations include other factors such as potential variations of the drum, toner supply, toner removal, discharging, cleaning, etc., so that, combining them with density fluctuations due to process gap fluctuations, causes dynamic fluctuations to occur in both the main scanning direction and the sub-scanning direction.
- a light amount adjustment is performed in accordance with a transmitting characteristic of optics in the main scanning direction, for example.
- an object of the present invention is to provide an image forming apparatus which makes it possible to improve a dynamic range of density correction and realize a highly accurate density correction.
- an image forming apparatus includes a light source; a drum which is a photosensitive body; an optical scanning apparatus which deflects and scans, in a main scanning direction by a deflecting and scanning unit, a light beam emitted from the light source, and collects, by a scanning and image forming unit, the deflected and scanned light beam on the drum, which drum has a face to be scanned, to form a latent image onto a surface of the drum; and an endless belt which is arranged to be in contact with the drum and on which an image corresponding to the latent image is formed, the image forming apparatus further including a pattern forming unit which forms, on the endless belt along a conveying direction of the endless belt, a density fluctuation detecting pattern having a period; a density sensor which detects the density fluctuating detecting pattern and outputs a density signal including information on density fluctuations in the conveying direction of the endless belt; and a period detecting sensor which detects the period
- the disclosed technique makes it possible to provide an image forming apparatus which improves a dynamic range of density correction and which can realize a highly accurate density correction.
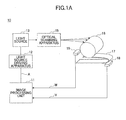
- FIG. 1A is a schematic diagram exemplifying an image forming apparatus according to a first embodiment.
- the image forming apparatus 10 includes an image processing unit 11; a light source driving apparatus 12; a light source 13; an optical scanning apparatus 15; a drum 16; an intermediate transfer belt 17; a density sensor 18; and a home position sensor 19 (which may be called an HP sensor 19 below).
- the density sensor 18 reads a density of a toner pattern formed onto the intermediate transfer belt 17, and outputs, to the image processing unit 11, a density signal V, which is an output signal in which an affixed amount of toner is converted to a voltage.
- the density sensor 18 may be arranged such that a light emitted by an LED is irradiated onto the intermediate transfer belt 17 and a specularly reflected light and a diffuse reflected light which are obtained in accordance with a toner density on the intermediate transfer belt 17 is detected by a light receiving element.
- the HP sensor 19 which is a period detecting sensor which detects a rotational period of the drum 16, outputs a home position signal W (which may be called an HP signal W below) to the image processing unit 11.
- the image forming apparatus 10 may include multiple density sensors and multiple HP sensors.
- the image processing unit 11 includes a CPU, a ROM, a RAM, a main memory, etc., for example, various functions of which image processing unit 11 may be realized by a program recorded in the ROM, etc., being read into the main memory to be executed by the CPU. A part or the whole of the image processing unit 11 may be realized by hardware only. Moreover, the image processing unit 11 may physically be configured with multiple apparatuses.
- the image processing unit 11 detects density fluctuations based on an HP signal W and a density signal V input, calculates a light amount correction amount which corrects for the density fluctuations in the main scanning direction and the sub-scanning direction to generate and output, to the light source driving apparatus 12, a light amount control signal A.
- the light source driving unit 12 drives the light source 13 based on the light amount control signal A.
- a semiconductor laser As the light source 13, a semiconductor laser, etc., may be used, for example.
- a semiconductor laser As a semiconductor laser, a VCSEL (Vertical Cavity Surface Emitting LASER), etc., may be used, for example.
- VCSEL Vertical Cavity Surface Emitting LASER
- a light beam emitted from the light source 13 is transmitted toward the drum 16, which is a photosensitive body by the optical scanning apparatus 15, and a latent image is formed onto a surface of the drum 16.
- the optical scanning apparatus 15 includes, for example, a deflecting and scanning unit (not shown) which deflects and scans, in a main scanning direction, a light beam emitted from the light source 13; a scanning and image forming unit (not shown) which collects the deflected and scanned light beam onto the drum 16, which is a face to be scanned, etc.
- the intermediate transfer belt 17 is an endless belt which is arranged to be in contact with the drum 16 and onto which an image corresponding to the latent image is formed.
- light emitting level control of the light source 13 is performed with a light amount based on a light amount control signal A which corrects for density fluctuations in the main scanning direction and the sub-scanning direction.
- the respective density fluctuations in the main scanning direction and the sub-scanning direction may be decreased by control of a light amount of the light source 13.
- the light amount control signal A based on only density fluctuations in either one of the main scanning direction and the sub-scanning direction can also be generated to correct for only density fluctuations in the one of the main scanning direction and the sub-scanning direction.
- the main scanning direction is a direction which is orthogonal to a conveying direction of the intermediate transfer belt 17, while the sub-scanning direction is the conveying direction of the intermediate transfer belt 17.
- FIGS. 1B and 1C are schematic diagrams exemplifying a density sensor.
- FIG. 1B shows a case in which the toner is not affixed onto the intermediate transfer belt 17, while FIG. 1C shows a case in which the toner is affixed onto the intermediate transfer belt 17.
- the density sensor 18 includes a light-emitting element 181; the specularly reflected light receiving element 182; and the diffuse reflected light receiving element 183.
- the light emitting element 181 is a light emitting diode (LED), for example, while the specularly reflected light receiving element 182 and the diffuse reflected light receiving element 183 are photodiodes (PDs), for example.
- LED light emitting diode
- PDs photodiodes
- FIG. 2A is a diagram for describing a density fluctuation detecting pattern.
- a density fluctuation detecting pattern 20 for detecting density fluctuations is formed on the intermediate transfer belt 17 in synchronicity with an HP signal W which is detected with a rotation of the drum 16.
- the density fluctuation detecting pattern 20 can be formed from a time which is delayed by ⁇ t, for example, relative to the HP signal W to accurately detect density fluctuations at a specific location of the drum 16 by density sensors 18a, 18b, and 18c.
- a density signal which indicates density fluctuations can be repeatedly detected from the density fluctuation detecting pattern 20 by the density sensors 18a, 18b, and 18c to obtain a more accurate density signal.
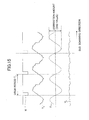
- FIG. 2B is a diagram for describing a method of density correction in the sub-scanning direction.
- a density signal which indicates density fluctuations may be detected from the density fluctuation detecting pattern 20 by the density sensors 18a, 18b, and 18c.
- a density signal Va with the same period as a period Td of the drum 16 may be detected from the density sensor 18a.
- a correction signal Ha a sinusoidal signal with a phase which is reverse that of the density signal Va and the same period as the period Td of the drum 16 may be generated.
- the density fluctuation detecting pattern can be formed to reduce density fluctuations of the formed density fluctuation detecting pattern in the sub-scanning direction.
- a correction signal may be generated based on an output signal of the density sensor 18b or 18c to reduce the density fluctuations in the sub-scanning direction.
- a correction signal may be generated based on an average value of output signals of the density sensors 18a to 18c to reduce the density fluctuations in the sub-scanning direction.
- a correction signal Ha which corrects for density fluctuations in the sub-scanning direction which is orthogonal to the main scanning direction may be generated based on an output signal of the HP sensor 19 and an output signal of at least one density sensor of multiple density sensors 18a, 18b, and 18c which are arranged in parallel in the main scanning direction. Then, light emitting level control of the light source 13 may be performed with a light amount based on the correction signal Ha to reduce density fluctuations in the sub-scanning direction.
- the correction signal Ha does not have to be a sinusoidal periodic pattern, and may be set to be a triangular periodic pattern, a trapezoidal periodic pattern, etc., for example, in accordance with conditions.
- FIG. 3A is a diagram for describing a density correcting method in the main scanning direction.
- multiple density sensors three density sensors 18a, 18b, and 18c in this case
- density signals Va, Vb, and Vc with differing signal levels are obtained in the main scanning direction as shown in FIG.3A .
- the density signals Va, Vb, and Vc may be sampled for one period or for multiple periods to detect density fluctuations in the main scanning direction as shown in FIG. 3B .
- density fluctuations in the main scanning direction can be reduced by linearly interpolating density signals Va, Vb, and Vc to generate the interpolated signal Sx, reversing the interpolated signal Sx to generate a correction signal Hb, and controlling a light amount signal of the light source 13 using the correction signal Hb.
- the correction signal Ha in the sub-scanning direction and the correction signal Hb in the main scanning direction are independently generated, and a light amount control signal A (see FIG. 1A ) in which the correction signal Ha and the correction signal Hb are convolved is generated to drive the light source 13.
- a light amount control signal A in which the correction signal Ha and the correction signal Hb are convolved is generated to drive the light source 13.
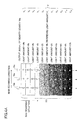
- FIGS. 4A and 4B are drawings for describing density calibration.
- a case is considered of successively increasing an amount of light which forms a pattern by control of an exposure power of the light source 13, drawing a density calibrating pattern 25 which has 11 levels (11 types) of rectangular-shaped patterns with differing densities in the sub-scanning direction, and detecting, by the density sensor 18a on the sub-scanning line, density signal V (including V 1 to V 11 ) which correspond to the respective patterns which make up the density calibrating pattern 25.
- FIG. 4A shows that a light amount is caused to be changed in intervals of 2% from -10% to +10% relative to a reference light amount.
- an actual print may be performed to measure an image density with a colorimeter, a scanner, etc., and a correspondence thereof with the density signal V (including V 1 to V 11 ) may be made to take a correlation between an actual image density and the density signal V (including V 1 to V 11 ).
- a correlation may be taken between the actual image density and the density signal.
- the density calibrating pattern 25 may be formed with at least 3 levels of exposure power that are changed by controlling exposure power of the light source 13 to calculate a change amount of the density relative to light amount fluctuations of the light source 13.
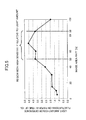
- the image area rates of the density fluctuation detecting pattern 20 shown in FIG. 2A and the density calibrating pattern 25 shown in FIG. 4A are respectively set between 50% and 85%.
- correction can be performed favorably by changing a color difference in increments of 0.2 from a point of sensing by a density sensor or visual inspection.
- the image area rate is between 50% and 85%, color difference fluctuations on paper becomes approximately 4 when the light amount is changed +10% as shown in FIG. 5 . Therefore, in order to change the color difference in increments of 0.2, it suffices that a light amount control resolution be +0.5%.
- the image area rate is other than between 50% and 85%, in order to change the color difference in increments of 0.2, the light amount control resolution becomes approximately ⁇ 1%, so that a dynamic range of density correction becomes narrow when taking into account upper and lower limits of a light amount change.
- the image area rate is a numerical value which indicates how much of a basic matrix of a dot or a parallel line is occupied when outputting a certain density pattern, and may also be called a dot area rate. For example, for a checker-shaped density pattern, the image area rate becomes 50%.
- the image area rate on paper may be calculated by calculating backwards from a CCD or a spectroscope.
- setting the image area rate of the density fluctuation detecting pattern 20 between 50% to 85% causes a dynamic range of density correction to be wide, so that accurate density fluctuation data for density correction can be obtained for density fluctuations caused by the drum 16, making it possible to realize an image forming apparatus 10 which can reduce density fluctuations in a simple configuration.
- FIG. 6 is an example of a flowchart on density fluctuation correction according to the first embodiment.
- FIG. 7 is a functional block diagram exemplifying a density fluctuation correcting unit according to the first embodiment.
- a calibrating unit 30a, a pattern forming unit 30b, and a correcting signal generating unit 30c of the density fluctuation correcting unit 30 shown in FIG. 7 may be realized by the image processing unit 11, the light source driving apparatus 12, the light source 13, the optical scanning apparatus 15, etc.
- the calibrating unit 30a forms a density calibrating pattern as shown in FIG. 4 , for example, at a position corresponding to the density sensors 18a, 18b, and 18c on the intermediate transfer belt 17. Then, the calibrating unit 30a forms a uniform density calibrating pattern with at least three levels (11 levels in the example in FIG. 4A ) of exposure power that are changed by control of exposure power in the light source 13 and with the image area rate between 50% and 85%. Next, in step S403, the calibrating unit 30a obtains a density signal of the respective density sensors 18a, 18b, and 18c which correspond to the density calibrating pattern 25.
- step S405 the calibrating unit 30a obtains correlation data between the respective density signal levels and light emitting power (light amount) of the light source 13 as shown in FIG. 4B , for example, and saves it in a memory, etc.
- correlation is taken between the density calibrating pattern 25 and the respective density signals obtained from the density sensors 18a, 18b, and 18c.
- a correspondence between amplitude of the density signals and a density of an image formed onto the intermediate transfer belt is identified, making it possible to discriminate a magnitude of the density relative to the density signal (the density is calibrated).
- the pattern forming unit 30b forms a density fluctuation detecting pattern 20 as shown in FIG. 2A , for example, at a position which corresponds to the density sensors 18a, 18b, and 18c that are on the intermediate transfer belt 17 with a rotational period of the drum 16 that is detected by the HP sensor 19. Then, the pattern forming unit 30b forms a uniform density fluctuation detecting pattern 20 with an image area rate between 50% and 85%.
- step S409 the correction signal generating unit 30c obtains the respective density signals (density signals Va, Vb, and Vc, which are indicated in FIG. 3A ) of the density sensors 18a, 18b, and 18c that correspond to the density fluctuation detecting pattern 20.
- step S411 the correction signal generating signal 30c generates a periodic pattern corresponding to density fluctuations in the sub-scanning direction.
- the periodic pattern corresponding to the density fluctuation in the sub-scanning direction may be obtained by approximating a signal in which density signals Va, Vb, Vc shown in FIG. 3A are averaged with a sinusoidal wave.
- the periodic pattern corresponding to the density fluctuations in the sub-scanning direction may be obtained by approximating, with a sinusoidal wave, an output signal of at least one density sensor, out of the density signals Va, Vb, and Vc shown in FIG. 3A .
- step S413 the correction signal generating unit 30c generates a correction signal which is a sinusoidal signal with a phase which is reverse that of a periodic pattern corresponding to the density fluctuations in the sub-scanning direction.
- step S415 the correction signal generating unit 30c causes a correction signal pattern generated in step S413 to, for example, undergo an A/D conversion to save the converted pattern in the memory, etc. Only a periodic pattern of a correction signal that corresponds to one period may be saved as a basic pattern.
- step S417 the correction signal generating unit 30c obtains an average value (see FIG. 3B , for example) for each density sensor for the respective density signals (density signals Va, Vb, and Vc shown in FIG. 3A , for example) of the density sensors 18a, 18b, and 18c that correspond to the density fluctuation detecting pattern 20.
- step S419 the correction signal generating unit 30c generates an approximation formula (a formula which shows a pattern of an interpolation signal Sx shown in FIG. 3C , for example) corresponding to the density fluctuations in the main scanning direction.
- step S421 the correction signal generating unit 30c generates a light emitting power correction formula (for example, a formula which shows a pattern of the correction signal Hb in FIG. 3C ) for correcting the density fluctuations in the main scanning direction.
- step S423 the correction signal generating unit 30c saves, in the memory, etc., a light emitting power correction formula generated in step S421.
- the correction signal generating unit 30c generates a light amount control signal A in which both are convolved, and performs light emitting level control of the light source 13 with a light amount based on the light amount control signal A.
- the respective density fluctuations in the main scanning direction and the sub-scanning direction may be reduced by control of a light amount of the light source 13.
- a density fluctuation correction is performed with a method in FIG. 6 to obtain a high quality image on the intermediate transfer belt 17, in which image, density fluctuations in the main scanning direction and the sub-scanning direction are reduced.
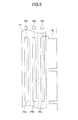
- FIG. 8 is a diagram exemplifying a density fluctuation detecting pattern according to the second embodiment.
- the density fluctuation detecting patterns 20a, 20b, and 20c with a sub-scanning direction for detecting density fluctuations as a longitudinal direction are arranged immediately below the density sensors 18a, 18b, and 18c which are arranged in multiple numbers in the main scanning direction.
- the density fluctuation detecting patterns 20a, 20b, and 20c can be formed to suppress an amount of consumption of toner with an advantageous effect equivalent to that of the density fluctuation detecting pattern 20 shown in FIG. 2A .
- FIG. 9 is a diagram exemplifying an image forming apparatus including multiple drums (photosensitive bodies).
- the image forming apparatus 40 which includes a configuration in which optical scanning apparatuses 45a, 45b, 45c, and 45d corresponding to the colors of cyan, magenta, yellow, and black, for example, along the intermediate transfer belt 17, which is an endless belt, is a so-called tandem-type image forming apparatus.
- the intermediate transfer belt 17 is an endless belt which is wound around various rollers which are rotationally driven.
- the optical scanning apparatuses 45a, 45b, 45c, and 45d which respectively include light sources (not shown), direct light beams emitted from the light sources to the respective drums 16a, 16b, 16c, and 16d via a deflector (not shown) and multiple optical components (not shown) and form a latent image on the respective drums 16a, 16b, 16c, and 16d.
- HP sensors 19a, 19b, 19c, and 19d are arranged in the vicinity of the drums 16a, 16b, 16c, and 16d, respectively. Functions of the HP sensors 19a, 19b, 19c, and 19d are the same as those of the HP sensor 19 which were described in the first embodiment.
- the rotational timing or period may differ somewhat for each of the drums 16a, 16b, 16c, and 16d.
- a drum differs for each of colors of cyan, magenta, yellow, and black, so that timings for generating an HP signal for each drum also differs.
- a density detecting pattern is generated in response to a timing of an HP signal which differs from color to color. In this way, from an aspect of image quality, an image with good color reproducibility in which density fluctuations for each of the drums 16a, 16b, 16c, and 16d are effectively reduced is obtained.
- FIG. 10 is a diagram exemplifying a density fluctuation detecting pattern according to a third embodiment.
- density fluctuation detecting patterns 21a, 21b, and 2lc which are formed in parallel in the main scanning direction are cyan patterns
- density fluctuation detecting patterns 22a, 22b, and 22c which are formed in parallel in the main scanning direction are magenta patterns
- density fluctuation detecting patterns 23a, 23b, and 23c which are formed in parallel in the main scanning direction are yellow patterns
- density fluctuation detecting patterns 24a, 24b, and 24c which are formed in parallel in the main scanning direction are black patterns.
- an HP signal Wc is an output signal from the HP sensor 19a corresponding to cyan
- an HP signal Wm is an output signal from the HP sensor 19b corresponding to magenta
- an HP signal Wy is an output signal from the HP sensor 19c corresponding to yellow
- an HP signal Wb is an output signal from the HP sensor 19d corresponding to black.
- the cyan density fluctuation detecting patterns 21a, 21b, and 21c corresponding to two periods of the HP signal Wc are generated; then, at a different position in the sub-scanning direction, the magenta density fluctuation detecting patterns 22a, 22b, and 22c corresponding to two periods of the HP signal Wm are generated; then, at a different position in the sub-scanning direction, the yellow density fluctuation detecting patterns 23a, 23b, and 23c corresponding to two periods of the HP signal Wy are generated; and then, at a different position in the sub-scanning direction, the black density fluctuation detecting patterns 24a, 24b, and 24c corresponding to two periods of the HP signal Wb are generated.
- the reason that the density fluctuation detecting pattern corresponding to two periods of the respective HP signals is generated is that there may a case in which an S/N ratio is small at a time of detecting by a density sensor with only a density fluctuation detecting pattern corresponding to one period of the respective HP signals. Therefore, in order to increase an S/N ratio when detecting by the density sensor, a density fluctuation detecting pattern corresponding to at least three periods of the respective HP signals may be formed.
- a density fluctuation detecting pattern formed that corresponds to multiple periods of the respective HP signals may be detected by each density sensor and an average processing may be performed among signals at the same position to more accurately detect periodic density fluctuations which are caused by a drum shape, etc. Therefore, a correction signal may be generated based on the density signal and a light amount of a light source may be controlled to realize an apparatus which forms an image with a high image quality in which density fluctuations are reduced.
- FIG. 11 is a schematic diagram exemplifying the image forming apparatus according to the comparative example.
- an image forming apparatus 100 according to a comparative example includes an image processing ASIC 11; a light source driving apparatus 13; a light source 14; an optical scanning apparatus 15; a drum 16; an intermediate transfer belt 17; and a density sensor 18.
- a light amount control signal A (main shading data) which is output from the image processing ASIC 11 is a light amount control signal in a main scanning direction (rotational axle direction) of the drum 16.
- the optical control signal A is input to the light source driving apparatus 13, which drives the light source 14 with a light amount based on the light amount control signal A and performs light emitting level control of the light source 14 (controls exposure power of the light source 14).
- a semiconductor laser etc.
- a VCSEL Very Cavity Surface Emitting LASER
- a light beam emitted from the light source 14 is transmitted toward the drum 16, which is a photosensitive body, by the optical scanning apparatus 15, and a latent image is formed on a surface of the drum 16.
- the optical scanning apparatus 15 includes, for example, a deflecting and scanning unit (not shown) which deflects and scans, in the main scanning direction, the light beam emitted from the light source 14; a scanning and image forming unit (not shown) which collects the deflected and scanned light beam onto the drum 16, which is a face to be scanned, etc.
- the intermediate transfer belt 17 is an endless belt which is arranged to be in contact with the drum 16 and onto which an image corresponding to the latent image is formed.
- the density sensor 18 reads a density of a toner pattern formed onto the intermediate transfer belt 17, and outputs, to the image processing ASIC 11, a density signal V, which is an output signal in which an affixed amount of toner is converted to a voltage.
- the density sensor 18 may be arranged such that a light emitted by an LED is irradiated onto the intermediate transfer belt 17 and a specularly reflected light and a diffuse reflected light which are obtained in accordance with a toner density on the intermediate transfer belt 17 is detected by a light receiving element.
- FIG. 12 is a schematic diagram exemplifying an image forming apparatus according to the fourth embodiment.
- the image forming apparatus 10 is different from the image forming apparatus 100 (see FIG. 11 ) in that a shading data converting unit 12 and a home position sensor 19 (which may be called a HP sensor 19 below) are added.
- the image forming apparatus 10 not only corrects for shading in the main scanning direction as in the image forming apparatus 100, but also corrects shading in the sub-scanning direction.
- a light amount control signal A (main shading data) output from the image processing ASIC 11, a density signal V which is output from the density sensor 18, and a home position signal W (which may be called an HP signal W below) which is output from the HP sensor 19 are respectively input to the shading data converting unit 12.
- the HP sensor 19 is a period detecting sensor which detects a rotational period of the drum 16.
- the shading data converting unit 12 includes a function of generating sub-shading data which corrects for shading in the sub-scanning direction as a signal which is synchronized to the HP signal W, etc. Moreover, it includes a function of multiplying the generated sub-shading data with the light amount control signal A (main shading data) to generate a light amount control signal B (main shading data + sub-shading data).
- the shading data converting unit 12 includes a CPU, a ROM, a main memory, etc., for example, various functions of which shading data converting unit 12 are realized by a program recorded in the ROM, etc., being read into the main memory to be executed by the CPU.
- a part or the whole of the shading data converting unit 12 may be realized by hardware only.
- the shading data converting unit 12 may physically be configured with multiple apparatuses.
- the light amount control signal B is input to the light source driving apparatus 13, which controls a light emitting level of the light source 14 with a light amount based on the light amount control signal B.
- the respective density fluctuations in the main scanning direction and the sub-scanning direction may be decreased by control of a light amount of the light source 14.
- the main scanning direction is a direction which is orthogonal to a conveying direction of the intermediate transfer belt 17, while the sub-scanning direction is the conveying direction of the intermediate transfer belt 17.
- FIGS. 13 and 14 are diagrams for describing density calibration. As shown in FIG. 13 , a case is considered of successively increasing an amount of light for forming a pattern; drawing, in the sub-scanning direction, a density calibrating pattern 20 which includes ten rectangular-shaped patterns with differing densities; and detecting, by the density sensor 18 on the sub-scanning line, a density signal V (including V 1 to V 10 ) which corresponds to the respective patterns which makes up the density calibrating pattern 20.
- V including V 1 to V 10
- FIG. 15 is a diagram for describing a density correction method. For example, a case is considered of forming a certain density pattern in multiple numbers within a time width of a period T 1 of the drum 16.
- a period T 1 in a drum 16 is not necessarily equivalent to a print size, and a print starting position relative to the drum 16 is not constant.
- an HP sensor 19 may be provided to specify the period T 1 of the drum 16.
- a phase and the period T 1 of the drum 16 are specified by the HP sensor 19 to obtain a density signal Va, which is close to a sinusoidal wave with the same period as the period T 1 of the drum 16 from the density sensor 18.
- a correction signal Y Based on density fluctuations of the density signal Va, as a correction signal Y, a sinusoidal signal with a phase which is reverse that of a density fluctuation Va and the same period as a period T 1 of the drum 16 may be generated. Amplitude of the sinusoidal signal becomes a correction amount.
- Forming the density fluctuation detecting pattern by inputting, into the light source driving apparatus 13, a correction signal Y with a phase which is reverse that of the density fluctuation Va to control a light amount of the light source 14 makes it possible to reduce density fluctuations of the formed density fluctuation detecting pattern in the sub-scanning direction.
- a signal whose amplitude is smaller than that of the density signal Va such as a density signal Vb, is obtained.
- a density fluctuating component with the period T 1 of the drum 16 is reduced relative to the density signal Va.
- a developing roller 22 which is a rotating body, is located at a position opposing the drum 16, between which an intermediate transfer belt 17 (not shown) is placed.
- the developing roller 22 includes a function of developing a latent image which is formed onto the drum 16.
- the HP sensor 19 includes an HP sensor 19a which detects a home position of the drum 16 and an HP sensor 19b which detects a home position of the developing roller 22.
- the HP sensor 19a is a first period detecting sensor which detects density fluctuations of a period T 1 which corresponds to rotating of the drum 16, while the HP sensor 19b is a second period detecting sensor which detects density fluctuations of a period T 2 which corresponds to rotating of the developing roller 22 which is different from a rotational period of the drum 16.
- the HP sensor 19a outputs an HP signal W 1 to the shading data converting unit 12, while the HP sensor 19b outputs an HP signal W 2 to the shading data converting unit 12.
- the period T 1 is one representative example of the first period according to the present invention
- the period T 2 is one representative example of the second period according to the present invention.
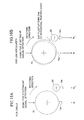
- FIGS. 16A, 16B , and 17 an example is described of density fluctuations in the sub-scanning direction due to the circularity of the drum 16.
- An image density varies depending on a gap between the drum 16 and the developing roller 22.
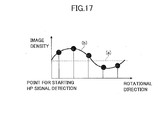
- FIG. 16A when the drum 16 is circular, the image density stabilizes to a certain value as shown in a broken line (a) in FIG. 17 .
- Fig. 16B when the circularity of the drum 16 is low, a gap fluctuation occurs due to a rotational position as shown in solid and broken lines of the drum 16, so that the image density also changes with rotating of the drum 16.
- FIG. 16B there are two fluctuating portions with a diameter which is larger and with a diameter which is smaller relative to a circle, so that as shown with a solid line (b) in FIG. 17 , a density of an image corresponding to one period (T 1 ) of the drum 16 appears as a density fluctuation which is close to a sinusoidal wave having two inflection points. Therefore, it is desirable to generate around at least five locations of density fluctuation detecting patterns as shown in black circles in FIG. 17 between output signals of the HP sensor 19a that corresponds to one period of the drum 16 to detect density fluctuations.
- FIG. 18 is a diagram exemplifying a density fluctuation detecting pattern according to the fourth embodiment.
- density fluctuation detecting patterns 23 and 24 are formed on the intermediate transfer belt 17 at different positions in the vertical direction (the main scanning direction) relative to the conveying direction of the intermediate transfer belt 17 (rotating direction of the drum 16).
- the respective density fluctuation detecting patterns 23 and 24, which are shown in FIG. 18 are representative examples of the first density fluctuation detecting pattern and the second density fluctuation detecting pattern according to the present invention.
- the density fluctuation detecting pattern 24 which is a pattern formed in synchronicity with the HP signal W 2 which is detected with rotating of the developing roller 22, has a second occurrence period which is different from the first occurrence period. While the second occurrence period is set to five patterns within a period T 2 of the HP signal W 2 in an example in FIG. 18 , it is not limited thereto.
- a pattern interval of the density fluctuation detecting pattern 24 may be set to be a constant interval for a multiple number of periods of the period T 2 .
- the density fluctuation detecting pattern 23 is generated from a time which is delayed by ⁇ t1, for example, relative to a rise of the HP signal W 1 of period T 1 (from tb0 to tb1) while the density fluctuation detecting pattern 24 can be generated from a time which is delayed by ⁇ t2, for example, relative to a rise of the HP signal W 2 of period T 2 .
- FIG. 19 is an example of a flowchart on density fluctuation correction according to the fourth embodiment.
- FIG. 20 is a diagram exemplifying various signals related to density fluctuation correction according to the fourth embodiment.
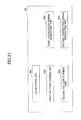
- FIG. 21 is a functional block diagram of a density fluctuation correcting unit 30 according to the fourth embodiment.
- a calibrating unit 30a, a first pattern forming unit 30b, a second pattern forming unit 30c, a first correction signal generating unit 30d, and a second correction signal generating unit 30e which are shown in FIG. 21 may be realized by the shading data converting unit 12, the light source driving unit 13, the light source 14, the optical scanning apparatus 15, etc.
- step S101 the calibrating unit 30a forms two columns of density calibrating patterns 20 having 10 rectangular patterns with differing densities as shown in FIG. 13 , for example, at a position (in the sub-scanning direction) corresponding to density sensors 18a and 18b on the intermediate transfer belt 17.
- step S102 the density sensors 18a and 18b respectively detect density signals from the density calibrating patterns 20 of the two columns.
- step S103 the calibrating unit 30a obtains correlation data between the density signal and density calibrating pattern 20 of each column as shown in FIG. 14 , for example.
- a correlation is taken between the density signals obtained from the density sensors 18a and 18b and the density calibrating pattern 20 of each column.
- a correspondence between amplitude of a density signal and a density of an image formed onto the intermediate transfer belt 17 is identified, making it possible to discriminate a magnitude of the density relative to the density signal.
- the first pattern forming unit 30b forms the density fluctuation detecting pattern 23 (a first density fluctuation detecting pattern) as shown in FIG. 18 , for example, in a position corresponding to the density sensor 18a on the intermediate transfer belt 17 along a conveying direction of the intermediate transfer belt 17.
- the density sensor 18a detects a density fluctuation detecting pattern 23 and outputs a first density signal X 11 as shown in FIG. 20 , for example.
- the first density signal X 11 is a signal which includes information on density fluctuations in a conveying direction of the intermediate transfer belt 17.
- step S106 the first correction signal generating unit 30d generates a first correction signal Y 11 (a signal with a period T 1 and a frequency f 1 ), which is a sinusoidal signal with a phase which is reverse that of density fluctuations as shown in FIG. 20 , for example, based on a first density signal X 11 .
- step S107 the first correction signal generating unit 30d causes a value of the first correction signal Y 11 generated in step S106 to undergo A/D conversion, for example, to hold the converted result in a memory (not shown), etc.
- step S108 the second pattern forming unit 30c inputs the first correction signal Y 11 in the light source driving apparatus 13 to control a light amount of the light source 14 to form a density fluctuation detecting pattern 24 (a second density fluctuation detecting pattern).
- step S109 the density sensor 18b detects the density fluctuation detecting pattern 24 and outputs a second density signal X 12 as shown in FIG. 20 , for example.
- the second density signal X 12 is a signal which includes information on density fluctuations in the conveying direction of the intermediate transfer belt 17.
- step S110 the second correction signal generating unit 30e generates a second correction signal Y 12 (a signal with a period T 2 and a frequency f 2 ), which is a sinusoidal signal with a phase which is reverse that of density fluctuations as shown in FIG. 20 , for example, based on a second density signal X 12 .
- step S111 the second correction signal generating unit 30e causes a value of the second correction signal Y 12 generated in step S110 to undergo A/D conversion, for example, to hold the converted result in a memory (not shown), etc.
- the second correction signal Y 12 which is held in the memory (not shown), etc., may be input into the light source driving apparatus 13 to control a light amount signal of the light source 14 to form a density fluctuation detecting pattern in which density fluctuations with periods T 1 and T 2 are reduced.
- a density fluctuation detecting pattern which is corrected with the second correction signal Y 12
- a density sensor detects that a density fluctuation detecting pattern, which is corrected with the second correction signal Y 12 .
- a third density signal X 13 is formed in which density fluctuations with periods T 1 and T 2 are reduced relative to the first density signal X 11 and the second density signal X 12 as shown in FIG. 20 , for example.
- a density fluctuation correction is performed with a method in FIG. 19 to obtain an image with a high image quality on the intermediate transfer belt 17, in which image density fluctuations with the period T 1 and period T 2 are reduced.
- the sub-shading data (the second correction signal Y 12 ) are multiplied with a light amount control signal A (main shading data) to generate a light amount control signal B (main shading data + sub-shading data). Then, the light amount control signal B may be input to the light source driving apparatus 13 to control a light amount signal of the light source 14 to reduce the respective density fluctuations in the main scanning direction and the sub-scanning direction by a light control amount of the light source 14.
- FIG. 22A to 22D are diagrams exemplifying a behavior in the frequency domain of various signals shown in FIG. 20 .
- the horizontal axis shows frequency
- the vertical axis shows a signal level.
- FIG. 22A shows a frequency distribution of the first density signal X 11 shown in FIG. 20 .
- a frequency distribution with a frequency f 1 and a frequency f 2 as centers which frequency f 1 corresponds to a period T 1 , which is a rotational period of the drum 16, which frequency f 2 corresponds to a period T 2 , which is a rotational period of the developing roller 22.
- FIG. 22B shows respective frequency distributions of the first correction signal Y 11 and the second correction signal Y 12 shown in FIG. 20 .
- the first correction signal Y 11 and the second correction signal Y 12 are respectively generated as sinusoidal signals, so that, as shown in FIG. 22B , they indicate frequency distributions of only a frequency f 1 which corresponds to a period T 1 and a frequency f 2 which corresponds to a period T 2 .
- FIG. 22C shows a frequency distribution of the second density signal X 12 shown in FIG. 20 .
- the first density signal X 11 is already corrected for with the first correction signal Y 11 , so that, in comparison to FIG. 22A , a frequency component with a frequency f 1 as a center decreases and only a frequency component with a frequency f 2 as a center appears prominently.
- FIG. 22D shows a frequency distribution of the third density signal X 13 shown in FIG. 20 .
- a frequency component with the frequency f 2 as a center decreases in comparison to FIG. 22C since the second density signal X 12 is already corrected for with the second correction signal Y 12 .
- frequency components with the frequency f 1 and the frequency f 2 decrease.
- frequency components of both the frequency f 1 which corresponds to the period T 1 , which is a rotational period of the drum 16, and the frequency f 2 which corresponds to the period T 2 , which is a rotational period of the developing roller 22, may be corrected for dynamically to reduce density fluctuations which occur periodically.
- accurate density signals for density fluctuation correction can be obtained, so that an image forming apparatus which can reduce density fluctuations may be realized in a simple configuration.
- the density fluctuation detecting patterns which detect two signals are generated simultaneously, a one time density detecting time becomes shorter in comparison to a case in which the density fluctuation detecting patterns for detecting two types of periodic signals that correspond to different home position signals are generated, so that a waiting time, etc. is reduced.
- FIG. 23 is a diagram exemplifying a density fluctuation detecting pattern according to the fifth embodiment.
- FIG. 24 is a diagram exemplifying various signals related to the density fluctuation correction according to the fifth embodiment.
- the density fluctuation detecting patterns 23 and 24 for detecting density fluctuations are formed on the same straight line relative to a conveying direction of the intermediate transfer belt 17 such that a part of each overlaps the other.
- the density fluctuation detecting patterns 23 and 24 are detected by only one density sensor 18.
- steps S101 to S107 in FIG. 19 are exactly the same as in the density fluctuation correction according to the fourth embodiment.
- step S108 it is different from the fourth embodiment in that the density fluctuation detecting pattern 24 is formed on the same straight line relative to a conveying direction of the intermediate transfer belt 17 such that it overlaps a part of the density fluctuation detecting pattern 23.
- step S109 unlike in the fourth embodiment, one density sensor 18 simultaneously detects the density fluctuation detecting patterns 23 and 24 formed such that a part of each overlaps the other, so that a density signal X 21 as shown in FIG. 24 , for example, is output.
- the density signal X 21 is a signal which includes information on density fluctuations in a conveying direction of the intermediate transfer belt 17.
- the first correction signal generating unit 30d generates a correction signal Y 21 (frequency f 1 ) by causing data shown with a circle for the density signal X 21 (data corresponding to the density fluctuation detecting pattern 23) to undergo an FFT (fast Fourier transform), etc. Then, the correction signal Y 21 is multiplied by the density signal X 21 to obtain a second density signal X 22 , in which density fluctuations with the period T 1 are reduced. In the obtained second density signal X 22 , a density fluctuation component of a period T 1 is reduced, so that a tendency of density fluctuations with the period T 2 appears.
- step S110 the second correction signal generating unit 30e generates a second correction signal Y 22 (a signal with a period T 2 and a frequency f 2 ), which is a sinusoidal signal with a phase which is reverse that of density fluctuations as shown in FIG. 24 , for example, based on a second density signal X 22 .
- step S111 the second correction signal generating unit 30e causes a value of the second correction signal Y 22 generated in step S110 to undergo A/D conversion, for example, to hold the converted result in a memory (not shown), etc.
- the second correction signal Y 22 which is held in the memory (not shown), etc., may be input into the light source driving apparatus 13 to control a light amount signal of the light source 14 to form density fluctuation detecting patterns in which density fluctuations with periods T 1 and T 2 are reduced.
- a third density signal X 23 is obtained in which density fluctuations with periods T 1 and T 2 are reduced as shown in FIG. 24 .
- a density fluctuation correction is performed with a method in Fig. 19 to obtain a high quality image on the intermediate transfer belt 17, in which image density fluctuations with the period T 1 and period T 2 are reduced.
- the same advantages are yielded as in the fourth embodiment; as one density sensor 18 detects density fluctuation detecting patterns 23 and 24, which are formed such that a part of each pattern overlaps the other, a number of parts of the density sensor in the image forming apparatus may be reduced, contributing to a decreased cost.
- step S104 the second pattern forming unit 30c forms a density fluctuation detecting pattern 24 (a second density fluctuation detecting pattern) as shown in FIG. 18 , for example, in a position corresponding to the density sensor 18a on the intermediate transfer belt 17 along a conveying direction of the intermediate transfer belt 17.
- the density sensor 18 detects a density fluctuation detecting pattern 24 and outputs a density signal X 31 , which is synchronized to the period T 2 of the HP signal W 2 as shown in FIG. 25 , for example.
- the density signal X 31 is a signal which includes information on density fluctuations with periods T 1 and T 2 in the conveying direction of the intermediate transfer belt 17.
- the first correction signal generating unit 30d samples a number of points in the density signal X 31 at predetermined timings and generates a first density signal X 32 corresponding to the HP signal W 1 from the sampled signal.
- step S106 the first correction signal generating unit 30d generates a first correction signal Y 31 (a signal with a period T 1 and a frequency f 1 ), which is a sinusoidal signal with a phase which is reverse that of density fluctuations as shown in FIG. 25 , for example, based on a first density signal X 32 .
- step S107 the first correction signal generating unit 30d causes a value of the first correction signal Y 31 generated in step S106 to undergo A/D conversion, for example, to hold the converted result in a memory (not shown), etc.
- steps S108-8111 according to the fourth embodiment is executed. In this way, the same advantageous effect as in the fourth embodiment is obtained.
- the HP signal W 2 relative to the HP signal W 1 is a non-synchronous signal, so that, a delay time of, for example, ⁇ td1, occurs for the density fluctuation detecting pattern 24 for which writing is started at a timing of the HP signal W 2 relative to the HP signal W 1 . Then, the delay time of ⁇ t12 between the HP signal W 1 and the HP signal W 2 may be detected to calculate a timing, relative to the HP signal W 1 , at which writing of the density fluctuation detecting pattern 24 is started. Thus, a phase difference of the density fluctuation signals may be detected, making it possible to accurately calculate density fluctuations with the period T 1 of the HP signal W 1 .
- multiple density detections may be performed with one density fluctuation detecting pattern without a need to have multiple types of density fluctuation detecting patterns to realize a reduced size and cost of circuitry in the image forming apparatus.
- a seventh embodiment an example is shown of forming a set of density fluctuation detecting patterns 23 and 24 in multiple numbers.
- FIG. 26 is a first part of a diagram exemplifying a density fluctuation detecting pattern according to the seventh embodiment.
- sets of density fluctuation detecting patterns 23 and 24 shown in FIG. 18 are formed in multiple numbers at different positions in the vertical direction (the main scanning direction) relative to the conveying direction of the intermediate transfer belt 17.
- the density sensors 18a to 18f are arranged at positions corresponding to the respective density fluctuation detecting patterns.
- the sets of density fluctuation detecting patterns 23 and 24 are formed in multiple numbers at different positions in the vertical direction (the main scanning direction) relative to the conveying direction of the intermediate transfer belt 17 to obtain density signals by the corresponding density sensors, so that information on density fluctuations within a face in one round of the developing roller 22 and the drum 16 is obtained.
- an average value of density fluctuation detecting signals obtained at multiple positions in the main scanning direction on the intermediate transfer belt 17 may be taken, etc., to obtain information on average density fluctuations within the face and also to realize accurate density fluctuation detection and density fluctuation correction.
- FIG. 27 is a second part of the diagram exemplifying the density fluctuation detecting pattern according to the seventh embodiment.
- sets of density fluctuation detecting patterns 23 and 24 shown in FIG. 23 may be formed in multiple numbers at different positions in the orthogonal direction (the main scanning direction) relative to the conveying direction of the intermediate transfer belt 17, while arranging density sensors 18a-18c at positions corresponding to the density fluctuation detecting patterns. Even in this way, the same advantageous effect as in FIG. 26 is obtained.
- an HP sensor corresponding to a drum and multiple HP sensors corresponding to each of the multiple developing rollers may be used to perform density correction.
- n HP sensors may be used to correct for density fluctuations with n periods.
- a method of changing a light amount of a light source as a scheme of correcting for density fluctuations
- a method of changing a developing bias of the developing roller, etc. may be used.
Landscapes
- Physics & Mathematics (AREA)
- General Physics & Mathematics (AREA)
- Engineering & Computer Science (AREA)
- Microelectronics & Electronic Packaging (AREA)
- Control Or Security For Electrophotography (AREA)
- Electrostatic Charge, Transfer And Separation In Electrography (AREA)
Abstract
Description
- The present invention relates to image forming apparatuses which form an image onto a medium such as paper, etc.
- An image forming apparatus represented by a laser beam printer is known, wherein a light beam emitted from a light source is deflected and scanned in a main scanning direction by a deflecting and scanning unit, and is collected toward a drum (a photosensitive body) which has a face to be scanned, and a latent image is formed on a drum surface. In such an image forming apparatus, the latent image on the drum surface is transferred onto an intermediate transfer belt which is placed between the drum and a developing roller and an image which corresponds to the latent image is formed onto the intermediate transfer belt.
- In the image which is formed onto the intermediate transfer belt, density fluctuations may occur in a main scanning direction and a sub-scanning direction, respectively. One possible cause of the density fluctuations is process gap (PG) fluctuations. First, the density fluctuations of the image in the main scanning direction are considered. As a factor for this, parallel characteristics of the drum (the photosensitive body) and the developing roller are possible. For example, when the mutual parallel characteristics of the drum and the developing roller are lost, variations occur in capabilities of developing onto the drum, possibly causing density fluctuations with respect to the main scanning direction. Here, the density fluctuations linearly change in the main scanning direction.
- Next, the density fluctuations of the image in the sub-scanning direction are considered. One factor for this may be decentering of the drum. For example, when a slight movement of an axle of the drum occurs, positions at which a distance from a rotational axle of the drum to a surface differs occur, so that positions occur in which there is a difference in a gap between the drum and the developing roller. This difference in the gap becomes a developing variation, which would affect the image as the density fluctuations in the sub-scanning direction.
- A different factor may be circularity of the drum. For example, assume that there is a drum B with low circularity relative to a drum A, which is circular. Then, with the drum B, at a time of rotation thereof, a difference occurs in a gap between the drum and the developing roller depending on a rotational angle, which may become a factor for fluctuations in developing. Due to the above-described factors, density fluctuations in the sub-scanning direction occur for an image formed on the drum surface. These density fluctuations become periodic, which occurs with a rotational period of the drum.
- Factors for the density fluctuations include other factors such as potential variations of the drum, toner supply, toner removal, discharging, cleaning, etc., so that, combining them with density fluctuations due to process gap fluctuations, causes dynamic fluctuations to occur in both the main scanning direction and the sub-scanning direction.
- In order to reduce such density fluctuations, for example, a light amount adjustment is performed in accordance with a transmitting characteristic of optics in the main scanning direction, for example. Moreover, for correcting in the sub-scanning direction, there is known a technique in which, for example, correction data are created in accordance with sensitivity variations of a photosensitive body to change a light amount in the sub-scanning direction, and a failure due to a phase offset of a rotational period of the photosensitive body and the correction data is avoided by an arithmetic calculation.
-
- Patent document 1:
JP2008-065270A - Patent document 2:
JP2003-127454A - However, besides the transmitting characteristics of the optics, there are density fluctuation producing factors in the main scanning direction, so that density fluctuations may occur in the main scanning direction over time. Moreover, there are also multiple density fluctuation producing factors in the sub-scanning direction, so that complex density fluctuations may occur by a combination thereof. With the above-described technique, a dynamic range of the density correction is narrow, so that it is difficult to realize a highly accurate density correction.
- In light of the problems described above, an object of the present invention is to provide an image forming apparatus which makes it possible to improve a dynamic range of density correction and realize a highly accurate density correction.
- According to an embodiment of the present invention, an image forming apparatus is provided. The image forming apparatus includes a light source; a drum which is a photosensitive body; an optical scanning apparatus which deflects and scans, in a main scanning direction by a deflecting and scanning unit, a light beam emitted from the light source, and collects, by a scanning and image forming unit, the deflected and scanned light beam on the drum, which drum has a face to be scanned, to form a latent image onto a surface of the drum; and an endless belt which is arranged to be in contact with the drum and on which an image corresponding to the latent image is formed, the image forming apparatus further including a pattern forming unit which forms, on the endless belt along a conveying direction of the endless belt, a density fluctuation detecting pattern having a period; a density sensor which detects the density fluctuating detecting pattern and outputs a density signal including information on density fluctuations in the conveying direction of the endless belt; and a period detecting sensor which detects the period included in the density fluctuations.
- The disclosed technique makes it possible to provide an image forming apparatus which improves a dynamic range of density correction and which can realize a highly accurate density correction.
- Other objects, features, and advantages of the present invention will become more apparent from the following detailed descriptions when read in conjunction with the accompanying drawings, in which:
-
FIG. 1A is a schematic diagram exemplifying an image forming apparatus according to a first embodiment; -
FIGS. 1B and 1C are schematic diagrams exemplifying a density sensor; -
FIG. 2A is a diagram for describing a density fluctuation detecting pattern; -
FIG. 2B is a diagram for describing a method of density correction in a sub-scanning direction; -
FIG. 3A is a diagram illustrating a first part of a diagram for describing the method of density correction in a main scanning direction; -
FIG. 3B is a diagram illustrating a second part of the diagram for describing the method of density correction in the main scanning direction; -
FIG. 3C is a diagram illustrating a third part of the diagram for describing the method of density correction in the main scanning direction; -
FIG. 4A is a diagram illustrating a first part of a diagram for describing density calibration; -
FIG. 4B is a diagram illustrating a second part of the diagram for describing density calibration; -
FIG. 5 is a diagram exemplifying a relationship between an image area rate and color difference fluctuations; -
FIG. 6 is a diagram illustrating one example of a flowchart on density fluctuation correction according to the first embodiment; -
FIG. 7 is a functional block diagram exemplifying a density fluctuation correcting unit according to the first embodiment; -
FIG. 8 is a diagram exemplifying a density fluctuation detecting pattern according to a second embodiment; -
FIG. 9 is a diagram exemplifying the image forming apparatus having multiple drums; -
FIG. 10 is a diagram exemplifying the density fluctuation detecting pattern according to a third embodiment; -
FIG. 11 is a schematic diagram exemplifying the image forming apparatus according to a comparative example; -
FIG. 12 is a schematic diagram exemplifying the image forming apparatus according to a fourth embodiment; -
FIG. 13 is a first part of a diagram for describing density calibration; -
FIG. 14 is a second part of the diagram for describing density calibration; -
FIG. 15 is a diagram for describing a method of density correction; -
FIG. 16A is a diagram for describing an example of density fluctuations in the sub-scanning direction according to drum circularity; -
FIG. 16B is another diagram for describing an example of density fluctuations in the sub-scanning direction according to the drum circularity; -
FIG. 17 is a further diagram for describing an example of density fluctuations in the sub-scanning direction according to the drum circularity; -
FIG. 18 is a diagram exemplifying a density fluctuation detecting pattern according to the fourth embodiment; -
FIG. 19 is a diagram illustrating one example of a flowchart on density fluctuation correction according to the fourth embodiment; -
FIG. 20 is a diagram exemplifying various signals related to density fluctuation correction according to the fourth embodiment; -
FIG. 21 is a functional block diagram of a density fluctuation correcting unit according to the fourth embodiment; -
FIGS. 22A to 22D are diagrams exemplifying a behavior in the frequency domain of various signals shown inFIG. 20 ; -
FIG. 23 is a diagram exemplifying a density fluctuation detecting pattern according to a fifth embodiment; -
FIG. 24 is a diagram exemplifying various signals related to density fluctuation correction according to the fifth embodiment; -
FIG. 25 is a diagram exemplifying various signals related to density fluctuation correction according to a sixth embodiment; -
FIG. 26 is a diagram illustrating a first part of a diagram exemplifying a density fluctuation detecting pattern according to a seventh embodiment; and -
FIG. 27 is a diagram illustrating a second part of the diagram exemplifying the density fluctuation detecting pattern according to the seventh embodiment. - A description is given below with regard to embodiments of the present invention with reference to the drawings. In the respective drawings, the same numbers are applied to the same elements, so that duplicate explanations may be omitted.
-
FIG. 1A is a schematic diagram exemplifying an image forming apparatus according to a first embodiment. With reference toFIG. 1A , theimage forming apparatus 10 includes animage processing unit 11; a lightsource driving apparatus 12; alight source 13; anoptical scanning apparatus 15; adrum 16; anintermediate transfer belt 17; adensity sensor 18; and a home position sensor 19 (which may be called anHP sensor 19 below). - In the
image forming apparatus 10, thedensity sensor 18 reads a density of a toner pattern formed onto theintermediate transfer belt 17, and outputs, to theimage processing unit 11, a density signal V, which is an output signal in which an affixed amount of toner is converted to a voltage. For example, thedensity sensor 18 may be arranged such that a light emitted by an LED is irradiated onto theintermediate transfer belt 17 and a specularly reflected light and a diffuse reflected light which are obtained in accordance with a toner density on theintermediate transfer belt 17 is detected by a light receiving element. - The
HP sensor 19, which is a period detecting sensor which detects a rotational period of thedrum 16, outputs a home position signal W (which may be called an HP signal W below) to theimage processing unit 11. As described below, theimage forming apparatus 10 may include multiple density sensors and multiple HP sensors. - The
image processing unit 11 includes a CPU, a ROM, a RAM, a main memory, etc., for example, various functions of whichimage processing unit 11 may be realized by a program recorded in the ROM, etc., being read into the main memory to be executed by the CPU. A part or the whole of theimage processing unit 11 may be realized by hardware only. Moreover, theimage processing unit 11 may physically be configured with multiple apparatuses. - The
image processing unit 11 detects density fluctuations based on an HP signal W and a density signal V input, calculates a light amount correction amount which corrects for the density fluctuations in the main scanning direction and the sub-scanning direction to generate and output, to the lightsource driving apparatus 12, a light amount control signal A. The lightsource driving unit 12 drives thelight source 13 based on the light amount control signal A. - As the
light source 13, a semiconductor laser, etc., may be used, for example. As a semiconductor laser, a VCSEL (Vertical Cavity Surface Emitting LASER), etc., may be used, for example. - A light beam emitted from the
light source 13 is transmitted toward thedrum 16, which is a photosensitive body by theoptical scanning apparatus 15, and a latent image is formed onto a surface of thedrum 16. Theoptical scanning apparatus 15 includes, for example, a deflecting and scanning unit (not shown) which deflects and scans, in a main scanning direction, a light beam emitted from thelight source 13; a scanning and image forming unit (not shown) which collects the deflected and scanned light beam onto thedrum 16, which is a face to be scanned, etc. - Then, after undergoing processes of developing and transferring, toner whose amount is based on a light emitting amount and a light emitting time of the
light source 13 is affixed onto theintermediate transfer belt 17 and a predetermined image is formed. Theintermediate transfer belt 17 is an endless belt which is arranged to be in contact with thedrum 16 and onto which an image corresponding to the latent image is formed. - In this way, in the
image forming apparatus 10, light emitting level control of thelight source 13 is performed with a light amount based on a light amount control signal A which corrects for density fluctuations in the main scanning direction and the sub-scanning direction. In this way, the respective density fluctuations in the main scanning direction and the sub-scanning direction may be decreased by control of a light amount of thelight source 13. - The light amount control signal A based on only density fluctuations in either one of the main scanning direction and the sub-scanning direction can also be generated to correct for only density fluctuations in the one of the main scanning direction and the sub-scanning direction. The main scanning direction is a direction which is orthogonal to a conveying direction of the
intermediate transfer belt 17, while the sub-scanning direction is the conveying direction of theintermediate transfer belt 17. - Below main constituting elements of the
image forming apparatus 10 are described in more detail.FIGS. 1B and 1C are schematic diagrams exemplifying a density sensor.FIG. 1B shows a case in which the toner is not affixed onto theintermediate transfer belt 17, whileFIG. 1C shows a case in which the toner is affixed onto theintermediate transfer belt 17. - With reference to
FIGS. 1B and 1C , thedensity sensor 18 includes a light-emittingelement 181; the specularly reflected light receivingelement 182; and the diffuse reflectedlight receiving element 183. Thelight emitting element 181 is a light emitting diode (LED), for example, while the specularly reflected light receivingelement 182 and the diffuse reflectedlight receiving element 183 are photodiodes (PDs), for example. - As shown in
FIG. 1B , when the toner is not affixed onto theintermediate transfer belt 17, a larger amount of light irradiated from thelight emitting element 181 is represented by a light which is specularly reflected from theintermediate transfer belt 17, and a larger amount of light is incident onto the specularly reflected light receivingelement 182. On the other hand, an amount of diffuse reflected light on theintermediate transfer belt 17 is small, so that almost no light is incident onto the diffuse reflectedlight receiving element 183. - When the
toner 50 is affixed onto theintermediate transfer belt 17 as shown inFIG. 1C , an amount of the specularly reflected light becomes smaller, and an output signal of the specularly reflected light receivingelement 182 becomes smaller. On the other hand, an amount of diffuse reflected light becomes larger, and an output signal of the diffuse reflectedlight receiving element 183 becomes larger. - In this way, for a case in which the
toner 50 is not affixed and for a case in which thetoner 50 is affixed, detected signal levels of the respective specularly reflected light receivingelement 182 and diffuse reflectedlight receiving element 183 differ. This makes it possible to detect a density of thetoner 50 on theintermediate transfer belt 17. How the detected signal levels of the respective specularly reflected receivingelement 182 and the diffuse reflectedlight receiving element 183 correspond to an actual image density cannot be discriminated only from the above-described configurations. This will be described below with reference toFIGS. 4A and4B . -
FIG. 2A is a diagram for describing a density fluctuation detecting pattern. As shown inFIG. 2A , according to the present embodiment, a densityfluctuation detecting pattern 20 for detecting density fluctuations is formed on theintermediate transfer belt 17 in synchronicity with an HP signal W which is detected with a rotation of thedrum 16. The densityfluctuation detecting pattern 20 can be formed from a time which is delayed by Δt, for example, relative to the HP signal W to accurately detect density fluctuations at a specific location of thedrum 16 bydensity sensors fluctuation detecting pattern 20 by thedensity sensors -
FIG. 2B is a diagram for describing a method of density correction in the sub-scanning direction. With the HP signal W as a trigger signal, a density signal which indicates density fluctuations may be detected from the densityfluctuation detecting pattern 20 by thedensity sensors drum 16 may be detected from thedensity sensor 18a. - Moreover, based on the density signal Va, as a correction signal Ha, a sinusoidal signal with a phase which is reverse that of the density signal Va and the same period as the period Td of the
drum 16 may be generated. By controlling a light amount signal of thelight source 13 using a correction signal Ha with a phase which is reverse that of the density signal Va, the density fluctuation detecting pattern can be formed to reduce density fluctuations of the formed density fluctuation detecting pattern in the sub-scanning direction. - In other words, when the density fluctuation detecting pattern which is corrected for using the correction signal Ha is detected by the
density sensor 18a, for example, a signal whose amplitude is smaller than that of the density signal Va is obtained. In lieu of the density signal Va, which is an output signal of thedensity sensor 18a, a correction signal may be generated based on an output signal of thedensity sensor density sensors 18a to 18c to reduce the density fluctuations in the sub-scanning direction. - In this way, a correction signal Ha which corrects for density fluctuations in the sub-scanning direction which is orthogonal to the main scanning direction may be generated based on an output signal of the
HP sensor 19 and an output signal of at least one density sensor ofmultiple density sensors light source 13 may be performed with a light amount based on the correction signal Ha to reduce density fluctuations in the sub-scanning direction. The correction signal Ha does not have to be a sinusoidal periodic pattern, and may be set to be a triangular periodic pattern, a trapezoidal periodic pattern, etc., for example, in accordance with conditions. -
FIG. 3A is a diagram for describing a density correcting method in the main scanning direction. As shown inFIG. 2A as described above, when multiple density sensors (threedensity sensors fluctuation detecting pattern 20, in addition to the above-described periodic fluctuations in the sub-scanning direction, density signals Va, Vb, and Vc with differing signal levels are obtained in the main scanning direction as shown inFIG.3A . - Based on the HP signal W, the density signals Va, Vb, and Vc may be sampled for one period or for multiple periods to detect density fluctuations in the main scanning direction as shown in
FIG. 3B . As shown inFIG. 3C , density fluctuations in the main scanning direction can be reduced by linearly interpolating density signals Va, Vb, and Vc to generate the interpolated signal Sx, reversing the interpolated signal Sx to generate a correction signal Hb, and controlling a light amount signal of thelight source 13 using the correction signal Hb. - While the above explanations have been given by breaking down into the sub-scanning direction and the main scanning direction for convenience, in practice, the correction signal Ha in the sub-scanning direction and the correction signal Hb in the main scanning direction are independently generated, and a light amount control signal A (see
FIG. 1A ) in which the correction signal Ha and the correction signal Hb are convolved is generated to drive thelight source 13. In this way, the respective density fluctuations in the main scanning direction and the sub-scanning direction may be reduced by control of a light amount of thelight source 13. -
FIGS. 4A and4B are drawings for describing density calibration. In order to perform density correction, it is necessary to know a fluctuating amount of density relative to light amount fluctuations. As shown inFIG. 4A , a case is considered of successively increasing an amount of light which forms a pattern by control of an exposure power of thelight source 13, drawing adensity calibrating pattern 25 which has 11 levels (11 types) of rectangular-shaped patterns with differing densities in the sub-scanning direction, and detecting, by thedensity sensor 18a on the sub-scanning line, density signal V (including V1 to V11) which correspond to the respective patterns which make up thedensity calibrating pattern 25.FIG. 4A shows that a light amount is caused to be changed in intervals of 2% from -10% to +10% relative to a reference light amount. - Then, between the respective patterns which make up the
density calibrating pattern 25 and the light amount increased for changing the density, there is a generally linear relationship. Moreover, there is also a generally linear relationship between the density of the respective patterns which make up thedensity calibrating pattern 25 and the density signal V (including V1 to V11), a generally linear relational data between the light amount and the density signal V (including V1 to V11) may be obtained as shown inFIG. 4B . - Furthermore, an actual print may be performed to measure an image density with a colorimeter, a scanner, etc., and a correspondence thereof with the density signal V (including V1 to V11) may be made to take a correlation between an actual image density and the density signal V (including V1 to V11). Similarly, for the
density sensors - While an example is shown in
FIG. 4A of forming thedensity calibrating pattern 25 with 11 levels of exposure power that are changed by controlling exposure power of thelight source 13, thedensity calibrating pattern 25 may be formed with at least 3 levels of exposure power that are changed by controlling exposure power of thelight source 13 to calculate a change amount of the density relative to light amount fluctuations of thelight source 13. - In the present embodiment, the image area rates of the density
fluctuation detecting pattern 20 shown inFIG. 2A and thedensity calibrating pattern 25 shown inFIG. 4A are respectively set between 50% and 85%. When correcting for density fluctuations within a page, correction can be performed favorably by changing a color difference in increments of 0.2 from a point of sensing by a density sensor or visual inspection. When the image area rate is between 50% and 85%, color difference fluctuations on paper becomes approximately 4 when the light amount is changed +10% as shown inFIG. 5 . Therefore, in order to change the color difference in increments of 0.2, it suffices that a light amount control resolution be +0.5%. - On the other hand, when the image area rate is other than between 50% and 85%, in order to change the color difference in increments of 0.2, the light amount control resolution becomes approximately ±1%, so that a dynamic range of density correction becomes narrow when taking into account upper and lower limits of a light amount change. The image area rate is a numerical value which indicates how much of a basic matrix of a dot or a parallel line is occupied when outputting a certain density pattern, and may also be called a dot area rate. For example, for a checker-shaped density pattern, the image area rate becomes 50%. The image area rate on paper may be calculated by calculating backwards from a CCD or a spectroscope.
- In this way, setting the image area rate of the density
fluctuation detecting pattern 20 between 50% to 85% causes a dynamic range of density correction to be wide, so that accurate density fluctuation data for density correction can be obtained for density fluctuations caused by thedrum 16, making it possible to realize animage forming apparatus 10 which can reduce density fluctuations in a simple configuration. The same applies also to thedensity calibrating pattern 25. - Here, density fluctuation correction is described in further detail below with reference to
FIGS. 6 and7 .FIG. 6 is an example of a flowchart on density fluctuation correction according to the first embodiment.FIG. 7 is a functional block diagram exemplifying a density fluctuation correcting unit according to the first embodiment. A calibratingunit 30a, apattern forming unit 30b, and a correctingsignal generating unit 30c of the densityfluctuation correcting unit 30 shown inFIG. 7 may be realized by theimage processing unit 11, the lightsource driving apparatus 12, thelight source 13, theoptical scanning apparatus 15, etc. - With reference to
FIGS. 6 and7 , first in step S401, the calibratingunit 30a forms a density calibrating pattern as shown inFIG. 4 , for example, at a position corresponding to thedensity sensors intermediate transfer belt 17. Then, the calibratingunit 30a forms a uniform density calibrating pattern with at least three levels (11 levels in the example inFIG. 4A ) of exposure power that are changed by control of exposure power in thelight source 13 and with the image area rate between 50% and 85%. Next, in step S403, the calibratingunit 30a obtains a density signal of therespective density sensors density calibrating pattern 25. - Next, in step S405, the calibrating
unit 30a obtains correlation data between the respective density signal levels and light emitting power (light amount) of thelight source 13 as shown inFIG. 4B , for example, and saves it in a memory, etc. In this way, correlation is taken between thedensity calibrating pattern 25 and the respective density signals obtained from thedensity sensors - Next, in step S407, the
pattern forming unit 30b forms a densityfluctuation detecting pattern 20 as shown inFIG. 2A , for example, at a position which corresponds to thedensity sensors intermediate transfer belt 17 with a rotational period of thedrum 16 that is detected by theHP sensor 19. Then, thepattern forming unit 30b forms a uniform densityfluctuation detecting pattern 20 with an image area rate between 50% and 85%. - Next, in step S409, the correction
signal generating unit 30c obtains the respective density signals (density signals Va, Vb, and Vc, which are indicated inFIG. 3A ) of thedensity sensors fluctuation detecting pattern 20. Next, in step S411, the correctionsignal generating signal 30c generates a periodic pattern corresponding to density fluctuations in the sub-scanning direction. The periodic pattern corresponding to the density fluctuation in the sub-scanning direction may be obtained by approximating a signal in which density signals Va, Vb, Vc shown inFIG. 3A are averaged with a sinusoidal wave. Alternatively, the periodic pattern corresponding to the density fluctuations in the sub-scanning direction may be obtained by approximating, with a sinusoidal wave, an output signal of at least one density sensor, out of the density signals Va, Vb, and Vc shown inFIG. 3A . - Next, in step S413, the correction
signal generating unit 30c generates a correction signal which is a sinusoidal signal with a phase which is reverse that of a periodic pattern corresponding to the density fluctuations in the sub-scanning direction. Next, in step S415, the correctionsignal generating unit 30c causes a correction signal pattern generated in step S413 to, for example, undergo an A/D conversion to save the converted pattern in the memory, etc. Only a periodic pattern of a correction signal that corresponds to one period may be saved as a basic pattern. - Next, in step S417, the correction
signal generating unit 30c obtains an average value (seeFIG. 3B , for example) for each density sensor for the respective density signals (density signals Va, Vb, and Vc shown inFIG. 3A , for example) of thedensity sensors fluctuation detecting pattern 20. - Next, in step S419, the correction
signal generating unit 30c generates an approximation formula (a formula which shows a pattern of an interpolation signal Sx shown inFIG. 3C , for example) corresponding to the density fluctuations in the main scanning direction. Next, in step S421, the correctionsignal generating unit 30c generates a light emitting power correction formula (for example, a formula which shows a pattern of the correction signal Hb inFIG. 3C ) for correcting the density fluctuations in the main scanning direction. Next, in step S423, the correctionsignal generating unit 30c saves, in the memory, etc., a light emitting power correction formula generated in step S421. - Thereafter, based on the light emitting power correction formula saved in step S423 and the correction signal pattern saved in step S415, the correction
signal generating unit 30c generates a light amount control signal A in which both are convolved, and performs light emitting level control of thelight source 13 with a light amount based on the light amount control signal A. In this way, the respective density fluctuations in the main scanning direction and the sub-scanning direction may be reduced by control of a light amount of thelight source 13. In other words, a density fluctuation correction is performed with a method inFIG. 6 to obtain a high quality image on theintermediate transfer belt 17, in which image, density fluctuations in the main scanning direction and the sub-scanning direction are reduced. - In this way, setting an image area rate of the density fluctuation detecting pattern between 50% and 85% causes a wide dynamic range of density correction, so that accurate density fluctuation data for density fluctuation correction can be obtained for density fluctuations caused by the drum, making it possible to realize the correction with a simple configuration.
- In a second embodiment, an example of a density fluctuation detecting pattern which is different from the first embodiment is shown.
FIG. 8 is a diagram exemplifying a density fluctuation detecting pattern according to the second embodiment. With reference toFIG. 8 , the densityfluctuation detecting patterns density sensors - The density
fluctuation detecting patterns fluctuation detecting pattern 20 shown inFIG. 2A . - According to a third embodiment is shown an example in which the present invention is applied to a tandem color machine which includes multiple photosensitive bodies.
FIG. 9 is a diagram exemplifying an image forming apparatus including multiple drums (photosensitive bodies). With reference toFIG. 9 , theimage forming apparatus 40, which includes a configuration in whichoptical scanning apparatuses intermediate transfer belt 17, which is an endless belt, is a so-called tandem-type image forming apparatus. Theintermediate transfer belt 17 is an endless belt which is wound around various rollers which are rotationally driven. - The
optical scanning apparatuses respective drums respective drums - In the vicinity of the
drums HP sensors HP sensors HP sensor 19 which were described in the first embodiment. - In the
image forming apparatus 40, the rotational timing or period may differ somewhat for each of thedrums image forming apparatus 40, a drum differs for each of colors of cyan, magenta, yellow, and black, so that timings for generating an HP signal for each drum also differs. Thus, when density fluctuation detecting pattern of each color is generated onto theintermediate transfer belt 17, a density detecting pattern is generated in response to a timing of an HP signal which differs from color to color. In this way, from an aspect of image quality, an image with good color reproducibility in which density fluctuations for each of thedrums -
FIG. 10 is a diagram exemplifying a density fluctuation detecting pattern according to a third embodiment. InFIG. 10 , densityfluctuation detecting patterns fluctuation detecting patterns fluctuation detecting patterns fluctuation detecting patterns - Moreover, in
FIG. 10 , an HP signal Wc is an output signal from theHP sensor 19a corresponding to cyan; an HP signal Wm is an output signal from theHP sensor 19b corresponding to magenta; an HP signal Wy is an output signal from theHP sensor 19c corresponding to yellow; and an HP signal Wb is an output signal from theHP sensor 19d corresponding to black. - In
FIG. 10 , the cyan densityfluctuation detecting patterns fluctuation detecting patterns fluctuation detecting patterns fluctuation detecting patterns - The reason that the density fluctuation detecting pattern corresponding to two periods of the respective HP signals is generated is that there may a case in which an S/N ratio is small at a time of detecting by a density sensor with only a density fluctuation detecting pattern corresponding to one period of the respective HP signals. Therefore, in order to increase an S/N ratio when detecting by the density sensor, a density fluctuation detecting pattern corresponding to at least three periods of the respective HP signals may be formed.
- A density fluctuation detecting pattern formed that corresponds to multiple periods of the respective HP signals may be detected by each density sensor and an average processing may be performed among signals at the same position to more accurately detect periodic density fluctuations which are caused by a drum shape, etc. Therefore, a correction signal may be generated based on the density signal and a light amount of a light source may be controlled to realize an apparatus which forms an image with a high image quality in which density fluctuations are reduced.
- First, in describing an image forming apparatus according to a fourth embodiment, a related-art image forming apparatus as a comparative example is described.
FIG. 11 is a schematic diagram exemplifying the image forming apparatus according to the comparative example. With reference toFIG. 11 , animage forming apparatus 100 according to a comparative example includes animage processing ASIC 11; a lightsource driving apparatus 13; alight source 14; anoptical scanning apparatus 15; adrum 16; anintermediate transfer belt 17; and adensity sensor 18. - In
FIG. 11 , a light amount control signal A (main shading data) which is output from theimage processing ASIC 11 is a light amount control signal in a main scanning direction (rotational axle direction) of thedrum 16. The optical control signal A is input to the lightsource driving apparatus 13, which drives thelight source 14 with a light amount based on the light amount control signal A and performs light emitting level control of the light source 14 (controls exposure power of the light source 14). As thelight source 14, a semiconductor laser, etc., may be used, for example. As a semiconductor laser, a VCSEL (Vertical Cavity Surface Emitting LASER), etc., may be used, for example. - A light beam emitted from the
light source 14 is transmitted toward thedrum 16, which is a photosensitive body, by theoptical scanning apparatus 15, and a latent image is formed on a surface of thedrum 16. Theoptical scanning apparatus 15 includes, for example, a deflecting and scanning unit (not shown) which deflects and scans, in the main scanning direction, the light beam emitted from thelight source 14; a scanning and image forming unit (not shown) which collects the deflected and scanned light beam onto thedrum 16, which is a face to be scanned, etc. - Then, after undergoing processes of developing and transferring, a toner whose amount is based on a light emitting amount and a light emitting time of the
light source 14 is affixed onto theintermediate transfer belt 17 and a predetermined image is formed. Theintermediate transfer belt 17 is an endless belt which is arranged to be in contact with thedrum 16 and onto which an image corresponding to the latent image is formed. - The
density sensor 18 reads a density of a toner pattern formed onto theintermediate transfer belt 17, and outputs, to theimage processing ASIC 11, a density signal V, which is an output signal in which an affixed amount of toner is converted to a voltage. For example, thedensity sensor 18 may be arranged such that a light emitted by an LED is irradiated onto theintermediate transfer belt 17 and a specularly reflected light and a diffuse reflected light which are obtained in accordance with a toner density on theintermediate transfer belt 17 is detected by a light receiving element. -
FIG. 12 is a schematic diagram exemplifying an image forming apparatus according to the fourth embodiment. With reference toFIG. 12 , theimage forming apparatus 10 is different from the image forming apparatus 100 (seeFIG. 11 ) in that a shadingdata converting unit 12 and a home position sensor 19 (which may be called aHP sensor 19 below) are added. Theimage forming apparatus 10 not only corrects for shading in the main scanning direction as in theimage forming apparatus 100, but also corrects shading in the sub-scanning direction. - In the
image forming apparatus 10, a light amount control signal A (main shading data) output from theimage processing ASIC 11, a density signal V which is output from thedensity sensor 18, and a home position signal W (which may be called an HP signal W below) which is output from theHP sensor 19 are respectively input to the shadingdata converting unit 12. TheHP sensor 19 is a period detecting sensor which detects a rotational period of thedrum 16. - The shading
data converting unit 12 includes a function of generating sub-shading data which corrects for shading in the sub-scanning direction as a signal which is synchronized to the HP signal W, etc. Moreover, it includes a function of multiplying the generated sub-shading data with the light amount control signal A (main shading data) to generate a light amount control signal B (main shading data + sub-shading data). - The shading
data converting unit 12 includes a CPU, a ROM, a main memory, etc., for example, various functions of which shadingdata converting unit 12 are realized by a program recorded in the ROM, etc., being read into the main memory to be executed by the CPU. A part or the whole of the shadingdata converting unit 12 may be realized by hardware only. Moreover, the shadingdata converting unit 12 may physically be configured with multiple apparatuses. - The light amount control signal B is input to the light
source driving apparatus 13, which controls a light emitting level of thelight source 14 with a light amount based on the light amount control signal B. In this way, the respective density fluctuations in the main scanning direction and the sub-scanning direction may be decreased by control of a light amount of thelight source 14. It is also possible to control thelight source 14 based on only sub-shading data, not combining the generated sub-shading data with the light amount control signal A (the main shading data), and correct for shading only in the sub-scanning direction. The main scanning direction is a direction which is orthogonal to a conveying direction of theintermediate transfer belt 17, while the sub-scanning direction is the conveying direction of theintermediate transfer belt 17. -
FIGS. 13 and14 are diagrams for describing density calibration. As shown inFIG. 13 , a case is considered of successively increasing an amount of light for forming a pattern; drawing, in the sub-scanning direction, adensity calibrating pattern 20 which includes ten rectangular-shaped patterns with differing densities; and detecting, by thedensity sensor 18 on the sub-scanning line, a density signal V (including V1 to V10) which corresponds to the respective patterns which makes up thedensity calibrating pattern 20. - Then, between the respective patterns which make up the
density calibrating pattern 20 and the light amount increased for changing the density, there is a generally linear relationship. Moreover, there is also a generally linear relationship between the density in the respective patterns which make up thedensity calibrating pattern 20 and the density signal V (including V1 to V10), and generally linear relational data between the light amount and the density signal V (including V1 to V10) may be obtained as shown inFIG. 14 . Moreover, an actual print may be performed to measure an image density with a colorimeter, a scanner, etc., and a correspondence thereof with the density signal V (including V1 to V10) may be made to take a correlation between an actual image density and the density signal V (including V1 to V10). -
FIG. 15 is a diagram for describing a density correction method. For example, a case is considered of forming a certain density pattern in multiple numbers within a time width of a period T1 of thedrum 16. - Here, a period T1 in a
drum 16 is not necessarily equivalent to a print size, and a print starting position relative to thedrum 16 is not constant. As density fluctuations of thedrum 16 with a period T1 occur, with an HP signal W as a trigger, anHP sensor 19 may be provided to specify the period T1 of thedrum 16. - A phase and the period T1 of the
drum 16 are specified by theHP sensor 19 to obtain a density signal Va, which is close to a sinusoidal wave with the same period as the period T1 of thedrum 16 from thedensity sensor 18. Based on density fluctuations of the density signal Va, as a correction signal Y, a sinusoidal signal with a phase which is reverse that of a density fluctuation Va and the same period as a period T1 of thedrum 16 may be generated. Amplitude of the sinusoidal signal becomes a correction amount. - Forming the density fluctuation detecting pattern by inputting, into the light
source driving apparatus 13, a correction signal Y with a phase which is reverse that of the density fluctuation Va to control a light amount of thelight source 14 makes it possible to reduce density fluctuations of the formed density fluctuation detecting pattern in the sub-scanning direction. In other words, when the density fluctuation detecting pattern which is formed using the correction signal Y is detected by thedensity sensor 18, a signal whose amplitude is smaller than that of the density signal Va, such as a density signal Vb, is obtained. In the density signal Vb, a density fluctuating component with the period T1 of thedrum 16 is reduced relative to the density signal Va. - While not shown in
FIG. 12 , in practice, as shown inFIGS. 16A, 16B , andFIG. 17 , a developingroller 22, which is a rotating body, is located at a position opposing thedrum 16, between which an intermediate transfer belt 17 (not shown) is placed. In other words, with theintermediate transfer belt 17 being placed between thedrum 16 and the developingroller 22, rotating of thedrum 16 and the developingroller 22 in a predetermined direction causes theintermediate transfer belt 17 to be conveyed in the sub-scanning direction. The developingroller 22 includes a function of developing a latent image which is formed onto thedrum 16. - Then, the
HP sensor 19 includes anHP sensor 19a which detects a home position of thedrum 16 and anHP sensor 19b which detects a home position of the developingroller 22. TheHP sensor 19a is a first period detecting sensor which detects density fluctuations of a period T1 which corresponds to rotating of thedrum 16, while theHP sensor 19b is a second period detecting sensor which detects density fluctuations of a period T2 which corresponds to rotating of the developingroller 22 which is different from a rotational period of thedrum 16. TheHP sensor 19a outputs an HP signal W1 to the shadingdata converting unit 12, while theHP sensor 19b outputs an HP signal W2 to the shadingdata converting unit 12. The period T1 is one representative example of the first period according to the present invention, while the period T2 is one representative example of the second period according to the present invention. - With reference to
FIGS. 16A, 16B , and17 , an example is described of density fluctuations in the sub-scanning direction due to the circularity of thedrum 16. An image density varies depending on a gap between thedrum 16 and the developingroller 22. As shown inFIG. 16A , when thedrum 16 is circular, the image density stabilizes to a certain value as shown in a broken line (a) inFIG. 17 . On the other hand, as shown inFig. 16B , when the circularity of thedrum 16 is low, a gap fluctuation occurs due to a rotational position as shown in solid and broken lines of thedrum 16, so that the image density also changes with rotating of thedrum 16. - In
FIG. 16B , there are two fluctuating portions with a diameter which is larger and with a diameter which is smaller relative to a circle, so that as shown with a solid line (b) inFIG. 17 , a density of an image corresponding to one period (T1) of thedrum 16 appears as a density fluctuation which is close to a sinusoidal wave having two inflection points. Therefore, it is desirable to generate around at least five locations of density fluctuation detecting patterns as shown in black circles inFIG. 17 between output signals of theHP sensor 19a that corresponds to one period of thedrum 16 to detect density fluctuations. -
FIG. 18 is a diagram exemplifying a density fluctuation detecting pattern according to the fourth embodiment. With reference toFIG. 18 , for density fluctuation detection, on theintermediate transfer belt 17 are formed densityfluctuation detecting patterns fluctuation detecting patterns FIG. 18 , are representative examples of the first density fluctuation detecting pattern and the second density fluctuation detecting pattern according to the present invention. - The density
fluctuation detecting pattern 23, which is a pattern formed in synchronicity with the HP signal W1 which is detected with rotating of thedrum 16, has a first occurrence period. While the first occurrence period is set to six patterns within a period T1 of the HP signal W1 in an example inFIG. 18 , it is not limited thereto. - Moreover, the density
fluctuation detecting pattern 24, which is a pattern formed in synchronicity with the HP signal W2 which is detected with rotating of the developingroller 22, has a second occurrence period which is different from the first occurrence period. While the second occurrence period is set to five patterns within a period T2 of the HP signal W2 in an example inFIG. 18 , it is not limited thereto. A pattern interval of the densityfluctuation detecting pattern 24 may be set to be a constant interval for a multiple number of periods of the period T2. - The density
fluctuation detecting pattern 23 is generated from a time which is delayed by Δt1, for example, relative to a rise of the HP signal W1 of period T1 (from tb0 to tb1) while the densityfluctuation detecting pattern 24 can be generated from a time which is delayed by Δt2, for example, relative to a rise of the HP signal W2 of period T2. - Now, with reference to
FIGS. 19 to 21 , a density fluctuation correction using the densityfluctuation detecting patterns FIG. 18 is described.FIG. 19 is an example of a flowchart on density fluctuation correction according to the fourth embodiment.FIG. 20 is a diagram exemplifying various signals related to density fluctuation correction according to the fourth embodiment.FIG. 21 is a functional block diagram of a densityfluctuation correcting unit 30 according to the fourth embodiment. - A calibrating
unit 30a, a firstpattern forming unit 30b, a secondpattern forming unit 30c, a first correctionsignal generating unit 30d, and a second correctionsignal generating unit 30e which are shown inFIG. 21 may be realized by the shadingdata converting unit 12, the lightsource driving unit 13, thelight source 14, theoptical scanning apparatus 15, etc. - With reference to
FIGS. 19 to 21 , first, in step S101, the calibratingunit 30a forms two columns ofdensity calibrating patterns 20 having 10 rectangular patterns with differing densities as shown inFIG. 13 , for example, at a position (in the sub-scanning direction) corresponding todensity sensors intermediate transfer belt 17. Next, in step S102, thedensity sensors density calibrating patterns 20 of the two columns. - Next, in step S103, the calibrating
unit 30a obtains correlation data between the density signal anddensity calibrating pattern 20 of each column as shown inFIG. 14 , for example. In this way, a correlation is taken between the density signals obtained from thedensity sensors density calibrating pattern 20 of each column. In other words, a correspondence between amplitude of a density signal and a density of an image formed onto theintermediate transfer belt 17 is identified, making it possible to discriminate a magnitude of the density relative to the density signal. - Next, in step S104, the first
pattern forming unit 30b forms the density fluctuation detecting pattern 23 (a first density fluctuation detecting pattern) as shown inFIG. 18 , for example, in a position corresponding to thedensity sensor 18a on theintermediate transfer belt 17 along a conveying direction of theintermediate transfer belt 17. Next, in step S105, thedensity sensor 18a detects a densityfluctuation detecting pattern 23 and outputs a first density signal X11 as shown inFIG. 20 , for example. The first density signal X11 is a signal which includes information on density fluctuations in a conveying direction of theintermediate transfer belt 17. - Next, in step S106, the first correction
signal generating unit 30d generates a first correction signal Y11 (a signal with a period T1 and a frequency f1), which is a sinusoidal signal with a phase which is reverse that of density fluctuations as shown inFIG. 20 , for example, based on a first density signal X11. Next, in step S107, the first correctionsignal generating unit 30d causes a value of the first correction signal Y11 generated in step S106 to undergo A/D conversion, for example, to hold the converted result in a memory (not shown), etc. - Next, in step S108, the second
pattern forming unit 30c inputs the first correction signal Y11 in the lightsource driving apparatus 13 to control a light amount of thelight source 14 to form a density fluctuation detecting pattern 24 (a second density fluctuation detecting pattern). Next, in step S109, thedensity sensor 18b detects the densityfluctuation detecting pattern 24 and outputs a second density signal X12 as shown inFIG. 20 , for example. The second density signal X12 is a signal which includes information on density fluctuations in the conveying direction of theintermediate transfer belt 17. - Next, in step S110, the second correction
signal generating unit 30e generates a second correction signal Y12 (a signal with a period T2 and a frequency f2), which is a sinusoidal signal with a phase which is reverse that of density fluctuations as shown inFIG. 20 , for example, based on a second density signal X12. Next, in step S111, the second correctionsignal generating unit 30e causes a value of the second correction signal Y12 generated in step S110 to undergo A/D conversion, for example, to hold the converted result in a memory (not shown), etc. - Thereafter, the second correction signal Y12, which is held in the memory (not shown), etc., may be input into the light
source driving apparatus 13 to control a light amount signal of thelight source 14 to form a density fluctuation detecting pattern in which density fluctuations with periods T1 and T2 are reduced. When the density fluctuation detecting pattern, which is corrected with the second correction signal Y12, is detected with a density sensor, a third density signal X13 is formed in which density fluctuations with periods T1 and T2 are reduced relative to the first density signal X11 and the second density signal X12 as shown inFIG. 20 , for example. In other words, a density fluctuation correction is performed with a method inFIG. 19 to obtain an image with a high image quality on theintermediate transfer belt 17, in which image density fluctuations with the period T1 and period T2 are reduced. - While an example of performing a density correction only with sub-shading data (the second correction signal Y12) is shown, in practice, the sub-shading data (the second correction signal Y12) are multiplied with a light amount control signal A (main shading data) to generate a light amount control signal B (main shading data + sub-shading data). Then, the light amount control signal B may be input to the light
source driving apparatus 13 to control a light amount signal of thelight source 14 to reduce the respective density fluctuations in the main scanning direction and the sub-scanning direction by a light control amount of thelight source 14. -
FIG. 22A to 22D are diagrams exemplifying a behavior in the frequency domain of various signals shown inFIG. 20 . InFIG. 22A to 22D , the horizontal axis shows frequency, while the vertical axis shows a signal level.FIG. 22A shows a frequency distribution of the first density signal X11 shown inFIG. 20 . As shown inFIG. 22A , for the first density signal X11 is seen a frequency distribution with a frequency f1 and a frequency f2 as centers, which frequency f1 corresponds to a period T1, which is a rotational period of thedrum 16, which frequency f2 corresponds to a period T2, which is a rotational period of the developingroller 22. -
FIG. 22B shows respective frequency distributions of the first correction signal Y11 and the second correction signal Y12 shown inFIG. 20 . The first correction signal Y11 and the second correction signal Y12 are respectively generated as sinusoidal signals, so that, as shown inFIG. 22B , they indicate frequency distributions of only a frequency f1 which corresponds to a period T1 and a frequency f2 which corresponds to a period T2. -
FIG. 22C shows a frequency distribution of the second density signal X12 shown inFIG. 20 . As shown inFIG. 22C , in the second density signal X12, the first density signal X11 is already corrected for with the first correction signal Y11, so that, in comparison toFIG. 22A , a frequency component with a frequency f1 as a center decreases and only a frequency component with a frequency f2 as a center appears prominently. -
FIG. 22D shows a frequency distribution of the third density signal X13 shown inFIG. 20 . As shown inFIG. 22D , in the third density signal X13, a frequency component with the frequency f2 as a center decreases in comparison toFIG. 22C since the second density signal X12 is already corrected for with the second correction signal Y12. In other words, compared toFIG. 22A , frequency components with the frequency f1 and the frequency f2 decrease. - In this way, frequency components of both the frequency f1 which corresponds to the period T1, which is a rotational period of the
drum 16, and the frequency f2 which corresponds to the period T2, which is a rotational period of the developingroller 22, may be corrected for dynamically to reduce density fluctuations which occur periodically. In other words, for density fluctuations which occur due to fluctuations in a physical position between thedrum 16 and the developingroller 22, accurate density signals for density fluctuation correction can be obtained, so that an image forming apparatus which can reduce density fluctuations may be realized in a simple configuration. - Moreover, as the density fluctuation detecting patterns which detect two signals are generated simultaneously, a one time density detecting time becomes shorter in comparison to a case in which the density fluctuation detecting patterns for detecting two types of periodic signals that correspond to different home position signals are generated, so that a waiting time, etc. is reduced.
- In a fifth embodiment, an example is shown of detecting the density
fluctuation detecting patterns -
FIG. 23 is a diagram exemplifying a density fluctuation detecting pattern according to the fifth embodiment.FIG. 24 is a diagram exemplifying various signals related to the density fluctuation correction according to the fifth embodiment. With reference toFIG. 23 , on theintermediate transfer belt 17, the densityfluctuation detecting patterns intermediate transfer belt 17 such that a part of each overlaps the other. According to the fifth embodiment, the densityfluctuation detecting patterns density sensor 18. - In the density fluctuation correction according to the fifth embodiment, steps S101 to S107 in
FIG. 19 are exactly the same as in the density fluctuation correction according to the fourth embodiment. In step S108, it is different from the fourth embodiment in that the densityfluctuation detecting pattern 24 is formed on the same straight line relative to a conveying direction of theintermediate transfer belt 17 such that it overlaps a part of the densityfluctuation detecting pattern 23. - In step S109, unlike in the fourth embodiment, one
density sensor 18 simultaneously detects the densityfluctuation detecting patterns FIG. 24 , for example, is output. The density signal X21 is a signal which includes information on density fluctuations in a conveying direction of theintermediate transfer belt 17. - Here, when the period T1 of the HP signal W1 > the period T2 of the HP signal W2 (when the frequency f1 of the HP signal W1 < the frequency f2 of the HP signal W2), as seen from the density signal X21, it is difficult to discriminate the density fluctuation with the period T2.
- Then, the first correction
signal generating unit 30d generates a correction signal Y21 (frequency f1) by causing data shown with a circle for the density signal X21 (data corresponding to the density fluctuation detecting pattern 23) to undergo an FFT (fast Fourier transform), etc. Then, the correction signal Y21 is multiplied by the density signal X21 to obtain a second density signal X22, in which density fluctuations with the period T1 are reduced. In the obtained second density signal X22, a density fluctuation component of a period T1 is reduced, so that a tendency of density fluctuations with the period T2 appears. - Next, in step S110, the second correction
signal generating unit 30e generates a second correction signal Y22 (a signal with a period T2 and a frequency f2), which is a sinusoidal signal with a phase which is reverse that of density fluctuations as shown inFIG. 24 , for example, based on a second density signal X22. Next, in step S111, the second correctionsignal generating unit 30e causes a value of the second correction signal Y22 generated in step S110 to undergo A/D conversion, for example, to hold the converted result in a memory (not shown), etc. - Thereafter, the second correction signal Y22, which is held in the memory (not shown), etc., may be input into the light
source driving apparatus 13 to control a light amount signal of thelight source 14 to form density fluctuation detecting patterns in which density fluctuations with periods T1 and T2 are reduced. When the density fluctuation detecting pattern which is corrected for with the second correction signal Y22 is detected by the density sensor, a third density signal X23 is obtained in which density fluctuations with periods T1 and T2 are reduced as shown inFIG. 24 . In other words, a density fluctuation correction is performed with a method inFig. 19 to obtain a high quality image on theintermediate transfer belt 17, in which image density fluctuations with the period T1 and period T2 are reduced. - In this way, in the fifth embodiment, the same advantages are yielded as in the fourth embodiment; as one
density sensor 18 detects densityfluctuation detecting patterns - In the sixth embodiment, an example is shown of detecting the density
fluctuation detecting patterns 24 only by one density sensor. - In the density fluctuation correction according to the sixth embodiment, steps S101 to S103 in
FIG. 19 are exactly the same as in the density fluctuation correction according to the fourth embodiment. In step S104, the secondpattern forming unit 30c forms a density fluctuation detecting pattern 24 (a second density fluctuation detecting pattern) as shown inFIG. 18 , for example, in a position corresponding to thedensity sensor 18a on theintermediate transfer belt 17 along a conveying direction of theintermediate transfer belt 17. - Next, in step S105, the
density sensor 18 detects a densityfluctuation detecting pattern 24 and outputs a density signal X31, which is synchronized to the period T2 of the HP signal W2 as shown inFIG. 25 , for example. The density signal X31 is a signal which includes information on density fluctuations with periods T1 and T2 in the conveying direction of theintermediate transfer belt 17. Here, the first correctionsignal generating unit 30d samples a number of points in the density signal X31 at predetermined timings and generates a first density signal X32 corresponding to the HP signal W1 from the sampled signal. - Next, in step S106, the first correction
signal generating unit 30d generates a first correction signal Y31 (a signal with a period T1 and a frequency f1), which is a sinusoidal signal with a phase which is reverse that of density fluctuations as shown inFIG. 25 , for example, based on a first density signal X32. Next, in step S107, the first correctionsignal generating unit 30d causes a value of the first correction signal Y31 generated in step S106 to undergo A/D conversion, for example, to hold the converted result in a memory (not shown), etc. Next, the same process as in steps S108-8111 according to the fourth embodiment is executed. In this way, the same advantageous effect as in the fourth embodiment is obtained. - The HP signal W2 relative to the HP signal W1 is a non-synchronous signal, so that, a delay time of, for example, Δtd1, occurs for the density
fluctuation detecting pattern 24 for which writing is started at a timing of the HP signal W2 relative to the HP signal W1. Then, the delay time of Δt12 between the HP signal W1 and the HP signal W2 may be detected to calculate a timing, relative to the HP signal W1, at which writing of the densityfluctuation detecting pattern 24 is started. Thus, a phase difference of the density fluctuation signals may be detected, making it possible to accurately calculate density fluctuations with the period T1 of the HP signal W1. - In this way, even a method of forming only the density
fluctuation detecting pattern 24 corresponding to a shorter period T2 twice may be used to reduce density fluctuations with periods T1 and T2. - Moreover, multiple density detections may be performed with one density fluctuation detecting pattern without a need to have multiple types of density fluctuation detecting patterns to realize a reduced size and cost of circuitry in the image forming apparatus.
- In a seventh embodiment, an example is shown of forming a set of density
fluctuation detecting patterns -
FIG. 26 is a first part of a diagram exemplifying a density fluctuation detecting pattern according to the seventh embodiment. With reference toFIG. 26 , on theintermediate transfer belt 17, sets of densityfluctuation detecting patterns FIG. 18 are formed in multiple numbers at different positions in the vertical direction (the main scanning direction) relative to the conveying direction of theintermediate transfer belt 17. Moreover, thedensity sensors 18a to 18f are arranged at positions corresponding to the respective density fluctuation detecting patterns. - In this way, the sets of density
fluctuation detecting patterns intermediate transfer belt 17 to obtain density signals by the corresponding density sensors, so that information on density fluctuations within a face in one round of the developingroller 22 and thedrum 16 is obtained. As a result, an average value of density fluctuation detecting signals obtained at multiple positions in the main scanning direction on theintermediate transfer belt 17 may be taken, etc., to obtain information on average density fluctuations within the face and also to realize accurate density fluctuation detection and density fluctuation correction. -
FIG. 27 is a second part of the diagram exemplifying the density fluctuation detecting pattern according to the seventh embodiment. As shown inFIG. 27 , sets of densityfluctuation detecting patterns FIG. 23 may be formed in multiple numbers at different positions in the orthogonal direction (the main scanning direction) relative to the conveying direction of theintermediate transfer belt 17, while arrangingdensity sensors 18a-18c at positions corresponding to the density fluctuation detecting patterns. Even in this way, the same advantageous effect as inFIG. 26 is obtained. - While preferred embodiments have been described in the above in detail, they are not limited to the above-described embodiments, so that various changes and modifications may be added to the above-described embodiments without departing from the scope recited in the claims.
- For example, for an image forming apparatus having multiple developing rollers, an HP sensor corresponding to a drum and multiple HP sensors corresponding to each of the multiple developing rollers may be used to perform density correction. In other words, n HP sensors may be used to correct for density fluctuations with n periods.
- Moreover, in lieu of a method of changing a light amount of a light source as a scheme of correcting for density fluctuations, a method of changing a developing bias of the developing roller, etc., may be used.
- The present application is based on Japanese Priority Applications No.
2012-061245 2012-061246
Claims (15)
- An image forming apparatus, comprising:a light source;a drum which is a photosensitive body;an optical scanning apparatus which deflects and scans, in a main scanning direction by a deflecting and scanning unit, a light beam emitted from the light source, and collects, by a scanning and image forming unit, the deflected and scanned light beam onto the drum, which drum has a face to be scanned, to form a latent image onto a surface of the drum; andan endless belt which is arranged to be in contact with the drum and on which an image corresponding to the latent image is formed, the image forming apparatus further includinga pattern forming unit which forms, on the endless belt along a conveying direction of the endless belt, a density fluctuation detecting pattern having a period;a density sensor which detects the density fluctuating detecting pattern and outputs a density signal including information on density fluctuations in the conveying direction of the endless belt; anda period detecting sensor which detects the period included in the density fluctuations.
- The image forming apparatus as claimed in claim 1, further comprising:a rotating body which is arranged to oppose the drum and places the endless belt between the drum and the rotating body, whereinthe density fluctuation detecting pattern includes a first density fluctuation detecting pattern having a first occurrence period and a second density fluctuation detecting pattern having a second occurrence period which is different from the first occurrence period, and whereinthe pattern forming unit includes a first pattern forming unit which forms the first density fluctuation detecting pattern and a second pattern forming unit which forms the second density fluctuation detecting pattern, and whereinthe period detecting sensor includes a first period detecting sensor which detects density fluctuations with a first period which corresponds to rotating of the drum and a second period detecting sensor which detects density fluctuations with a second period corresponding to rotating of the rotating body that differ from a rotational period of the drum.
- The image forming apparatus as claimed in claim 2, further comprising:a first correction signal generating unit which generates a first correction signal with the first period based on the density signal; anda second correction signal generating unit which generates a second correction signal with the second period based on the density signal.
- The image forming apparatus as claimed in claim 3, wherein the first pattern forming unit and the second pattern forming unit form the first density fluctuation detecting pattern and the second density fluctuation detecting pattern on a same straight line relative to the conveying direction of the endless belt such that a part of the first pattern forming unit and a part of the second pattern forming unit overlap each other.
- The image forming apparatus as claimed in claim 4, wherein the first correction signal generating unit generates the first correction signal by FFT based on a density signal which includes information on density fluctuations of both the first density fluctuation detecting pattern and the second density fluctuation detecting pattern.
- The image forming apparatus as claimed in claim 3, wherein the first period is longer than the second period, and wherein a density signal which includes information on density fluctuations of the second density fluctuation detecting pattern is sampled with the first occurrence period to generate a density signal corresponding to the first density fluctuation detecting pattern.
- The image forming apparatus as claimed in claim 3, wherein the density sensor includes a first density sensor and a second density sensor, wherein
the first pattern forming unit and the second pattern forming unit form the respective first and second density fluctuation detecting patterns at different positions in a direction orthogonal to the conveying direction of the endless belt, wherein
the first density sensor detects the first density fluctuation detecting pattern to output a first density signal which includes information on density fluctuations in the conveying direction of the endless belt, and wherein
the second density sensor detects the second density fluctuation detecting pattern to output a second density signal which includes information on density fluctuations in the conveying direction of the endless belt. - The image forming apparatus as claimed in claim 7, wherein the first period is longer than the second period,
wherein the second pattern forming unit forms the second density fluctuation detecting pattern while the first density signal is corrected for using the first correction signal,
wherein the second density sensor detects the second density fluctuation detecting pattern which is formed while the first density signal is corrected for to output the second density signal, and
wherein the second correction signal generating unit generates the second correction signal from the second density signal based on the second density fluctuation detecting pattern formed while the first density signal is corrected for. - The image forming apparatus as claimed in claim 1, further comprising:a correction signal generating unit which generates a correction signal for correcting for exposure power of the light source such that the density fluctuations are reduced based on an output signal of the density sensor, whereinthe pattern forming unit forms, on the endless belt, the density fluctuation detecting pattern with an image area rate between 50% and 85%.
- The image forming apparatus as claimed in claim 9, further comprising:a period detecting sensor which detects a rotational period of the drum, whereinthe pattern forming unit forms the density fluctuation detecting pattern with the rotational period of the drum detected by the periodic detecting sensor.
- The image forming apparatus as claimed in claim 1, wherein the pattern forming unit forms the density fluctuation detecting pattern corresponding to multiple rotational periods of the drum that are detected by the period detecting sensor.
- The image forming apparatus as claimed in claim 9, further comprising:a calibrating unit which forms, on the endless belt, a density calibrating pattern for calculating a change amount of a density relative to light amount fluctuations of the light source, whereinthe calibrating unit forms the density calibrating pattern with exposure power of three or more levels that are changed by controlling exposure power of the light source and at the image area rate between 50% and 85%.
- The image forming apparatus as claimed in claim 9, wherein the density sensor includes multiple density sensors arranged in parallel in the main scanning direction, and wherein the correction signal generating unit generates a correction formula which corrects for density fluctuations in the main scanning direction based on an output signal of each density sensor and a position of each density sensor.
- The image forming apparatus as claimed in claim 9, wherein the density sensor includes multiple density sensors arranged in parallel in the main scanning direction, and wherein
the correction signal generating unit generates a correction signal which corrects for density fluctuations in a sub-scanning direction which is orthogonal to the main scanning direction based on an output signal of the period detecting sensor and an output signal of at least one density sensor of the multiple density sensors. - The image forming apparatus as claimed in claim 1, wherein the light source is a surface emitting laser.
Applications Claiming Priority (2)
| Application Number | Priority Date | Filing Date | Title |
|---|---|---|---|
| JP2012061246A JP6089422B2 (en) | 2012-03-16 | 2012-03-16 | Image forming apparatus |
| JP2012061245A JP5978679B2 (en) | 2012-03-16 | 2012-03-16 | Image forming apparatus |
Publications (3)
| Publication Number | Publication Date |
|---|---|
| EP2639645A2 true EP2639645A2 (en) | 2013-09-18 |
| EP2639645A3 EP2639645A3 (en) | 2017-05-10 |
| EP2639645B1 EP2639645B1 (en) | 2019-10-23 |
Family
ID=47891515
Family Applications (1)
| Application Number | Title | Priority Date | Filing Date |
|---|---|---|---|
| EP13159740.3A Active EP2639645B1 (en) | 2012-03-16 | 2013-03-18 | Image forming apparatus |
Country Status (2)
| Country | Link |
|---|---|
| US (1) | US8983318B2 (en) |
| EP (1) | EP2639645B1 (en) |
Cited By (4)
| Publication number | Priority date | Publication date | Assignee | Title |
|---|---|---|---|---|
| JP2017009896A (en) * | 2015-06-25 | 2017-01-12 | コニカミノルタ株式会社 | Image forming apparatus |
| JP2017009895A (en) * | 2015-06-25 | 2017-01-12 | コニカミノルタ株式会社 | Image forming apparatus |
| EP3441822A1 (en) * | 2017-08-10 | 2019-02-13 | Ricoh Company, Limited | Image forming apparatus and image forming method |
| EP3514632A1 (en) * | 2017-12-21 | 2019-07-24 | Ricoh Company, Ltd. | Image forming apparatus |
Families Citing this family (17)
| Publication number | Priority date | Publication date | Assignee | Title |
|---|---|---|---|---|
| JP6172506B2 (en) | 2013-05-02 | 2017-08-02 | 株式会社リコー | Image forming apparatus and image forming method |
| JP6167654B2 (en) | 2013-05-09 | 2017-07-26 | 株式会社リコー | Image forming apparatus, image forming method, and printed material manufacturing method |
| JP6171547B2 (en) | 2013-05-10 | 2017-08-02 | 株式会社リコー | Image forming apparatus, image forming method, and printed material manufacturing method |
| JP6127712B2 (en) | 2013-05-21 | 2017-05-17 | 株式会社リコー | Light source driving circuit, optical scanning device, and image forming apparatus |
| US9521295B2 (en) | 2013-12-03 | 2016-12-13 | Ricoh Company, Ltd. | Image forming apparatus and image forming method |
| JP6418479B2 (en) | 2013-12-25 | 2018-11-07 | 株式会社リコー | Image forming method and image forming apparatus |
| JP6425008B2 (en) | 2014-01-10 | 2018-11-21 | 株式会社リコー | Image forming apparatus and image forming method |
| JP6256125B2 (en) | 2014-03-13 | 2018-01-10 | 株式会社リコー | Image forming apparatus |
| JP6364971B2 (en) | 2014-06-03 | 2018-08-01 | 株式会社リコー | Image forming apparatus |
| JP2016021664A (en) | 2014-07-14 | 2016-02-04 | 株式会社リコー | Image forming apparatus |
| JP6518078B2 (en) * | 2015-02-25 | 2019-05-22 | キヤノン株式会社 | Measuring apparatus and measuring method, and image forming apparatus |
| JP6256446B2 (en) * | 2015-10-08 | 2018-01-10 | コニカミノルタ株式会社 | Image forming apparatus, image forming system, and density unevenness correcting method |
| JP6641634B2 (en) | 2016-03-18 | 2020-02-05 | 株式会社リコー | Image forming apparatus and image forming method |
| US10032418B2 (en) * | 2016-05-09 | 2018-07-24 | Japan Display Inc. | Display apparatus |
| JP6702030B2 (en) | 2016-06-30 | 2020-05-27 | 株式会社リコー | Image forming apparatus, correction method, scanning control apparatus, image processing system |
| JP6897027B2 (en) * | 2016-08-24 | 2021-06-30 | 株式会社リコー | Image forming device |
| JP7593130B2 (en) | 2021-01-21 | 2024-12-03 | 株式会社リコー | CONTROL DEVICE, IMAGE FORMING APPARATUS, AND CONTROL METHOD FOR THE CONTROL DEVICE |
Citations (2)
| Publication number | Priority date | Publication date | Assignee | Title |
|---|---|---|---|---|
| JP2003127454A (en) | 2001-10-24 | 2003-05-08 | Fuji Photo Film Co Ltd | Imaging method and apparatus |
| JP2008065270A (en) | 2006-09-11 | 2008-03-21 | Canon Inc | Image forming apparatus and control method thereof |
Family Cites Families (42)
| Publication number | Priority date | Publication date | Assignee | Title |
|---|---|---|---|---|
| JP3983449B2 (en) | 1999-10-15 | 2007-09-26 | 株式会社リコー | Pulse width modulation circuit, optical writing apparatus, and image forming apparatus |
| US6731317B2 (en) | 2001-03-14 | 2004-05-04 | Ricoh Company, Ltd. | Pulse modulation signal generation circuit, and semiconductor laser modulation device, optical scanning device and image formation device using the same |
| US6791596B2 (en) | 2001-06-28 | 2004-09-14 | Ricoh Company, Ltd. | Method and apparatus for image forming capable of effectively generating pixel clock pulses |
| US7271824B2 (en) | 2001-09-28 | 2007-09-18 | Ricoh Company, Ltd. | Pixel clock generating apparatus, optical writing apparatus using a pixel clock, imaging apparatus, and method for generating pixel clocks |
| US7256815B2 (en) | 2001-12-20 | 2007-08-14 | Ricoh Company, Ltd. | Image forming method, image forming apparatus, optical scan device, and image forming apparatus using the same |
| US6933957B2 (en) | 2002-09-24 | 2005-08-23 | Ricoh Company, Ltd. | Pixel clock generation apparatus, pixel clock generation method, and image forming apparatus capable of correcting main scan dot position shift with a high degree of accuracy |
| JP4165746B2 (en) | 2003-02-07 | 2008-10-15 | 株式会社リコー | Pixel clock generation circuit and image forming apparatus |
| US7496121B2 (en) | 2003-03-20 | 2009-02-24 | Ricoh Company, Ltd. | Laser modulating and driving device and image reproducing apparatus using the same |
| JP4404351B2 (en) | 2004-04-12 | 2010-01-27 | 株式会社リコー | Pixel clock generation circuit and image forming apparatus |
| US7936493B2 (en) | 2005-06-21 | 2011-05-03 | Ricoh Company, Ltd. | Dot position correcting apparatus, optical scanning apparatus, imaging apparatus, and color imaging apparatus |
| JP2007038477A (en) | 2005-08-02 | 2007-02-15 | Ricoh Co Ltd | Pixel clock and pulse modulation signal generation apparatus, optical scanning apparatus, and image forming apparatus |
| JP2007148346A (en) | 2005-10-25 | 2007-06-14 | Ricoh Co Ltd | Optical scanning apparatus and image forming apparatus |
| JP2007135100A (en) | 2005-11-11 | 2007-05-31 | Noritsu Koki Co Ltd | Image recording apparatus and shading correction method thereof |
| JP4765576B2 (en) * | 2005-11-22 | 2011-09-07 | 富士ゼロックス株式会社 | Image forming apparatus, correction parameter setting apparatus |
| US8253768B2 (en) | 2005-12-09 | 2012-08-28 | Ricoh Company, Ltd. | Optical scanner and image forming apparatus |
| JP2007269001A (en) | 2006-03-10 | 2007-10-18 | Ricoh Co Ltd | Optical scanning apparatus, optical scanning method, image forming apparatus, color image forming apparatus, program, and recording medium |
| US7826110B2 (en) | 2006-06-19 | 2010-11-02 | Ricoh Company, Ltd. | Light scanning apparatus, light scanning method, image forming apparatus, and color image forming apparatus |
| JP4912071B2 (en) | 2006-08-04 | 2012-04-04 | 株式会社リコー | Optical scanning apparatus, optical scanning method, image forming apparatus, color image forming apparatus, program, and recording medium |
| JP4863840B2 (en) | 2006-10-27 | 2012-01-25 | 株式会社リコー | Pixel forming apparatus, optical scanning apparatus, optical scanning method, image forming apparatus, and color image forming apparatus |
| JP5083867B2 (en) | 2007-03-02 | 2012-11-28 | 株式会社リコー | Light source driving device, optical scanning device, and image forming apparatus |
| US7995251B2 (en) | 2007-03-30 | 2011-08-09 | Ricoh Company, Limited | Optical scanning device, optical scanning method, and image forming apparatus |
| US7903135B2 (en) | 2007-04-26 | 2011-03-08 | Ricoh Company, Ltd. | Optical scanning device and image forming apparatus for optimizing arrangement intervals in a main-scanning direction and a sub-scanning direction |
| JP4953918B2 (en) | 2007-05-23 | 2012-06-13 | 株式会社リコー | Light source driving device, optical scanning device, and image forming apparatus |
| JP5348601B2 (en) | 2007-05-28 | 2013-11-20 | 株式会社リコー | Light source device, optical scanning device, and image forming apparatus |
| JP2009157014A (en) | 2007-12-26 | 2009-07-16 | Ricoh Co Ltd | Optical scanning apparatus and image forming apparatus |
| JP5194802B2 (en) | 2008-01-07 | 2013-05-08 | 株式会社リコー | Light source driving device, optical scanning device, and image forming apparatus |
| JP5006810B2 (en) | 2008-02-06 | 2012-08-22 | 株式会社リコー | Optical scanning apparatus and image forming apparatus |
| JP2009244843A (en) | 2008-03-14 | 2009-10-22 | Ricoh Co Ltd | Optical scanning device and color image forming apparatus |
| JP2009262344A (en) | 2008-04-22 | 2009-11-12 | Ricoh Co Ltd | Image formation device and image correcting method |
| JP5036634B2 (en) | 2008-06-10 | 2012-09-26 | 株式会社リコー | Light source device, optical scanning device, and image forming apparatus |
| US8237760B2 (en) | 2008-08-19 | 2012-08-07 | Ricoh Company, Ltd. | Light-source driving device, optical scanning device, and counting method |
| JP2010118504A (en) | 2008-11-13 | 2010-05-27 | Ricoh Co Ltd | Light source device, optical scanning device, and image forming apparatus |
| JP5402072B2 (en) | 2009-02-23 | 2014-01-29 | 株式会社リコー | Light source driving device, optical scanning device, and image forming apparatus |
| JP5471569B2 (en) | 2010-02-18 | 2014-04-16 | 株式会社リコー | Laser driving device, optical scanning device, image forming apparatus, and laser driving method |
| JP5517046B2 (en) * | 2010-02-23 | 2014-06-11 | 株式会社リコー | Image forming apparatus |
| JP2011216843A (en) | 2010-03-16 | 2011-10-27 | Ricoh Co Ltd | Semiconductor laser driving unit, and image forming apparatus including the same |
| US8610971B2 (en) | 2010-10-20 | 2013-12-17 | Ricoh Company, Limited | Image forming apparatus |
| JP5679110B2 (en) | 2011-01-25 | 2015-03-04 | 株式会社リコー | Image forming apparatus |
| US9046850B2 (en) * | 2011-02-04 | 2015-06-02 | Ricoh Company, Ltd. | Image forming apparatus capable of reducing image density irregularity |
| JP5402976B2 (en) * | 2011-04-27 | 2014-01-29 | コニカミノルタ株式会社 | Image forming apparatus and gradation correction method |
| JP5853418B2 (en) | 2011-05-20 | 2016-02-09 | 株式会社リコー | Light source driving device and image forming apparatus |
| JP5998547B2 (en) * | 2012-03-14 | 2016-09-28 | 株式会社リコー | Image forming apparatus and image forming method |
-
2013
- 2013-03-15 US US13/843,147 patent/US8983318B2/en active Active
- 2013-03-18 EP EP13159740.3A patent/EP2639645B1/en active Active
Patent Citations (2)
| Publication number | Priority date | Publication date | Assignee | Title |
|---|---|---|---|---|
| JP2003127454A (en) | 2001-10-24 | 2003-05-08 | Fuji Photo Film Co Ltd | Imaging method and apparatus |
| JP2008065270A (en) | 2006-09-11 | 2008-03-21 | Canon Inc | Image forming apparatus and control method thereof |
Cited By (6)
| Publication number | Priority date | Publication date | Assignee | Title |
|---|---|---|---|---|
| JP2017009896A (en) * | 2015-06-25 | 2017-01-12 | コニカミノルタ株式会社 | Image forming apparatus |
| JP2017009895A (en) * | 2015-06-25 | 2017-01-12 | コニカミノルタ株式会社 | Image forming apparatus |
| EP3441822A1 (en) * | 2017-08-10 | 2019-02-13 | Ricoh Company, Limited | Image forming apparatus and image forming method |
| US10481514B2 (en) | 2017-08-10 | 2019-11-19 | Ricoh Company, Ltd. | Image forming apparatus and image forming method |
| EP3514632A1 (en) * | 2017-12-21 | 2019-07-24 | Ricoh Company, Ltd. | Image forming apparatus |
| US10474056B2 (en) | 2017-12-21 | 2019-11-12 | Ricoh Company, Ltd. | Image forming apparatus |
Also Published As
| Publication number | Publication date |
|---|---|
| EP2639645A3 (en) | 2017-05-10 |
| US8983318B2 (en) | 2015-03-17 |
| US20130243459A1 (en) | 2013-09-19 |
| EP2639645B1 (en) | 2019-10-23 |
Similar Documents
| Publication | Publication Date | Title |
|---|---|---|
| EP2639645B1 (en) | Image forming apparatus | |
| JP6821342B2 (en) | Image forming device | |
| US9930214B2 (en) | Correction method for image forming apparatus | |
| US10397437B2 (en) | Image forming apparatus | |
| US9860422B2 (en) | Correction method for image forming apparatus | |
| US8581944B2 (en) | Image forming apparatus and method for detecting position deviation | |
| JP5978679B2 (en) | Image forming apparatus | |
| US10033900B2 (en) | Correction method for image forming apparatus | |
| JP6214705B2 (en) | Image forming apparatus | |
| US10021271B2 (en) | Correction method for image forming apparatus | |
| JP2015221548A (en) | Image forming apparatus | |
| JP6089422B2 (en) | Image forming apparatus | |
| JP2004334175A (en) | Optical scanning device and image forming apparatus | |
| US8963970B2 (en) | Image forming apparatus equipped with laser light source | |
| WO2013099668A1 (en) | Light beam detection circuit, optical beam scanning unit and image forming device | |
| US7154110B2 (en) | Systems and methods for improving calibration of a linear array sensor | |
| JP4134999B2 (en) | Light emission timing adjustment method, laser scanning device, and image forming apparatus | |
| JP2017211408A (en) | Image forming apparatus | |
| US10185269B2 (en) | Image forming apparatus and method for forming an image | |
| JP2001281589A (en) | Device and method for forming image | |
| JP4893009B2 (en) | Image forming apparatus, photoconductor, and misregistration detection method | |
| JP2014102479A (en) | Image forming apparatus | |
| JP6393082B2 (en) | Image forming apparatus | |
| JP2019098619A (en) | Image forming apparatus | |
| JP2017024184A (en) | Image forming apparatus |
Legal Events
| Date | Code | Title | Description |
|---|---|---|---|
| PUAI | Public reference made under article 153(3) epc to a published international application that has entered the european phase |
Free format text: ORIGINAL CODE: 0009012 |
|
| 17P | Request for examination filed |
Effective date: 20130318 |
|
| AK | Designated contracting states |
Kind code of ref document: A2 Designated state(s): AL AT BE BG CH CY CZ DE DK EE ES FI FR GB GR HR HU IE IS IT LI LT LU LV MC MK MT NL NO PL PT RO RS SE SI SK SM TR |
|
| AX | Request for extension of the european patent |
Extension state: BA ME |
|
| PUAL | Search report despatched |
Free format text: ORIGINAL CODE: 0009013 |
|
| AK | Designated contracting states |
Kind code of ref document: A3 Designated state(s): AL AT BE BG CH CY CZ DE DK EE ES FI FR GB GR HR HU IE IS IT LI LT LU LV MC MK MT NL NO PL PT RO RS SE SI SK SM TR |
|
| AX | Request for extension of the european patent |
Extension state: BA ME |
|
| RIC1 | Information provided on ipc code assigned before grant |
Ipc: G03G 15/00 20060101AFI20170406BHEP |
|
| GRAP | Despatch of communication of intention to grant a patent |
Free format text: ORIGINAL CODE: EPIDOSNIGR1 |
|
| STAA | Information on the status of an ep patent application or granted ep patent |
Free format text: STATUS: GRANT OF PATENT IS INTENDED |
|
| INTG | Intention to grant announced |
Effective date: 20190523 |
|
| GRAS | Grant fee paid |
Free format text: ORIGINAL CODE: EPIDOSNIGR3 |
|
| GRAA | (expected) grant |
Free format text: ORIGINAL CODE: 0009210 |
|
| STAA | Information on the status of an ep patent application or granted ep patent |
Free format text: STATUS: THE PATENT HAS BEEN GRANTED |
|
| AK | Designated contracting states |
Kind code of ref document: B1 Designated state(s): AL AT BE BG CH CY CZ DE DK EE ES FI FR GB GR HR HU IE IS IT LI LT LU LV MC MK MT NL NO PL PT RO RS SE SI SK SM TR |
|
| REG | Reference to a national code |
Ref country code: GB Ref legal event code: FG4D |
|
| REG | Reference to a national code |
Ref country code: CH Ref legal event code: EP |
|
| REG | Reference to a national code |
Ref country code: IE Ref legal event code: FG4D |
|
| REG | Reference to a national code |
Ref country code: DE Ref legal event code: R096 Ref document number: 602013061909 Country of ref document: DE |
|
| REG | Reference to a national code |
Ref country code: AT Ref legal event code: REF Ref document number: 1194341 Country of ref document: AT Kind code of ref document: T Effective date: 20191115 |
|
| REG | Reference to a national code |
Ref country code: NL Ref legal event code: MP Effective date: 20191023 |
|
| REG | Reference to a national code |
Ref country code: LT Ref legal event code: MG4D |
|
| PG25 | Lapsed in a contracting state [announced via postgrant information from national office to epo] |
Ref country code: BG Free format text: LAPSE BECAUSE OF FAILURE TO SUBMIT A TRANSLATION OF THE DESCRIPTION OR TO PAY THE FEE WITHIN THE PRESCRIBED TIME-LIMIT Effective date: 20200123 Ref country code: GR Free format text: LAPSE BECAUSE OF FAILURE TO SUBMIT A TRANSLATION OF THE DESCRIPTION OR TO PAY THE FEE WITHIN THE PRESCRIBED TIME-LIMIT Effective date: 20200124 Ref country code: FI Free format text: LAPSE BECAUSE OF FAILURE TO SUBMIT A TRANSLATION OF THE DESCRIPTION OR TO PAY THE FEE WITHIN THE PRESCRIBED TIME-LIMIT Effective date: 20191023 Ref country code: LT Free format text: LAPSE BECAUSE OF FAILURE TO SUBMIT A TRANSLATION OF THE DESCRIPTION OR TO PAY THE FEE WITHIN THE PRESCRIBED TIME-LIMIT Effective date: 20191023 Ref country code: PT Free format text: LAPSE BECAUSE OF FAILURE TO SUBMIT A TRANSLATION OF THE DESCRIPTION OR TO PAY THE FEE WITHIN THE PRESCRIBED TIME-LIMIT Effective date: 20200224 Ref country code: NL Free format text: LAPSE BECAUSE OF FAILURE TO SUBMIT A TRANSLATION OF THE DESCRIPTION OR TO PAY THE FEE WITHIN THE PRESCRIBED TIME-LIMIT Effective date: 20191023 Ref country code: ES Free format text: LAPSE BECAUSE OF FAILURE TO SUBMIT A TRANSLATION OF THE DESCRIPTION OR TO PAY THE FEE WITHIN THE PRESCRIBED TIME-LIMIT Effective date: 20191023 Ref country code: SE Free format text: LAPSE BECAUSE OF FAILURE TO SUBMIT A TRANSLATION OF THE DESCRIPTION OR TO PAY THE FEE WITHIN THE PRESCRIBED TIME-LIMIT Effective date: 20191023 Ref country code: PL Free format text: LAPSE BECAUSE OF FAILURE TO SUBMIT A TRANSLATION OF THE DESCRIPTION OR TO PAY THE FEE WITHIN THE PRESCRIBED TIME-LIMIT Effective date: 20191023 Ref country code: LV Free format text: LAPSE BECAUSE OF FAILURE TO SUBMIT A TRANSLATION OF THE DESCRIPTION OR TO PAY THE FEE WITHIN THE PRESCRIBED TIME-LIMIT Effective date: 20191023 Ref country code: NO Free format text: LAPSE BECAUSE OF FAILURE TO SUBMIT A TRANSLATION OF THE DESCRIPTION OR TO PAY THE FEE WITHIN THE PRESCRIBED TIME-LIMIT Effective date: 20200123 |
|
| PG25 | Lapsed in a contracting state [announced via postgrant information from national office to epo] |
Ref country code: IS Free format text: LAPSE BECAUSE OF FAILURE TO SUBMIT A TRANSLATION OF THE DESCRIPTION OR TO PAY THE FEE WITHIN THE PRESCRIBED TIME-LIMIT Effective date: 20200224 Ref country code: RS Free format text: LAPSE BECAUSE OF FAILURE TO SUBMIT A TRANSLATION OF THE DESCRIPTION OR TO PAY THE FEE WITHIN THE PRESCRIBED TIME-LIMIT Effective date: 20191023 Ref country code: HR Free format text: LAPSE BECAUSE OF FAILURE TO SUBMIT A TRANSLATION OF THE DESCRIPTION OR TO PAY THE FEE WITHIN THE PRESCRIBED TIME-LIMIT Effective date: 20191023 |
|
| PG25 | Lapsed in a contracting state [announced via postgrant information from national office to epo] |
Ref country code: AL Free format text: LAPSE BECAUSE OF FAILURE TO SUBMIT A TRANSLATION OF THE DESCRIPTION OR TO PAY THE FEE WITHIN THE PRESCRIBED TIME-LIMIT Effective date: 20191023 |
|
| REG | Reference to a national code |
Ref country code: DE Ref legal event code: R097 Ref document number: 602013061909 Country of ref document: DE |
|
| PG2D | Information on lapse in contracting state deleted |
Ref country code: IS |
|
| PG25 | Lapsed in a contracting state [announced via postgrant information from national office to epo] |
Ref country code: CZ Free format text: LAPSE BECAUSE OF FAILURE TO SUBMIT A TRANSLATION OF THE DESCRIPTION OR TO PAY THE FEE WITHIN THE PRESCRIBED TIME-LIMIT Effective date: 20191023 Ref country code: RO Free format text: LAPSE BECAUSE OF FAILURE TO SUBMIT A TRANSLATION OF THE DESCRIPTION OR TO PAY THE FEE WITHIN THE PRESCRIBED TIME-LIMIT Effective date: 20191023 Ref country code: EE Free format text: LAPSE BECAUSE OF FAILURE TO SUBMIT A TRANSLATION OF THE DESCRIPTION OR TO PAY THE FEE WITHIN THE PRESCRIBED TIME-LIMIT Effective date: 20191023 Ref country code: DK Free format text: LAPSE BECAUSE OF FAILURE TO SUBMIT A TRANSLATION OF THE DESCRIPTION OR TO PAY THE FEE WITHIN THE PRESCRIBED TIME-LIMIT Effective date: 20191023 Ref country code: IS Free format text: LAPSE BECAUSE OF FAILURE TO SUBMIT A TRANSLATION OF THE DESCRIPTION OR TO PAY THE FEE WITHIN THE PRESCRIBED TIME-LIMIT Effective date: 20200223 |
|
| REG | Reference to a national code |
Ref country code: AT Ref legal event code: MK05 Ref document number: 1194341 Country of ref document: AT Kind code of ref document: T Effective date: 20191023 |
|
| PLBE | No opposition filed within time limit |
Free format text: ORIGINAL CODE: 0009261 |
|
| STAA | Information on the status of an ep patent application or granted ep patent |
Free format text: STATUS: NO OPPOSITION FILED WITHIN TIME LIMIT |
|
| PG25 | Lapsed in a contracting state [announced via postgrant information from national office to epo] |
Ref country code: SK Free format text: LAPSE BECAUSE OF FAILURE TO SUBMIT A TRANSLATION OF THE DESCRIPTION OR TO PAY THE FEE WITHIN THE PRESCRIBED TIME-LIMIT Effective date: 20191023 Ref country code: SM Free format text: LAPSE BECAUSE OF FAILURE TO SUBMIT A TRANSLATION OF THE DESCRIPTION OR TO PAY THE FEE WITHIN THE PRESCRIBED TIME-LIMIT Effective date: 20191023 Ref country code: IT Free format text: LAPSE BECAUSE OF FAILURE TO SUBMIT A TRANSLATION OF THE DESCRIPTION OR TO PAY THE FEE WITHIN THE PRESCRIBED TIME-LIMIT Effective date: 20191023 |
|
| 26N | No opposition filed |
Effective date: 20200724 |
|
| PG25 | Lapsed in a contracting state [announced via postgrant information from national office to epo] |
Ref country code: MC Free format text: LAPSE BECAUSE OF FAILURE TO SUBMIT A TRANSLATION OF THE DESCRIPTION OR TO PAY THE FEE WITHIN THE PRESCRIBED TIME-LIMIT Effective date: 20191023 |
|
| REG | Reference to a national code |
Ref country code: CH Ref legal event code: PL |
|
| PG25 | Lapsed in a contracting state [announced via postgrant information from national office to epo] |
Ref country code: AT Free format text: LAPSE BECAUSE OF FAILURE TO SUBMIT A TRANSLATION OF THE DESCRIPTION OR TO PAY THE FEE WITHIN THE PRESCRIBED TIME-LIMIT Effective date: 20191023 Ref country code: SI Free format text: LAPSE BECAUSE OF FAILURE TO SUBMIT A TRANSLATION OF THE DESCRIPTION OR TO PAY THE FEE WITHIN THE PRESCRIBED TIME-LIMIT Effective date: 20191023 |
|
| REG | Reference to a national code |
Ref country code: BE Ref legal event code: MM Effective date: 20200331 |
|
| PG25 | Lapsed in a contracting state [announced via postgrant information from national office to epo] |
Ref country code: LU Free format text: LAPSE BECAUSE OF NON-PAYMENT OF DUE FEES Effective date: 20200318 |
|
| PG25 | Lapsed in a contracting state [announced via postgrant information from national office to epo] |
Ref country code: LI Free format text: LAPSE BECAUSE OF NON-PAYMENT OF DUE FEES Effective date: 20200331 Ref country code: CH Free format text: LAPSE BECAUSE OF NON-PAYMENT OF DUE FEES Effective date: 20200331 Ref country code: IE Free format text: LAPSE BECAUSE OF NON-PAYMENT OF DUE FEES Effective date: 20200318 |
|
| PG25 | Lapsed in a contracting state [announced via postgrant information from national office to epo] |
Ref country code: BE Free format text: LAPSE BECAUSE OF NON-PAYMENT OF DUE FEES Effective date: 20200331 |
|
| PGFP | Annual fee paid to national office [announced via postgrant information from national office to epo] |
Ref country code: GB Payment date: 20220321 Year of fee payment: 10 |
|
| PG25 | Lapsed in a contracting state [announced via postgrant information from national office to epo] |
Ref country code: TR Free format text: LAPSE BECAUSE OF FAILURE TO SUBMIT A TRANSLATION OF THE DESCRIPTION OR TO PAY THE FEE WITHIN THE PRESCRIBED TIME-LIMIT Effective date: 20191023 Ref country code: MT Free format text: LAPSE BECAUSE OF FAILURE TO SUBMIT A TRANSLATION OF THE DESCRIPTION OR TO PAY THE FEE WITHIN THE PRESCRIBED TIME-LIMIT Effective date: 20191023 Ref country code: CY Free format text: LAPSE BECAUSE OF FAILURE TO SUBMIT A TRANSLATION OF THE DESCRIPTION OR TO PAY THE FEE WITHIN THE PRESCRIBED TIME-LIMIT Effective date: 20191023 |
|
| PGFP | Annual fee paid to national office [announced via postgrant information from national office to epo] |
Ref country code: FR Payment date: 20220322 Year of fee payment: 10 |
|
| PG25 | Lapsed in a contracting state [announced via postgrant information from national office to epo] |
Ref country code: MK Free format text: LAPSE BECAUSE OF FAILURE TO SUBMIT A TRANSLATION OF THE DESCRIPTION OR TO PAY THE FEE WITHIN THE PRESCRIBED TIME-LIMIT Effective date: 20191023 |
|
| PGFP | Annual fee paid to national office [announced via postgrant information from national office to epo] |
Ref country code: DE Payment date: 20220620 Year of fee payment: 11 |
|
| GBPC | Gb: european patent ceased through non-payment of renewal fee |
Effective date: 20230318 |
|
| PG25 | Lapsed in a contracting state [announced via postgrant information from national office to epo] |
Ref country code: GB Free format text: LAPSE BECAUSE OF NON-PAYMENT OF DUE FEES Effective date: 20230318 |
|
| PG25 | Lapsed in a contracting state [announced via postgrant information from national office to epo] |
Ref country code: GB Free format text: LAPSE BECAUSE OF NON-PAYMENT OF DUE FEES Effective date: 20230318 Ref country code: FR Free format text: LAPSE BECAUSE OF NON-PAYMENT OF DUE FEES Effective date: 20230331 |
|
| REG | Reference to a national code |
Ref country code: DE Ref legal event code: R119 Ref document number: 602013061909 Country of ref document: DE |
|
| PG25 | Lapsed in a contracting state [announced via postgrant information from national office to epo] |
Ref country code: DE Free format text: LAPSE BECAUSE OF NON-PAYMENT OF DUE FEES Effective date: 20241001 |
|
| PG25 | Lapsed in a contracting state [announced via postgrant information from national office to epo] |
Ref country code: DE Free format text: LAPSE BECAUSE OF NON-PAYMENT OF DUE FEES Effective date: 20241001 |