EP2634528A1 - Measurement apparatus for measuring shape of test object and measurement method - Google Patents
Measurement apparatus for measuring shape of test object and measurement method Download PDFInfo
- Publication number
- EP2634528A1 EP2634528A1 EP13000561.4A EP13000561A EP2634528A1 EP 2634528 A1 EP2634528 A1 EP 2634528A1 EP 13000561 A EP13000561 A EP 13000561A EP 2634528 A1 EP2634528 A1 EP 2634528A1
- Authority
- EP
- European Patent Office
- Prior art keywords
- interference fringe
- test surface
- vibration
- light
- interference
- Prior art date
- Legal status (The legal status is an assumption and is not a legal conclusion. Google has not performed a legal analysis and makes no representation as to the accuracy of the status listed.)
- Withdrawn
Links
- 238000012360 testing method Methods 0.000 title claims abstract description 82
- 238000005259 measurement Methods 0.000 title claims abstract description 64
- 238000000691 measurement method Methods 0.000 title claims description 4
- 238000001514 detection method Methods 0.000 claims abstract description 62
- 238000000034 method Methods 0.000 claims description 17
- 230000010363 phase shift Effects 0.000 claims description 11
- 230000003287 optical effect Effects 0.000 claims description 5
- 239000000284 extract Substances 0.000 claims description 2
- 238000001914 filtration Methods 0.000 claims description 2
- 238000001228 spectrum Methods 0.000 claims 1
- BJQHLKABXJIVAM-UHFFFAOYSA-N bis(2-ethylhexyl) phthalate Chemical compound CCCCC(CC)COC(=O)C1=CC=CC=C1C(=O)OCC(CC)CCCC BJQHLKABXJIVAM-UHFFFAOYSA-N 0.000 description 13
- 238000004422 calculation algorithm Methods 0.000 description 8
- 238000000411 transmission spectrum Methods 0.000 description 5
- 239000011295 pitch Substances 0.000 description 4
- 230000001133 acceleration Effects 0.000 description 3
- 238000004364 calculation method Methods 0.000 description 3
- 230000015572 biosynthetic process Effects 0.000 description 2
- 230000007423 decrease Effects 0.000 description 2
- 239000006185 dispersion Substances 0.000 description 2
- 238000006073 displacement reaction Methods 0.000 description 2
- 230000001678 irradiating effect Effects 0.000 description 2
- 238000010521 absorption reaction Methods 0.000 description 1
- 238000007796 conventional method Methods 0.000 description 1
- 238000012937 correction Methods 0.000 description 1
- 239000011521 glass Substances 0.000 description 1
- 239000000463 material Substances 0.000 description 1
- 238000012986 modification Methods 0.000 description 1
- 230000004048 modification Effects 0.000 description 1
- 239000007787 solid Substances 0.000 description 1
- 230000003595 spectral effect Effects 0.000 description 1
- 230000001360 synchronised effect Effects 0.000 description 1
Images

Classifications
-
- G—PHYSICS
- G01—MEASURING; TESTING
- G01B—MEASURING LENGTH, THICKNESS OR SIMILAR LINEAR DIMENSIONS; MEASURING ANGLES; MEASURING AREAS; MEASURING IRREGULARITIES OF SURFACES OR CONTOURS
- G01B11/00—Measuring arrangements characterised by the use of optical techniques
- G01B11/24—Measuring arrangements characterised by the use of optical techniques for measuring contours or curvatures
- G01B11/2441—Measuring arrangements characterised by the use of optical techniques for measuring contours or curvatures using interferometry
-
- G—PHYSICS
- G01—MEASURING; TESTING
- G01B—MEASURING LENGTH, THICKNESS OR SIMILAR LINEAR DIMENSIONS; MEASURING ANGLES; MEASURING AREAS; MEASURING IRREGULARITIES OF SURFACES OR CONTOURS
- G01B9/00—Measuring instruments characterised by the use of optical techniques
- G01B9/02—Interferometers
- G01B9/02015—Interferometers characterised by the beam path configuration
- G01B9/02032—Interferometers characterised by the beam path configuration generating a spatial carrier frequency, e.g. by creating lateral or angular offset between reference and object beam
-
- G—PHYSICS
- G01—MEASURING; TESTING
- G01B—MEASURING LENGTH, THICKNESS OR SIMILAR LINEAR DIMENSIONS; MEASURING ANGLES; MEASURING AREAS; MEASURING IRREGULARITIES OF SURFACES OR CONTOURS
- G01B9/00—Measuring instruments characterised by the use of optical techniques
- G01B9/02—Interferometers
- G01B9/02055—Reduction or prevention of errors; Testing; Calibration
- G01B9/02075—Reduction or prevention of errors; Testing; Calibration of particular errors
- G01B9/02076—Caused by motion
-
- G—PHYSICS
- G01—MEASURING; TESTING
- G01B—MEASURING LENGTH, THICKNESS OR SIMILAR LINEAR DIMENSIONS; MEASURING ANGLES; MEASURING AREAS; MEASURING IRREGULARITIES OF SURFACES OR CONTOURS
- G01B2290/00—Aspects of interferometers not specifically covered by any group under G01B9/02
- G01B2290/60—Reference interferometer, i.e. additional interferometer not interacting with object
Definitions
- the present invention relates to a measurement apparatus for measuring the shape of a test object and a measurement method.
- Japanese Patent Laid-Open No. 8-219738 has disclosed a method of detecting a relative vibration between a reference surface and test surface by using an acceleration sensor, and moving at least one of the reference surface and test surface so as to cancel the fluctuation in the relative position, thereby reducing measurement errors caused during measurement by vibrations.
- an interference signal generated by a reflected light beam from an error detection surface positioned around a test surface and a reflected light beam from a part of a reference surface is measured simultaneously with an interference signal generated by the test surface and reference surface, and the phase distribution on the error detection surface is measured by the phase shift method.
- the coefficients a and b in equation (1) are calculated from the measured phase distribution on the error detection surface, and a measurement error generated on the shape of the test surface by a disturbance vibration is corrected by using the coefficients a and b.
- the present invention provides a measurement apparatus capable of inexpensively and accurately correcting a measurement error caused by a disturbance vibration.
- the present invention in its first aspect provides a measurement apparatus as specified in claims 1 to 7.
- the present invention in its second aspect provides a measurement method as specified in claim 8.
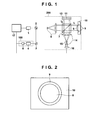
- Fig. 1 is a view showing a measurement apparatus according to the first embodiment
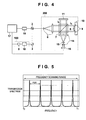
- Fig. 2 is a view showing the positional relationship between a test surface and vibration detection surface
- Fig. 3 is a view showing a measurement sequence according to the first embodiment
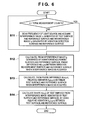
- Fig. 4 is a view showing a measurement apparatus according to the second embodiment
- Fig. 5 is a view showing the transmission spectrum of an etalon
- Fig. 6 is a view showing a measurement sequence according to the second embodiment.
- Fig. 1 is an exemplary view showing an example of a measurement apparatus for measuring the shape of a test surface by detecting interference fringes (first interference fringes) generated by interference between reference light irradiating a reference surface and measurement light irradiating the test surface according to the first embodiment.
- interference fringes first interference fringes
- the measurement apparatus may also use a synthetic wavelength having a measurement range enlarged by using a plurality of light sources having different wavelengths.
- a non-polarizing beam splitter 2 divides a light beam emitted from a light source 1.
- One divided light beam is guided to a wavelength measurement unit 100, and the other divided light beam is guided to an interferometer unit 200.
- the light beam guided to the wavelength measurement unit 100 is reflected by a mirror 3, transmitted through a gas cell 4, and incident on a detector 5.
- a control unit 17 Based on the light intensity detected by the detector 5, a control unit 17 performs control such that the wavelength of the light beam emitted from the light source 1 is stabilized to a wavelength reference as the absorption line of the gas cell 4.
- the light beam guided to the interferometer unit 200 is expanded to a desired beam diameter by a beam expander 6.
- a non-polarizing beam splitter 7 divides the expanded light beam into a light beam (measurement light) I 1 and a light beam (reference light) I 2 .
- a part of the light beam (measurement light) I 1 is incident on a test surface 8, and the other part is incident on a vibration detection surface 9.
- the light beam (reference light) I 2 is incident on a reference surface 11.
- the reference surface 11 is positioned on a piezoelectric element 13 as an element for shifting the phase of the light beam I 2 , and changing the difference between the optical path lengths of the light beams I 1 and I 2 .
- the control unit (processor) 17 applies a voltage to the piezoelectric element 13. This enables fringe scan synchronized with the sensing timing of a image sensor 16 (ex. CCD sensor, CMOS sensor).
- the image sensor 16 senses an image of two dimensions.
- the image sensor 16 may comprise plural sensors.
- the vibration detection surface 9 is positioned outside the test surface 8, and fixed to a mounting base 10 on which a test object is mounted, such that a relative position with respect to the test surface 8 is constant.
- the vibration detection surface 9 is a plane mirror and inclined to a plane perpendicular to the optical axis of the light beam (measurement light) I 1 . Consequently, the vibration detection surface 9 is inclined relative to the reference surface 11.
- the first embodiment uses the inclined vibration detection surface 9, it is also possible to use a vibration detection surface 9 having stair-casing steps.
- the light beam I 1 is reflected by the test surface 8 and vibration detection surface 9, and returns to the non-polarizing beam splitter 7.
- the light beam I 2 is reflected by the reference surface 11, and returns to the non-polarizing beam splitter 7.
- the solid lines of the light beams I 1 and I 2 indicate light beams corresponding to the test surface 8
- the dotted lines indicate light beams corresponding to the vibration detection surface 9.
- the light beams I 1 and I 2 are combined by the non-polarizing beam splitter 7, and incident on the image sensor 16 via an image formation lens 14 and spatial filter 15.
- the image sensor 16 simultaneously acquires a first interference fringe image generated by the reflected light beams from the test surface 8 and reference surface 11 and a second interference fringe image generated by the reflected light beams from the vibration detection surface 9 and reference surface 11 at once.
- the image sensor 16 and test surface 8 are positioned to be optically conjugate with each other via the image formation lens 14.
- the spatial filter 15 prevents unnecessary light from mixing in the image sensor 16.
- x and y indicate a pixel address in the image sensor 16
- a(x,y) is the bias intensity
- b(x,y) is the amplitude intensity
- H(x,y) is the shape of the test surface
- ⁇ is the amount of phase shift of the light beam I 2 , which is caused by the piezoelectric element 13.
- the control unit 17 can accurately calculate the shape H(x,y) of the test surface by using equation (3).
- the object of the first embodiment is to correct a measurement error caused by a disturbance vibration in accordance with a measurement sequence shown in Fig. 3 , and accurately calculate the shape of the test surface 8 even when there is a disturbance vibration.
- the measurement sequence according to the first embodiment will be explained below with reference to Fig. 3 .
- step S1 the control unit 17 drives the piezoelectric element 13 to acquire the first interference fringe image generated by the reflected light beams from the test surface 8 and reference surface 11, and the second interference fringe image generated by the reflected light beams from the vibration detection surface 9 and reference surface 11.
- the driving of the piezoelectric element 13 and the acquisition of the interference fringe images are alternately repeated until the number of times of phase shift reaches a predetermined number N.
- N is at least 3 in order to separate a(x,y) and b(x,y).
- ⁇ is the wavelength
- H(x,y) is the shape of the test surface 8
- ⁇ z(x,y,n) is a relative vibration between the test surface 8 and reference surface 11 when the nth interference image is acquired
- ⁇ (n) is the phase shift amount of the nth interference image.
- H'(x,y) is the shape of the vibration detection surface 9
- f x and f y are respectively carrier frequencies formed in the x and y directions by the vibration detection surface 9 and reference surface 11
- ⁇ z'(x,y,n) is a relative vibration between the vibration detection surface 9 and reference surface 11 when the nth second interference fringe image is acquired.
- the carrier frequencies f x and f y are determined by a relative inclination
- step S2 the control unit 17 calculates a phase difference ⁇ (x,y,n) between the vibration detection surface 9 and reference surface 11 when each interference image is acquired, from the second interference fringe image I 2 (x,y,n) generated by the vibration detection surface 9 and reference surface 11.
- the carrier frequencies f x and f y are superposed on the second interference fringe image I 2 (x,y,n).
- the control unit 17 calculates the phase difference ⁇ (x,y,n) by using the Fourier-transform method of fringe-pattern analysis.
- the Fourier-transform method of fringe-pattern analysis is a method of obtaining a phase from one second interference fringe image by introducing the carrier frequencies f x and f y .
- c(x,y,n) is the complex amplitude of the second interference fringe
- c * (x,y,n) is the conjugate of c(x,y,n).
- the phase difference ⁇ (x,y,n) between the vibration detection surface 9 and reference surface 11 is a phase distribution having information about the shape H'(x,y) of the vibration detection surface, the relative vibration ⁇ z'(x,y,n) between the vibration detection surface 9 and reference surface 11, and the phase shift amount ⁇ (n) between the light beams I 1 and I 2 .
- A( ⁇ , ⁇ ) is the Fourier transform of a(x,y)
- C( ⁇ - f x , ⁇ - f y ) and C * ( ⁇ - f x , ⁇ - f y ) are respectively the Fourier transforms of c(x,y,n) and c * (x,y,n).
- control unit 17 extracts C( ⁇ - f x , ⁇ - f y ) by filtering, moves a spectral peak positioned at coordinates (f x ,f y ) to the origin of a frequency coordinate system, and eliminates the carrier frequencies f x and f y .
- step S3 the control unit 17 calculates a relative vibration ⁇ z'(x,y,n) between the vibration detection surface 9 and reference surface 11 when each image is acquired, from the phase difference ⁇ (x,y,n) between the vibration detection surface 9 and reference surface 11 calculated in step S2.
- phase differences ⁇ (x,y,1) and ⁇ (x,y,n) between the vibration detection surface 9 and the reference surface 11 and the phase shift amounts ⁇ (1) and ⁇ (n) are known parameters. Accordingly, the relative vibration ⁇ z'(x,y,n) between the vibration detection surface 9 and reference surface 11 can be calculated by using these values.
- the relative vibration ⁇ z'(x,y,n) between the vibration detection surface 9 and reference surface 11 is calculated following the procedures described above.
- the target of calculation is the relative vibration between the test surface 8 and reference surface 11.
- the relative positions of the test surface 8 and vibration detection surface 9 are constant, so the piston component and tilt component of the relative vibration with respect to the reference surface 11 are the same. Therefore, the control unit 17 calculates the piston component and tilt component by performing plane approximation on the relative vibration of the vibration detection surface 9, and calculates the relative vibration of the test surface 8 from the calculated piston component and tilt component.
- the control unit 17 defines a merit function M 1 below by using the relative vibration ⁇ z'(x,y,n) between the vibration detection surface 9 and reference surface 11. Then, the control unit 17 calculates the piston component p(n) and tilt components t x (n) and t y (n) of the relative vibration, which minimize the merit function M 1 , and calculates the relative vibration ⁇ z(x,y,n) between the test surface 8 and reference surface 11 by using the calculated components in accordance with the equation (5).
- M 1 ⁇ x , y ⁇ z ⁇ x ⁇ y ⁇ n - p n + t x n ⁇ x + t y n ⁇ y 2
- step S4 the control unit 17 calculates the shape of the test surface 8 from the first interference fringe image generated by the test surface 8 and reference surface 11, by using the relative vibration ⁇ z(x,y,n) between the test surface 8 and reference surface 11 calculated in step S3. More specifically, the control unit 17 defines a merit function M 2 below by using the first interference fringe image I 1 (x,y,n) generated by the test surface 8 and reference surface 11, and the relative vibration ⁇ z(x,y,n) between the test surface 8 and reference surface 11. Then, the control unit 17 obtains H(x,y) that minimizes the merit function M 2 as a surface position at the point (x,y) on the test surface 8.
- a(x,y), b(x,y), and H(x,y) are unknown constants at the point (x,y) on the test surface 8. Since there are three unknowns including H(x,y) to be obtained, the number N of the first interference fringe images must be three or more.
- the measurement sequence according to the first embodiment has been explained above.
- the first embodiment is inexpensive because it is unnecessary to add any acceleration sensor for vibration detection unlike in Japanese Patent Laid-Open No. 8-219738 .
- the first embodiment does not use any approximate calculation unlike in Japanese Patent Laid-Open No. 2000-275021 . This makes it possible to accurately correct a measurement error caused by a disturbance vibration even in a large-vibration environment.
- the second embodiment includes a frequency scanning interferometer.
- Fig. 4 is a schematic view showing an example of a measurement apparatus of the second embodiment. As in the first embodiment, the most basic arrangement including one light source will be explained, but a plurality of light sources may also be used.
- the measurement apparatus according to the second embodiment is the same as that of the first embodiment except that the light source 1 is replaced with a frequency scanning light source 19, no piezoelectric element 13 is necessary, and a wavelength measurement unit 100 is changed. Therefore, only the wavelength measurement unit 100 of the measurement apparatus will be explained below.
- a light beam guided to the wavelength measurement unit 100 is reflected by a mirror 3, transmitted through a Fabry-perot etalon 18, and incident on a detector 5.
- a control unit 17 controls the wavelength of a light beam emitted from the frequency scanning light source 19. It is necessary to ensure the relative value of each peak of the transmission spectrum of the Fabry-perot etalon 18.
- a vacuum-medium etalon having a guaranteed transmission spectrum interval is used as the Fabry-perot etalon 18. Since the vacuum-medium etalon has neither the refractive index nor the dispersion of an internal medium, it is readily possible to ensure the relative value of the wavelength.
- low-thermal-expansion glass or the like as the material of the etalon, it is possible to reduce the expansion ratio with respect to the temperature, and implement a wavelength reference element that is stable for a long time period.
- the Fabry-perot etalon 18 is not limited to the vacuum-medium etalon, and may also be an air-gap etalon or solid etalon. In this case, it is necessary to guarantee the internal refractive index and dispersion by, for example, measuring the etalon temperature. Also, to ensure the wavelength at each time during frequency scanning, the Fabry-perot etalon 18 desirably has at least two transmission spectra within the frequency scanning range of the frequency scanning light source 19.
- Fig. 5 shows an example in which a scanning range from a light source frequency f 0 to a light source frequency f 1 contains five transmission spectra.
- c is the light speed
- ⁇ f is the frequency scanning amount of the light source 19 between images
- ⁇ 0 (x,y) is the initial phase of an interference signal
- n 1 to N (N is at least 3).
- a sine-wave interference signal having a frequency corresponding to a shape H(x,y) of the test surface 8 is obtained by each pixel of the image sensor 16.
- the shape H(x,y) of the test surface 8 is calculated following the above procedures. However, if a relative fluctuation occurs between the test surface 8 and reference surface 11 due to a disturbance vibration or the like, a phase error is added to equation (15), and the measurement accuracy decreases in the same manner as that for the phase shift interferometer of the first embodiment. In the second embodiment, therefore, a measurement error generated by a disturbance vibration is corrected and the shape of the test surface 8 is accurately calculated even when there is a disturbance vibration, in accordance with a measurement sequence shown in Fig. 6 .
- the measurement sequence according to the second embodiment will be explained below with reference to Fig. 6 . Since this measurement sequence shown in Fig. 6 is basically the same as the measurement sequence of the first embodiment, only portions different from the first embodiment will briefly be explained.
- step S11 the control unit 17 scans the frequency of the frequency scanning light source 19, and acquires a first interference fringe image generated by reflected light beams from the test surface 8 and reference surface 11, and a second interference fringe image generated by reflected light beams from a vibration detection surface 9 and the reference surface 11.
- the control unit 17 acquires interference fringe images by scanning the frequency of the light source 19, until a predetermined frequency scanning amount (a total sensing count: N times) is reached.
- step S12 the control unit 17 calculates a phase difference ⁇ (x,y,n) between the vibration detection surface 9 and reference surface 11 when each image is acquired, from the second interference fringe image I 2 (x,y,n) generated by the vibration detection surface 9 and reference surface 11.
- the control unit 17 calculates the phase difference ⁇ (x,y,n) based on the Carre algorithm. Note that the method of calculating the phase difference ⁇ (x,y,n) is not limited to the Carre algorithm, and the Fourier-transform method of fringe-pattern analysis may also be used as in the first embodiment.
- the Carre algorithm is a method of obtaining a phase by using four interference signals having phase differences at a predetermined pitch in one direction.
- the Carre algorithm will briefly be explained below.
- the phase can be calculated from four interference signals having phase differences at equal pitches by using the Carre algorithm.
- the second interference fringe image I 2 (x,y,n) generated by the vibration detection surface 9 and reference surface 11 is an interference fringe image spatially given phase differences at equal pitches.
- the control unit 17 can calculate the phase difference ⁇ (x,y,n) between the vibration detection surface 9 and reference surface 11 when each image is acquired from one second interference fringe image.
- step S13 the control unit 17 calculates the relative vibration between the test surface 8 and reference surface 11 when each second interference fringe image is acquired, from the phase difference ⁇ (x,y,n) between the vibration detection surface 9 and reference surface 11 calculated in step S2.
- the control unit 17 can calculate the relative vibration ⁇ z'(x,y,n) between the vibration detection surface 9 and reference surface 11 by using these values.
- the method of calculating the relative vibration ⁇ z(x,y,n) between the test surface 8 and reference surface 11 from the relative vibration ⁇ z'(x,y,n) between the vibration detection surface 9 and reference surface 11 is the same as that of the first embodiment, so an explanation thereof will be omitted.
Landscapes
- Physics & Mathematics (AREA)
- General Physics & Mathematics (AREA)
- Length Measuring Devices By Optical Means (AREA)
- Instruments For Measurement Of Length By Optical Means (AREA)
Abstract
Description
- The present invention relates to a measurement apparatus for measuring the shape of a test object and a measurement method.
- A light wave interferometer using the interference of light generally has a high measurement accuracy, so even a weak vibration occurring during measurement has large influence on the measurement result. Therefore, demands have arisen for reducing measurement errors caused in the light wave interferometer by vibrations. Japanese Patent Laid-Open No.
8-219738 - In Japanese Patent Laid-Open No.
2000-275021 
where ϕ is the true value of a phase. Also, each of an amplitude a and constant term b changes in accordance with the vibration state during measurement, and has a different value whenever measurement is performed. - In Japanese Patent Laid-Open No.
2000-275021 - In Japanese Patent Laid-Open No.
8-219738 2000-275021 2000-275021 - The present invention provides a measurement apparatus capable of inexpensively and accurately correcting a measurement error caused by a disturbance vibration.
- The present invention in its first aspect provides a measurement apparatus as specified in
claims 1 to 7. - The present invention in its second aspect provides a measurement method as specified in
claim 8. - Further features of the present invention will become apparent from the following description of exemplary embodiments with reference to the attached drawings.
-
Fig. 1 is a view showing a measurement apparatus according to the first embodiment; -
Fig. 2 is a view showing the positional relationship between a test surface and vibration detection surface; -
Fig. 3 is a view showing a measurement sequence according to the first embodiment; -
Fig. 4 is a view showing a measurement apparatus according to the second embodiment; -
Fig. 5 is a view showing the transmission spectrum of an etalon; and -
Fig. 6 is a view showing a measurement sequence according to the second embodiment. -
Fig. 1 is an exemplary view showing an example of a measurement apparatus for measuring the shape of a test surface by detecting interference fringes (first interference fringes) generated by interference between reference light irradiating a reference surface and measurement light irradiating the test surface according to the first embodiment. In the first embodiment, the most basic arrangement using one light source will be explained. However, the number of light sources is not limited to one, and the measurement apparatus may also use a synthetic wavelength having a measurement range enlarged by using a plurality of light sources having different wavelengths. - A
non-polarizing beam splitter 2 divides a light beam emitted from alight source 1. One divided light beam is guided to awavelength measurement unit 100, and the other divided light beam is guided to aninterferometer unit 200. The light beam guided to thewavelength measurement unit 100 is reflected by amirror 3, transmitted through agas cell 4, and incident on adetector 5. Based on the light intensity detected by thedetector 5, acontrol unit 17 performs control such that the wavelength of the light beam emitted from thelight source 1 is stabilized to a wavelength reference as the absorption line of thegas cell 4. On the other hand, the light beam guided to theinterferometer unit 200 is expanded to a desired beam diameter by abeam expander 6. - A
non-polarizing beam splitter 7 divides the expanded light beam into a light beam (measurement light) I1 and a light beam (reference light) I2. A part of the light beam (measurement light) I1 is incident on atest surface 8, and the other part is incident on avibration detection surface 9. The light beam (reference light) I2 is incident on areference surface 11. Thereference surface 11 is positioned on apiezoelectric element 13 as an element for shifting the phase of the light beam I2, and changing the difference between the optical path lengths of the light beams I1 and I2. When measuring an image of an interference fringe, the control unit (processor) 17 applies a voltage to thepiezoelectric element 13. This enables fringe scan synchronized with the sensing timing of a image sensor 16 (ex. CCD sensor, CMOS sensor). Theimage sensor 16 senses an image of two dimensions. Theimage sensor 16 may comprise plural sensors. - As shown in
Fig. 2 , thevibration detection surface 9 is positioned outside thetest surface 8, and fixed to amounting base 10 on which a test object is mounted, such that a relative position with respect to thetest surface 8 is constant. Thevibration detection surface 9 is a plane mirror and inclined to a plane perpendicular to the optical axis of the light beam (measurement light) I1. Consequently, thevibration detection surface 9 is inclined relative to thereference surface 11. Although the first embodiment uses the inclinedvibration detection surface 9, it is also possible to use avibration detection surface 9 having stair-casing steps. The light beam I1 is reflected by thetest surface 8 andvibration detection surface 9, and returns to thenon-polarizing beam splitter 7. The light beam I2 is reflected by thereference surface 11, and returns to thenon-polarizing beam splitter 7. Referring toFig. 1 , the solid lines of the light beams I1 and I2 indicate light beams corresponding to thetest surface 8, and the dotted lines indicate light beams corresponding to thevibration detection surface 9. - The light beams I1 and I2 are combined by the
non-polarizing beam splitter 7, and incident on theimage sensor 16 via animage formation lens 14 andspatial filter 15. Theimage sensor 16 simultaneously acquires a first interference fringe image generated by the reflected light beams from thetest surface 8 andreference surface 11 and a second interference fringe image generated by the reflected light beams from thevibration detection surface 9 andreference surface 11 at once. Theimage sensor 16 andtest surface 8 are positioned to be optically conjugate with each other via theimage formation lens 14. Thespatial filter 15 prevents unnecessary light from mixing in theimage sensor 16. - In an ideal state in which no measurement error is caused by a disturbance vibration, a first interference fringe image I(x,y) generated by the
test surface 8 andreference surface 11 is represented by:
where x and y indicate a pixel address in theimage sensor 16, a(x,y) is the bias intensity, b(x,y) is the amplitude intensity, H(x,y) is the shape of the test surface, and δϕ is the amount of phase shift of the light beam I2, which is caused by thepiezoelectric element 13. - When using a phase calculation algorithm based on the four-step method, the
control unit 17 acquires four first interference fringe images I1, I2, I3, and I4 for each phase of the reference light I2 by setting the phase shift amount such that δϕ = 0, π/2, π, and 3π/2. Thecontrol unit 17 can obtain the shape H(x,y) of the test surface by using:
- In an ideal state in which no measurement error is caused by a disturbance vibration, the
control unit 17 can accurately calculate the shape H(x,y) of the test surface by using equation (3). However, if a relative vibration is generated between thetest surface 8 andreference surface 11 by a disturbance vibration, an error is added to the phase term of equation (2), and the measurement accuracy of the shape H(x,y) of thetest surface 8 decreases. Accordingly, the object of the first embodiment is to correct a measurement error caused by a disturbance vibration in accordance with a measurement sequence shown inFig. 3 , and accurately calculate the shape of thetest surface 8 even when there is a disturbance vibration. The measurement sequence according to the first embodiment will be explained below with reference toFig. 3 . - In step S1, the
control unit 17 drives thepiezoelectric element 13 to acquire the first interference fringe image generated by the reflected light beams from thetest surface 8 andreference surface 11, and the second interference fringe image generated by the reflected light beams from thevibration detection surface 9 andreference surface 11. In this step, the driving of thepiezoelectric element 13 and the acquisition of the interference fringe images are alternately repeated until the number of times of phase shift reaches a predetermined number N. Note that N is at least 3 in order to separate a(x,y) and b(x,y). When there is a disturbance vibration, a first interference fringe image I1(x,y,n) of the nth (n = 1 to N) test surface of the N test surfaces is represented by:
where λ is the wavelength, H(x,y) is the shape of thetest surface 8, δz(x,y,n) is a relative vibration between thetest surface 8 andreference surface 11 when the nth interference image is acquired, and δϕ(n) is the phase shift amount of the nth interference image. - Also, the relative vibration δz(x,y,n) between the
test surface 8 andreference surface 11 in equation (4) above can be represented by a uniform component (piston) and inclination component (tilt), and hence is represented by:
where p(n), tx(n), and ty(n) respectively indicate the piston component, x-direction tilt component, and y-direction tilt component of the relative vibration when the nth interference fringe image is acquired. - On the other hand, when there is a disturbance vibration, a second interference fringe image I2(x,y,n) generated by the reflected light beams from the
vibration detection surface 9 andreference surface 11 is represented by:
where H'(x,y) is the shape of thevibration detection surface 9, fx and fy are respectively carrier frequencies formed in the x and y directions by thevibration detection surface 9 andreference surface 11, and δz'(x,y,n) is a relative vibration between thevibration detection surface 9 andreference surface 11 when the nth second interference fringe image is acquired. The carrier frequencies fx and fy are determined by a relative inclination angle between thevibration detection surface 9 andreference surface 11. - In step S2, the
control unit 17 calculates a phase difference ϕ(x,y,n) between thevibration detection surface 9 andreference surface 11 when each interference image is acquired, from the second interference fringe image I2(x,y,n) generated by thevibration detection surface 9 andreference surface 11. The carrier frequencies fx and fy are superposed on the second interference fringe image I2(x,y,n). In the first embodiment, thecontrol unit 17 calculates the phase difference ϕ(x,y,n) by using the Fourier-transform method of fringe-pattern analysis. The Fourier-transform method of fringe-pattern analysis is a method of obtaining a phase from one second interference fringe image by introducing the carrier frequencies fx and fy. A brief explanation of the phase calculation by the Fourier-transform method of fringe-pattern analysis will be made below. - First, the second interference fringe image I2(x,y,n) generated by the
vibration detection surface 9 andreference surface 11 and represented by equation (6) above can be deformed as represented by:
where c(x,y,n) is the complex amplitude of the second interference fringe, and c*(x,y,n) is the conjugate of c(x,y,n).
for
- That is, the phase difference ϕ(x,y,n) between the
vibration detection surface 9 andreference surface 11 is a phase distribution having information about the shape H'(x,y) of the vibration detection surface, the relative vibration δz'(x,y,n) between thevibration detection surface 9 andreference surface 11, and the phase shift amount δϕ(n) between the light beams I1 and I2. - Equation (10) below is obtained by performing Fourier transform on equation (7), that is, data of the second interference fringe:

where A(η,ζ) is the Fourier transform of a(x,y), and C(η - fx,ζ - fy) and C*(η - fx,ζ - fy) are respectively the Fourier transforms of c(x,y,n) and c*(x,y,n). - Then, the
control unit 17 extracts C(η - fx,ζ - fy) by filtering, moves a spectral peak positioned at coordinates (fx,fy) to the origin of a frequency coordinate system, and eliminates the carrier frequencies fx and fy. Subsequently, thecontrol unit 17 obtains c(x,y,n) by performing inverse Fourier transform, and calculates the phase difference ϕ(x,y,n) by:
where Im(c(x,y,n)) and Re(c(x,y,n)) are respectively the imaginary part and real part of the complex amplitude c(x,y,n) of the second interference fringe. - The foregoing is the explanation of the Fourier-transform method of fringe-pattern analysis. Since the phase can be calculated from one second interference fringe image by using the Fourier-transform method of fringe-pattern analysis as described above, it is possible to calculate the phase difference ϕ(x,y,n) between the
vibration detection surface 9 andreference surface 11 when each image is acquired. - In step S3, the
control unit 17 calculates a relative vibration δz'(x,y,n) between thevibration detection surface 9 andreference surface 11 when each image is acquired, from the phase difference ϕ(x,y,n) between thevibration detection surface 9 andreference surface 11 calculated in step S2. A relative displacement when the first image of the second interference fringe is acquired is used as a reference (that is, δz'(x,y,1) = 0). In this case, using equation (9), the relative vibration δz'(x,y,n) between thevibration detection surface 9 andreference surface 11 when the nth second interference fringe image is acquired is represented by equation (12) below by:
- In equation (12) above, the phase differences ϕ(x,y,1) and ϕ(x,y,n) between the
vibration detection surface 9 and thereference surface 11 and the phase shift amounts δϕ(1) and δϕ(n) are known parameters. Accordingly, the relative vibration δz'(x,y,n) between thevibration detection surface 9 andreference surface 11 can be calculated by using these values. - The relative vibration δz'(x,y,n) between the
vibration detection surface 9 andreference surface 11 is calculated following the procedures described above. However, the target of calculation is the relative vibration between thetest surface 8 andreference surface 11. In the first embodiment, the relative positions of thetest surface 8 andvibration detection surface 9 are constant, so the piston component and tilt component of the relative vibration with respect to thereference surface 11 are the same. Therefore, thecontrol unit 17 calculates the piston component and tilt component by performing plane approximation on the relative vibration of thevibration detection surface 9, and calculates the relative vibration of thetest surface 8 from the calculated piston component and tilt component. - More specifically, the
control unit 17 defines a merit function M1 below by using the relative vibration δz'(x,y,n) between thevibration detection surface 9 andreference surface 11. Then, thecontrol unit 17 calculates the piston component p(n) and tilt components tx(n) and ty(n) of the relative vibration, which minimize the merit function M1, and calculates the relative vibration δz(x,y,n) between thetest surface 8 andreference surface 11 by using the calculated components in accordance with the equation (5).
- In step S4, the
control unit 17 calculates the shape of thetest surface 8 from the first interference fringe image generated by thetest surface 8 andreference surface 11, by using the relative vibration δz(x,y,n) between thetest surface 8 andreference surface 11 calculated in step S3. More specifically, thecontrol unit 17 defines a merit function M2 below by using the first interference fringe image I1(x,y,n) generated by thetest surface 8 andreference surface 11, and the relative vibration δz(x,y,n) between thetest surface 8 andreference surface 11. Then, thecontrol unit 17 obtains H(x,y) that minimizes the merit function M2 as a surface position at the point (x,y) on thetest surface 8.
where a(x,y), b(x,y), and H(x,y) are unknown constants at the point (x,y) on thetest surface 8. Since there are three unknowns including H(x,y) to be obtained, the number N of the first interference fringe images must be three or more. - The measurement sequence according to the first embodiment has been explained above. As described above, the first embodiment is inexpensive because it is unnecessary to add any acceleration sensor for vibration detection unlike in Japanese Patent Laid-Open No.
8-219738 2000-275021 - The second embodiment includes a frequency scanning interferometer.
Fig. 4 is a schematic view showing an example of a measurement apparatus of the second embodiment. As in the first embodiment, the most basic arrangement including one light source will be explained, but a plurality of light sources may also be used. In addition, the measurement apparatus according to the second embodiment is the same as that of the first embodiment except that thelight source 1 is replaced with a frequencyscanning light source 19, nopiezoelectric element 13 is necessary, and awavelength measurement unit 100 is changed. Therefore, only thewavelength measurement unit 100 of the measurement apparatus will be explained below. - A light beam guided to the
wavelength measurement unit 100 is reflected by amirror 3, transmitted through a Fabry-perot etalon 18, and incident on adetector 5. Based on the light intensity detected by thedetector 5, acontrol unit 17 controls the wavelength of a light beam emitted from the frequencyscanning light source 19. It is necessary to ensure the relative value of each peak of the transmission spectrum of the Fabry-perot etalon 18. In the second embodiment, therefore, a vacuum-medium etalon having a guaranteed transmission spectrum interval is used as the Fabry-perot etalon 18. Since the vacuum-medium etalon has neither the refractive index nor the dispersion of an internal medium, it is readily possible to ensure the relative value of the wavelength. In addition, when using low-thermal-expansion glass or the like as the material of the etalon, it is possible to reduce the expansion ratio with respect to the temperature, and implement a wavelength reference element that is stable for a long time period. - The Fabry-
perot etalon 18 is not limited to the vacuum-medium etalon, and may also be an air-gap etalon or solid etalon. In this case, it is necessary to guarantee the internal refractive index and dispersion by, for example, measuring the etalon temperature. Also, to ensure the wavelength at each time during frequency scanning, the Fabry-perot etalon 18 desirably has at least two transmission spectra within the frequency scanning range of the frequencyscanning light source 19.Fig. 5 shows an example in which a scanning range from a light source frequency f0 to a light source frequency f1 contains five transmission spectra. - In the frequency scanning interferometer in an ideal state in which no measurement error is caused by a disturbance vibration, an interference fringe image I(x,y,n) generated by a
test surface 8 andreference surface 11 is represented by:
where c is the light speed, δf is the frequency scanning amount of thelight source 19 between images, ϕ0(x,y) is the initial phase of an interference signal, and n = 1 to N (N is at least 3). - When the frequency scanning amount between images is constant, as indicated by equation (15), a sine-wave interference signal having a frequency corresponding to a shape H(x,y) of the
test surface 8 is obtained by each pixel of theimage sensor 16. A frequency ν(x,y) of the interference signal depends on only the shape H(x,y) of thetest surface 8. Therefore, thecontrol unit 17 can calculate the frequency ν(x,y) of the interference signal by performing Fourier transform on the interference signal and performing peak detection, and can calculate the shape H(x,y) of thetest surface 8 by:
- The shape H(x,y) of the
test surface 8 is calculated following the above procedures. However, if a relative fluctuation occurs between thetest surface 8 andreference surface 11 due to a disturbance vibration or the like, a phase error is added to equation (15), and the measurement accuracy decreases in the same manner as that for the phase shift interferometer of the first embodiment. In the second embodiment, therefore, a measurement error generated by a disturbance vibration is corrected and the shape of thetest surface 8 is accurately calculated even when there is a disturbance vibration, in accordance with a measurement sequence shown inFig. 6 . The measurement sequence according to the second embodiment will be explained below with reference toFig. 6 . Since this measurement sequence shown inFig. 6 is basically the same as the measurement sequence of the first embodiment, only portions different from the first embodiment will briefly be explained. - In step S11, the
control unit 17 scans the frequency of the frequencyscanning light source 19, and acquires a first interference fringe image generated by reflected light beams from thetest surface 8 andreference surface 11, and a second interference fringe image generated by reflected light beams from avibration detection surface 9 and thereference surface 11. In this step, thecontrol unit 17 acquires interference fringe images by scanning the frequency of thelight source 19, until a predetermined frequency scanning amount (a total sensing count: N times) is reached. When there is a disturbance vibration, a first interference fringe image I1(x,y,n) of thetest surface 8 when the sensing count is n times (n = 1 to N) is represented by:
- On the other hand, when there is a disturbance vibration, a second interference fringe image I2(x,y,n) generated by the reflected light beams from the
vibration detection surface 9 andreference surface 11 is represented by:
- In step S12, the
control unit 17 calculates a phase difference ϕ(x,y,n) between thevibration detection surface 9 andreference surface 11 when each image is acquired, from the second interference fringe image I2(x,y,n) generated by thevibration detection surface 9 andreference surface 11. In the second embodiment, thecontrol unit 17 calculates the phase difference ϕ(x,y,n) based on the Carre algorithm. Note that the method of calculating the phase difference ϕ(x,y,n) is not limited to the Carre algorithm, and the Fourier-transform method of fringe-pattern analysis may also be used as in the first embodiment. - The Carre algorithm is a method of obtaining a phase by using four interference signals having phase differences at a predetermined pitch in one direction. The Carre algorithm will briefly be explained below. Four interference signals I1, I2, I3, and I4 given phase differences -3α, -α, α, and 3α at equal pitches are represented by:

By using the four interference signals I1, I2, I3, and I4 by solving equations (19), a phase ϕ of the interference signal can be calculated by:
- The foregoing is the brief explanation of the Carre algorithm. As described above, the phase can be calculated from four interference signals having phase differences at equal pitches by using the Carre algorithm.
- As indicated by equation (18), the second interference fringe image I2(x,y,n) generated by the
vibration detection surface 9 andreference surface 11 is an interference fringe image spatially given phase differences at equal pitches. By using the Carre algorithm based on interference signals of four pixels adjacent to each other in the x or y direction, therefore, thecontrol unit 17 can calculate the phase difference ϕ(x,y,n) between thevibration detection surface 9 andreference surface 11 when each image is acquired from one second interference fringe image. Thus, the phase difference ϕ(x,y,n) between thevibration detection surface 9 andreference surface 11 indicated by equation (21) below is calculated:
- In step S13, the
control unit 17 calculates the relative vibration between thetest surface 8 andreference surface 11 when each second interference fringe image is acquired, from the phase difference ϕ(x,y,n) between thevibration detection surface 9 andreference surface 11 calculated in step S2. A relative displacement when the second interference fringe image is acquired for n = 1 is used as a reference (that is, δz'(x,y,1) = 0). In this case, by using equation (21), the relative vibration between thevibration detection surface 9 andreference surface 11 when the nth second interference fringe image is acquired is represented by:
- In equation (22) above, the phase differences ϕ(x,y,1) and ϕ(x,y,n) between the
vibration detection surface 9 and thereference surface 11, a frequency step amount δf, and the shape H'(x,y) of thevibration detection surface 9 are known parameters (the shape H'(x,y) of thevibration detection surface 9 is separately calibrated). Accordingly, thecontrol unit 17 can calculate the relative vibration δz'(x,y,n) between thevibration detection surface 9 andreference surface 11 by using these values. The method of calculating the relative vibration δz(x,y,n) between thetest surface 8 andreference surface 11 from the relative vibration δz'(x,y,n) between thevibration detection surface 9 andreference surface 11 is the same as that of the first embodiment, so an explanation thereof will be omitted. - In step S14, the
control unit 17 calculates the shape of thetest surface 8 from the first interference fringe image generated by thetest surface 8 andreference surface 11, by using the relative vibration δz(x,y,n) between thetest surface 8 andreference surface 11 calculated in step S3. More specifically, thecontrol unit 17 defines a merit function M3 below by using the first interference fringe image I1(x,y,n) generated by thetest surface 8 andreference surface 11, and the relative vibration δz(x,y,n) between thetest surface 8 and reference surface 11:
Then, thecontrol unit 17 obtains H(x,y) that minimizes the merit function M3, as a surface position at a point (x,y) on thetest surface 8. - The measurement sequence according to the second embodiment has been explained above. In this embodiment as described above, it is possible to inexpensively and accurately correct a measurement error caused by a disturbance vibration when compared to the conventional methods, as in the first embodiment.
- While the present invention has been described with reference to exemplary embodiments, it is to be understood that the invention is not limited to the disclosed exemplary embodiments. The scope of the following claims is to be accorded the broadest interpretation so as to encompass all such modifications and equivalent structures and functions.
Claims (8)
- A measurement apparatus for measuring a shape of a test surface (8) by detecting a first interference fringe generated by interference between reference light from a reference surface (11) and measurement light from the test surface, the apparatus characterized by comprising:a vibration detection surface (9) which has a set relative position with respect to the test surface, and is irradiated with a part of the measurement light;an image sensor (16) configured to sense, together with the first interference fringe, a second interference fringe generated by interference between light from said vibration detection surface and the reference light; anda processor (17) configured to obtain a relative vibration between the reference surface and the test surface by using data of the sensed second interference fringe, and obtain the shape of the test surface by using the obtained relative vibration and data of the sensed first interference fringe.
- The apparatus according to claim 1, characterized in that said vibration detection surface is inclined to a plane perpendicular to an optical axis of the measurement light.
- The apparatus according to claim 1 or 2, characterized in that said processor obtains a phase difference corresponding to an optical path length difference between the reference surface and said vibration detection surface from the sensed second interference fringe, obtains a relative vibration between the reference surface and said vibration detection surface from the obtained phase difference, and obtains a relative vibration between the reference surface and the test surface from the obtained relative vibration.
- The apparatus according to claim 3, characterized in that said processor performs Fourier transform on the data of the second interference fringe on which a carrier frequency formed by said vibration detection surface and the reference surface is superposed, extracts only a spectrum containing information of said vibration detection surface by filtering, and obtains the phase difference by performing inverse Fourier transform.
- The apparatus according to claim 3, characterized in that letting I1, I2, I3, and I4 respectively be intensities of the second interference fringe at four pixels arranged at a predetermined pitch in one direction in said image sensor, and ϕ be the phase difference, said processor obtains the phase difference ϕ by using

- The apparatus according to any one of claims 1 to 5, characterized in that letting a(x,y), b(x,y), and H(x,y) be unknown constants at a point (x,y) on the test surface, λ be a wavelength of the reference light and the measurement light, I(x,y,n) be an intensity of the first interference fringe sensed as an nth image of N (N is not less than 3) first interference fringes sensed whenever a phase of the reference light is shifted, and δz(x,y,n) and δϕ(n) respectively be a relative vibration between the reference surface and the test surface and a phase shift amount of the reference light when the nth first interference fringe is sensed, said processor obtains H(x,y) which minimizes a merit function M represented by

as a surface position at a point (x,y) on the test surface. - The apparatus according to any one of claims 1 to 5, characterized in that letting a(x,y), b(x,y), and H(x,y) be unknown constants at a point (x,y) on the test surface, c be a light speed, I(x,y,n) be an intensity of the first interference fringe sensed as an nth image of N (N is not less than 3) first interference fringes sensed whenever a frequency of the reference light and the measurement light is shifted by δf, and δ0(x,y) be a phase difference corresponding to an optical path length difference between the reference surface and the test surface when a first image of the first interference fringe is sensed, said processor obtains H(x,y) which minimizes a merit function M represented by

as a surface position at a point (x,y) on the test surface. - A measurement method for measuring a shape of a test surface (8) by detecting a first interference fringe generated by interference between reference light from a reference surface (11) and measurement light from the test surface, the method characterized by comprising steps of :sensing, together with the first interference fringe, a second interference fringe generated by interference between the reference light and light from a vibration detection surface (9) which has a set relative position with respect to the test surface and is irradiated with a part of the measurement light; andobtaining a relative vibration between the reference surface and the test surface by using data of the sensed second interference fringe, and obtaining the shape of the test surface by using the obtained relative vibration and data of the sensed first interference fringe.
Applications Claiming Priority (1)
| Application Number | Priority Date | Filing Date | Title |
|---|---|---|---|
| JP2012045786A JP5894464B2 (en) | 2012-03-01 | 2012-03-01 | Measuring device |
Publications (1)
| Publication Number | Publication Date |
|---|---|
| EP2634528A1 true EP2634528A1 (en) | 2013-09-04 |
Family
ID=47713816
Family Applications (1)
| Application Number | Title | Priority Date | Filing Date |
|---|---|---|---|
| EP13000561.4A Withdrawn EP2634528A1 (en) | 2012-03-01 | 2013-02-04 | Measurement apparatus for measuring shape of test object and measurement method |
Country Status (3)
| Country | Link |
|---|---|
| US (1) | US9052189B2 (en) |
| EP (1) | EP2634528A1 (en) |
| JP (1) | JP5894464B2 (en) |
Families Citing this family (2)
| Publication number | Priority date | Publication date | Assignee | Title |
|---|---|---|---|---|
| JP7801545B2 (en) * | 2022-03-25 | 2026-01-19 | 株式会社東京精密 | Surface profile measuring device and surface profile measuring method |
| CN116429017B (en) * | 2023-05-10 | 2026-02-27 | 东北大学 | A digital holographic three-dimensional measurement method and apparatus for phase shift of vibration of a test object |
Citations (2)
| Publication number | Priority date | Publication date | Assignee | Title |
|---|---|---|---|---|
| JPH08219738A (en) | 1995-02-16 | 1996-08-30 | Nikon Corp | Interferometer |
| JP2000275021A (en) | 1999-03-25 | 2000-10-06 | Nikon Corp | Surface shape measuring device |
Family Cites Families (4)
| Publication number | Priority date | Publication date | Assignee | Title |
|---|---|---|---|---|
| DE19944021A1 (en) * | 1998-09-14 | 2000-05-04 | Nikon Corp | Aspheric surface shape measuring apparatus has null element provided in optical path between light source and examined surface to convert spherical wave to desired aspherical wave |
| US6495819B1 (en) * | 2000-08-08 | 2002-12-17 | Southwest Research Institute | Dual-interferometer method for measuring bending of materials |
| JP2002202112A (en) * | 2000-11-06 | 2002-07-19 | Fujitsu Ltd | Shape measuring device |
| US8531677B2 (en) * | 2010-05-27 | 2013-09-10 | Corning Incorporated | Frequency-shifting interferometer with selective data processing |
-
2012
- 2012-03-01 JP JP2012045786A patent/JP5894464B2/en not_active Expired - Fee Related
-
2013
- 2013-02-04 EP EP13000561.4A patent/EP2634528A1/en not_active Withdrawn
- 2013-02-07 US US13/761,349 patent/US9052189B2/en not_active Expired - Fee Related
Patent Citations (2)
| Publication number | Priority date | Publication date | Assignee | Title |
|---|---|---|---|---|
| JPH08219738A (en) | 1995-02-16 | 1996-08-30 | Nikon Corp | Interferometer |
| JP2000275021A (en) | 1999-03-25 | 2000-10-06 | Nikon Corp | Surface shape measuring device |
Non-Patent Citations (2)
| Title |
|---|
| MELOZZI M ET AL: "VIBRATION-INSENSITIVE INTERFEROMETER FOR ON-LINE MEASUREMENTS", APPLIED OPTICS, OPTICAL SOCIETY OF AMERICA, WASHINGTON, DC; US, vol. 34, no. 25, 1 September 1995 (1995-09-01), pages 5595 - 5601, XP000522985, ISSN: 0003-6935, DOI: 10.1364/AO.34.005595 * |
| TAKEDA M ET AL: "FOURIER-TRANSFORM METHOD OF FRINGE-PATTERN ANALYSIS FOR COMPUTER-BASED TOPOGRAPHY AND INTERFEROMETRY", JOURNAL OF THE OPTICAL SOCIETY OF AMERICA, AMERICAN INSTITUTE OF PHYSICS, NEW YORK; US, vol. 72, no. 1, 1 January 1982 (1982-01-01), pages 156 - 160, XP000570893, ISSN: 0093-5433, DOI: 10.1364/JOSA.72.000156 * |
Also Published As
| Publication number | Publication date |
|---|---|
| JP5894464B2 (en) | 2016-03-30 |
| US20130229664A1 (en) | 2013-09-05 |
| US9052189B2 (en) | 2015-06-09 |
| JP2013181828A (en) | 2013-09-12 |
Similar Documents
| Publication | Publication Date | Title |
|---|---|---|
| KR101590241B1 (en) | Optical characteristics measuring apparatus, and optical characteristics measuring method | |
| CN104797903B (en) | Optical measuring method for obtaining surface topography by calibrating the direction of measuring head and measuring device with measuring head | |
| JP4378533B2 (en) | Calibration method for components of optical coherence tomography | |
| US6532073B2 (en) | Fringe analysis error detection method and fringe analysis error correction method | |
| US10746537B2 (en) | Radius-of-curvature measurement by spectrally-controlled interferometry | |
| EP2306144A1 (en) | Surface shape measurement apparatus | |
| EP1209442A2 (en) | Automated radius of curvature measurements | |
| JP2013092402A (en) | Multi-wavelength interferometer, measurement apparatus, and measurement method | |
| JP5648961B2 (en) | Spectral characteristic measuring apparatus and calibration method thereof | |
| CN103162621A (en) | Measuring apparatus including multi-wavelength interferometer | |
| EP2420796B1 (en) | Shape measuring method and shape measuring apparatus using white light interferometry | |
| EP1717546B1 (en) | Interferometer and method of calibrating the interferometer | |
| US20150077759A1 (en) | Compact, Slope Sensitive Optical Probe | |
| JP2013152191A (en) | Multi-wavelength interferometer | |
| CN101221042A (en) | Two-dimensional dispersion fringe analysis method for absolute distance measurement | |
| US9052189B2 (en) | Measurement apparatus for measuring shape of test object and measurement method | |
| EP2636988A1 (en) | Surface shape measurement method and measurement apparatus using wavelength scanning interferometry | |
| JP2012173218A (en) | Interferometer and measuring method | |
| JP5079755B2 (en) | Calibration method for components of optical coherence tomography | |
| JP2013029317A (en) | Optical tomographic image measuring apparatus and optical tomographic image measuring system | |
| RU2491505C1 (en) | Method of determining surface roughness | |
| JPH09196619A (en) | Measuring method and device for minute displacement | |
| JP5376284B2 (en) | Interferometry method and interferometer | |
| JP2014169983A (en) | Measuring apparatus, measuring method, and article manufacturing method | |
| US7898672B1 (en) | Real-time scanner-nonlinearity error correction for HDVSI |
Legal Events
| Date | Code | Title | Description |
|---|---|---|---|
| PUAI | Public reference made under article 153(3) epc to a published international application that has entered the european phase |
Free format text: ORIGINAL CODE: 0009012 |
|
| AK | Designated contracting states |
Kind code of ref document: A1 Designated state(s): AL AT BE BG CH CY CZ DE DK EE ES FI FR GB GR HR HU IE IS IT LI LT LU LV MC MK MT NL NO PL PT RO RS SE SI SK SM TR |
|
| AX | Request for extension of the european patent |
Extension state: BA ME |
|
| 17P | Request for examination filed |
Effective date: 20140304 |
|
| RBV | Designated contracting states (corrected) |
Designated state(s): AL AT BE BG CH CY CZ DE DK EE ES FI FR GB GR HR HU IE IS IT LI LT LU LV MC MK MT NL NO PL PT RO RS SE SI SK SM TR |
|
| STAA | Information on the status of an ep patent application or granted ep patent |
Free format text: STATUS: THE APPLICATION HAS BEEN WITHDRAWN |
|
| 18W | Application withdrawn |
Effective date: 20150529 |