EP2622326B1 - Method for activation of aqueous silver nanoparticle dispersions for surface enhanced raman spectroscopy - Google Patents
Method for activation of aqueous silver nanoparticle dispersions for surface enhanced raman spectroscopy Download PDFInfo
- Publication number
- EP2622326B1 EP2622326B1 EP11784577.6A EP11784577A EP2622326B1 EP 2622326 B1 EP2622326 B1 EP 2622326B1 EP 11784577 A EP11784577 A EP 11784577A EP 2622326 B1 EP2622326 B1 EP 2622326B1
- Authority
- EP
- European Patent Office
- Prior art keywords
- mol
- concentration
- dispersion
- solution
- activation
- Prior art date
- Legal status (The legal status is an assumption and is not a legal conclusion. Google has not performed a legal analysis and makes no representation as to the accuracy of the status listed.)
- Not-in-force
Links
Images


Classifications
-
- G—PHYSICS
- G01—MEASURING; TESTING
- G01N—INVESTIGATING OR ANALYSING MATERIALS BY DETERMINING THEIR CHEMICAL OR PHYSICAL PROPERTIES
- G01N21/00—Investigating or analysing materials by the use of optical means, i.e. using sub-millimetre waves, infrared, visible or ultraviolet light
- G01N21/62—Systems in which the material investigated is excited whereby it emits light or causes a change in wavelength of the incident light
- G01N21/63—Systems in which the material investigated is excited whereby it emits light or causes a change in wavelength of the incident light optically excited
- G01N21/65—Raman scattering
- G01N21/658—Raman scattering enhancement Raman, e.g. surface plasmons
-
- B—PERFORMING OPERATIONS; TRANSPORTING
- B82—NANOTECHNOLOGY
- B82Y—SPECIFIC USES OR APPLICATIONS OF NANOSTRUCTURES; MEASUREMENT OR ANALYSIS OF NANOSTRUCTURES; MANUFACTURE OR TREATMENT OF NANOSTRUCTURES
- B82Y15/00—Nanotechnology for interacting, sensing or actuating, e.g. quantum dots as markers in protein assays or molecular motors
-
- B—PERFORMING OPERATIONS; TRANSPORTING
- B82—NANOTECHNOLOGY
- B82Y—SPECIFIC USES OR APPLICATIONS OF NANOSTRUCTURES; MEASUREMENT OR ANALYSIS OF NANOSTRUCTURES; MANUFACTURE OR TREATMENT OF NANOSTRUCTURES
- B82Y30/00—Nanotechnology for materials or surface science, e.g. nanocomposites
-
- G—PHYSICS
- G01—MEASURING; TESTING
- G01N—INVESTIGATING OR ANALYSING MATERIALS BY DETERMINING THEIR CHEMICAL OR PHYSICAL PROPERTIES
- G01N33/00—Investigating or analysing materials by specific methods not covered by groups G01N1/00 - G01N31/00
- G01N33/48—Biological material, e.g. blood, urine; Haemocytometers
- G01N33/50—Chemical analysis of biological material, e.g. blood, urine; Testing involving biospecific ligand binding methods; Immunological testing
- G01N33/53—Immunoassay; Biospecific binding assay; Materials therefor
- G01N33/543—Immunoassay; Biospecific binding assay; Materials therefor with an insoluble carrier for immobilising immunochemicals
- G01N33/54313—Immunoassay; Biospecific binding assay; Materials therefor with an insoluble carrier for immobilising immunochemicals the carrier being characterised by its particulate form
- G01N33/54346—Nanoparticles
-
- G—PHYSICS
- G01—MEASURING; TESTING
- G01N—INVESTIGATING OR ANALYSING MATERIALS BY DETERMINING THEIR CHEMICAL OR PHYSICAL PROPERTIES
- G01N33/00—Investigating or analysing materials by specific methods not covered by groups G01N1/00 - G01N31/00
- G01N33/48—Biological material, e.g. blood, urine; Haemocytometers
- G01N33/50—Chemical analysis of biological material, e.g. blood, urine; Testing involving biospecific ligand binding methods; Immunological testing
- G01N33/58—Chemical analysis of biological material, e.g. blood, urine; Testing involving biospecific ligand binding methods; Immunological testing involving labelled substances
- G01N33/585—Chemical analysis of biological material, e.g. blood, urine; Testing involving biospecific ligand binding methods; Immunological testing involving labelled substances with a particulate label, e.g. coloured latex
- G01N33/587—Nanoparticles
-
- G—PHYSICS
- G01—MEASURING; TESTING
- G01N—INVESTIGATING OR ANALYSING MATERIALS BY DETERMINING THEIR CHEMICAL OR PHYSICAL PROPERTIES
- G01N21/00—Investigating or analysing materials by the use of optical means, i.e. using sub-millimetre waves, infrared, visible or ultraviolet light
- G01N21/62—Systems in which the material investigated is excited whereby it emits light or causes a change in wavelength of the incident light
- G01N21/63—Systems in which the material investigated is excited whereby it emits light or causes a change in wavelength of the incident light optically excited
- G01N21/65—Raman scattering
- G01N2021/653—Coherent methods [CARS]
- G01N2021/655—Stimulated Raman
-
- G—PHYSICS
- G01—MEASURING; TESTING
- G01N—INVESTIGATING OR ANALYSING MATERIALS BY DETERMINING THEIR CHEMICAL OR PHYSICAL PROPERTIES
- G01N21/00—Investigating or analysing materials by the use of optical means, i.e. using sub-millimetre waves, infrared, visible or ultraviolet light
- G01N21/62—Systems in which the material investigated is excited whereby it emits light or causes a change in wavelength of the incident light
- G01N21/63—Systems in which the material investigated is excited whereby it emits light or causes a change in wavelength of the incident light optically excited
- G01N21/65—Raman scattering
- G01N2021/653—Coherent methods [CARS]
- G01N2021/656—Raman microprobe
Definitions
- the present invention relates to a method for activation of aqueous silver nanoparticle dispersions for purposes of surface enhanced Raman spectroscopy, which represents a very promising and sensitive analytical method.
- SERS surface enhanced Raman scattering
- hot particles particles of a certain sizes which are referred to as "hot particles”. These particles' optimum size depends on the wavelength of the laser used for the excitation and ranges approximately from 70 nm to 200 nm for the excitation wavelengths in the range from 488 nm to 647 nm ( Emory S. R.et al., J Am Chem Soc 120, 1998 ). For the commonly used argon lasers (wavelength of 514.5 nm), silver particles of the size of about 90 nm are the most effective ones.
- the most frequently used activation agents of the silver nanoparticles include halide ions, particularly chlorides.
- halide ions particularly chlorides.
- the state-of-art procedures of silver nanoparticle activation by means of chloride ion solutions employ the final concentrations in the range of from 0.001 mol.dm -3 to 0.02 mol.dm -3 ( Leopold, N. and Lendl, B. J Phys Chem B 107, 2003 ; Michaels A. et al., J Am Chem Soc 121, 1999 ; Leng W. N.
- the object of the invention is a method for a fast activation of aqueous dispersions of silver nanoparticles for purposes of surface enhanced Roman spectroscopy, wherein a solution of chloride ions is added to the aqueous dispersion of silver nanoparticles in the presence of oxygen in such an amount that the final chloride ion concentration in the activated dispersion ranges from 0.4 mol.dm -3 to 1 mol.dm -3 .
- the advantage of the method of activation according to the present invention is that it allows to prepare silver particles suitable also for the application in surface enhanced Raman spectroscopy that uses lasers with the wavelength in a near-infrared area.
- the re-crystallization and activation occurs in the presence of oxygen.
- the presence of oxygen in the activated dispersion is an important requirement for the nanoparticle recrystallization and activation.
- the amount of oxygen naturally dissolved in water under standard conditions is sufficient for a successful course of the activation.
- more oxygen can be added into the dispersion during the activation.
- the adding of oxygen can be performed, e.g., by several short shakings of the dispersion during the activation, by a vigorous agitation, by adding oxygen from a container, by chemically preparing oxygen (e.g., using a chemical source of oxygen) or by any other suitable method.
- large aggregates of the initial nanoparticles are formed that do not manifest any surface enhancement of Raman signal.
- the final chloride ion concentration in the activated silver nanoparticle dispersion is in the range of from 0.4 mol.d -3 to 1 mol.dm -3 , more preferably 0.4 to 0.8 mol.dm -3
- the concentration of chloride ions in the chloride ion stock solutions used for the activation is preferably in the range of from 0.125 mol.dm -3 to saturated solution concentration, more preferably 1 mol.dm -3 to saturated solution concentration, most preferably 1 mol.dm -3 to 4 mol.dm -3 .
- any water-soluble salt containing the chloride anion can be used as the source of chloride ions, provided that its stock solution can be prepared with a sufficient concentration, i.e. if the concentration of the chloride ions in the saturated solution thereof is sufficient for achieving the required final chloride ion concentration.
- the cation contained in that salt should not interact with the activated silver nanoparticle dispersion.
- chlorides of alkali metals i.e. metals from the IA group of the periodic table of elements
- ammonium chloride are suitable salts.
- the initial size of silver nanoparticles in the dispersion before the activation is typically in the range of from 10 nm to 100 nm.
- the final Ag concentration in the activated silver nanoparticle dispersion is typically in the range of from 10 -7 mol.dm -3 to 0.05 mol.dm -3 , preferably 10 -6 mol.dm -3 to 0.01 mol.dm -3 , more preferably 10 -4 mol.dm -3 to 10 -3 mol.dm -3 .
- Sodium chloride was obtained from Sigma-Aldrich.
- Silver nanoparticles were prepared by means of reduction of silver ion ammonium complex with maltose, glucose, ascorbic acid and sodium tetrahydridoborate ( Kvitek et al., J Mater Chem 15, 2005 , Panacek et al., J Phys Chem B 110, 2006 , Creighton et al., J Chem Soc Faraday Trans II 75, 1979 ).
- the starting compounds were obtained from Sigma-Aldrich.
- the size of nanoparticles was measured by Zetasizer Nano-ZS (Malvern, UK) instrument using the DLS (Dynamic Light Scattering) principle.
- the prepared dispersions were also characterized by UV-Vis absorption spectroscopy using Specord S600 spectrophotometer (Analytic Jena AG, Germany).
- the size of silver nanoparticles and their polydispersity was also verified by transmission electron microscopy (TEM) by JEM 2010 instrument (Jeol, Japan) using the accelerating voltage of 160 kV.
- the surface enhanced Raman spectra were measured on Jobin-Yvon T 64 000 instruments with the excitation wavelengths of 488 nm and 514.5 nm (Jobin-Yvon, France), HORIBA iHR550 with the excitation wavelength of 532 nm, Thermo Scientific DXR Microscope with the excitation wavelengths of 633 nm and 780 nm (Thermo Scientific, USA) and Nicolet FT-IR 6700 (Nicolet, USA) equipped with Raman module (NXR FT-Nicolet, USA) with the excitation wavelength of 1064 nm.
- 0.2 ml of a dispersion of silver nanoparticles with the average size of 25 nm and Ag concentration of 0.001 mol.dm -3 in the dispersion was transferred into a 3 ml cuvette. Then 0.7 ml of distilled water was added. After stirring the mixture, 0.1 ml of NaCl solution with the concentration of 4 mol.dm -3 was added. The final concentration of sodium chloride in the solution was 0.4 mol.dcm -3 . The mixture was vigorously stirred for 10 seconds and then the changes in the silver particle dispersion characteristics were measured using the following methods: DLS, UV-Vis absorption spectroscopy, and TEM.
- 0.2 ml of a dispersion of silver nanoparticles with the average size of 25 nm and Ag concentration of 0.001 mol.dm -3 in the dispersion was transferred into a 3 ml cuvette. Then 0.7 ml of distilled water was added. After stirring the mixture, 0.1 ml of NaCl solution with the concentration of 1 mol.dm -3 was added. The final concentration of sodium chloride in the solution was 0.1 mol.dm -3 . The mixture was vigorously stirred for 10 seconds and then the changes of the silver particle dispersion characteristics were measured using the following methods: DLS, UV-Vis absorption spectroscopy, and TEM. When the final chloride ion concentration in the activated dispersion is 0.1 mol.dm -3 , the particles recrystallize only partially and incompletely within the same time as in Example 1 ( Fig. 4 ).
- 0.1 ml of a dispersion of silver nanoparticles with the average size of 25 nm and Ag concentration of 0.001 mol.dm -3 in the dispersion was transferred into a 3 ml cuvette. Then 0.8 ml of distilled water was added. After stirring the mixture, 0.1 ml of NaCl solution with the concentration of 4 mol.dm -3 was added. The final concentration of sodium chloride in the solution was 0.4 mol.dm -3 . The mixture was vigorously stirred for 10 seconds and then the changes of the silver particle dispersion characteristics were measured using the following methods: DLS, UV-Vis absorption spectroscopy, and TEM. The course of the particle size changes was similar to the data presented in Example 1 ( Fig 3 ). However, after 15 minutes following the addition of chloride anions, the final particle size determined by DLS method was 250 nm.
- 0.2 ml of a dispersion of silver nanoparticles with the average size of 25 nm and Ag concentration of 0.001 mol.dm -3 in the dispersion was transferred into a 3 ml cuvette. Then 0.7 ml of distilled water was added. After stirring the mixture, 0.1 ml of NaCl solution with the concentration of 4 mol.dm -3 was added. The final concentration of sodium chloride in the solution was 0.4 mol.dm -3 . The mixture was vigorously stirred for 10 seconds and then 10 ⁇ l of adenine solution (or alternatively another analyzed or examined substance) with the concentration of 0.001 mol.dm -3 was added to the mixture.
- 0.2 ml of a dispersion of silver nanoparticles with the average size of 200 nm and Ag concentration of 0.001 mol.dm -3 in the dispersion was transferred into a 3 ml cuvette. Then 0.7 ml of distilled water was added. After stirring the mixture, 0.1 ml of NaCl solution with a concentration of 1 mol.dm -3 was added. The final concentration of sodium chloride in the solution was 0.1 mol.dm -3 . The mixture was vigorously stirred for 10 seconds and then 10 ⁇ l of adenine solution (or alternatively another analyzed or examined substance) with the concentration of 0.001 mol.dm -3 was added to the mixture. Surface enhanced Raman spectrum was recorded after 10 minutes following the sodium chloride solution addition. The surface enhanced Raman spectrum of adenine was similar to spectrum presented in Example 6 ( Fig 6 ). The enhancement factor was estimated to approx. 5 ⁇ 10 4 .
- 0.2 ml of a dispersion of silver nanoparticles with the average size of 25 nm and Ag concentration of 0.001 mol.dm -3 in the dispersion was transferred into a 3 ml cuvette. Then 0.6 ml of distilled water was added. After stirring the mixture, 0.2 ml of NaCl solution with a concentration of 4 mol.dm -3 was added. The final concentration of sodium chloride in the solution was 0.8 mol.dm -3 . The mixture was vigorously stirred for 10 seconds and then 10 ⁇ l of adenine solution (or alternatively another analyzed or examined substance) with the concentration of 10 -6 mol.dm -3 was added to the mixture.
- the final concentration of sodium chloride in the solution was 0.8 mol.dm -3 .
- Surface enhanced Raman spectrum was recorded after 6 minutes following the sodium chloride solution addition.
- the surface enhanced Raman spectrum of adenine was similar to spectrum presented in Example 6 ( Fig 6 ).
- the enhancement factor was estimated to approx. 6 ⁇ 10 7 .
Landscapes
- Engineering & Computer Science (AREA)
- Health & Medical Sciences (AREA)
- Chemical & Material Sciences (AREA)
- Life Sciences & Earth Sciences (AREA)
- Immunology (AREA)
- Nanotechnology (AREA)
- Molecular Biology (AREA)
- Physics & Mathematics (AREA)
- Hematology (AREA)
- General Physics & Mathematics (AREA)
- Urology & Nephrology (AREA)
- Biomedical Technology (AREA)
- General Health & Medical Sciences (AREA)
- Biochemistry (AREA)
- Analytical Chemistry (AREA)
- Pathology (AREA)
- Biotechnology (AREA)
- Cell Biology (AREA)
- Microbiology (AREA)
- Food Science & Technology (AREA)
- Medicinal Chemistry (AREA)
- Crystallography & Structural Chemistry (AREA)
- Materials Engineering (AREA)
- Condensed Matter Physics & Semiconductors (AREA)
- Composite Materials (AREA)
- Nuclear Medicine, Radiotherapy & Molecular Imaging (AREA)
- Investigating, Analyzing Materials By Fluorescence Or Luminescence (AREA)
- Manufacture Of Metal Powder And Suspensions Thereof (AREA)
Description
- The present invention relates to a method for activation of aqueous silver nanoparticle dispersions for purposes of surface enhanced Raman spectroscopy, which represents a very promising and sensitive analytical method.
- The discovery of surface enhanced Raman scattering (SERS) on a silver electrode by Fleischmann in 1974, and especially its re-discovery on colloidal silver particles by Creighton in 1977 started the extensive development of a new and very sensitive analytical method that allows the detection of molecules in the concentration range from pico- to femtomols (Doerning W. E. and Nie S. M., J Phys Chem B, 106, 2002). A high enhancement of SERS, reaching the values of up to 1015, even allowed the detection of individual molecule adsorbed on a single silver nanoparticle (Michaels M. et al. J Am Chem Soc, 121, 1999; Nie S. and Emory S. R., Science, 275, 1997). Some studies have shown that so high a value of the enhancement can be achieved only on particles of a certain sizes which are referred to as "hot particles". These particles' optimum size depends on the wavelength of the laser used for the excitation and ranges approximately from 70 nm to 200 nm for the excitation wavelengths in the range from 488 nm to 647 nm (Emory S. R.et al., J Am Chem Soc 120, 1998). For the commonly used argon lasers (wavelength of 514.5 nm), silver particles of the size of about 90 nm are the most effective ones. Based on the mentioned dependence of the size of the "hot particles" for a given laser wavelength, it can be expected that when using lasers in the red (785 nm) and near-infrared area (1064 nm), the maximum enhancement of Raman signal should be obtained on silver particles of the size of around 400 nm. Unfortunately, particles of this dimension are unstable in solution and they usually sediment within a few hours. Silver nanoparticles of the size ranging from units of nanometers to tens of nanometers can be stable for several months or years, even without any extra stabilization. However, these small particles themselves usually do not provide surface enhancement of the Raman signal. For this purpose, they must be activated for example by the addition of some inorganic ion solution. The most frequently used activation agents of the silver nanoparticles include halide ions, particularly chlorides. However, the mechanism of the activation of these ions is not yet fully explained; one of possible explanations of this effect is based on a partial aggregation of silver nanoparticles caused by mentioned ions. The state-of-art procedures of silver nanoparticle activation by means of chloride ion solutions employ the final concentrations in the range of from 0.001 mol.dm-3 to 0.02 mol.dm-3 (Leopold, N. and Lendl, B. J Phys Chem B 107, 2003; Michaels A. et al., J Am Chem Soc 121, 1999; Leng W. N. et al., J Raman Spectrosc 37, 2006; Zhang P. X. et al., J Raman Spectrosc 21, 1990; Campbell M. et al., J Raman Spectrosc 30, 1999; Doering W. E. and Nie S. M., J Phys Chem B 106, 2002). But in these cases, a slow aggregation of silver nanoparticles occurs, resulting in Raman signal irreproducibility and often also in a long activation time.
- The object of the invention is a method for a fast activation of aqueous dispersions of silver nanoparticles for purposes of surface enhanced Roman spectroscopy, wherein a solution of chloride ions is added to the aqueous dispersion of silver nanoparticles in the presence of oxygen in such an amount that the final chloride ion concentration in the activated dispersion ranges from 0.4 mol.dm-3 to 1 mol.dm-3.
- The advantage of the method of activation according to the present invention is that it allows to prepare silver particles suitable also for the application in surface enhanced Raman spectroscopy that uses lasers with the wavelength in a near-infrared area.
- In case of the method according to the present invention, gradual recrystallization of nanoparticles occurs. After about 15 minutes following the addition of the chloride anions with the final concentration of 0.4 mol.dm-3, particles of the size of about 400 nm are already present in the activated dispersion. This particle size modification process caused by the recrystallization is reproducible. Hence another advantage of the present invention is that it allows a fast and reproducible activation of silver nanoparticles for the purposes of SERS through their recrystallization, which is different from the state of the art methods which lead to a slow and often irreproducible aggregation of silver particles.
- It is an aspect of the invention that the re-crystallization and activation occurs in the presence of oxygen. The presence of oxygen in the activated dispersion is an important requirement for the nanoparticle recrystallization and activation. Usually, the amount of oxygen naturally dissolved in water under standard conditions (ambient temperature, atmospheric pressure) is sufficient for a successful course of the activation. Where necessary, more oxygen can be added into the dispersion during the activation. The adding of oxygen can be performed, e.g., by several short shakings of the dispersion during the activation, by a vigorous agitation, by adding oxygen from a container, by chemically preparing oxygen (e.g., using a chemical source of oxygen) or by any other suitable method. In total absence of oxygen in the activated dispersion, large aggregates of the initial nanoparticles are formed that do not manifest any surface enhancement of Raman signal.
- When using a lower final chloride ion concentrations in the activated dispersion (about 0.1 mol.dm-3), also in the presence of oxygen, the activation and recrystallization process is not as fast and reproducible as in the case of the higher final chloride anion concentrations. Moreover, in these cases the particles recrystallize only partially within the same time period. For that reason, it is advantageous to use higher final chloride ion concentrations, i.e. 0.4 mol.dm-3 and higher.
- The final chloride ion concentration in the activated silver nanoparticle dispersion is in the range of from 0.4 mol.d-3 to 1 mol.dm-3, more preferably 0.4 to 0.8 mol.dm-3
- For the activation of silver nanoparticles for the spectroscopy using a laser with the wavelength of 1064 nm, it is appropriate to use higher final chloride ion concentrations in the final activated dispersion, particularly the concentrations of from 0.4 mol.dm-3 to 0.8 mol.dm-3.
- The concentration of chloride ions in the chloride ion stock solutions used for the activation is preferably in the range of from 0.125 mol.dm-3 to saturated solution concentration, more preferably 1 mol.dm-3 to saturated solution concentration, most preferably 1 mol.dm-3 to 4 mol.dm-3.
- Any water-soluble salt containing the chloride anion can be used as the source of chloride ions, provided that its stock solution can be prepared with a sufficient concentration, i.e. if the concentration of the chloride ions in the saturated solution thereof is sufficient for achieving the required final chloride ion concentration. Also, the cation contained in that salt should not interact with the activated silver nanoparticle dispersion. For example, chlorides of alkali metals (i.e. metals from the IA group of the periodic table of elements) and ammonium chloride are suitable salts.
- The initial size of silver nanoparticles in the dispersion before the activation is typically in the range of from 10 nm to 100 nm.
- The final Ag concentration in the activated silver nanoparticle dispersion is typically in the range of from 10-7 mol.dm-3 to 0.05 mol.dm-3, preferably 10-6 mol.dm-3 to 0.01 mol.dm-3, more preferably 10-4 mol.dm-3 to 10-3 mol.dm-3.
-
-
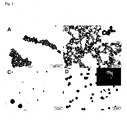
Figure 1 shows the transmission electron microscopy images of the primary silver nanoparticles and the transformed silver particles formed during 15 minutes after the addition of the sodium chloride solution with the concentration of 4 mol.dm-3 (the final concentration of 0.4 mol.dm-3). (A) primary silver nanoparticles with the size of approx. 20 nm; (B) silver particles formed after 30 seconds; (C) after 2 minutes; and (D) after 15 minutes following the addition of NaCl solution with the concentration of 4 mol.dm-3. -
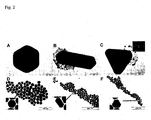
Figure 2 represents transmission electron microscopy images of recrystallized particles (A, B, C) with various morphologies of the size of several hundred nanometers formed 15 minutes after the addition of sodium chloride solution (the final concentration of 0.4 mol.dm-3) and transmission electron microscopy images of primary non-activated silver nanoparticles (D, E, F) with the same crystal shapes (see insets) before the addition of sodium chloride solution. -
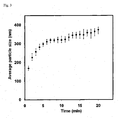
Figure 3 shows the time-dependent change of the average size of silver particles recorded during 20 minutes after the addition of 4M sodium chloride solution (the final concentration of 0.4 mol.dm-3). The data presented in the chart are an average obtained from 12 independent measurements performed during one year, wherein the error bars represent maximum and minimum determined values of silver particle average sizes. The average particle sizes were determined by DLS method. -
Figure 4 shows transmission electron microscopy images of silver nanoparticles of the initial size of approx. 20 nm transformed during 15 minutes following the addition of the sodium chloride solution with the concentration of 1 mol.dm-3 (the final concentration of 0.1 mol.dm-3). -
Figure 5 shows (A) transmission electron microscopy images of silver particle aggregates obtained after 15 minutes following the addition of sodium chloride solution (the final concentration of 0.4 mol.dm-3) to particles of the size of approx. 20 nm in the absence of oxygen in the activated dispersion, and (B) the detail of these aggregates' surface. -
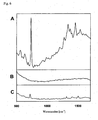
Figure 6 shows Raman spectra and surface enhanced Raman spectra of adenine recorded using a laser with the wavelength of 1064 nm. (A) Surface enhanced Raman spectrum of adenine with the concentration of 10-5 mol.dm-3 recorded in the presence of silver particles transformed by means of sodium chloride solution with the final concentration of 0.4 mol.dm-3. (B) Raman spectrum of adenine with the concentration of 10-5 mol.dm-3 recorded using silver nanoparticles of the size approx. 20 nm without the sodium chloride solution addition. (C) Raman spectrum of adenine of concentration equal to 10-1 mol.dm-3. - Sodium chloride was obtained from Sigma-Aldrich. Silver nanoparticles were prepared by means of reduction of silver ion ammonium complex with maltose, glucose, ascorbic acid and sodium tetrahydridoborate (Kvitek et al., J Mater Chem 15, 2005, Panacek et al., J Phys Chem B 110, 2006, Creighton et al., J Chem Soc Faraday Trans II 75, 1979). The starting compounds were obtained from Sigma-Aldrich.
- The size of nanoparticles was measured by Zetasizer Nano-ZS (Malvern, UK) instrument using the DLS (Dynamic Light Scattering) principle. The prepared dispersions were also characterized by UV-Vis absorption spectroscopy using Specord S600 spectrophotometer (Analytic Jena AG, Germany). The size of silver nanoparticles and their polydispersity was also verified by transmission electron microscopy (TEM) by JEM 2010 instrument (Jeol, Japan) using the accelerating voltage of 160 kV. The surface enhanced Raman spectra were measured on Jobin-Yvon T 64 000 instruments with the excitation wavelengths of 488 nm and 514.5 nm (Jobin-Yvon, France), HORIBA iHR550 with the excitation wavelength of 532 nm, Thermo Scientific DXR Microscope with the excitation wavelengths of 633 nm and 780 nm (Thermo Scientific, USA) and Nicolet FT-IR 6700 (Nicolet, USA) equipped with Raman module (NXR FT-Nicolet, USA) with the excitation wavelength of 1064 nm.
- 0.2 ml of a dispersion of silver nanoparticles with the average size of 25 nm and Ag concentration of 0.001 mol.dm-3 in the dispersion was transferred into a 3 ml cuvette. Then 0.7 ml of distilled water was added. After stirring the mixture, 0.1 ml of NaCl solution with the concentration of 4 mol.dm-3 was added. The final concentration of sodium chloride in the solution was 0.4 mol.dcm-3. The mixture was vigorously stirred for 10 seconds and then the changes in the silver particle dispersion characteristics were measured using the following methods: DLS, UV-Vis absorption spectroscopy, and TEM. After 15 minutes following the addition of chloride anions, particles with the size of 400 nm were already present in the activated dispersion (
Fig. 1 ,2 ). The process of the particle size change caused by the recrystallization is reproducible, as it was shown in the course of 12 measurements carried out during one year (Fig. 3 ). - 0.2 ml of a dispersion of silver nanoparticles with the average size of 25 nm and Ag concentration of 0.001 mol.dm-3 in the dispersion was transferred into a 3 ml cuvette. Then 0.7 ml of distilled water was added. After stirring the mixture, 0.1 ml of NaCl solution with the concentration of 1 mol.dm-3 was added. The final concentration of sodium chloride in the solution was 0.1 mol.dm-3. The mixture was vigorously stirred for 10 seconds and then the changes of the silver particle dispersion characteristics were measured using the following methods: DLS, UV-Vis absorption spectroscopy, and TEM. When the final chloride ion concentration in the activated dispersion is 0.1 mol.dm-3, the particles recrystallize only partially and incompletely within the same time as in Example 1 (
Fig. 4 ). - 0.2 ml of a dispersion of silver nanoparticles with the average size of 25 nm and Ag concentration of 0.001 mol.dm-3 in the dispersion was transferred into a 3 ml cuvette. Then 0.7 ml of distilled water was added. After stirring the mixture, 0.1 ml of NaCl solution with the concentration of 4 mol.dm-3 was added. The final concentration of sodium chloride in the solution was 0.4 mol.dm-3. All air oxygen has been removed from all solutions by a thorough bubbling with argon and the transformation was carried out in the absence of air. In this case, the primary particle recrystallization did not occur, but only their aggregation. On TEM images, we can observe aggregates of the size of several units of micrometers (
Fig. 5 ); these aggregates prepared in the absence of oxygen are not suitable for use in the SERS. - 0.1 ml of a dispersion of silver nanoparticles with the average size of 25 nm and Ag concentration of 0.001 mol.dm-3 in the dispersion was transferred into a 3 ml cuvette. Then 0.8 ml of distilled water was added. After stirring the mixture, 0.1 ml of NaCl solution with the concentration of 4 mol.dm-3 was added. The final concentration of sodium chloride in the solution was 0.4 mol.dm-3. The mixture was vigorously stirred for 10 seconds and then the changes of the silver particle dispersion characteristics were measured using the following methods: DLS, UV-Vis absorption spectroscopy, and TEM. The course of the particle size changes was similar to the data presented in Example 1 (
Fig 3 ). However, after 15 minutes following the addition of chloride anions, the final particle size determined by DLS method was 250 nm. - 0.8 ml of a dispersion of silver nanoparticles with the average size of 25 nm and Ag concentration of 0.001 mol.dm-3 in the dispersion was transferred into a 3 ml cuvette. Then 0.1 ml of distilled water was added. After stirring the mixture, 0.1 ml of NaCl solution with the concentration of 4 mol.dm-3 was added. The final concentration of sodium chloride in the solution was 0.4 mol.dm-3. The mixture was vigorously stirred for 10 seconds and then the changes of the silver particle dispersion characteristics were measured using the following methods: DLS, UV-Vis absorption spectroscopy, and TEM. The course of the particle size changes was similar to the data presented in Example 1 (
Fig 3 ). However, after 20 minutes following the addition of chloride anions, the final particle size determined by DLS method was 700 nm. - 0.2 ml of a dispersion of silver nanoparticles with the average size of 25 nm and Ag concentration of 0.001 mol.dm-3 in the dispersion was transferred into a 3 ml cuvette. Then 0.7 ml of distilled water was added. After stirring the mixture, 0.1 ml of NaCl solution with the concentration of 4 mol.dm-3 was added. The final concentration of sodium chloride in the solution was 0.4 mol.dm-3. The mixture was vigorously stirred for 10 seconds and then 10 µl of adenine solution (or alternatively another analyzed or examined substance) with the concentration of 0.001 mol.dm-3 was added to the mixture. Surface enhanced Raman spectrum was recorded after 15 minutes following the sodium chloride solution addition (
Fig. 6 ). For the evaluation of enhancement, the Raman spectrum of adenine solution (concentration equal to 0.1 mol.dm-3) was measured without the presence of activated silver particles. The enhancement factor was determined by comparing the intensities of the most intensive peak in spectrum of adenine at 734 cm-1 and it was estimated to approx. 105. - 1 ml of a dispersion of silver nanoparticles with the average size of 25 nm and Ag concentration of 0.001 mol.dm-3 in the dispersion was transferred into a 10 ml flask. Then 3.5 ml of distilled water was added. After stirring the mixture, 0.5 ml of KCl solution with the concentration of 4 mol.dm-3 was added. The final concentration of potassium chloride in the solution was 0.4 mol.dm-3. The mixture was vigorously stirred for 10 seconds and then 10 µl of adenine solution (or alternatively another analyzed or examined substance) with the concentration of 0.0005 mol.dm-3 was added to the mixture. Surface enhanced Raman spectrum was recorded after 3 minutes following the potassium chloride solution addition. The surface enhanced Raman spectrum of adenine was similar to spectrum presented in Example 6 (
Fig 6 ). The enhancement factor was estimated to approx. 5·105. - 1 ml of a dispersion of silver nanoparticles with the average size of 60 nm and Ag concentration of 0.001 mol.dm-3 in the dispersion was transferred into a 10 ml flask. Then 3.5 ml of distilled water was added. After stirring the mixture, 0.5 ml of NaCl solution with the concentration of 1 mol.dm-3 was added. The final concentration of sodium chloride in the solution was 0.1 mol.dm-3. The mixture was vigorously stirred for 10 seconds and then 10 µl of adenine solution (or alternatively another analyzed or examined substance) with the concentration of 0.001 mol.dm-3 was added to the mixture. Surface enhanced Raman spectrum was recorded after 15 minutes following the sodium chloride solution addition. The surface enhanced Raman spectrum of adenine was similar to spectrum presented in Example 6 (
Fig 6 ). The enhancement factor was estimated to approx. 2·105. - 0.2 ml of a dispersion of silver nanoparticles with the average size of 200 nm and Ag concentration of 0.001 mol.dm-3 in the dispersion was transferred into a 3 ml cuvette. Then 0.7 ml of distilled water was added. After stirring the mixture, 0.1 ml of NaCl solution with a concentration of 1 mol.dm-3 was added. The final concentration of sodium chloride in the solution was 0.1 mol.dm-3. The mixture was vigorously stirred for 10 seconds and then 10 µl of adenine solution (or alternatively another analyzed or examined substance) with the concentration of 0.001 mol.dm-3 was added to the mixture. Surface enhanced Raman spectrum was recorded after 10 minutes following the sodium chloride solution addition. The surface enhanced Raman spectrum of adenine was similar to spectrum presented in Example 6 (
Fig 6 ). The enhancement factor was estimated to approx. 5·104. - 0.2 ml of a dispersion of silver nanoparticles with the average size of 25 nm and Ag concentration of 0.001 mol.dm-3 in the dispersion was transferred into a 3 ml cuvette. Then 0.6 ml of distilled water was added. After stirring the mixture, 0.2 ml of NaCl solution with a concentration of 4 mol.dm-3 was added. The final concentration of sodium chloride in the solution was 0.8 mol.dm-3. The mixture was vigorously stirred for 10 seconds and then 10 µl of adenine solution (or alternatively another analyzed or examined substance) with the concentration of 10-6 mol.dm-3 was added to the mixture. The final concentration of sodium chloride in the solution was 0.8 mol.dm-3. Surface enhanced Raman spectrum was recorded after 6 minutes following the sodium chloride solution addition. The surface enhanced Raman spectrum of adenine was similar to spectrum presented in Example 6 (
Fig 6 ). The enhancement factor was estimated to approx. 6·107. - 1 ml of a dispersion of silver nanoparticles with the average size of 25 nm and Ag concentration of 0.001 mol.dm-3 in the dispersion was transferred into a 10 ml flask. Then 3.5 ml of distilled water was added. After stirring the mixture, 0.5 ml of KCl solution with the concentration of 4 mol.dm-3 was added. The final concentration of potassium chloride in the solution was 0.4 mol.dm-3. The mixture was vigorously stirred for 10 seconds and then 10 µl of adenine solution (or alternatively another analyzed or examined substance) with the concentration of 0.001 mol.dm-3 was added to the mixture. Surface enhanced Raman spectrum was recorded after 6 minutes following the potassium chloride solution addition. The surface enhanced Raman spectrum of adenine was similar to spectrum presented in Example 6 (
Fig 6 ). The enhancement factor was estimated to approx. 105. - 1 ml of a dispersion of silver nanoparticles with the average size of 25 nm and Ag concentration of 0.001 mol.dm-3 in the dispersion was transferred into a 10 ml flask. Then 3.5 ml of distilled water was added. After stirring the mixture, 0.5 ml of KCl solution with the concentration of 4 mol.dm-3 was added. The final concentration of potassium chloride in the solution was 0.4 mol.dm-3. The mixture was vigorously stirred for 10 seconds and then 10 µl of adenine solution (or alternatively another analyzed or examined substance) with the concentration of 0.001 mol.dm-3 was added to the mixture. Surface enhanced Raman spectrum was recorded after 6 minutes following the potassium chloride solution addition. The surface enhanced Raman spectrum of adenine was similar to spectrum presented in Example 6 (
Fig 6 ). The enhancement factor was estimated to approx. 8·104.
Claims (5)
- A method for activation of aqueous dispersions of silver nanoparticles for purposes of surface enhanced Raman spectroscopy, wherein a solution of chloride ions is added to the aqueous dispersion of silver nanoparticles in the presence of oxygen, characterized in that the final chloride ion concentration in the activated dispersion ranges from 0.4 mol.dm-3 to 1 mol.dm-3.
- The method according to claim 1, characterized in that the final chloride ion concentration in the activated dispersion ranges from 0.4 mol.dm-3 to 0.8 mol.dm-3.
- The method according to claim 1, characterized in that oxygen is added to the dispersion in the course of the activation.
- The method according to claim 1, characterized in that the initial size of silver nanoparticles in the dispersion before the activation is in the range of from 10 nm to 100 nm.
- The method according to claim 1, characterized in that a water-soluble salt containing the chloride anion is used as the source of chloride ions.
Applications Claiming Priority (2)
| Application Number | Priority Date | Filing Date | Title |
|---|---|---|---|
| CZ2010-708A CZ304231B6 (en) | 2010-09-29 | 2010-09-29 | Method for activation of aqueous dispersions of silver nanoparticles for purposes of surface enhanced Raman spectroscopy |
| PCT/CZ2011/000083 WO2012041262A1 (en) | 2010-09-29 | 2011-08-29 | Method for activation of aqueous silver nanoparticle dispersions for surface enhanced raman spectroscopy |
Publications (2)
| Publication Number | Publication Date |
|---|---|
| EP2622326A1 EP2622326A1 (en) | 2013-08-07 |
| EP2622326B1 true EP2622326B1 (en) | 2014-07-30 |
Family
ID=44993424
Family Applications (1)
| Application Number | Title | Priority Date | Filing Date |
|---|---|---|---|
| EP11784577.6A Not-in-force EP2622326B1 (en) | 2010-09-29 | 2011-08-29 | Method for activation of aqueous silver nanoparticle dispersions for surface enhanced raman spectroscopy |
Country Status (3)
| Country | Link |
|---|---|
| EP (1) | EP2622326B1 (en) |
| CZ (1) | CZ304231B6 (en) |
| WO (1) | WO2012041262A1 (en) |
Families Citing this family (5)
| Publication number | Priority date | Publication date | Assignee | Title |
|---|---|---|---|---|
| CZ2014771A3 (en) * | 2014-11-10 | 2015-12-30 | Univerzita Palackého v Olomouci | Process for preparing layers of silver colloidal particles on glass substrate for purposes of surface-enhanced Raman spectroscopy, a layer of silver colloidal particles on glass substrate and use of such layer |
| CZ309424B6 (en) * | 2015-04-29 | 2022-12-28 | Univerzita Palackého v Olomouci | A method of preparing a magnetic composite for the purposes of surface-enhanced Raman spectroscopy, a magnetic composite and its use |
| CN112213294A (en) * | 2020-09-22 | 2021-01-12 | 立穹(上海)光电科技有限公司 | Method for rapidly detecting sildenafil in health-care product |
| CN112683877B (en) * | 2020-12-03 | 2022-08-16 | 苏州大学 | Surface-enhanced Raman substrate based on silver pyramid-shaped nanoparticles and preparation method thereof |
| CN115184334B (en) * | 2022-07-08 | 2024-10-25 | 西安交通大学 | A Raman spectroscopy detection method based on colloidal silver gradient aggregation effect |
-
2010
- 2010-09-29 CZ CZ2010-708A patent/CZ304231B6/en not_active IP Right Cessation
-
2011
- 2011-08-29 WO PCT/CZ2011/000083 patent/WO2012041262A1/en not_active Ceased
- 2011-08-29 EP EP11784577.6A patent/EP2622326B1/en not_active Not-in-force
Also Published As
| Publication number | Publication date |
|---|---|
| EP2622326A1 (en) | 2013-08-07 |
| WO2012041262A1 (en) | 2012-04-05 |
| CZ304231B6 (en) | 2014-01-15 |
| CZ2010708A3 (en) | 2012-04-11 |
Similar Documents
| Publication | Publication Date | Title |
|---|---|---|
| Wilhelm et al. | Water dispersible upconverting nanoparticles: effects of surface modification on their luminescence and colloidal stability | |
| Cañamares et al. | Comparative SERS effectiveness of silver nanoparticles prepared by different methods: A study of the enhancement factor and the interfacial properties | |
| Dong et al. | Ratio fluorescent hybrid probe for visualized fluorescence detection of H2O2 in vitro and in vivo | |
| Mahmoud et al. | Gold nanostars as a colloidal substrate for in-solution SERS measurements using a handheld Raman spectrometer | |
| Narband et al. | The interaction between gold nanoparticles and cationic and anionic dyes: enhanced UV-visible absorption | |
| Esmail et al. | Violuric acid carbon dots as a highly fluorescence probe for ultrasensitive determination of Zn (II) in tomato paste | |
| Szczeszak et al. | Spectroscopic, structural and in vitro cytotoxicity evaluation of luminescent, lanthanide doped core@ shell nanomaterials GdVO4: Eu3+ 5%@ SiO2@ NH2 | |
| Al-Thabaiti et al. | Protein interactions with silver nanoparticles: Green synthesis, and biophysical approach | |
| Liu et al. | The synthesis of water-dispersible zinc doped AgInS2 quantum dots and their application in Cu2+ detection | |
| Garg et al. | A sensitive turn on fluorescent probe for detection of biothiols using MnO2@ carbon dots nanocomposites | |
| Yang et al. | Confined synthesis of phosphorus, nitrogen co-doped carbon dots with green luminescence and anion recognition performance | |
| EP2622326A1 (en) | Method for activation of aqueous silver nanoparticle dispersions for surface enhanced raman spectroscopy | |
| Sohal et al. | Nanomolar level detection of metal ions by improving the monodispersity and stability of nitrogen-doped graphene quantum dots | |
| CN113717716A (en) | Silicon nanoparticle probe and preparation method and application thereof | |
| Olteanu et al. | “One-pot” synthesis of fluorescent Au@ SiO2 and SiO2@ Au nanoparticles | |
| Munaro et al. | The role of the synthetic pathways on properties of Ag2S nanoparticles for photothermal applications | |
| Maity et al. | Hydrogelation of bile acid–peptide conjugates and in situ synthesis of silver and gold nanoparticles in the hydrogel matrix | |
| Sun et al. | Study on fluorescence properties of carbogenic nanoparticles and their application for the determination of ferrous succinate | |
| ES2629127T3 (en) | Preparation of metal colloids | |
| Shalaeva et al. | Binding of L-tryptophan and bovine serum albumin by novel gold nanoparticles capped with amphiphilic sulfonatomethylated calixresorcinarenes | |
| Sarageng et al. | Using H 2 O 2 as a green oxidant to produce fluorescent GaOOH nanomaterials from a liquid metal | |
| KR102273168B1 (en) | Method for preparing a metal nanocube with a modulated corner sharpness index | |
| Sohal et al. | Transformation of bulk MnO2 to fluorescent quantum dots for selective and sensitive detection of ferric ions and ascorbic acid by turn-off-on strategy | |
| Nie et al. | Highly sensitive fluorescent probe for selective detection of hypochlorite ions using nitrogen–fluorine co-doped carbon nanodots | |
| Qazi et al. | Green synthesis of silver nanoparticles by pulsed laser irradiation: effect of hydrophilicity of dispersing agents on size of particles |
Legal Events
| Date | Code | Title | Description |
|---|---|---|---|
| PUAI | Public reference made under article 153(3) epc to a published international application that has entered the european phase |
Free format text: ORIGINAL CODE: 0009012 |
|
| 17P | Request for examination filed |
Effective date: 20130402 |
|
| AK | Designated contracting states |
Kind code of ref document: A1 Designated state(s): AL AT BE BG CH CY CZ DE DK EE ES FI FR GB GR HR HU IE IS IT LI LT LU LV MC MK MT NL NO PL PT RO RS SE SI SK SM TR |
|
| DAX | Request for extension of the european patent (deleted) | ||
| GRAP | Despatch of communication of intention to grant a patent |
Free format text: ORIGINAL CODE: EPIDOSNIGR1 |
|
| GRAS | Grant fee paid |
Free format text: ORIGINAL CODE: EPIDOSNIGR3 |
|
| GRAA | (expected) grant |
Free format text: ORIGINAL CODE: 0009210 |
|
| INTG | Intention to grant announced |
Effective date: 20140611 |
|
| AK | Designated contracting states |
Kind code of ref document: B1 Designated state(s): AL AT BE BG CH CY CZ DE DK EE ES FI FR GB GR HR HU IE IS IT LI LT LU LV MC MK MT NL NO PL PT RO RS SE SI SK SM TR |
|
| REG | Reference to a national code |
Ref country code: GB Ref legal event code: FG4D |
|
| REG | Reference to a national code |
Ref country code: CH Ref legal event code: EP |
|
| REG | Reference to a national code |
Ref country code: AT Ref legal event code: REF Ref document number: 680195 Country of ref document: AT Kind code of ref document: T Effective date: 20140815 |
|
| REG | Reference to a national code |
Ref country code: IE Ref legal event code: FG4D |
|
| REG | Reference to a national code |
Ref country code: DE Ref legal event code: R096 Ref document number: 602011008797 Country of ref document: DE Effective date: 20140911 |
|
| PGFP | Annual fee paid to national office [announced via postgrant information from national office to epo] |
Ref country code: IE Payment date: 20140916 Year of fee payment: 4 |
|
| REG | Reference to a national code |
Ref country code: AT Ref legal event code: MK05 Ref document number: 680195 Country of ref document: AT Kind code of ref document: T Effective date: 20140730 |
|
| REG | Reference to a national code |
Ref country code: NL Ref legal event code: VDEP Effective date: 20140730 |
|
| REG | Reference to a national code |
Ref country code: LT Ref legal event code: MG4D |
|
| PG25 | Lapsed in a contracting state [announced via postgrant information from national office to epo] |
Ref country code: FI Free format text: LAPSE BECAUSE OF FAILURE TO SUBMIT A TRANSLATION OF THE DESCRIPTION OR TO PAY THE FEE WITHIN THE PRESCRIBED TIME-LIMIT Effective date: 20140730 Ref country code: NO Free format text: LAPSE BECAUSE OF FAILURE TO SUBMIT A TRANSLATION OF THE DESCRIPTION OR TO PAY THE FEE WITHIN THE PRESCRIBED TIME-LIMIT Effective date: 20141030 Ref country code: GR Free format text: LAPSE BECAUSE OF FAILURE TO SUBMIT A TRANSLATION OF THE DESCRIPTION OR TO PAY THE FEE WITHIN THE PRESCRIBED TIME-LIMIT Effective date: 20141031 Ref country code: LT Free format text: LAPSE BECAUSE OF FAILURE TO SUBMIT A TRANSLATION OF THE DESCRIPTION OR TO PAY THE FEE WITHIN THE PRESCRIBED TIME-LIMIT Effective date: 20140730 Ref country code: BG Free format text: LAPSE BECAUSE OF FAILURE TO SUBMIT A TRANSLATION OF THE DESCRIPTION OR TO PAY THE FEE WITHIN THE PRESCRIBED TIME-LIMIT Effective date: 20141030 Ref country code: SE Free format text: LAPSE BECAUSE OF FAILURE TO SUBMIT A TRANSLATION OF THE DESCRIPTION OR TO PAY THE FEE WITHIN THE PRESCRIBED TIME-LIMIT Effective date: 20140730 Ref country code: PT Free format text: LAPSE BECAUSE OF FAILURE TO SUBMIT A TRANSLATION OF THE DESCRIPTION OR TO PAY THE FEE WITHIN THE PRESCRIBED TIME-LIMIT Effective date: 20141202 Ref country code: ES Free format text: LAPSE BECAUSE OF FAILURE TO SUBMIT A TRANSLATION OF THE DESCRIPTION OR TO PAY THE FEE WITHIN THE PRESCRIBED TIME-LIMIT Effective date: 20140730 |
|
| PG25 | Lapsed in a contracting state [announced via postgrant information from national office to epo] |
Ref country code: RS Free format text: LAPSE BECAUSE OF FAILURE TO SUBMIT A TRANSLATION OF THE DESCRIPTION OR TO PAY THE FEE WITHIN THE PRESCRIBED TIME-LIMIT Effective date: 20140730 Ref country code: IS Free format text: LAPSE BECAUSE OF FAILURE TO SUBMIT A TRANSLATION OF THE DESCRIPTION OR TO PAY THE FEE WITHIN THE PRESCRIBED TIME-LIMIT Effective date: 20141130 Ref country code: HR Free format text: LAPSE BECAUSE OF FAILURE TO SUBMIT A TRANSLATION OF THE DESCRIPTION OR TO PAY THE FEE WITHIN THE PRESCRIBED TIME-LIMIT Effective date: 20140730 Ref country code: PL Free format text: LAPSE BECAUSE OF FAILURE TO SUBMIT A TRANSLATION OF THE DESCRIPTION OR TO PAY THE FEE WITHIN THE PRESCRIBED TIME-LIMIT Effective date: 20140730 Ref country code: LV Free format text: LAPSE BECAUSE OF FAILURE TO SUBMIT A TRANSLATION OF THE DESCRIPTION OR TO PAY THE FEE WITHIN THE PRESCRIBED TIME-LIMIT Effective date: 20140730 Ref country code: NL Free format text: LAPSE BECAUSE OF FAILURE TO SUBMIT A TRANSLATION OF THE DESCRIPTION OR TO PAY THE FEE WITHIN THE PRESCRIBED TIME-LIMIT Effective date: 20140730 Ref country code: AT Free format text: LAPSE BECAUSE OF FAILURE TO SUBMIT A TRANSLATION OF THE DESCRIPTION OR TO PAY THE FEE WITHIN THE PRESCRIBED TIME-LIMIT Effective date: 20140730 Ref country code: CY Free format text: LAPSE BECAUSE OF FAILURE TO SUBMIT A TRANSLATION OF THE DESCRIPTION OR TO PAY THE FEE WITHIN THE PRESCRIBED TIME-LIMIT Effective date: 20140730 |
|
| REG | Reference to a national code |
Ref country code: CH Ref legal event code: PL |
|
| PG25 | Lapsed in a contracting state [announced via postgrant information from national office to epo] |
Ref country code: IT Free format text: LAPSE BECAUSE OF FAILURE TO SUBMIT A TRANSLATION OF THE DESCRIPTION OR TO PAY THE FEE WITHIN THE PRESCRIBED TIME-LIMIT Effective date: 20140730 Ref country code: CH Free format text: LAPSE BECAUSE OF NON-PAYMENT OF DUE FEES Effective date: 20140831 Ref country code: CZ Free format text: LAPSE BECAUSE OF FAILURE TO SUBMIT A TRANSLATION OF THE DESCRIPTION OR TO PAY THE FEE WITHIN THE PRESCRIBED TIME-LIMIT Effective date: 20140730 Ref country code: RO Free format text: LAPSE BECAUSE OF FAILURE TO SUBMIT A TRANSLATION OF THE DESCRIPTION OR TO PAY THE FEE WITHIN THE PRESCRIBED TIME-LIMIT Effective date: 20140730 Ref country code: LI Free format text: LAPSE BECAUSE OF NON-PAYMENT OF DUE FEES Effective date: 20140831 Ref country code: SK Free format text: LAPSE BECAUSE OF FAILURE TO SUBMIT A TRANSLATION OF THE DESCRIPTION OR TO PAY THE FEE WITHIN THE PRESCRIBED TIME-LIMIT Effective date: 20140730 Ref country code: EE Free format text: LAPSE BECAUSE OF FAILURE TO SUBMIT A TRANSLATION OF THE DESCRIPTION OR TO PAY THE FEE WITHIN THE PRESCRIBED TIME-LIMIT Effective date: 20140730 Ref country code: BE Free format text: LAPSE BECAUSE OF NON-PAYMENT OF DUE FEES Effective date: 20140831 Ref country code: MC Free format text: LAPSE BECAUSE OF FAILURE TO SUBMIT A TRANSLATION OF THE DESCRIPTION OR TO PAY THE FEE WITHIN THE PRESCRIBED TIME-LIMIT Effective date: 20140730 Ref country code: DK Free format text: LAPSE BECAUSE OF FAILURE TO SUBMIT A TRANSLATION OF THE DESCRIPTION OR TO PAY THE FEE WITHIN THE PRESCRIBED TIME-LIMIT Effective date: 20140730 |
|
| REG | Reference to a national code |
Ref country code: DE Ref legal event code: R097 Ref document number: 602011008797 Country of ref document: DE |
|
| PLBE | No opposition filed within time limit |
Free format text: ORIGINAL CODE: 0009261 |
|
| STAA | Information on the status of an ep patent application or granted ep patent |
Free format text: STATUS: NO OPPOSITION FILED WITHIN TIME LIMIT |
|
| 26N | No opposition filed |
Effective date: 20150504 |
|
| REG | Reference to a national code |
Ref country code: FR Ref legal event code: PLFP Year of fee payment: 5 |
|
| PGFP | Annual fee paid to national office [announced via postgrant information from national office to epo] |
Ref country code: GB Payment date: 20150826 Year of fee payment: 5 Ref country code: DE Payment date: 20150824 Year of fee payment: 5 |
|
| PG25 | Lapsed in a contracting state [announced via postgrant information from national office to epo] |
Ref country code: SI Free format text: LAPSE BECAUSE OF FAILURE TO SUBMIT A TRANSLATION OF THE DESCRIPTION OR TO PAY THE FEE WITHIN THE PRESCRIBED TIME-LIMIT Effective date: 20140730 |
|
| PGFP | Annual fee paid to national office [announced via postgrant information from national office to epo] |
Ref country code: FR Payment date: 20150831 Year of fee payment: 5 |
|
| PG25 | Lapsed in a contracting state [announced via postgrant information from national office to epo] |
Ref country code: SM Free format text: LAPSE BECAUSE OF FAILURE TO SUBMIT A TRANSLATION OF THE DESCRIPTION OR TO PAY THE FEE WITHIN THE PRESCRIBED TIME-LIMIT Effective date: 20140730 |
|
| REG | Reference to a national code |
Ref country code: IE Ref legal event code: MM4A |
|
| PG25 | Lapsed in a contracting state [announced via postgrant information from national office to epo] |
Ref country code: MT Free format text: LAPSE BECAUSE OF FAILURE TO SUBMIT A TRANSLATION OF THE DESCRIPTION OR TO PAY THE FEE WITHIN THE PRESCRIBED TIME-LIMIT Effective date: 20140730 |
|
| PG25 | Lapsed in a contracting state [announced via postgrant information from national office to epo] |
Ref country code: BE Free format text: LAPSE BECAUSE OF FAILURE TO SUBMIT A TRANSLATION OF THE DESCRIPTION OR TO PAY THE FEE WITHIN THE PRESCRIBED TIME-LIMIT Effective date: 20140730 Ref country code: HU Free format text: LAPSE BECAUSE OF FAILURE TO SUBMIT A TRANSLATION OF THE DESCRIPTION OR TO PAY THE FEE WITHIN THE PRESCRIBED TIME-LIMIT; INVALID AB INITIO Effective date: 20110829 Ref country code: IE Free format text: LAPSE BECAUSE OF NON-PAYMENT OF DUE FEES Effective date: 20150829 Ref country code: LU Free format text: LAPSE BECAUSE OF NON-PAYMENT OF DUE FEES Effective date: 20140829 |
|
| REG | Reference to a national code |
Ref country code: DE Ref legal event code: R119 Ref document number: 602011008797 Country of ref document: DE |
|
| GBPC | Gb: european patent ceased through non-payment of renewal fee |
Effective date: 20160829 |
|
| REG | Reference to a national code |
Ref country code: FR Ref legal event code: ST Effective date: 20170428 |
|
| PG25 | Lapsed in a contracting state [announced via postgrant information from national office to epo] |
Ref country code: FR Free format text: LAPSE BECAUSE OF NON-PAYMENT OF DUE FEES Effective date: 20160831 Ref country code: DE Free format text: LAPSE BECAUSE OF NON-PAYMENT OF DUE FEES Effective date: 20170301 Ref country code: GB Free format text: LAPSE BECAUSE OF NON-PAYMENT OF DUE FEES Effective date: 20160829 |
|
| PG25 | Lapsed in a contracting state [announced via postgrant information from national office to epo] |
Ref country code: TR Free format text: LAPSE BECAUSE OF FAILURE TO SUBMIT A TRANSLATION OF THE DESCRIPTION OR TO PAY THE FEE WITHIN THE PRESCRIBED TIME-LIMIT Effective date: 20140730 |
|
| PG25 | Lapsed in a contracting state [announced via postgrant information from national office to epo] |
Ref country code: MK Free format text: LAPSE BECAUSE OF FAILURE TO SUBMIT A TRANSLATION OF THE DESCRIPTION OR TO PAY THE FEE WITHIN THE PRESCRIBED TIME-LIMIT Effective date: 20140730 |
|
| PG25 | Lapsed in a contracting state [announced via postgrant information from national office to epo] |
Ref country code: AL Free format text: LAPSE BECAUSE OF FAILURE TO SUBMIT A TRANSLATION OF THE DESCRIPTION OR TO PAY THE FEE WITHIN THE PRESCRIBED TIME-LIMIT Effective date: 20140730 |