EP2601618B1 - Apparatus and method for analyzing bulky data - Google Patents
Apparatus and method for analyzing bulky data Download PDFInfo
- Publication number
- EP2601618B1 EP2601618B1 EP10751825.0A EP10751825A EP2601618B1 EP 2601618 B1 EP2601618 B1 EP 2601618B1 EP 10751825 A EP10751825 A EP 10751825A EP 2601618 B1 EP2601618 B1 EP 2601618B1
- Authority
- EP
- European Patent Office
- Prior art keywords
- data
- cluster
- correlation
- analysis
- data items
- Prior art date
- Legal status (The legal status is an assumption and is not a legal conclusion. Google has not performed a legal analysis and makes no representation as to the accuracy of the status listed.)
- Active
Links
Images



Classifications
-
- G—PHYSICS
- G06—COMPUTING OR CALCULATING; COUNTING
- G06F—ELECTRIC DIGITAL DATA PROCESSING
- G06F18/00—Pattern recognition
- G06F18/20—Analysing
- G06F18/23—Clustering techniques
-
- G—PHYSICS
- G06—COMPUTING OR CALCULATING; COUNTING
- G06F—ELECTRIC DIGITAL DATA PROCESSING
- G06F18/00—Pattern recognition
- G06F18/40—Software arrangements specially adapted for pattern recognition, e.g. user interfaces or toolboxes therefor
Definitions
- Embodiments according to the invention relating to an analysis of huge amounts of data obtained from experiments and particularly to an apparatus and a method for analyzing bulky data.
- Points in space storing x,y,z-coordinates, velocities, accelerations, stress tensor components, material properties, etc.
- the number of nodes is very large (millions).
- elements solids, shells, beams etc
- the number of elements is also very large (millions).
- parts b-pillar, tunnel, etc
- timesteps combine parts, the number of timesteps is moderate, e.g. several hundreds.
- N data N nodes * N values_per_node + N elements * N values_per_element * N timesteps and is usually hundreds of millions. Special methods are required to support processing of such a huge amount of data.
- Typical tasks of data analysis include a scatter analysis, a causal analysis, a linear sensitivity analysis, a non-linear sensitivity analysis or a metamodeling of the bulky data.
- EP 1338883 describe an approach for causal analysis of crash results using a similarity function constructed in these patents. It allows identifying the cause of scatter and observing its propagation, however the method is computationally intensive and not applicable to the amount of data produced by newest crash-test simulations.
- US7386425 describes an approach to separate influences of design variable changes from bifurcation effects. This approach does not allow finding causal relationships between scatter events.
- PCA method is used to describe relationships between design variable changes and scatter behavior and to find main tendencies but not the cause of scatter. Being applied to the bulky data all approaches above are very time consuming and their combination is even more expensive computationally. It is very important for the industry to have a strategy and a method for efficient bulky data analysis which allows to solve the above listed tasks simultaneously in appropriate time.
- An embodiment of the invention provides an apparatus for analyzing bulky data comprising a cluster analyzer, a correlation determiner and a data analyzer.
- the bulky data comprises a plurality of data items, each data item comprising a data value for each experiment of a plurality of experiments by which the bulky data was obtained.
- the cluster analyzer is configured to determine a cluster center of a cluster of data items based on a cluster analysis of the plurality of data items.
- the correlation determiner is configured to calculate a correlation value between the determined cluster center and each data item of the plurality of the data items.
- a correlation value indicates a correlation strength of the cluster center and a data item.
- the data analyzer is configured to analyze the bulky data based on calculated correlation values.
- Embodiments according to the present invention are based on the center idea that a cluster analysis of the plurality of data items is performed and correlation values between the determined cluster centers and the data items are determined.
- a data item with strong correlation to the cluster center can be assigned to a cluster center comprising a similar behavior. Therefore, it may be sufficient to analyze the behavior of the cluster centers or of data items representing the cluster centers to obtain information of the behavior of all the data items assigned to a cluster center. So, the necessary data to be analyzed can be significantly reduced.
- results can be obtained more quickly and often with higher precision by using the inventive concept, since known methods are often not able to handle such huge amounts of data, so that more or less accurate approximations must be implemented.
- the bulky data represents crash-tests data, forming data, casting data, molding data, fluid dynamic data, medical data, semiconductor process simulation data, semiconductor device simulation data, network simulation data, circuit simulation data, electromagnetic field data or electromagnetic compatibility data.
- the apparatus and method for analyzing bulky data can be used in many technical fields.
- Some embodiments according to the invention relate to an apparatus for analyzing bulky data with a cluster analyzer determining the cluster center based on a density-based cluster analysis, a k-means cluster analysis, a dendrogram cluster analysis or a spectral cluster analysis. In this way, a very flexible implementation of the cluster analyzer may be possible.
- Some embodiments according to the invention comprise a data item adapter calculating a deviation vector of a data item by calculating a deviation value for each data value of the data item.
- a deviation value is obtained by calculating the difference between the data value and a mean of all data values of the data item.
- the data item adapter may calculate the deviation vectors of the data items in terms of z-score vectors of the data items.
- the data analyzer performs a scatter analysis, a causal analysis, a linear sensitivity analysis, a non-linear sensitivity analysis or a metamodeling of the bulky data. Therefore, the inventive concept is useful for analyzing bulky data in various ways.
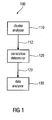
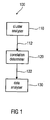
- Fig. 1 shows a block diagram of an apparatus 100 for analyzing bulky data according to an embodiment of the invention.
- the apparatus 100 for analyzing bulky data comprises a cluster analyzer 110, a correlation determiner 120 and a data analyzer 130.
- the cluster analyzer 110 is connected to the correlation determiner 120 and the correlation determiner 120 is connected to the data analyzer 130.
- the bulky data comprises a plurality of data items, each data item comprising a data value for each experiment of a plurality of experiments by which the bulky data was obtained.
- the cluster analyzer 110 determines a cluster center 112 of a cluster of data items based on a cluster analysis of the plurality of data items.
- the correlation determiner 120 calculates a correlation value 122 between the determined cluster center and each data item of the plurality of data items.
- the correlation value 122 indicates a correlation strength of the cluster center and a data item.
- the data analyzer 130 analyzes the bulky data based on calculated correlation values 122.
- the bulky data may be obtained by real experiments (e.g. crash-tests) or virtual experiments (e.g. crash-test simulations). This usually results in a huge amount of data to be analyzed.
- the bulky data can be analyzed, for example, by analyzing the behavior of only a few cluster centers or data items representing the cluster centers instead of analyzing all data items of the bulky data. Therefore, the analysis of the bulky data may be accelerated significantly. Further, the precision may be increased, because the cluster centers represent the behavior of the data items assigned to the cluster center very accurately. Further, the computational complexity may be reduced, since not every data item must be analyzed individually.
- a determined cluster center may be represented by coordinates, by a vector or a data item comprising a similar behavior or the most similar behavior of all data items of the plurality of data items.
- inventive concept is described in more detail with reference to crash-test analysis, although the inventive concept can more generally be used for various applications from engineering or natural sciences with e.g. geometrical background. Examples include also, but not limited to forming (e.g. for analysis of spring-back or clicker phenomena), casting and molding (e.g. for analysis of blow holes arising in a solidification process), computational fluid dynamics (e.g. for backtracking of eddies or finding and backtracking sources of numerical instabilities, e.g. due to cracks, tiny in- or outflows dominating the overall flow field or due to inadequate local discretization), medicine (e.g. for backtracking of instable results inside soft matter, e.g.
- forming e.g. for analysis of spring-back or clicker phenomena
- casting and molding e.g. for analysis of blow holes arising in a solidification process
- computational fluid dynamics e.g. for backtracking of eddies or finding and backtracking sources of numerical instabilities, e.g.
- semiconductor process simulation e.g. for backtracking of mechanical stress peaks to areas with non-matching crystal lattices or for the analysis of doping evolution after deposition or injection due to chemical reactions and diffusion
- semiconductor device simulation e.g. for finding and backtracking of current leaks
- network simulation and circuit simulation if combined with geometrical information; e.g. for backtracking of leaks) or electromagnetic fields, electromagnetic compatibility (e.g. for backtracking of local sensitivities due to wave evolution or the analysis of numerical instabilities).
- the apparatus for analyzing bulky data may be, depending on the application, for example, a crash-test analyzer, a forming analyzer, a casting analyzer, a molding analyzer, a fluid dynamics analyzer, a medical analyzer, a semiconductor process analyzer, a semiconductor device analyzer, a network analyzer, an electromagnetic field analyzer or an electromagnetic compatibility analyzer.
- the experiments may be based on a geometrical model comprising, for example, a lattice with a plurality of lattice points.
- This lattice points may be defined by their positions in space represented by coordinates of a 3-dimensional coordinate system.
- each coordinate of a lattice point of the geometrical model e.g. lattice model of a car
- a data item of the bulky data may represent a specific parameter to be determined during the experiment. For example, during a crash-test the positions of predefined points on the crash test object (e.g. a car) are recorded. For example, the coordinates (x, y, z) of the center of the steering wheel within a predefined coordinate system are recorded for preceding time intervals during the crash test.
- a data item may be one coordinate of the center of the steering wheel (x, y or z) at a specific timestep (or for a time interval) during the crash test.
- the crash test is repeated several times representing the plurality of experiments, so that each data item comprises a data value for each experiment. In this way, a data item may also be considered as a vector containing the data values of the experiments.
- the cluster analyzer 110 may determine cluster centers 112 indicating regions of high density of data items or representations of data items.
- the calculated correlation values 122 indicate a correlation strength of the cluster center 112 and the data items.
- a strong correlation means that the data item behaves or nearly behaves like the cluster center 112 and a weak correlation means that the data item and the cluster center 112 behave independent or nearly independent from each other.
- a data item can be assigned to a cluster center 112 comprising the highest correlation strength, if correlation values between the data item and several cluster centers are calculated, for example.
- the cluster analyzer 110, the correlation determiner 120 and the data analyzer 130 may be independent hardware units or part of a processor, a microcontroller or a computer as well as a computer program or software product for running on a computer or microcontroller.
- the data items itself may be used as input data or the data items may be preprocessed.
- the apparatus 100 may comprise additionally a data item adapter.
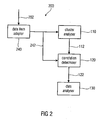
- Fig. 2 shows a block diagram of an apparatus 200 for analyzing bulky data according to an embodiment of the invention.
- the apparatus 200 is similar to the apparatus shown in Fig. 1 , but comprises additionally a data item adapter 240 connected to the cluster analyzer 110 and the correlation determiner 120.
- the data item adapter 240 may preprocess the data items in many different ways.
- the data item adapter 240 may calculate a deviation vector 242 for a data item 202 by calculating a deviation value for each data value of the data item 202.
- the deviation value calculated from the data value of the data item 202 may be calculated by calculating the difference between the data value and a mean of all data values of the data item 202.
- the data item adapter 240 may adapt the information contained by the data item by replacing it by a deviation vector indicating the deviation of the data values from the mean of all data values of the data item.
- the cluster analyzer 110 may calculate a cluster center vector 112 representing the cluster center based on a cluster analysis of the deviation vectors calculated for each data item 202 of the plurality of data items. In other words, the cluster analyzer 110 may determine a representation 112 of the cluster center compatible to the representation 242 of the data items 202. Additionally, the correlation determiner 120 may calculate the correlation value 122 between the determined cluster center vector 112 and the deviation vector 242 of each data item.
- the deviation vectors may be defined in different ways. One possibility may be the following statistical description.
- FIG. 11 A schematic example for data item matrix is shown in Fig. 11 .
- the three coordinates of a point observed during the experiment e.g. x,y,z of a point on a car or a car simulation model within a Cartesian coordinate system
- the data items are arranged in blocks, each block containing the data items of a timestep (indicated by t1, t2).
- ⁇ x i > is the mean of the i-th data item
- dx ij is the deviation from the mean of the i-th data item
- rms(x i ) is the root mean square deviation of the i-th data item.
- Fig. 8 shows a schematic illustration of two z-vectors z1, z2, within the unit norm sphere 810, formed by an intersection of a sphere 810 with a hyperplane 820.
- the data item adapter 240 may calculate the deviation vectors of the data items, so that the calculated deviation vectors represent z-score vectors of the data items.
- the correlation determiner 120 calculates a correlation value 122 for each data item of the plurality of data items.
- a correlation value 122 can be determined in many different ways. For example, a correlation value 122 may be calculated so that the absolute value of the calculated correlation value varies between a minimal correlation value indicating a low correlation or no correlation and a maximal correlation value indicating a strong correlation. For this, for example, a Pearson correlator may be used.
- Pearson's correlator indicates strong correlation in the limit of corr ⁇ 1 (maximal correlation value), corresponding to z 1 ⁇ z 2 , ⁇ 0 (minimal correlation value) or in the limit corr ⁇ 1, corresponding to z 1 ⁇ -z 2 , ⁇ .
- the correlation determiner 120 may calculate the correlation value 122 for each data item of the plurality of data items, so that a correlation value 122 calculated for a first deviation vector (e.g. z-score vector) of a data item is equal to a correlation value 122 calculated for a second deviation vector (e.g. z-score vector) comprising an opposite direction in comparison to the first deviation vector.
- a first deviation vector e.g. z-score vector
- a second deviation vector e.g. z-score vector
- the cluster analysis may be done in many different ways. Although a correlation-independent cluster analysis may be used, in preferred embodiments of the invention, the cluster analysis considers a correlation of the data items. In this connection, the cluster analysis may also be called correlation clustering or correlation cluster analysis.
- the task of correlation clustering is to group all strongly correlated data items in one cluster and subdivide all data items to a few such clusters. This allows to identify the parts of data which behave similarly and to reduce the number of independent degrees of freedom of the system to few cluster centers.
- Clustering provides a compact representation of experimental data, suitable for direct analysis by user. Formally this representation can be defined as a reconstruction of original bulky data in terms of cluster centers and association of all data with these centers. Reconstruction proceeds in two phases, wherein phase I is determination of cluster centers and phase II is assignment of data items to cluster centers.
- correlation clustering becomes straightforward in z-space representation.
- Many efficient clustering techniques are known to be applicable to this problem, as for example, density-based clustering, k-means clustering, dendrogram clustering or spectral clustering.
- the density-based clustering technique estimates the density of data items in z-space by introducing a discretization of z-space to a finite set of hypercubes.
- the hypercubes should cover the unit-norm sphere where all data items are located.
- matching z-score vectors are counted.
- the total number of hypercubes is huge due to the large dimension of z-space - this phenomenon is referred as "curse of dimensionality" -, only a small portion of hypercubes is filled. Practically, the number of filled hypercubes is much less than the number of data items.
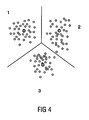
- the k-means clustering technique also known as Voronoj iteration, is illustrated by Fig. 4 . Its initialization requires specifying the expected number of clusters k and randomly selecting k cluster centers. Then each data item is assigned to the nearest cluster center, and new cluster centers are recomputed. This step is repeated iteratively until the cluster assignments do not change any more.
- This technique allows to obtain a minimal average cluster diameter, which therefore becomes a function of number of clusters k: ⁇ diam>(k).
- k-means has moderate requirements w.r.t. memory O(N data * N exp ), and computational complexity O(N data * N exp *k*N iter ), depending on the number of iterations.
- the dendrogram clustering technique also known as agglomerative hierarchical clustering, stores a distance matrix for clusters d(X,Y).
- the method defines original points as initial clusters, then applies to them the following procedure.
- a pair of clusters is found possessing minimal distance. This pair is merged to a new cluster, and the distance matrix is updated accordingly (merging two rows corresponding to clusters X and Y to a new row using the linkage formula above, complementing merge of X and Y columns from matrix symmetry).
- a sequence of merged clusters defined by this procedure can be graphically displayed as a tree-like diagram, called dendrogram, see Fig. 5 .
- a stopping criterion cuts off a tree not reaching the root, leaving a number of clusters with user-controlled diameter.
- Dendrogram clustering is memory- and computationally expensive, since it requires to store a O(N data 2 ) distance matrix and to perform up to O(N data 3 ) operations for processing. For bulky data, it can be applied only in a combination with a special subsampling procedure, as described below. On the other hand, this technique is non-iterative and has a predictable completion time.
- Spectral clustering is based on a special matrix decomposition, known as singular value decomposition (SVD).
- the Gram matrix has a moderate size of N exp * N exp which allows to load the whole G-matrix to memory and apply any suitable method for spectral matrix decomposition (e.g. Jacobi method). Practically, the computational complexity of this step is negligible compared with the other steps.
- the matrix C has size N data * N data and is composed of scalar products of z-score vectors for every pair of data items (equal to correlator of data items). Due to a huge size of this matrix, it is practically impossible to compute, store or spectrally decompose it directly.
- the above method provides its correct and computationally efficient spectral decomposition.
- the matrices C and C 2 differ only in scaling factors, equal to scatter rms(x i ), applied to every row and column.
- a problem which can occur in application of clustering techniques is appearance of chains of data items where consequential items are strongly correlated but beginning and end items are not correlated. Such chains should not be merged in one cluster.
- Density-based clustering includes a special algorithm for elimination of strongly correlated chain members.
- the k-means technique attempts to minimize the average cluster diameter and will tend to break the chains and assign them to different cluster centers.
- the dendrogram technique is free from the chaining phenomenon if the complete linkage scheme is used.
- Spectral clustering produces cluster centers which are orthogonal and uncorrelated by definition.
- k-means can be similarly modified by redefinition of the assignment criterion: a z-vector is assigned to cluster center z c if the absolute value
- the dendrogram technique takes the structure of the projective space automatically into account by a special definition of the non-Euclidean distance, so that opposite z-vectors produce a zero entry in the distance matrix. Spectral clustering merges opposite cluster centers in one cluster, assigning them to one V-vector.
- the cluster analyzer 110 may determine at least one cluster center 112 (e.g. represented by a cluster center vector) based on a density-based cluster analysis, a k-means cluster analysis, a dendrogram cluster analysis, a spectral cluster analysis or another clustering technique.
- the cluster analyzer 110 determines cluster centers 112 of clusters of data items comprising strongly correlated data items. This means that the cluster analysis identifies clusters of strongly correlated data items. Strongly correlated means in this connection that these data items are correlated stronger to each other or the corresponding cluster center 112 than to the other determined cluster centers of data items.
- the cluster analyzer 110 may map deviation vectors (e.g. z-score vectors) representing data items comprising opposite directions to the same cluster center.
- the cluster analyzer 110 may determine one or more cluster centers of data items based on the cluster analysis of the plurality of data items. Consequently, the correlation determiner 120 may calculate a correlation value 122 between each determined cluster center 112 and each data item of the plurality of data items. In this way, for each data item of the plurality of data items a cluster center comprising the strongest correlation to the data item may be identified and the data item can be assigned to this cluster center.
- the clustering methods mentioned above may require different run times depending on the input bulky data and other parameters of the cluster techniques. Some of the clustering methods can be accelerated by simple adaptations.
- Spectral clustering allows to process data items sequentially one after the other and has the minimal memory requirements. On the other hand, it requires considerable computational effort for filling the Gram matrix.
- the cluster analyzer 110 determines the plurality of cluster centers based on a spectral cluster analysis, the number of cluster centers of the plurality of cluster centers determined by the cluster analyzer 110 may depend on or may be set by Parseval's criterion.
- N 1 *N 2 10000 which is much less than the amount of data items in the hypercube (a million). This procedure, similar to the percentage hurdle voting rule, allows a significant reduction of the total memory usage of the algorithm.
- the plurality of cluster centers determined by a cluster analyzer 110 may contain only cluster centers comprising more than a predefined minimum number of assigned data items after considering a predefined number of data items of the plurality of data items.
- Cluster center containing less than the minimal number of assigned data items after considering the predefined number of data items may be neglected or deleted.
- the predefined number of data items of the plurality of data items may be small compared to the number of data items of the plurality of data items or the number data items of the bulky data (e.g. 1/10, 1/100, 1/1000 or less).
- clustering methods require processing simultaneously all data items and, for optimal performance, need to load in memory the whole data matrix or even the larger distance matrix. Due to their enormous sizes this is practically impossible. The following observation allows applying these methods nevertheless. Since the most interesting clusters contain millions of data items, their centers and the actual density of data in them can be reliably determined on much smaller statistics than the full set. Subsampling of data items is a selection of random subset in the full set of data items, which can be used for determination of cluster centers. The selection should be really random and not correlated with node, part or state structure of the dataset. After determining the cluster centers, the full set of data items is processed once to assign them to the clusters. This approach is similar to a public opinion poll by selecting a representative sample of the population. It allows reducing the memory usage and accelerating computation significantly (by a factor of thousands).
- the bulky data may comprise more data items than the plurality of data items and a pre-selection of data items may be done to obtain the plurality of data items.
- the apparatus for analyzing the bulky data may comprise a data item selector.
- the data item selector may select the data items of the plurality of data items randomly or pseudo-randomly from the data items contained by the bulky data.
- the data item selector may be located between the data item adapter 240 and the cluster analyzer 110 or before the data item adapter 240.
- the correlation determiner 120 may calculate a correlation value 122 not only for the plurality of the data items, but also for the other data items contained by the bulky data. In other words, the correlation determiner 120 may calculate a correlation value between the determined cluster center and each data item of the bulky data.
- correlation clustering delivers cluster centers in form of z-vectors.
- the user can define other points of interest involving her/his engineers knowledge of the problem. For example, certain control points on the car body can be important from safety requirements and should be included into the points of interest list.
- the correlation determiner 120 may calculate a correlation value between each item on the list of points of interest and each data item of the plurality of data items.
- the list of points of interest may comprise the determined cluster centers 112 and at least one user-defined point of interest.
- the main pass of the computation is applied. For example, it computes correlator corr(POI,*) of all items from the POI list with all data items, as well as scatter amplitude rms(*) for all data items. This step involves one-time reading of all data and is normally one of the most time consuming parts of the analysis.
- N exp 25
- This structure supports an optimal order of data reading, which allows rapid sampling of one data item, i.e. x ij , at i fixed, j varied from 1 to N exp .
- This vector is transformed to the z-space, where a few of computations are performed to find rms, corr and other necessary statistical measures of the data item.
- the resulting measures are written blockwise to a file, if necessary, in compressed form.
- the data can be written in the data format of the original experiments, ready for visualization with any suitable post-processor program.
- an effective norm can be selected and written to a file as a scalar value.
- data items are ordered by triples: (X 1 ,Y 1 ,Z 1 ,X 2 ,Y 2 ,Z 2 ,...), see Fig. 11 .
- highest hierarchical levels are timesteps t1,t2,..., each of them contains nodes, represented by triples of coordinates.
- the lost component information can be recovered afterwards by observing raw data plots for any pair of selected nodes. For example, for a destination point from the POI list and for a corresponding source point found in causal analysis, raw data can be extracted from the data set and displayed as 3x3 plots including all component combinations, see Fig. 9 .
- the data items x1, y1, z1 indicating a position in space of a point of interest in a 3-dimensional coordinate system and data items x2, y2, z2 indicating a position in space of a source point found in causal analysis.
- the data items of the point of interest are compared with each data item of the source point resulting in one of the nine plots shown in Fig. 9 .
- Each plot comprises for each experiment of the plurality of experiments one data point indicating the relationship between the position of the point of interest and the position of the source point.
- differences of the positions in comparison to positions of preceding timesteps may be considered. Random access to data items allows to accelerate such data extraction. It accelerates also clustering algorithms, utilizing a subsampling procedure, since only a small selected subset of data must be read. Also, extraction of user-defined POI for computation of correlator is accelerated. Cluster centers which are formally added to the POI list are already presented as z-score vectors and do not need to be extracted. Other parts of computation require only sequential data access.
- the effort for processing each of the clustering techniques mentioned includes, in addition to purely computational effort, also input/output operations.
- For determination of cluster centers one needs O(N subsamp * N exp ) reading operations, if subsampling is applied, else O(N data * N exp ) reading operations without subsampling.
- For output of clustering data one needs O(N data * N exp ) operations for one-pass reading of the whole database and O(N data *N clust ) operations to write the clustering results. All input/output operations can be accelerated using data compression algorithms.
- the data analyzer 130 may generate a partition diagram based on calculated correlation values to present the results of the analysis of the bulky data.
- Representation of data in a form of partition diagram shows - at a glance - the correlation structure of the whole data set.
- Selecting an appropriate visualization range in available postprocessing tools such as GNS Animator one can investigate further details e.g. search a time step where the region of influence for a particular POI originates, in order to identify the source of scatter related with this POI.
- FIG. 13 shows a partition diagram of a real life example.
- the partition diagram, depicted on Fig. 13 shows at a glance distribution of correlators in the model.
- Several correlation clusters have been detected, in particular:
- color or grey code
- grey code may be used to distinguish clusters on the model.
- Some embodiments according to the invention relate to a data analyzer 130 performing a scatter analysis, a causal analysis, a linear sensitivity analysis, a non-linear sensitivity analysis or a metamodeling of the bulky data based on calculated correlation values.
- the data analyzer 130 may perform the cluster analysis based on some or all calculated correlation values. For example, only one or some cluster centers may be analysed and therefore only the corresponding calculated correlation values may be considered.
- the data analyzer may perform a causal analysis or scatter analysis, the causal analysis or the scatter analysis of the bulky data may be based on calculated correlation values aiming to identify causal chains processing a large correlation.
- a practical problem of causal analysis in crash-test simulations is often not a removal of a prime cause of scatter, which is usually the crash event itself. It is more an observation of propagation paths of the scatter, with a purpose to prevent this propagation, by finding regions where scatter is amplified (e.g. break of a welding point, pillar buckling, slipping of two contact surfaces etc). Therefore it is necessary to check an amplitude of scatter rms(x) along the causal chain. Also, small cause can have large effect and formally earliest events in the causal chain can have a microscopic amplitude ("butterfly effect"). Again, it is reasonable to search for amplifying factors and try to eliminate them, not the microscopic sources.
- Causal chains can be defined as regions in space-time possessing a large correlator (e.g.
- a selection of the best representative path inside the chain can be done using 2-dimensional multi-objective optimization for finding parts with maximal correlation at earliest possible state. This gives a curve (Pareto front) on a 2-dimensional plot (time,
- One can also add to the representative set a neighborhood of the Pareto front, which can be determined with Pareto ranking methods.
- the data analyzer 130 may reconstruct a causal chain based on a Pareto ranking of correlation values.
- FIG. 12 An illustration of a causal analysis is shown in Fig. 12 .
- the crash model of the car comprising 1 million nodes, 32 timesteps and 25 simulations (experiments) is illustrated.
- Crash intrusions in foot room of the driver and passenger are commonly considered as critical safety characteristics of car design. These characteristics possess numerical uncertainties, whose analysis falls in the subject of this patent.
- correlators For user specified destination point, selected in driver's foot room, depicted on Fig. 12 bottom, correlators have been computed using the method described in this patent. Color (grey code) displays the value of correlator.
- a source of the scatter has been identified at earlier time step by increased value of correlator. The source is related with a buckling of longitudinal structure depicted on Fig. 12 top.
- the values of large correlator propagate along the causal chain depicted on Fig. 12 middle.
- This chain detected with Pareto front algorithm, shows propagation of the scatter from the source towards steering wheel, and further to the foot room destination point.
- the data analyzer 130 may perform a linear sensitivity analysis of the bulky data.
- control parameters can be e.g. thicknesses of car body components, initial velocity of collision, material properties etc.
- the correlation determiner 120 may add a data item representing a variation of a control parameter of the experiments and calculate the correlation value between the added data item and each data item of the plurality of data items. Alternatively or additionally, the correlation determiner 120 may calculate a correlation value between the added data item and each determined cluster center. Further, the data analyzer 130 may determine a sensitivity matrix or a sensitivity vector based on the determined correlation values of the added data item and may perform the linear sensitivity analysis based on the determined sensitivity matrix or sensitivity vector.
- the data analyzer 130 may perform a non-linear sensitivity analysis or a metamodeling of the bulky data.
- Metamodeling is an interpolation or approximation method applied to existing simulations to predict the result of a new simulation performed at intermediate values of parameters. Often non-linear methods are used to catch non-linear parametric dependencies.
- This representation makes an interpolation of bulky simulation data possible at a rate (computational complexity) linear with respect to the size of the dataset.
- Metamodeling is employed to complete sensitivity analysis for non-linear dependencies, where instead of the S pk matrix other quantities can be used as sensitivity measures.
- the sign of S pk can be tested along the cross section, and the global sign of the dependence can be introduced, equal to +1 if all S pk are positive on cross-section, -1 if all S pk are negative and 0 for sign changing S pk .
- This information can be easily presented graphically, e.g. in the form shown on Fig. 10 .
- Metamodeling is also used for the solution of optimization problems.
- engineers are confronted with simultaneous optimization of multiple objectives, coming from different types of simulations (so called multidisciplinary optimization problems). It is often desirable to interpolate the whole model (even on highly resolved geometries), instead ofsome scalar optimization criteria only, in order to have a possibility to inspect the (Pareto-) optimal design in full detail.
- Such kind of bulky data metamodeling can be significantly accelerated using correlation clustering described in this patent.
- zc' is the dual basis to zc
- G is the Gram matrix of the basis zc.
- RBF metamodeling allows not only to interpolate data in a new parameter point, but also to estimate precision of this interpolation.
- this precision can be estimated using a known cross-validation procedure: the data point is removed, data are interpolated to this point and compared with the actually measured value at this point. Formally, for this comparison one needs to construct a new metamodel where the data point is removed.
- the so-estimated error can be interpolated, using e.g. the same RBF weights w i .
- the data analyzer 130 may control a precision of the metamodeling based on a cross-validation.
- Fig. 14 shows a flow chart of a method 1400 for analyzing bulky data according to an embodiment of the invention.
- the bulky data comprises a plurality of data items, each data item comprising a data value for each experiment of a plurality of experiments by which the bulky data was obtained.
- the method 1400 comprises determining 1410 a cluster center of a cluster of data items, calculating 1420 correlation values and analyzing 1430 the bulky data.
- the cluster center of the cluster of data items is determined 1410 based on a cluster analysis of the plurality of data items.
- a correlation value is calculated 1420 between the determined cluster center and each data item of the plurality of data items.
- a correlation value indicates a correlation strength of the cluster center and a data item.
- the bulky data is analyzed 1430 based on calculated correlation values.
- the method 1400 may comprise additional, optional steps representing features of the inventive concept mentioned above.
- Some embodiments according to the invention relate to a correlation clustering of bulky data and its application in the analysis of crash-test data and fields with similar phenomena.
- the method consists of the following steps. Firstly, a number of crash-test simulations or real experiments is performed and stored in the database. Secondly, correlation clustering of data items in the database is performed. Thirdly, a list of points of interest (POI) is formed including cluster centers, user defined points and variations of design parameters. Fourthly, one-pass computation of scatter and correlator of all data items with the POI list is performed. Fifthly, a partition diagram is set up. Sixthly, scatter and causal analysis is performed based on Pareto ranking of scatter and correlator data. Seventhly, linear sensitivity analysis is performed using correlator of parameter variations with the POI list. Eighthly, non-linear sensitivity analysis and metamodeling of bulky data are performed based on reconstruction of database in terms of correlation clusters.
- Crash-test simulations possess a stochastic component, related with physical and numerical instabilities of underlying crash model and uncertainties of its control parameters.
- Scatter analysis is a characterization of this component, usually in terms of scatter amplitude distributed on the model's geometry and evolving in time. This allows identifying parts of the model, possessing large scatter and most non-deterministic behavior. The purpose is to estimate reliability of numerical results and do corresponding tolerance predictions.
- Causal analysis is determination of cause-effect relationships between events. In context of crash-test analysis, this usually means identification of events or properties causing the scatter of the results. This allows to find sources of physical or numerical instabilities of the system and helps to reduce or completely eliminate them.
- causal analysis is generally performed by means of statistical methods, particularly, by estimation of correlation of events. It is commonly known that correlation does not imply causation (this logical error is often referred as “cum hoc ergo propter hoc”: “with this, therefore because of this”). Instead, strong correlation of two events does mean that they belong to the same causal chain. Two strongly correlated events either have direct causal relation or they have a common cause, i.e. a third event in the past, triggering these two ones. This common cause will be revealed, if the whole causal chain i.e. a complete sequence of causally related events will be reconstructed. Practical application of causal analysis requires formal methods for reconstruction of causal chains.
- Sensitivity analysis considers dependence of the numerical result on variation of control parameters. It allows to identify the parameters possessing most influence to the result and the parts of the model where the impact of such variation is considerable.
- Metamodeling of simulation results allows making prediction for the model behavior at new values of control parameters, where no simulation has been done yet. These values of parameters are usually intermediate in respect to existing ones, where simulations are available. Predictions are needed for analysis and optimization of product properties during the design stage and are usually completed with a control simulation done at the optimal parameter values.
- Some embodiments according to the invention relate to a method for crash-test data analysis comprising performing a number of crash-test simulations or real experiments and storing the results in a database, correlation clustering of data items in the database and analysis of the cluster data.
- a z-score representation is used for the correlation clustering.
- the correlation clustering may be performed using a density-based clustering technique, a k-means clustering technique, a dendrogram clustering technique or a spectral clustering technique.
- the correlation clustering may be accelerated by intermediate cleaning or subsampling technique.
- a list of points of interest may be formed including cluster centers and/or user defined points and/or variations of design parameters.
- the results of the correlation clustering may be presented in form of the partition diagram.
- scatter and/or causal analysis may be performed based on scatter and/or correlator data.
- the causal analysis may be performed by reconstructing causal chains using Pareto ranking of correlated data (correlation values).
- a linear sensitivity analysis may be performed using correlator (a correlation value) of parameter variations with the points of interest (POI) list.
- a non-linear sensitivity analysis and/or metamodeling of bulky data may be performed based on a reconstruction of the database in terms of correlation clusters.
- This non-linear sensitivity and/or metamodeling may be performed using multi-quadric radial basis functions (RBF) with detrending.
- RBF multi-quadric radial basis functions
- the precision of the metamodeling may be controlled by means of the cross validation procedure.
- the precision of bulky data reconstruction may be controlled by means of Parseval's criterion.
- a non-linear sensitivity measure and global sign of dependence may be evaluated on cross-sections in parameters space as described in the embodiments.
- aspects of the described concept have been described in the context of an apparatus, it is clear that these aspects also represent a description of the corresponding method, where a block or device corresponds to a method step or a feature of a method step. Analogously, aspects described in the context of a method step also represent a description of a corresponding block or item or feature of a corresponding apparatus.
- embodiments of the invention can be implemented in hardware or in software.
- the implementation can be performed using a digital storage medium, for example a floppy disk, a DVD, a Blue-Ray, a CD, a ROM, a PROM, an EPROM, an EEPROM or a FLASH memory, having electronically readable control signals stored thereon, which cooperate (or are capable of cooperating) with a programmable computer system such that the respective method is performed. Therefore, the digital storage medium may be computer readable.
- Some embodiments according to the invention comprise a data carrier having electronically readable control signals, which are capable of cooperating with a programmable computer system, such that one of the methods described herein is performed.
- embodiments of the present invention can be implemented as a computer program product with a program code, the program code being operative for performing one of the methods when the computer program product runs on a computer.
- the program code may for example be stored on a machine readable carrier.
- inventions comprise the computer program for performing one of the methods described herein, stored on a machine readable carrier.
- an embodiment of the inventive method is, therefore, a computer program having a program code for performing one of the methods described herein, when the computer program runs on a computer.
- a further embodiment of the inventive methods is, therefore, a data carrier (or a digital storage medium, or a computer-readable medium) comprising, recorded thereon, the computer program for performing one of the methods described herein.
- a further embodiment of the inventive method is, therefore, a data stream or a sequence of signals representing the computer program for performing one of the methods described herein.
- the data stream or the sequence of signals may for example be configured to be transferred via a data communication connection, for example via the Internet.
- a further embodiment comprises a processing means, for example a computer, or a programmable logic device, configured to or adapted to perform one of the methods described herein.
- a processing means for example a computer, or a programmable logic device, configured to or adapted to perform one of the methods described herein.
- a further embodiment comprises a computer having installed thereon the computer program for performing one of the methods described herein.
- a programmable logic device for example a field programmable gate array
- a field programmable gate array may cooperate with a microprocessor in order to perform one of the methods described herein.
- the methods are preferably performed by any hardware apparatus.
Landscapes
- Engineering & Computer Science (AREA)
- Data Mining & Analysis (AREA)
- Theoretical Computer Science (AREA)
- Computer Vision & Pattern Recognition (AREA)
- Artificial Intelligence (AREA)
- Bioinformatics & Computational Biology (AREA)
- Bioinformatics & Cheminformatics (AREA)
- Evolutionary Biology (AREA)
- Evolutionary Computation (AREA)
- Physics & Mathematics (AREA)
- General Engineering & Computer Science (AREA)
- General Physics & Mathematics (AREA)
- Life Sciences & Earth Sciences (AREA)
- Human Computer Interaction (AREA)
- Information Retrieval, Db Structures And Fs Structures Therefor (AREA)
Description
- Embodiments according to the invention relating to an analysis of huge amounts of data obtained from experiments and particularly to an apparatus and a method for analyzing bulky data.
- In many different technical fields experiments result in a huge amount of data generated during the experiments. For example, in connection with crash-test experiments, one of the largest challenges of crash-test data analysis is the huge amount of data items to be processed. Results of the commonly used finite-element-based crash-test simulation are presented in groups of different information levels.
- Points in space (nodes) storing x,y,z-coordinates, velocities, accelerations, stress tensor components, material properties, etc. The number of nodes is very large (millions). Further, elements (solids, shells, beams etc) combine nodes, can also store material properties and other values. The number of elements is also very large (millions). Additionally, parts (b-pillar, tunnel, etc) combine elements, the number of parts is moderate, e.g. several thousands. Further, timesteps combine parts, the number of timesteps is moderate, e.g. several hundreds.
- The total number of data items is then

and is usually hundreds of millions. Special methods are required to support processing of such a huge amount of data. - Also, in other technical fields, as for example forming, casting, molding, computational fluid dynamics, medicine, semiconductor process simulation, semiconductor device simulation, network simulation, circuit simulation, electromagnetic fields or electromagnetic compatibility, a huge amount of data is generated and must be analyzed.
- Typical tasks of data analysis include a scatter analysis, a causal analysis, a linear sensitivity analysis, a non-linear sensitivity analysis or a metamodeling of the bulky data.
-
DE10207503 ,EP 1338883 describe an approach for causal analysis of crash results using a similarity function constructed in these patents. It allows identifying the cause of scatter and observing its propagation, however the method is computationally intensive and not applicable to the amount of data produced by newest crash-test simulations.US7386425 describes an approach to separate influences of design variable changes from bifurcation effects. This approach does not allow finding causal relationships between scatter events. In "Ackermann et al, in: Weimar, Optimization and Stochastic Days 5.0 - November 20-21, 2008" PCA method is used to describe relationships between design variable changes and scatter behavior and to find main tendencies but not the cause of scatter. Being applied to the bulky data all approaches above are very time consuming and their combination is even more expensive computationally. It is very important for the industry to have a strategy and a method for efficient bulky data analysis which allows to solve the above listed tasks simultaneously in appropriate time. - It is the object of the present invention to provide an improved concept for analyzing bulky data, which allows to accelerate the analysis, increase the decision of the analysis and/or reduce the computational complexity of the analysis.
- This object is solved by an apparatus according to
claim 1 or a method according to claim 24. - An embodiment of the invention provides an apparatus for analyzing bulky data comprising a cluster analyzer, a correlation determiner and a data analyzer. The bulky data comprises a plurality of data items, each data item comprising a data value for each experiment of a plurality of experiments by which the bulky data was obtained. The cluster analyzer is configured to determine a cluster center of a cluster of data items based on a cluster analysis of the plurality of data items. The correlation determiner is configured to calculate a correlation value between the determined cluster center and each data item of the plurality of the data items. A correlation value indicates a correlation strength of the cluster center and a data item. Further, the data analyzer is configured to analyze the bulky data based on calculated correlation values.
- Embodiments according to the present invention are based on the center idea that a cluster analysis of the plurality of data items is performed and correlation values between the determined cluster centers and the data items are determined. In this way, a data item with strong correlation to the cluster center can be assigned to a cluster center comprising a similar behavior. Therefore, it may be sufficient to analyze the behavior of the cluster centers or of data items representing the cluster centers to obtain information of the behavior of all the data items assigned to a cluster center. So, the necessary data to be analyzed can be significantly reduced. In comparison to known analyzing methods, results can be obtained more quickly and often with higher precision by using the inventive concept, since known methods are often not able to handle such huge amounts of data, so that more or less accurate approximations must be implemented.
- In some embodiments according to the invention, the bulky data represents crash-tests data, forming data, casting data, molding data, fluid dynamic data, medical data, semiconductor process simulation data, semiconductor device simulation data, network simulation data, circuit simulation data, electromagnetic field data or electromagnetic compatibility data. In this way, the apparatus and method for analyzing bulky data can be used in many technical fields.
- Some embodiments according to the invention relate to an apparatus for analyzing bulky data with a cluster analyzer determining the cluster center based on a density-based cluster analysis, a k-means cluster analysis, a dendrogram cluster analysis or a spectral cluster analysis. In this way, a very flexible implementation of the cluster analyzer may be possible.
- Some embodiments according to the invention comprise a data item adapter calculating a deviation vector of a data item by calculating a deviation value for each data value of the data item. A deviation value is obtained by calculating the difference between the data value and a mean of all data values of the data item. The data item adapter may calculate the deviation vectors of the data items in terms of z-score vectors of the data items.
- In some further embodiments according to the invention, the data analyzer performs a scatter analysis, a causal analysis, a linear sensitivity analysis, a non-linear sensitivity analysis or a metamodeling of the bulky data. Therefore, the inventive concept is useful for analyzing bulky data in various ways.
- The embodiments according to the invention will be detailed subsequently referring to the appended drawings, in which:
- Fig. 1
- is a block diagram of an apparatus for analyzing bulky data;
- Fig. 2
- is a block diagram of an apparatus for analyzing bulky data;
- Fig. 3
- is a schematic illustration of a density-based clustering;
- Fig. 4
- is a schematic illustration of a k-means clustering;
- Fig. 5
- is a schematic illustration of a dendrogram clustering;
- Fig. 6
- is a schematic illustration of a spectral clustering;
- Fig. 7
- is a schematic illustration of a Pareto ranking;
- Fig. 8
- is a schematic illustration of z-score vectors;
- Fig. 9
- is an example for raw data blocks for all component combinations;
- Fig. 10
- is a schematic illustration of a sensitivity matrix;
- Fig. 11
- is an example of data ordering in an experimental data matrix
- Fig. 12
- is an example of a causal analysis;
- Fig. 13
- is an example of a partition diagram;
- Fig. 14
- is a flow chart of a method for analyzing bulky data.
- In the following, the same reference numerals are partly used for objects and functional units having the same or similar functional properties and the description thereof with regard to a figure shall apply also to other figures in order to reduce redundancy in the description of the embodiments.
-
Fig. 1 shows a block diagram of anapparatus 100 for analyzing bulky data according to an embodiment of the invention. Theapparatus 100 for analyzing bulky data comprises acluster analyzer 110, acorrelation determiner 120 and adata analyzer 130. Thecluster analyzer 110 is connected to thecorrelation determiner 120 and thecorrelation determiner 120 is connected to thedata analyzer 130. The bulky data comprises a plurality of data items, each data item comprising a data value for each experiment of a plurality of experiments by which the bulky data was obtained. Thecluster analyzer 110 determines acluster center 112 of a cluster of data items based on a cluster analysis of the plurality of data items. Then, thecorrelation determiner 120 calculates acorrelation value 122 between the determined cluster center and each data item of the plurality of data items. Thecorrelation value 122 indicates a correlation strength of the cluster center and a data item. Further, thedata analyzer 130 analyzes the bulky data based on calculated correlation values 122. - The bulky data may be obtained by real experiments (e.g. crash-tests) or virtual experiments (e.g. crash-test simulations). This usually results in a huge amount of data to be analyzed. Using the described concept, the bulky data can be analyzed, for example, by analyzing the behavior of only a few cluster centers or data items representing the cluster centers instead of analyzing all data items of the bulky data. Therefore, the analysis of the bulky data may be accelerated significantly. Further, the precision may be increased, because the cluster centers represent the behavior of the data items assigned to the cluster center very accurately. Further, the computational complexity may be reduced, since not every data item must be analyzed individually.
- A determined cluster center may be represented by coordinates, by a vector or a data item comprising a similar behavior or the most similar behavior of all data items of the plurality of data items.
- In the following, the inventive concept is described in more detail with reference to crash-test analysis, although the inventive concept can more generally be used for various applications from engineering or natural sciences with e.g. geometrical background. Examples include also, but not limited to forming (e.g. for analysis of spring-back or clicker phenomena), casting and molding (e.g. for analysis of blow holes arising in a solidification process), computational fluid dynamics (e.g. for backtracking of eddies or finding and backtracking sources of numerical instabilities, e.g. due to cracks, tiny in- or outflows dominating the overall flow field or due to inadequate local discretization), medicine (e.g. for backtracking of instable results inside soft matter, e.g. organs, due to irradiation processes such as focused ultra-sound), semiconductor process simulation (e.g. for backtracking of mechanical stress peaks to areas with non-matching crystal lattices or for the analysis of doping evolution after deposition or injection due to chemical reactions and diffusion), semiconductor device simulation (e.g. for finding and backtracking of current leaks), network simulation and circuit simulation (if combined with geometrical information; e.g. for backtracking of leaks) or electromagnetic fields, electromagnetic compatibility (e.g. for backtracking of local sensitivities due to wave evolution or the analysis of numerical instabilities).
- Therefore, the apparatus for analyzing bulky data may be, depending on the application, for example, a crash-test analyzer, a forming analyzer, a casting analyzer, a molding analyzer, a fluid dynamics analyzer, a medical analyzer, a semiconductor process analyzer, a semiconductor device analyzer, a network analyzer, an electromagnetic field analyzer or an electromagnetic compatibility analyzer.
- The experiments may be based on a geometrical model comprising, for example, a lattice with a plurality of lattice points. This lattice points may be defined by their positions in space represented by coordinates of a 3-dimensional coordinate system. In this connection, for example, each coordinate of a lattice point of the geometrical model (e.g. lattice model of a car) may represent a data item.
- If simulations are used to obtain the bulky data, a sufficient variation between the experiments may be obtained by varying the assignment of tasks in a parallel processing to the used parallel processors.
- A data item of the bulky data may represent a specific parameter to be determined during the experiment. For example, during a crash-test the positions of predefined points on the crash test object (e.g. a car) are recorded. For example, the coordinates (x, y, z) of the center of the steering wheel within a predefined coordinate system are recorded for preceding time intervals during the crash test. In this example, a data item may be one coordinate of the center of the steering wheel (x, y or z) at a specific timestep (or for a time interval) during the crash test. The crash test is repeated several times representing the plurality of experiments, so that each data item comprises a data value for each experiment. In this way, a data item may also be considered as a vector containing the data values of the experiments.
- The
cluster analyzer 110 may determinecluster centers 112 indicating regions of high density of data items or representations of data items. - The calculated correlation values 122 indicate a correlation strength of the
cluster center 112 and the data items. In this connection, a strong correlation means that the data item behaves or nearly behaves like thecluster center 112 and a weak correlation means that the data item and thecluster center 112 behave independent or nearly independent from each other. In this way, a data item can be assigned to acluster center 112 comprising the highest correlation strength, if correlation values between the data item and several cluster centers are calculated, for example. - The
cluster analyzer 110, thecorrelation determiner 120 and the data analyzer 130 may be independent hardware units or part of a processor, a microcontroller or a computer as well as a computer program or software product for running on a computer or microcontroller. - For the cluster analysis and/or the calculation of the
correlation value 122, the data items itself may be used as input data or the data items may be preprocessed. For this, theapparatus 100 may comprise additionally a data item adapter.Fig. 2 shows a block diagram of anapparatus 200 for analyzing bulky data according to an embodiment of the invention. Theapparatus 200 is similar to the apparatus shown inFig. 1 , but comprises additionally adata item adapter 240 connected to thecluster analyzer 110 and thecorrelation determiner 120. Thedata item adapter 240 may preprocess the data items in many different ways. For example, thedata item adapter 240 may calculate adeviation vector 242 for adata item 202 by calculating a deviation value for each data value of thedata item 202. The deviation value calculated from the data value of thedata item 202 may be calculated by calculating the difference between the data value and a mean of all data values of thedata item 202. In other words, thedata item adapter 240 may adapt the information contained by the data item by replacing it by a deviation vector indicating the deviation of the data values from the mean of all data values of the data item. - Further, the
cluster analyzer 110 may calculate acluster center vector 112 representing the cluster center based on a cluster analysis of the deviation vectors calculated for eachdata item 202 of the plurality of data items. In other words, thecluster analyzer 110 may determine arepresentation 112 of the cluster center compatible to therepresentation 242 of thedata items 202. Additionally, thecorrelation determiner 120 may calculate thecorrelation value 122 between the determinedcluster center vector 112 and thedeviation vector 242 of each data item. The deviation vectors may be defined in different ways. One possibility may be the following statistical description. - The input may be an experimental data matrix xij, i=1..Ndata, j=1..Nexp (containing the data items xi). Every column in this matrix forms one experiment, every row forms a data item varied in experiments.
- A schematic example for data item matrix is shown in
Fig. 11 . The three coordinates of a point observed during the experiment (e.g. x,y,z of a point on a car or a car simulation model within a Cartesian coordinate system) are represented by three succeeding rows. Further, the data items are arranged in blocks, each block containing the data items of a timestep (indicated by t1, t2). - Then every data item is transformed to a z-score vector:

with dxij = xij - <xi> and |dxi|=sqrt(∑j dxij 2) and zij=dxij/|dxi|
or by means of the equivalent alternative formula
with rms(xi)=sqrt(∑j dxij 2/ Nexp). Here <xi> is the mean of the i-th data item, dxij is the deviation from the mean of the i-th data item, and rms(xi) is the root mean square deviation of the i-th data item. - In this way data items are transformed to Ndata vectors in Nexp -dimensional space. All these z-vectors belong to an (Nexp -2)-dimensional unit-norm sphere, formed by intersection of a sphere |z|=1 with a hyperplane ∑j zij=0.
-
Fig. 8 shows a schematic illustration of two z-vectors z1, z2, within theunit norm sphere 810, formed by an intersection of asphere 810 with ahyperplane 820. - An important role of this representation is the following. All z-vectors which are located close one to the other correspond to strongly correlated data items. Two such data items being displayed on 2D plot will show a linear dependence between the items. This plot is coincident up to a scaling with the plot of one z-vector versus the other, which is concentrated near z1=z2 due to approximate coincidence of z-vectors. Also in the case when two z-vectors are approximately opposite, they correspond to strongly correlated data items and linear data plot, approximately coincident with z1=-z2, up to a scaling.
- Alternatively, in definition of z-vector one can use arbitrary Lp-norm:

where ||v||p =(∑j |v|p)1/p is Lp-norm of vector v, in particular, ||v||1 =∑j·|vj| or ||v||∞=maxj |vj|. Previously given definition is equivalent to a choice of L2-norm: ||v||2=sqrt(∑j vj 2). So generalized z-vectors will belong not to a sphere but to so called superquadric, which in the particular cases p=1,∞ becomes a regular polyhedron. Also, alternatively to the angular distance between two z-vectors one can use an arbitrary metric, e.g. any monotonically increasing function f(θ), possessing a property f(0)=0. - In other words, in a preferred embodiment, the
data item adapter 240 may calculate the deviation vectors of the data items, so that the calculated deviation vectors represent z-score vectors of the data items. - Further, the
correlation determiner 120 calculates acorrelation value 122 for each data item of the plurality of data items. Acorrelation value 122 can be determined in many different ways. For example, acorrelation value 122 may be calculated so that the absolute value of the calculated correlation value varies between a minimal correlation value indicating a low correlation or no correlation and a maximal correlation value indicating a strong correlation. For this, for example, a Pearson correlator may be used. - For example, the scalar product of two z-vectors is equal to Pearson's correlator since

- It is also related with the angular distance of the z-vectors on the sphere:

- See for example
Fig. 8 . Pearson's correlator, often used as a measure of correlation, indicates strong correlation in the limit of corr→1 (maximal correlation value), corresponding to z1→z2, θ→0 (minimal correlation value) or in the limit corr→1, corresponding to z1→-z2, θ→π. The sign of Pearson's correlator shows the direction of dependence of data items: in the case corr=1, z1 increases with increase of z2, in the case corr=-1, z1 decreases with increase of z2. If not the direction of dependence is of interest, but only the fact of such dependence, one can formally consider a sphere of z-vectors as projective space, where opposite points are glued together and are considered as identical points. In this space approximately opposite vectors become approximately coincident. - In other words, the
correlation determiner 120 may calculate thecorrelation value 122 for each data item of the plurality of data items, so that acorrelation value 122 calculated for a first deviation vector (e.g. z-score vector) of a data item is equal to acorrelation value 122 calculated for a second deviation vector (e.g. z-score vector) comprising an opposite direction in comparison to the first deviation vector. - Further, the cluster analysis may be done in many different ways. Although a correlation-independent cluster analysis may be used, in preferred embodiments of the invention, the cluster analysis considers a correlation of the data items. In this connection, the cluster analysis may also be called correlation clustering or correlation cluster analysis.
- The task of correlation clustering is to group all strongly correlated data items in one cluster and subdivide all data items to a few such clusters. This allows to identify the parts of data which behave similarly and to reduce the number of independent degrees of freedom of the system to few cluster centers. Clustering provides a compact representation of experimental data, suitable for direct analysis by user. Formally this representation can be defined as a reconstruction of original bulky data in terms of cluster centers and association of all data with these centers. Reconstruction proceeds in two phases, wherein phase I is determination of cluster centers and phase II is assignment of data items to cluster centers.
- For example, correlation clustering becomes straightforward in z-space representation. One only needs to group together closely located z-vectors with any suitable general clustering technique. Many efficient clustering techniques are known to be applicable to this problem, as for example, density-based clustering, k-means clustering, dendrogram clustering or spectral clustering.
- Details of these techniques will be presented below. Most of them possess as a control parameter a cluster diameter diam related to Pearson's correlator by the formula

- The density-based clustering technique estimates the density of data items in z-space by introducing a discretization of z-space to a finite set of hypercubes. The hypercubes should cover the unit-norm sphere where all data items are located. The hypercube size should correspond to the optimal cluster diameter diam=arccos(corr). In every hypercube, matching z-score vectors are counted. Although the total number of hypercubes is huge due to the large dimension of z-space - this phenomenon is referred as "curse of dimensionality" -, only a small portion of hypercubes is filled. Practically, the number of filled hypercubes is much less than the number of data items. For efficient access to so structured data, one can use known methods of multidimensional indexing, based on binary search trees. Such methods support rapid search, insert and erase operations, with a typical operation count of O(log(Nelements)). An implementation of the methods can be found in standard software libraries such as C++ standard template library STL. After processing all data items and storing hypercube count data in a binary tree, the following procedure is applied, see
Fig. 3 . An hypercube A with a maximal count is selected, and its center is defined as the cluster center. Then all hypercubes B are removed possessing a correlation with A stronger than a specified weak limit (e.g. those with |corr|>0.5). The procedure is repeated for the remaining hypercubes C until the maximal count becomes small. Density-based clustering requires O(Ncubes) memory and between O(Ndata * Nexp) and O(Ndata *log(Ncubes)) floating point operations, where in practice Ncubes<< Ndata. - The k-means clustering technique, also known as Voronoj iteration, is illustrated by
Fig. 4 . Its initialization requires specifying the expected number of clusters k and randomly selecting k cluster centers. Then each data item is assigned to the nearest cluster center, and new cluster centers are recomputed. This step is repeated iteratively until the cluster assignments do not change any more. This technique allows to obtain a minimal average cluster diameter, which therefore becomes a function of number of clusters k: <diam>(k). The optimal value of k corresponds to <diam>(k*)=arccos(corr). This can be achieved by initially selecting a small value of k (underestimation, e.g. k=5) and sequentially incrementing k until optimal condition is met. Otherwise one can select a large value for k (overestimation, e.g. k=1000) and decrement k to the optimal value. k-means has moderate requirements w.r.t. memory O(Ndata * Nexp), and computational complexity O(Ndata * Nexp *k*Niter), depending on the number of iterations. - The dendrogram clustering technique, also known as agglomerative hierarchical clustering, stores a distance matrix for clusters d(X,Y). For the case of correlation clustering it can be related with correlation matrix, defined in terms of scalar products of corresponding z-vectors, e.g.

- So-defined distance between data items is then used to determine distance between clusters, by means of one of these alternative definitions:
single linkage: d(X,Y) = min d(x,y), x∈X, y∈Y, complete linkage: d(X,Y) = max d(x,y), x∈X, y∈Y, average linkage: d(X,Y) = avg d(x,y), x∈X, y∈Y. - The method defines original points as initial clusters, then applies to them the following procedure. A pair of clusters is found possessing minimal distance. This pair is merged to a new cluster, and the distance matrix is updated accordingly (merging two rows corresponding to clusters X and Y to a new row using the linkage formula above, complementing merge of X and Y columns from matrix symmetry). The procedure is repeated until all data will be merged into one cluster, or a stopping criterion will be met. For example, if the minimal distance exceeds the critical diameter diam=arccos(corr), iterations can be stopped. A sequence of merged clusters defined by this procedure can be graphically displayed as a tree-like diagram, called dendrogram, see
Fig. 5 . A stopping criterion cuts off a tree not reaching the root, leaving a number of clusters with user-controlled diameter. Dendrogram clustering is memory- and computationally expensive, since it requires to store a O(Ndata 2) distance matrix and to perform up to O(Ndata 3) operations for processing. For bulky data, it can be applied only in a combination with a special subsampling procedure, as described below. On the other hand, this technique is non-iterative and has a predictable completion time. - Spectral clustering is based on a special matrix decomposition, known as singular value decomposition (SVD). The Z-matrix is a row-wise collection of z-vectors for all data items and is decomposed as follows:

where A is a diagonal matrix of size Nexp * Nexp, U is a column-orthogonal matrix of size Ndata * Nexp, V an orthogonal square matrix of size Nexp * Nexp:
- A computationally efficient method to perform this decomposition in our practical case with Ndata >> Nexp is to find the Gram matrix:
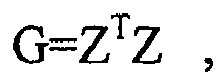
perform its spectral decomposition:
and compute the remaining U-matrix with the formula: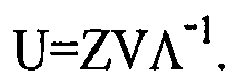
- The Gram matrix has a moderate size of Nexp * Nexp which allows to load the whole G-matrix to memory and apply any suitable method for spectral matrix decomposition (e.g. Jacobi method). Practically, the computational complexity of this step is negligible compared with the other steps. Computation of G-matrix consists of sequential reading of data items and incrementing the elements of G-matrix, e.g. for n-th data item (n=1.. Ndata):

requiring O(Ndata * Nexp 2) floating point operations and O(Nexp 2) amount of memory. Computation of U-matrix requires to read the database once more, performing O(Ndata * Nexp *Nclust) floating point operations and storing O(Nexp 2) data items. Further optimizations are possible, based on symmetry of G-matrix, storage of only Nexp * Nclust piece of V-matrix etc. Here, Nclust is the number of selected spectral clusters, practically Nclust << Nexp, seeFig. 6 . - Selection of clusters can be performed using Parseval's criterion. The SVD spectrum of the Z-matrix is represented by elements of the diagonal matrix A. These values are non-negative and sorted in non-ascending order. If all these values starting from a certain number Nclust +1 are omitted (i.e. set to zero), the resulting reconstruction of Z-matrix will have a deviation dZ. L2-norm of this deviation gives

i.e. the sum of squares of omitted spectral values. This formula allows controlling precision of reconstructed Z-matrix. Usually Λk rapidly decreases with k, and a few first A values give sufficient precision. - In this way, spectral clustering provides an efficient representation of the Z-matrix as a linear combination of a small number of U-vectors. It is convenient to scale these vectors by entries of the diagonal A-matrix, writing Ψ=UΛ. Column vectors of Ψ are called spectral clusters or modes, while column vectors of the V-matrix define corresponding cluster centers in z-space.
- In a separable case, when all data items can be assigned to Nclust exactly uncorrelated clusters, the cluster centers in z-space, found by any other clustering method, become mutually orthogonal (since scalar product is equal to correlator) and identical with columns of V-matrix. U-vectors in this case will have non-overlapping content, taking non-zero values on data items from corresponding cluster and zero values outside.
- Generally, there can be data items weakly correlated with several cluster centers. In this case, U-vectors will overlap, reflecting the fact that data items belong simultaneously to several clusters. Also, cluster centers can be weakly correlated with one another and can be approximately, but not exactly orthogonal. In this case, V-vectors will represent an orthogonal basis in z-space nearest to cluster centers, in this way approximating positions of actual cluster centers. The reconstruction of the Z-matrix provided by spectral clustering remains exact also in this general case and can be used e.g. for interpolation of bulky data (see below).
- The formulae above implement spectral clustering for the Z-matrix. This is mathematically equivalent to a spectral decomposition of the correlation matrix

- Here, the matrix C has size Ndata * Ndata and is composed of scalar products of z-score vectors for every pair of data items (equal to correlator of data items). Due to a huge size of this matrix, it is practically impossible to compute, store or spectrally decompose it directly. However, the above method provides its correct and computationally efficient spectral decomposition. One can use in the above formulae instead of the Z-matrix the dX-matrix, composed of dx-vectors (see above). The resulting decomposition will be equivalent to spectral decomposition of the
covariance matrix 
which has the same size Ndata * Ndata and is composed of average values covij=<dxi dxj> (with a normalization factor Nexp). The matrices C and C2 differ only in scaling factors, equal to scatter rms(xi), applied to every row and column. Generally, one can assign an arbitrary weight per data item, e.g. for the purpose of selecting more interesting regions of data and compute SVD for matrix QZ, where Q is a diagonal matrix containing these weights. This is equivalent to the spectral decomposition of the matrix
- The results of spectral clustering for different selections of weights are equivalent up to orthogonal transformation, i.e. after a variation of weights, Ξ=Q-1UA is replaced by Ξ→ΞΩ, with Ω being a Nexp * Nexp orthogonal matrix:

- In the separable case described above, the matrices C, C2, Cq have block-diagonal structure and their decompositions become independent on weights (Ω=1).
- A problem which can occur in application of clustering techniques is appearance of chains of data items where consequential items are strongly correlated but beginning and end items are not correlated. Such chains should not be merged in one cluster. Density-based clustering includes a special algorithm for elimination of strongly correlated chain members. The k-means technique attempts to minimize the average cluster diameter and will tend to break the chains and assign them to different cluster centers. The dendrogram technique is free from the chaining phenomenon if the complete linkage scheme is used. Spectral clustering produces cluster centers which are orthogonal and uncorrelated by definition.
- It has been already noted that only the absolute value of the correlator is important, and opposite z-vectors can be identified by means of gluing the z-sphere to (Nexp -2)-dimensional projective space. The density-based technique can be modified to count opposite z-vectors in the same hypercube applying a transformation z' = {z,z1≥0; -z,z1<0} and covering only half of the sphere by hypercubes. k-means can be similarly modified by redefinition of the assignment criterion: a z-vector is assigned to cluster center zc if the absolute value |(z,zc)| is maximal, and a z-vector is reverted z→-z if (z,zc)<0. The dendrogram technique takes the structure of the projective space automatically into account by a special definition of the non-Euclidean distance, so that opposite z-vectors produce a zero entry in the distance matrix. Spectral clustering merges opposite cluster centers in one cluster, assigning them to one V-vector.
- Summarizing, the
cluster analyzer 110 may determine at least one cluster center 112 (e.g. represented by a cluster center vector) based on a density-based cluster analysis, a k-means cluster analysis, a dendrogram cluster analysis, a spectral cluster analysis or another clustering technique. In this connection, thecluster analyzer 110 determines cluster centers 112 of clusters of data items comprising strongly correlated data items. This means that the cluster analysis identifies clusters of strongly correlated data items. Strongly correlated means in this connection that these data items are correlated stronger to each other or thecorresponding cluster center 112 than to the other determined cluster centers of data items. - Further, the symmetry of the projected space may be exploited. For this, the
cluster analyzer 110 may map deviation vectors (e.g. z-score vectors) representing data items comprising opposite directions to the same cluster center. Depending on the bulky data, thecluster analyzer 110 may determine one or more cluster centers of data items based on the cluster analysis of the plurality of data items. Consequently, thecorrelation determiner 120 may calculate acorrelation value 122 between eachdetermined cluster center 112 and each data item of the plurality of data items. In this way, for each data item of the plurality of data items a cluster center comprising the strongest correlation to the data item may be identified and the data item can be assigned to this cluster center. - The clustering methods mentioned above may require different run times depending on the input bulky data and other parameters of the cluster techniques. Some of the clustering methods can be accelerated by simple adaptations.
- Spectral clustering allows to process data items sequentially one after the other and has the minimal memory requirements. On the other hand, it requires considerable computational effort for filling the Gram matrix.
- If the
cluster analyzer 110 determines the plurality of cluster centers based on a spectral cluster analysis, the number of cluster centers of the plurality of cluster centers determined by thecluster analyzer 110 may depend on or may be set by Parseval's criterion. - Density based clustering also allows to process data items sequentially, since it stores only density information per hypercube. Its problem, however, is a rapidly increasing number of hypercubes and proportional memory requirements. Practically there are only a few hypercubes with millions of data items, and millions of hypercubes contain only a few data items. Only the most populated hypercubes are interesting for the analysis. The following intermediate "cleaning procedure" can reduce the memory usage. During the filling of hypercubes, periodically, e.g. after every million data items and N1=100 times totally, hypercubes which have too few data items, e.g. less than N2=100, are removed. As a result, only a few really populated hypercubes survive the procedure. The amount of data per hypercube can be underestimated by N1*N2=10000 which is much less than the amount of data items in the hypercube (a million). This procedure, similar to the percentage hurdle voting rule, allows a significant reduction of the total memory usage of the algorithm.
- In other words, for example, if the cluster analyzer determines the plurality of cluster centers based on a density-based cluster analysis, the plurality of cluster centers determined by a
cluster analyzer 110 may contain only cluster centers comprising more than a predefined minimum number of assigned data items after considering a predefined number of data items of the plurality of data items. Cluster center containing less than the minimal number of assigned data items after considering the predefined number of data items may be neglected or deleted. The predefined number of data items of the plurality of data items may be small compared to the number of data items of the plurality of data items or the number data items of the bulky data (e.g. 1/10, 1/100, 1/1000 or less). - Other clustering methods require processing simultaneously all data items and, for optimal performance, need to load in memory the whole data matrix or even the larger distance matrix. Due to their enormous sizes this is practically impossible. The following observation allows applying these methods nevertheless. Since the most interesting clusters contain millions of data items, their centers and the actual density of data in them can be reliably determined on much smaller statistics than the full set. Subsampling of data items is a selection of random subset in the full set of data items, which can be used for determination of cluster centers. The selection should be really random and not correlated with node, part or state structure of the dataset. After determining the cluster centers, the full set of data items is processed once to assign them to the clusters. This approach is similar to a public opinion poll by selecting a representative sample of the population. It allows reducing the memory usage and accelerating computation significantly (by a factor of thousands).
- More generally, the bulky data may comprise more data items than the plurality of data items and a pre-selection of data items may be done to obtain the plurality of data items. For this, the apparatus for analyzing the bulky data may comprise a data item selector. The data item selector may select the data items of the plurality of data items randomly or pseudo-randomly from the data items contained by the bulky data. In the embodiment shown in
Fig. 2 , the data item selector may be located between thedata item adapter 240 and thecluster analyzer 110 or before thedata item adapter 240. - In this connection, the
correlation determiner 120 may calculate acorrelation value 122 not only for the plurality of the data items, but also for the other data items contained by the bulky data. In other words, thecorrelation determiner 120 may calculate a correlation value between the determined cluster center and each data item of the bulky data. - In the described example, correlation clustering delivers cluster centers in form of z-vectors. In addition to cluster centers, the user can define other points of interest involving her/his engineers knowledge of the problem. For example, certain control points on the car body can be important from safety requirements and should be included into the points of interest list.
- Consequently, the
correlation determiner 120 may calculate a correlation value between each item on the list of points of interest and each data item of the plurality of data items. The list of points of interest may comprise thedetermined cluster centers 112 and at least one user-defined point of interest. - After the POI list (list of points of interest) has been set up, the main pass of the computation is applied. For example, it computes correlator corr(POI,*) of all items from the POI list with all data items, as well as scatter amplitude rms(*) for all data items. This step involves one-time reading of all data and is normally one of the most time consuming parts of the analysis.
- In the following, an example for a data organization for the main pass is described. The data items are stored in uncompressed or compressed form with a random access to blocks of data (e.g. states). Experiments can be stored in a few separate files (e.g. Nexp =25), which may be opened simultaneously. This structure supports an optimal order of data reading, which allows rapid sampling of one data item, i.e. xij, at i fixed, j varied from 1 to Nexp. This vector is transformed to the z-space, where a few of computations are performed to find rms, corr and other necessary statistical measures of the data item. The resulting measures are written blockwise to a file, if necessary, in compressed form. For example, the data can be written in the data format of the original experiments, ready for visualization with any suitable post-processor program.
- To achieve a more compact storage and comprehensive visualization, for tensor structures, such as 3-vectors and 3x3 matrices, an effective norm can be selected and written to a file as a scalar value. For example, scatter of vector values has three components, and its Euclidean norm appear to be most convenient:

- For the correlator, the maximal absolute value appears more convenient

since |corrij|→1 implies that at least one of the tensor components represents strong correlation. In the formulae above, data items are ordered by triples: (X1,Y1,Z1,X2,Y2,Z2,...), seeFig. 11 . On this figure highest hierarchical levels are timesteps t1,t2,..., each of them contains nodes, represented by triples of coordinates. - The lost component information can be recovered afterwards by observing raw data plots for any pair of selected nodes. For example, for a destination point from the POI list and for a corresponding source point found in causal analysis, raw data can be extracted from the data set and displayed as 3x3 plots including all component combinations, see
Fig. 9 . The data items x1, y1, z1 indicating a position in space of a point of interest in a 3-dimensional coordinate system and data items x2, y2, z2 indicating a position in space of a source point found in causal analysis. The data items of the point of interest are compared with each data item of the source point resulting in one of the nine plots shown inFig. 9 . Each plot comprises for each experiment of the plurality of experiments one data point indicating the relationship between the position of the point of interest and the position of the source point. Alternatively, for example, instead of the absolute position of the points, also differences of the positions in comparison to positions of preceding timesteps may be considered. Random access to data items allows to accelerate such data extraction. It accelerates also clustering algorithms, utilizing a subsampling procedure, since only a small selected subset of data must be read. Also, extraction of user-defined POI for computation of correlator is accelerated. Cluster centers which are formally added to the POI list are already presented as z-score vectors and do not need to be extracted. Other parts of computation require only sequential data access. - Summarizing, the effort for processing each of the clustering techniques mentioned includes, in addition to purely computational effort, also input/output operations. For determination of cluster centers one needs O(Nsubsamp* Nexp) reading operations, if subsampling is applied, else O(Ndata * Nexp) reading operations without subsampling. For output of clustering data one needs O(Ndata * Nexp) operations for one-pass reading of the whole database and O(Ndata *Nclust) operations to write the clustering results. All input/output operations can be accelerated using data compression algorithms.
- In some embodiments according to the invention, the
data analyzer 130 may generate a partition diagram based on calculated correlation values to present the results of the analysis of the bulky data. - A partition diagram is a subdivision of a geometrical model to regions of influence: each data item from the geometrical model is checked against user-specified and/or cluster POI lists to find closest POI in the sense of correlation distance dist=arccos(|corr|). A single scalar value may be stored per state and node, the integer part of which is a number of the closest POI and the fractional part of which is related with the correlator to this POI:

- For example, val=3.2 means that a given point has strongest correlation with the third POI at the level corr=0.8, while val=3.7 means that strongest correlation is still achieved for the third POI, although the correlation level is weak, corr=0.3.
- Representation of data in a form of partition diagram shows - at a glance - the correlation structure of the whole data set. Selecting an appropriate visualization range in available postprocessing tools such as GNS Animator, one can investigate further details e.g. search a time step where the region of influence for a particular POI originates, in order to identify the source of scatter related with this POI.
- For example,
Fig. 13 shows a partition diagram of a real life example. The partition diagram, depicted onFig. 13 , shows at a glance distribution of correlators in the model. Several correlation clusters have been detected, in particular: - Cluster A1-A2-A3 corresponds to buckling of bottom longitudinal structure, whose influence propagates through the driver's seat and extends to the whole left-rear side of the car.
- Cluster B1-B2-B3 starts on left wheel house and propagates through the steering column to the right side of the car.
- Cluster C1-C2-C3 starts on the bumper at the moment of crash with the barrier and extends over the motor hood.
- For example, color (or grey code) may be used to distinguish clusters on the model.
- Some embodiments according to the invention relate to a
data analyzer 130 performing a scatter analysis, a causal analysis, a linear sensitivity analysis, a non-linear sensitivity analysis or a metamodeling of the bulky data based on calculated correlation values. - In this connection, the
data analyzer 130 may perform the cluster analysis based on some or all calculated correlation values. For example, only one or some cluster centers may be analysed and therefore only the corresponding calculated correlation values may be considered. - In some embodiments, the data analyzer may perform a causal analysis or scatter analysis, the causal analysis or the scatter analysis of the bulky data may be based on calculated correlation values aiming to identify causal chains processing a large correlation.
- A practical problem of causal analysis in crash-test simulations is often not a removal of a prime cause of scatter, which is usually the crash event itself. It is more an observation of propagation paths of the scatter, with a purpose to prevent this propagation, by finding regions where scatter is amplified (e.g. break of a welding point, pillar buckling, slipping of two contact surfaces etc). Therefore it is necessary to check an amplitude of scatter rms(x) along the causal chain. Also, small cause can have large effect and formally earliest events in the causal chain can have a microscopic amplitude ("butterfly effect"). Again, it is reasonable to search for amplifying factors and try to eliminate them, not the microscopic sources.
- Causal chains can be defined as regions in space-time possessing a large correlator (e.g. |corr|>0.7) with a given destination point. Such regions can be directly visualized using computed correlation data. A selection of the best representative path inside the chain can be done using 2-dimensional multi-objective optimization for finding parts with maximal correlation at earliest possible state. This gives a curve (Pareto front) on a 2-dimensional plot (time,|corr|) representing the causal chain, see
Fig. 7 . One can also add to the representative set a neighborhood of the Pareto front, which can be determined with Pareto ranking methods. - In other words, the
data analyzer 130 may reconstruct a causal chain based on a Pareto ranking of correlation values. - An illustration of a causal analysis is shown in
Fig. 12 . In this example the crash model of the car comprising 1 million nodes, 32 timesteps and 25 simulations (experiments) is illustrated. - Crash intrusions in foot room of the driver and passenger are commonly considered as critical safety characteristics of car design. These characteristics possess numerical uncertainties, whose analysis falls in the subject of this patent. For user specified destination point, selected in driver's foot room, depicted on
Fig. 12 bottom, correlators have been computed using the method described in this patent. Color (grey code) displays the value of correlator. A source of the scatter has been identified at earlier time step by increased value of correlator. The source is related with a buckling of longitudinal structure depicted onFig. 12 top. The values of large correlator propagate along the causal chain depicted onFig. 12 middle. This chain, detected with Pareto front algorithm, shows propagation of the scatter from the source towards steering wheel, and further to the foot room destination point. - Alternatively or additionally to the scatter analysis or causal analysis, the
data analyzer 130 may perform a linear sensitivity analysis of the bulky data. - Sensitivity analysis considers dependence of the numerical result on variation of control parameters park, k=1...Npar. In crash problems such control parameters can be e.g. thicknesses of car body components, initial velocity of collision, material properties etc. The purpose of linear sensitivity analysis is, based on the determination of a Jacobi matrix Jik=∂xi/∂park or, in a different normalization, a sensitivity matrix Sik=Jikrms(park), a decision which parameters mostly influence the data. Our correlation data allow solving rapidly also this task. Particularly, in case of a uniform design of experiment (DoE) with a random and uncorrelated change of parameters, we have

i.e. the sensitivity matrix is proportional to the correlator of data item with variation of parameter. To compute these data, one only needs to include data items representing the variation of parameters to the list of POI, in addition to cluster centers and user-defined POIs. However, in case of many parameters, the resulting sensitivity matrix is too bulky for direct representation to the user. It is better to compute the sensitivity matrix only for cluster centers, since they represent main tendencies in data:
- This gives a comprehensible matrix of size Nclust x Npar, the entries of which can be directly visualized to detect most influencing parameters, see
Fig. 10 . The sizes of squares represent values of matrix elements. Further, color can be used to display sign of the dependents. - A similar formula can be obtained also for a non-uniform DoE and a correlated change of parameters:

where Cmk=corr(parm,park) is the inter-correlation of parameters. - For performing the linear sensitivity analysis, the
correlation determiner 120 may add a data item representing a variation of a control parameter of the experiments and calculate the correlation value between the added data item and each data item of the plurality of data items. Alternatively or additionally, thecorrelation determiner 120 may calculate a correlation value between the added data item and each determined cluster center. Further, thedata analyzer 130 may determine a sensitivity matrix or a sensitivity vector based on the determined correlation values of the added data item and may perform the linear sensitivity analysis based on the determined sensitivity matrix or sensitivity vector. - Further, alternatively or additionally, the
data analyzer 130 may perform a non-linear sensitivity analysis or a metamodeling of the bulky data. - Metamodeling is an interpolation or approximation method applied to existing simulations to predict the result of a new simulation performed at intermediate values of parameters. Often non-linear methods are used to catch non-linear parametric dependencies. The usage of radial basis functions (RBFs) is quite convenient, i.e. a representation of the form

is used, where pari are coordinates of the i-th run in the space of design variables; f is the objective value, interpolated to a new point par; Φ() are special functions, depending only on the Euclidean distance between the points par and pari. The coefficients ci can be obtained by solving a linear system
where fi are the user-provided data, which could be single criteria or bulky simulation results, associated with i-th simulation run. The solution can be found by direct inversion of the moderately sized Nexp * Nexp system matrix Φij = Φ (|pari -parj|). The result can be written in a form of weighted sum:
with the weights wi(par) = ∑j Φ-1 ij Φ (|par-parj|). This representation makes an interpolation of bulky simulation data possible at a rate (computational complexity) linear with respect to the size of the dataset. - A suitable choice for the RBF is the multi-quadric function (see for example "Buhmann N.D., Radial basis functions: theory and implementations, Cambridge University Press, 2003")

where c is a constant defining smoothness of the function near data point par=pari. In between data points, the result of the interpolation is a cumulative effect of many contributions and, except of this smoothness, there is almost no influence of coefficient c to the result. Therefore no adjustment procedures (learning) is necessary, in contrast to other interpolation techniques like Kriging and neural networks. RBF interpolation can also be combined with polynomial detrending, adding a polynomial part P:
- This allows reconstructing exactly polynomial (including linear) dependencies and generally improving precision of interpolation. Formulae for coefficients ci and interpolation weights wi can be updated accordingly.
- Metamodeling is employed to complete sensitivity analysis for non-linear dependencies, where instead of the Spk matrix other quantities can be used as sensitivity measures. For example

with the maximum taken over the k-th central cross-section in parameter space:
- Also the sign of Spk can be tested along the cross section, and the global sign of the dependence can be introduced, equal to +1 if all Spk are positive on cross-section, -1 if all Spk are negative and 0 for sign changing Spk. This information can be easily presented graphically, e.g. in the form shown on
Fig. 10 . - Possible interaction terms can be estimated similarly using higher order derivatives.
- Metamodeling is also used for the solution of optimization problems. In practical applications, engineers are confronted with simultaneous optimization of multiple objectives, coming from different types of simulations (so called multidisciplinary optimization problems). It is often desirable to interpolate the whole model (even on highly resolved geometries), instead ofsome scalar optimization criteria only, in order to have a possibility to inspect the (Pareto-) optimal design in full detail. Such kind of bulky data metamodeling can be significantly accelerated using correlation clustering described in this patent.
- This possibility is based on the fact that, for bulky crash data, the (approximate) rank of the data matrix is usually much smaller than the number of experiments, rank« Nexp. The rank of a matrix is the maximal number of linearly independent columns and also rows in it. This fact means that not the whole z-space is used, but a small subspace in it. To identify this subspace, any of the above described clustering methods can be used. The basis of this subspace can be spanned on cluster centers. Because all clustering techniques except of spectral clustering can produce a non-orthogonal basis, the decomposition formula should generally use a dual basis:


- Here, zc' is the dual basis to zc, G is the Gram matrix of the basis zc. Rewriting this formula in terms of correlators, and expressing dx

as a result, the whole data matrix can be expressed as a sum of Nclust terms found earlier with the corr(clustPOI,*) algorithm. The advantage of such representation is that Nclust =rank<< Nexp leading to a reduction of storage and the possibility to accelerate all processing operations applied to this matrix. Particularly, non-linear metamodeling of bulky data represents an interpolated result as a weighted sum:
- With the clustering representation above this gives

providing an acceleration factor of Nexp / Nclust, compared with the direct computation of the weighted sum. - A similar representation can be written for spectral clustering:


where columns of V define centers of clusters and
- A further advantage of RBF metamodeling is that it allows not only to interpolate data in a new parameter point, but also to estimate precision of this interpolation. In an existing data point, this precision can be estimated using a known cross-validation procedure: the data point is removed, data are interpolated to this point and compared with the actually measured value at this point. Formally, for this comparison one needs to construct a new metamodel where the data point is removed. For an RBF metamodel with detrending this step can be performed analytically, resulting in the following direct formula:

where ci and Φ were defined above. In between data points, the so-estimated error can be interpolated, using e.g. the same RBF weights wi. The error formula above is applicable also for bulky data, since
is represented as a weighted sum of data items and correlation clustering allows accelerating its computation as well. - As explained above, the
data analyzer 130 may control a precision of the metamodeling based on a cross-validation. -
Fig. 14 shows a flow chart of amethod 1400 for analyzing bulky data according to an embodiment of the invention. The bulky data comprises a plurality of data items, each data item comprising a data value for each experiment of a plurality of experiments by which the bulky data was obtained. Themethod 1400 comprises determining 1410 a cluster center of a cluster of data items, calculating 1420 correlation values and analyzing 1430 the bulky data. The cluster center of the cluster of data items is determined 1410 based on a cluster analysis of the plurality of data items. Further, a correlation value is calculated 1420 between the determined cluster center and each data item of the plurality of data items. A correlation value indicates a correlation strength of the cluster center and a data item. Further, the bulky data is analyzed 1430 based on calculated correlation values. - The
method 1400 may comprise additional, optional steps representing features of the inventive concept mentioned above. - Some embodiments according to the invention relate to a correlation clustering of bulky data and its application in the analysis of crash-test data and fields with similar phenomena.
- For example, a method for the analysis of crash-test data and fields with similar phenomena is disclosed which allows accelerating scatter analysis, causal analysis, sensitivity analysis and metamodeling of bulky data.
- The method consists of the following steps. Firstly, a number of crash-test simulations or real experiments is performed and stored in the database. Secondly, correlation clustering of data items in the database is performed. Thirdly, a list of points of interest (POI) is formed including cluster centers, user defined points and variations of design parameters. Fourthly, one-pass computation of scatter and correlator of all data items with the POI list is performed. Fifthly, a partition diagram is set up. Sixthly, scatter and causal analysis is performed based on Pareto ranking of scatter and correlator data. Seventhly, linear sensitivity analysis is performed using correlator of parameter variations with the POI list. Eighthly, non-linear sensitivity analysis and metamodeling of bulky data are performed based on reconstruction of database in terms of correlation clusters.
- Crash-test simulations possess a stochastic component, related with physical and numerical instabilities of underlying crash model and uncertainties of its control parameters.
- Scatter analysis is a characterization of this component, usually in terms of scatter amplitude distributed on the model's geometry and evolving in time. This allows identifying parts of the model, possessing large scatter and most non-deterministic behavior. The purpose is to estimate reliability of numerical results and do corresponding tolerance predictions.
- Causal analysis is determination of cause-effect relationships between events. In context of crash-test analysis, this usually means identification of events or properties causing the scatter of the results. This allows to find sources of physical or numerical instabilities of the system and helps to reduce or completely eliminate them.
- Causal analysis is generally performed by means of statistical methods, particularly, by estimation of correlation of events. It is commonly known that correlation does not imply causation (this logical error is often referred as "cum hoc ergo propter hoc": "with this, therefore because of this"). Instead, strong correlation of two events does mean that they belong to the same causal chain. Two strongly correlated events either have direct causal relation or they have a common cause, i.e. a third event in the past, triggering these two ones. This common cause will be revealed, if the whole causal chain i.e. a complete sequence of causally related events will be reconstructed. Practical application of causal analysis requires formal methods for reconstruction of causal chains.
- Sensitivity analysis considers dependence of the numerical result on variation of control parameters. It allows to identify the parameters possessing most influence to the result and the parts of the model where the impact of such variation is considerable.
- Metamodeling of simulation results allows making prediction for the model behavior at new values of control parameters, where no simulation has been done yet. These values of parameters are usually intermediate in respect to existing ones, where simulations are available. Predictions are needed for analysis and optimization of product properties during the design stage and are usually completed with a control simulation done at the optimal parameter values.
- Solution of all these tasks can be significantly accelerated using correlation clustering methods described before.
- Some embodiments according to the invention relate to a method for crash-test data analysis comprising performing a number of crash-test simulations or real experiments and storing the results in a database, correlation clustering of data items in the database and analysis of the cluster data.
- According to an aspect of the invention, a z-score representation is used for the correlation clustering. Further, the correlation clustering may be performed using a density-based clustering technique, a k-means clustering technique, a dendrogram clustering technique or a spectral clustering technique.
- According to another aspect of the invention, the correlation clustering may be accelerated by intermediate cleaning or subsampling technique.
- Further, a list of points of interest (POI) may be formed including cluster centers and/or user defined points and/or variations of design parameters.
- The results of the correlation clustering may be presented in form of the partition diagram.
- According to another aspect of the invention, scatter and/or causal analysis may be performed based on scatter and/or correlator data. The causal analysis may be performed by reconstructing causal chains using Pareto ranking of correlated data (correlation values).
- Further, a linear sensitivity analysis may be performed using correlator (a correlation value) of parameter variations with the points of interest (POI) list.
- Alternatively or additionally, a non-linear sensitivity analysis and/or metamodeling of bulky data may be performed based on a reconstruction of the database in terms of correlation clusters. This non-linear sensitivity and/or metamodeling may be performed using multi-quadric radial basis functions (RBF) with detrending. The precision of the metamodeling may be controlled by means of the cross validation procedure.
- According to another aspect of the invention, the precision of bulky data reconstruction may be controlled by means of Parseval's criterion.
- Further, a non-linear sensitivity measure and global sign of dependence may be evaluated on cross-sections in parameters space as described in the embodiments.
- Although some aspects of the described concept have been described in the context of an apparatus, it is clear that these aspects also represent a description of the corresponding method, where a block or device corresponds to a method step or a feature of a method step. Analogously, aspects described in the context of a method step also represent a description of a corresponding block or item or feature of a corresponding apparatus.
- Depending on certain implementation requirements, embodiments of the invention can be implemented in hardware or in software. The implementation can be performed using a digital storage medium, for example a floppy disk, a DVD, a Blue-Ray, a CD, a ROM, a PROM, an EPROM, an EEPROM or a FLASH memory, having electronically readable control signals stored thereon, which cooperate (or are capable of cooperating) with a programmable computer system such that the respective method is performed. Therefore, the digital storage medium may be computer readable.
- Some embodiments according to the invention comprise a data carrier having electronically readable control signals, which are capable of cooperating with a programmable computer system, such that one of the methods described herein is performed.
- Generally, embodiments of the present invention can be implemented as a computer program product with a program code, the program code being operative for performing one of the methods when the computer program product runs on a computer. The program code may for example be stored on a machine readable carrier.
- Other embodiments comprise the computer program for performing one of the methods described herein, stored on a machine readable carrier.
- In other words, an embodiment of the inventive method is, therefore, a computer program having a program code for performing one of the methods described herein, when the computer program runs on a computer.
- A further embodiment of the inventive methods is, therefore, a data carrier (or a digital storage medium, or a computer-readable medium) comprising, recorded thereon, the computer program for performing one of the methods described herein.
- A further embodiment of the inventive method is, therefore, a data stream or a sequence of signals representing the computer program for performing one of the methods described herein. The data stream or the sequence of signals may for example be configured to be transferred via a data communication connection, for example via the Internet.
- A further embodiment comprises a processing means, for example a computer, or a programmable logic device, configured to or adapted to perform one of the methods described herein.
- A further embodiment comprises a computer having installed thereon the computer program for performing one of the methods described herein.
- In some embodiments, a programmable logic device (for example a field programmable gate array) may be used to perform some or all of the functionalities of the methods described herein. In some embodiments, a field programmable gate array may cooperate with a microprocessor in order to perform one of the methods described herein. Generally, the methods are preferably performed by any hardware apparatus.
- The above described embodiments are merely illustrative for the principles of the present invention. It is understood that modifications and variations of the arrangements and the details described herein will be apparent to others skilled in the art. It is the intent, therefore, to be limited only by the scope of the impending patent claims and not by the specific details presented by way of description and explanation of the embodiments herein.
Claims (16)
- Computer-implemented method applied to existing bulky data of geometrical models of simulations or experiments in engineering applications in order to interpolate or approximate the result of new simulations, the bulky data comprising a plurality Ndata of data items xi, wherein each data item xi comprises a data value xij for each experiment j of a plurality of experiments Nexp by which the bulky data was obtained, the method comprising:calculating, for each data item xi, the mean <xi> of all data values xij and, for each data value xij, a deviation value zij as zij = (xij - <xi>)/(rms(xi) sqrt(Nexp)), wherein rms() denotes the root mean square deviation and and sqrt() denotes square root;determining a plurality of Nclust cluster centers zcp based on cluster analysis of correlation values of deviation vectors zi of deviation values zij for each experiment j;performing an interpolation or approximation in a subspace of the z-space based on the calculated correlation values and the root mean square deviation of each data item of the plurality of data items, by determining an interpolated or approximated result dx*i as a a weighted sum of
 where wj are weights for interpolation and dxij is
 where corr(clustp,xj) are the correlation strengths of the cluster center p and the respective data item xi, zc' denotes a dual basis to cluster centers zcp.
 - Method according to claim 1, wherein the list of points of interest additionally comprises at least one user-defined point of interest and variations of design parameters,
- Method according to claim 1 or 2, wherein
each data item is one coordinate of a predefined point at a specific timestamp of a crash test object. - Method according to one of the claims 1 to 3, wherein the method comprises determining the cluster center (112) based on a density-based cluster analysis, a k-means cluster analysis, a dendrogram cluster analysis or a spectral cluster analysis of the plurality of data items, wherein the cluster analysis determines cluster center of clusters of data items being strongly correlated data items.
- Method according to one of the claims 1 to 4, wherein the method comprises calculating the correlation value (122) for each data item of the plurality of data items, so that an absolute value of all calculated correlation values (122) varies between a minimal correlation value indicating a low correlation strength or no correlation and a maximal correlation value indicating a high correlation strength.
- Method according to one of the claims 1 to 5, wherein comprises calculating the correlation values according to a Pearson correlator.
- Method according to one of the claims 1 to 6, wherein the method comprises generating a partition diagram based on calculated correlation values (122) to present the results of the analysis of the bulky data.
- Method according to one of the claims 1 to 7, wherein the method comprises performing a scatter analysis, a causal analysis, a linear sensitivity analysis, or a non-linear sensitivity analysis of the bulky data.
- Method according to any of claims 6 to 8, wherein the method comprises reconstructing a causal chain based on a Pareto ranking of correlation values (122).
- Method according to one of the claims 8 to 9, wherein the method comprises adding a data item representing a variation of a control parameter of the experiments and calculating a correlation value (122) between the added data item and each data item of the plurality of data items or calculating a correlation value between the added data item and each determined cluster center, wherein the method comprises determining a sensitivity matrix or a sensitivity vector based on the determined correlation values of the added data item, and performing a linear sensitivity analysis based on the sensitivity matrix or the sensitivity vector.
- Method according to one of the claims 8 to 10, wherein the method comprises performing a non-linear sensitivity analysis based on a radial basis function.
- Apparatus according to one of the claims 8 to 11, wherein the method comprises controlling a precision of the metamodeling based on a cross-validation.
- Method according to one of the claims 1 to 12, wherein wi = ∑j Φ-1 ij Φ (|par-parj|) where Φij = Φ (|pari -parj|) and pari is an i-th control parameter, and Φ() is a Radial basis function.
- Method according to any of claims 1 to 13, wherein the bulky data is crash test data.
- Computer program with the program code for performing the method according to claim any of claim 1 to 14, when the computer program runs on a computer or a micro controller.
- Computer having installed thereon the computer program according to claim 15.
Applications Claiming Priority (1)
| Application Number | Priority Date | Filing Date | Title |
|---|---|---|---|
| PCT/EP2010/061439 WO2012016594A1 (en) | 2010-08-05 | 2010-08-05 | Apparatus and method for analyzing bulky data |
Publications (2)
| Publication Number | Publication Date |
|---|---|
| EP2601618A1 EP2601618A1 (en) | 2013-06-12 |
| EP2601618B1 true EP2601618B1 (en) | 2014-10-01 |
Family
ID=44263219
Family Applications (1)
| Application Number | Title | Priority Date | Filing Date |
|---|---|---|---|
| EP10751825.0A Active EP2601618B1 (en) | 2010-08-05 | 2010-08-05 | Apparatus and method for analyzing bulky data |
Country Status (2)
| Country | Link |
|---|---|
| EP (1) | EP2601618B1 (en) |
| WO (1) | WO2012016594A1 (en) |
Families Citing this family (4)
| Publication number | Priority date | Publication date | Assignee | Title |
|---|---|---|---|---|
| TWI798314B (en) * | 2017-12-28 | 2023-04-11 | 日商東京威力科創股份有限公司 | Data processing device, data processing method, and data processing program |
| CN111881111A (en) * | 2020-07-21 | 2020-11-03 | 清华大学 | Force and flow field correlation experiment database system, data processing system and processing method |
| CN116825169B (en) * | 2023-08-31 | 2023-11-24 | 悦芯科技股份有限公司 | Abnormal memory chip detection method based on test equipment |
| CN116990298B (en) * | 2023-09-28 | 2023-12-08 | 南通中奥车用新材料有限公司 | Finished product quality evaluation system for artificial leather production equipment |
Family Cites Families (3)
| Publication number | Priority date | Publication date | Assignee | Title |
|---|---|---|---|---|
| ES2261534T3 (en) | 2002-02-22 | 2006-11-16 | Fraunhofer-Gesellschaft Zur Forderung Der Angewandten Forschung E.V. | PROCEDURE TO ANALYZE THE VARIATIONS IN THE RESULTS OF THE SHOCK PROCESSES. |
| DE10207503B3 (en) | 2002-02-22 | 2004-03-18 | Fraunhofer-Gesellschaft zur Förderung der angewandten Forschung e.V. | Analyzing crash process outcome scatter involves simulating locus point position spatial scatter at defined time points, analyzing whether position scatters of first and second locus points correlate |
| US7386425B1 (en) | 2003-11-03 | 2008-06-10 | Livermore Software Technology Corp. | Method and system for distinguishing effects due to bifurcation from effects due to design variable changes in finite element analysis |
-
2010
- 2010-08-05 EP EP10751825.0A patent/EP2601618B1/en active Active
- 2010-08-05 WO PCT/EP2010/061439 patent/WO2012016594A1/en not_active Ceased
Also Published As
| Publication number | Publication date |
|---|---|
| WO2012016594A1 (en) | 2012-02-09 |
| EP2601618A1 (en) | 2013-06-12 |
Similar Documents
| Publication | Publication Date | Title |
|---|---|---|
| Ashby | Multivariate probability distributions | |
| Bohn et al. | Analysis of car crash simulation data with nonlinear machine learning methods | |
| Kim et al. | Algorithms for nonnegative matrix and tensor factorizations: a unified view based on block coordinate descent framework | |
| Chalupka et al. | A Framework for Evaluating Approximation Methods for Gaussian Process Regression. | |
| Thomaser et al. | One-shot optimization for vehicle dynamics control systems: towards benchmarking and exploratory landscape analysis | |
| Kofnov et al. | Moment-based invariants for probabilistic loops with non-polynomial assignments | |
| EP2601618A1 (en) | Apparatus and method for analyzing bulky data | |
| Halder et al. | An adaptive minimum spanning tree multielement method for uncertainty quantification of smooth and discontinuous responses | |
| Jiménez-Pastor et al. | Forward and backward constrained bisimulations for quantum circuits | |
| Da Veiga | Distributional encoding for Gaussian process regression with qualitative inputs | |
| Ali et al. | Evaluation of latent space learning with procedurally-generated datasets of shapes | |
| Reisinger et al. | Finite difference methods for medium-and high-dimensional derivative pricing PDEs | |
| Foster et al. | A GPU-based approximate SVD algorithm | |
| Chalupka et al. | A framework for evaluating approximation methods for gaussian process regression | |
| Kruczyk et al. | Random reducts: A monte carlo rough set-based method for feature selection in large datasets | |
| Li et al. | Efficient level-crossing probability calculation for Gaussian process modeled data | |
| Hosseinpouri et al. | An area-specific stick breaking process for spatial data | |
| Gottschalk et al. | Coarsening in algebraic multigrid using Gaussian processes | |
| Tolla | A survey of some linear programming methods | |
| Naher et al. | Using Machine Learning to Estimate Utilization and Throughput for OpenCL-Based SpMV Implementation on an FPGA | |
| Shimizu et al. | Deformation Clustering Methods for Topologically Optimized Structures under Crash Load based on Displacement Time Series | |
| Lee et al. | The adaptive patched cubature filter and its implementation | |
| Tsai | Building Kinetic Models for Complex Systems with Arbitrary Memories | |
| Papapanagiotou¹ et al. | for the Analysis of Ship Engine Data | |
| Marussy et al. | Configurable numerical analysis for stochastic systems |
Legal Events
| Date | Code | Title | Description |
|---|---|---|---|
| PUAI | Public reference made under article 153(3) epc to a published international application that has entered the european phase |
Free format text: ORIGINAL CODE: 0009012 |
|
| 17P | Request for examination filed |
Effective date: 20130205 |
|
| AK | Designated contracting states |
Kind code of ref document: A1 Designated state(s): AL AT BE BG CH CY CZ DE DK EE ES FI FR GB GR HR HU IE IS IT LI LT LU LV MC MK MT NL NO PL PT RO SE SI SK SM TR |
|
| DAX | Request for extension of the european patent (deleted) | ||
| RIN1 | Information on inventor provided before grant (corrected) |
Inventor name: NIKITINA, LIALIA Inventor name: CLEES, TANJA |
|
| GRAP | Despatch of communication of intention to grant a patent |
Free format text: ORIGINAL CODE: EPIDOSNIGR1 |
|
| INTG | Intention to grant announced |
Effective date: 20140415 |
|
| GRAS | Grant fee paid |
Free format text: ORIGINAL CODE: EPIDOSNIGR3 |
|
| GRAA | (expected) grant |
Free format text: ORIGINAL CODE: 0009210 |
|
| RAP1 | Party data changed (applicant data changed or rights of an application transferred) |
Owner name: FRAUNHOFER-GESELLSCHAFT ZUR FOERDERUNG DER ANGEWAN |
|
| AK | Designated contracting states |
Kind code of ref document: B1 Designated state(s): AL AT BE BG CH CY CZ DE DK EE ES FI FR GB GR HR HU IE IS IT LI LT LU LV MC MK MT NL NO PL PT RO SE SI SK SM TR |
|
| REG | Reference to a national code |
Ref country code: GB Ref legal event code: FG4D |
|
| REG | Reference to a national code |
Ref country code: AT Ref legal event code: REF Ref document number: 689845 Country of ref document: AT Kind code of ref document: T Effective date: 20141015 Ref country code: CH Ref legal event code: EP |
|
| REG | Reference to a national code |
Ref country code: IE Ref legal event code: FG4D |
|
| REG | Reference to a national code |
Ref country code: DE Ref legal event code: R096 Ref document number: 602010019259 Country of ref document: DE Effective date: 20141113 |
|
| REG | Reference to a national code |
Ref country code: NL Ref legal event code: T3 |
|
| REG | Reference to a national code |
Ref country code: LT Ref legal event code: MG4D |
|
| PG25 | Lapsed in a contracting state [announced via postgrant information from national office to epo] |
Ref country code: PT Free format text: LAPSE BECAUSE OF FAILURE TO SUBMIT A TRANSLATION OF THE DESCRIPTION OR TO PAY THE FEE WITHIN THE PRESCRIBED TIME-LIMIT Effective date: 20150202 Ref country code: ES Free format text: LAPSE BECAUSE OF FAILURE TO SUBMIT A TRANSLATION OF THE DESCRIPTION OR TO PAY THE FEE WITHIN THE PRESCRIBED TIME-LIMIT Effective date: 20141001 Ref country code: LT Free format text: LAPSE BECAUSE OF FAILURE TO SUBMIT A TRANSLATION OF THE DESCRIPTION OR TO PAY THE FEE WITHIN THE PRESCRIBED TIME-LIMIT Effective date: 20141001 Ref country code: CZ Free format text: LAPSE BECAUSE OF FAILURE TO SUBMIT A TRANSLATION OF THE DESCRIPTION OR TO PAY THE FEE WITHIN THE PRESCRIBED TIME-LIMIT Effective date: 20141001 Ref country code: NO Free format text: LAPSE BECAUSE OF FAILURE TO SUBMIT A TRANSLATION OF THE DESCRIPTION OR TO PAY THE FEE WITHIN THE PRESCRIBED TIME-LIMIT Effective date: 20150101 Ref country code: IS Free format text: LAPSE BECAUSE OF FAILURE TO SUBMIT A TRANSLATION OF THE DESCRIPTION OR TO PAY THE FEE WITHIN THE PRESCRIBED TIME-LIMIT Effective date: 20150201 Ref country code: FI Free format text: LAPSE BECAUSE OF FAILURE TO SUBMIT A TRANSLATION OF THE DESCRIPTION OR TO PAY THE FEE WITHIN THE PRESCRIBED TIME-LIMIT Effective date: 20141001 |
|
| PG25 | Lapsed in a contracting state [announced via postgrant information from national office to epo] |
Ref country code: LV Free format text: LAPSE BECAUSE OF FAILURE TO SUBMIT A TRANSLATION OF THE DESCRIPTION OR TO PAY THE FEE WITHIN THE PRESCRIBED TIME-LIMIT Effective date: 20141001 Ref country code: HR Free format text: LAPSE BECAUSE OF FAILURE TO SUBMIT A TRANSLATION OF THE DESCRIPTION OR TO PAY THE FEE WITHIN THE PRESCRIBED TIME-LIMIT Effective date: 20141001 Ref country code: SE Free format text: LAPSE BECAUSE OF FAILURE TO SUBMIT A TRANSLATION OF THE DESCRIPTION OR TO PAY THE FEE WITHIN THE PRESCRIBED TIME-LIMIT Effective date: 20141001 Ref country code: PL Free format text: LAPSE BECAUSE OF FAILURE TO SUBMIT A TRANSLATION OF THE DESCRIPTION OR TO PAY THE FEE WITHIN THE PRESCRIBED TIME-LIMIT Effective date: 20141001 Ref country code: GR Free format text: LAPSE BECAUSE OF FAILURE TO SUBMIT A TRANSLATION OF THE DESCRIPTION OR TO PAY THE FEE WITHIN THE PRESCRIBED TIME-LIMIT Effective date: 20150102 Ref country code: CY Free format text: LAPSE BECAUSE OF FAILURE TO SUBMIT A TRANSLATION OF THE DESCRIPTION OR TO PAY THE FEE WITHIN THE PRESCRIBED TIME-LIMIT Effective date: 20141001 |
|
| REG | Reference to a national code |
Ref country code: DE Ref legal event code: R097 Ref document number: 602010019259 Country of ref document: DE |
|
| PG25 | Lapsed in a contracting state [announced via postgrant information from national office to epo] |
Ref country code: EE Free format text: LAPSE BECAUSE OF FAILURE TO SUBMIT A TRANSLATION OF THE DESCRIPTION OR TO PAY THE FEE WITHIN THE PRESCRIBED TIME-LIMIT Effective date: 20141001 Ref country code: DK Free format text: LAPSE BECAUSE OF FAILURE TO SUBMIT A TRANSLATION OF THE DESCRIPTION OR TO PAY THE FEE WITHIN THE PRESCRIBED TIME-LIMIT Effective date: 20141001 Ref country code: SK Free format text: LAPSE BECAUSE OF FAILURE TO SUBMIT A TRANSLATION OF THE DESCRIPTION OR TO PAY THE FEE WITHIN THE PRESCRIBED TIME-LIMIT Effective date: 20141001 Ref country code: RO Free format text: LAPSE BECAUSE OF FAILURE TO SUBMIT A TRANSLATION OF THE DESCRIPTION OR TO PAY THE FEE WITHIN THE PRESCRIBED TIME-LIMIT Effective date: 20141001 |
|
| PLBE | No opposition filed within time limit |
Free format text: ORIGINAL CODE: 0009261 |
|
| STAA | Information on the status of an ep patent application or granted ep patent |
Free format text: STATUS: NO OPPOSITION FILED WITHIN TIME LIMIT |
|
| PG25 | Lapsed in a contracting state [announced via postgrant information from national office to epo] |
Ref country code: IT Free format text: LAPSE BECAUSE OF FAILURE TO SUBMIT A TRANSLATION OF THE DESCRIPTION OR TO PAY THE FEE WITHIN THE PRESCRIBED TIME-LIMIT Effective date: 20141001 |
|
| 26N | No opposition filed |
Effective date: 20150702 |
|
| PG25 | Lapsed in a contracting state [announced via postgrant information from national office to epo] |
Ref country code: SI Free format text: LAPSE BECAUSE OF FAILURE TO SUBMIT A TRANSLATION OF THE DESCRIPTION OR TO PAY THE FEE WITHIN THE PRESCRIBED TIME-LIMIT Effective date: 20141001 |
|
| PG25 | Lapsed in a contracting state [announced via postgrant information from national office to epo] |
Ref country code: MC Free format text: LAPSE BECAUSE OF FAILURE TO SUBMIT A TRANSLATION OF THE DESCRIPTION OR TO PAY THE FEE WITHIN THE PRESCRIBED TIME-LIMIT Effective date: 20141001 Ref country code: LU Free format text: LAPSE BECAUSE OF FAILURE TO SUBMIT A TRANSLATION OF THE DESCRIPTION OR TO PAY THE FEE WITHIN THE PRESCRIBED TIME-LIMIT Effective date: 20150805 |
|
| REG | Reference to a national code |
Ref country code: CH Ref legal event code: PL |
|
| PG25 | Lapsed in a contracting state [announced via postgrant information from national office to epo] |
Ref country code: CH Free format text: LAPSE BECAUSE OF NON-PAYMENT OF DUE FEES Effective date: 20150831 Ref country code: LI Free format text: LAPSE BECAUSE OF NON-PAYMENT OF DUE FEES Effective date: 20150831 |
|
| REG | Reference to a national code |
Ref country code: IE Ref legal event code: MM4A |
|
| PG25 | Lapsed in a contracting state [announced via postgrant information from national office to epo] |
Ref country code: IE Free format text: LAPSE BECAUSE OF NON-PAYMENT OF DUE FEES Effective date: 20150805 |
|
| REG | Reference to a national code |
Ref country code: FR Ref legal event code: PLFP Year of fee payment: 7 |
|
| PG25 | Lapsed in a contracting state [announced via postgrant information from national office to epo] |
Ref country code: MT Free format text: LAPSE BECAUSE OF FAILURE TO SUBMIT A TRANSLATION OF THE DESCRIPTION OR TO PAY THE FEE WITHIN THE PRESCRIBED TIME-LIMIT Effective date: 20141001 |
|
| PG25 | Lapsed in a contracting state [announced via postgrant information from national office to epo] |
Ref country code: BG Free format text: LAPSE BECAUSE OF FAILURE TO SUBMIT A TRANSLATION OF THE DESCRIPTION OR TO PAY THE FEE WITHIN THE PRESCRIBED TIME-LIMIT Effective date: 20141001 Ref country code: SM Free format text: LAPSE BECAUSE OF FAILURE TO SUBMIT A TRANSLATION OF THE DESCRIPTION OR TO PAY THE FEE WITHIN THE PRESCRIBED TIME-LIMIT Effective date: 20141001 Ref country code: HU Free format text: LAPSE BECAUSE OF FAILURE TO SUBMIT A TRANSLATION OF THE DESCRIPTION OR TO PAY THE FEE WITHIN THE PRESCRIBED TIME-LIMIT; INVALID AB INITIO Effective date: 20100805 |
|
| REG | Reference to a national code |
Ref country code: FR Ref legal event code: PLFP Year of fee payment: 8 |
|
| PG25 | Lapsed in a contracting state [announced via postgrant information from national office to epo] |
Ref country code: BE Free format text: LAPSE BECAUSE OF FAILURE TO SUBMIT A TRANSLATION OF THE DESCRIPTION OR TO PAY THE FEE WITHIN THE PRESCRIBED TIME-LIMIT Effective date: 20141001 |
|
| PG25 | Lapsed in a contracting state [announced via postgrant information from national office to epo] |
Ref country code: TR Free format text: LAPSE BECAUSE OF FAILURE TO SUBMIT A TRANSLATION OF THE DESCRIPTION OR TO PAY THE FEE WITHIN THE PRESCRIBED TIME-LIMIT Effective date: 20141001 Ref country code: MK Free format text: LAPSE BECAUSE OF FAILURE TO SUBMIT A TRANSLATION OF THE DESCRIPTION OR TO PAY THE FEE WITHIN THE PRESCRIBED TIME-LIMIT Effective date: 20141001 |
|
| REG | Reference to a national code |
Ref country code: FR Ref legal event code: PLFP Year of fee payment: 9 |
|
| PG25 | Lapsed in a contracting state [announced via postgrant information from national office to epo] |
Ref country code: AL Free format text: LAPSE BECAUSE OF FAILURE TO SUBMIT A TRANSLATION OF THE DESCRIPTION OR TO PAY THE FEE WITHIN THE PRESCRIBED TIME-LIMIT Effective date: 20141001 |
|
| REG | Reference to a national code |
Ref country code: DE Ref legal event code: R079 Ref document number: 602010019259 Country of ref document: DE Free format text: PREVIOUS MAIN CLASS: G06K0009620000 Ipc: G06V0030190000 |
|
| P01 | Opt-out of the competence of the unified patent court (upc) registered |
Effective date: 20230524 |
|
| PGFP | Annual fee paid to national office [announced via postgrant information from national office to epo] |
Ref country code: NL Payment date: 20250821 Year of fee payment: 16 |
|
| PGFP | Annual fee paid to national office [announced via postgrant information from national office to epo] |
Ref country code: DE Payment date: 20250819 Year of fee payment: 16 |
|
| PGFP | Annual fee paid to national office [announced via postgrant information from national office to epo] |
Ref country code: GB Payment date: 20250822 Year of fee payment: 16 |
|
| PGFP | Annual fee paid to national office [announced via postgrant information from national office to epo] |
Ref country code: FR Payment date: 20250827 Year of fee payment: 16 Ref country code: AT Payment date: 20250819 Year of fee payment: 16 |