EP2584050B1 - Diagnostic biomarkers of diabetes - Google Patents
Diagnostic biomarkers of diabetes Download PDFInfo
- Publication number
- EP2584050B1 EP2584050B1 EP13151356.6A EP13151356A EP2584050B1 EP 2584050 B1 EP2584050 B1 EP 2584050B1 EP 13151356 A EP13151356 A EP 13151356A EP 2584050 B1 EP2584050 B1 EP 2584050B1
- Authority
- EP
- European Patent Office
- Prior art keywords
- gene
- patient
- expression profile
- genes
- diabetes
- Prior art date
- Legal status (The legal status is an assumption and is not a legal conclusion. Google has not performed a legal analysis and makes no representation as to the accuracy of the status listed.)
- Not-in-force
Links
- 206010012601 diabetes mellitus Diseases 0.000 title claims description 107
- 239000000104 diagnostic biomarker Substances 0.000 title description 2
- 230000014509 gene expression Effects 0.000 claims description 125
- 238000012360 testing method Methods 0.000 claims description 84
- 208000037265 diseases, disorders, signs and symptoms Diseases 0.000 claims description 73
- 230000004547 gene signature Effects 0.000 claims description 65
- 102100022338 Integrin alpha-M Human genes 0.000 claims description 47
- 101001046686 Homo sapiens Integrin alpha-M Proteins 0.000 claims description 46
- 239000003153 chemical reaction reagent Substances 0.000 claims description 43
- 102100022297 Integrin alpha-X Human genes 0.000 claims description 42
- 238000000034 method Methods 0.000 claims description 40
- 208000001072 type 2 diabetes mellitus Diseases 0.000 claims description 40
- 238000004458 analytical method Methods 0.000 claims description 34
- 210000003819 peripheral blood mononuclear cell Anatomy 0.000 claims description 32
- 210000004369 blood Anatomy 0.000 claims description 31
- 239000008280 blood Substances 0.000 claims description 31
- 238000009396 hybridization Methods 0.000 claims description 25
- 206010018429 Glucose tolerance impaired Diseases 0.000 claims description 23
- 238000003556 assay Methods 0.000 claims description 23
- 210000004027 cell Anatomy 0.000 claims description 21
- 108090000963 Actin-related protein 2 Proteins 0.000 claims description 20
- 102100039466 Eukaryotic translation initiation factor 5B Human genes 0.000 claims description 20
- 101001036496 Homo sapiens Eukaryotic translation initiation factor 5B Proteins 0.000 claims description 20
- 102100040996 Cochlin Human genes 0.000 claims description 19
- 101000938702 Homo sapiens N-acetyltransferase ESCO1 Proteins 0.000 claims description 19
- 101000801664 Homo sapiens Nucleoprotein TPR Proteins 0.000 claims description 19
- 102100030815 N-acetyltransferase ESCO1 Human genes 0.000 claims description 19
- 102100033615 Nucleoprotein TPR Human genes 0.000 claims description 19
- 102100029064 Serine/threonine-protein kinase WNK1 Human genes 0.000 claims description 19
- 101000748988 Homo sapiens Cochlin Proteins 0.000 claims description 18
- 101000604123 Homo sapiens Noggin Proteins 0.000 claims description 18
- 101000652433 Homo sapiens Protein SON Proteins 0.000 claims description 18
- 101000770770 Homo sapiens Serine/threonine-protein kinase WNK1 Proteins 0.000 claims description 18
- 101000772165 Homo sapiens Tubby-related protein 4 Proteins 0.000 claims description 18
- 102100030232 Protein SON Human genes 0.000 claims description 18
- 102100029299 Tubby-related protein 4 Human genes 0.000 claims description 18
- 108091034117 Oligonucleotide Proteins 0.000 claims description 17
- 238000003753 real-time PCR Methods 0.000 claims description 17
- -1 AA741300 Proteins 0.000 claims description 16
- 230000003321 amplification Effects 0.000 claims description 13
- 210000001616 monocyte Anatomy 0.000 claims description 13
- 238000003199 nucleic acid amplification method Methods 0.000 claims description 13
- 230000000984 immunochemical effect Effects 0.000 claims description 12
- 101000946889 Homo sapiens Monocyte differentiation antigen CD14 Proteins 0.000 claims description 11
- 102100035877 Monocyte differentiation antigen CD14 Human genes 0.000 claims description 11
- 238000001514 detection method Methods 0.000 claims description 11
- 230000008859 change Effects 0.000 claims description 10
- 238000002493 microarray Methods 0.000 claims description 10
- 208000016097 disease of metabolism Diseases 0.000 claims description 9
- 208000030159 metabolic disease Diseases 0.000 claims description 9
- 102100038454 Noggin Human genes 0.000 claims description 7
- 238000004422 calculation algorithm Methods 0.000 claims description 7
- 238000012417 linear regression Methods 0.000 claims description 6
- 238000007477 logistic regression Methods 0.000 claims description 6
- 102000004373 Actin-related protein 2 Human genes 0.000 claims 4
- 238000004806 packaging method and process Methods 0.000 claims 1
- 108090000623 proteins and genes Proteins 0.000 description 145
- 239000000523 sample Substances 0.000 description 101
- 108020004414 DNA Proteins 0.000 description 93
- 241000282414 Homo sapiens Species 0.000 description 93
- 108700011001 Transcription Factor 7-Like 2 Proteins 0.000 description 47
- 102100035101 Transcription factor 7-like 2 Human genes 0.000 description 47
- 150000007523 nucleic acids Chemical class 0.000 description 29
- WQZGKKKJIJFFOK-GASJEMHNSA-N Glucose Natural products OC[C@H]1OC(O)[C@H](O)[C@@H](O)[C@@H]1O WQZGKKKJIJFFOK-GASJEMHNSA-N 0.000 description 28
- 239000008103 glucose Substances 0.000 description 28
- 102000039446 nucleic acids Human genes 0.000 description 24
- 108020004707 nucleic acids Proteins 0.000 description 24
- 201000009104 prediabetes syndrome Diseases 0.000 description 22
- 101000884271 Homo sapiens Signal transducer CD24 Proteins 0.000 description 20
- 101000648042 Homo sapiens Signal-transducing adaptor protein 1 Proteins 0.000 description 20
- 102100038081 Signal transducer CD24 Human genes 0.000 description 20
- NOESYZHRGYRDHS-UHFFFAOYSA-N insulin Chemical compound N1C(=O)C(NC(=O)C(CCC(N)=O)NC(=O)C(CCC(O)=O)NC(=O)C(C(C)C)NC(=O)C(NC(=O)CN)C(C)CC)CSSCC(C(NC(CO)C(=O)NC(CC(C)C)C(=O)NC(CC=2C=CC(O)=CC=2)C(=O)NC(CCC(N)=O)C(=O)NC(CC(C)C)C(=O)NC(CCC(O)=O)C(=O)NC(CC(N)=O)C(=O)NC(CC=2C=CC(O)=CC=2)C(=O)NC(CSSCC(NC(=O)C(C(C)C)NC(=O)C(CC(C)C)NC(=O)C(CC=2C=CC(O)=CC=2)NC(=O)C(CC(C)C)NC(=O)C(C)NC(=O)C(CCC(O)=O)NC(=O)C(C(C)C)NC(=O)C(CC(C)C)NC(=O)C(CC=2NC=NC=2)NC(=O)C(CO)NC(=O)CNC2=O)C(=O)NCC(=O)NC(CCC(O)=O)C(=O)NC(CCCNC(N)=N)C(=O)NCC(=O)NC(CC=3C=CC=CC=3)C(=O)NC(CC=3C=CC=CC=3)C(=O)NC(CC=3C=CC(O)=CC=3)C(=O)NC(C(C)O)C(=O)N3C(CCC3)C(=O)NC(CCCCN)C(=O)NC(C)C(O)=O)C(=O)NC(CC(N)=O)C(O)=O)=O)NC(=O)C(C(C)CC)NC(=O)C(CO)NC(=O)C(C(C)O)NC(=O)C1CSSCC2NC(=O)C(CC(C)C)NC(=O)C(NC(=O)C(CCC(N)=O)NC(=O)C(CC(N)=O)NC(=O)C(NC(=O)C(N)CC=1C=CC=CC=1)C(C)C)CC1=CN=CN1 NOESYZHRGYRDHS-UHFFFAOYSA-N 0.000 description 20
- 238000007410 oral glucose tolerance test Methods 0.000 description 20
- 102100024607 DNA topoisomerase 1 Human genes 0.000 description 19
- 101000830681 Homo sapiens DNA topoisomerase 1 Proteins 0.000 description 19
- 101000639063 Homo sapiens Protein UXT Proteins 0.000 description 18
- 102100023989 Actin-related protein 2 Human genes 0.000 description 17
- 208000002705 Glucose Intolerance Diseases 0.000 description 17
- 235000018102 proteins Nutrition 0.000 description 16
- 102000004169 proteins and genes Human genes 0.000 description 16
- 201000010099 disease Diseases 0.000 description 13
- 238000002955 isolation Methods 0.000 description 12
- 101150072531 10 gene Proteins 0.000 description 11
- 101150105830 clc gene Proteins 0.000 description 11
- 101150090724 3 gene Proteins 0.000 description 10
- 102000004877 Insulin Human genes 0.000 description 10
- 108090001061 Insulin Proteins 0.000 description 10
- 238000006243 chemical reaction Methods 0.000 description 10
- 230000000295 complement effect Effects 0.000 description 10
- 229940125396 insulin Drugs 0.000 description 10
- 210000002381 plasma Anatomy 0.000 description 10
- 108091032973 (ribonucleotides)n+m Proteins 0.000 description 9
- 108010017222 Cyclin-Dependent Kinase Inhibitor p57 Proteins 0.000 description 9
- 102000004480 Cyclin-Dependent Kinase Inhibitor p57 Human genes 0.000 description 9
- 238000003745 diagnosis Methods 0.000 description 9
- 108020004999 messenger RNA Proteins 0.000 description 9
- 239000000047 product Substances 0.000 description 9
- 102100025263 Signal-transducing adaptor protein 1 Human genes 0.000 description 8
- 239000012472 biological sample Substances 0.000 description 8
- 239000002299 complementary DNA Substances 0.000 description 8
- 239000003550 marker Substances 0.000 description 8
- 239000002773 nucleotide Substances 0.000 description 8
- 125000003729 nucleotide group Chemical group 0.000 description 8
- 210000001519 tissue Anatomy 0.000 description 8
- 102100027685 Hemoglobin subunit alpha Human genes 0.000 description 7
- 101001009007 Homo sapiens Hemoglobin subunit alpha Proteins 0.000 description 7
- 108091028043 Nucleic acid sequence Proteins 0.000 description 7
- 238000010240 RT-PCR analysis Methods 0.000 description 7
- 238000005259 measurement Methods 0.000 description 7
- BZTDTCNHAFUJOG-UHFFFAOYSA-N 6-carboxyfluorescein Chemical compound C12=CC=C(O)C=C2OC2=CC(O)=CC=C2C11OC(=O)C2=CC=C(C(=O)O)C=C21 BZTDTCNHAFUJOG-UHFFFAOYSA-N 0.000 description 6
- 108010085238 Actins Proteins 0.000 description 6
- 208000001280 Prediabetic State Diseases 0.000 description 6
- 206010067584 Type 1 diabetes mellitus Diseases 0.000 description 6
- 210000000349 chromosome Anatomy 0.000 description 6
- 230000037361 pathway Effects 0.000 description 6
- 108010009392 Cyclin-Dependent Kinase Inhibitor p16 Proteins 0.000 description 5
- 102100024458 Cyclin-dependent kinase inhibitor 2A Human genes 0.000 description 5
- 108010092799 RNA-directed DNA polymerase Proteins 0.000 description 5
- 108010083644 Ribonucleases Proteins 0.000 description 5
- 102000006382 Ribonucleases Human genes 0.000 description 5
- 230000015572 biosynthetic process Effects 0.000 description 5
- 238000005516 engineering process Methods 0.000 description 5
- 239000000203 mixture Substances 0.000 description 5
- 230000000717 retained effect Effects 0.000 description 5
- 238000003786 synthesis reaction Methods 0.000 description 5
- IJGRMHOSHXDMSA-UHFFFAOYSA-N Atomic nitrogen Chemical compound N#N IJGRMHOSHXDMSA-UHFFFAOYSA-N 0.000 description 4
- 206010003645 Atopy Diseases 0.000 description 4
- 108010009356 Cyclin-Dependent Kinase Inhibitor p15 Proteins 0.000 description 4
- 238000002965 ELISA Methods 0.000 description 4
- 102100031780 Endonuclease Human genes 0.000 description 4
- 238000009015 Human TaqMan MicroRNA Assay kit Methods 0.000 description 4
- 241001465754 Metazoa Species 0.000 description 4
- 102100034850 Peptidyl-prolyl cis-trans isomerase G Human genes 0.000 description 4
- 238000002123 RNA extraction Methods 0.000 description 4
- JLCPHMBAVCMARE-UHFFFAOYSA-N [3-[[3-[[3-[[3-[[3-[[3-[[3-[[3-[[3-[[3-[[3-[[5-(2-amino-6-oxo-1H-purin-9-yl)-3-[[3-[[3-[[3-[[3-[[3-[[5-(2-amino-6-oxo-1H-purin-9-yl)-3-[[5-(2-amino-6-oxo-1H-purin-9-yl)-3-hydroxyoxolan-2-yl]methoxy-hydroxyphosphoryl]oxyoxolan-2-yl]methoxy-hydroxyphosphoryl]oxy-5-(5-methyl-2,4-dioxopyrimidin-1-yl)oxolan-2-yl]methoxy-hydroxyphosphoryl]oxy-5-(6-aminopurin-9-yl)oxolan-2-yl]methoxy-hydroxyphosphoryl]oxy-5-(6-aminopurin-9-yl)oxolan-2-yl]methoxy-hydroxyphosphoryl]oxy-5-(6-aminopurin-9-yl)oxolan-2-yl]methoxy-hydroxyphosphoryl]oxy-5-(6-aminopurin-9-yl)oxolan-2-yl]methoxy-hydroxyphosphoryl]oxyoxolan-2-yl]methoxy-hydroxyphosphoryl]oxy-5-(5-methyl-2,4-dioxopyrimidin-1-yl)oxolan-2-yl]methoxy-hydroxyphosphoryl]oxy-5-(4-amino-2-oxopyrimidin-1-yl)oxolan-2-yl]methoxy-hydroxyphosphoryl]oxy-5-(5-methyl-2,4-dioxopyrimidin-1-yl)oxolan-2-yl]methoxy-hydroxyphosphoryl]oxy-5-(5-methyl-2,4-dioxopyrimidin-1-yl)oxolan-2-yl]methoxy-hydroxyphosphoryl]oxy-5-(6-aminopurin-9-yl)oxolan-2-yl]methoxy-hydroxyphosphoryl]oxy-5-(6-aminopurin-9-yl)oxolan-2-yl]methoxy-hydroxyphosphoryl]oxy-5-(4-amino-2-oxopyrimidin-1-yl)oxolan-2-yl]methoxy-hydroxyphosphoryl]oxy-5-(4-amino-2-oxopyrimidin-1-yl)oxolan-2-yl]methoxy-hydroxyphosphoryl]oxy-5-(4-amino-2-oxopyrimidin-1-yl)oxolan-2-yl]methoxy-hydroxyphosphoryl]oxy-5-(6-aminopurin-9-yl)oxolan-2-yl]methoxy-hydroxyphosphoryl]oxy-5-(4-amino-2-oxopyrimidin-1-yl)oxolan-2-yl]methyl [5-(6-aminopurin-9-yl)-2-(hydroxymethyl)oxolan-3-yl] hydrogen phosphate Polymers Cc1cn(C2CC(OP(O)(=O)OCC3OC(CC3OP(O)(=O)OCC3OC(CC3O)n3cnc4c3nc(N)[nH]c4=O)n3cnc4c3nc(N)[nH]c4=O)C(COP(O)(=O)OC3CC(OC3COP(O)(=O)OC3CC(OC3COP(O)(=O)OC3CC(OC3COP(O)(=O)OC3CC(OC3COP(O)(=O)OC3CC(OC3COP(O)(=O)OC3CC(OC3COP(O)(=O)OC3CC(OC3COP(O)(=O)OC3CC(OC3COP(O)(=O)OC3CC(OC3COP(O)(=O)OC3CC(OC3COP(O)(=O)OC3CC(OC3COP(O)(=O)OC3CC(OC3COP(O)(=O)OC3CC(OC3COP(O)(=O)OC3CC(OC3COP(O)(=O)OC3CC(OC3COP(O)(=O)OC3CC(OC3COP(O)(=O)OC3CC(OC3CO)n3cnc4c(N)ncnc34)n3ccc(N)nc3=O)n3cnc4c(N)ncnc34)n3ccc(N)nc3=O)n3ccc(N)nc3=O)n3ccc(N)nc3=O)n3cnc4c(N)ncnc34)n3cnc4c(N)ncnc34)n3cc(C)c(=O)[nH]c3=O)n3cc(C)c(=O)[nH]c3=O)n3ccc(N)nc3=O)n3cc(C)c(=O)[nH]c3=O)n3cnc4c3nc(N)[nH]c4=O)n3cnc4c(N)ncnc34)n3cnc4c(N)ncnc34)n3cnc4c(N)ncnc34)n3cnc4c(N)ncnc34)O2)c(=O)[nH]c1=O JLCPHMBAVCMARE-UHFFFAOYSA-N 0.000 description 4
- 238000000137 annealing Methods 0.000 description 4
- 210000000227 basophil cell of anterior lobe of hypophysis Anatomy 0.000 description 4
- 239000000872 buffer Substances 0.000 description 4
- 238000013211 curve analysis Methods 0.000 description 4
- 239000012634 fragment Substances 0.000 description 4
- 201000001421 hyperglycemia Diseases 0.000 description 4
- 210000002540 macrophage Anatomy 0.000 description 4
- 238000012544 monitoring process Methods 0.000 description 4
- 230000001105 regulatory effect Effects 0.000 description 4
- NCMVOABPESMRCP-SHYZEUOFSA-N 2'-deoxycytosine 5'-monophosphate Chemical compound O=C1N=C(N)C=CN1[C@@H]1O[C@H](COP(O)(O)=O)[C@@H](O)C1 NCMVOABPESMRCP-SHYZEUOFSA-N 0.000 description 3
- 102100030374 Actin, cytoplasmic 2 Human genes 0.000 description 3
- 101710093498 Actin, gamma Proteins 0.000 description 3
- 102000003741 Actin-related protein 3 Human genes 0.000 description 3
- 108090000104 Actin-related protein 3 Proteins 0.000 description 3
- 102000007469 Actins Human genes 0.000 description 3
- 108010025464 Cyclin-Dependent Kinase 4 Proteins 0.000 description 3
- 102000009512 Cyclin-Dependent Kinase Inhibitor p15 Human genes 0.000 description 3
- 102100036252 Cyclin-dependent kinase 4 Human genes 0.000 description 3
- 102000053602 DNA Human genes 0.000 description 3
- 102100029775 Eukaryotic translation initiation factor 1 Human genes 0.000 description 3
- 102100035688 Guanylate-binding protein 1 Human genes 0.000 description 3
- 108010054147 Hemoglobins Proteins 0.000 description 3
- 101000773237 Homo sapiens Actin, cytoplasmic 2 Proteins 0.000 description 3
- 101001001336 Homo sapiens Guanylate-binding protein 1 Proteins 0.000 description 3
- 101000599779 Homo sapiens Insulin-like growth factor 2 mRNA-binding protein 2 Proteins 0.000 description 3
- 101001046668 Homo sapiens Integrin alpha-X Proteins 0.000 description 3
- 101000738322 Homo sapiens Prothymosin alpha Proteins 0.000 description 3
- 206010056997 Impaired fasting glucose Diseases 0.000 description 3
- 102100037919 Insulin-like growth factor 2 mRNA-binding protein 2 Human genes 0.000 description 3
- 241000699670 Mus sp. Species 0.000 description 3
- 208000008589 Obesity Diseases 0.000 description 3
- 239000012807 PCR reagent Substances 0.000 description 3
- 102100037925 Prothymosin alpha Human genes 0.000 description 3
- 238000011529 RT qPCR Methods 0.000 description 3
- 108091006556 SLC30A8 Proteins 0.000 description 3
- 239000000427 antigen Substances 0.000 description 3
- 108091007433 antigens Proteins 0.000 description 3
- 102000036639 antigens Human genes 0.000 description 3
- 238000013459 approach Methods 0.000 description 3
- 230000027455 binding Effects 0.000 description 3
- 230000031018 biological processes and functions Effects 0.000 description 3
- 238000010804 cDNA synthesis Methods 0.000 description 3
- 230000001413 cellular effect Effects 0.000 description 3
- 239000003795 chemical substances by application Substances 0.000 description 3
- 230000001419 dependent effect Effects 0.000 description 3
- 238000011161 development Methods 0.000 description 3
- 230000018109 developmental process Effects 0.000 description 3
- 238000002866 fluorescence resonance energy transfer Methods 0.000 description 3
- 230000002068 genetic effect Effects 0.000 description 3
- 238000007446 glucose tolerance test Methods 0.000 description 3
- 238000000338 in vitro Methods 0.000 description 3
- 235000020824 obesity Nutrition 0.000 description 3
- 238000003068 pathway analysis Methods 0.000 description 3
- 238000003752 polymerase chain reaction Methods 0.000 description 3
- 102000040430 polynucleotide Human genes 0.000 description 3
- 108091033319 polynucleotide Proteins 0.000 description 3
- 239000002157 polynucleotide Substances 0.000 description 3
- 239000013074 reference sample Substances 0.000 description 3
- 230000010076 replication Effects 0.000 description 3
- 230000004044 response Effects 0.000 description 3
- 230000035945 sensitivity Effects 0.000 description 3
- 238000012549 training Methods 0.000 description 3
- YBJHBAHKTGYVGT-ZKWXMUAHSA-N (+)-Biotin Chemical compound N1C(=O)N[C@@H]2[C@H](CCCCC(=O)O)SC[C@@H]21 YBJHBAHKTGYVGT-ZKWXMUAHSA-N 0.000 description 2
- NJYVEMPWNAYQQN-UHFFFAOYSA-N 5-carboxyfluorescein Chemical compound C12=CC=C(O)C=C2OC2=CC(O)=CC=C2C21OC(=O)C1=CC(C(=O)O)=CC=C21 NJYVEMPWNAYQQN-UHFFFAOYSA-N 0.000 description 2
- 102000051354 ADAMTS9 Human genes 0.000 description 2
- 108091005669 ADAMTS9 Proteins 0.000 description 2
- 102100022900 Actin, cytoplasmic 1 Human genes 0.000 description 2
- 102100026401 Actin-related protein 2/3 complex subunit 5-like protein Human genes 0.000 description 2
- 230000003844 B-cell-activation Effects 0.000 description 2
- 201000000046 Beckwith-Wiedemann syndrome Diseases 0.000 description 2
- 102100022006 Cell division cycle protein 123 homolog Human genes 0.000 description 2
- 102100032902 Chromobox protein homolog 3 Human genes 0.000 description 2
- 108020004635 Complementary DNA Proteins 0.000 description 2
- 108090000133 DNA helicases Proteins 0.000 description 2
- 102000003844 DNA helicases Human genes 0.000 description 2
- 102100036816 Eukaryotic peptide chain release factor GTP-binding subunit ERF3A Human genes 0.000 description 2
- 102100031510 Fibrillin-2 Human genes 0.000 description 2
- ZHNUHDYFZUAESO-UHFFFAOYSA-N Formamide Chemical compound NC=O ZHNUHDYFZUAESO-UHFFFAOYSA-N 0.000 description 2
- 102100021519 Hemoglobin subunit beta Human genes 0.000 description 2
- 102000001554 Hemoglobins Human genes 0.000 description 2
- 101000614701 Homo sapiens ATP-sensitive inward rectifier potassium channel 11 Proteins 0.000 description 2
- 101000785745 Homo sapiens Actin-related protein 2/3 complex subunit 5-like protein Proteins 0.000 description 2
- 101100273821 Homo sapiens CDKN1C gene Proteins 0.000 description 2
- 101000897353 Homo sapiens Cell division cycle protein 123 homolog Proteins 0.000 description 2
- 101000851788 Homo sapiens Eukaryotic peptide chain release factor GTP-binding subunit ERF3A Proteins 0.000 description 2
- 101000846890 Homo sapiens Fibrillin-2 Proteins 0.000 description 2
- 101000899111 Homo sapiens Hemoglobin subunit beta Proteins 0.000 description 2
- 101001018097 Homo sapiens L-selectin Proteins 0.000 description 2
- 101001063456 Homo sapiens Leucine-rich repeat-containing G-protein coupled receptor 5 Proteins 0.000 description 2
- 101001018028 Homo sapiens Lymphocyte antigen 86 Proteins 0.000 description 2
- 101001115417 Homo sapiens M-phase phosphoprotein 8 Proteins 0.000 description 2
- 101001005667 Homo sapiens Mastermind-like protein 2 Proteins 0.000 description 2
- 101000653374 Homo sapiens Methylcytosine dioxygenase TET2 Proteins 0.000 description 2
- 101001091194 Homo sapiens Peptidyl-prolyl cis-trans isomerase G Proteins 0.000 description 2
- 101000741790 Homo sapiens Peroxisome proliferator-activated receptor gamma Proteins 0.000 description 2
- 101001105486 Homo sapiens Proteasome subunit alpha type-7 Proteins 0.000 description 2
- 101001068628 Homo sapiens Protein PRRC2C Proteins 0.000 description 2
- 101000640231 Homo sapiens Protein SDA1 homolog Proteins 0.000 description 2
- 101001075671 Homo sapiens RAB7A-interacting MON1-CCZ1 complex subunit 1 Proteins 0.000 description 2
- 101000783373 Homo sapiens Serine/threonine-protein phosphatase 2A 56 kDa regulatory subunit gamma isoform Proteins 0.000 description 2
- 101000831007 Homo sapiens T-cell immunoreceptor with Ig and ITIM domains Proteins 0.000 description 2
- 101000847107 Homo sapiens Tetraspanin-8 Proteins 0.000 description 2
- 101000666234 Homo sapiens Thyroid adenoma-associated protein Proteins 0.000 description 2
- 101000904499 Homo sapiens Transcription regulator protein BACH2 Proteins 0.000 description 2
- 101000834933 Homo sapiens Transmembrane protein 106A Proteins 0.000 description 2
- 101000655162 Homo sapiens Transmembrane protein 223 Proteins 0.000 description 2
- 101001077673 Homo sapiens Voltage-gated hydrogen channel 1 Proteins 0.000 description 2
- 101000765926 Homo sapiens tRNA:m(4)X modification enzyme TRM13 homolog Proteins 0.000 description 2
- 102000017792 KCNJ11 Human genes 0.000 description 2
- 102100033467 L-selectin Human genes 0.000 description 2
- 102100031036 Leucine-rich repeat-containing G-protein coupled receptor 5 Human genes 0.000 description 2
- 102100033485 Lymphocyte antigen 86 Human genes 0.000 description 2
- 102100023268 M-phase phosphoprotein 8 Human genes 0.000 description 2
- 208000035180 MODY Diseases 0.000 description 2
- 241000124008 Mammalia Species 0.000 description 2
- 102100025130 Mastermind-like protein 2 Human genes 0.000 description 2
- 102100030803 Methylcytosine dioxygenase TET2 Human genes 0.000 description 2
- 102100039614 Nuclear receptor ROR-alpha Human genes 0.000 description 2
- 108700026244 Open Reading Frames Proteins 0.000 description 2
- 101710111200 Peptidyl-prolyl cis-trans isomerase G Proteins 0.000 description 2
- 102100038825 Peroxisome proliferator-activated receptor gamma Human genes 0.000 description 2
- 102100021201 Proteasome subunit alpha type-7 Human genes 0.000 description 2
- 102100033952 Protein PRRC2C Human genes 0.000 description 2
- 102100033960 Protein SDA1 homolog Human genes 0.000 description 2
- 102100020934 RAB7A-interacting MON1-CCZ1 complex subunit 1 Human genes 0.000 description 2
- 102100036140 Serine/threonine-protein phosphatase 2A 56 kDa regulatory subunit gamma isoform Human genes 0.000 description 2
- 238000000692 Student's t-test Methods 0.000 description 2
- 102100024834 T-cell immunoreceptor with Ig and ITIM domains Human genes 0.000 description 2
- 102100032802 Tetraspanin-8 Human genes 0.000 description 2
- 102100038148 Thyroid adenoma-associated protein Human genes 0.000 description 2
- 102100023998 Transcription regulator protein BACH2 Human genes 0.000 description 2
- 108020004566 Transfer RNA Proteins 0.000 description 2
- 102100033663 Transforming growth factor beta receptor type 3 Human genes 0.000 description 2
- 102100026230 Transmembrane protein 106A Human genes 0.000 description 2
- 102100033034 Transmembrane protein 223 Human genes 0.000 description 2
- 102100025443 Voltage-gated hydrogen channel 1 Human genes 0.000 description 2
- 239000000654 additive Substances 0.000 description 2
- 230000004075 alteration Effects 0.000 description 2
- 230000006399 behavior Effects 0.000 description 2
- 230000008901 benefit Effects 0.000 description 2
- 230000022131 cell cycle Effects 0.000 description 2
- 230000006037 cell lysis Effects 0.000 description 2
- 230000001351 cycling effect Effects 0.000 description 2
- 238000013461 design Methods 0.000 description 2
- 230000004069 differentiation Effects 0.000 description 2
- 208000035475 disorder Diseases 0.000 description 2
- 239000012154 double-distilled water Substances 0.000 description 2
- 238000013399 early diagnosis Methods 0.000 description 2
- 230000000694 effects Effects 0.000 description 2
- 210000003979 eosinophil Anatomy 0.000 description 2
- 230000007717 exclusion Effects 0.000 description 2
- 239000011536 extraction buffer Substances 0.000 description 2
- MHMNJMPURVTYEJ-UHFFFAOYSA-N fluorescein-5-isothiocyanate Chemical compound O1C(=O)C2=CC(N=C=S)=CC=C2C21C1=CC=C(O)C=C1OC1=CC(O)=CC=C21 MHMNJMPURVTYEJ-UHFFFAOYSA-N 0.000 description 2
- 101150086810 fpg gene Proteins 0.000 description 2
- 239000007789 gas Substances 0.000 description 2
- 230000013632 homeostatic process Effects 0.000 description 2
- 230000028996 humoral immune response Effects 0.000 description 2
- 208000033066 hyperinsulinemic hypoglycemia Diseases 0.000 description 2
- 230000010354 integration Effects 0.000 description 2
- 208000001921 latent autoimmune diabetes in adults Diseases 0.000 description 2
- 238000007834 ligase chain reaction Methods 0.000 description 2
- 239000007788 liquid Substances 0.000 description 2
- 238000004519 manufacturing process Methods 0.000 description 2
- 201000006950 maturity-onset diabetes of the young Diseases 0.000 description 2
- 230000008018 melting Effects 0.000 description 2
- 238000002844 melting Methods 0.000 description 2
- 230000002503 metabolic effect Effects 0.000 description 2
- 238000010208 microarray analysis Methods 0.000 description 2
- 230000035772 mutation Effects 0.000 description 2
- 210000000066 myeloid cell Anatomy 0.000 description 2
- CJWXCNXHAIFFMH-AVZHFPDBSA-N n-[(2s,3r,4s,5s,6r)-2-[(2r,3r,4s,5r)-2-acetamido-4,5,6-trihydroxy-1-oxohexan-3-yl]oxy-3,5-dihydroxy-6-methyloxan-4-yl]acetamide Chemical compound C[C@H]1O[C@@H](O[C@@H]([C@@H](O)[C@H](O)CO)[C@@H](NC(C)=O)C=O)[C@H](O)[C@@H](NC(C)=O)[C@@H]1O CJWXCNXHAIFFMH-AVZHFPDBSA-N 0.000 description 2
- 229910052757 nitrogen Inorganic materials 0.000 description 2
- 238000010606 normalization Methods 0.000 description 2
- 230000002018 overexpression Effects 0.000 description 2
- 238000006116 polymerization reaction Methods 0.000 description 2
- 229920001184 polypeptide Chemical group 0.000 description 2
- 230000008569 process Effects 0.000 description 2
- 108090000765 processed proteins & peptides Chemical group 0.000 description 2
- 102000004196 processed proteins & peptides Human genes 0.000 description 2
- 230000035755 proliferation Effects 0.000 description 2
- 239000011541 reaction mixture Substances 0.000 description 2
- 238000011160 research Methods 0.000 description 2
- 150000003839 salts Chemical class 0.000 description 2
- 238000007619 statistical method Methods 0.000 description 2
- 239000013589 supplement Substances 0.000 description 2
- 208000035101 susceptibility to 6 systemic lupus erythematosus Diseases 0.000 description 2
- 208000024891 symptom Diseases 0.000 description 2
- 102100026593 tRNA:m(4)X modification enzyme TRM13 homolog Human genes 0.000 description 2
- 238000013518 transcription Methods 0.000 description 2
- 230000035897 transcription Effects 0.000 description 2
- FMKJUUQOYOHLTF-OWOJBTEDSA-N (e)-4-azaniumylbut-2-enoate Chemical compound NC\C=C\C(O)=O FMKJUUQOYOHLTF-OWOJBTEDSA-N 0.000 description 1
- LTFMZDNNPPEQNG-KVQBGUIXSA-N 2'-deoxyguanosine 5'-monophosphate Chemical compound C1=2NC(N)=NC(=O)C=2N=CN1[C@H]1C[C@H](O)[C@@H](COP(O)(O)=O)O1 LTFMZDNNPPEQNG-KVQBGUIXSA-N 0.000 description 1
- 102100037563 40S ribosomal protein S2 Human genes 0.000 description 1
- 102100022464 5'-nucleotidase Human genes 0.000 description 1
- WQZIDRAQTRIQDX-UHFFFAOYSA-N 6-carboxy-x-rhodamine Chemical compound OC(=O)C1=CC=C(C([O-])=O)C=C1C(C1=CC=2CCCN3CCCC(C=23)=C1O1)=C2C1=C(CCC1)C3=[N+]1CCCC3=C2 WQZIDRAQTRIQDX-UHFFFAOYSA-N 0.000 description 1
- 101150008021 80 gene Proteins 0.000 description 1
- 102100022861 ADP-ribosylation factor-like protein 5A Human genes 0.000 description 1
- 102100023157 AT-rich interactive domain-containing protein 2 Human genes 0.000 description 1
- 102100022933 ATM interactor Human genes 0.000 description 1
- 101710170219 ATM interactor Proteins 0.000 description 1
- 102100026135 ATP-dependent RNA helicase DDX24 Human genes 0.000 description 1
- 208000004611 Abdominal Obesity Diseases 0.000 description 1
- 108010076365 Adiponectin Proteins 0.000 description 1
- 102100031786 Adiponectin Human genes 0.000 description 1
- 102100031460 Advillin Human genes 0.000 description 1
- 208000007848 Alcoholism Diseases 0.000 description 1
- 102100032044 Amphoterin-induced protein 1 Human genes 0.000 description 1
- 102100026683 Angiogenic factor with G patch and FHA domains 1 Human genes 0.000 description 1
- 102100034611 Ankyrin repeat domain-containing protein 12 Human genes 0.000 description 1
- 102100034564 Ankyrin repeat domain-containing protein 36A Human genes 0.000 description 1
- 102100039179 Ankyrin repeat domain-containing protein 46 Human genes 0.000 description 1
- 206010003210 Arteriosclerosis Diseases 0.000 description 1
- 241000271566 Aves Species 0.000 description 1
- 108090001008 Avidin Proteins 0.000 description 1
- 102100035634 B-cell linker protein Human genes 0.000 description 1
- 210000002237 B-cell of pancreatic islet Anatomy 0.000 description 1
- 102100021568 B-cell scaffold protein with ankyrin repeats Human genes 0.000 description 1
- 102100022005 B-lymphocyte antigen CD20 Human genes 0.000 description 1
- 102000008836 BTB/POZ domains Human genes 0.000 description 1
- 108050000749 BTB/POZ domains Proteins 0.000 description 1
- 102100021961 Bis(5'-adenosyl)-triphosphatase ENPP4 Human genes 0.000 description 1
- 201000004569 Blindness Diseases 0.000 description 1
- 108010039209 Blood Coagulation Factors Proteins 0.000 description 1
- 102000015081 Blood Coagulation Factors Human genes 0.000 description 1
- 241000283690 Bos taurus Species 0.000 description 1
- 241000282817 Bovidae Species 0.000 description 1
- 102100027310 Bromodomain adjacent to zinc finger domain protein 1A Human genes 0.000 description 1
- 102100036302 C-C chemokine receptor type 6 Human genes 0.000 description 1
- 102100031658 C-X-C chemokine receptor type 5 Human genes 0.000 description 1
- 108010017009 CD11b Antigen Proteins 0.000 description 1
- 101150108519 CDK4 gene Proteins 0.000 description 1
- 102100033210 CUGBP Elav-like family member 2 Human genes 0.000 description 1
- 102100036431 Calcineurin subunit B type 1 Human genes 0.000 description 1
- 102100033086 Calcium/calmodulin-dependent protein kinase type 1 Human genes 0.000 description 1
- 102100033088 Calcium/calmodulin-dependent protein kinase type 1D Human genes 0.000 description 1
- 102100025227 Calcium/calmodulin-dependent protein kinase type II subunit gamma Human genes 0.000 description 1
- 241000282472 Canis lupus familiaris Species 0.000 description 1
- 102100032196 Carbohydrate sulfotransferase 12 Human genes 0.000 description 1
- 102100036569 Cell division cycle and apoptosis regulator protein 1 Human genes 0.000 description 1
- 102100023473 Cell growth-regulating nucleolar protein Human genes 0.000 description 1
- 206010065941 Central obesity Diseases 0.000 description 1
- 102100034754 Centrosomal protein of 83 kDa Human genes 0.000 description 1
- 102100028776 Centrosome and spindle pole-associated protein 1 Human genes 0.000 description 1
- 102100034505 Ceroid-lipofuscinosis neuronal protein 5 Human genes 0.000 description 1
- 229920002567 Chondroitin Polymers 0.000 description 1
- 101710173111 Chromobox protein homolog 3 Proteins 0.000 description 1
- 101710152347 Cochlin Proteins 0.000 description 1
- 102100023674 Coiled-coil domain-containing protein 186 Human genes 0.000 description 1
- 108090000695 Cytokines Proteins 0.000 description 1
- 102000004127 Cytokines Human genes 0.000 description 1
- 102100033484 DNA repair and recombination protein RAD54-like Human genes 0.000 description 1
- 101710179332 DNA repair and recombination protein RAD54-like Proteins 0.000 description 1
- 102100040401 DNA topoisomerase 3-alpha Human genes 0.000 description 1
- 102100027642 DNA-binding protein inhibitor ID-2 Human genes 0.000 description 1
- 108010014303 DNA-directed DNA polymerase Proteins 0.000 description 1
- 102000016928 DNA-directed DNA polymerase Human genes 0.000 description 1
- 108090000626 DNA-directed RNA polymerases Proteins 0.000 description 1
- 102000004163 DNA-directed RNA polymerases Human genes 0.000 description 1
- 102100024350 Dedicator of cytokinesis protein 8 Human genes 0.000 description 1
- 238000009007 Diagnostic Kit Methods 0.000 description 1
- 102100020750 Dipeptidyl peptidase 3 Human genes 0.000 description 1
- 102100037923 Disco-interacting protein 2 homolog B Human genes 0.000 description 1
- 102100035420 DnaJ homolog subfamily C member 1 Human genes 0.000 description 1
- 241000255581 Drosophila <fruit fly, genus> Species 0.000 description 1
- 206010013654 Drug abuse Diseases 0.000 description 1
- 102100023272 Dual specificity mitogen-activated protein kinase kinase 5 Human genes 0.000 description 1
- 102100025327 Dynamin-like 120 kDa protein, mitochondrial Human genes 0.000 description 1
- 102100038509 E3 ubiquitin-protein ligase ARIH1 Human genes 0.000 description 1
- 102100035813 E3 ubiquitin-protein ligase CBL Human genes 0.000 description 1
- 102100034362 E3 ubiquitin-protein ligase KCMF1 Human genes 0.000 description 1
- 102100031788 E3 ubiquitin-protein ligase MYLIP Human genes 0.000 description 1
- 102100038631 E3 ubiquitin-protein ligase SMURF1 Human genes 0.000 description 1
- 238000012286 ELISA Assay Methods 0.000 description 1
- 102100038415 ELKS/Rab6-interacting/CAST family member 1 Human genes 0.000 description 1
- 101710180090 ELKS/Rab6-interacting/CAST family member 1 Proteins 0.000 description 1
- 102100035084 ER membrane protein complex subunit 4 Human genes 0.000 description 1
- 102100035092 ER membrane protein complex subunit 5 Human genes 0.000 description 1
- 102100029722 Ectonucleoside triphosphate diphosphohydrolase 1 Human genes 0.000 description 1
- 241001635598 Enicostema Species 0.000 description 1
- 101710181478 Envelope glycoprotein GP350 Proteins 0.000 description 1
- 241000283086 Equidae Species 0.000 description 1
- 102100029106 Ethylmalonyl-CoA decarboxylase Human genes 0.000 description 1
- 102100020987 Eukaryotic translation initiation factor 5 Human genes 0.000 description 1
- 102100027300 Extracellular serine/threonine protein kinase FAM20C Human genes 0.000 description 1
- 102100020903 Ezrin Human genes 0.000 description 1
- 102100040650 F-BAR and double SH3 domains protein 2 Human genes 0.000 description 1
- 102100029186 F-box only protein 9 Human genes 0.000 description 1
- 101150111889 F4 gene Proteins 0.000 description 1
- 201000000141 Fanconi anemia complementation group L Diseases 0.000 description 1
- 241000282326 Felis catus Species 0.000 description 1
- 102100040680 Formin-binding protein 1 Human genes 0.000 description 1
- 102100039833 G patch domain-containing protein 8 Human genes 0.000 description 1
- 101710198884 GATA-type zinc finger protein 1 Proteins 0.000 description 1
- 230000010558 Gene Alterations Effects 0.000 description 1
- 102100028701 General vesicular transport factor p115 Human genes 0.000 description 1
- 102400000321 Glucagon Human genes 0.000 description 1
- 108060003199 Glucagon Proteins 0.000 description 1
- DTHNMHAUYICORS-KTKZVXAJSA-N Glucagon-like peptide 1 Chemical compound C([C@@H](C(=O)N[C@@H]([C@@H](C)CC)C(=O)N[C@@H](C)C(=O)N[C@@H](CC=1C2=CC=CC=C2NC=1)C(=O)N[C@@H](CC(C)C)C(=O)N[C@@H](C(C)C)C(=O)N[C@@H](CCCCN)C(=O)NCC(=O)N[C@@H](CCCNC(N)=N)C(N)=O)NC(=O)[C@H](CCC(O)=O)NC(=O)[C@H](CCCCN)NC(=O)[C@H](C)NC(=O)[C@H](C)NC(=O)[C@H](CCC(N)=O)NC(=O)CNC(=O)[C@H](CCC(O)=O)NC(=O)[C@H](CC(C)C)NC(=O)[C@H](CC=1C=CC(O)=CC=1)NC(=O)[C@H](CO)NC(=O)[C@H](CO)NC(=O)[C@@H](NC(=O)[C@H](CC(O)=O)NC(=O)[C@H](CO)NC(=O)[C@@H](NC(=O)[C@H](CC=1C=CC=CC=1)NC(=O)[C@@H](NC(=O)CNC(=O)[C@H](CCC(O)=O)NC(=O)[C@H](C)NC(=O)[C@@H](N)CC=1N=CNC=1)[C@@H](C)O)[C@@H](C)O)C(C)C)C1=CC=CC=C1 DTHNMHAUYICORS-KTKZVXAJSA-N 0.000 description 1
- 102100036646 Glutamyl-tRNA(Gln) amidotransferase subunit A, mitochondrial Human genes 0.000 description 1
- 102100036442 Glutathione reductase, mitochondrial Human genes 0.000 description 1
- 102100034223 Golgi apparatus protein 1 Human genes 0.000 description 1
- 102100033415 Golgi resident protein GCP60 Human genes 0.000 description 1
- 102100025334 Guanine nucleotide-binding protein G(q) subunit alpha Human genes 0.000 description 1
- 102100028539 Guanylate-binding protein 5 Human genes 0.000 description 1
- 102100028972 HLA class I histocompatibility antigen, A alpha chain Human genes 0.000 description 1
- 102100028971 HLA class I histocompatibility antigen, C alpha chain Human genes 0.000 description 1
- 102100028970 HLA class I histocompatibility antigen, alpha chain E Human genes 0.000 description 1
- 102100028966 HLA class I histocompatibility antigen, alpha chain F Human genes 0.000 description 1
- 102100022969 HMG box transcription factor BBX Human genes 0.000 description 1
- 102100039330 HMG box-containing protein 1 Human genes 0.000 description 1
- HTTJABKRGRZYRN-UHFFFAOYSA-N Heparin Chemical compound OC1C(NC(=O)C)C(O)OC(COS(O)(=O)=O)C1OC1C(OS(O)(=O)=O)C(O)C(OC2C(C(OS(O)(=O)=O)C(OC3C(C(O)C(O)C(O3)C(O)=O)OS(O)(=O)=O)C(CO)O2)NS(O)(=O)=O)C(C(O)=O)O1 HTTJABKRGRZYRN-UHFFFAOYSA-N 0.000 description 1
- 108010061414 Hepatocyte Nuclear Factor 1-beta Proteins 0.000 description 1
- 102100022123 Hepatocyte nuclear factor 1-beta Human genes 0.000 description 1
- 102100024233 High affinity cAMP-specific 3',5'-cyclic phosphodiesterase 7A Human genes 0.000 description 1
- 102100027711 Histone-lysine N-methyltransferase SETD5 Human genes 0.000 description 1
- 241000282412 Homo Species 0.000 description 1
- 101000678236 Homo sapiens 5'-nucleotidase Proteins 0.000 description 1
- 101000974441 Homo sapiens ADP-ribosylation factor-like protein 5A Proteins 0.000 description 1
- 101000685261 Homo sapiens AT-rich interactive domain-containing protein 2 Proteins 0.000 description 1
- 101000912684 Homo sapiens ATP-dependent RNA helicase DDX24 Proteins 0.000 description 1
- 101000975766 Homo sapiens Actin-related protein 2 Proteins 0.000 description 1
- 101000729999 Homo sapiens Advillin Proteins 0.000 description 1
- 101001062620 Homo sapiens Alpha-ketoglutarate-dependent dioxygenase FTO Proteins 0.000 description 1
- 101000776170 Homo sapiens Amphoterin-induced protein 1 Proteins 0.000 description 1
- 101000690725 Homo sapiens Angiogenic factor with G patch and FHA domains 1 Proteins 0.000 description 1
- 101000924485 Homo sapiens Ankyrin repeat domain-containing protein 12 Proteins 0.000 description 1
- 101000924345 Homo sapiens Ankyrin repeat domain-containing protein 36B Proteins 0.000 description 1
- 101000889428 Homo sapiens Ankyrin repeat domain-containing protein 46 Proteins 0.000 description 1
- 101000803266 Homo sapiens B-cell linker protein Proteins 0.000 description 1
- 101000971155 Homo sapiens B-cell scaffold protein with ankyrin repeats Proteins 0.000 description 1
- 101000897405 Homo sapiens B-lymphocyte antigen CD20 Proteins 0.000 description 1
- 101000897056 Homo sapiens Bis(5'-adenosyl)-triphosphatase ENPP4 Proteins 0.000 description 1
- 101000937778 Homo sapiens Bromodomain adjacent to zinc finger domain protein 1A Proteins 0.000 description 1
- 101000716068 Homo sapiens C-C chemokine receptor type 6 Proteins 0.000 description 1
- 101000922405 Homo sapiens C-X-C chemokine receptor type 5 Proteins 0.000 description 1
- 101000942118 Homo sapiens C-reactive protein Proteins 0.000 description 1
- 101000944442 Homo sapiens CUGBP Elav-like family member 2 Proteins 0.000 description 1
- 101000714321 Homo sapiens Calcineurin subunit B type 1 Proteins 0.000 description 1
- 101000944250 Homo sapiens Calcium/calmodulin-dependent protein kinase type 1 Proteins 0.000 description 1
- 101000944258 Homo sapiens Calcium/calmodulin-dependent protein kinase type 1D Proteins 0.000 description 1
- 101001077334 Homo sapiens Calcium/calmodulin-dependent protein kinase type II subunit gamma Proteins 0.000 description 1
- 101000775621 Homo sapiens Carbohydrate sulfotransferase 12 Proteins 0.000 description 1
- 101000715197 Homo sapiens Cell division cycle and apoptosis regulator protein 1 Proteins 0.000 description 1
- 101000622133 Homo sapiens Cell growth-regulating nucleolar protein Proteins 0.000 description 1
- 101000945814 Homo sapiens Centrosomal protein of 83 kDa Proteins 0.000 description 1
- 101000916452 Homo sapiens Centrosome and spindle pole-associated protein 1 Proteins 0.000 description 1
- 101000797578 Homo sapiens Chromobox protein homolog 3 Proteins 0.000 description 1
- 101000978247 Homo sapiens Coiled-coil domain-containing protein 186 Proteins 0.000 description 1
- 101000944365 Homo sapiens Cyclin-dependent kinase inhibitor 1C Proteins 0.000 description 1
- 101000611068 Homo sapiens DNA topoisomerase 3-alpha Proteins 0.000 description 1
- 101001081582 Homo sapiens DNA-binding protein inhibitor ID-2 Proteins 0.000 description 1
- 101001052946 Homo sapiens Dedicator of cytokinesis protein 8 Proteins 0.000 description 1
- 101000931862 Homo sapiens Dipeptidyl peptidase 3 Proteins 0.000 description 1
- 101000805871 Homo sapiens Disco-interacting protein 2 homolog B Proteins 0.000 description 1
- 101000804122 Homo sapiens DnaJ homolog subfamily C member 1 Proteins 0.000 description 1
- 101000808922 Homo sapiens E3 ubiquitin-protein ligase ARIH1 Proteins 0.000 description 1
- 101000994641 Homo sapiens E3 ubiquitin-protein ligase KCMF1 Proteins 0.000 description 1
- 101001128447 Homo sapiens E3 ubiquitin-protein ligase MYLIP Proteins 0.000 description 1
- 101000664993 Homo sapiens E3 ubiquitin-protein ligase SMURF1 Proteins 0.000 description 1
- 101000877430 Homo sapiens ER membrane protein complex subunit 4 Proteins 0.000 description 1
- 101000877400 Homo sapiens ER membrane protein complex subunit 5 Proteins 0.000 description 1
- 101000920800 Homo sapiens Endoplasmic reticulum-Golgi intermediate compartment protein 2 Proteins 0.000 description 1
- 101000841277 Homo sapiens Ethylmalonyl-CoA decarboxylase Proteins 0.000 description 1
- 101001002481 Homo sapiens Eukaryotic translation initiation factor 5 Proteins 0.000 description 1
- 101000937709 Homo sapiens Extracellular serine/threonine protein kinase FAM20C Proteins 0.000 description 1
- 101000854648 Homo sapiens Ezrin Proteins 0.000 description 1
- 101000892420 Homo sapiens F-BAR and double SH3 domains protein 2 Proteins 0.000 description 1
- 101000917834 Homo sapiens F-box only protein 9 Proteins 0.000 description 1
- 101000892722 Homo sapiens Formin-binding protein 1 Proteins 0.000 description 1
- 101001034097 Homo sapiens G patch domain-containing protein 8 Proteins 0.000 description 1
- 101001072655 Homo sapiens Glutamyl-tRNA(Gln) amidotransferase subunit A, mitochondrial Proteins 0.000 description 1
- 101000926911 Homo sapiens Golgi resident protein GCP60 Proteins 0.000 description 1
- 101000857888 Homo sapiens Guanine nucleotide-binding protein G(q) subunit alpha Proteins 0.000 description 1
- 101001058850 Homo sapiens Guanylate-binding protein 5 Proteins 0.000 description 1
- 101000986085 Homo sapiens HLA class I histocompatibility antigen, alpha chain E Proteins 0.000 description 1
- 101000986080 Homo sapiens HLA class I histocompatibility antigen, alpha chain F Proteins 0.000 description 1
- 101000903732 Homo sapiens HMG box transcription factor BBX Proteins 0.000 description 1
- 101001035846 Homo sapiens HMG box-containing protein 1 Proteins 0.000 description 1
- 101001117267 Homo sapiens High affinity cAMP-specific 3',5'-cyclic phosphodiesterase 7A Proteins 0.000 description 1
- 101000650669 Homo sapiens Histone-lysine N-methyltransferase SETD5 Proteins 0.000 description 1
- 101000998629 Homo sapiens Importin subunit beta-1 Proteins 0.000 description 1
- 101001008896 Homo sapiens Inactive histone-lysine N-methyltransferase 2E Proteins 0.000 description 1
- 101000975421 Homo sapiens Inositol 1,4,5-trisphosphate receptor type 2 Proteins 0.000 description 1
- 101000935040 Homo sapiens Integrin beta-2 Proteins 0.000 description 1
- 101001082070 Homo sapiens Interferon alpha-inducible protein 6 Proteins 0.000 description 1
- 101001003142 Homo sapiens Interleukin-12 receptor subunit beta-1 Proteins 0.000 description 1
- 101001056560 Homo sapiens Juxtaposed with another zinc finger protein 1 Proteins 0.000 description 1
- 101001017828 Homo sapiens Leucine-rich repeat flightless-interacting protein 1 Proteins 0.000 description 1
- 101000608935 Homo sapiens Leukosialin Proteins 0.000 description 1
- 101001017592 Homo sapiens Mediator of RNA polymerase II transcription subunit 13-like Proteins 0.000 description 1
- 101000616438 Homo sapiens Microtubule-associated protein 4 Proteins 0.000 description 1
- 101000578867 Homo sapiens Mis18-binding protein 1 Proteins 0.000 description 1
- 101000701614 Homo sapiens Nuclear autoantigen Sp-100 Proteins 0.000 description 1
- 101001137535 Homo sapiens Nuclear ubiquitous casein and cyclin-dependent kinase substrate 1 Proteins 0.000 description 1
- 101000604135 Homo sapiens Nucleolar protein 10 Proteins 0.000 description 1
- 101000992388 Homo sapiens Oxysterol-binding protein-related protein 8 Proteins 0.000 description 1
- 101000983268 Homo sapiens PHD finger protein 20-like protein 1 Proteins 0.000 description 1
- 101001071227 Homo sapiens PHD finger protein 23 Proteins 0.000 description 1
- 101000601724 Homo sapiens Paired box protein Pax-5 Proteins 0.000 description 1
- 101001094028 Homo sapiens Phosphatase and actin regulator 2 Proteins 0.000 description 1
- 101001126233 Homo sapiens Phospholipid phosphatase 4 Proteins 0.000 description 1
- 101001126231 Homo sapiens Phospholipid phosphatase 5 Proteins 0.000 description 1
- 101001137939 Homo sapiens Phosphorylase b kinase regulatory subunit beta Proteins 0.000 description 1
- 101000583156 Homo sapiens Pituitary homeobox 1 Proteins 0.000 description 1
- 101001097889 Homo sapiens Platelet-activating factor acetylhydrolase Proteins 0.000 description 1
- 101000609363 Homo sapiens Platelet-activating factor acetylhydrolase IB subunit alpha1 Proteins 0.000 description 1
- 101001064282 Homo sapiens Platelet-activating factor acetylhydrolase IB subunit beta Proteins 0.000 description 1
- 101001002271 Homo sapiens Polypeptide N-acetylgalactosaminyltransferase 1 Proteins 0.000 description 1
- 101001135406 Homo sapiens Polypyrimidine tract-binding protein 2 Proteins 0.000 description 1
- 101001124667 Homo sapiens Proteasome subunit alpha type-5 Proteins 0.000 description 1
- 101000942217 Homo sapiens Protein C19orf12 Proteins 0.000 description 1
- 101001065541 Homo sapiens Protein LYRIC Proteins 0.000 description 1
- 101000757232 Homo sapiens Protein arginine N-methyltransferase 2 Proteins 0.000 description 1
- 101001098769 Homo sapiens Protein disulfide-isomerase A6 Proteins 0.000 description 1
- 101001000061 Homo sapiens Protein phosphatase 1 regulatory subunit 12A Proteins 0.000 description 1
- 101000735558 Homo sapiens Protein-arginine deiminase type-2 Proteins 0.000 description 1
- 101000728107 Homo sapiens Putative Polycomb group protein ASXL2 Proteins 0.000 description 1
- 101000708591 Homo sapiens RAB11-binding protein RELCH Proteins 0.000 description 1
- 101000580720 Homo sapiens RNA-binding protein 25 Proteins 0.000 description 1
- 101001130290 Homo sapiens Rab GTPase-binding effector protein 1 Proteins 0.000 description 1
- 101000712814 Homo sapiens Rab3 GTPase-activating protein non-catalytic subunit Proteins 0.000 description 1
- 101000743829 Homo sapiens Ras-related protein Rab-12 Proteins 0.000 description 1
- 101000584743 Homo sapiens Recombining binding protein suppressor of hairless Proteins 0.000 description 1
- 101000849714 Homo sapiens Ribonuclease P protein subunit p29 Proteins 0.000 description 1
- 101000880116 Homo sapiens SERTA domain-containing protein 2 Proteins 0.000 description 1
- 101000832674 Homo sapiens SURP and G-patch domain-containing protein 2 Proteins 0.000 description 1
- 101000709250 Homo sapiens Serine/threonine-protein kinase SIK2 Proteins 0.000 description 1
- 101000651561 Homo sapiens Signal recognition particle subunit SRP72 Proteins 0.000 description 1
- 101000974834 Homo sapiens Sodium/potassium-transporting ATPase subunit beta-3 Proteins 0.000 description 1
- 101000665020 Homo sapiens Sorting nexin-5 Proteins 0.000 description 1
- 101000708766 Homo sapiens Structural maintenance of chromosomes protein 3 Proteins 0.000 description 1
- 101000661451 Homo sapiens Succinate-CoA ligase [GDP-forming] subunit beta, mitochondrial Proteins 0.000 description 1
- 101001099181 Homo sapiens TATA-binding protein-associated factor 2N Proteins 0.000 description 1
- 101000652998 Homo sapiens THAP domain-containing protein 6 Proteins 0.000 description 1
- 101000852214 Homo sapiens THO complex subunit 4 Proteins 0.000 description 1
- 101000665590 Homo sapiens Tax1-binding protein 1 Proteins 0.000 description 1
- 101001095487 Homo sapiens Telomere-associated protein RIF1 Proteins 0.000 description 1
- 101000796022 Homo sapiens Thioredoxin-interacting protein Proteins 0.000 description 1
- 101000737828 Homo sapiens Threonylcarbamoyladenosine tRNA methylthiotransferase Proteins 0.000 description 1
- 101001137337 Homo sapiens Transcriptional activator protein Pur-alpha Proteins 0.000 description 1
- 101000904868 Homo sapiens Transcriptional regulator ATRX Proteins 0.000 description 1
- 101000649120 Homo sapiens Translocating chain-associated membrane protein 2 Proteins 0.000 description 1
- 101000663048 Homo sapiens Transmembrane and coiled-coil domain protein 3 Proteins 0.000 description 1
- 101000640723 Homo sapiens Transmembrane protein 131-like Proteins 0.000 description 1
- 101000610557 Homo sapiens U4/U6 small nuclear ribonucleoprotein Prp31 Proteins 0.000 description 1
- 101000777156 Homo sapiens UBX domain-containing protein 4 Proteins 0.000 description 1
- 101000607909 Homo sapiens Ubiquitin carboxyl-terminal hydrolase 1 Proteins 0.000 description 1
- 101000644815 Homo sapiens Ubiquitin carboxyl-terminal hydrolase 16 Proteins 0.000 description 1
- 101001052436 Homo sapiens Ubiquitin carboxyl-terminal hydrolase MINDY-2 Proteins 0.000 description 1
- 101000644682 Homo sapiens Ubiquitin-conjugating enzyme E2 H Proteins 0.000 description 1
- 101000667110 Homo sapiens Vacuolar protein sorting-associated protein 13B Proteins 0.000 description 1
- 101000803685 Homo sapiens Vacuolar protein sorting-associated protein 4A Proteins 0.000 description 1
- 101000743114 Homo sapiens WASH complex subunit 4 Proteins 0.000 description 1
- 101000814514 Homo sapiens XIAP-associated factor 1 Proteins 0.000 description 1
- 101000708573 Homo sapiens Y+L amino acid transporter 2 Proteins 0.000 description 1
- 101000744745 Homo sapiens YTH domain-containing family protein 2 Proteins 0.000 description 1
- 101000964479 Homo sapiens Zinc finger and BTB domain-containing protein 18 Proteins 0.000 description 1
- 101000802327 Homo sapiens Zinc finger protein 561 Proteins 0.000 description 1
- 101000785613 Homo sapiens Zinc finger protein 652 Proteins 0.000 description 1
- 101000749534 Homo sapiens rRNA-processing protein UTP23 homolog Proteins 0.000 description 1
- 101000766035 Homo sapiens tRNA (guanine(37)-N1)-methyltransferase Proteins 0.000 description 1
- 241000714260 Human T-lymphotropic virus 1 Species 0.000 description 1
- 241000714259 Human T-lymphotropic virus 2 Species 0.000 description 1
- 208000009451 Hyperglycemic Hyperosmolar Nonketotic Coma Diseases 0.000 description 1
- 208000013016 Hypoglycemia Diseases 0.000 description 1
- 102100033258 Importin subunit beta-1 Human genes 0.000 description 1
- 102100027767 Inactive histone-lysine N-methyltransferase 2E Human genes 0.000 description 1
- 102100024037 Inositol 1,4,5-trisphosphate receptor type 2 Human genes 0.000 description 1
- 206010022489 Insulin Resistance Diseases 0.000 description 1
- 108060004056 Integrin alpha Chain Proteins 0.000 description 1
- 108010052369 Integrin alphaXbeta2 Proteins 0.000 description 1
- 102100039884 Integrin-linked kinase-associated serine/threonine phosphatase 2C Human genes 0.000 description 1
- 101710160759 Integrin-linked kinase-associated serine/threonine phosphatase 2C Proteins 0.000 description 1
- 102100027354 Interferon alpha-inducible protein 6 Human genes 0.000 description 1
- 102100020790 Interleukin-12 receptor subunit beta-1 Human genes 0.000 description 1
- 102000004195 Isomerases Human genes 0.000 description 1
- 108090000769 Isomerases Proteins 0.000 description 1
- 102100025392 Isovaleryl-CoA dehydrogenase, mitochondrial Human genes 0.000 description 1
- 102100023133 Jupiter microtubule associated homolog 1 Human genes 0.000 description 1
- 102100025727 Juxtaposed with another zinc finger protein 1 Human genes 0.000 description 1
- 206010023379 Ketoacidosis Diseases 0.000 description 1
- 208000007976 Ketosis Diseases 0.000 description 1
- 102100033303 Leucine-rich repeat flightless-interacting protein 1 Human genes 0.000 description 1
- 102100039564 Leukosialin Human genes 0.000 description 1
- 230000027311 M phase Effects 0.000 description 1
- 108010068305 MAP Kinase Kinase 5 Proteins 0.000 description 1
- 101000962498 Macropis fulvipes Macropin Proteins 0.000 description 1
- 102100034164 Mediator of RNA polymerase II transcription subunit 13-like Human genes 0.000 description 1
- 102100038290 Methyltransferase-like protein 22 Human genes 0.000 description 1
- 108700011259 MicroRNAs Proteins 0.000 description 1
- 102100021794 Microtubule-associated protein 4 Human genes 0.000 description 1
- 102100028344 Mis18-binding protein 1 Human genes 0.000 description 1
- 241000713333 Mouse mammary tumor virus Species 0.000 description 1
- 206010028164 Multiple allergies Diseases 0.000 description 1
- 241000699666 Mus <mouse, genus> Species 0.000 description 1
- 101100341513 Mus musculus Itgam gene Proteins 0.000 description 1
- 101100019396 Mus musculus Itgax gene Proteins 0.000 description 1
- 101100084404 Mus musculus Prodh gene Proteins 0.000 description 1
- KWYHDKDOAIKMQN-UHFFFAOYSA-N N,N,N',N'-tetramethylethylenediamine Chemical compound CN(C)CCN(C)C KWYHDKDOAIKMQN-UHFFFAOYSA-N 0.000 description 1
- 102100023896 N-acyl-phosphatidylethanolamine-hydrolyzing phospholipase D Human genes 0.000 description 1
- 101710180738 N-acyl-phosphatidylethanolamine-hydrolyzing phospholipase D Proteins 0.000 description 1
- 102100038552 NEDD4-binding protein 1 Human genes 0.000 description 1
- 101710081124 NEDD4-binding protein 1 Proteins 0.000 description 1
- 108010059419 NIMA-Interacting Peptidylprolyl Isomerase Proteins 0.000 description 1
- 102000005591 NIMA-Interacting Peptidylprolyl Isomerase Human genes 0.000 description 1
- 206010028980 Neoplasm Diseases 0.000 description 1
- 208000028389 Nerve injury Diseases 0.000 description 1
- 206010029260 Neuroblastoma Diseases 0.000 description 1
- 102100030436 Nuclear autoantigen Sp-100 Human genes 0.000 description 1
- 102100021007 Nuclear ubiquitous casein and cyclin-dependent kinase substrate 1 Human genes 0.000 description 1
- 101710163270 Nuclease Proteins 0.000 description 1
- 102100038456 Nucleolar protein 10 Human genes 0.000 description 1
- 102100025062 Nucleosome-remodeling factor subunit BPTF Human genes 0.000 description 1
- 108020005187 Oligonucleotide Probes Proteins 0.000 description 1
- 208000012868 Overgrowth Diseases 0.000 description 1
- 102100032151 Oxysterol-binding protein-related protein 8 Human genes 0.000 description 1
- 238000009004 PCR Kit Methods 0.000 description 1
- 238000002944 PCR assay Methods 0.000 description 1
- 102100026870 PHD finger protein 20-like protein 1 Human genes 0.000 description 1
- 102100036877 PHD finger protein 23 Human genes 0.000 description 1
- 102000036938 POU2AF1 Human genes 0.000 description 1
- 108060006456 POU2AF1 Proteins 0.000 description 1
- 101150004094 PRO2 gene Proteins 0.000 description 1
- 102100037504 Paired box protein Pax-5 Human genes 0.000 description 1
- 241001494479 Pecora Species 0.000 description 1
- 102100035266 Phosphatase and actin regulator 2 Human genes 0.000 description 1
- 102100030451 Phospholipid phosphatase 4 Human genes 0.000 description 1
- 102100030452 Phospholipid phosphatase 5 Human genes 0.000 description 1
- 108010089430 Phosphoproteins Proteins 0.000 description 1
- 102000007982 Phosphoproteins Human genes 0.000 description 1
- 102100020854 Phosphorylase b kinase regulatory subunit beta Human genes 0.000 description 1
- 108010004729 Phycoerythrin Proteins 0.000 description 1
- 102100030345 Pituitary homeobox 1 Human genes 0.000 description 1
- 108010022233 Plasminogen Activator Inhibitor 1 Proteins 0.000 description 1
- 102100039418 Plasminogen activator inhibitor 1 Human genes 0.000 description 1
- 102100037518 Platelet-activating factor acetylhydrolase Human genes 0.000 description 1
- 102100039446 Platelet-activating factor acetylhydrolase IB subunit alpha1 Human genes 0.000 description 1
- 102100020947 Polypeptide N-acetylgalactosaminyltransferase 1 Human genes 0.000 description 1
- 102100033280 Polypyrimidine tract-binding protein 2 Human genes 0.000 description 1
- 102100040918 Pro-glucagon Human genes 0.000 description 1
- 102000035554 Proglucagon Human genes 0.000 description 1
- 108010058003 Proglucagon Proteins 0.000 description 1
- 108010076181 Proinsulin Proteins 0.000 description 1
- 102100029270 Proteasome subunit alpha type-5 Human genes 0.000 description 1
- 102100032608 Protein C19orf12 Human genes 0.000 description 1
- 108010038241 Protein Inhibitors of Activated STAT Proteins 0.000 description 1
- 102000010635 Protein Inhibitors of Activated STAT Human genes 0.000 description 1
- 102100032133 Protein LYRIC Human genes 0.000 description 1
- 102100022988 Protein arginine N-methyltransferase 2 Human genes 0.000 description 1
- 102100037061 Protein disulfide-isomerase A6 Human genes 0.000 description 1
- 102100036547 Protein phosphatase 1 regulatory subunit 12A Human genes 0.000 description 1
- 102100035735 Protein-arginine deiminase type-2 Human genes 0.000 description 1
- 108091008109 Pseudogenes Proteins 0.000 description 1
- 102000057361 Pseudogenes Human genes 0.000 description 1
- 102100029750 Putative Polycomb group protein ASXL2 Human genes 0.000 description 1
- 238000001190 Q-PCR Methods 0.000 description 1
- 102100032798 RAB11-binding protein RELCH Human genes 0.000 description 1
- 238000013381 RNA quantification Methods 0.000 description 1
- 102100027478 RNA-binding protein 25 Human genes 0.000 description 1
- 102100031523 Rab GTPase-binding effector protein 1 Human genes 0.000 description 1
- 102100033185 Rab3 GTPase-activating protein non-catalytic subunit Human genes 0.000 description 1
- 102100038914 RalA-binding protein 1 Human genes 0.000 description 1
- 102100039106 Ras-related protein Rab-12 Human genes 0.000 description 1
- 102100030000 Recombining binding protein suppressor of hairless Human genes 0.000 description 1
- 206010057430 Retinal injury Diseases 0.000 description 1
- 102100033788 Ribonuclease P protein subunit p29 Human genes 0.000 description 1
- 102100037968 Ribonuclease inhibitor Human genes 0.000 description 1
- 102100037351 SERTA domain-containing protein 2 Human genes 0.000 description 1
- 108091006237 SLC7A6 Proteins 0.000 description 1
- 102100024541 SURP and G-patch domain-containing protein 2 Human genes 0.000 description 1
- 240000004808 Saccharomyces cerevisiae Species 0.000 description 1
- 102100023230 Serine/threonine-protein kinase MAK Human genes 0.000 description 1
- 102100034377 Serine/threonine-protein kinase SIK2 Human genes 0.000 description 1
- 102100027315 Signal recognition particle subunit SRP72 Human genes 0.000 description 1
- 241000580858 Simian-Human immunodeficiency virus Species 0.000 description 1
- 108020004688 Small Nuclear RNA Proteins 0.000 description 1
- 102000039471 Small Nuclear RNA Human genes 0.000 description 1
- 102100033774 Sodium-coupled neutral amino acid transporter 2 Human genes 0.000 description 1
- 102100022792 Sodium/potassium-transporting ATPase subunit beta-3 Human genes 0.000 description 1
- 102100038624 Sorting nexin-5 Human genes 0.000 description 1
- 102100027780 Splicing factor, proline- and glutamine-rich Human genes 0.000 description 1
- 102100032723 Structural maintenance of chromosomes protein 3 Human genes 0.000 description 1
- 108090001033 Sulfotransferases Proteins 0.000 description 1
- 102000004896 Sulfotransferases Human genes 0.000 description 1
- 102100036049 T-complex protein 1 subunit gamma Human genes 0.000 description 1
- 210000001744 T-lymphocyte Anatomy 0.000 description 1
- 102100038917 TATA-binding protein-associated factor 2N Human genes 0.000 description 1
- 102100030958 THAP domain-containing protein 6 Human genes 0.000 description 1
- 102100036434 THO complex subunit 4 Human genes 0.000 description 1
- 102100038193 Tax1-binding protein 1 Human genes 0.000 description 1
- 102100037806 Telomere-associated protein RIF1 Human genes 0.000 description 1
- 102100031344 Thioredoxin-interacting protein Human genes 0.000 description 1
- 102100035310 Threonylcarbamoyladenosine tRNA methylthiotransferase Human genes 0.000 description 1
- 102000040945 Transcription factor Human genes 0.000 description 1
- 108091023040 Transcription factor Proteins 0.000 description 1
- 102100039189 Transcription factor Maf Human genes 0.000 description 1
- 102100035715 Transcriptional activator protein Pur-alpha Human genes 0.000 description 1
- 102100023931 Transcriptional regulator ATRX Human genes 0.000 description 1
- 102100027957 Translocating chain-associated membrane protein 2 Human genes 0.000 description 1
- 102100037737 Transmembrane and coiled-coil domain protein 3 Human genes 0.000 description 1
- 102100033853 Transmembrane protein 131-like Human genes 0.000 description 1
- 102100040118 U4/U6 small nuclear ribonucleoprotein Prp31 Human genes 0.000 description 1
- 102100031308 UBX domain-containing protein 4 Human genes 0.000 description 1
- 102100023914 UDP-glucuronic acid decarboxylase 1 Human genes 0.000 description 1
- 101150020913 USP7 gene Proteins 0.000 description 1
- 102100039865 Ubiquitin carboxyl-terminal hydrolase 1 Human genes 0.000 description 1
- 102100020730 Ubiquitin carboxyl-terminal hydrolase 16 Human genes 0.000 description 1
- 102100021013 Ubiquitin carboxyl-terminal hydrolase 7 Human genes 0.000 description 1
- 102100024198 Ubiquitin carboxyl-terminal hydrolase MINDY-2 Human genes 0.000 description 1
- 108700011958 Ubiquitin-Specific Peptidase 7 Proteins 0.000 description 1
- 102100020698 Ubiquitin-conjugating enzyme E2 H Human genes 0.000 description 1
- 229940126752 Ubiquitin-specific protease 7 inhibitor Drugs 0.000 description 1
- 101710100170 Unknown protein Proteins 0.000 description 1
- 102100039113 Vacuolar protein sorting-associated protein 13B Human genes 0.000 description 1
- 102100035085 Vacuolar protein sorting-associated protein 4A Human genes 0.000 description 1
- 102100038143 WASH complex subunit 4 Human genes 0.000 description 1
- 108010037977 WNK Lysine-Deficient Protein Kinase 1 Proteins 0.000 description 1
- 102100039488 XIAP-associated factor 1 Human genes 0.000 description 1
- 102100032803 Y+L amino acid transporter 2 Human genes 0.000 description 1
- 102100039644 YTH domain-containing family protein 2 Human genes 0.000 description 1
- HCHKCACWOHOZIP-UHFFFAOYSA-N Zinc Chemical compound [Zn] HCHKCACWOHOZIP-UHFFFAOYSA-N 0.000 description 1
- 102100040762 Zinc finger and BTB domain-containing protein 18 Human genes 0.000 description 1
- 102100034643 Zinc finger protein 561 Human genes 0.000 description 1
- 102100026453 Zinc finger protein 652 Human genes 0.000 description 1
- 238000009825 accumulation Methods 0.000 description 1
- 230000009471 action Effects 0.000 description 1
- 230000004913 activation Effects 0.000 description 1
- 230000000996 additive effect Effects 0.000 description 1
- 210000000577 adipose tissue Anatomy 0.000 description 1
- 230000032683 aging Effects 0.000 description 1
- 206010001584 alcohol abuse Diseases 0.000 description 1
- 208000025746 alcohol use disease Diseases 0.000 description 1
- 108010004469 allophycocyanin Proteins 0.000 description 1
- 230000006907 apoptotic process Effects 0.000 description 1
- 208000011775 arteriosclerosis disease Diseases 0.000 description 1
- 210000003719 b-lymphocyte Anatomy 0.000 description 1
- WQZGKKKJIJFFOK-VFUOTHLCSA-N beta-D-glucose Chemical compound OC[C@H]1O[C@@H](O)[C@H](O)[C@@H](O)[C@@H]1O WQZGKKKJIJFFOK-VFUOTHLCSA-N 0.000 description 1
- 108010079292 betaglycan Proteins 0.000 description 1
- 238000010364 biochemical engineering Methods 0.000 description 1
- 238000010876 biochemical test Methods 0.000 description 1
- 239000012620 biological material Substances 0.000 description 1
- 230000033228 biological regulation Effects 0.000 description 1
- 238000001574 biopsy Methods 0.000 description 1
- 229960002685 biotin Drugs 0.000 description 1
- 235000020958 biotin Nutrition 0.000 description 1
- 239000011616 biotin Substances 0.000 description 1
- 210000000601 blood cell Anatomy 0.000 description 1
- 230000023555 blood coagulation Effects 0.000 description 1
- 239000003114 blood coagulation factor Substances 0.000 description 1
- 230000006583 body weight regulation Effects 0.000 description 1
- 210000001185 bone marrow Anatomy 0.000 description 1
- 238000004364 calculation method Methods 0.000 description 1
- 201000011510 cancer Diseases 0.000 description 1
- 230000023852 carbohydrate metabolic process Effects 0.000 description 1
- 235000021256 carbohydrate metabolism Nutrition 0.000 description 1
- 150000001720 carbohydrates Chemical class 0.000 description 1
- 235000014633 carbohydrates Nutrition 0.000 description 1
- 101150062912 cct3 gene Proteins 0.000 description 1
- 210000000170 cell membrane Anatomy 0.000 description 1
- 230000012292 cell migration Effects 0.000 description 1
- 210000001175 cerebrospinal fluid Anatomy 0.000 description 1
- DLGJWSVWTWEWBJ-HGGSSLSASA-N chondroitin Chemical compound CC(O)=N[C@@H]1[C@H](O)O[C@H](CO)[C@H](O)[C@@H]1OC1[C@H](O)[C@H](O)C=C(C(O)=O)O1 DLGJWSVWTWEWBJ-HGGSSLSASA-N 0.000 description 1
- 208000020832 chronic kidney disease Diseases 0.000 description 1
- 208000022831 chronic renal failure syndrome Diseases 0.000 description 1
- 208000009854 congenital contractural arachnodactyly Diseases 0.000 description 1
- 238000011109 contamination Methods 0.000 description 1
- 230000002596 correlated effect Effects 0.000 description 1
- 210000004748 cultured cell Anatomy 0.000 description 1
- SUYVUBYJARFZHO-RRKCRQDMSA-N dATP Chemical compound C1=NC=2C(N)=NC=NC=2N1[C@H]1C[C@H](O)[C@@H](COP(O)(=O)OP(O)(=O)OP(O)(O)=O)O1 SUYVUBYJARFZHO-RRKCRQDMSA-N 0.000 description 1
- SUYVUBYJARFZHO-UHFFFAOYSA-N dATP Natural products C1=NC=2C(N)=NC=NC=2N1C1CC(O)C(COP(O)(=O)OP(O)(=O)OP(O)(O)=O)O1 SUYVUBYJARFZHO-UHFFFAOYSA-N 0.000 description 1
- RGWHQCVHVJXOKC-SHYZEUOFSA-J dCTP(4-) Chemical compound O=C1N=C(N)C=CN1[C@@H]1O[C@H](COP([O-])(=O)OP([O-])(=O)OP([O-])([O-])=O)[C@@H](O)C1 RGWHQCVHVJXOKC-SHYZEUOFSA-J 0.000 description 1
- HAAZLUGHYHWQIW-KVQBGUIXSA-N dGTP Chemical compound C1=NC=2C(=O)NC(N)=NC=2N1[C@H]1C[C@H](O)[C@@H](COP(O)(=O)OP(O)(=O)OP(O)(O)=O)O1 HAAZLUGHYHWQIW-KVQBGUIXSA-N 0.000 description 1
- NHVNXKFIZYSCEB-XLPZGREQSA-N dTTP Chemical compound O=C1NC(=O)C(C)=CN1[C@@H]1O[C@H](COP(O)(=O)OP(O)(=O)OP(O)(O)=O)[C@@H](O)C1 NHVNXKFIZYSCEB-XLPZGREQSA-N 0.000 description 1
- 230000007423 decrease Effects 0.000 description 1
- 230000003247 decreasing effect Effects 0.000 description 1
- 230000007547 defect Effects 0.000 description 1
- 230000002950 deficient Effects 0.000 description 1
- 238000012217 deletion Methods 0.000 description 1
- 230000037430 deletion Effects 0.000 description 1
- 239000003398 denaturant Substances 0.000 description 1
- 210000004443 dendritic cell Anatomy 0.000 description 1
- KHWCHTKSEGGWEX-UHFFFAOYSA-N deoxyadenylic acid Natural products C1=NC=2C(N)=NC=NC=2N1C1CC(O)C(COP(O)(O)=O)O1 KHWCHTKSEGGWEX-UHFFFAOYSA-N 0.000 description 1
- LTFMZDNNPPEQNG-UHFFFAOYSA-N deoxyguanylic acid Natural products C1=2NC(N)=NC(=O)C=2N=CN1C1CC(O)C(COP(O)(O)=O)O1 LTFMZDNNPPEQNG-UHFFFAOYSA-N 0.000 description 1
- 239000003599 detergent Substances 0.000 description 1
- 238000012774 diagnostic algorithm Methods 0.000 description 1
- 238000002405 diagnostic procedure Methods 0.000 description 1
- 229940079593 drug Drugs 0.000 description 1
- 239000003814 drug Substances 0.000 description 1
- 101150030653 emr-1 gene Proteins 0.000 description 1
- 210000003158 enteroendocrine cell Anatomy 0.000 description 1
- 230000002255 enzymatic effect Effects 0.000 description 1
- 210000003743 erythrocyte Anatomy 0.000 description 1
- 238000000684 flow cytometry Methods 0.000 description 1
- 238000002875 fluorescence polarization Methods 0.000 description 1
- 235000021588 free fatty acids Nutrition 0.000 description 1
- 230000008014 freezing Effects 0.000 description 1
- 238000007710 freezing Methods 0.000 description 1
- 238000010353 genetic engineering Methods 0.000 description 1
- 208000004104 gestational diabetes Diseases 0.000 description 1
- MASNOZXLGMXCHN-ZLPAWPGGSA-N glucagon Chemical compound C([C@@H](C(=O)N[C@H](C(=O)N[C@@H](CCC(N)=O)C(=O)N[C@@H](CC=1C2=CC=CC=C2NC=1)C(=O)N[C@@H](CC(C)C)C(=O)N[C@@H](CCSC)C(=O)N[C@@H](CC(N)=O)C(=O)N[C@@H]([C@@H](C)O)C(O)=O)C(C)C)NC(=O)[C@H](CC(O)=O)NC(=O)[C@H](CCC(N)=O)NC(=O)[C@H](C)NC(=O)[C@H](CCCNC(N)=N)NC(=O)[C@H](CCCNC(N)=N)NC(=O)[C@H](CO)NC(=O)[C@H](CC(O)=O)NC(=O)[C@H](CC(C)C)NC(=O)[C@H](CC=1C=CC(O)=CC=1)NC(=O)[C@H](CCCCN)NC(=O)[C@H](CO)NC(=O)[C@H](CC=1C=CC(O)=CC=1)NC(=O)[C@H](CC(O)=O)NC(=O)[C@H](CO)NC(=O)[C@@H](NC(=O)[C@H](CC=1C=CC=CC=1)NC(=O)[C@@H](NC(=O)CNC(=O)[C@H](CCC(N)=O)NC(=O)[C@H](CO)NC(=O)[C@@H](N)CC=1NC=NC=1)[C@@H](C)O)[C@@H](C)O)C1=CC=CC=C1 MASNOZXLGMXCHN-ZLPAWPGGSA-N 0.000 description 1
- 229960004666 glucagon Drugs 0.000 description 1
- 208000035474 group of disease Diseases 0.000 description 1
- ZJYYHGLJYGJLLN-UHFFFAOYSA-N guanidinium thiocyanate Chemical compound SC#N.NC(N)=N ZJYYHGLJYGJLLN-UHFFFAOYSA-N 0.000 description 1
- 229920000669 heparin Polymers 0.000 description 1
- 229960002897 heparin Drugs 0.000 description 1
- 238000010842 high-capacity cDNA reverse transcription kit Methods 0.000 description 1
- 229940088597 hormone Drugs 0.000 description 1
- 239000005556 hormone Substances 0.000 description 1
- 230000003345 hyperglycaemic effect Effects 0.000 description 1
- 238000007654 immersion Methods 0.000 description 1
- 210000002865 immune cell Anatomy 0.000 description 1
- 230000001900 immune effect Effects 0.000 description 1
- 230000028993 immune response Effects 0.000 description 1
- 230000003053 immunization Effects 0.000 description 1
- 238000002649 immunization Methods 0.000 description 1
- 230000001771 impaired effect Effects 0.000 description 1
- 230000002757 inflammatory effect Effects 0.000 description 1
- 230000028709 inflammatory response Effects 0.000 description 1
- 239000003112 inhibitor Substances 0.000 description 1
- 230000000977 initiatory effect Effects 0.000 description 1
- 238000003780 insertion Methods 0.000 description 1
- 230000037431 insertion Effects 0.000 description 1
- 102000017777 integrin alpha chain Human genes 0.000 description 1
- 210000000936 intestine Anatomy 0.000 description 1
- 238000011005 laboratory method Methods 0.000 description 1
- 210000000265 leukocyte Anatomy 0.000 description 1
- 230000007774 longterm Effects 0.000 description 1
- 210000002751 lymph Anatomy 0.000 description 1
- 108010089086 lysolecithin acylhydrolase Proteins 0.000 description 1
- 210000004962 mammalian cell Anatomy 0.000 description 1
- 239000012528 membrane Substances 0.000 description 1
- 239000002679 microRNA Substances 0.000 description 1
- 235000013336 milk Nutrition 0.000 description 1
- 210000004080 milk Anatomy 0.000 description 1
- 239000008267 milk Substances 0.000 description 1
- 238000012986 modification Methods 0.000 description 1
- 230000004048 modification Effects 0.000 description 1
- 238000010369 molecular cloning Methods 0.000 description 1
- 239000003068 molecular probe Substances 0.000 description 1
- 239000004570 mortar (masonry) Substances 0.000 description 1
- 238000010172 mouse model Methods 0.000 description 1
- 239000013642 negative control Substances 0.000 description 1
- 230000008764 nerve damage Effects 0.000 description 1
- 238000007857 nested PCR Methods 0.000 description 1
- 239000002751 oligonucleotide probe Substances 0.000 description 1
- 210000000056 organ Anatomy 0.000 description 1
- 239000003960 organic solvent Substances 0.000 description 1
- 230000008506 pathogenesis Effects 0.000 description 1
- 230000004560 pathway-based gene signature Effects 0.000 description 1
- 239000013610 patient sample Substances 0.000 description 1
- 238000003909 pattern recognition Methods 0.000 description 1
- 239000008188 pellet Substances 0.000 description 1
- 230000037081 physical activity Effects 0.000 description 1
- 108010024226 placental ribonuclease inhibitor Proteins 0.000 description 1
- 230000000379 polymerizing effect Effects 0.000 description 1
- 102000054765 polymorphisms of proteins Human genes 0.000 description 1
- 239000013641 positive control Substances 0.000 description 1
- 239000000843 powder Substances 0.000 description 1
- 239000002243 precursor Substances 0.000 description 1
- 238000002360 preparation method Methods 0.000 description 1
- 230000002265 prevention Effects 0.000 description 1
- 238000004393 prognosis Methods 0.000 description 1
- 238000003498 protein array Methods 0.000 description 1
- 238000000159 protein binding assay Methods 0.000 description 1
- 230000025220 protein targeting to vacuole Effects 0.000 description 1
- 238000011002 quantification Methods 0.000 description 1
- 102100040585 rRNA-processing protein UTP23 homolog Human genes 0.000 description 1
- 230000002285 radioactive effect Effects 0.000 description 1
- 238000003127 radioimmunoassay Methods 0.000 description 1
- 230000008707 rearrangement Effects 0.000 description 1
- 230000009467 reduction Effects 0.000 description 1
- 230000003252 repetitive effect Effects 0.000 description 1
- 238000010839 reverse transcription Methods 0.000 description 1
- 230000002441 reversible effect Effects 0.000 description 1
- 238000012552 review Methods 0.000 description 1
- PYWVYCXTNDRMGF-UHFFFAOYSA-N rhodamine B Chemical compound [Cl-].C=12C=CC(=[N+](CC)CC)C=C2OC2=CC(N(CC)CC)=CC=C2C=1C1=CC=CC=C1C(O)=O PYWVYCXTNDRMGF-UHFFFAOYSA-N 0.000 description 1
- 210000003296 saliva Anatomy 0.000 description 1
- 238000012216 screening Methods 0.000 description 1
- 230000028327 secretion Effects 0.000 description 1
- 210000002966 serum Anatomy 0.000 description 1
- 239000007787 solid Substances 0.000 description 1
- 230000007480 spreading Effects 0.000 description 1
- 238000003892 spreading Methods 0.000 description 1
- 238000010186 staining Methods 0.000 description 1
- 238000010561 standard procedure Methods 0.000 description 1
- 210000000130 stem cell Anatomy 0.000 description 1
- 239000000126 substance Substances 0.000 description 1
- 208000011117 substance-related disease Diseases 0.000 description 1
- 239000000758 substrate Substances 0.000 description 1
- 230000002459 sustained effect Effects 0.000 description 1
- 102100026250 tRNA (guanine(37)-N1)-methyltransferase Human genes 0.000 description 1
- 210000001138 tear Anatomy 0.000 description 1
- ABZLKHKQJHEPAX-UHFFFAOYSA-N tetramethylrhodamine Chemical compound C=12C=CC(N(C)C)=CC2=[O+]C2=CC(N(C)C)=CC=C2C=1C1=CC=CC=C1C([O-])=O ABZLKHKQJHEPAX-UHFFFAOYSA-N 0.000 description 1
- MPLHNVLQVRSVEE-UHFFFAOYSA-N texas red Chemical compound [O-]S(=O)(=O)C1=CC(S(Cl)(=O)=O)=CC=C1C(C1=CC=2CCCN3CCCC(C=23)=C1O1)=C2C1=C(CCC1)C3=[N+]1CCCC3=C2 MPLHNVLQVRSVEE-UHFFFAOYSA-N 0.000 description 1
- 230000002103 transcriptional effect Effects 0.000 description 1
- 238000013519 translation Methods 0.000 description 1
- 150000003626 triacylglycerols Chemical class 0.000 description 1
- 208000035408 type 1 diabetes mellitus 1 Diseases 0.000 description 1
- 241001430294 unidentified retrovirus Species 0.000 description 1
- 108010037501 vesicular transport factor p115 Proteins 0.000 description 1
- 239000011701 zinc Substances 0.000 description 1
- 229910052725 zinc Inorganic materials 0.000 description 1
Images
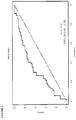


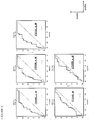
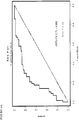

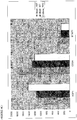

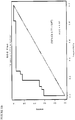

Classifications
-
- C—CHEMISTRY; METALLURGY
- C12—BIOCHEMISTRY; BEER; SPIRITS; WINE; VINEGAR; MICROBIOLOGY; ENZYMOLOGY; MUTATION OR GENETIC ENGINEERING
- C12Q—MEASURING OR TESTING PROCESSES INVOLVING ENZYMES, NUCLEIC ACIDS OR MICROORGANISMS; COMPOSITIONS OR TEST PAPERS THEREFOR; PROCESSES OF PREPARING SUCH COMPOSITIONS; CONDITION-RESPONSIVE CONTROL IN MICROBIOLOGICAL OR ENZYMOLOGICAL PROCESSES
- C12Q1/00—Measuring or testing processes involving enzymes, nucleic acids or microorganisms; Compositions therefor; Processes of preparing such compositions
- C12Q1/68—Measuring or testing processes involving enzymes, nucleic acids or microorganisms; Compositions therefor; Processes of preparing such compositions involving nucleic acids
- C12Q1/6876—Nucleic acid products used in the analysis of nucleic acids, e.g. primers or probes
- C12Q1/6883—Nucleic acid products used in the analysis of nucleic acids, e.g. primers or probes for diseases caused by alterations of genetic material
-
- G—PHYSICS
- G01—MEASURING; TESTING
- G01N—INVESTIGATING OR ANALYSING MATERIALS BY DETERMINING THEIR CHEMICAL OR PHYSICAL PROPERTIES
- G01N33/00—Investigating or analysing materials by specific methods not covered by groups G01N1/00 - G01N31/00
- G01N33/48—Biological material, e.g. blood, urine; Haemocytometers
- G01N33/50—Chemical analysis of biological material, e.g. blood, urine; Testing involving biospecific ligand binding methods; Immunological testing
- G01N33/53—Immunoassay; Biospecific binding assay; Materials therefor
-
- G—PHYSICS
- G01—MEASURING; TESTING
- G01N—INVESTIGATING OR ANALYSING MATERIALS BY DETERMINING THEIR CHEMICAL OR PHYSICAL PROPERTIES
- G01N33/00—Investigating or analysing materials by specific methods not covered by groups G01N1/00 - G01N31/00
- G01N33/48—Biological material, e.g. blood, urine; Haemocytometers
- G01N33/50—Chemical analysis of biological material, e.g. blood, urine; Testing involving biospecific ligand binding methods; Immunological testing
- G01N33/68—Chemical analysis of biological material, e.g. blood, urine; Testing involving biospecific ligand binding methods; Immunological testing involving proteins, peptides or amino acids
- G01N33/6893—Chemical analysis of biological material, e.g. blood, urine; Testing involving biospecific ligand binding methods; Immunological testing involving proteins, peptides or amino acids related to diseases not provided for elsewhere
-
- G—PHYSICS
- G16—INFORMATION AND COMMUNICATION TECHNOLOGY [ICT] SPECIALLY ADAPTED FOR SPECIFIC APPLICATION FIELDS
- G16B—BIOINFORMATICS, i.e. INFORMATION AND COMMUNICATION TECHNOLOGY [ICT] SPECIALLY ADAPTED FOR GENETIC OR PROTEIN-RELATED DATA PROCESSING IN COMPUTATIONAL MOLECULAR BIOLOGY
- G16B25/00—ICT specially adapted for hybridisation; ICT specially adapted for gene or protein expression
-
- G—PHYSICS
- G16—INFORMATION AND COMMUNICATION TECHNOLOGY [ICT] SPECIALLY ADAPTED FOR SPECIFIC APPLICATION FIELDS
- G16B—BIOINFORMATICS, i.e. INFORMATION AND COMMUNICATION TECHNOLOGY [ICT] SPECIALLY ADAPTED FOR GENETIC OR PROTEIN-RELATED DATA PROCESSING IN COMPUTATIONAL MOLECULAR BIOLOGY
- G16B25/00—ICT specially adapted for hybridisation; ICT specially adapted for gene or protein expression
- G16B25/10—Gene or protein expression profiling; Expression-ratio estimation or normalisation
-
- G—PHYSICS
- G16—INFORMATION AND COMMUNICATION TECHNOLOGY [ICT] SPECIALLY ADAPTED FOR SPECIFIC APPLICATION FIELDS
- G16B—BIOINFORMATICS, i.e. INFORMATION AND COMMUNICATION TECHNOLOGY [ICT] SPECIALLY ADAPTED FOR GENETIC OR PROTEIN-RELATED DATA PROCESSING IN COMPUTATIONAL MOLECULAR BIOLOGY
- G16B25/00—ICT specially adapted for hybridisation; ICT specially adapted for gene or protein expression
- G16B25/30—Microarray design
-
- G—PHYSICS
- G16—INFORMATION AND COMMUNICATION TECHNOLOGY [ICT] SPECIALLY ADAPTED FOR SPECIFIC APPLICATION FIELDS
- G16B—BIOINFORMATICS, i.e. INFORMATION AND COMMUNICATION TECHNOLOGY [ICT] SPECIALLY ADAPTED FOR GENETIC OR PROTEIN-RELATED DATA PROCESSING IN COMPUTATIONAL MOLECULAR BIOLOGY
- G16B40/00—ICT specially adapted for biostatistics; ICT specially adapted for bioinformatics-related machine learning or data mining, e.g. knowledge discovery or pattern finding
-
- G—PHYSICS
- G16—INFORMATION AND COMMUNICATION TECHNOLOGY [ICT] SPECIALLY ADAPTED FOR SPECIFIC APPLICATION FIELDS
- G16B—BIOINFORMATICS, i.e. INFORMATION AND COMMUNICATION TECHNOLOGY [ICT] SPECIALLY ADAPTED FOR GENETIC OR PROTEIN-RELATED DATA PROCESSING IN COMPUTATIONAL MOLECULAR BIOLOGY
- G16B40/00—ICT specially adapted for biostatistics; ICT specially adapted for bioinformatics-related machine learning or data mining, e.g. knowledge discovery or pattern finding
- G16B40/10—Signal processing, e.g. from mass spectrometry [MS] or from PCR
-
- G—PHYSICS
- G16—INFORMATION AND COMMUNICATION TECHNOLOGY [ICT] SPECIALLY ADAPTED FOR SPECIFIC APPLICATION FIELDS
- G16H—HEALTHCARE INFORMATICS, i.e. INFORMATION AND COMMUNICATION TECHNOLOGY [ICT] SPECIALLY ADAPTED FOR THE HANDLING OR PROCESSING OF MEDICAL OR HEALTHCARE DATA
- G16H50/00—ICT specially adapted for medical diagnosis, medical simulation or medical data mining; ICT specially adapted for detecting, monitoring or modelling epidemics or pandemics
- G16H50/20—ICT specially adapted for medical diagnosis, medical simulation or medical data mining; ICT specially adapted for detecting, monitoring or modelling epidemics or pandemics for computer-aided diagnosis, e.g. based on medical expert systems
-
- C—CHEMISTRY; METALLURGY
- C12—BIOCHEMISTRY; BEER; SPIRITS; WINE; VINEGAR; MICROBIOLOGY; ENZYMOLOGY; MUTATION OR GENETIC ENGINEERING
- C12Q—MEASURING OR TESTING PROCESSES INVOLVING ENZYMES, NUCLEIC ACIDS OR MICROORGANISMS; COMPOSITIONS OR TEST PAPERS THEREFOR; PROCESSES OF PREPARING SUCH COMPOSITIONS; CONDITION-RESPONSIVE CONTROL IN MICROBIOLOGICAL OR ENZYMOLOGICAL PROCESSES
- C12Q2600/00—Oligonucleotides characterized by their use
- C12Q2600/112—Disease subtyping, staging or classification
-
- C—CHEMISTRY; METALLURGY
- C12—BIOCHEMISTRY; BEER; SPIRITS; WINE; VINEGAR; MICROBIOLOGY; ENZYMOLOGY; MUTATION OR GENETIC ENGINEERING
- C12Q—MEASURING OR TESTING PROCESSES INVOLVING ENZYMES, NUCLEIC ACIDS OR MICROORGANISMS; COMPOSITIONS OR TEST PAPERS THEREFOR; PROCESSES OF PREPARING SUCH COMPOSITIONS; CONDITION-RESPONSIVE CONTROL IN MICROBIOLOGICAL OR ENZYMOLOGICAL PROCESSES
- C12Q2600/00—Oligonucleotides characterized by their use
- C12Q2600/156—Polymorphic or mutational markers
-
- C—CHEMISTRY; METALLURGY
- C12—BIOCHEMISTRY; BEER; SPIRITS; WINE; VINEGAR; MICROBIOLOGY; ENZYMOLOGY; MUTATION OR GENETIC ENGINEERING
- C12Q—MEASURING OR TESTING PROCESSES INVOLVING ENZYMES, NUCLEIC ACIDS OR MICROORGANISMS; COMPOSITIONS OR TEST PAPERS THEREFOR; PROCESSES OF PREPARING SUCH COMPOSITIONS; CONDITION-RESPONSIVE CONTROL IN MICROBIOLOGICAL OR ENZYMOLOGICAL PROCESSES
- C12Q2600/00—Oligonucleotides characterized by their use
- C12Q2600/158—Expression markers
-
- Y—GENERAL TAGGING OF NEW TECHNOLOGICAL DEVELOPMENTS; GENERAL TAGGING OF CROSS-SECTIONAL TECHNOLOGIES SPANNING OVER SEVERAL SECTIONS OF THE IPC; TECHNICAL SUBJECTS COVERED BY FORMER USPC CROSS-REFERENCE ART COLLECTIONS [XRACs] AND DIGESTS
- Y02—TECHNOLOGIES OR APPLICATIONS FOR MITIGATION OR ADAPTATION AGAINST CLIMATE CHANGE
- Y02A—TECHNOLOGIES FOR ADAPTATION TO CLIMATE CHANGE
- Y02A90/00—Technologies having an indirect contribution to adaptation to climate change
- Y02A90/10—Information and communication technologies [ICT] supporting adaptation to climate change, e.g. for weather forecasting or climate simulation
Definitions
- the application relates to the field of medical diagnostics and describes methods and kits for the point-of-care diagnosis of a diabetic disease state in a patient.
- Diabetes is a group of diseases marked by high levels of blood glucose resulting from defects in insulin production, insulin action, or both. Left untreated, it can cause many serious short term complications including symptoms ofhypoglycemia, ketoacidosis, or nonketotic hyperosmolar coma. In the long term, diabetes is known to contribute to an increased risk of arteriosclerosis, chronic renal failure, retinal damage (including blindness), nerve damage and microvascular damage.
- WO 2007/128884 relates to a method of diagnosis of Type 2 Diabetes.
- EP1538219 relates to methods which are alleged to be able to be used to diagnose or screen to Diabetes Mellitus type 1 (DM1) in a subject by assaying for a marker for DM1.
- DM1 Diabetes Mellitus type 1
- WO 2008/074963 relates to an in vitro method for the early diagnosis of diabetes from a biological sample from a patient.
- kits comprising reagents for the rapid measurement of gene signature expression profiles in a patient's blood sample.
- the kit format is cost-effective and convenient for use at a point-of-care facility.
- a method for the diagnosis of Diabetes Mellitus in a patient, the method comprising the steps of (a) providing a test sample taken from a patient, (b) measuring the gene expression profile of a gene signature comprising a gene selected from the group of TOP1, CD24 and STAP1 genes, (c) comparing the gene expression profile with a diagnostic gene expression profile of the gene signature, (d) determining a diabetic disease state in the patient based at least in part upon a substantial match between the gene expression profile and the diagnostic gene expression profile and (e) displaying the determination to a medical professional.
- the determining step can be executed by a computer system running one or more algorithms selected from the group of Linear combination of gene expression signals, Linear regression model, Logistic regression model, Linear discrimination analysis (LDA) model, The nearest neighbor model and the Prediction Analysis of Microarrays (PAM).
- the determining step can also include analysis of the patient's metabolic disease profile.
- the gene signature can include any two genes selected from the group of TOP1, CD24 and STAP1 genes or all three genes. In one embodiment, the gene signature can include one or more genes selected from the group of TOP1, CD24 and STAP1 genes and one or more genes selected from the genes listed in TABLES 1 or 6.
- the patient can have a normal BMI.
- the diabetic disease state can be a pre-diabetic disease state or a Type 2 Diabetes disease state.
- the test sample can be a blood sample or a test sample containing PBMCs or CD11c + or CD11b + or Emr + or [CD11b + CD11c + ] or [Emr + CD11b + ] or [Emr + CD11c + ] or [Emr + CD11b + CD11c + ] cells or CD14 + monocytes.
- the measuring can involve real-time PCR, an immunochemical assay or a specific oligonucleotide hybridization.
- a method for the diagnosis of Diabetes Mellitus in a patient, the method comprising the steps of (a) providing a test sample taken from a patient, (b) measuring the gene expression profile of a gene signature comprising the TULP4, AA741300, ESCO1, EIF5B, ACTR2, WNK1, COCH, SON, TPR and NOG genes, (c) comparing the gene expression profile with a diagnostic gene expression profile of the gene signature, (d) determining a diabetic disease state in the patient based at least in part upon a substantial match between the gene expression profile and the diagnostic gene expression profile and (e) displaying the determination to a medical professional.
- the determining step can be executed by a computer system running one or more algorithms selected from the group of Linear combination of gene expression signals, Linear regression model, Logistic regression model, Linear discrimination analysis (LDA) model, The nearest neighbor model and the Prediction Analysis of Microarrays (PAM).
- the determining step can also include analysis of the patient's metabolic disease profile.
- the gene signature includes the TOP1, CD24 and STAP1 genes in addition to the TULP4, AA741300, ESCO1, EIF5B, ACTR2, WNK1, COCH, SON, TPR and NOG genes.
- the gene signature includes the TULP4, AA741300, ESCO1, EIF5B, ACTR2, WNK1, COCH, SON, TPR and NOG genes and one or more genes selected from the genes listed in TABLES 1 or 6.
- the patient can have a normal BMI.
- the diabetic disease state can be a pre-diabetic disease state or a Type 2 Diabetes disease state.
- the test sample can be a blood sample or a test sample containing PBMCs or CD11c + or CD11b + or Emr + or [CD11b + CD11c + ] or [Emr + CD11b + ] or [Emr + CD11c + ] or [Emr + CD11b + CD11c + ] cells or CD14 + monocytes.
- the measuring can involve real-time PCR, an immunochemical assay or a specific oligonucleotide hybridization.
- a method for the diagnosis of Diabetes Mellitus in a patient, the method comprising the steps of (a) providing a test sample taken from a patient, (b) measuring the gene expression profile of a gene signature comprising the TCF7L2 and CLC genes, (c) comparing the gene expression profile with a diagnostic gene expression profile of the gene signature, (d) determining a diabetic disease state in the patient based at least in part upon a substantial match between the gene expression profile and the diagnostic gene expression profile and (e) displaying the determination to a medical professional.
- the determining step can be executed by a computer system running one or more algorithms selected from the group of Linear combination of gene expression signals, Linear regression model, Logistic regression model, Linear discrimination analysis (LDA) model, The nearest neighbor model and the Prediction Analysis of Microarrays (PAM).
- the determining step can also include analysis of the patient's metabolic disease profile.
- the gene signature can include either the TCF7L2 or CLC gene. In one aspect, the gene signature includes one or more variants of the TC7L2 or CLC gene. In one aspect, the gene signature includes either the TCF7L2 or CLC gene and one or more genes selected from the genes listed in TABLES 1 or 6.
- the patient can have a normal BMI.
- the diabetic disease state can be a pre-diabetic disease state or a Type 2 Diabetes disease state.
- the test sample can be a blood sample or a test sample containing PBMCs or CD11c + or CD11b + or Emr + or [CD11b + CD11c + ] or [Emr + CD11b + ] or [Emr + CD11c + ] or [Emr + CD11b + CD11c + ] cells or CD14 + monocytes.
- the measuring can involve real-time PCR, an immunochemical assay or a specific oligonucleotide hybridization.
- a method for diagnosing a change in the diabetic disease state of a patient comprising the steps of (a) providing a first test sample taken from a patient at a first time point, (b) measuring a first expression profile of a gene signature comprising a gene selected from the group of the TOP 1, CD24 and STAP1 genes in the first test sample, (c) providing a second test sample taken from the patient at a second time point, (d) measuring a second expression profile of the gene signature in the second test sample, (e) comparing the first expression profile with the second expression profile, (f) determining a change in the diabetic disease state in the patient based at least in part upon a substantial difference between the first gene expression profile and the second gene expression profile, and (g) displaying the determination to a medical professional.
- the determining step is executed by a computer system running one or more algorithms selected from the group of Linear combination of gene expression signals, Linear regression model, Logistic regression model, Linear discrimination analysis (LDA) model, The nearest neighbor model and the Prediction Analysis of Microarrays (PAM).
- the determining step also includes an analysis of the patient's metabolic disease profile.
- the gene signature can include any two genes selected from the group of the TOP1, CD24 and STAP1 genes. In one aspect, the gene signature includes the TOP1, CD24 and STAP1 genes. In another aspect, the gene signature includes a gene selected from the group of the TOP1, CD24 and STAP1 genes and one or more genes selected from the genes listed in TABLES 1 or 6.
- the time period between the first time point and the second time point is from 0 to 2 years or from 1 ⁇ 4 to 2 years or from 1 ⁇ 2 to 2 years or from 2 to 5 years, or from 5 to 10 years or more.
- a change in diabetic disease state can be indicative of a progression toward a pre-diabetic disease state or a Type II Diabetes disease state.
- the patient at the first time point gas a normal BMI.
- the first and second test sample can be blood samples.
- the first and second test sample can a test sample containing PBMCs or CD11c + or CD11b + or Emr + or [CD11b + CD11c + ] or [Emr + CD11b + ] or [Emr + CD11c + ] or [Emr + CD11b + CD11c + ] cells or CD14 + monocytes.
- the measuring can involve real-time PCR, an immunochemical assay or a specific oligonucleotide hybridization.
- a method for diagnosing a change in the diabetic disease state of a patient comprising the steps of (a) providing a first test sample taken from a patient at a first time point, (b) measuring a first expression profile of a gene signature comprising the TULP4, AA741300, ESCO1, EIF5B, ACTR2, WNK1, COCH, SON, TPR and NOG genes in the first test sample, (c) providing a second test sample taken from the patient at a second time point, (d) measuring a second expression profile of the gene signature in the second test sample, (e) comparing the first expression profile with the second expression profile, (f) determining a change in the diabetic disease state in the patient based at least in part upon a substantial difference between the first gene expression profile and the second gene expression profile, and (g) displaying the determination to a medical professional.
- the determining step is executed by a computer system running one or more algorithms selected from the group of Linear combination of gene expression signals, Linear regression model, Logistic regression model, Linear discrimination analysis (LDA) model, The nearest neighbor model and the Prediction Analysis of Microarrays (PAM).
- the determining step also includes an analysis of the patient's metabolic disease profile.
- the gene signature includes the TULP4, AA741300, ESCO1, EIF5B, ACTR2, WNK1, COCH, SON, TPR and NOG genes and one or more genes selected from the genes listed in TABLES 1 or 6.
- the time period between the first time point and the second time point is from 0 to 2 years or from 1 ⁇ 4 to 2 years or from 1 ⁇ 2 to 2 years or from 2 to 5 years, or from 5 to 10 years or more.
- a change in diabetic disease state can be indicative of a progression toward a pre-diabetic disease state or a Type II Diabetes disease state.
- the patient at the first time point gas a normal BMI.
- the first and second test sample can be blood samples.
- the first and second test sample can a test sample containing PBMCs or CD11c + or CD11b + or Emr + or [CD11b + CD11c + ] or [Emr + CD11b + ] or [Emr + CD11c + ] or [Emr + CD11b + CD11c + ] cells or CD14 + monocytes.
- the measuring can involve real-time PCR, an immunochemical assay or a specific oligonucleotide hybridization.
- kits for assessing a patient's susceptibility to Diabetes in which the assessment is made with a test apparatus.
- the kit includes (a) reagents for collecting a test sample from a patient; and (b) reagents for measuring the expression profile of a gene signature comprising the TCF7L2 and CLC genes or variants thereof in a patient's test sample.
- Reagents in step (a) and (b) are sufficient for a plurality of tests.
- Reagents for collecting a test sample from a patient can be packaged in sterile containers.
- the gene signature can include one or more of the genes selected from the group of TCF7L2 and CLC genes and one or more genes selected from the list of genes of TABLES 1 or 6.
- the test sample can be a blood sample.
- the kit can also include reagents for the isolation of PBMCs or reagents for the isolation of CD11c + or CD11b + or Emr + or [CD11b + CD11c + ] or [Emr + CD11b + ] or [Emr + CD11c + ] or [Emr + CD11b + CD11c + ] cells or reagents for the isolation of CD14 + monocytes.
- the reagents for measuring the expression profile of a gene signature can be real-time PCR reagents, immunochemical assay reagents or for specific oligonucleotides hybridization.
- kits for assessing a patient's susceptibility to Diabetes in which the assessment is made with a test apparatus.
- the kit includes (a) reagents for collecting a test sample from a patient; and (b) reagents for measuring the expression profile of a gene signature comprising the TOP 1, CD24 and STAP1 genes or variants thereof in a patient's test sample.
- the gene signature can include any two genes selected from the group of the TOP1, CD24 and STAP1 genes. In another aspect, the gene signature includes one or more of the genes selected from the group of TOP1, CD24 and STAP1 genes. In another aspect, the gene signature includes one or more genes selected from the group of TOP1, CD24 and STAP1 genes and one or more genes selected from the list of genes of TABLES 1 or 6.
- Reagents in step (a) and (b) are sufficient for a plurality of tests.
- Reagents for collecting a test sample from a patient can be packaged in sterile containers.
- the test sample can be a blood sample.
- the kit can also include reagents for the isolation of PBMCs or reagents for the isolation of CD11c + or CD11b + or Emr + or [CD11b + CD11c + ] or [Emr + CD11b + ] or [Emr + CD11c + ] or [Emr + CD11b + CD11c + ] cells or reagents for the isolation of CD14 + monocytes.
- the reagents for measuring the expression profile of a gene signature can be real-time PCR reagents, immunochemical assay reagents or for specific oligonucleotides hybridization.
- kits for assessing a patient's susceptibility to Diabetes in which the assessment is made with a test apparatus.
- the kit includes (a) reagents for collecting a test sample from a patient; and (b) reagents for measuring the expression profile of a gene signature of TULP4, AA741300, ESCO1, EIF5B, ACTR2, WNK1, COCH, SON, TPR and NOG genes in a patient's test sample.
- Reagents in step (a) and (b) are sufficient for a plurality of tests.
- Reagents for collecting a test sample from a patient can be packaged in sterile containers.
- the gene signature can also include TULP4, AA741300, ESCO1, EIF5B, ACTR2, WNK1, COCH, SON, TPR and NOG genes and one or more genes selected from the list of genes of TABLES 1 or 6.
- the test sample can be a blood sample.
- the kit can also include reagents for the isolation of PBMCs or reagents for the isolation of CD11c + or CD11b + or Emr + or [CD11b + CD11c + ] or [Emr + CD11b + ] or [Emr + CD11c + ] or [Emr + CD11b + CD11c + ] cells or reagents for the isolation of CD14 + monocytes.
- the reagents for measuring the expression profile of a gene signature can be real-time PCR reagents as defined in the claims, or immunochemical assay reagents.
- kits with reagents and instructions for the cost-effective and rapid testing of blood samples by medical personnel at a point-of-care facility are also described.
- Diabetes Mellitus refers to any disease characterized by a high concentration of blood glucose (hyperglycemia). Diabetes mellitus is diagnosed by demonstrating any one of the following: a fasting plasma glucose level at or above 126 mg/dL (7.0 mmol/l) or a plasma glucose at or above 200 mg/dL (11.1 mmol/l) two hours after a 75 g oral glucose load as in a glucose tolerance test or symptoms of hyperglycemia and casual plasma glucose at or above 200 mg/dL (11.1 mmol/l).
- diabetes refers to "type 1 diabetes” also known as childhood-onset diabetes, juvenile diabetes, and insulin-dependent diabetes (IDDM) or "type 2 diabetes” also known as adult-onset diabetes, obesity-related diabetes, and non-insulin-dependent diabetes (NIDDM) or others forms of diabetes include gestational diabetes, insulin-resistant type 1 diabetes (or “double diabetes"), latent autoimmune diabetes of adults (or LADA) and maturity onset diabetes of the young (MODY) which is a group of several single gene (monogenic) disorders with strong family histories that present as type 2 diabetes before 30 years of age.
- IDDM insulin-dependent diabetes
- NIDDM non-insulin-dependent diabetes
- MIDY maturity onset diabetes of the young
- a "diabetic disease state” refers to a pre-diabetic disease state, intermediate diabetic disease states characterized by stages of the disease more advanced then the pre-diabetic disease state and to disease states characteristic of overt diabetes as defined herein, including type I or II diabetes.
- a "pre-diabetic disease state” is one where a patient has an impaired fasting glucose level and impaired glucose tolerance.
- An impaired fasting glucose is defined as a blood glucose level from 100 to 125 mg/dL (6.1 and 7.0 mmol/l) i.e. an impaired fasting glucose.
- Patients with plasma glucose at or above 140 mg/dL or 7.8 mmol/l, but not over 200, two hours after a 75 g oral glucose load are considered to have impaired glucose tolerance.
- a “medical professional” is a physician or trained medical technician or nurse at a point-of-care facility.
- a "point-of-care" facility can be at an inpatient location such as in a hospital or an outpatient location such as a doctor's office or a walk-in clinic.
- the diagnostic assay may be distributed as a commercial kit to consumers together with instruments for the analysis of gene signature expression profile in a blood sample.
- the commercial kit may be combined with instruments and reagents for the monitoring of blood glucose levels.
- blood glucose level refers to the concentration of glucose in blood.
- the normal blood glucose level euglycemia is approximately 120 mg/dl. This value fluctuates by as much as 30 mg/dl in non-diabetics.
- hyperglycemia high blood sugar
- hyperglycemia occurs when the blood glucose level rises above 180 mg/dl.
- a test sample is any biological sample from a patient that contains cells that differentially express genes in response to a diabetic disease state.
- the biological sample can be any biological material isolated from an atopic or non-atopic mammal, such as a human, including a cellular component of blood, bone marrow, plasma, serum, lymph, cerebrospinal fluid or other secretions such as tears, saliva, or milk; tissue or organ biopsy samples; or cultured cells.
- the biological sample is a cellular sample that can be collected from a patient with minimal intervention.
- a test sample is a blood sample or a preparation of PBMCs (peripheral blood mononuclear cells) or CD14+ monocytes or CD11b+ or CD11c+ or Emr + cells.
- the mammal may be a human, or may be a domestic, companion or zoo animal. While it is particularly contemplated the herein described diagnostic tools are suitable for use in medical treatment of humans, they are also applicable to veterinary treatment, including treatment of companion animals such as dogs and cats, and domestic animals such as horses, cattle and sheep, or zoo animals such as non-human primates, felids, canids, bovids, and ungulates.
- RNA expression refers to the process of converting genetic information encoded in a gene into RNA (e.g., mRNA, rRNA, tRNA, or snRNA) through "transcription" of the gene (e.g., via the enzymatic action of an RNA polymerase), and for protein encoding genes, into protein through “translation” of mRNA.
- RNA e.g., mRNA, rRNA, tRNA, or snRNA
- Gene expression profile refers to identified expression levels of at least one polynucleotide or protein expressed in a biological sample.
- primer refers to an oligonucleotide either naturally occurring (e.g. as a restriction fragment) or produced synthetically, which is capable of acting as a point of initiation of synthesis of a primer extension product which is complementary to a nucleic acid strand (template or target sequence) when placed under suitable conditions (e.g. buffer, salt, temperature and pH) in the presence of nucleotides and an agent for nucleic acid polymerization, such as DNA dependent or RNA dependent polymerase.
- a primer must be sufficiently long to prime the synthesis of extension products in the presence of an agent for polymerization.
- a typical primer contains at least about 10 nucleotides in length of a sequence substantially complementary or homologous to the target sequence, but somewhat longer primers are preferred. Usually primers contain about 15-26 nucleotides.
- a “gene signature” refers to a pattern of gene expression of a selected set of genes that provides a unique identifier of a biological sample.
- a gene signature is diagnostic of a diabetic disease state if the pattern of gene expression of the selected set of genes is a substantial match to a gene signature in a reference sample taken from a patient with a diabetic disease state.
- a “gene signature” may be a pre-determined combination of nucleic acid or polypeptide sequences (if the genes are protein-coding genes). Gene signatures may comprise genes of unknown function or genes with no open reading frames including, but not limited to, rRNA, UsnRNA, microRNA or tRNAs.
- a "diagnostic gene expression profile” refers to the gene expression profile of a gene signature in a biological sample taken from a patient diagnosed with a particular disease state.
- the disease state can be a diabetic disease state or a non-diabetic disease state.
- a "substantial match" between a test gene expression profile from the patient and a diagnostic gene expression profile characteristic of a diabetic disease state indicates the patient has a diabetic disease state.
- a "substantial match” between a test gene expression profile from the patient and a diagnostic gene expression profile characteristic of a non-diabetic disease state indicates the patient does not have a diabetic disease state.
- a "variant" of a gene means gene sequences that are at least about 75% identical thereto, more preferably at least about 85% identical, and most preferably at least 90% identical and still more preferably at least about 95-99% identified when these DNA sequences are compared to a nucleic acid sequence of the prevalent wild type gene.
- a variant of a gene is a gene with one or more alterations in the DNA sequence of the gene including, but not limited to, point mutations or single nucleotide polymorphisms, deletions, insertions, rearrangements, splice donor or acceptor site mutations and gene alterations characteristic of a pseudogenes.
- a gene implicitly includes both wild type and variants forms of the gene as defined herein.
- a "substantial match” refers to the comparison of the gene expression profile of a gene signature in a test sample with the gene expression profile of the gene signature in a reference sample taken from a patient with a defined disease state.
- the expression profiles are "substantially matched” if the expression of the gene signature in the test sample and the reference sample are at substantially the same levels. i.e., there is no statistically significant difference between the samples after normalization of the samples.
- the confidence interval of substantially matched expression profiles is at least about 50% or from about 50% to about 75% or from about 75% to about 80% or from about 80% to about 85% or from about 85% to about 90% or from about 90% to about 95%.
- the confidence interval of substantially matched expression profiles is about 95% to about 100%. In another preferred embodiment, the confidence interval of substantially matched expression profiles is any number between about 95% to about 100%. In another preferred embodiment, the confidence interval of substantially matched expression profiles is about 95% or about 96% or about 97% or about 98% or about 99%, or about 99.9%.
- a “substantial difference” refers to the difference in the gene expression profile of a gene at one time point with the gene expression profile of the same gene signature at a second time point.
- the expression profiles are “substantially different” if the expression of the gene signature at the first and second time points are at different levels i.e. there is a statistically significant difference between the samples after normalization of the samples.
- expression profiles are "substantially different” if the expression of the gene signature at the first and second time points are outside the calculated confidence interval.
- the confidence interval of substantially different expression profiles is less than about 50% or less than about 75% or less than about 80% or less than from about 85% or less than about 90% or less than about 95%.
- a 95% confidence interval CI is equal to AUC + 1.96 x standard error of AUC, where AUC is the area under the ROC Curve.
- ROC refers to a receiver operating characteristic, or simply ROC curve, which is a graphical plot of the sensitivity vs. (1 - specificity) for a binary classifier system as its discrimination threshold is varied.
- diagnosis refers to the method of distinguishing one diabetic disease state from another diabetic disease state, or determining whether a diabetic disease state is present in an patient (atopic) relative to the "normal” or “non-diabetic” (non-atopic) state, and/or determining the nature of a diabetic disease state.
- determining a diabetic disease state refers to an integration of all information that is useful in diagnosing a patient with a diabetic disease state or condition and/or in classifying the disease.
- This information includes, but is not limited to family history, human genetics data, BMI, physical activity, metabolic disease profile and the results of a statistical analysis of the expression profiles of one or more gene signatures in a test sample taken from a patient. In the point-of-care setting, this information is analyzed and displayed by a computer system having appropriate data analysis software. Integration of the clinical data provides the attending physician with the information needed to determine if the patient has a diabetic condition, information related to the nature or classification of diabetes as well as information related to the prognosis and/or information useful in selecting an appropriate treatment.
- the diagnostic assays, described herein provide the medical professional with a determination of the efficacy of the prescribed medical treatment.
- a "metabolic disease profile” refers to any number of standard metabolic measures and other risk factors that can be diagnostic of a diabetic disease state including, but not limited to fasting plasma glucose, insulin, pro-insulin, c-peptide, intact insulin, BMI, waist circumference, GLP-1, adiponectin, PAI-1, hemoglobin A1c, HDL, LDL, VLDL, triglycerides, free fatty acids.
- the metabolic disease profile can be used to generate a superior model for classification equivalence to 2-hr OGTT.
- a glucose tolerance test is the administration of glucose to determine how quickly it is cleared from the blood.
- the test is usually used to test for diabetes, insulin resistance, and sometimes reactive hypoglycemia.
- the glucose is most often given orally so the common test is technically an oral glucose tolerance test (OGTT).
- OGTT oral glucose tolerance test
- the fasting plasma glucose test is a carbohydrate metabolism test which measures plasma, or blood, glucose levels after a fast. Fasting stimulates the release of the hormone glucagon, which in turn raises plasma glucose levels. In people without diabetes, the body will produce and process insulin to counteract the rise in glucose levels. In people with diabetes this does not happen, and the tested glucose levels will remain high.
- the body mass index (BMI), or Quetelet index, is a statistical measurement which compares a person's weight and height. Due to its ease of measurement and calculation, it is the most widely used diagnostic tool to identify obesity.
- NGT Normal Glucose Tolerance
- IGT Impaired Glucose Tolerance
- T2D type 2 diabetes.
- CD11c + , CD11b + and Emr + are cell surface markers of human monocyte/macrophage and myeloid cells and their precursors.
- the most commonly used monocyte/macrophage and myeloid cell surface markers are F4/80 and CD11b, although F4/80 and CD11b antibodies have been reported to react with eosinophils and dendritic cells and NK and other T and B cell subtypes, respectively ( Nguyen, et al. (2007) J Biol Chem 282, 35279-35292 ; Patsouris, et al. (2008) Cell Metab. 8, 301-309 ).
- the F4/80 gene in mouse is the ortholog to the human Emr1 gene.
- the human ortholog for the mouse CD11c gene is ITGAX also called integrin, alpha X (complement component 3 receptor 4 subunit), SLEB6, OTTHUMP00000163299; leu M5, alpha subunit; leukocyte surface antigen p150,95, alpha subunit; myeloid membrane antigen, alpha subunit; p150 95 integrin alpha chain (Chromosome: 16; Location: 16p11.2 Annotation: Chromosome 16, NC_000016.8 (31274010..31301819) MIM: 151510, GeneID:3687).
- the human ortholog for the mouse CD11b gene is ITGAM or integrin, alpha M (complement component 3 receptor 3 subunit) also called CD11B, CR3A, MAC-1, MAC1A, MGC117044, MO1A, SLEB6, macrophage antigen alpha polypeptide; neutrophil adherence receptor alpha-M subunit (Chromosome: 16; Location: 16p11.2 Chromosome 16, NC_000016.8 (31178789..31251714), MIM: 120980, GeneID: 3684).
- CD11c + , CD11b + and Emr + and CD14 + cells can be purified from PBMCs by positive selection using the appropriate human blood cell isolation kit (StemCell Technologies). Purity of isolated cells populations (>85%) is then confirmed by flow cytometry staining of fluorescent-conjugated antibodies to the appropriate cell surface mnrker (BioLegend).
- real-time PCR refers to real-time polymerase chain reaction, also called quantitative real time polymerase chain reaction (Q-PCR/qPCR) or kinetic polymerase chain reaction.
- Real-time PCR is a laboratory technique based on the polymerase chain reaction, which is used to amplify and simultaneously quantify a targeted DNA molecule. It enables both detection and quantification (as absolute number of copies or relative amount when normalized to DNA input or additional normalizing genes) of a specific sequence in a DNA sample.
- an immunochemical assay is a biochemical test that measures the concentration of a substance in a cellular extract using the reaction of an antibody or antibodies to its antigen.
- the antigen is a protein expressed by anyone of the protein coding genes comprising a gene signature.
- the immunochemical assay is an Enzyme-Linked ImmunoSorbent Assay (ELISA).
- hybridization refers to hybridization between probe sequences on a solid support such as a chip and cDNA sequences generated from transcripts within the patient's test sample. If the two nucleic acid sequences are substantially complementary, hybridization occurs which is directly proportional to the amount of cDNA sequences in the test sample. Detection of hybridization is then achieved using techniques well known in the art. Numerous factors influence the efficiency and selectivity of hybridization of two nucleic acids, for example, a nucleic acid member on a array, to a target nucleic acid sequence.
- nucleic acid member length is a positive correlation exists between the nucleic acid member length and both the efficiency and accuracy with which a nucleic acid member will anneal to a target sequence.
- longer sequences have a higher melting temperature (TM) than do shorter ones, and are less likely to be repeated within a given target sequence, thereby minimizing promiscuous hybridization.
- TM melting temperature
- Hybridization temperature varies inversely with nucleic acid member annealing efficiency, as does the concentration of organic solvents, e.g., formamide, that might be included in a hybridization mixture, while increases in salt concentration facilitate binding. Under stringent annealing conditions, longer nucleic acids, hybridize more efficiently than do shorter ones, which are sufficient under more permissive conditions.
- antibody includes both polyclonal and monoclonal antibodies; and may be an intact molecule, a fragment thereof (such as Fv, Fd, Fab, Fab' and F(ab)'2 fragments, or multimers or aggregates of intact molecules and/or fragments; and may occur in nature or be produced, e.g., by immunization, synthesis or genetic engineering.
- the application discloses a number of genes, including some which had not previously been considered to be associated with a diabetic disease state, are differentially expressed in peripheral blood mononuclear cells (PMBC) from patients which have a diabetic or pre-diabetic disease state as compared to patients who do not have a diabetic disease state.
- PMBC peripheral blood mononuclear cells
- genes that are differentially expressed in PBMCs of NGTs and T2Ds are identified using microarray analysis. Transcripts from PBMCs of NGT and T2D patients (in this example, a cohort of 107 patients) were initially screened using the Affymetrix Human Genome HG-U133Plus2 chip, according to the manufacturer's instructions. Approximately 200 differentially expressed genes were selected which had a False Discovery Rate, FDR ⁇ 20%, fold change >1.7 between NGTs and T2Ds using the Significance Analysis of Microarray (SAM) program (see TABLE 1).
- SAM Significance Analysis of Microarray
- Table 12A also includes the Genbank Accession Numbers of each of the selected genes.
- Gene expression of diabetes susceptibility genes may be measured in a biological sample using a number of different techniques. For example, identification of mRNA from the diabetes-associated genes within a mixture of various mRNAs is conveniently accomplished by the use of reverse transcriptase-polymerase chain reaction (RT-PCR) and an oligonucleotide hybridization probe that is labeled with a detectable moiety.
- RT-PCR reverse transcriptase-polymerase chain reaction
- oligonucleotide hybridization probe that is labeled with a detectable moiety.
- RNA isolation from more challenging samples such as intact tissues or cells high in endogenous ribonuclease, requires a more aggressive approach.
- tissue or cells are quickly homogenized in a powerful protein denaturant (usually guanidinium isothiocyanate), to irreversibly inactivate nucleases and solubilize cell membranes.
- a tissue sample If a tissue sample can not be promptly homogenized, it must be rapidly frozen by immersion in liquid nitrogen, and stored at -80° C. Samples frozen in this manner must never be thawed prior to RNA isolation or the RNA will be rapidly degraded by RNase liberated during the cell lysis that occurs during freezing.
- the tissue must be immersed in a pool of liquid nitrogen and ground to a fine powder using mortar and pestle. Once powdered, the still-frozen tissue is homogenized in RNA extraction buffer.
- kits for RNA isolation are now commercially available (Ambion, Quiagen).
- cDNA is first generated by first reverse transcribing a first strand of cDNA from a template mRNA using a RNA dependent DNA polymerase and a primer.
- Reverse transcriptases useful according to the application include, but are not limited to, reverse transcriptases from HIV, HTLV-1, HTLV-II, FeLV, FIV, SIV, AMV, MMTV, MoMuLV and other retroviruses (for reviews, see for example, Levin, 1997, Cell 88:5-8 ; Verma, 1977, Biochim. Biophys. Acta 473:1-38 ; Wu et al., 1975, CRC Crit. Rev. Biochem. 3:289-347 ).
- thermostable reverse transcriptase e.g. GeneAmp® Thermostable rTth Reverse Transcriptase RNA PCR Kit (Applied Biosystems).
- Polymerase chain reaction generally refers to a method for amplification of a desired nucleotide sequence in vitro, as described in U.S. Patent Nos. 4,683,202 , 4,683,195 , 4,800,159 , and 4,965,188 .
- the PCR reaction involves a repetitive series of temperature cycles and is typically performed in a volume of 10-100 ⁇ l.
- the reaction mix comprises dNTPs (each of the four deoxynucleotides dATP, dCTP, dGTP, and dTTP), primers, buffers, DNA polymerase, and nucleic acid template.
- the PCR reaction comprises providing a set of polynucleotide primers wherein a first primer contains a sequence complementary to a region in one strand of the nucleic acid template sequence and primes the synthesis of a complementary DNA strand, and a second primer contains a sequence complementary to a region in a second strand of the target nucleic acid sequence and primes the synthesis of a complementary DNA strand, and amplifying the nucleic acid template sequence employing a nucleic acid polymerase as a template-dependent polymerizing agent under conditions which are permissive for PCR cycling steps of (i) annealing of primers required for amplification to a target nucleic acid sequence contained within the template sequence, (ii) extending the primers wherein the nucleic acid polymerase synthesizes a primer extension product.
- LCR ligase chain reaction
- NBA polynucleotide-specific based amplification
- Primers can readily be designed and synthesized by one of skill in the art for the nucleic acid region of interest. It will be appreciated that suitable primers to be used with the application can be designed using any suitable method. Primer selection for PCR is described, e.g., in U.S. Pat. No. 6,898,531, issued May 24, 2005 , entitled “Algorithms for Selection of Primer Pairs" and U.S. Ser. No. 10/236,480, filed Sep. 5, 2002 ; for short-range PCR, U.S. Ser. No. 10/341,832, filed Jan. 14, 2003 provides guidance with respect to primer selection.
- Primer design is based on a number of parameters, such as optimum melting temperature (Tm) for the hybridization conditions to be used and the desired length of the oligonucleotide probe.
- Tm optimum melting temperature
- oligonucleotide design attempts to minimize the potential secondary structures a molecule might contain, such as hairpin structures and dimmers between probes, with the goal being to maximize availability of the resulting probe for hybridization.
- the primers used in the PCR method will be complementary to nucleotide sequences within the cDNA template and preferably over exon-intron boundaries.
- the PCR reaction can use nested PCR primers.
- a detectable label may be included in an amplification reaction.
- Suitable labels include fluorochromes, e.g. fluorescein isothiocyanate (FITC), rhodamine, Texas Red, phycoerythrin, allophycocyanin, 6-carboxyfluorexcein (6-FAM), 2',7'-dimethoxy-4',5'-dichloro-6-carboxyfluorescein (JOE), 6-carboxy-X-rhodamine(ROX), 6-carboxy-2',4',7',4,7-hexachlorofluorescein (HEX), 5-carboxyfluorescein (5-FAM) or N,N,N',N'-tetramethyl-6-carboxyrhodamine (TAMRA), radioactive labels, e.g.
- the label may be a two stage system, where the amplified DNA is conjugated to biotin, haptens, or the like having a high affinity binding partner, e.g. avidin, specific antibodies, etc., where the binding partner is conjugated to a detectable label.
- the label may be conjugated to one or both of the primers.
- the pool of nucleotides used in the amplification is labeled, so as to incorporate the label into the amplification product.
- the application utilizes a combined PCR and hybridization probing system so as to take advantage of assay systems such as the use of FRET probes as disclosed in US patents U.S. Pat. Nos. 6,140,054 and 6,174,670 .
- the FRET or "fluorescent resonance energy transfer" approach employs two oligonucleotides which bind to adjacent sites on the same strand of the nucleic acid being amplified.
- One oligonucleotide is labeled with a donor fluorophore which absorbs light at a first wavelength and emits light in response, and the second is labeled with an acceptor fluorophore which is capable of fluorescence in response to the emitted light of the first donor (but not substantially by the light source exciting the first donor, and whose emission can be distinguished from that of the first fluorophore).
- the second or acceptor fluorophore shows a substantial increase in fluorescence when it is in close proximity to the first or donor fluorophore, such as occurs when the two oligonucleotides come in close proximity when they hybridise to adjacent sites on the nucleic acid being amplified, for example in the annealing phase of PCR, forming a fluorogenic complex.
- the method allows detection of the amount of product as it is being formed.
- TaqMan Real-time PCR measures accumulation of a product via the fluorophore during the exponential stages of the PCR, rather than at the end point as in conventional PCR.
- the exponential increase of the product is used to determine the threshold cycle, CT, i.e. the number of PCR cycles at which a significant exponential increase in fluorescence is detected, and which is directly correlated with the number of copies of DNA template present in the reaction.
- matrices or microchips are manufactured to contain an array of loci each containing a oligonucleotide of known sequence.
- each locus contains a molar excess of selected immobilized synthetic oligomers synthesized so as to contain complementary sequences for desired portions of a diabetes susceptibility gene.
- Transcripts of diabetes susceptibility genes present in PBMC are amplified by RT-PCR and labeled, as described herein.
- the oligomers on the microchips are then hybridized with the labeled RT-PCR amplified diabetes susceptibility gene nucleic acids. Hybridization occurs under stringent conditions to ensure that only perfect or near perfect matches between the sequence embedded in the microchip and the target sequence will occur during hybridization.
- the resulting fluorescence at each locus is proportional to the expression level of the one or more diabetes susceptibility gene in the PBMCs.
- gene signature expression profiles of protein-coding genes are determined using techniques well known in the art of immunochemistry including, for example, antibody-based binding assays such as ELISA or radioimmunoassays or protein arrays containing antibodies directed to the protein products of genes within a pre-determined signature as defined herein.
- the expression profiles of the TCF7L2 and CLC genes were analyzed in peripheral blood mononuclear cells from normal glucose tolerant and type 2 diabetic patients.
- the human Charcot-Leyden crystal protein gene is expressed primarily in eosinophils.
- CLC is down regulated sequentially in PBMC ofNGTs to IGTs to T2Ds.
- the mean signal intensities of its expression in microarray of the 107-patient cohort are listed In TABLE 2 below.
- Receiver operating characteristic (ROC) analysis demonstrated that the CLC gene expression level can be used to separate NGTs from IGTs/T2Ds.
- ROC Receiver operating characteristic
- ROC receiver operating characteristic
- the area under curve (AUC) was calculated as a measure of the performance of CLC gene in predicting patient status.
- Receiver operating characteristic (ROC) analysis of the CLC gene date demonstrated that the CLC gene expression level can be used to separate NGTs from IGTs/T2Ds (see FIG. 1 ).
- TCF7L2 transcription factor-7-like 2
- SNPs within TCF7L2 give the highest lifetime risk score for predicting type 2 diabetes progression compared to SNPs in other marker genes, including CDKAL1, CDKN2A/2B, FTO, IGF2BP2, and SLC30A8 (range of risk scores 1.12 - 1.20).
- TCF7L2 is widely expressed and this transcription factor is known to respond to developmental signals from members of the Wnt family of proteins. Functional and genetic studies point to a critical role for TCF7L2 in the development of the intestine and proglucagon gene expression in enteroendocrine cells.
- TCF7L2 and the CLC gene are diagnostic markers of diabetes, either individually or in combination, 180 subjects were recruited from the German population in association with the Institute for Clinical Research & Development (IKFE), in Mainz, Germany. Appropriate IRB approvals were obtained prior to patient sample collection. The inclusion criteria consisted of patients between 18-75 years and a body-mass index (BMI) ⁇ 30 who had no previous diagnosis of diabetes, and the legal capacity and ability to understand the nature and extent of the clinical study and the required procedures.
- BMI body-mass index
- the exclusion criteria consisted of blood donation within the last 30 days, insulin dependent diabetes mellitus, lactating or pregnant women, or women who intend to become pregnant during the course of the study, sexually active women not practicing birth control, history of severe/ multiple allergies, drug or alcohol abuse, and lack of compliance to study requirements. All clinical measurements including the 75g-oral glucose tolerance test results (OGTT) were obtained using standard procedures.
- RNA quantification and quality was performed using the ND-1000 Spectrophotometer (NanoDrop) and reconfirmed by spectrophotometric quantitation with RiboGreen kit (Molecular Probes). The quality of RNA templates was measured by using the Bioanalyzer 2100 (Agilent Technologies).
- First-strand cDNA synthesis was performed using 200 ng of total RNA from each patient PBMC sample using the High Capacity cDNA Reverse Transcription kit (Applied Biosystems). Afterwards, the reaction mixture was diluted 10-fold with ddH 2 O, and 4 ⁇ l was used as template in a 10 ⁇ l Taqman PCR reaction on the ABI Prism 7900HT sequence detection system.
- the reaction components consisted of 2X Taqman PCR master mix (Applied Biosystems), 0.9 ⁇ M of each primer, and 0.25 ⁇ M of fluorescent-labeled probe (Biosearch Technologies). Sequences for primer/probe sets used in RT-PCR Taqman assay are presented in Table 3 .
- Quantitative real-time RT-PCR by Taqman assay using two different primer/ probe combinations specific for TCF7L2 and one prime/probe set for CLC was performed on RNA isolated from PBMCs from individual patients.
- Thermocycling profile for PCR step was as follows, 95°C for 10 min, followed by 40 cycles of 95°C (15 sec) and 60°C (1 min).
- the delta Ct (cycle threshold) value was calculated by subtracting the Ct of the housekeeping ⁇ -actin gene from the Ct of marker of interest, for instance, TCF7L2 (Ct TCF7L2 - Ct actin).
- the value of [2 -(delta Ct) x 1000] was used to represent the expression of TCF7L2 relative to ⁇ -actin.
- the OGTT result was used as the true clinical status.
- Student's T-test was used for determining statistical significance between expression levels of gene markers using normalized Ct values.
- the NGT and IGT plus T2D patient groups had a statistically significant difference between expression levels by Student's T-test, with p-values 0.004; 0.021 and 0.022 for TCF7L2 set 1, set 3 and CLC, respectively.
- Receiver Operating Characteristic (ROC) curves for each TCF7L2 and CLC primer/probe set normalized delta Ct value were generated (Table 5, FIGs. 2A and 2B ).
- the AUC values for the TCF7L2 set 1 and CLC PCR assays were 0.63 and 0.61, respectively.
- TCF7L2 set 1 expression from PBMCs can correctly classify a patient as being normal or pre-diabetic/diabetic with an AUC of 0.73 when used in conjunction with the FPG test ( FIGs. 2A and 2B ).
- CLC did not have an additive value to TCF7L2 set 1 and was not considered for the diagnostic algorithm. Additionally, exclusion of 14 patients that had FPG ⁇ 126mg/dL (also considered diabetic) did not change the performance of the assay.
- Table 5 ROC curve AUC values for each marker probe-primer set and in combination with FPG values ROC AUC value Marker set # Marker vs. OGTT Marker+FPG vs. OGTT TCF7L2 set 1 0.63 0.73 TCF7L2 set 2 0.59 ND TCF7L2 set 3 0.61 0.72 CLC set 1 0.60 0.69
- each of the genes selected in the microarray analysis may be combined with the performance of TCF7L2 set 1 to more closely match the 2-hr OGTT result.
- genes that are strongly associated with a risk of type 2 diabetes may also be combined with the performance of TCF7L2 set 1 to more closely match the 2-hr OGTT result.
- the genes of Table 6 in combination with one or more genes of TABLE 1 can be tested as described herein for gene signatures that are diagnostic of a diabetic disease state.
- TABLE 6 Gene Symbols NOTCH2 IGF2BP2 LGR5 CDKN2A-2B THADA WFS1 FTO HHEX-IDE PPARG KCNJ11 JAZF11 CDC123 ADAMTS9 TSPAN8 SLC30A8 CAMK1D
- CDKN1C a member of the CIP/KIP family was also differentially expressed in PBMCs from NGTs and T2Ds.
- the CIP/KIP family consists of three members, CDKN2A, CDKN2B and CDKN1C. All of the three members can inhibit the activity of CDK4, which plays a central role in regulating mammalian cell cycle. Islet ⁇ -cell replication plays an essential role in maintaining ⁇ -cell mass homeostasis. It has been known that CDK4 has an important role in the regulation of body weight and pancreatic ⁇ -cell proliferation. In mice, loss of the CDK4 gene resulted in insulin-deficient diabetes due to the reduction of ⁇ -cell mass whereas activation of CDK4 caused ⁇ -islet cell hyperplasia.
- CDKN1C is a maternally expressed gene located on chromosome 11p15.5 and is involved in the pathogenesis of Beckwith-Wiedemann syndrome (BWS), a disorder characterized by neonatal hyperinsulinemic hypoglycemia, as well as pre- and postnatal overgrowth.
- BWS Beckwith-Wiedemann syndrome
- CDKN1C is down-regulated by insulin and variants of CDKN1C may be associated to increased birth weights in type 2 diabetes patients.
- the CIP/KIP family plays an important role in other biological processes, such as apoptosis, transcription regulation, differentiation and cell migration.
- the expression of the three genes in the 107 patient cohort was analyzed. Only CDKN1C displayed differential expression among NGTs, IGTs and T2Ds (see TABLE 7). There are 5 probes expressing in PBMC for CDKN1C on the HG-U133Plus2 GeneChip. Each of them displayed differential expression between NGTs and IGTs/T2Ds (TABLE 7).
- IGT IGT, NGT vs. T2D, or NGT vs. IGT+T2D.
- B cell activation and humoral immune response have dominantly negative association with diabetes (lower expression in IGT/T2D) whereas DNA unwinding during replication has positive association with diabetes (higher expression in IGT/T2D).
- genes with a p ⁇ 0.05 were pooled and sorted based on their statistical significance (z score from Global Test). If a gene has more than one probe in the list and their behaviors were consistent, the one with the highest significance was retained. If a gene has more than one probe in the list and their behaviors were opposite, all probes for this gene were removed. As a result, 14 unique genes were obtained (SEE TABLE 8 below).
- the ROC analysis of the 3-gene signature in the 107-patient cohort ( FIG. 4A and 4B ) demonstrates this signature can separate NGTs from IGTs/T2Ds.
- a histogram depicting the mean expression of the genes is shown in FIG. 4C .
- the 107-patient cohort was then divided into a 54-patient training set and a 53-patient test set. Based on OGTT classification, there are 28 NGTs, 17 IGTs and 9 T2Ds in the training set whereas there are 29 NGTs, 16 IGTs and 8 T2Ds in the test set.
- SAM Significant Analysis of Microarray
- genes with the fold-change larger than 1.5 between the two groups, and the average intensity of the gene in the dataset is larger than 200 were retained.
- 17 probe sets were obtained.
- 4 were probes representing hemoglobin gene. Considering that hemoglobin has extremely high expression in red blood cells, the 4 probes were removed to eliminate possible contamination.
- performance of combination of the top genes were examined from 2 to 13 in the training set. The result indicated that the top 10 genes gave the best performance based on the area under curve (AUC) (see Table 10).
- the statistical analysis of the clinical data identified a 3 gene and 10 signature that are differentially expressed in NGTs and T2D.
- a diagnostic assay is described for the point-of-care classification of normal versus pre-diabetes/ diabetes or for the prediction of progression to pre-diabetes/ diabetes over a defined period time, e.g. from 1 ⁇ 2 to 2 years or from 2 to 5 years, or from 5 to 10 years or more.
- gene expression profiles are determined by detection of the protein encoded by the mRNA, for example using ELISA or proteomic array. All of these methods are well known in the art.
- kits which comprises a package unit having one or more reagents for the diagnosis of a diabetic disease state in a patient.
- the kit may also contain one or more of the following items: buffers, instructions, and positive or negative controls.
- Kits may include containers of reagents mixed together in suitable proportions for performing the methods described herein.
- Reagent containers preferably contain reagents in unit quantities that obviate measuring steps when performing the subject methods.
- the kit may include sterile needles and tubes/ containers for the collection of a patient's blood. Collection tubes will typically contain certain additives e.g. heparin to inhibit blood coagulation
- Kits may also contain reagents for the measurement of a gene signature expression profile in a patient's sample.
- gene signatures expression profiles may be measured by a variety of means known in the art including RT-PCR assays, oligonucleotide based assays using microchips or protein based assays such as ELISA assays.
- gene signature expression profiles are measured by real-time RT-PCR.
- the kit comprises primers of the amplification and detection of gene signature expression profiles in a patient's blood sample.
- Primers may have a sequence that is complementary to any one of the diabetes susceptibility genes as defined herein including TOP1, CD24, STAP1, TULP4, AA741300, ESCO1, EIF5B, ACTR2, WNK1, COCH, SON, TPR, NOG genes or any one of the genes listed in Tables 1 or 6.
- kit reagents are designed to function with the 7500 Fast Dx Real-Time PCR Instrument by Applied Biosystems, which is a PCR-based technology that was approved by the FDA's Office of In Vitro Diagnostics (FDA-OIVD).
- the kit includes a microchip comprising an array of hybridization probes for the 3 gene (TOP1, CD24 and STAP1) or 10 gene (TULP4, AA741300, ESCO1, EIF5B, ACTR2, WNK1, COCH, SON, TPR and NOG) signatures.
- the microchips may further comprise an array of one or more hybrization probes for one or more of the genes listed in Tables 1 or 6.
- the microchips are designed to function with Affymetrix GeneChipDx technology that can measure, in parallel, the gene expression of 1 to more than 55,000 mRNAs.
- FDA-OIVD this platform for use with the AmpliChip P450 product from Roche Molecular Diagnostics and the Pathwork Diagnostics Tissue of Origin test.
Landscapes
- Health & Medical Sciences (AREA)
- Life Sciences & Earth Sciences (AREA)
- Engineering & Computer Science (AREA)
- Physics & Mathematics (AREA)
- Chemical & Material Sciences (AREA)
- Molecular Biology (AREA)
- General Health & Medical Sciences (AREA)
- Biotechnology (AREA)
- Medical Informatics (AREA)
- Genetics & Genomics (AREA)
- Bioinformatics & Cheminformatics (AREA)
- Biophysics (AREA)
- Spectroscopy & Molecular Physics (AREA)
- Immunology (AREA)
- Proteomics, Peptides & Aminoacids (AREA)
- Theoretical Computer Science (AREA)
- Evolutionary Biology (AREA)
- Bioinformatics & Computational Biology (AREA)
- Analytical Chemistry (AREA)
- Biomedical Technology (AREA)
- Organic Chemistry (AREA)
- Pathology (AREA)
- Urology & Nephrology (AREA)
- Hematology (AREA)
- Biochemistry (AREA)
- Microbiology (AREA)
- Public Health (AREA)
- Zoology (AREA)
- Wood Science & Technology (AREA)
- Data Mining & Analysis (AREA)
- Databases & Information Systems (AREA)
- Epidemiology (AREA)
- Artificial Intelligence (AREA)
- Computer Vision & Pattern Recognition (AREA)
- Evolutionary Computation (AREA)
- Bioethics (AREA)
- Software Systems (AREA)
- Cell Biology (AREA)
- Medicinal Chemistry (AREA)
- Food Science & Technology (AREA)
Description
- The application relates to the field of medical diagnostics and describes methods and kits for the point-of-care diagnosis of a diabetic disease state in a patient.
- Diabetes is a group of diseases marked by high levels of blood glucose resulting from defects in insulin production, insulin action, or both. Left untreated, it can cause many serious short term complications including symptoms ofhypoglycemia, ketoacidosis, or nonketotic hyperosmolar coma. In the long term, diabetes is known to contribute to an increased risk of arteriosclerosis, chronic renal failure, retinal damage (including blindness), nerve damage and microvascular damage.
- The spreading epidemic of diabetes in the developing world is predicted to have a profound impact on the healthcare system in the United States. A recent study by the Center for Disease Control and Prevention indicates the incidence of new diabetes cases in the U.S. nearly doubled in the last 10 years. As of 2007, at least 57 million people in the United States have pre-diabetes. Coupled with the nearly 24 million who already have diabetes, this places more than 25% of the U.S. population at risk for further complications from this disease. According to the American Diabetes Association, the estimated cost of diabetes in the United States in 2007 amounted to $174 billion with direct medical costs approaching $116 billion.
- Although the etiology of diabetes appears to be multi-factorial in nature, increasing experimental evidence suggests the onset of obesity, especially abdominal obesity, disrupts immune and metabolic homeostasis and ultimately leads to a broad inflammatory response. The production of inflammatory cytokines in the adipose tissue, such as TNF alpha, then deregulates the immune response and a cell's ability to respond to insulin. Detection of an alteration in the transcriptional profiles of circulating immune cells, such as monocytes and macrophages, therefore provides a convenient avenue to diagnose the disease and monitor its progression before even the more overt signs of glucose intolerance become apparent.
- For the forgoing reasons, there is an unmet need for rapid and accurate diagnostic assays for the diagnosis and monitoring of patients at risk of developing diabetes. In particular, there is an unmet need for diagnostic assays in a kit format that can be readily used at a point-of-care facility for the routine screening of patients for early onset diabetes.
-
WO 2007/128884 relates to a method of diagnosis of Type 2 Diabetes.EP1538219 relates to methods which are alleged to be able to be used to diagnose or screen to Diabetes Mellitus type 1 (DM1) in a subject by assaying for a marker for DM1.WO 2008/074963 relates to an in vitro method for the early diagnosis of diabetes from a biological sample from a patient. - Methods are described for the determination of gene signature expression profiles that are diagnostic of pre-diabetic and diabetic disease states. The disclosure further pertains to diagnostic kits comprising reagents for the rapid measurement of gene signature expression profiles in a patient's blood sample. The kit format is cost-effective and convenient for use at a point-of-care facility.
- In one embodiment of the disclosure, a method is described for the diagnosis of Diabetes Mellitus in a patient, the method comprising the steps of (a) providing a test sample taken from a patient, (b) measuring the gene expression profile of a gene signature comprising a gene selected from the group of TOP1, CD24 and STAP1 genes, (c) comparing the gene expression profile with a diagnostic gene expression profile of the gene signature, (d) determining a diabetic disease state in the patient based at least in part upon a substantial match between the gene expression profile and the diagnostic gene expression profile and (e) displaying the determination to a medical professional.
- The determining step can be executed by a computer system running one or more algorithms selected from the group of Linear combination of gene expression signals, Linear regression model, Logistic regression model, Linear discrimination analysis (LDA) model, The nearest neighbor model and the Prediction Analysis of Microarrays (PAM). The determining step can also include analysis of the patient's metabolic disease profile.
- The gene signature can include any two genes selected from the group of TOP1, CD24 and STAP1 genes or all three genes. In one embodiment, the gene signature can include one or more genes selected from the group of TOP1, CD24 and STAP1 genes and one or more genes selected from the genes listed in TABLES 1 or 6.
- The patient can have a normal BMI. The diabetic disease state can be a pre-diabetic disease state or a Type 2 Diabetes disease state.
- The test sample can be a blood sample or a test sample containing PBMCs or CD11c+ or CD11b+ or Emr+ or [CD11b+ CD11c+] or [Emr+ CD11b+] or [Emr+ CD11c+] or [Emr+ CD11b+ CD11c+] cells or CD14+ monocytes.
- The measuring can involve real-time PCR, an immunochemical assay or a specific oligonucleotide hybridization.
- In one embodiment, a method is described for the diagnosis of Diabetes Mellitus in a patient, the method comprising the steps of (a) providing a test sample taken from a patient, (b) measuring the gene expression profile of a gene signature comprising the TULP4, AA741300, ESCO1, EIF5B, ACTR2, WNK1, COCH, SON, TPR and NOG genes, (c) comparing the gene expression profile with a diagnostic gene expression profile of the gene signature, (d) determining a diabetic disease state in the patient based at least in part upon a substantial match between the gene expression profile and the diagnostic gene expression profile and (e) displaying the determination to a medical professional.
- The determining step can be executed by a computer system running one or more algorithms selected from the group of Linear combination of gene expression signals, Linear regression model, Logistic regression model, Linear discrimination analysis (LDA) model, The nearest neighbor model and the Prediction Analysis of Microarrays (PAM). The determining step can also include analysis of the patient's metabolic disease profile.
- In one aspect, the gene signature includes the TOP1, CD24 and STAP1 genes in addition to the TULP4, AA741300, ESCO1, EIF5B, ACTR2, WNK1, COCH, SON, TPR and NOG genes. In another aspect, the gene signature includes the TULP4, AA741300, ESCO1, EIF5B, ACTR2, WNK1, COCH, SON, TPR and NOG genes and one or more genes selected from the genes listed in TABLES 1 or 6.
- The patient can have a normal BMI. The diabetic disease state can be a pre-diabetic disease state or a Type 2 Diabetes disease state.
- The test sample can be a blood sample or a test sample containing PBMCs or CD11c+ or CD11b+ or Emr+ or [CD11b+ CD11c+] or [Emr+ CD11b+] or [Emr+ CD11c+] or [Emr+ CD11b+ CD11c+] cells or CD14+ monocytes.
- The measuring can involve real-time PCR, an immunochemical assay or a specific oligonucleotide hybridization.
- In one embodiment of the disclosure, a method is described for the diagnosis of Diabetes Mellitus in a patient, the method comprising the steps of (a) providing a test sample taken from a patient, (b) measuring the gene expression profile of a gene signature comprising the TCF7L2 and CLC genes, (c) comparing the gene expression profile with a diagnostic gene expression profile of the gene signature, (d) determining a diabetic disease state in the patient based at least in part upon a substantial match between the gene expression profile and the diagnostic gene expression profile and (e) displaying the determination to a medical professional.
- The determining step can be executed by a computer system running one or more algorithms selected from the group of Linear combination of gene expression signals, Linear regression model, Logistic regression model, Linear discrimination analysis (LDA) model, The nearest neighbor model and the Prediction Analysis of Microarrays (PAM). The determining step can also include analysis of the patient's metabolic disease profile.
- The gene signature can include either the TCF7L2 or CLC gene. In one aspect, the gene signature includes one or more variants of the TC7L2 or CLC gene. In one aspect, the gene signature includes either the TCF7L2 or CLC gene and one or more genes selected from the genes listed in TABLES 1 or 6.
- The patient can have a normal BMI. The diabetic disease state can be a pre-diabetic disease state or a Type 2 Diabetes disease state.
- The test sample can be a blood sample or a test sample containing PBMCs or CD11c+ or CD11b+ or Emr+ or [CD11b+ CD11c+] or [Emr+ CD11b+] or [Emr+ CD11c+] or [Emr+ CD11b+ CD11c+] cells or CD14+ monocytes.
- The measuring can involve real-time PCR, an immunochemical assay or a specific oligonucleotide hybridization.
- In one embodiment of the disclosure, a method is described for diagnosing a change in the diabetic disease state of a patient comprising the steps of (a) providing a first test sample taken from a patient at a first time point, (b) measuring a first expression profile of a gene signature comprising a gene selected from the group of the
TOP 1, CD24 and STAP1 genes in the first test sample, (c) providing a second test sample taken from the patient at a second time point, (d) measuring a second expression profile of the gene signature in the second test sample, (e) comparing the first expression profile with the second expression profile, (f) determining a change in the diabetic disease state in the patient based at least in part upon a substantial difference between the first gene expression profile and the second gene expression profile, and (g) displaying the determination to a medical professional. - In one aspect, the determining step is executed by a computer system running one or more algorithms selected from the group of Linear combination of gene expression signals, Linear regression model, Logistic regression model, Linear discrimination analysis (LDA) model, The nearest neighbor model and the Prediction Analysis of Microarrays (PAM). In another aspect, the determining step also includes an analysis of the patient's metabolic disease profile.
- The gene signature can include any two genes selected from the group of the TOP1, CD24 and STAP1 genes. In one aspect, the gene signature includes the TOP1, CD24 and STAP1 genes. In another aspect, the gene signature includes a gene selected from the group of the TOP1, CD24 and STAP1 genes and one or more genes selected from the genes listed in TABLES 1 or 6.
- In one aspect, the time period between the first time point and the second time point is from 0 to 2 years or from ¼ to 2 years or from ½ to 2 years or from 2 to 5 years, or from 5 to 10 years or more.
- A change in diabetic disease state can be indicative of a progression toward a pre-diabetic disease state or a Type II Diabetes disease state. In one aspect, the patient at the first time point gas a normal BMI.
- The first and second test sample can be blood samples. In one aspect, the first and second test sample can a test sample containing PBMCs or CD11c+ or CD11b+ or Emr+ or [CD11b+ CD11c+] or [Emr+ CD11b+] or [Emr+ CD11c+] or [Emr+ CD11b+ CD11c+] cells or CD14+ monocytes.
- The measuring can involve real-time PCR, an immunochemical assay or a specific oligonucleotide hybridization.
- In one embodiment, a method is described for diagnosing a change in the diabetic disease state of a patient comprising the steps of (a) providing a first test sample taken from a patient at a first time point, (b) measuring a first expression profile of a gene signature comprising the TULP4, AA741300, ESCO1, EIF5B, ACTR2, WNK1, COCH, SON, TPR and NOG genes in the first test sample, (c) providing a second test sample taken from the patient at a second time point, (d) measuring a second expression profile of the gene signature in the second test sample, (e) comparing the first expression profile with the second expression profile, (f) determining a change in the diabetic disease state in the patient based at least in part upon a substantial difference between the first gene expression profile and the second gene expression profile, and (g) displaying the determination to a medical professional.
- In one aspect, the determining step is executed by a computer system running one or more algorithms selected from the group of Linear combination of gene expression signals, Linear regression model, Logistic regression model, Linear discrimination analysis (LDA) model, The nearest neighbor model and the Prediction Analysis of Microarrays (PAM). In another aspect, the determining step also includes an analysis of the patient's metabolic disease profile.
- In another aspect, the gene signature includes the TULP4, AA741300, ESCO1, EIF5B, ACTR2, WNK1, COCH, SON, TPR and NOG genes and one or more genes selected from the genes listed in TABLES 1 or 6.
- In one aspect, the time period between the first time point and the second time point is from 0 to 2 years or from ¼ to 2 years or from ½ to 2 years or from 2 to 5 years, or from 5 to 10 years or more.
- A change in diabetic disease state can be indicative of a progression toward a pre-diabetic disease state or a Type II Diabetes disease state. In one aspect, the patient at the first time point gas a normal BMI.
- The first and second test sample can be blood samples. In one aspect, the first and second test sample can a test sample containing PBMCs or CD11c+ or CD11b+ or Emr+ or [CD11b+ CD11c+] or [Emr+ CD11b+] or [Emr+ CD11c+] or [Emr+ CD11b+ CD11c+] cells or CD14+ monocytes.
- The measuring can involve real-time PCR, an immunochemical assay or a specific oligonucleotide hybridization.
- In another embodiment of the disclosure, a kit is described for assessing a patient's susceptibility to Diabetes in which the assessment is made with a test apparatus. The kit includes (a) reagents for collecting a test sample from a patient; and (b) reagents for measuring the expression profile of a gene signature comprising the TCF7L2 and CLC genes or variants thereof in a patient's test sample.
- Reagents in step (a) and (b) are sufficient for a plurality of tests. Reagents for collecting a test sample from a patient can be packaged in sterile containers.
- The gene signature can include one or more of the genes selected from the group of TCF7L2 and CLC genes and one or more genes selected from the list of genes of TABLES 1 or 6.
- The test sample can be a blood sample.
- The kit can also include reagents for the isolation of PBMCs or reagents for the isolation of CD11c+ or CD11b+ or Emr+ or [CD11b+ CD11c+] or [Emr+ CD11b+] or [Emr+ CD11c+] or [Emr+ CD11b+ CD11c+] cells or reagents for the isolation of CD14+ monocytes. The reagents for measuring the expression profile of a gene signature can be real-time PCR reagents, immunochemical assay reagents or for specific oligonucleotides hybridization.
- In another embodiment of the disclosure, a kit is described for assessing a patient's susceptibility to Diabetes in which the assessment is made with a test apparatus. The kit includes (a) reagents for collecting a test sample from a patient; and (b) reagents for measuring the expression profile of a gene signature comprising the
TOP 1, CD24 and STAP1 genes or variants thereof in a patient's test sample. - The gene signature can include any two genes selected from the group of the TOP1, CD24 and STAP1 genes. In another aspect, the gene signature includes one or more of the genes selected from the group of TOP1, CD24 and STAP1 genes. In another aspect, the gene signature includes one or more genes selected from the group of TOP1, CD24 and STAP1 genes and one or more genes selected from the list of genes of TABLES 1 or 6.
- Reagents in step (a) and (b) are sufficient for a plurality of tests. Reagents for collecting a test sample from a patient can be packaged in sterile containers.
- The test sample can be a blood sample.
- The kit can also include reagents for the isolation of PBMCs or reagents for the isolation of CD11c+ or CD11b+ or Emr+ or [CD11b+ CD11c+] or [Emr+ CD11b+] or [Emr+ CD11c+] or [Emr+ CD11b+ CD11c+] cells or reagents for the isolation of CD14+ monocytes. The reagents for measuring the expression profile of a gene signature can be real-time PCR reagents, immunochemical assay reagents or for specific oligonucleotides hybridization.
- In another embodiment, a kit is described for assessing a patient's susceptibility to Diabetes in which the assessment is made with a test apparatus. The kit includes (a) reagents for collecting a test sample from a patient; and (b) reagents for measuring the expression profile of a gene signature of TULP4, AA741300, ESCO1, EIF5B, ACTR2, WNK1, COCH, SON, TPR and NOG genes in a patient's test sample.
- Reagents in step (a) and (b) are sufficient for a plurality of tests. Reagents for collecting a test sample from a patient can be packaged in sterile containers.
- The gene signature can also include TULP4, AA741300, ESCO1, EIF5B, ACTR2, WNK1, COCH, SON, TPR and NOG genes and one or more genes selected from the list of genes of TABLES 1 or 6.
- The test sample can be a blood sample.
- The kit can also include reagents for the isolation of PBMCs or reagents for the isolation of CD11c+ or CD11b+ or Emr+ or [CD11b+ CD11c+] or [Emr+ CD11b+] or [Emr+ CD11c+] or [Emr+ CD11b+ CD11c+] cells or reagents for the isolation of CD14+ monocytes. The reagents for measuring the expression profile of a gene signature can be real-time PCR reagents as defined in the claims, or immunochemical assay reagents.
- It should be understood that this application is not limited to the embodiments disclosed in this Summary, and it is intended to cover modifications and variations that are within the scope of the claims.
- The previously described embodiments have many advantages, including novel gene signatures for the early diagnosis of a pre-diabetic disease state and the monitoring of patients who are at risk of developing diabetes or who have already acquired the disease. The disclosure also describes kits with reagents and instructions for the cost-effective and rapid testing of blood samples by medical personnel at a point-of-care facility.
-
-
FIG. 1 depicts a ROC Curve Analysis of CLC Gene compared to OGTT in accordance with a first embodiment; -
FIG. 2A depicts a ROC Curve Analysis of TCF7L2 set 1 compared to OGTT according to a second embodiment; -
FIG 2B depicts a ROC Curve Analysis of TCF7L2 set 1 compared to compared to OGTT vs. FPG according to a third embodiment; -
FIG. 3 shows a ROC Curve Analysis of CDKN1C gene according to a fourth embodiment; -
FIG. 4A shows a ROC analysis of the 3-gene signature compared to OGTT according to a fifth embodiment; -
FIG. 4B depicts a ROC analysis of the 3-gene signature compared to FPG vs. OGTT according to a sixth embodiment; -
FIG. 4C depicts bar chart of the mean expression of the 3-gene signature according to a seventh embodiment; -
FIG. 5A shows a ROC analysis of the 10-gene signature compared to OGTT according to an eighth embodiment; -
FIG. 5B shows a ROC analysis of the 10-gene signature compared to FPG vs. OGTT according to a ninth embodiment; and -
FIG. 5C depicts bar chart of the mean expression of the 10-gene signature according to a tenth embodiment - Unless defined otherwise, all technical and scientific terms used herein have the same meaning as is commonly understood by one of skill in the art. The following definitions are provided to help interpret the disclosure and claims of this application. In the event a definition in this section is not consistent with definitions elsewhere, the definition set forth in this section will control.
- Furthermore, the practice of the invention employs, unless otherwise indicated, conventional molecular biological and immunological techniques within the skill of the art. Such techniques are well known to the skilled worker, and are explained fully in the literature. See, e.g., Colignan, Dunn, Ploegh, Speicher and Wingfield "Current protocols in Protein Science" (1999-2008) Volume I and II, including all supplements (John Wiley & Sons Inc.); and Bailey, J. E. and Ollis, D. F., Biochemical Engineering Fundamentals, McGraw-Hill Book Company, NY, 1986; Ausubel, et al., ed., Current Protocols in Molecular Biology, John Wiley & Sons, Inc., NY, N.Y. (1987-2008), including all supplements; Sambrook, et al., Molecular Cloning: A Laboratory Manual, 2nd Edition, Cold Spring Harbor, N.Y. (1989); and Harlow and Lane, Antibodies, a Laboratory Manual, Cold Spring Harbor, N.Y. (1989). ROC analysis is reviewed in "An Introduction to ROC Analysis" by Tom Fawcett, Pattern Recognition Letters 27 (2006) 861-874.
- As used herein, "Diabetes Mellitus" refers to any disease characterized by a high concentration of blood glucose (hyperglycemia). Diabetes mellitus is diagnosed by demonstrating any one of the following: a fasting plasma glucose level at or above 126 mg/dL (7.0 mmol/l) or a plasma glucose at or above 200 mg/dL (11.1 mmol/l) two hours after a 75 g oral glucose load as in a glucose tolerance test or symptoms of hyperglycemia and casual plasma glucose at or above 200 mg/dL (11.1 mmol/l).
- As used herein, diabetes refers to "
type 1 diabetes" also known as childhood-onset diabetes, juvenile diabetes, and insulin-dependent diabetes (IDDM) or "type 2 diabetes" also known as adult-onset diabetes, obesity-related diabetes, and non-insulin-dependent diabetes (NIDDM) or others forms of diabetes include gestational diabetes, insulin-resistant type 1 diabetes (or "double diabetes"), latent autoimmune diabetes of adults (or LADA) and maturity onset diabetes of the young (MODY) which is a group of several single gene (monogenic) disorders with strong family histories that present as type 2 diabetes before 30 years of age. - As used herein, a "diabetic disease state" refers to a pre-diabetic disease state, intermediate diabetic disease states characterized by stages of the disease more advanced then the pre-diabetic disease state and to disease states characteristic of overt diabetes as defined herein, including type I or II diabetes.
- As used herein, a "pre-diabetic disease state" is one where a patient has an impaired fasting glucose level and impaired glucose tolerance. An impaired fasting glucose is defined as a blood glucose level from 100 to 125 mg/dL (6.1 and 7.0 mmol/l) i.e. an impaired fasting glucose. Patients with plasma glucose at or above 140 mg/dL or 7.8 mmol/l, but not over 200, two hours after a 75 g oral glucose load are considered to have impaired glucose tolerance.
- As used herein, a "medical professional" is a physician or trained medical technician or nurse at a point-of-care facility.
- A "point-of-care" facility can be at an inpatient location such as in a hospital or an outpatient location such as a doctor's office or a walk-in clinic. In one embodiment, the diagnostic assay may be distributed as a commercial kit to consumers together with instruments for the analysis of gene signature expression profile in a blood sample. In another embodiment, the commercial kit may be combined with instruments and reagents for the monitoring of blood glucose levels.
- The term "blood glucose level" refers to the concentration of glucose in blood. The normal blood glucose level (euglycemia) is approximately 120 mg/dl. This value fluctuates by as much as 30 mg/dl in non-diabetics.
- The condition of "hyperglycemia" (high blood sugar) is a condition in which the blood glucose level is too high. Typically, hyperglycemia occurs when the blood glucose level rises above 180 mg/dl.
- As used herein, a "test sample" is any biological sample from a patient that contains cells that differentially express genes in response to a diabetic disease state. The biological sample can be any biological material isolated from an atopic or non-atopic mammal, such as a human, including a cellular component of blood, bone marrow, plasma, serum, lymph, cerebrospinal fluid or other secretions such as tears, saliva, or milk; tissue or organ biopsy samples; or cultured cells. Preferably the biological sample is a cellular sample that can be collected from a patient with minimal intervention. In a preferred embodiment, a test sample is a blood sample or a preparation of PBMCs (peripheral blood mononuclear cells) or CD14+ monocytes or CD11b+ or CD11c+ or Emr+ cells.
- The mammal may be a human, or may be a domestic, companion or zoo animal. While it is particularly contemplated the herein described diagnostic tools are suitable for use in medical treatment of humans, they are also applicable to veterinary treatment, including treatment of companion animals such as dogs and cats, and domestic animals such as horses, cattle and sheep, or zoo animals such as non-human primates, felids, canids, bovids, and ungulates.
- As used herein, the term "gene expression" refers to the process of converting genetic information encoded in a gene into RNA (e.g., mRNA, rRNA, tRNA, or snRNA) through "transcription" of the gene (e.g., via the enzymatic action of an RNA polymerase), and for protein encoding genes, into protein through "translation" of mRNA.
- "Gene expression profile" refers to identified expression levels of at least one polynucleotide or protein expressed in a biological sample.
- The term "primer" as used herein refers to an oligonucleotide either naturally occurring (e.g. as a restriction fragment) or produced synthetically, which is capable of acting as a point of initiation of synthesis of a primer extension product which is complementary to a nucleic acid strand (template or target sequence) when placed under suitable conditions (e.g. buffer, salt, temperature and pH) in the presence of nucleotides and an agent for nucleic acid polymerization, such as DNA dependent or RNA dependent polymerase. A primer must be sufficiently long to prime the synthesis of extension products in the presence of an agent for polymerization. A typical primer contains at least about 10 nucleotides in length of a sequence substantially complementary or homologous to the target sequence, but somewhat longer primers are preferred. Usually primers contain about 15-26 nucleotides.
- As used herein, a "gene signature" refers to a pattern of gene expression of a selected set of genes that provides a unique identifier of a biological sample. A gene signature is diagnostic of a diabetic disease state if the pattern of gene expression of the selected set of genes is a substantial match to a gene signature in a reference sample taken from a patient with a diabetic disease state. For purposes of this application, a "gene signature" may be a pre-determined combination of nucleic acid or polypeptide sequences (if the genes are protein-coding genes). Gene signatures may comprise genes of unknown function or genes with no open reading frames including, but not limited to, rRNA, UsnRNA, microRNA or tRNAs.
- As used herein, a "diagnostic gene expression profile" refers to the gene expression profile of a gene signature in a biological sample taken from a patient diagnosed with a particular disease state. The disease state can be a diabetic disease state or a non-diabetic disease state. A "substantial match" between a test gene expression profile from the patient and a diagnostic gene expression profile characteristic of a diabetic disease state indicates the patient has a diabetic disease state. Alternatively, a "substantial match" between a test gene expression profile from the patient and a diagnostic gene expression profile characteristic of a non-diabetic disease state indicates the patient does not have a diabetic disease state.
- As used herein, a "variant" of a gene means gene sequences that are at least about 75% identical thereto, more preferably at least about 85% identical, and most preferably at least 90% identical and still more preferably at least about 95-99% identified when these DNA sequences are compared to a nucleic acid sequence of the prevalent wild type gene. In one embodiment, a variant of a gene is a gene with one or more alterations in the DNA sequence of the gene including, but not limited to, point mutations or single nucleotide polymorphisms, deletions, insertions, rearrangements, splice donor or acceptor site mutations and gene alterations characteristic of a pseudogenes. Throughout this application a gene implicitly includes both wild type and variants forms of the gene as defined herein.
- As used herein, a "substantial match" refers to the comparison of the gene expression profile of a gene signature in a test sample with the gene expression profile of the gene signature in a reference sample taken from a patient with a defined disease state. The expression profiles are "substantially matched" if the expression of the gene signature in the test sample and the reference sample are at substantially the same levels. i.e., there is no statistically significant difference between the samples after normalization of the samples. In one embodiment, the confidence interval of substantially matched expression profiles is at least about 50% or from about 50% to about 75% or from about 75% to about 80% or from about 80% to about 85% or from about 85% to about 90% or from about 90% to about 95%. In a preferred embodiment, the confidence interval of substantially matched expression profiles is about 95% to about 100%. In another preferred embodiment, the confidence interval of substantially matched expression profiles is any number between about 95% to about 100%. In another preferred embodiment, the confidence interval of substantially matched expression profiles is about 95% or about 96% or about 97% or about 98% or about 99%, or about 99.9%.
- As used herein, a "substantial difference" refers to the difference in the gene expression profile of a gene at one time point with the gene expression profile of the same gene signature at a second time point. The expression profiles are "substantially different" if the expression of the gene signature at the first and second time points are at different levels i.e. there is a statistically significant difference between the samples after normalization of the samples. In one embodiment, expression profiles are "substantially different" if the expression of the gene signature at the first and second time points are outside the calculated confidence interval. In one embodiment, the confidence interval of substantially different expression profiles is less than about 50% or less than about 75% or less than about 80% or less than from about 85% or less than about 90% or less than about 95%.
- A 95% confidence interval CI is equal to AUC + 1.96 x standard error of AUC, where AUC is the area under the ROC Curve.
- As used herein, "ROC" refers to a receiver operating characteristic, or simply ROC curve, which is a graphical plot of the sensitivity vs. (1 - specificity) for a binary classifier system as its discrimination threshold is varied.
- As used herein, the terms "diagnosis" or "diagnosing" refers to the method of distinguishing one diabetic disease state from another diabetic disease state, or determining whether a diabetic disease state is present in an patient (atopic) relative to the "normal" or "non-diabetic" (non-atopic) state, and/or determining the nature of a diabetic disease state.
- As used herein, "determining a diabetic disease state" refers to an integration of all information that is useful in diagnosing a patient with a diabetic disease state or condition and/or in classifying the disease. This information includes, but is not limited to family history, human genetics data, BMI, physical activity, metabolic disease profile and the results of a statistical analysis of the expression profiles of one or more gene signatures in a test sample taken from a patient. In the point-of-care setting, this information is analyzed and displayed by a computer system having appropriate data analysis software. Integration of the clinical data provides the attending physician with the information needed to determine if the patient has a diabetic condition, information related to the nature or classification of diabetes as well as information related to the prognosis and/or information useful in selecting an appropriate treatment. In one embodiment, the diagnostic assays, described herein, provide the medical professional with a determination of the efficacy of the prescribed medical treatment.
- As used herein, a "metabolic disease profile" refers to any number of standard metabolic measures and other risk factors that can be diagnostic of a diabetic disease state including, but not limited to fasting plasma glucose, insulin, pro-insulin, c-peptide, intact insulin, BMI, waist circumference, GLP-1, adiponectin, PAI-1, hemoglobin A1c, HDL, LDL, VLDL, triglycerides, free fatty acids. The metabolic disease profile can be used to generate a superior model for classification equivalence to 2-hr OGTT.
- A glucose tolerance test is the administration of glucose to determine how quickly it is cleared from the blood. The test is usually used to test for diabetes, insulin resistance, and sometimes reactive hypoglycemia. The glucose is most often given orally so the common test is technically an oral glucose tolerance test (OGTT).
- The fasting plasma glucose test (FPG) is a carbohydrate metabolism test which measures plasma, or blood, glucose levels after a fast. Fasting stimulates the release of the hormone glucagon, which in turn raises plasma glucose levels. In people without diabetes, the body will produce and process insulin to counteract the rise in glucose levels. In people with diabetes this does not happen, and the tested glucose levels will remain high.
- As used herein, the body mass index (BMI), or Quetelet index, is a statistical measurement which compares a person's weight and height. Due to its ease of measurement and calculation, it is the most widely used diagnostic tool to identify obesity.
- As used herein, NGT means Normal Glucose Tolerance, IGT means Impaired Glucose Tolerance and T2D means type 2 diabetes.
- As used herein, CD11c+, CD11b+ and Emr+ are cell surface markers of human monocyte/macrophage and myeloid cells and their precursors. In mice, the most commonly used monocyte/macrophage and myeloid cell surface markers are F4/80 and CD11b, although F4/80 and CD11b antibodies have been reported to react with eosinophils and dendritic cells and NK and other T and B cell subtypes, respectively (Nguyen, et al. (2007) J Biol Chem 282, 35279-35292; Patsouris, et al. (2008) Cell Metab. 8, 301-309). The F4/80 gene in mouse is the ortholog to the human Emr1 gene. The human ortholog for the mouse CD11c gene is ITGAX also called integrin, alpha X (complement component 3 receptor 4 subunit), SLEB6, OTTHUMP00000163299; leu M5, alpha subunit; leukocyte surface antigen p150,95, alpha subunit; myeloid membrane antigen, alpha subunit;
p150 95 integrin alpha chain (Chromosome: 16; Location: 16p11.2 Annotation: Chromosome 16, NC_000016.8 (31274010..31301819) MIM: 151510, GeneID:3687). The human ortholog for the mouse CD11b gene is ITGAM or integrin, alpha M (complement component 3 receptor 3 subunit) also called CD11B, CR3A, MAC-1, MAC1A, MGC117044, MO1A, SLEB6, macrophage antigen alpha polypeptide; neutrophil adherence receptor alpha-M subunit (Chromosome: 16; Location: 16p11.2 Chromosome 16, NC_000016.8 (31178789..31251714), MIM: 120980, GeneID: 3684). CD11c+, CD11b+ and Emr+ and CD14+ cells can be purified from PBMCs by positive selection using the appropriate human blood cell isolation kit (StemCell Technologies). Purity of isolated cells populations (>85%) is then confirmed by flow cytometry staining of fluorescent-conjugated antibodies to the appropriate cell surface mnrker (BioLegend). - As used herein, "real-time PCR" refers to real-time polymerase chain reaction, also called quantitative real time polymerase chain reaction (Q-PCR/qPCR) or kinetic polymerase chain reaction. Real-time PCR is a laboratory technique based on the polymerase chain reaction, which is used to amplify and simultaneously quantify a targeted DNA molecule. It enables both detection and quantification (as absolute number of copies or relative amount when normalized to DNA input or additional normalizing genes) of a specific sequence in a DNA sample.
- As used herein, an immunochemical assay is a biochemical test that measures the concentration of a substance in a cellular extract using the reaction of an antibody or antibodies to its antigen. In this disclosure, the antigen is a protein expressed by anyone of the protein coding genes comprising a gene signature. In a preferred embodiment, the immunochemical assay is an Enzyme-Linked ImmunoSorbent Assay (ELISA).
- As used herein, "specific oligonucleotide hybridization" refers to hybridization between probe sequences on a solid support such as a chip and cDNA sequences generated from transcripts within the patient's test sample. If the two nucleic acid sequences are substantially complementary, hybridization occurs which is directly proportional to the amount of cDNA sequences in the test sample. Detection of hybridization is then achieved using techniques well known in the art. Numerous factors influence the efficiency and selectivity of hybridization of two nucleic acids, for example, a nucleic acid member on a array, to a target nucleic acid sequence. These factors include nucleic acid member length, nucleotide sequence and/or composition, hybridization temperature, buffer composition and potential for steric hindrance in the region to which the nucleic acid member is required to hybridize. A positive correlation exists between the nucleic acid member length and both the efficiency and accuracy with which a nucleic acid member will anneal to a target sequence. In particular, longer sequences have a higher melting temperature (TM) than do shorter ones, and are less likely to be repeated within a given target sequence, thereby minimizing promiscuous hybridization. Hybridization temperature varies inversely with nucleic acid member annealing efficiency, as does the concentration of organic solvents, e.g., formamide, that might be included in a hybridization mixture, while increases in salt concentration facilitate binding. Under stringent annealing conditions, longer nucleic acids, hybridize more efficiently than do shorter ones, which are sufficient under more permissive conditions.
- As used herein, the term "antibody" includes both polyclonal and monoclonal antibodies; and may be an intact molecule, a fragment thereof (such as Fv, Fd, Fab, Fab' and F(ab)'2 fragments, or multimers or aggregates of intact molecules and/or fragments; and may occur in nature or be produced, e.g., by immunization, synthesis or genetic engineering.
- As used herein, all references to probes in Tables 1, 7, 8, 9, 10A and 10B refer to probe sets represented on the GeneChip Human Genome U133 Plus 2.0 Array.
- The following description relates to certain embodiments of the application, and to a particular methodology for diagnosing a diabetic disease state in a patient. In particular, the application discloses a number of genes, including some which had not previously been considered to be associated with a diabetic disease state, are differentially expressed in peripheral blood mononuclear cells (PMBC) from patients which have a diabetic or pre-diabetic disease state as compared to patients who do not have a diabetic disease state.
- In one embodiment, genes that are differentially expressed in PBMCs of NGTs and T2Ds are identified using microarray analysis. Transcripts from PBMCs of NGT and T2D patients (in this example, a cohort of 107 patients) were initially screened using the Affymetrix Human Genome HG-U133Plus2 chip, according to the manufacturer's instructions. Approximately 200 differentially expressed genes were selected which had a False Discovery Rate, FDR<20%, fold change >1.7 between NGTs and T2Ds using the Significance Analysis of Microarray (SAM) program (see TABLE 1).
- Methods of diabetes classification are now described by determining the differential expression of different combinations of diabetes susceptibility genes identified in the initial microarray screen (see TABLE 12A). Table 12A also includes the Genbank Accession Numbers of each of the selected genes.
- Gene expression of diabetes susceptibility genes may be measured in a biological sample using a number of different techniques. For example, identification of mRNA from the diabetes-associated genes within a mixture of various mRNAs is conveniently accomplished by the use of reverse transcriptase-polymerase chain reaction (RT-PCR) and an oligonucleotide hybridization probe that is labeled with a detectable moiety.
- First a test sample is collected from a patient. To obtain high quality RNA it is necessary to minimize the activity of RNase liberated during cell lysis. This is normally accomplished by using isolation methods that disrupt tissues and inactivate or inhibit RNases simultaneously. For specimens low in endogenous ribonuclease, isolation protocols commonly use extraction buffers contain detergents to solubilize membranes, and inhibitors of RNase such as placental ribonuclease inhibitor or vanadyl-ribonucleoside complexes. RNA isolation from more challenging samples, such as intact tissues or cells high in endogenous ribonuclease, requires a more aggressive approach. In these cases, the tissue or cells are quickly homogenized in a powerful protein denaturant (usually guanidinium isothiocyanate), to irreversibly inactivate nucleases and solubilize cell membranes. If a tissue sample can not be promptly homogenized, it must be rapidly frozen by immersion in liquid nitrogen, and stored at -80° C. Samples frozen in this manner must never be thawed prior to RNA isolation or the RNA will be rapidly degraded by RNase liberated during the cell lysis that occurs during freezing. The tissue must be immersed in a pool of liquid nitrogen and ground to a fine powder using mortar and pestle. Once powdered, the still-frozen tissue is homogenized in RNA extraction buffer. A number of kits for RNA isolation are now commercially available (Ambion, Quiagen).
- As is well known in the art, cDNA is first generated by first reverse transcribing a first strand of cDNA from a template mRNA using a RNA dependent DNA polymerase and a primer. Reverse transcriptases useful according to the application include, but are not limited to, reverse transcriptases from HIV, HTLV-1, HTLV-II, FeLV, FIV, SIV, AMV, MMTV, MoMuLV and other retroviruses (for reviews, see for example, Levin, 1997, Cell 88:5-8; Verma, 1977, Biochim. Biophys. Acta 473:1-38; Wu et al., 1975, CRC Crit. Rev. Biochem. 3:289-347). More recently, a number of kits are now commercially available for RT-PCR reactions using thermostable reverse transcriptase, e.g. GeneAmp® Thermostable rTth Reverse Transcriptase RNA PCR Kit (Applied Biosystems).
- "Polymerase chain reaction," or "PCR," as used herein generally refers to a method for amplification of a desired nucleotide sequence in vitro, as described in
U.S. Patent Nos. 4,683,202 ,4,683,195 ,4,800,159 , and4,965,188 . The PCR reaction involves a repetitive series of temperature cycles and is typically performed in a volume of 10-100 µl. The reaction mix comprises dNTPs (each of the four deoxynucleotides dATP, dCTP, dGTP, and dTTP), primers, buffers, DNA polymerase, and nucleic acid template. The PCR reaction comprises providing a set of polynucleotide primers wherein a first primer contains a sequence complementary to a region in one strand of the nucleic acid template sequence and primes the synthesis of a complementary DNA strand, and a second primer contains a sequence complementary to a region in a second strand of the target nucleic acid sequence and primes the synthesis of a complementary DNA strand, and amplifying the nucleic acid template sequence employing a nucleic acid polymerase as a template-dependent polymerizing agent under conditions which are permissive for PCR cycling steps of (i) annealing of primers required for amplification to a target nucleic acid sequence contained within the template sequence, (ii) extending the primers wherein the nucleic acid polymerase synthesizes a primer extension product. - Other methods of amplification include, but are not limited to, ligase chain reaction (LCR), polynucleotide-specific based amplification (NSBA).
- Primers can readily be designed and synthesized by one of skill in the art for the nucleic acid region of interest. It will be appreciated that suitable primers to be used with the application can be designed using any suitable method. Primer selection for PCR is described, e.g., in
U.S. Pat. No. 6,898,531, issued May 24, 2005 , entitled "Algorithms for Selection of Primer Pairs" andU.S. Ser. No. 10/236,480, filed Sep. 5, 2002 U.S. Ser. No. 10/341,832, filed Jan. 14, 2003 - In one embodiment, the PCR reaction can use nested PCR primers.
- In one embodiment, a detectable label may be included in an amplification reaction. Suitable labels include fluorochromes, e.g. fluorescein isothiocyanate (FITC), rhodamine, Texas Red, phycoerythrin, allophycocyanin, 6-carboxyfluorexcein (6-FAM), 2',7'-dimethoxy-4',5'-dichloro-6-carboxyfluorescein (JOE), 6-carboxy-X-rhodamine(ROX), 6-carboxy-2',4',7',4,7-hexachlorofluorescein (HEX), 5-carboxyfluorescein (5-FAM) or N,N,N',N'-tetramethyl-6-carboxyrhodamine (TAMRA), radioactive labels, e.g. 32P, 35S, 3H; as well as others. The label may be a two stage system, where the amplified DNA is conjugated to biotin, haptens, or the like having a high affinity binding partner, e.g. avidin, specific antibodies, etc., where the binding partner is conjugated to a detectable label. The label may be conjugated to one or both of the primers. Alternatively, the pool of nucleotides used in the amplification is labeled, so as to incorporate the label into the amplification product.
- In a particularly preferred embodiment the application utilizes a combined PCR and hybridization probing system so as to take advantage of assay systems such as the use of FRET probes as disclosed in US patents
U.S. Pat. Nos. 6,140,054 and6,174,670 . In one of its simplest configurations, the FRET or "fluorescent resonance energy transfer" approach employs two oligonucleotides which bind to adjacent sites on the same strand of the nucleic acid being amplified. One oligonucleotide is labeled with a donor fluorophore which absorbs light at a first wavelength and emits light in response, and the second is labeled with an acceptor fluorophore which is capable of fluorescence in response to the emitted light of the first donor (but not substantially by the light source exciting the first donor, and whose emission can be distinguished from that of the first fluorophore). In this configuration, the second or acceptor fluorophore shows a substantial increase in fluorescence when it is in close proximity to the first or donor fluorophore, such as occurs when the two oligonucleotides come in close proximity when they hybridise to adjacent sites on the nucleic acid being amplified, for example in the annealing phase of PCR, forming a fluorogenic complex. As more of the nucleic acid being amplified accumulates, so more of the fluorogenic complex can be formed and there is an increase in the fluorescence from the acceptor probe, and this can be measured. Hence the method allows detection of the amount of product as it is being formed. - It will also be appreciated by those skilled in the art that detection of amplification can be carried out using numerous means in the art, for example using TaqMan™ hybridisation probes in the PCR reaction and measurement of fluorescence specific for the target nucleic acids once sufficient amplification has taken place. TaqMan Real-time PCR measures accumulation of a product via the fluorophore during the exponential stages of the PCR, rather than at the end point as in conventional PCR. The exponential increase of the product is used to determine the threshold cycle, CT, i.e. the number of PCR cycles at which a significant exponential increase in fluorescence is detected, and which is directly correlated with the number of copies of DNA template present in the reaction.
- Although those skilled in the art will be aware that other similar quantitative "real-time" and homogenous nucleic acid amplification/detection systems exist such as those based on the TaqMan approach (see
U.S. Pat. Nos. 5,538,848 and5,691,146 ), fluorescence polarisation assays (e.g. Gibson et al., 1997, Clin Chem., 43: 1336-1341), and the Invader assay (e.g. Agarwal et al., ; Ryan D et al, Mol Diagn 1999 June; 4(2): 135-144). Such systems would also be adaptable for use in the described application, enabling real-time monitoring of nucleic acid amplification. - In another embodiment of the application, matrices or microchips are manufactured to contain an array of loci each containing a oligonucleotide of known sequence. In this disclosure, each locus contains a molar excess of selected immobilized synthetic oligomers synthesized so as to contain complementary sequences for desired portions of a diabetes susceptibility gene. Transcripts of diabetes susceptibility genes present in PBMC are amplified by RT-PCR and labeled, as described herein. The oligomers on the microchips are then hybridized with the labeled RT-PCR amplified diabetes susceptibility gene nucleic acids. Hybridization occurs under stringent conditions to ensure that only perfect or near perfect matches between the sequence embedded in the microchip and the target sequence will occur during hybridization. The resulting fluorescence at each locus is proportional to the expression level of the one or more diabetes susceptibility gene in the PBMCs.
- In other embodiments of the application, gene signature expression profiles of protein-coding genes are determined using techniques well known in the art of immunochemistry including, for example, antibody-based binding assays such as ELISA or radioimmunoassays or protein arrays containing antibodies directed to the protein products of genes within a pre-determined signature as defined herein.
- The expression profiles of the TCF7L2 and CLC genes were analyzed in peripheral blood mononuclear cells from normal glucose tolerant and type 2 diabetic patients.
- The human Charcot-Leyden crystal protein gene is expressed primarily in eosinophils. CLC is down regulated sequentially in PBMC ofNGTs to IGTs to T2Ds. The mean signal intensities of its expression in microarray of the 107-patient cohort are listed In TABLE 2 below. Receiver operating characteristic (ROC) analysis demonstrated that the CLC gene expression level can be used to separate NGTs from IGTs/T2Ds.
TABLE 2: CLC gene expression in PBMCs isolated from NGTs, IGTs and T2Ds NGT IGT T2D 1504 900 410 - The performance of CLC gene in predicting the clinical status was further examined using a receiver operating characteristic (ROC) analysis. An ROC curve shows the relationship between sensitivity and specificity. That is, an increase in sensitivity will be accompanied by a decrease in specificity. The closer the curve follows the left axis and then the top edge of the ROC space, the more accurate the test. Conversely, the closer the curve comes to the 45-degree diagonal of the ROC graph, the less accurate the test. The area under the ROC is a measure of test accuracy. The accuracy of the test depends on how well the test separates the group being tested into those with and without the disease in question. An area under the curve (referred to as "AUC") of 1 represents a perfect test, while an area of 0.5 represents a less useful test. Thus, preferred genes and diagnostic methods of the present application have an AUC greater than 0.50, more preferred tests have an AUC greater than 0.60, more preferred tests have an AUC greater than 0.70.
- The area under curve (AUC) was calculated as a measure of the performance of CLC gene in predicting patient status. Receiver operating characteristic (ROC) analysis of the CLC gene date demonstrated that the CLC gene expression level can be used to separate NGTs from IGTs/T2Ds (see
FIG. 1 ). - Genetic variants in the gene encoding for transcription factor-7-like 2 (TCF7L2) have been strongly associated with a risk for developing type 2 diabetes and impaired β-cell insulin function (see
US 2006/0286588 ). Genome-wide association studies implicate SNPs within TCF7L2 give the highest lifetime risk score for predicting type 2 diabetes progression compared to SNPs in other marker genes, including CDKAL1, CDKN2A/2B, FTO, IGF2BP2, and SLC30A8 (range of risk scores 1.12 - 1.20). TCF7L2 is widely expressed and this transcription factor is known to respond to developmental signals from members of the Wnt family of proteins. Functional and genetic studies point to a critical role for TCF7L2 in the development of the intestine and proglucagon gene expression in enteroendocrine cells. - To ascertain if TCF7L2 and the CLC gene are diagnostic markers of diabetes, either individually or in combination, 180 subjects were recruited from the German population in association with the Institute for Clinical Research & Development (IKFE), in Mainz, Germany. Appropriate IRB approvals were obtained prior to patient sample collection. The inclusion criteria consisted of patients between 18-75 years and a body-mass index (BMI) ≥ 30 who had no previous diagnosis of diabetes, and the legal capacity and ability to understand the nature and extent of the clinical study and the required procedures. The exclusion criteria consisted of blood donation within the last 30 days, insulin dependent diabetes mellitus, lactating or pregnant women, or women who intend to become pregnant during the course of the study, sexually active women not practicing birth control, history of severe/ multiple allergies, drug or alcohol abuse, and lack of compliance to study requirements. All clinical measurements including the 75g-oral glucose tolerance test results (OGTT) were obtained using standard procedures.
- Blood samples were drawn by venipuncture into CPT tubes (BD Biosciences). PBMCs were isolated according to manufacturer's protocol and the final cell pellet was resuspended in 1ml of Trizol (Invitrogen), and stored at -80°C. Subsequently, total RNA was purified using manufacturer's protocol and resuspended in DEPC-treated ddH2O RNA quantification and quality was performed using the ND-1000 Spectrophotometer (NanoDrop) and reconfirmed by spectrophotometric quantitation with RiboGreen kit (Molecular Probes). The quality of RNA templates was measured by using the Bioanalyzer 2100 (Agilent Technologies).
- First-strand cDNA synthesis was performed using 200 ng of total RNA from each patient PBMC sample using the High Capacity cDNA Reverse Transcription kit (Applied Biosystems). Afterwards, the reaction mixture was diluted 10-fold with ddH2O, and 4 µl was used as template in a 10 µl Taqman PCR reaction on the ABI Prism 7900HT sequence detection system. The reaction components consisted of 2X Taqman PCR master mix (Applied Biosystems), 0.9 µM of each primer, and 0.25 µM of fluorescent-labeled probe (Biosearch Technologies). Sequences for primer/probe sets used in RT-PCR Taqman assay are presented in Table 3.
Cycling conditions for reverse transcription step were as follows:Step 1 Step 2 Step 3 Step 4 Temp (C°) 25 37 85 4 Time 10 min. 120 min. 5 sec. ∞ Table 3. Probe and Primer sequences used in Taqman assays for TCF7L2, CLC and ACTIN Marker set # 5'>3' -Sequence Sequence Name Comment ACCTGAGCGCTCCTAAGAAATG TCF7L2 DL F1 NOT over junction TCF7L2 set 1 AGGGCCGCACCAGTTATTC TCF7L2 DL R1 NOT over junction FAM-AGCGCGCTTTGGCCTTGATCAAC-BHQ1 TCF7L2 DL Pro1 NOT over junction CGTCGACTTCTTGGTTACATTCC TCF7L2 DL F2 NOT over junction TCF7L2 set 2 CACGACGCTAAAGCTATTCTAAAGAC TCF7L2 DL R2 NOT over junction FAM- CAGCCGCTGTCGCTCGTCACC-BHQ1 TCF7L2 DL Pro2 NOT over junction GAAAGCGCGGCCATCAAC TCF7L2 1564 U18 Over junction TCF7L2 set 3 CAGCTCGTAGTATTTCGCTTGCT TCF7L2 1644 L23 Over junction FAM-TCCTTGGGCGGAGGTGGCATG-BHQ1 TCF7L2 1586 P21 Over junction GCTACCCGTGCCATACACAGA CLC 85 U21 Over junction CLC set 1 GCAGATATGGTTCATTCAAGAAACA CLC 185 L25 Over junction FAM-TTCTACTGTGACAATCAAAGGGCGACCA-BHQ1 CLC 127 P28 Over junction CCTGGCACCCAGCACAAT B-actin-1F GCCGATCCACACGGAGTACTT B-actin-1R ACTIN FAM-ATCAAGATCATTGCTCCTCCTGAGCGC-BHQ1 B-actin P Internal Control - Quantitative real-time RT-PCR by Taqman assay using two different primer/ probe combinations specific for TCF7L2 and one prime/probe set for CLC, was performed on RNA isolated from PBMCs from individual patients. Thermocycling profile for PCR step was as follows, 95°C for 10 min, followed by 40 cycles of 95°C (15 sec) and 60°C (1 min). Ct values were calculated from the raw data using the software SDS version 2.1 (Applied Biosystems), with threshold set at 0.2 to 0.3. Run-to run reproducibility by Pearson correlation was R2=0.96-0.98 for the above-mentioned markers. The delta Ct (cycle threshold) value was calculated by subtracting the Ct of the housekeeping β-actin gene from the Ct of marker of interest, for instance, TCF7L2 (Ct TCF7L2 - Ct actin). The value of [2-(delta Ct) x 1000] was used to represent the expression of TCF7L2 relative to β-actin. The OGTT result was used as the true clinical status. Student's T-test was used for determining statistical significance between expression levels of gene markers using normalized Ct values.
- Based on the 2-hr OGTT measurement and current ADA guidelines, of the 180 patients enrolled in the study, 104 patients were classified as NGT (Normal Glucose Tolerance), 49 patients as IGT (impaired glucose tolerance) and 27 patients were considered T2D (type 2 diabetes). Because the T2D subjects were diagnosed with diabetes for the first time in this study, the duration of the disease for each patient, and how long the PBMCs were sustained in a hyperglycemic microenvironment was unknown.
- T-test analysis for expression levels of TCF7L2 and CLC normalized to β-actin for each patient, based on primer/probe sets values and separated by glucose tolerance, is depicted in Table 4. The NGT and IGT plus T2D patient groups had a statistically significant difference between expression levels by Student's T-test, with p-values =0.004; 0.021 and 0.022 for TCF7L2 set 1, set 3 and CLC, respectively. These results indicate differential expression of the TCF7L2 and CLC genes in PBMCs of pre-diabetic (IGT) patients or pre-diabetic and T2D patients combined together compared to NGT.
TABLE 4: Statistical difference in expression levels of TCF7L2 and CLC by Student's T-te st Sample n T-test Bactin Ct Normalized TCF7L2_1 Normalized TCF7L2_2 Normalized TCF7L2_3 Normalized CLC 104/49 NGT/IGT 0.451 0.005 0.075 0.008 0.013 104/76 NGT/(IGT+T2D) 0.277 0.004 0.093 0.021 0.022 Statistically significant differentiation - Next, the performance of the TCF7L2 and CLC Taqman assays as a diagnostic tool for the classification of patients as normal or pre-diabetic/diabetic, compared to the 2-hr OGTT was assessed. Receiver Operating Characteristic (ROC) curves for each TCF7L2 and CLC primer/probe set normalized delta Ct value were generated (Table 5,
FIGs. 2A and2B ). The AUC values for the TCF7L2 set 1 and CLC PCR assays were 0.63 and 0.61, respectively. Compared to the 2-hr OGTT classification, TCF7L2 set 1 expression from PBMCs can correctly classify a patient as being normal or pre-diabetic/diabetic with an AUC of 0.73 when used in conjunction with the FPG test (FIGs. 2A and2B ). CLC did not have an additive value to TCF7L2 set 1 and was not considered for the diagnostic algorithm. Additionally, exclusion of 14 patients that had FPG ≥ 126mg/dL (also considered diabetic) did not change the performance of the assay.Table 5: ROC curve AUC values for each marker probe-primer set and in combination with FPG values ROC AUC value Marker set # Marker vs. OGTT Marker+FPG vs. OGTT TCF7L2 set 1 0.63 0.73 TCF7L2 set 2 0.59 ND TCF7L2 set 3 0.61 0.72 CLC set 1 0.60 0.69 - In one embodiment, each of the genes selected in the microarray analysis (see TABLE 1) may be combined with the performance of TCF7L2 set 1 to more closely match the 2-hr OGTT result.
- In another embodiment, genes that are strongly associated with a risk of type 2 diabetes (see TABLE 6) may also be combined with the performance of TCF7L2 set 1 to more closely match the 2-hr OGTT result. In another embodiment, the genes of Table 6 in combination with one or more genes of TABLE 1 can be tested as described herein for gene signatures that are diagnostic of a diabetic disease state.
TABLE 6: Gene Symbols NOTCH2 IGF2BP2 LGR5 CDKN2A-2B THADA WFS1 FTO HHEX-IDE PPARG KCNJ11 JAZF11 CDC123 ADAMTS9 TSPAN8 SLC30A8 CAMK1D - In another embodiment, the expression of CDKN1C, a member of the CIP/KIP family was also differentially expressed in PBMCs from NGTs and T2Ds.
- The CIP/KIP family consists of three members, CDKN2A, CDKN2B and CDKN1C. All of the three members can inhibit the activity of CDK4, which plays a central role in regulating mammalian cell cycle. Islet β-cell replication plays an essential role in maintaining β-cell mass homeostasis. It has been known that CDK4 has an important role in the regulation of body weight and pancreatic β-cell proliferation. In mice, loss of the CDK4 gene resulted in insulin-deficient diabetes due to the reduction of β-cell mass whereas activation of CDK4 caused β-islet cell hyperplasia. Recently, genome-wide association studies of type 2 diabetes have revealed that nucleotide variation near CDKN2A and CDKN2B genes is associated with type 2 diabetes risk. In addition, over-expression of CDKN2A leads to decreased islet proliferation in aging mice and over-expression of CDKN2B is related to islet hypoplasia and diabetes in murine models. CDKN1C is a maternally expressed gene located on chromosome 11p15.5 and is involved in the pathogenesis of Beckwith-Wiedemann syndrome (BWS), a disorder characterized by neonatal hyperinsulinemic hypoglycemia, as well as pre- and postnatal overgrowth. Recent studies also showed that CDKN1C is down-regulated by insulin and variants of CDKN1C may be associated to increased birth weights in type 2 diabetes patients. In addition to regulating the cell cycle, the CIP/KIP family plays an important role in other biological processes, such as apoptosis, transcription regulation, differentiation and cell migration. The expression of the three genes in the 107 patient cohort was analyzed. Only CDKN1C displayed differential expression among NGTs, IGTs and T2Ds (see TABLE 7). There are 5 probes expressing in PBMC for CDKN1C on the HG-U133Plus2 GeneChip. Each of them displayed differential expression between NGTs and IGTs/T2Ds (TABLE 7). ROC analysis showed that expression levels of the 5 probes can be used to separate NGTs from T2Ds (
FIG. 3 ).TABLE 7: CDKN1C gene expression in PBMCs isolated from NGTs, IGTs and T2Ds Gene Probe Expression in PBMC Mean_NGT Mean_IGT Mean_T2D CDKN1C 213182_x_at Yes 935 1178 1784 213183_s_at Yes 531 712 624 213348_at Yes 2648 3246 3957 216894_x_at Yes 797 1030 1439 219534_x_at Yes 1092 1356 1973 - In a person of ordinary skill in the art will recognize that the described embodiments provide a premise to investigate gene signatures as a diagnostic tool of diabetes. To investigate the underlying biological processes between normal subjects and pre-diabetes and diabetes patients, pathway analysis was conducted. Namely, the probes on HG-U133Plus2 chip were mapped to Gene Ontology Biological Process (GOBP) as described by Yu et al. BMC Cancer 7:182 (2007). Since genes with very low expression tend to have higher variations, genes whose mean intensity is less than 200 in the dataset were removed from pathway analysis. As a result, 21247 probes were retained. To identify pathways that have significant association with the development of pre-diabetes or diabetes, global test program was run by comparing NGT vs. IGT, NGT vs. T2D, or NGT vs. IGT+T2D. The pathways that have at least 10 probes and a significant p value (p < 0.05) were identified for each comparison. There were 3 pathways that had consistent association with the patient outcomes through the three comparisons. They are B cell activation (GO0042113), humoral immune response (GO0006959), and DNA unwinding during replication (GO0006268). Among the 3 pathways, B cell activation and humoral immune response have dominantly negative association with diabetes (lower expression in IGT/T2D) whereas DNA unwinding during replication has positive association with diabetes (higher expression in IGT/T2D).
- To build a pathway-based gene signature from the 3 key pathways, genes with a p < 0.05 were pooled and sorted based on their statistical significance (z score from Global Test). If a gene has more than one probe in the list and their behaviors were consistent, the one with the highest significance was retained. If a gene has more than one probe in the list and their behaviors were opposite, all probes for this gene were removed. As a result, 14 unique genes were obtained (SEE TABLE 8 below).
TABLE 8 : Pathway Significant Genes PSID Gene Symbol Gene Title 208900_s_at TOP1 topoisomerase (DNA) I 216379_x_at CD24 CD24 antigen (small cell lung carcinoma cluster 4 antigen) 222430_s_at YTHDF2 YTH domain family, member 2 1554343_a_at BRDG1 BCR downstream signaling 1228592_at MS4A1 membrane-spanning 4-domains, subfamily A, member 1216894_x_at CDKN1C cyclin-dependent kinase inhibitor 1C (p57, Kip2) 1558662_s_at BANK1 B-cell scaffold protein with ankyrin repeats 1205267_at POU2AF1 POU domain, class 2, associating factor 1205859_at LY86 lymphocyte antigen 86 221969_at PAX5 Paired box gene 5 (B-cell lineage specific activator) 207655_s_at BLNK B-cell linker 206126_at BLR1 Burkitt lymphoma receptor 1, GTP binding protein (chemokine (C-X-C motif) receptor 5)206983_at CCR6 chemokine (C-C motif) receptor 6 204946_s_at TOP3A topoisomerase (DNA) III alpha 214252_s_at CLN5 ceroid-lipofuscinosis, neuronal 5 - To build a signature using genes with relatively high variation, 10 genes with a CV > 0.25 were retained. To determine the optimal number of genes for a signature, combination of top 2 - 10 genes were examined in the dataset. The result indicated that the top 3 genes gave the best performance in the prediction of patients' outcomes. The 3 genes, TOP1, CD24 and STAP1 below in TABLE 9.
TABLE 9: 3 gene expression in PBMCs isolated from NGTs, IGTs and T2Ds Top 3 genes from pathway analysis Probe Gene Symbol Gene Title 208900_s_at TOP1 topoisomerase (DNA) I 216379_x_at CD24 CD24 antigen (small cell lung carcinoma cluster 4 antigen) 1554343_a_at STAP1 signal transducing adaptor family member 1The mean expression of the top 3 genes in subgroups Probe Gene Mean_NGT Mean_IGT Mean_T2D 208900_s_at TOP1 868 1145 1418 216379_x_at CD24 1767 1274 1194 1554343_a_at STAP1 373 283 265 - The ROC analysis of the 3-gene signature in the 107-patient cohort (
FIG. 4A and4B ) demonstrates this signature can separate NGTs from IGTs/T2Ds. A histogram depicting the mean expression of the genes is shown inFIG. 4C . - To remove non-informative genes, only genes that had 10 or more presence calls in the cohort were retained. The 107-patient cohort was then divided into a 54-patient training set and a 53-patient test set. Based on OGTT classification, there are 28 NGTs, 17 IGTs and 9 T2Ds in the training set whereas there are 29 NGTs, 16 IGTs and 8 T2Ds in the test set. To identify genes that have differential expression between NGT and IGT + T2D patients, Significant Analysis of Microarray (SAM) program was performed. Genes were selected if the False Discovery Rate (FDR) is lower than 20%. As a result, 235 genes were selected. To further narrow down the gene list, genes with the fold-change larger than 1.5 between the two groups, and the average intensity of the gene in the dataset is larger than 200 were retained. As a result, 17 probe sets were obtained. Among them, 4 were probes representing hemoglobin gene. Considering that hemoglobin has extremely high expression in red blood cells, the 4 probes were removed to eliminate possible contamination. To determine the optimal number of genes as a signature, performance of combination of the top genes were examined from 2 to 13 in the training set. The result indicated that the top 10 genes gave the best performance based on the area under curve (AUC) (see Table 10).
TABLE 10A : 10 gene expression in PBMCs isolated from NGTs, IGTs and T2Ds Probe Symbol Title 239742_at TULP4 Tubby like protein 4 244450_at AA741300 Weakly similar to ALU8_HUMAN ALU SUBFAMILY SX SEQUENCE 235216_at ESCO1 establishment of cohesion 1homolog 1201026_at EIF5B eukaryotic translation initiation factor 5B 200727_s_at ACTR2 ARP2 actin-related protein 2 homolog 211993_at WNK1 WNK lysine deficient protein kinase 1205229_s_at COCH coagulation factor C homolog, cochlin 201085_s_at SON SON DNA binding protein 1557227_s_at TPR translocated promoter region (to activated MET oncogene) 231798_at NOG Noggin TABLE 10B: The mean expression of the top 10 genes in subgroups Probe Gene Mean_NGT Mean_IGT Mean_T2D 239742_at TULP4 514 659 702 244450_at AA741300 674 461 482 235216_at ESCO1 199 262 351 201026_at EIF5B 330 440 500 200727_s_at ACTR2 2153 2751 3590 211993_at WNK1 397 505 625 205229_s_at COCH 330 231 250 201085_s_at SON 3300 4103 4900 1557227_s_at TPR 378 445 616 231798_at NOG 515 430 302 - To further evaluate the gene signature, patient outcomes in the test set were determined. Prediction of pre-diabetes and diabetes using plasma fasting glucose (FPG) levels was also examined. To investigate the complementary effect between the gene signature and FPG levels, combination of these two predictors were used to predict the patient outcomes. A comparison of ROC analyses among using FPG, or 10-gene signature, or combination of FPG and 10-gene signature in the test set is depicted in
FIG. 5 . It demonstrates that the 10-gene signature can independently separate NTGs from IGTs/T2Ds, and the FPG and the 10-gene signature are complementary for better prediction (seeFIGs. 5A and5B ). The mean expression signals of the 10 genes in the 107-patient cohort are shown in the table and bar chart inFIG. 5C . - The statistical analysis of the clinical data identified a 3 gene and 10 signature that are differentially expressed in NGTs and T2D.
- In another embodiment, a diagnostic assay is described for the point-of-care classification of normal versus pre-diabetes/ diabetes or for the prediction of progression to pre-diabetes/ diabetes over a defined period time, e.g. from ½ to 2 years or from 2 to 5 years, or from 5 to 10 years or more.
- Alternatively gene expression profiles are determined by detection of the protein encoded by the mRNA, for example using ELISA or proteomic array. All of these methods are well known in the art.
- The disclosure herein also provides for a kit format which comprises a package unit having one or more reagents for the diagnosis of a diabetic disease state in a patient. The kit may also contain one or more of the following items: buffers, instructions, and positive or negative controls. Kits may include containers of reagents mixed together in suitable proportions for performing the methods described herein. Reagent containers preferably contain reagents in unit quantities that obviate measuring steps when performing the subject methods.
- The kit may include sterile needles and tubes/ containers for the collection of a patient's blood. Collection tubes will typically contain certain additives e.g. heparin to inhibit blood coagulation
- Kits may also contain reagents for the measurement of a gene signature expression profile in a patient's sample. As disclosed herein, gene signatures expression profiles may be measured by a variety of means known in the art including RT-PCR assays, oligonucleotide based assays using microchips or protein based assays such as ELISA assays.
- In a preferred embodiment, gene signature expression profiles are measured by real-time RT-PCR.
- In one embodiment of the application, the kit comprises primers of the amplification and detection of gene signature expression profiles in a patient's blood sample. Primers may have a sequence that is complementary to any one of the diabetes susceptibility genes as defined herein including TOP1, CD24, STAP1, TULP4, AA741300, ESCO1, EIF5B, ACTR2, WNK1, COCH, SON, TPR, NOG genes or any one of the genes listed in Tables 1 or 6.
- Examples of primer sequences used for the real-time RT-PCR of diabetes susceptibility genes are disclosed in Tables 12B and 12C.
- In a preferred embodiment, the kit reagents are designed to function with the 7500 Fast Dx Real-Time PCR Instrument by Applied Biosystems, which is a PCR-based technology that was approved by the FDA's Office of In Vitro Diagnostics (FDA-OIVD).
- In yet another embodiment, the kit includes a microchip comprising an array of hybridization probes for the 3 gene (TOP1, CD24 and STAP1) or 10 gene (TULP4, AA741300, ESCO1, EIF5B, ACTR2, WNK1, COCH, SON, TPR and NOG) signatures. In another aspect, the microchips may further comprise an array of one or more hybrization probes for one or more of the genes listed in Tables 1 or 6.
- In a preferred embodiment, the microchips are designed to function with Affymetrix GeneChipDx technology that can measure, in parallel, the gene expression of 1 to more than 55,000 mRNAs. FDA-OIVD this platform for use with the AmpliChip P450 product from Roche Molecular Diagnostics and the Pathwork Diagnostics Tissue of Origin test.
TABLE 1 Probe Gene Symbol Gene Title 218659_at ASXL2 additional sex combs like 2 (Drosophila) 230528_s_at MGC2752 hypothetical protein MGC2752 211921_x_at PTMA prothymosin, alpha (gene sequence 28) /// prothymosin, alpha (gene sequence 28) 209102_s_at HBP1 HMG-box transcription factor 1 239946_at KIAA0922 KIAA0922 protein 226741_at TMEM85 Transmembrane protein 85 239742_at TULP4 Tubby like protein 4 202844_s_at RALBP1 ralA binding protein 1 237768_x_at TAF15 TAF15 RNA polymerase II, TATA box binding protein (TBP)-associated factor, 68kDa 202373_s_at RAB3GAP2 RAB3 GTPase activating protein subunit 2 (non-catalytic) 223413_s_at LYAR hypothetical protein FLJ20425 222371_at PIAS1 Protein inhibitor of activated STAT, 1 244450_at MAK Male germ cell-associated kinase 201024_x_at EIF5B eukaryotic translation initiation factor 5B 202615_at GNAQ Guanine nucleotide binding protein (G protein), q polypeptide 222621_at DNAJC1 DnaJ (Hsp40) homolog, subfamily C, member 1 212774_at ZNF238 zinc finger protein 238 238883_at THRAP2 Thyroid hormone receptor associated protein 2 223130_s_at MYLIP myosin regulatory light chain interacting protein 225445_at --- Transcribed locus 235601_at MAP2K5 Mitogen-activated protein kinase kinase 5 209258_s_at CSPG6 chondroitin sulfate proteoglycan 6 (bamacan) 1557238_s_at SETD5 SET domain containing 5 202927_at PIN1 protein (peptidyl-prolyl cis/trans isomerase) NIMA-interacting 1 1568618_a_at GALNT1 UDP-N-acetyl-alpha-D-galactosamine:polypeptide N-acetylgalactosaminyltransferase 1 (GalNAc-T1) 222417_s_at SNX5 sorting nexin 5 208836_at ATP1B3 ATPase, Na+/K+ transporting, beta 3 polypeptide 202738_s_at PHKB phosphorylase kinase, beta 224872_at KIAA1463 KIAA1463 protein 235200_at ZNF561 Zinc finger protein 561 235216_at ESCO1 establishment of cohesion 1 homolog 1 (S. cerevisiae) 201026_at EIF5B eukaryotic translation initiation factor 5B 208095_s_at SRP72 signal recognition particle 72kDa 244457_at ITPR2 Family with sequence similarity 20, member C 216563_at ANKRD12 Ankyrin repeat domain 12 211983_x_at ACTG1 actin, gamma 1 227854_at FANCL Fanconi anemia, complementation group L 1552343_s_at PDE7A phosphodiesterase 7A 221548_s_at ILKAP integrin-linked kinase-associated serine/threonine phosphatase 2C 215772_x_at SUCLG2 succinate-CoA ligase, GDP-forming, beta subunit 229010_at CBL Cas-Br-M (murine) ecotropic retroviral transforming sequence 226879_at MGC15619 hypothetical protein MGC15619 1556451_at BACH2 BTB and CNC homology 1, basic leucine zipper transcription factor 2 225490_at ARID2 AT rich interactive domain 2 (ARID, RFX-like) 214055_x_at BAT2D1 BAT2 domain containing 1 32069_at N4BP1 Nedd4 binding protein 1 235457_at MAML2 mastermind-like 2 (Drosophila) 217985_s_at BAZ1A bromodomain adjacent to zinc finger domain, 1A 229399_at C10orf118 chromosome 10 open reading frame 118 208994_s_at PPIG peptidyl-prolyl isomerase G (cyclophilin G) 202656_s_at SERTAD2 SERTA domain containing 2 241917_at FCHSD2 FCH and double SH3 domains 2 238807_at ANKRD46 Ankyrin repeat domain 46 204415_at G1P3 interferon, alpha-inducible protein (clone IFI-6-16) 240176_at LOC391426 Similar to ENSANGP00000004103 233284_at --- --- 232583_at --- --- 200772_x_at PTMA prothymosin, alpha (gene sequence 28) 239721_at UBE2H Ubiquitin-conjugating enzyme E2H (UBC8 homolog, yeast) 218607_s_at SDAD1 SDA1 domain containing 1 204160_s_at ENPP4 ectonucleotide pyrophosphatase/phosphodiesterase 4 (putative function) 243303_at ECHDC1 Enoyl Coenzyme A hydratase domain containing 1 225266_at ZNF652 Zinc finger protein 652 220072_at CSPP1 centrosome and spindle pole associated protein 1 234196_at TMCC3 Transmembrane and coiled-coil domain family 3 222616_s_at USP16 ubiquitin specific peptidase 16 201274_at PSMA5 proteasome (prosome, macropain) subunit, alpha type, 5 238714_at RAB12 RAB12, member RAS oncogene family 204563_at SELL selectin L (lymphocyte adhesion molecule 1) 1557239_at BBX Bobby sox homolog (Drosophila) 232510_s_at DPP3 dipeptidylpeptidase 3 235653_s_at THAP6 THAP domain containing 6 200727_s_at ACTR2 ARP2 actin-related protein 2 homolog (yeast) 221564_at HRMT1L1 HMT1 hnRNP methyltransferase-like 1 (S. cerevisiae) 211993_at WNK1 WNK lysine deficient protein kinase 1 /// WNK lysine deficient protein kinase 1 201114_x_at PSMA7 proteasome (prosome, macropain) subunit, alpha type, 7 233089_at QRSL1 glutaminyl-tRNA synthase (glutamine-hydrolyzing)-like 1 212991_at FBXO9 F-box protein 9 227770_at VPS4A Vacuolar protein sorting 4A (yeast) 222111_at FAM63B Family with sequence similarity 63, member B 1558604_a_at MRNA; clone CD 43T7 205229_s_at COCH coagulation factor C homolog, cochlin (Limulus polyphemus) 219130_at FLJ10287 hypothetical protein FLJ10287 241262_at --- 202412_s_at USP1 ubiquitin specific peptidase 1 225092_at RABEP1 rabaptin, RAB GTPase binding effector protein 1 200905_x_at HLA-E major histocompatibility complex, class I, E 201010_s_at TXNIP thioredoxin interacting protein 221607_x_at ACTG1 actin, gamma 1 201085_s_at SON SON DNA binding protein 214723_x_at KIAA1641 KIAA1641 201565_s_at ID2 inhibitor of DNA binding 2, dominant negative helix-loop-helix protein 201861_s_at LRRFIP1 leucine rich repeat (in FLII) interacting protein 1 207785_s_at RBPSUH recombining binding protein suppressor of hairless (Drosophila) 230415_at --- 236620_at RIF1 RAP1 interacting factor homolog (yeast) 206363_at MAF v-maf musculoaponeurotic fibrosarcoma oncogene homolog (avian) 1558748_at NAPE-PLD N-acyl-phosphatidylethanolamine-hydrolyzing phospholipase D 223101_s_at ARPC5L actin related protein 2/3 complex, subunit 5-like 236370_at SMURF1 SMAD specific E3 ubiquitin protein ligase 1 200702_s_at DDX24 DEAD (Asp-Glu-Ala-Asp) box polypeptide 24 1557227_s_at TPR translocated promoter region (to activated MET oncogene) 220934_s_at MGC3196 hypothetical protein MGC3196 233333_x_at AVIL advillin 231798_at NOG Noggin 228986_at OSBPL8 oxysterol binding protein-like 8 241786_at PPP3R1 Protein phosphatase 3 (formerly 2B), regulatory subunit B, 19kDa, alpha isoform (calcineurin B, type I) 212227_x_at EIF1 eukaryotic translation initiation factor 1 222471_s_at KCMF1 potassium channel modulatory factor 1 203580_s_at SLC7A6 solute carrier family 7 (cationic amino acid transporter, y+ system), member 6 208900_s_at TOP1 topoisomerase (DNA) I 240070_at FLJ39873 hypothetical protein FLJ39873 213305_s_at PPP2R5C protein phosphatase 2, regulatory subunit B (B56), gamma isoform 229470_at CDNA FLJ27196 fis, clone SYN02831 204048_s_at PHACTR2 phosphatase and actin regulator 2 1561690_at CDNA clone IMAGE:5303966 1556728_at CDNA FLJ43665 fis, clone SYNOV4006327 212027_at RBM25 RNA binding motif protein 25 210218_s_at SP100 nuclear antigen Sp100 232356_at CDNA FLJ13539 fis, clone PLACE1006640 241891_at DOCK8 Dedicator of cytokinesis 8 235925_at LOC440282 Hypothetical protein LOC145783 211745_x_at HBA1 hemoglobin, alpha 1 /// hemoglobin, alpha 1 240452_at GSPT1 G1 to S phase transition 1 212669_at CAMK2G calcium/calmodulin-dependent protein kinase (CaM kinase) II gamma 209791_at PADI2 peptidyl arginine deiminase, type II 221952_x_at TRMT5 TRM5 tRNA methyltransferase 5 homolog (S. cerevisiae) 226942_at PHF20L1 PHD finger protein 20-like 1 203939_at NT5E 5'-nucleotidase, ecto (CD73) 208705_s_at EIF5 eukaryotic translation initiation factor 5 1557718_at PPP2R5C protein phosphatase 2, regulatory subunit B (B56), gamma isoform 212251_at MTDH metadherin 226384_at PPAPDC1 B phosphatidic acid phosphatase type 2 domain containing 1 B 212487_at KIAA0553 KIAA0553 protein 227402_s_at C8orf53 chromosome 8 open reading frame 53 221875_x_at HLA-F major histocompatibility complex, class I, F 225506_at KIAA1468 KIAA1468 201730_s_at TPR translocated promoter region (to activated MET oncogene) 235645_at ESCO1 establishment of cohesion 1 homolog 1 (S. cerevisiae) 208993_s_at PPIG peptidyl-prolyl isomerase G (cyclophilin G) 233690_at C21orf96 Chromosome 21 open reading frame 96 221798_x_at RPS2 Ribosomal protein S2 1569898_a_at --- CDNA FLJ32047 fis, clone NTONG2001137 202368_s_at TRAM2 translocation associated membrane protein 2 215128_at --- --- 230761_at USP7 Unknown protein 243_g_at MAP4 microtubule-associated protein 4 223081_at PHF23 PHD finger protein 23 224736_at CCAR1 cell division cycle and apoptosis regulator 1 236962_at PTBP2 Polypyrimidine tract binding protein 2 225893_at --- MRNA; cDNA DKFZp686D04119 (from clone DKFZp686D04119) 244414_at MAML2 Mastermind-like 2 (Drosophila) 221234_s_at BACH2 BTB and CNC homology 1, basic leucine zipper transcription factor 2 /// BTB and CNC homology 1, basic zipper transcription factor 2 218135_at PTX1 PTX1 protein 229353 s_at NUCKS1 nuclear casein kinase and cyclin-dependent kinase substrate 1 228408_s_at SDAD1 SDA1 domain containing 1 234723_x_at --- --- 212130_x_at EIF1 eukaryotic translation initiation factor 1 232565_at RAB61P2 RAB6 interacting protein 2 210479_s_at RORA RAR-related orphan receptor A 226320_at THOC4 THO complex 4 208859_s_at ATRX alpha thalassemia/mental retardation syndrome X-linked (RAD54 homolog, S. cerevisiae) 238645_at VIL2 Villin 2 (ezrin) 243578_at --- Transcribed locus 202868_s_at POP4 processing of precursor 4, ribonuclease P/MRP subunit (S. cerevisiae) 224585_x_at ACTG1 actin, gamma 1 221768_at SFPQ Splicing factor proline/glutamine-rich (polypyrimidine tract binding protein associated) 1557459_at SNF1LK2 SNF1-like kinase 2 225583_at UXS1 UDP-glucuronate decarboxylase 1 225125_at TMEM32 transmembrane protein 32 202408_s_at PRPF31 PRP31 pre-mRNA processing factor 31 homolog (yeast) 236355_s_at LOC439993 LOC439993 209458_x_at HBA1 /// HBA2 hemoglobin, alpha 1 /// hemoglobin, alpha 1 /// hemoglobin, alpha 2 /// hemoglobin, alpha 2 211948_x_at BAT2D1 BAT2 domain containing 1 203682_s_at IVD isovaleryl Coenzyme A dehydrogenase 203184_at FBN2 fibrillin 2 (congenital contractural arachnodactyly) 1560082_at NOL10 Nucleolar protein 10 212794_s_at KIAA1033 KIAA1033 226159_at LOC285636 hypothetical protein LOC285636 225276_at GSPT1 G1 to S phase transition 1 205859_at LY86 lymphocyte antigen 86 200977_s_at TAX1BP1 Tax1 (human T-cell leukemia virus type I) binding protein 1 239418_x_at ENTPD1 Ectonucleoside triphosphate diphosphohydrolase 1 208638_at PDIA6 protein disulfide isomerase family A, member 6 203228_at PAFAH 1 B3 platelet-activating factor acetylhydrolase, isoform Ib, gamma subunit 29kDa 208812_x_at HLA-C major histocompatibility complex, class I, C 220924_s_at SLC38A2 solute carrier family 38, member 2 235705_at --- --- 208974_x_at KPNB1 karyopherin (importin) beta 1 201854_s_at ASCIZ ATM/ATR-Substrate Chk2-Interacting Zn2+-finger protein 209116_x_at HBB hemoglobin, beta /// hemoglobin, beta 218150_at ARL5 ADP-ribosylation factor-like 5 208042_at AGGF1 angiogenic factor with G patch and FHA domains 1 226718_at AMIGO1 adhesion molecule with Ig-like domain 1 235328_at CCDC41 Coiled-coil domain containing 41 225609_at GSR glutathione reductase 242972_at CDNA FLJ46556 fis, clone THYMU3039807 239811_at MLL5 Myeloid/lymphoid or mixed-lineage leukemia 5 (trithorax homolog, Drosophila) 201027_s_at EIF5B eukaryotic translation initiation factor 5B 233742_at MGC2654 LP8272 1556323_at CUGBP2 CUG triplet repeat, RNA binding protein 2 202926_at NAG neuroblastoma-amplified protein 220966_x_at ARPC5L actin related protein 2/3 complex, subunit 5-like /// actin related protein 2/3 complex, subunit 5-like 1552302_at MGC20235 hypothetical protein MGC20235 238787_at Transcribed locus 213505_s_at SFRS14 splicing factor, arginine/serine-rich 14 1555920_at CBX3 Chromobox homolog 3 (HP1 gamma homolog, Drosophila) 207186_s_at FALZ fetal Alzheimer antigen 210426_x_at RORA RAR-related orphan receptor A 1559993_at --- 201602_s_at PPP1R12A protein phosphatase 1, regulatory (inhibitor) subunit 12A 216088_s_at PSMA7 proteasome (prosome, macropain) subunit, alpha type, 7 236254_at VPS13B vacuolar protein sorting 13B (yeast) 204731_at TGFBR3 transforming growth factor, beta receptor III (betaglycan, 300kDa) 202269_x_at GBP1 guanylate binding protein 1, interferon-inducible, 67kDa///guanylate binding protein 1, interferon-inducible, 67kDa 216981_x_at SPN sialophorin (gpL115, leukosialin, CD43) 212007_at UBXD2 UBX domain containing 2 217755_at HN1 hematological and neurological expressed 1 213940_s_at FNBP1 formin binding protein 1 201831_s_at VDP vesicle docking protein p115 225041_at HSMPP8 M-phase phosphoprotein, mpp8 1552584_at IL12RB1 interleukin 12 receptor, beta 1 206133_at BIRC4BP XIAP associated factor-1 229625_at GBP5 Guanylate binding protein 5 206500_s_at C14orf106 chromosome 14 open reading frame 106 201881_s_at ARIH1 ariadne homolog, ubiquitin-conjugating enzyme E2 binding protein, 1 (Drosophila) 202323_s_at ACBD3 acyl-Coenzyme A binding domain containing 3 204021_s_at PURA purine-rich element binding protein A 215313_x_at HLA-A major histocompatibility complex, class I, A 207966_s_at GLG1 golgi apparatus protein 1 235461_at FLJ20032 hypothetical protein FLJ20032 223983_s_at C19orf12 chromosome 19 open reading frame 12 202021_x_at EIF1 eukaryotic translation initiation factor 1 231577_s_at GBP1 guanylate binding protein 1, interferon-inducible, 67kDa 218927_s_at CHST12 carbohydrate (chondroitin 4) sulfotransferase 12 


TABLE 12A Gene symbol GenBank Accession Number 3-gene signature 3-gene signature CDKN1C gi|169790897|ref|NM_000076.2| Gene symbol GenBank Accession Number TCF7L2 gi|170014695|ref|NM_030756.3 TOP1 NM_003286 CLC gi|20357558|ref|NM_001828.4| CD24 NM_013230 STAP1 NM_012108 WFS1 NM_006005 TSPAN8 NM_004616 10-gene signature THADA NM_022065 Gene symbol GenBank Accession Number TCF7L2 NM_030756 SLC30A8 NM_173851 TULP4 NM_020245 PPARG NM_138712 AA741300 AA741300 NOTCH2 NM_024408 ESCO1 NM_052911 LGR5 NM_003667 EIF5B NM_015904 KCNJ11 NM_000525 ACTR2 NM_001005386 JAZF1 NM_175061 WNK1 NM_018979 IGF2BP2 NM_001007225 COCH NM_004086 HHEX-IDE NM_002729, NM_004969 SON NM_138927 FTO NM_001080432 TPR NM_003292 CDKN2B NM_078487 NOG NM_005450 CDKN2A NM_058195 CDC123 NM_006023 CAMK1 D NM_153498 ADAMTS9 NM_182920 TABLE 12B 3-gene signature Gene Symbol Accession Upper primer Sequence Probe Sequence Lower primer Sequence TOP1 NM_003286 CCCTGTACTTCATCGACAAGC AGCAGCAGCCCACAGTGT AGAGCAGGCAATGAAAAGGAGGAAG CD24 NM_013230 GCCAGGGCAATGATGAATG CTCAATATGGATAATCAAGAGTTGCT TCTACCCCCAGATCCAAGCAGCCT STAP1 NM_012108 TGAAAAGAACTGTGCGAAATTC CACTTTCTGTGTTCTCTGTCTTCAG CCTTGTTTTGCCGAAAGAGGAAGTACA STAP1-331F22 TGAAAAGAACTGTGCGAAATTC STAP1-407R25 CACTTTCTGTGTTCTCTGTCTTCAG STAP1-355P27 CCTTGTTTTGCCGAAAGAGGAAGTACA CD24_996_U19 GCCAGGGCAATGATGAATG CD24_1069_L26 CTCAATATGGATAATCAAGAGTTGCT CD24_1019_P24 TCTACCCCCAGATCCAAGCAGCCT TOP1_1679_U22 CCCTGTACTTCATCGACAAGC TOP1_1762_L18 AGCAGCAGCCCACAGTGT TOP1_1708_P26 AGAGCAGGCAATGAAAAGGAGGAAG TABLE 12C 10-gene signature Gene Symbol Upper primer Sequence Probe Sequence Lower primer Sequence TULP4 GAAGAGTGTGTGTCTATGTGCATT TAAA CAAGTTGCTCCATCTGATTCTTA AATT CACATTCACACGGGAAGACAGGCT CA AA741300 Not available ESCO1 CTAAACGGCAGCACAAAAGGA CATGTCTTATGGCTAACACGTTT CTT TGCAAACCAACAGACTCAGCAAAC AAGG EIF5B CAGCCAAGGCATCAAGATCA GAGCGCCATTGACAAGCAAT TCATCCTTGGTGCTGTCTTCGCTCT TGTT ACTR2 CATTCAACTCCAGGACATGGAA TCCCCAAGACACCAGAATAAAA CT AGGCCTCTCTCTGCCCTTTGACTG GA WNK1 GCATGCTTGAGATGGCTACATC TGGTCACGCGACGGTAGAT TCCTTACTCGGAGTGCCAAAATGCT GC COCH CCATTTAGGCAAATAAGCACTCCTT GCCTCAGCAGTGTTTTTAACAAA G AAGCCGCTGCCTTCTGGTTACAATT TACA SON GCTCTGCTCAGCCCTAAAGAAA TCCTCAATATTGGCAGAAAATCC T CCTCCCCCTCCTAAAGAGACACTG CCTG TPR CTGCCCAAGTCTGTCCAGAAC CCTGACTGTGGGACAACCTCTT ATCAGCAATCCGAGATCGATGGCC T NOG CACCCGGACACTTGATCGAT GTTCATTGAAAACCCTCGCTAG A ACCGCCTCCAACCAGTTCCACCAC Gene Symbol Primer sequences Gene Symbol Primer sequences TULP4-F1 GAAGAGTGTGTGTCTATGTGCATT TAAA COCH-F1 CCATTTAGGCAAATAAGCACTCCTT TULP4-R1 CAAGTTGCTCCATCTGATTCTTAAA TT COCH-R1 GCCTCAGCAGTGTTTTTAACAAAG TULP4-Pro1 CACATTCACACGGGAAGACAGGCT CA COCH-Pro1 AAGCCGCTGCCTTCTGGTTACAATTT ACA ESCO1-F CTAAACGGCAGCACAAAAGGA SON-F1 GCTCTGCTCAGCCCTAAAGAAA ESCO1-R CATGTCTTATGGCTAACACGTTTCT T SON-R1 TCCTCAATATTGGCAGAAAATCCT ESCO1-Pro2 TGCAAACCAACAGACTCAGCAAAC AAGG SON-Pro1 CCTCCCCCTCCTAAAGAGACACTGC CTG NOG-F1 CACCCGGACACTTGATCGAT EIF5B-F1 CAGCCAAGGCATCAAGATCA NOG-R1 GTTCATTGAAAACCCTCGCTAGA EIF5B-R1 GAGCGCCATTGACAAGCAAT NOG-Pro1 ACCGCCTCCAACCAGTTCCACCAC EIF5B-Pro1 TCATCCTTGGTGCTGTCTTCGCTCTT GTT WNK1-F1 GCATGCTTGAGATGGCTACATC ACTR2-F1 CATTCAACTCCAGGACATGGAA WNK1-R1 TGGTCACGCGACGGTAGAT ACTR2-R1 TCCCCAAGACACCAGAATAAAACT WNK1-Pro1 TCCTTACTCGGAGTGCCAAAATGC TGC ACTR2-Pro1 AGGCCTCTCTCTGCCCTTTGACTGG A TPR-F1 CTGCCCAAGTCTGTCCAGAAC TPR-R1 CCTGACTGTGGGACAACCTCTT TPR-Pro1 ATCAGCAATCCGAGATCGATGGCCT -
- <110> Veridex, LLC
- <120> DIAGNOSTIC BIOMARKERS OF DIABETES
- <130> P060769EP
- <140> EP__
<141> 2008-11-13 - <150>
PCT/US2008/083424
<151> 2008-11-13 - <150>
US 60/987,540
<151> 2007-11-13 - <160> 87
- <170> PatentIn version 3.5
- <210> 1
<211> 21
<212> DNA
<213> Homo sapiens - <400> 1
ccctgtactt catcgacaag c 21 - <210> 2
<211> 19
<212> DNA
<213> Homo sapiens - <400> 2
gccagggcaa tgatgaatg 19 - <210> 3
<211> 22
<212> DNA
<213> Homo sapiens - <400> 3
tgaaaagaac tgtgcgaaattc 22 - <210> 4
<211> 18
<212> DNA
<213> Homo sapiens - <400> 4
agcagcagcc cacagtgt 18 - <210> 5
<211> 26
<212> DNA
<213> Homo sapiens - <400> 5
ctcaatatgg ataatcaaga gttgct 26 - <210> 6
<211> 25
<212> DNA
<213> Homo sapiens - <400> 6
cactttctgt gttctctgtc ttcag 25 - <210> 7
<211> 25
<212> DNA
<213> Homo sapiens - <400> 7
agagcaggca atgaaaagga ggaag 25 - <210> 8
<211> 24
<212> DNA
<213> Homo sapiens - <400> 8
tctaccccca gatccaagca gcct 24 - <210> 9
<211> 27
<212> DNA
<213> Homo sapiens - <400> 9
ccttgttttg ccgaaagagg aagtaca 27 - <210> 10
<211> 22
<212> DNA
<213> Homo sapiens - <400> 10
tgaaaagaac tgtgcgaaattc 22 - <210> 11
<211> 25
<212> DNA
<213> Homo sapiens - <400> 11
cactttctgt gttctctgtc ttcag 25 - <210> 12
<211> 27
<212> DNA
<213> Homo sapiens - <400> 12
ccttgttttg ccgaaagagg aagtaca 27 - <210> 13
<211> 19
<212> DNA
<213> Homo sapiens - <400> 13
gccagggcaa tgatgaatg 19 - <210> 14
<211> 26
<212> DNA
<213> Homo sapiens - <400> 14
ctcaatatgg ataatcaaga gttgct 26 - <210> 15
<211> 24
<212> DNA
<213> Homo sapiens - <400> 15
tctaccccca gatccaagca gcct 24 - <210> 16
<211> 21
<212> DNA
<213> Homo sapiens - <400> 16
ccctgtactt catcgacaag c 21 - <210> 17
<211> 18
<212> DNA
<213> Homo sapiens - <400> 17
agcagcagcc cacagtgt 18 - <210> 18
<211> 25
<212> DNA
<213> Homo sapiens - <400> 18
agagcaggca atgaaaagga ggaag 25 - <210> 19
<211> 28
<212> DNA
<213> Homo sapiens - <400> 19
gaagagtgtg tgtctatgtg catttaaa 28 - <210> 20
<211> 21
<212> DNA
<213> Homo sapiens - <400> 20
ctaaacggca gcacaaaagg a 21 - <210> 21
<211> 20
<212> DNA
<213> Homo sapiens - <400> 21
cagccaaggc atcaagatca 20 - <210> 22
<211> 22
<212> DNA
<213> Homo sapiens - <400> 22
cattcaactc caggacatggaa 22 - <210> 23
<211> 22
<212> DNA
<213> Homo sapiens - <400> 23
gcatgcttga gatggctaca tc 22 - <210> 24
<211> 25
<212> DNA
<213> Homo sapiens - <400> 24
ccatttaggc aaataagcac tcctt 25 - <210> 25
<211> 22
<212> DNA
<213> Homo sapiens - <400> 25
gctctgctca gccctaaagaaa 22 - <210> 26
<211> 21
<212> DNA
<213> Homo sapiens - <400> 26
ctgcccaagt ctgtccagaa c 21 - <210> 27
<211> 20
<212> DNA
<213> Homo sapiens - <400> 27
cacccggaca cttgatcgat 20 - <210> 28
<211> 27
<212> DNA
<213> Homo sapiens - <400> 28
caagttgctc catctgattc ttaaatt 27 - <210> 29
<211> 26
<212> DNA
<213> Homo sapiens - <400> 29
catgtcttat ggctaacacg tttctt 26 - <210> 30
<211> 20
<212> DNA
<213> Homo sapiens - <400> 30
gagcgccatt gacaagcaat 20 - <210> 31
<211> 24
<212> DNA
<213> Homo sapiens - <400> 31
tccccaagac accagaataa aact 24 - <210> 32
<211> 19
<212> DNA
<213> Homo sapiens - <400> 32
tggtcacgcg acggtagat 19 - <210> 33
<211> 24
<212> DNA
<213> Homo sapiens - <400> 33
gcctcagcag tgtttttaac aaag 24 - <210> 34
<211> 24
<212> DNA
<213> Homo sapiens - <400> 34
tcctcaatat tggcagaaaa tcct 24 - <210> 35
<211> 22
<212> DNA
<213> Homo sapiens - <400> 35
cctgactgtg ggacaacctctt 22 - <210> 36
<211> 23
<212> DNA
<213> Homo sapiens - <400> 36
gttcattgaa aaccctcgct aga 23 - <210> 37
<211> 26
<212> DNA
<213> Homo sapiens - <400> 37
cacattcaca cgggaagaca ggctca 26 - <210> 38
<211> 28
<212> DNA
<213> Homo sapiens - <400> 38
tgcaaaccaa cagactcagc aaacaagg 28 - <210> 39
<211> 29
<212> DNA
<213> Homo sapiens - <400> 39
tcatccttgg tgctgtcttc gctcttgtt 29 - <210> 40
<211> 26
<212> DNA
<213> Homo sapiens - <400> 40
aggcctctct ctgccctttg actgga 26 - <210> 41
<211> 27
<212> DNA
<213> Homo sapiens - <400> 41
tccttactcg gagtgccaaa atgctgc 27 - <210> 42
<211> 29
<212> DNA
<213> Homo sapiens - <400> 42
aagccgctgc cttctggtta caatttaca 29 - <210> 43
<211> 28
<212> DNA
<213> Homo sapiens - <400> 43
cctccccctc ctaaagagac actgcctg 28 - <210> 44
<211> 25
<212> DNA
<213> Homo sapiens - <400> 44
atcagcaatc cgagatcgat ggcct 25 - <210> 45
<211> 24
<212> DNA
<213> Homo sapiens - <400> 45
accgcctcca accagttcca ccac 24 - <210> 46
<211> 28
<212> DNA
<213> Homo sapiens - <400> 46
gaagagtgtg tgtctatgtg catttaaa 28 - <210> 47
<211> 27
<212> DNA
<213> Homo sapiens - <400> 47
caagttgctc catctgattc ttaaatt 27 - <210> 48
<211> 26
<212> DNA
<213> Homo sapiens - <400> 48
cacattcaca cgggaagaca ggctca 26 - <210> 49
<211> 21
<212> DNA
<213> Homo sapiens - <400> 49
ctaaacggca gcacaaaagg a 21 - <210> 50
<211> 26
<212> DNA
<213> Homo sapiens - <400> 50
catgtcttat ggctaacacg tttctt 26 - <210> 51
<211> 28
<212> DNA
<213> Homo sapiens - <400> 51
tgcaaaccaa cagactcagc aaacaagg 28 - <210> 52
<211> 20
<212> DNA
<213> Homo sapiens - <400> 52
cacccggaca cttgatcgat 20 - <210> 53
<211> 23
<212> DNA
<213> Homo sapiens - <400> 53
gttcattgaa aaccctcgct aga 23 - <210> 54
<211> 24
<212> DNA
<213> Homo sapiens - <400> 54
accgcctcca accagttcca ccac 24 - <210> 55
<211> 22
<212> DNA
<213> Homo sapiens - <400> 55
gcatgcttga gatggctaca tc 22 - <210> 56
<211> 19
<212> DNA
<213> Homo sapiens - <400> 56
tggtcacgcg acggtagat 19 - <210> 57
<211> 27
<212> DNA
<213> Homo sapiens - <400> 57
tccttactcg gagtgccaaa atgctgc 27 - <210> 58
<211> 25
<212> DNA
<213> Homo sapiens - <400> 58
ccatttaggc aaataagcac tcctt 25 - <210> 59
<211> 24
<212> DNA
<213> Homo sapiens - <400> 59
gcctcagcag tgtttttaac aaag 24 - <210> 60
<211> 29
<212> DNA
<213> Homo sapiens - <400> 60
aagccgctgc cttctggtta caatttaca 29 - <210> 61
<211> 22
<212> DNA
<213> Homo sapiens - <400> 61
gctctgctca gccctaaagaaa 22 - <210> 62
<211> 24
<212> DNA
<213> Homo sapiens - <400> 62
tcctcaatat tggcagaaaa tcct 24 - <210> 63
<211> 28
<212> DNA
<213> Homo sapiens - <400> 63
cctccccctc ctaaagagac actgcctg 28 - <210> 64
<211> 20
<212> DNA
<213> Homo sapiens - <400> 64
cagccaaggc atcaagatca 20 - <210> 65
<211> 20
<212> DNA
<213> Homo sapiens - <400> 65
gagcgccatt gacaagcaat 20 - <210> 66
<211> 29
<212> DNA
<213> Homo sapiens - <400> 66
tcatccttgg tgctgtcttc gctcttgtt 29 - <210> 67
<211> 22
<212> DNA
<213> Homo sapiens - <400> 67
cattcaactc caggacatggaa 22 - <210> 68
<211> 24
<212> DNA
<213> Homo sapiens - <400> 68
tccccaagac accagaataa aact 24 - <210> 69
<211> 26
<212> DNA
<213> Homo sapiens - <400> 69
aggcctctct ctgccctttg actgga 26 - <210> 70
<211> 21
<212> DNA
<213> Homo sapiens - <400> 70
ctgcccaagt ctgtccagaa c 21 - <210> 71
<211> 22
<212> DNA
<213> Homo sapiens - <400> 71
cctgactgtg ggacaacctctt 22 - <210> 72
<211> 25
<212> DNA
<213> Homo sapiens - <400> 72
atcagcaatc cgagatcgat ggcct 25 - <210> 73
<211> 22
<212> DNA
<213> Homo sapiens - <400> 73
acctgagcgc tcctaagaaa tg 22 - <210> 74
<211> 19
<212> DNA
<213> Homo sapiens - <400> 74
agggccgcac cagttattc 19 - <210> 75
<211> 23
<212> DNA
<213> Artificial Sequence - <220>
<223> Taqman probe - <220>
<221> misc_feature
<222> (1)..(1)
<223> 6-carboxyfluorescein (FAM)-dATP - <220>
<221> misc_feature
<222> (23) .. (23)
<223> dCMP - BHQ1 (Black Hole Quencher-1) - <400> 75
ngcgcgcttt ggccttgatc aan 23 - <210> 76
<211> 23
<212> DNA
<213> Homo sapiens - <400> 76
cgtcgacttc ttggttacat tcc 23 - <210> 77
<211> 26
<212> DNA
<213> Homo sapiens - <400> 77
cacgacgcta aagctattct aaagac 26 - <210> 78
<211> 21
<212> DNA
<213> Artificial Sequence - <220>
<223> Taqman probe - <220>
<221> misc_feature
<222> (1)..(1)
<223> 6-carboxyfluorescein (FAM)-dCTP - <220>
<221> misc_feature
<222> (21) .. (21)
<223> dCMP - BHQ1 (Black Hole Quencher-1) - <400> 78
nagccgctgt cgctcgtcac n 21 - <210> 79
<211> 18
<212> DNA
<213> Homo sapiens - <400> 79
gaaagcgcgg ccatcaac 18 - <210> 80
<211> 23
<212> DNA
<213> Homo sapiens - <400> 80
cagctcgtag tatttcgctt get 23 - <210> 81
<211> 21
<212> DNA
<213> Artificial Sequence - <220>
<223> Taqman probe - <220>
<221> misc_feature
<222> (1)..(1)
<223> 6-carboxyfluorescein (FAM)-dTTP - <220>
<221> misc_feature
<222> (21) .. (21)
<223> dGMP - BHQ1 (Black Hole Quencher-1) - <400> 81
nccttgggcg gaggtggcat n 21 - <210> 82
<211> 21
<212> DNA
<213> Homo sapiens - <400> 82
gctacccgtg ccatacacag a 21 - <210> 83
<211> 25
<212> DNA
<213> Homo sapiens - <400> 83
gcagatatgg ttcattcaag aaaca 25 - <210> 84
<211> 28
<212> DNA
<213> Artificial Sequence - <220>
<223> Taqman probe - <220>
<221> misc_feature
<222> (1)..(1)
<223> 6-carboxyfluorescein (FAM)-dTTP - <220>
<221> misc_feature
<222> (28) .. (28)
<223> dAMP - BHQ1 (Black Hole Quencher-1) - <400> 84
ntctactgtg acaatcaaag ggcgaccn 28 - <210> 85
<211> 18
<212> DNA
<213> Homo sapiens - <400> 85
cctggcaccc agcacaat 18 - <210> 86
<211> 21
<212> DNA
<213> Homo sapiens - <400> 86
gccgatccac acggagtact t 21 - <210> 87
<211> 27
<212> DNA
<213> Artificial Sequence - <220>
<223> Taqman probe - <220>
<221> misc_feature
<222> (1)..(1)
<223> 6-carboxyfluorescein (FAM)-dATP - <220>
<221> misc_feature
<222> (27)..(27)
<223> dCMP - BHQ1 (Black Hole Quencher-1) - <400> 87
ntcaagatca ttgctcctcc tgagcgn 27
Claims (10)
- A method of diagnosing Diabetes Mellitus in a patient comprising the steps of:a. measuring the gene expression profile of a gene signature comprising the TULP4, AA741300, ESCO1, EIF5B, ACTR2, WNK1, COCH, SON, TPR and NOG genes in a test sample taken from a patient; andb. comparing said gene expression profile with a diagnostic gene expression profile of said gene signature;c. determining a diabetic disease state in said patient based at least in part upon a substantial match between said gene expression profile and said diagnostic gene expression profile; andd. displaying said determination to a medical professional.
- A method of diagnosing a change in the diabetic disease state of a patient comprising the steps of:a. measuring a first expression profile of a gene signature in a first test sample taken at a first time point, said gene signature comprising the TULP4, AA741300, ESCO1, EIF5B, ACTR2, WNK1, COCH, SON, TPR and NOG genes;b. measuring a second expression profile of said gene signature in a second test sample taken at a second time point;c. comparing said first expression profile with said second expression profile;d. determining a change in the diabetic disease state in said patient based at least in part upon a substantial difference between said first gene expression profile and said second gene expression profile; ande. displaying said determination to a medical professional.
- The method according to claim 1 or 2, wherein said determining step is executed by a computer system, said computer system running one or more algorithms selected from the group consisting of Linear combination of gene expression signals, Linear regression model, Logistic regression model, Linear discrimination analysis (LDA) model, The nearest neighbor model and the Prediction Analysis of Microarrays (PAM).
- The method according to any one of claims 1 to 3, wherein said determining step further comprises an analysis of the patient's metabolic disease profile.
- The method according to any one of claims 1 to 4, wherein said diabetic disease state is a pre-diabetic disease state or a Type 2 Diabetes disease state.
- The method according to any one of any claims 1 to 5, wherein said test sample is a blood sample.
- The method according to any one of claims 1 to 6, wherein said test sample comprises PBMCs or CD11c+ or CD11b+ or Emr+ or [CD11b+CD11c+] or [Emr+ CD11b+] or [Emr+CD11c+] or [Emr+CD11b+CD11c+] cells or CD14+ monocytes.
- The method according to any one of claims 1 to 7, wherein said measuring step involves real-time PCR, an immunochemical assay or specific oligonucleotide hybridization.
- The use of a kit for assessing a patient's susceptibility to Diabetes in which the assessment is made with a test apparatus, the kit comprising:a. reagents for collecting a test sample from a patient; andb. reagents for measuring the gene expression profile of a gene signature comprising the TULP4, AA741300, ESCO1, EIF5B, ACTR2, WNK1, COCH, SON, TPR and NOG genes in a patient's test sample, wherein the reagents are for: (i) real-time PCR, wherein said reagents comprise primers for the amplification and detection of the gene expression profile, or (ii) an immunochemical assay, wherein said reagents comprise antibodies for the detection of the TULP4, AA741300, ESCO1, EIF5B, ACTR2, WNK1, COCH, SON, TPR and NOG proteins; and packaging therefor.
- The use of claim 9, wherein said reagents for collecting a test sample are reagents for collecting a blood sample.
Applications Claiming Priority (2)
| Application Number | Priority Date | Filing Date | Title |
|---|---|---|---|
| US98754007P | 2007-11-13 | 2007-11-13 | |
| EP08849756.5A EP2215266B1 (en) | 2007-11-13 | 2008-11-13 | Diagnostic biomarkers of diabetes |
Related Parent Applications (3)
| Application Number | Title | Priority Date | Filing Date |
|---|---|---|---|
| EP08849756.5A Division EP2215266B1 (en) | 2007-11-13 | 2008-11-13 | Diagnostic biomarkers of diabetes |
| EP08849756.5A Division-Into EP2215266B1 (en) | 2007-11-13 | 2008-11-13 | Diagnostic biomarkers of diabetes |
| EP08849756.5 Division | 2008-11-13 |
Publications (2)
| Publication Number | Publication Date |
|---|---|
| EP2584050A1 EP2584050A1 (en) | 2013-04-24 |
| EP2584050B1 true EP2584050B1 (en) | 2017-05-31 |
Family
ID=40510430
Family Applications (2)
| Application Number | Title | Priority Date | Filing Date |
|---|---|---|---|
| EP08849756.5A Not-in-force EP2215266B1 (en) | 2007-11-13 | 2008-11-13 | Diagnostic biomarkers of diabetes |
| EP13151356.6A Not-in-force EP2584050B1 (en) | 2007-11-13 | 2008-11-13 | Diagnostic biomarkers of diabetes |
Family Applications Before (1)
| Application Number | Title | Priority Date | Filing Date |
|---|---|---|---|
| EP08849756.5A Not-in-force EP2215266B1 (en) | 2007-11-13 | 2008-11-13 | Diagnostic biomarkers of diabetes |
Country Status (11)
| Country | Link |
|---|---|
| US (3) | US20110275079A1 (en) |
| EP (2) | EP2215266B1 (en) |
| JP (1) | JP2011502537A (en) |
| KR (1) | KR101591738B1 (en) |
| CN (1) | CN101918589B (en) |
| BR (1) | BRPI0820557A2 (en) |
| CA (1) | CA2705195A1 (en) |
| ES (1) | ES2635429T3 (en) |
| IL (1) | IL205353A (en) |
| MX (1) | MX2010005281A (en) |
| WO (1) | WO2009064901A2 (en) |
Families Citing this family (23)
| Publication number | Priority date | Publication date | Assignee | Title |
|---|---|---|---|---|
| US9034587B2 (en) * | 2007-12-10 | 2015-05-19 | The Medical Research, Infrastructure and Health Services Fund of the Tel Aviv Medical Center | Methods of diagnosing cancer |
| CA2763199A1 (en) * | 2009-05-29 | 2010-12-02 | The Regents Of The Univeristy Of California | B cell signature associated with tolerance in transplant recipients |
| AU2010308329B2 (en) * | 2009-10-19 | 2016-10-13 | Labrador Diagnostics Llc | Integrated health data capture and analysis system |
| WO2012005764A2 (en) * | 2010-07-08 | 2012-01-12 | Prime Genomics, Inc. | System for the quantification of system-wide dynamics in complex networks |
| WO2014019408A1 (en) * | 2012-08-01 | 2014-02-06 | Bgi Shenzhen | Biomarkers for diabetes and usages thereof |
| AP2015008447A0 (en) * | 2012-10-18 | 2015-05-31 | Fio Corp | Virtual diagnostic test panel device, system, method and computer readable medium |
| EP3027115B1 (en) * | 2013-08-02 | 2023-09-06 | Echosens | Non-invasive system for calculating a human or animal, reliable, standardized and complete score |
| EP2942356B1 (en) * | 2014-05-05 | 2017-08-23 | Medizinische Hochschule Hannover | Mutation for type 1 diabetes mellitus and animal model |
| KR101658134B1 (en) | 2014-09-30 | 2016-09-21 | 연세대학교 산학협력단 | Diagnosis or screening in diabetes using PBMC metabolites or Lp-PLA2 activity |
| KR101893244B1 (en) | 2015-05-22 | 2018-08-30 | 가천대학교 산학협력단 | Novel Biomarker Indicative of Diabetes and Their Uses |
| WO2017032815A2 (en) * | 2015-08-24 | 2017-03-02 | Helmholtz Zentrum München - Deutsches Forschungszentrum für Gesundheit und Umwelt (GmbH) | Biomarkers for cardiometabolic diseases |
| CN106609301B (en) * | 2015-10-26 | 2019-10-25 | 北京大学人民医院 | A kit for auxiliary diagnosis of type 1 diabetes |
| CN107358047A (en) * | 2017-07-13 | 2017-11-17 | 刘峰 | Diabetic assesses and management system |
| CN110527717B (en) * | 2018-01-31 | 2023-08-18 | 完美(广东)日用品有限公司 | Biomarkers for type 2 diabetes and uses thereof |
| CN108707661B (en) * | 2018-07-03 | 2021-03-23 | 张罗 | Application of specific primer of CLC gene in preparation of kit for detecting chronic nasosinusitis accompanied with nasal polyp subtype |
| WO2020037174A1 (en) | 2018-08-16 | 2020-02-20 | The Johns Hopkins University | Antibodies to human znt8 |
| KR101977410B1 (en) | 2018-08-22 | 2019-05-10 | 주식회사 피플바이오 | Novel Biomarker Indicative of Diabetes and Their Uses |
| CN109182508A (en) * | 2018-10-22 | 2019-01-11 | 北京华夏时代生物工程有限公司 | The fluorescence in situ hybridization sequencing approach of TCF7L2 gene mononucleotide polymorphism |
| US12366570B2 (en) | 2019-10-01 | 2025-07-22 | The Johns Hopkins University | Cell-based ZNT8 assay |
| CN114965753B (en) * | 2022-05-13 | 2026-03-31 | 重庆医科大学附属第一医院 | Application of an LGALS3BP protein abundance detection reagent in the preparation of diagnostic reagents for gestational diabetes mellitus tears |
| CN115851943A (en) * | 2022-11-17 | 2023-03-28 | 杭州艾迪康医学检验中心有限公司 | Reagent and method for detecting TOP1 gene expression level |
| CN122017253A (en) * | 2026-02-12 | 2026-05-12 | 首都医科大学附属北京朝阳医院 | Marker combination for diagnosis or prognosis evaluation of diabetes and application thereof |
| CN121874348B (en) * | 2026-03-11 | 2026-07-17 | 中南大学 | Application of reagent for detecting or inhibiting TCF7L2-Exon14 shear isomer and oral cancer therapeutic drug |
Family Cites Families (12)
| Publication number | Priority date | Publication date | Assignee | Title |
|---|---|---|---|---|
| US20040265869A1 (en) * | 1999-01-06 | 2004-12-30 | Chondrogene Limited | Method for the detection of type II diabetes related gene transcripts in blood |
| WO2002022886A2 (en) | 2000-09-18 | 2002-03-21 | Wisconsin Alumni Research Foundation | Expression of genes in diabetes mellitus and insulin resistance |
| US20030036077A1 (en) * | 2001-05-31 | 2003-02-20 | Chronix Biomedical | Methods for generating an mRNA expression profile from an ecellular mRNA containing blood sample and using the same to identify functional state markers |
| US20070054269A1 (en) * | 2001-07-10 | 2007-03-08 | Mendrick Donna L | Molecular cardiotoxicology modeling |
| US20040146894A1 (en) * | 2002-10-14 | 2004-07-29 | Warrington Janet A. | Methods of diagnosing and treating stress urinary incontinence |
| US20060019256A1 (en) * | 2003-06-09 | 2006-01-26 | The Regents Of The University Of Michigan | Compositions and methods for treating and diagnosing cancer |
| US20050112584A1 (en) * | 2003-11-20 | 2005-05-26 | Cifuentes Francisco J. | Methods for evaluating tissue pair combinations for use in nucleic acid array technology |
| EP1538219A1 (en) * | 2003-12-04 | 2005-06-08 | Erasmus University Medical Center Rotterdam | Method to diagnose or screen for type 1 diabetes mellitus |
| WO2006060653A2 (en) * | 2004-11-30 | 2006-06-08 | Veridex Llc | Lung cancer prognostics |
| US20070099209A1 (en) * | 2005-06-13 | 2007-05-03 | The Regents Of The University Of Michigan | Compositions and methods for treating and diagnosing cancer |
| WO2007128884A1 (en) * | 2006-05-09 | 2007-11-15 | Oy Jurilab Ltd | Novel genes and markers in type 2 diabetes and obesity |
| FR2910025A1 (en) * | 2006-12-19 | 2008-06-20 | Biomerieux Sa | METHOD FOR THE DIAGNOSIS OF DIABETES |
-
2008
- 2008-11-13 WO PCT/US2008/083424 patent/WO2009064901A2/en not_active Ceased
- 2008-11-13 US US12/742,920 patent/US20110275079A1/en not_active Abandoned
- 2008-11-13 EP EP08849756.5A patent/EP2215266B1/en not_active Not-in-force
- 2008-11-13 JP JP2010534182A patent/JP2011502537A/en active Pending
- 2008-11-13 EP EP13151356.6A patent/EP2584050B1/en not_active Not-in-force
- 2008-11-13 KR KR1020107012926A patent/KR101591738B1/en not_active Expired - Fee Related
- 2008-11-13 BR BRPI0820557A patent/BRPI0820557A2/en not_active Application Discontinuation
- 2008-11-13 CN CN200880115967.7A patent/CN101918589B/en not_active Expired - Fee Related
- 2008-11-13 MX MX2010005281A patent/MX2010005281A/en active IP Right Grant
- 2008-11-13 ES ES13151356.6T patent/ES2635429T3/en active Active
- 2008-11-13 CA CA2705195A patent/CA2705195A1/en not_active Abandoned
-
2010
- 2010-04-26 IL IL205353A patent/IL205353A/en active IP Right Grant
-
2012
- 2012-12-04 US US13/693,306 patent/US20130217011A1/en not_active Abandoned
-
2015
- 2015-05-13 US US14/711,127 patent/US20160138103A1/en not_active Abandoned
Also Published As
| Publication number | Publication date |
|---|---|
| JP2011502537A (en) | 2011-01-27 |
| IL205353A (en) | 2015-02-26 |
| CN101918589A (en) | 2010-12-15 |
| BRPI0820557A2 (en) | 2017-03-28 |
| US20110275079A1 (en) | 2011-11-10 |
| CN101918589B (en) | 2016-08-17 |
| KR101591738B1 (en) | 2016-02-04 |
| IL205353A0 (en) | 2010-12-30 |
| WO2009064901A3 (en) | 2009-09-24 |
| US20160138103A1 (en) | 2016-05-19 |
| EP2215266A2 (en) | 2010-08-11 |
| KR20100093562A (en) | 2010-08-25 |
| MX2010005281A (en) | 2010-08-09 |
| EP2584050A1 (en) | 2013-04-24 |
| ES2635429T3 (en) | 2017-10-03 |
| WO2009064901A2 (en) | 2009-05-22 |
| CA2705195A1 (en) | 2009-05-22 |
| EP2215266B1 (en) | 2015-01-14 |
| US20130217011A1 (en) | 2013-08-22 |
Similar Documents
| Publication | Publication Date | Title |
|---|---|---|
| EP2584050A1 (en) | Diagnostic biomarkers of diabetes | |
| US20230227911A1 (en) | Methods for Diagnosis of Sepsis | |
| EP3481964B1 (en) | Biomarkers for inflammatory bowel disease | |
| CA2923700A1 (en) | Methods and systems for analysis of organ transplantation | |
| CN105339797B (en) | Prognosis prediction diagnosis gene marker of early-stage breast cancer and application thereof | |
| KR102110039B1 (en) | Biomarker microRNA-26b or microRNA-4449 for diagnosing obesity and use thereof | |
| AU2010233846A1 (en) | Method for in vitro diagnosing a complex disease | |
| EP3129496A1 (en) | Molecular predictors of sepsis | |
| US20140100125A1 (en) | Methods, Kits and Compositions for Determining Severity and Survival of Heart Failure in a Subject | |
| US20250218537A1 (en) | Methods for diagnosing myocardial infarction | |
| US20250137066A1 (en) | Compostions and methods for diagnosing lung cancers using gene expression profiles | |
| EP3825416A2 (en) | Gene expression profiles associated with sub-clinical kidney transplant rejection | |
| EP3825417A2 (en) | Tissue molecular signatures of kidney transplant rejections | |
| CA2674211A1 (en) | Methods and kits for diagnosis and/or prognosis of the tolerant state in liver transplantation | |
| AU2021221905B2 (en) | Gene expression profiles associated with sub-clinical kidney transplant rejection | |
| Satake et al. | Preanalytical considerations in quantifying circulating miRNAs that predict end-stage kidney disease in diabetes | |
| WO2009049257A2 (en) | Predictive models and methods for diagnosing and assessing coronary artery disease | |
| US20120264633A1 (en) | Methods for detecting thrombocytosis using biomarkers | |
| JP2021175381A (en) | How to detect atopic dermatitis | |
| WO2025172242A1 (en) | Method of assessing the risk of death of a patient |
Legal Events
| Date | Code | Title | Description |
|---|---|---|---|
| PUAI | Public reference made under article 153(3) epc to a published international application that has entered the european phase |
Free format text: ORIGINAL CODE: 0009012 |
|
| AC | Divisional application: reference to earlier application |
Ref document number: 2215266 Country of ref document: EP Kind code of ref document: P |
|
| AK | Designated contracting states |
Kind code of ref document: A1 Designated state(s): AT BE BG CH CY CZ DE DK EE ES FI FR GB GR HR HU IE IS IT LI LT LU LV MC MT NL NO PL PT RO SE SI SK TR |
|
| RIN1 | Information on inventor provided before grant (corrected) |
Inventor name: DERECHO, CARLO Inventor name: VENER, TATIANA Inventor name: YU, JACK X. Inventor name: LEE, DONG U. Inventor name: ZHANG, YI Inventor name: WANG, YIXIN Inventor name: BACKUS, JOHN W. Inventor name: PALMA, JOHN F. |
|
| RIN1 | Information on inventor provided before grant (corrected) |
Inventor name: WANG, YIXIN Inventor name: BACKUS, JOHN W. Inventor name: LEE, DONGHO Inventor name: VENER, TATIANA Inventor name: PALMA, JOHN F. Inventor name: DERECHO, CARLO Inventor name: ZHANG, YI Inventor name: YU, JACK X. |
|
| 17P | Request for examination filed |
Effective date: 20131024 |
|
| RBV | Designated contracting states (corrected) |
Designated state(s): AT BE BG CH CY CZ DE DK EE ES FI FR GB GR HR HU IE IS IT LI LT LU LV MC MT NL NO PL PT RO SE SI SK TR |
|
| 17Q | First examination report despatched |
Effective date: 20140224 |
|
| RAP1 | Party data changed (applicant data changed or rights of an application transferred) |
Owner name: JANSSEN DIAGNOSTICS, LLC |
|
| GRAP | Despatch of communication of intention to grant a patent |
Free format text: ORIGINAL CODE: EPIDOSNIGR1 |
|
| INTG | Intention to grant announced |
Effective date: 20161214 |
|
| GRAS | Grant fee paid |
Free format text: ORIGINAL CODE: EPIDOSNIGR3 |
|
| GRAA | (expected) grant |
Free format text: ORIGINAL CODE: 0009210 |
|
| AC | Divisional application: reference to earlier application |
Ref document number: 2215266 Country of ref document: EP Kind code of ref document: P |
|
| AK | Designated contracting states |
Kind code of ref document: B1 Designated state(s): AT BE BG CH CY CZ DE DK EE ES FI FR GB GR HR HU IE IS IT LI LT LU LV MC MT NL NO PL PT RO SE SI SK TR |
|
| REG | Reference to a national code |
Ref country code: CH Ref legal event code: EP Ref country code: GB Ref legal event code: FG4D Ref country code: CH Ref legal event code: NV Representative=s name: E. BLUM AND CO. AG PATENT- UND MARKENANWAELTE , CH |
|
| REG | Reference to a national code |
Ref country code: AT Ref legal event code: REF Ref document number: 897534 Country of ref document: AT Kind code of ref document: T Effective date: 20170615 |
|
| REG | Reference to a national code |
Ref country code: IE Ref legal event code: FG4D |
|
| REG | Reference to a national code |
Ref country code: DE Ref legal event code: R096 Ref document number: 602008050535 Country of ref document: DE |
|
| REG | Reference to a national code |
Ref country code: NL Ref legal event code: FP |
|
| REG | Reference to a national code |
Ref country code: ES Ref legal event code: FG2A Ref document number: 2635429 Country of ref document: ES Kind code of ref document: T3 Effective date: 20171003 |
|
| REG | Reference to a national code |
Ref country code: LT Ref legal event code: MG4D |
|
| REG | Reference to a national code |
Ref country code: AT Ref legal event code: MK05 Ref document number: 897534 Country of ref document: AT Kind code of ref document: T Effective date: 20170531 |
|
| PG25 | Lapsed in a contracting state [announced via postgrant information from national office to epo] |
Ref country code: FI Free format text: LAPSE BECAUSE OF FAILURE TO SUBMIT A TRANSLATION OF THE DESCRIPTION OR TO PAY THE FEE WITHIN THE PRESCRIBED TIME-LIMIT Effective date: 20170531 Ref country code: LT Free format text: LAPSE BECAUSE OF FAILURE TO SUBMIT A TRANSLATION OF THE DESCRIPTION OR TO PAY THE FEE WITHIN THE PRESCRIBED TIME-LIMIT Effective date: 20170531 Ref country code: NO Free format text: LAPSE BECAUSE OF FAILURE TO SUBMIT A TRANSLATION OF THE DESCRIPTION OR TO PAY THE FEE WITHIN THE PRESCRIBED TIME-LIMIT Effective date: 20170831 Ref country code: HR Free format text: LAPSE BECAUSE OF FAILURE TO SUBMIT A TRANSLATION OF THE DESCRIPTION OR TO PAY THE FEE WITHIN THE PRESCRIBED TIME-LIMIT Effective date: 20170531 Ref country code: AT Free format text: LAPSE BECAUSE OF FAILURE TO SUBMIT A TRANSLATION OF THE DESCRIPTION OR TO PAY THE FEE WITHIN THE PRESCRIBED TIME-LIMIT Effective date: 20170531 Ref country code: GR Free format text: LAPSE BECAUSE OF FAILURE TO SUBMIT A TRANSLATION OF THE DESCRIPTION OR TO PAY THE FEE WITHIN THE PRESCRIBED TIME-LIMIT Effective date: 20170901 |
|
| PG25 | Lapsed in a contracting state [announced via postgrant information from national office to epo] |
Ref country code: BG Free format text: LAPSE BECAUSE OF FAILURE TO SUBMIT A TRANSLATION OF THE DESCRIPTION OR TO PAY THE FEE WITHIN THE PRESCRIBED TIME-LIMIT Effective date: 20170831 Ref country code: LV Free format text: LAPSE BECAUSE OF FAILURE TO SUBMIT A TRANSLATION OF THE DESCRIPTION OR TO PAY THE FEE WITHIN THE PRESCRIBED TIME-LIMIT Effective date: 20170531 Ref country code: IS Free format text: LAPSE BECAUSE OF FAILURE TO SUBMIT A TRANSLATION OF THE DESCRIPTION OR TO PAY THE FEE WITHIN THE PRESCRIBED TIME-LIMIT Effective date: 20170930 Ref country code: SE Free format text: LAPSE BECAUSE OF FAILURE TO SUBMIT A TRANSLATION OF THE DESCRIPTION OR TO PAY THE FEE WITHIN THE PRESCRIBED TIME-LIMIT Effective date: 20170531 |
|
| PG25 | Lapsed in a contracting state [announced via postgrant information from national office to epo] |
Ref country code: EE Free format text: LAPSE BECAUSE OF FAILURE TO SUBMIT A TRANSLATION OF THE DESCRIPTION OR TO PAY THE FEE WITHIN THE PRESCRIBED TIME-LIMIT Effective date: 20170531 Ref country code: CZ Free format text: LAPSE BECAUSE OF FAILURE TO SUBMIT A TRANSLATION OF THE DESCRIPTION OR TO PAY THE FEE WITHIN THE PRESCRIBED TIME-LIMIT Effective date: 20170531 Ref country code: DK Free format text: LAPSE BECAUSE OF FAILURE TO SUBMIT A TRANSLATION OF THE DESCRIPTION OR TO PAY THE FEE WITHIN THE PRESCRIBED TIME-LIMIT Effective date: 20170531 Ref country code: RO Free format text: LAPSE BECAUSE OF FAILURE TO SUBMIT A TRANSLATION OF THE DESCRIPTION OR TO PAY THE FEE WITHIN THE PRESCRIBED TIME-LIMIT Effective date: 20170531 Ref country code: SK Free format text: LAPSE BECAUSE OF FAILURE TO SUBMIT A TRANSLATION OF THE DESCRIPTION OR TO PAY THE FEE WITHIN THE PRESCRIBED TIME-LIMIT Effective date: 20170531 |
|
| PG25 | Lapsed in a contracting state [announced via postgrant information from national office to epo] |
Ref country code: PL Free format text: LAPSE BECAUSE OF FAILURE TO SUBMIT A TRANSLATION OF THE DESCRIPTION OR TO PAY THE FEE WITHIN THE PRESCRIBED TIME-LIMIT Effective date: 20170531 |
|
| REG | Reference to a national code |
Ref country code: DE Ref legal event code: R097 Ref document number: 602008050535 Country of ref document: DE |
|
| PLBE | No opposition filed within time limit |
Free format text: ORIGINAL CODE: 0009261 |
|
| STAA | Information on the status of an ep patent application or granted ep patent |
Free format text: STATUS: NO OPPOSITION FILED WITHIN TIME LIMIT |
|
| 26N | No opposition filed |
Effective date: 20180301 |
|
| REG | Reference to a national code |
Ref country code: FR Ref legal event code: PLFP Year of fee payment: 10 |
|
| PG25 | Lapsed in a contracting state [announced via postgrant information from national office to epo] |
Ref country code: SI Free format text: LAPSE BECAUSE OF FAILURE TO SUBMIT A TRANSLATION OF THE DESCRIPTION OR TO PAY THE FEE WITHIN THE PRESCRIBED TIME-LIMIT Effective date: 20170531 |
|
| PG25 | Lapsed in a contracting state [announced via postgrant information from national office to epo] |
Ref country code: MC Free format text: LAPSE BECAUSE OF FAILURE TO SUBMIT A TRANSLATION OF THE DESCRIPTION OR TO PAY THE FEE WITHIN THE PRESCRIBED TIME-LIMIT Effective date: 20170531 |
|
| PG25 | Lapsed in a contracting state [announced via postgrant information from national office to epo] |
Ref country code: LU Free format text: LAPSE BECAUSE OF NON-PAYMENT OF DUE FEES Effective date: 20171113 |
|
| PG25 | Lapsed in a contracting state [announced via postgrant information from national office to epo] |
Ref country code: MT Free format text: LAPSE BECAUSE OF NON-PAYMENT OF DUE FEES Effective date: 20171113 |
|
| PG25 | Lapsed in a contracting state [announced via postgrant information from national office to epo] |
Ref country code: HU Free format text: LAPSE BECAUSE OF FAILURE TO SUBMIT A TRANSLATION OF THE DESCRIPTION OR TO PAY THE FEE WITHIN THE PRESCRIBED TIME-LIMIT; INVALID AB INITIO Effective date: 20081113 |
|
| PGFP | Annual fee paid to national office [announced via postgrant information from national office to epo] |
Ref country code: NL Payment date: 20190516 Year of fee payment: 11 |
|
| PGFP | Annual fee paid to national office [announced via postgrant information from national office to epo] |
Ref country code: ES Payment date: 20190517 Year of fee payment: 11 Ref country code: DE Payment date: 20190522 Year of fee payment: 11 Ref country code: IT Payment date: 20190524 Year of fee payment: 11 Ref country code: IE Payment date: 20190517 Year of fee payment: 11 |
|
| PGFP | Annual fee paid to national office [announced via postgrant information from national office to epo] |
Ref country code: FR Payment date: 20190520 Year of fee payment: 11 Ref country code: BE Payment date: 20190516 Year of fee payment: 11 |
|
| PGFP | Annual fee paid to national office [announced via postgrant information from national office to epo] |
Ref country code: CH Payment date: 20190516 Year of fee payment: 11 |
|
| PG25 | Lapsed in a contracting state [announced via postgrant information from national office to epo] |
Ref country code: CY Free format text: LAPSE BECAUSE OF NON-PAYMENT OF DUE FEES Effective date: 20170531 |
|
| PGFP | Annual fee paid to national office [announced via postgrant information from national office to epo] |
Ref country code: GB Payment date: 20190516 Year of fee payment: 11 |
|
| PG25 | Lapsed in a contracting state [announced via postgrant information from national office to epo] |
Ref country code: TR Free format text: LAPSE BECAUSE OF FAILURE TO SUBMIT A TRANSLATION OF THE DESCRIPTION OR TO PAY THE FEE WITHIN THE PRESCRIBED TIME-LIMIT Effective date: 20170531 |
|
| PG25 | Lapsed in a contracting state [announced via postgrant information from national office to epo] |
Ref country code: PT Free format text: LAPSE BECAUSE OF FAILURE TO SUBMIT A TRANSLATION OF THE DESCRIPTION OR TO PAY THE FEE WITHIN THE PRESCRIBED TIME-LIMIT Effective date: 20170531 |
|
| REG | Reference to a national code |
Ref country code: DE Ref legal event code: R119 Ref document number: 602008050535 Country of ref document: DE |
|
| REG | Reference to a national code |
Ref country code: CH Ref legal event code: PL |
|
| REG | Reference to a national code |
Ref country code: NL Ref legal event code: MM Effective date: 20191201 |
|
| PG25 | Lapsed in a contracting state [announced via postgrant information from national office to epo] |
Ref country code: CH Free format text: LAPSE BECAUSE OF NON-PAYMENT OF DUE FEES Effective date: 20191130 Ref country code: LI Free format text: LAPSE BECAUSE OF NON-PAYMENT OF DUE FEES Effective date: 20191130 |
|
| REG | Reference to a national code |
Ref country code: BE Ref legal event code: MM Effective date: 20191130 |
|
| GBPC | Gb: european patent ceased through non-payment of renewal fee |
Effective date: 20191113 |
|
| PG25 | Lapsed in a contracting state [announced via postgrant information from national office to epo] |
Ref country code: NL Free format text: LAPSE BECAUSE OF NON-PAYMENT OF DUE FEES Effective date: 20191201 |
|
| PG25 | Lapsed in a contracting state [announced via postgrant information from national office to epo] |
Ref country code: DE Free format text: LAPSE BECAUSE OF NON-PAYMENT OF DUE FEES Effective date: 20200603 Ref country code: IT Free format text: LAPSE BECAUSE OF NON-PAYMENT OF DUE FEES Effective date: 20191113 Ref country code: IE Free format text: LAPSE BECAUSE OF NON-PAYMENT OF DUE FEES Effective date: 20191113 Ref country code: FR Free format text: LAPSE BECAUSE OF NON-PAYMENT OF DUE FEES Effective date: 20191130 Ref country code: GB Free format text: LAPSE BECAUSE OF NON-PAYMENT OF DUE FEES Effective date: 20191113 |
|
| PG25 | Lapsed in a contracting state [announced via postgrant information from national office to epo] |
Ref country code: BE Free format text: LAPSE BECAUSE OF NON-PAYMENT OF DUE FEES Effective date: 20191130 |
|
| REG | Reference to a national code |
Ref country code: ES Ref legal event code: FD2A Effective date: 20210531 |
|
| PG25 | Lapsed in a contracting state [announced via postgrant information from national office to epo] |
Ref country code: ES Free format text: LAPSE BECAUSE OF NON-PAYMENT OF DUE FEES Effective date: 20191114 |