EP2581873A1 - Power consumption amount display device - Google Patents
Power consumption amount display device Download PDFInfo
- Publication number
- EP2581873A1 EP2581873A1 EP11792243.5A EP11792243A EP2581873A1 EP 2581873 A1 EP2581873 A1 EP 2581873A1 EP 11792243 A EP11792243 A EP 11792243A EP 2581873 A1 EP2581873 A1 EP 2581873A1
- Authority
- EP
- European Patent Office
- Prior art keywords
- power consumption
- consumption amount
- target month
- date
- measurement value
- Prior art date
- Legal status (The legal status is an assumption and is not a legal conclusion. Google has not performed a legal analysis and makes no representation as to the accuracy of the status listed.)
- Ceased
Links
Images




Classifications
-
- H—ELECTRICITY
- H02—GENERATION; CONVERSION OR DISTRIBUTION OF ELECTRIC POWER
- H02J—ELECTRIC POWER NETWORKS; CIRCUIT ARRANGEMENTS OR SYSTEMS FOR SUPPLYING OR DISTRIBUTING ELECTRIC POWER; SYSTEMS FOR STORING ELECTRIC ENERGY
- H02J3/00—Circuit arrangements for AC mains or AC distribution networks
- H02J3/12—Arrangements for adjusting voltage in AC networks by changing a characteristic of the network load
- H02J3/14—Arrangements for adjusting voltage in AC networks by changing a characteristic of the network load by switching loads on to, or off from, the networks, e.g. progressively balanced loading
-
- H—ELECTRICITY
- H02—GENERATION; CONVERSION OR DISTRIBUTION OF ELECTRIC POWER
- H02J—ELECTRIC POWER NETWORKS; CIRCUIT ARRANGEMENTS OR SYSTEMS FOR SUPPLYING OR DISTRIBUTING ELECTRIC POWER; SYSTEMS FOR STORING ELECTRIC ENERGY
- H02J2105/00—Networks for supplying or distributing electric power characterised by their spatial reach or by the load
- H02J2105/40—Networks for supplying or distributing electric power characterised by their spatial reach or by the load characterised by the loads connecting to the networks or being supplied by the networks
- H02J2105/42—Home appliances
-
- Y—GENERAL TAGGING OF NEW TECHNOLOGICAL DEVELOPMENTS; GENERAL TAGGING OF CROSS-SECTIONAL TECHNOLOGIES SPANNING OVER SEVERAL SECTIONS OF THE IPC; TECHNICAL SUBJECTS COVERED BY FORMER USPC CROSS-REFERENCE ART COLLECTIONS [XRACs] AND DIGESTS
- Y02—TECHNOLOGIES OR APPLICATIONS FOR MITIGATION OR ADAPTATION AGAINST CLIMATE CHANGE
- Y02B—CLIMATE CHANGE MITIGATION TECHNOLOGIES RELATED TO BUILDINGS, e.g. HOUSING, HOUSE APPLIANCES OR RELATED END-USER APPLICATIONS
- Y02B70/00—Technologies for an efficient end-user side electric power management and consumption
- Y02B70/30—Systems integrating technologies related to power network operation and communication or information technologies for improving the carbon footprint of the management of residential or tertiary loads, i.e. smart grids as climate change mitigation technology in the buildings sector, including also the last stages of power distribution and the control, monitoring or operating management systems at local level
-
- Y—GENERAL TAGGING OF NEW TECHNOLOGICAL DEVELOPMENTS; GENERAL TAGGING OF CROSS-SECTIONAL TECHNOLOGIES SPANNING OVER SEVERAL SECTIONS OF THE IPC; TECHNICAL SUBJECTS COVERED BY FORMER USPC CROSS-REFERENCE ART COLLECTIONS [XRACs] AND DIGESTS
- Y02—TECHNOLOGIES OR APPLICATIONS FOR MITIGATION OR ADAPTATION AGAINST CLIMATE CHANGE
- Y02B—CLIMATE CHANGE MITIGATION TECHNOLOGIES RELATED TO BUILDINGS, e.g. HOUSING, HOUSE APPLIANCES OR RELATED END-USER APPLICATIONS
- Y02B70/00—Technologies for an efficient end-user side electric power management and consumption
- Y02B70/30—Systems integrating technologies related to power network operation and communication or information technologies for improving the carbon footprint of the management of residential or tertiary loads, i.e. smart grids as climate change mitigation technology in the buildings sector, including also the last stages of power distribution and the control, monitoring or operating management systems at local level
- Y02B70/3225—Demand response systems, e.g. load shedding, peak shaving
-
- Y—GENERAL TAGGING OF NEW TECHNOLOGICAL DEVELOPMENTS; GENERAL TAGGING OF CROSS-SECTIONAL TECHNOLOGIES SPANNING OVER SEVERAL SECTIONS OF THE IPC; TECHNICAL SUBJECTS COVERED BY FORMER USPC CROSS-REFERENCE ART COLLECTIONS [XRACs] AND DIGESTS
- Y04—INFORMATION OR COMMUNICATION TECHNOLOGIES HAVING AN IMPACT ON OTHER TECHNOLOGY AREAS
- Y04S—SYSTEMS INTEGRATING TECHNOLOGIES RELATED TO POWER NETWORK OPERATION, COMMUNICATION OR INFORMATION TECHNOLOGIES FOR IMPROVING THE ELECTRICAL POWER GENERATION, TRANSMISSION, DISTRIBUTION, MANAGEMENT OR USAGE, i.e. SMART GRIDS
- Y04S20/00—Management or operation of end-user stationary applications or the last stages of power distribution; Controlling, monitoring or operating thereof
- Y04S20/20—End-user application control systems
- Y04S20/222—Demand response systems, e.g. load shedding, peak shaving
-
- Y—GENERAL TAGGING OF NEW TECHNOLOGICAL DEVELOPMENTS; GENERAL TAGGING OF CROSS-SECTIONAL TECHNOLOGIES SPANNING OVER SEVERAL SECTIONS OF THE IPC; TECHNICAL SUBJECTS COVERED BY FORMER USPC CROSS-REFERENCE ART COLLECTIONS [XRACs] AND DIGESTS
- Y04—INFORMATION OR COMMUNICATION TECHNOLOGIES HAVING AN IMPACT ON OTHER TECHNOLOGY AREAS
- Y04S—SYSTEMS INTEGRATING TECHNOLOGIES RELATED TO POWER NETWORK OPERATION, COMMUNICATION OR INFORMATION TECHNOLOGIES FOR IMPROVING THE ELECTRICAL POWER GENERATION, TRANSMISSION, DISTRIBUTION, MANAGEMENT OR USAGE, i.e. SMART GRIDS
- Y04S20/00—Management or operation of end-user stationary applications or the last stages of power distribution; Controlling, monitoring or operating thereof
- Y04S20/20—End-user application control systems
- Y04S20/242—Home appliances
Definitions
- Embodiments described herein relate generally to a power consumption amount display for displaying measurement data of power consumption amount in office buildings, factories, or the like.
- the measurement data of the power consumption amount in the monitor target period is compared with the measurement data of the power consumption amount in the same period of the previous month or previous year.
- the comparison is sometimes made between the measurement data of the power consumption amount per day of one month as the monitor target and the measurement data of the power consumption amount per day of one month in the past.
- the data per day of the power consumption amount measurement value of the comparison target month is made to correspond, by the same date, to the data per day of the power consumption amount measurement value of the monitor target month and where such corresponding data are displayed.
- the monitor target month has the sixth and seventh days falling on Saturday and Sunday when the power consumption amount measurement value is smaller than that of other dates, while the comparison target month has the sixth and seventh days falling on weekdays, failing to be proper as a comparison target.
- the monitor target month has fourth and fifth days falling on weekdays, while the comparison target month has the fourth and fifth days falling on Saturday and Sunday, in this case as well, failing to be proper as the comparison target.
- the present invention has been made. It is an object of the present invention to provid a power consumption amount display for displaying measurement data of power consumption amount in a building by allowing the measurement data to correspond to past measurement data which is more proper as a comparison target.
- a power consumption amount display connected to a measurement value memory for memorizing a power consumption amount measurement value of a monitor target device includes: a monitor information selecting portion for a user to select a monitor target month and a comparison target month of the power consumption amount measurement value; a measurement value obtaining portion for obtaining, from the measurement value memory, the power consumption amount measurement values corresponding to the monitor target month and the comparison target month which are selected at the monitor information selecting portion; a display information generating portion capable of generating display information by shifting a date of the comparison target month obtained at the measurement value obtaining portion, such that a day of a week of the date of the comparison target month coincides with a day of a week of a date of the monitor target month obtained at the measurement value obtaining portion, allowing the date of the comparison target month to correspond to the date of the monitor target month, and arranging and displaying per day the power consumption amount measurement values of the corresponding dates; and a display portion for displaying the display information generated at the display information generating portion
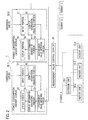
- the explanation will be made about a case where a power consumption amount of each of an outdoor unit 10-1 and a plurality of indoor units 10-2 to 10-4 connected with the outdoor unit 10-1 of an air conditioner installed for a tenant (shop) A in a building as a monitor target is measured and then the monitor information is displayed. That is, according to the embodiment, the explanation will be made about a case in which the device as the monitor target is the air conditioner.
- the power consumption amount display system 1 has a measurement value management server 20 as a measurement value memory connected with the outdoor unit 10-1 and indoor units 10-2 to 10-4 which are disposed in the building as the monitor target and a plurality of power consumption amount displays 30-1, 30-2 connected with the measurement value management server 20.
- Each of the outdoor unit 10-1 and the indoor units 10-2 to 10-4 accumulates and holds a measurement value of power consumption amount of own device and transmits the measurement value to the measurement value management server 20 at a predetermined time interval (for example, 15 min. or 30 min.).
- the measurement value management server 20 includes a clock function having a calendar function for specifying year, month, date, and day of the week.
- the measurement value management server 20 obtains the measurement value of the power consumption amount transmitted from the outdoor unit 10-1 and each of the indoor units 10-2 to 10-4 connected with the measurement value management server 20, and stores the power consumption amount per unit based on year, month, date, and time of the clock function.
- Each of the power consumption amount displays 30-1 and 30-2 is composed of a general-purpose personal computer, a special controller, or the like and includes an input portion 31, a monitor information selecting portion 32, a measurement value obtaining portion 33, a display information generating portion 34, and a display portion 35.
- the input portion 31 includes, for example, a mouse, a key board, and the like and inputs various pieces of information by an operation of an observer (user).
- the monitor information selecting portion 32 implements such processes as setting basic information and selecting a monitor target device, a monitor target period of the power consumption amount, and a comparison target period before the monitor target period.
- the measurement value obtaining portion 33 requests the measurement value management server 20 for the power consumption amount measurement value associated with the selected monitor target device which measurement values correspond to the monitor target month and comparison target month selected by the monitor information selecting portion 32 to obtain the data.
- the display information generating portion 34 Based on the measurement value of the power consumption amount obtained at the measurement value obtaining portion 33 and the basic information set at the monitor information selecting portion 32, the display information generating portion 34 generates the display information to be displayed as the monitor information.
- the display portion 35 displays the display information generated at the display information generating portion 34.
- the measurement value management server 20 obtains the measurement value from the outdoor unit 10-1 and indoor units 10-2 to 10-4 at a predetermined time interval and stores the measurement value together with the obtained data of year, month, date, day of the week and time.
- an energy saving monitor screen 100 as illustrated in Fig. 3 is displayed on the display portion 35.
- the energy saving monitor screen 100 includes a "basic setting" button 110 for displaying a basic setting screen for setting basic information associated with the display of the monitor information, a monitor target device selecting area 120 for selecting the monitor target device individually, per area or per tenant, a monitor target period selecting area 130 for selecting the monitor target period and comparison target period, and a graph display area 140 for displaying, with a bar graph, the measurement value and reduction ratio of the power consumption amount corresponding to the selected monitor target device and selected monitor target period.
- the observer operates the energy saving monitor screen 100 from the input portion 31 to thereby allow the monitor information selecting portion 32 to implement the process of setting the basic information and the process of selecting the monitor target device and the monitor target period and comparison target period of the power consumption amount.
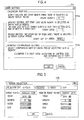
- the basic setting screen 111 includes a calendar setting area 111a and a monthly comparison setting area 111b.
- the calendar setting area 111a can set calendar information of the display period of the graph displayed in the graph display area 140.
- the monthly comparison setting area 111b can select whether to arrange and display per day the power consumption amount measurement value of the monitor target month and the power consumption amount measurement value of the comparison target month by the same date or by shifting and thereby matching the day of the week.
- a default is so set that, as the basic information, when the time unit of the display period of the graph is selected as a yearly unit, the start month of the display period is set as "April,” when the time unit of the display period of the graph is selected as a monthly unit, the start date of the display period is set as "1st,” and when the time unit of the display period of the graph is selected as a weekly unit, the start day of the week of the display period is set as "Monday.”
- a default is so set as to select that, when the time unit of the display period of the graph to be displayed in the graph display area 140 is selected as a monthly unit, the date of the comparison target month is so shifted that the day of the week of the date of the comparison target month matches with the day of the week of the date of the monitor target month, and then the measurement data of the power consumption amount is arranged and displayed per day.
- the setting of the display is accomplished by the observer to select an "OK" button in the lowermost section and the display screen returns to the energy saving monitor screen 100 in Fig. 3 .
- the explanation will be made in a condition that the time unit of the display period of the graph is selected as a monthly unit in the basic setting screen 111.
- the observer operating the input portion 31 marks, in the monitor target device selecting area 120 of the calendar setting area 111a, the check box of the area or device as the monitor target, to thereby make the selection individually, per area or per tenant.
- the observer operating the input portion 31 sets the monitor target period and comparison target period in the monitor target period selecting area 130 of the energy saving monitor screen 100.
- the selection is made such that the time unit of each of the monitor target period and comparison target period in the monitor target period selecting area 130 is set to the monthly unit, and the monitor target month is set as "August 2010" and the comparison target month as "August 2009.”
- the comparison target month may be selected by making an operation in the reverse buttons 131, 133 or forward buttons 132, 134 in the monitor target period selecting area 130 or may be selected by making an operation in a period selecting screen 135 (as illustrated in Fig. 5 ) which is displayed by making a selection in the monitor target period selecting area 130.
- period selecting screen 1335 year, month, week, and date of each of the monitor target period and the comparison target period are selected by operating upper and lower triangle marks respectively displayed in input boxes.
- Fig. 5 since the selection has been already made in the above-described basic setting screen 111 such that the time unit of each of the monitor target period and the comparison target period is set to the monthly unit, it is not necessary to set as for week and date which are each a time unit smaller than the monthly unit and, therefore, it is so shown that week and date cannot be inputted.
- the measurement value obtaining portion 33 obtains, from the measurement value management server 20, the power consumption amount measurement value associated with the selected monitor target device in the selected monitor target month and selected comparison target month.
- the display information generating portion 34 generates the display information to be displayed as the monitor information.
- step S2 Since the time unit of the display period is set as a monthly unit ("YES" at S1), the process moves to step S2 to thereby determine whether or not "arranging and displaying per day by matching a day of the week" in the set basic information is selected (S2). If "arranging and displaying per day by matching a day of the week” is not selected ("NO” at S2), the start date of the comparison target month is not shifted but is set to "1st” and is so set as to correspond to "1st” set as the start date of the display period of the monitor target month (S3).
- step S3 Since "arranging and displaying per day by matching a day of the week" is selected in the basic information ("YES" at S2), the process moves to step S3 to thereby determine whether or not the day of the week of the start date of the monitor target month coincides with the day of the week of the start date of the comparison target month (S4).
- the start date of the comparison target month is set to "1st” and is so set as to correspond to "1st” set as the start date of the display period of the monitor target month (S3).
- the shift amount is calculated for each of such cases that the date is added and subtracted until the day of the week of the comparison target month coincides with the day of the week of the start date of the monitor target month (step S5).
- the start date of the comparison target month is set to "1st" as is without adding the date.
- the day of the week of the start date of the monitor target month does not coincide with the day of the week of the start date of the comparison target month as "Calendar information of comparison target month (2)"
- the date "2nd” causing a coincided day of the week by addition is set as the start date of the comparison target month.
- the date causing the coincided day of the week is set as the start date of the comparison target month and is so set as to correspond to "1st" set as the start date of the display period of the monitor target month.
- the display information generating portion 34 Based on the information of the start date of the comparison target month so set at step S3, step S7, or step S8 as to correspond to the start date of the display period of the monitor target month and based on the measurement value of the power consumption amount obtained at the measurement value obtaining portion 33, the display information generating portion 34 generates the display information for arranging and displaying per day the power consumption amount measurement values of corresponding dates of the monitor target month and comparison target month. Further, even when the time unit of the display time of the graph to be displayed is not selected as a monthly unit at step S1 ("NO" at S1), the display information generating portion 34 generates the display information with the selected time unit (S9).
- adding or subtracting the date within a range of three days before and after the date of the monitor target month such that the day of the week of the start date of the comparison target month coincides with the day of the week of the start date of the monitor target month can match the day of the week with the smallest shift amount, thus making it possible to generate the display information with the shift of date suppressed to the minimum. That is, according to the embodiment, it is so configured that, in the coinciding of the day of the week between the monitor target month and the comparison target month, the day of the closest date is selected.
- the shift amount can be three days at maximum.
- step S 14 when it is determined that the day of the week of the start date of the monitor target month does not coincide with the day of the week of the start date of the comparison target month ("NO" at S 14), the date is sequentially added until the day of the start date of the comparison target date coincides with the day of the week of the start date of the monitor target month, to thereby set the date having the coincided day of the week as the start date of the comparison target month (S 15).
- the start date of the comparison target month is set to "1st" as is without adding the date.
- the date is shifted by adding "one day” (added number of days: +1) such that the day of the week of the start date of the comparison target month coincides with "Monday” which is the day of the week of the start date of the monitor target month. Then, the date "2nd" which is the date having the coincided day of the week is set as the start date of the comparison target month.
- the date is shifted by adding "two days” (added number of days: +2) such that the day of the week of the start date of the comparison target month coincides with "Monday” which is the day of the week of the start date of the monitor target month. Then, the date "3rd" which is the date having the coincided day of the week is set as the start date of the comparison target month.
- the display information generating portion 34 Based on the information of the start date of the comparison target month so set at step S 13 or step S15 as to correspond to the start date of the display period of the monitor target month and based on the measurement value of the power consumption amount obtained at the measurement value obtaining portion 33, the display information generating portion 34 generates the display information for arranging and displaying per day the power consumption amount measurement values of corresponding dates of the monitor target month and the comparison target month. Further, even when the time unit of the display time of the graph to be displayed is not selected as a monthly unit at step S11 ("NO" at S11), the display information generating portion 34 generates the display information with the selected time unit (S6).
- the display information can be generated by only the data of the month that is selected as the comparison target month without having the comparison target data displayed in such a manner as to stride over the previous month.
- the process of obtaining the measurement value can be simplified. According to this method, since the start date of the monitor target month does not date back to the previous month, a feeling of strangeness can be reduced in the case of monthly comparison.
- the number of days to be shifted is six at a maximum in this method as well, even in the case the power consumption amount is changeable by seasonal change, it is possible to make a comparison by reducing influence of the seasonal change, although this method is slightly inferior to the embodiment illustrated in Fig. 6 .
- the generated display information is displayed in the graph display area 140 of the energy saving monitor screen 100 displayed in the display portion 35.
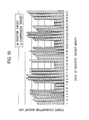
- An example of the display information displayed in the graph display area 140 is illustrated in Fig. 10 .
- the data of the same day of the week of the power consumption amount measurement value of the comparison target month is arranged and displayed per day as set so as to correspond to the data per day of the power consumption amount measurement value of the monitor target month.
- the power consumption amount measurement value of the monitor target month and the power consumption amount measurement value of the comparison target month by selecting, in the setting of the basic information, whether "arrange and display per day by the same date” or “arrange and display per day by matching the day of the week", it is made possible not to implement the process of shifting the date when comparing, between the data of different months, the power consumption amount associated with a device uninfluenced by the day of the week, thus enabling to more simply implement the generating process of the display information.
- the monitoring operation of the observer may be further supported by displaying the graph illustrating the reduction rate of the power consumption amount per day of the monitor target month compared with the comparison target month.
- the explanation has been made about the case in which the measurement values of the power consumption amounts transmitted from the outdoor unit 10-1 and indoor units 10-2 to 10-4 are received by and stored in the measurement value management server 20 but the present invention is not limited to this. It is possible to install a power meter for measuring the power consumption amounts of a plurality of outdoor units and indoor units and obtaining and storing, by the measurement value management server 20, the measurement value of the power consumption amount measured by the power meter.
- the power consumption amount measurement value of the monitor target month and the power consumption amount measurement value of the comparison target month are arranged and displayed per day on the bar graph for ease of comparison; however, they may be arranged and displayed per day in a form of a numeral table.
Landscapes
- Engineering & Computer Science (AREA)
- Power Engineering (AREA)
- Remote Monitoring And Control Of Power-Distribution Networks (AREA)
- Management, Administration, Business Operations System, And Electronic Commerce (AREA)
- Control Of Indicators Other Than Cathode Ray Tubes (AREA)
Abstract
Description
- Embodiments described herein relate generally to a power consumption amount display for displaying measurement data of power consumption amount in office buildings, factories, or the like.
- Conventionally, in buildings such as office or factory, as energy saving measures, an effort is being made for reducing the power consumption amount by devices in the building. For reducing the power consumption amount, it is effective to store measurement data of the power consumption amount within a predetermined period and to analyze the measurement data.
- Then, in the analysis of the measurement data of the power consumption amount in the building, as the case may be, the measurement data of the power consumption amount in the monitor target period is compared with the measurement data of the power consumption amount in the same period of the previous month or previous year.
- PTL 1:
JP 2005-312142 A - In comparing the measurement data, the comparison is sometimes made between the measurement data of the power consumption amount per day of one month as the monitor target and the measurement data of the power consumption amount per day of one month in the past. In this case, allowing the data of the same date to correspond to each other, as the case may be, sometimes causes the data of different days of the week to be made as comparison target.
- However, in office buildings, factories, or the like, an operating day is distinguished from a non-operating day ordinarily by a day of the week; therefore, the power consumption amount is greatly different depending on whether or not the date falls on the operating day or the non-operating day. Thus, there was a problem that a proper analysis cannot be made by the comparison between the data having different days of the week.
- For example, as illustrated in
Fig. 1 , it is assumed that the data per day of the power consumption amount measurement value of the comparison target month is made to correspond, by the same date, to the data per day of the power consumption amount measurement value of the monitor target month and where such corresponding data are displayed. In this case, the monitor target month has the sixth and seventh days falling on Saturday and Sunday when the power consumption amount measurement value is smaller than that of other dates, while the comparison target month has the sixth and seventh days falling on weekdays, failing to be proper as a comparison target. Further, the monitor target month has fourth and fifth days falling on weekdays, while the comparison target month has the fourth and fifth days falling on Saturday and Sunday, in this case as well, failing to be proper as the comparison target. - In view of the above, the present invention has been made. It is an object of the present invention to provid a power consumption amount display for displaying measurement data of power consumption amount in a building by allowing the measurement data to correspond to past measurement data which is more proper as a comparison target.
- For accomplishing the above object, according to one embodiment, a power consumption amount display connected to a measurement value memory for memorizing a power consumption amount measurement value of a monitor target device includes: a monitor information selecting portion for a user to select a monitor target month and a comparison target month of the power consumption amount measurement value; a measurement value obtaining portion for obtaining, from the measurement value memory, the power consumption amount measurement values corresponding to the monitor target month and the comparison target month which are selected at the monitor information selecting portion; a display information generating portion capable of generating display information by shifting a date of the comparison target month obtained at the measurement value obtaining portion, such that a day of a week of the date of the comparison target month coincides with a day of a week of a date of the monitor target month obtained at the measurement value obtaining portion, allowing the date of the comparison target month to correspond to the date of the monitor target month, and arranging and displaying per day the power consumption amount measurement values of the corresponding dates; and a display portion for displaying the display information generated at the display information generating portion.
-
- [
Fig. 1] Fig. 1 is a graph illustrating an example of display information displayed by a conventional power consumption amount display. - [
Fig. 2] Fig. 2 is a block diagram illustrating a structure of a power consumption amount display system using a power consumption amount display according to one embodiment. - [
Fig. 3] Fig. 3 is a structural diagram of a screen illustrating an example of an energy saving monitor screen displayed on the power consumption amount display according to the embodiment. - [
Fig. 4] Fig. 4 is a structural diagram of a screen illustrating an example of a basic setting screen for setting basic information in the energy saving monitor screen displayed on the power consumption amount display according to the one embodiment. - [
Fig. 5] Fig. 5 is a structural diagram of a screen illustrating an example of a period selecting screen for selecting a monitor target period and a comparison target period in the energy saving monitor screen displayed on the power consumption amount display according to the embodiment. - [
Fig. 6] Fig. 6 is a flowchart illustrating an example of a process of generating the display information in the power consumption amount display according to the embodiment. - [
Fig. 7] Fig. 7 is a drawing for explaining the shift state of the date in the comparison target month implemented by the process of generating of the display information in the power consumption amount display according to the embodiment. - [
Fig. 8] Fig. 8 is a flowchart illustrating another example of the process of generating the display information in the power consumption amount display according to the embodiment. - [
Fig. 9] Fig. 9 is a drawing for explaining the shift state of the date in the comparison target month implemented by another process of generating the display information in the power consumption amount display according to the embodiment. - [
Fig. 10] Fig. 10 is a graph illustrating an example of display information displayed by the power consumption amount display according to the embodiment. - Hereinafter, embodiments will be explained in detail referring to the drawings.
- Structure of a power consumption
amount display system 1 using a power consumption amount display according to one embodiment will be explained referring toFig. 2 . - According to the embodiment, the explanation will be made about a case where a power consumption amount of each of an outdoor unit 10-1 and a plurality of indoor units 10-2 to 10-4 connected with the outdoor unit 10-1 of an air conditioner installed for a tenant (shop) A in a building as a monitor target is measured and then the monitor information is displayed. That is, according to the embodiment, the explanation will be made about a case in which the device as the monitor target is the air conditioner.
- The power consumption
amount display system 1 according to the embodiment has a measurementvalue management server 20 as a measurement value memory connected with the outdoor unit 10-1 and indoor units 10-2 to 10-4 which are disposed in the building as the monitor target and a plurality of power consumption amount displays 30-1, 30-2 connected with the measurementvalue management server 20. - Each of the outdoor unit 10-1 and the indoor units 10-2 to 10-4 accumulates and holds a measurement value of power consumption amount of own device and transmits the measurement value to the measurement
value management server 20 at a predetermined time interval (for example, 15 min. or 30 min.). - The measurement
value management server 20 includes a clock function having a calendar function for specifying year, month, date, and day of the week. The measurementvalue management server 20 obtains the measurement value of the power consumption amount transmitted from the outdoor unit 10-1 and each of the indoor units 10-2 to 10-4 connected with the measurementvalue management server 20, and stores the power consumption amount per unit based on year, month, date, and time of the clock function. - Each of the power consumption amount displays 30-1 and 30-2 is composed of a general-purpose personal computer, a special controller, or the like and includes an
input portion 31, a monitorinformation selecting portion 32, a measurementvalue obtaining portion 33, a displayinformation generating portion 34, and adisplay portion 35. - The
input portion 31 includes, for example, a mouse, a key board, and the like and inputs various pieces of information by an operation of an observer (user). - By the information inputted from the
input portion 31, the monitorinformation selecting portion 32 implements such processes as setting basic information and selecting a monitor target device, a monitor target period of the power consumption amount, and a comparison target period before the monitor target period. - The measurement
value obtaining portion 33 requests the measurementvalue management server 20 for the power consumption amount measurement value associated with the selected monitor target device which measurement values correspond to the monitor target month and comparison target month selected by the monitorinformation selecting portion 32 to obtain the data. - Based on the measurement value of the power consumption amount obtained at the measurement
value obtaining portion 33 and the basic information set at the monitorinformation selecting portion 32, the displayinformation generating portion 34 generates the display information to be displayed as the monitor information. - The
display portion 35 displays the display information generated at the displayinformation generating portion 34. - Next, operations of the power consumption
amount display system 1 according to the embodiment will be explained. According to the embodiment, the explanation will be made about a case where the monitor information is displayed in the power consumption amount display 30-1. - According to the embodiment, it is assumed that the measurement
value management server 20 obtains the measurement value from the outdoor unit 10-1 and indoor units 10-2 to 10-4 at a predetermined time interval and stores the measurement value together with the obtained data of year, month, date, day of the week and time. - First, when the observer operates the
input portion 31 of the power consumption amount display 30-1 to thereby start the process for displaying the monitor information, an energy savingmonitor screen 100 as illustrated inFig. 3 is displayed on thedisplay portion 35. - The energy saving
monitor screen 100 includes a "basic setting"button 110 for displaying a basic setting screen for setting basic information associated with the display of the monitor information, a monitor targetdevice selecting area 120 for selecting the monitor target device individually, per area or per tenant, a monitor targetperiod selecting area 130 for selecting the monitor target period and comparison target period, and agraph display area 140 for displaying, with a bar graph, the measurement value and reduction ratio of the power consumption amount corresponding to the selected monitor target device and selected monitor target period. - Next, the observer operates the energy saving
monitor screen 100 from theinput portion 31 to thereby allow the monitorinformation selecting portion 32 to implement the process of setting the basic information and the process of selecting the monitor target device and the monitor target period and comparison target period of the power consumption amount. - When the process of setting the basic information is to be implemented, first, by selecting the "basic setting"
button 110 of the energy savingmonitor screen 100, abasic setting screen 111 as illustrated inFig. 4 is displayed on another window. Then, on thebasic setting screen 111 thus displayed, the basic information associated with the display of the monitor information is set by the operation of the observer. - The
basic setting screen 111 includes acalendar setting area 111a and a monthlycomparison setting area 111b. Thecalendar setting area 111a can set calendar information of the display period of the graph displayed in thegraph display area 140. When the time unit of the display period of the graph to be displayed in thegraph display area 140 is selected as a monthly unit, the monthlycomparison setting area 111b can select whether to arrange and display per day the power consumption amount measurement value of the monitor target month and the power consumption amount measurement value of the comparison target month by the same date or by shifting and thereby matching the day of the week. - According to the embodiment, in the
calendar setting area 111a in thebasic setting screen 111, a default is so set that, as the basic information, when the time unit of the display period of the graph is selected as a yearly unit, the start month of the display period is set as "April," when the time unit of the display period of the graph is selected as a monthly unit, the start date of the display period is set as "1st," and when the time unit of the display period of the graph is selected as a weekly unit, the start day of the week of the display period is set as "Monday." Further, in the monthlycomparison setting area 111b in thebasic setting screen 111, a default is so set as to select that, when the time unit of the display period of the graph to be displayed in thegraph display area 140 is selected as a monthly unit, the date of the comparison target month is so shifted that the day of the week of the date of the comparison target month matches with the day of the week of the date of the monitor target month, and then the measurement data of the power consumption amount is arranged and displayed per day. - In the
basic setting screen 111, the setting of the display is accomplished by the observer to select an "OK" button in the lowermost section and the display screen returns to the energy savingmonitor screen 100 inFig. 3 . Herein, the explanation will be made in a condition that the time unit of the display period of the graph is selected as a monthly unit in thebasic setting screen 111. - Next, the observer operating the
input portion 31 marks, in the monitor targetdevice selecting area 120 of thecalendar setting area 111a, the check box of the area or device as the monitor target, to thereby make the selection individually, per area or per tenant. - According to the embodiment, as illustrated in
Fig. 3 , it is assumed that all devices in a tenant A on the second floor of the building is selected as the monitor target in the monitor targetdevice selecting area 120. - Next, the observer operating the
input portion 31 sets the monitor target period and comparison target period in the monitor targetperiod selecting area 130 of the energy savingmonitor screen 100. - According to the embodiment, as illustrated in
Fig. 3 , it is assumed that the selection is made such that the time unit of each of the monitor target period and comparison target period in the monitor targetperiod selecting area 130 is set to the monthly unit, and the monitor target month is set as "August 2010" and the comparison target month as "August 2009." - The comparison target month may be selected by making an operation in the
reverse buttons forward buttons period selecting area 130 or may be selected by making an operation in a period selecting screen 135 (as illustrated inFig. 5 ) which is displayed by making a selection in the monitor targetperiod selecting area 130. - In the
period selecting screen 135, year, month, week, and date of each of the monitor target period and the comparison target period are selected by operating upper and lower triangle marks respectively displayed in input boxes. InFig. 5 , since the selection has been already made in the above-describedbasic setting screen 111 such that the time unit of each of the monitor target period and the comparison target period is set to the monthly unit, it is not necessary to set as for week and date which are each a time unit smaller than the monthly unit and, therefore, it is so shown that week and date cannot be inputted. - In this way, once the monitor
information selecting portion 32 implements the process for setting the basic information, and the processes for selecting the monitor target device, and the monitor target period and comparison target period of the power consumption amount, the measurementvalue obtaining portion 33 obtains, from the measurementvalue management server 20, the power consumption amount measurement value associated with the selected monitor target device in the selected monitor target month and selected comparison target month. - Next, based on the measurement value of the power consumption amount obtained at the measurement
value obtaining portion 33 and the basic information set at the monitorinformation selecting portion 32, the displayinformation generating portion 34 generates the display information to be displayed as the monitor information. - An example of the generating process of the display information at the display
information generating portion 34 will be explained referring to a flowchart inFig. 6 . - First, based on the information selected at the monitor
information selecting portion 32, it is determined whether or not the time unit of the display period of the graph to be displayed is selected as a monthly unit (S1). - Since the time unit of the display period is set as a monthly unit ("YES" at S1), the process moves to step S2 to thereby determine whether or not "arranging and displaying per day by matching a day of the week" in the set basic information is selected (S2). If "arranging and displaying per day by matching a day of the week" is not selected ("NO" at S2), the start date of the comparison target month is not shifted but is set to "1st" and is so set as to correspond to "1st" set as the start date of the display period of the monitor target month (S3). Since "arranging and displaying per day by matching a day of the week" is selected in the basic information ("YES" at S2), the process moves to step S3 to thereby determine whether or not the day of the week of the start date of the monitor target month coincides with the day of the week of the start date of the comparison target month (S4).
- When the day of the week of the start date of the monitor target month coincides with the day of the week of the start date of the comparison target month ("YES" at S4), the start date of the comparison target month is set to "1st" and is so set as to correspond to "1st" set as the start date of the display period of the monitor target month (S3).
- When the day of the week of the start date of the monitor target month is determined not to coincide with the day of the week of the start date of the comparison target month at step S4 ("NO" at S4), the shift amount is calculated for each of such cases that the date is added and subtracted until the day of the week of the comparison target month coincides with the day of the week of the start date of the monitor target month (step S5).
- Then, of the cases of addition and subtraction, whichever having a smaller shift amount thus calculated is selected and used for shifting the date of the comparison target month.
- When the shift amount is smaller in the case of the addition, it is determined that the date of the comparison target month is added and then shifted ("YES" at step S6). Then, by adding and shifting the date, the date of the day of the week which coincides with the day of the week of the start date of the monitor target month is set as the start date of the comparison target month (S7).
- When the shift amount is smaller in the case of the subtraction, it is determined that the date of the comparison target month is subtracted and then shifted ("NO" at S6). Then, by subtracting and shifting the date, the date of the day of the week which coincides with the day of the week of the start date of the monitor target month is set as the start date of the comparison target month (S8).
- For example, when the day of the week of the start date of the monitor target month coincides as "Monday" with the day of the week of the start date of the comparison target month as "Calendar information of comparison target month (1)" illustrated in
Fig. 7 , the start date of the comparison target month is set to "1st" as is without adding the date. Further, when the day of the week of the start date of the monitor target month does not coincide with the day of the week of the start date of the comparison target month as "Calendar information of comparison target month (2)", first, for shifting such that the day of the week of the comparison target month coincides with the day of the week of the start date of the monitor target month, it is determined to implement the shift by addition since addition (+1 day) is smaller in shift amount than subtraction (-6 days). Then, the date "2nd" causing a coincided day of the week by addition is set as the start date of the comparison target month. - Likewise, when the day of the week of the start date of the monitor target month does not coincide with the day of the week of the start date of the comparison target month as "Calendar information of comparison target month (3)", first, for shifting such that the day of the week of the comparison target month coincides with the day of the week of the start date of the monitor target month, it is determined to implement the shift by addition since addition (+2 days) is smaller in shift amount than subtraction (-5 days). Then, the date "3rd" causing a coincided day of the week by addition is set as the start date of the comparison target month.
- Further, when the day of the week of the start date of the monitor target month does not coincide with the day of the week of the start date of the comparison target month as "Calendar information of comparison target month (5)", first, for shifting such that the day of the week of the comparison target month coincides with the day of the week of the start date of the monitor target month, it is determined to implement the shift by subtraction since subtraction (-1 day) is smaller in shift amount than addition (+6 days). Then, the last date "31st" of the previous month of the comparison target month causing a coincided day of the week by subtraction is set as the start date of the comparison target month.
- Likewise, when the day of the week of the start date of the monitor target month does not coincide with the day of the week of the start date of the comparison target month as "Calendar information of comparison target month (6)", firstly, for shifting such that the day of the week of the comparison target month coincides with the day of the week of the start date of the monitor target month, it is determined to implement the shift by subtraction since subtraction (-2 days) is smaller in shift amount than addition (+5 days). Then, the second to the last date "30th" of the previous month of the comparison target month causing a coincided day of the week by subtraction is set as the start date of the comparison target month.
- In this way, the date causing the coincided day of the week is set as the start date of the comparison target month and is so set as to correspond to "1st" set as the start date of the display period of the monitor target month.
- Implementing the processes as set forth above shifts the date of the comparison target month within a range of three days before and after the date of the monitor target month.
- Then, based on the information of the start date of the comparison target month so set at step S3, step S7, or step S8 as to correspond to the start date of the display period of the monitor target month and based on the measurement value of the power consumption amount obtained at the measurement
value obtaining portion 33, the displayinformation generating portion 34 generates the display information for arranging and displaying per day the power consumption amount measurement values of corresponding dates of the monitor target month and comparison target month. Further, even when the time unit of the display time of the graph to be displayed is not selected as a monthly unit at step S1 ("NO" at S1), the displayinformation generating portion 34 generates the display information with the selected time unit (S9). - In this way, adding or subtracting the date within a range of three days before and after the date of the monitor target month such that the day of the week of the start date of the comparison target month coincides with the day of the week of the start date of the monitor target month can match the day of the week with the smallest shift amount, thus making it possible to generate the display information with the shift of date suppressed to the minimum. That is, according to the embodiment, it is so configured that, in the coinciding of the day of the week between the monitor target month and the comparison target month, the day of the closest date is selected. Thus, the shift amount can be three days at maximum. As a result, in the case of a device such as an air conditioner having the power consumption amount changeable by seasonal change, it is possible to make an optimum comparison by reducing influence of the seasonal change.
- Further, referring to the flowchart in
Fig. 8 , an explanation will be made about another example of the generating process of the display information. This example adopts such a method that, when the day of the week of the start date of the monitor target month does not coincide with the day of the week of the start date of the comparison target month, the date of the comparison target month is shifted only to the addition side. - In
Fig. 8 , processes at steps S11 toS 14 are similar to the processes at steps S1 to S4 inFig. 6 , and therefore, detailed explanations thereof will be omitted. - At
step S 14, when it is determined that the day of the week of the start date of the monitor target month does not coincide with the day of the week of the start date of the comparison target month ("NO" at S 14), the date is sequentially added until the day of the start date of the comparison target date coincides with the day of the week of the start date of the monitor target month, to thereby set the date having the coincided day of the week as the start date of the comparison target month (S 15). - For example, when the day of the week of the start date of the monitor target month coincides as "Monday" with the day of the week of the start date of the comparison target month as "Calendar information of comparison target month (1)" illustrated in
Fig. 9 , the start date of the comparison target month is set to "1st" as is without adding the date. - Further, when the day of the week of the start date of the monitor target month does not coincide with the day of the week of the start date of the comparison target month as "Calendar information of comparison target month (2)", first, the date is shifted by adding "one day" (added number of days: +1) such that the day of the week of the start date of the comparison target month coincides with "Monday" which is the day of the week of the start date of the monitor target month. Then, the date "2nd" which is the date having the coincided day of the week is set as the start date of the comparison target month.
- Further, when the day of the week of the start date of the monitor target month does not coincide with the day of the week of the start date of the comparison target month as "Calendar information of comparison target month (3)", first, the date is shifted by adding "two days" (added number of days: +2) such that the day of the week of the start date of the comparison target month coincides with "Monday" which is the day of the week of the start date of the monitor target month. Then, the date "3rd" which is the date having the coincided day of the week is set as the start date of the comparison target month.
- Likewise, in the case of "Calendar information of comparison target month (4)" to "Calendar information of comparison target month (7)", the adding process is implemented and thereby the date having the coincided day of the week is set as the start date of the comparison target month. Then, the date having the coincided day of the week is so set as to correspond to "1st" set as the start date of the display period of the monitor target month.
- Implementing the processes as set forth above shifts the date of the comparison target month within a range of six days after the date of the monitor target month.
- Then, based on the information of the start date of the comparison target month so set at step S 13 or step S15 as to correspond to the start date of the display period of the monitor target month and based on the measurement value of the power consumption amount obtained at the measurement
value obtaining portion 33, the displayinformation generating portion 34 generates the display information for arranging and displaying per day the power consumption amount measurement values of corresponding dates of the monitor target month and the comparison target month. Further, even when the time unit of the display time of the graph to be displayed is not selected as a monthly unit at step S11 ("NO" at S11), the displayinformation generating portion 34 generates the display information with the selected time unit (S6). - In this way, by sequentially adding the date such that the day of the week of the start date of the comparison target month coincides with the day of the week of the start date of the monitor target month, the display information can be generated by only the data of the month that is selected as the comparison target month without having the comparison target data displayed in such a manner as to stride over the previous month. Further, when the power consumption amount measurement values are stored by being classified per month in the measurement
value management server 20, the process of obtaining the measurement value can be simplified. According to this method, since the start date of the monitor target month does not date back to the previous month, a feeling of strangeness can be reduced in the case of monthly comparison. Further, since the number of days to be shifted is six at a maximum in this method as well, even in the case the power consumption amount is changeable by seasonal change, it is possible to make a comparison by reducing influence of the seasonal change, although this method is slightly inferior to the embodiment illustrated inFig. 6 . - The generated display information is displayed in the
graph display area 140 of the energy savingmonitor screen 100 displayed in thedisplay portion 35. An example of the display information displayed in thegraph display area 140 is illustrated inFig. 10 . - According to the graph of
Fig. 10 , the data of the same day of the week of the power consumption amount measurement value of the comparison target month is arranged and displayed per day as set so as to correspond to the data per day of the power consumption amount measurement value of the monitor target month. - With the data displayed as above, even when the power consumption amount of the building where the non-operating day falls on Saturday and Sunday and the power consumption amount is greatly different from that of the weekday is monitored, a proper comparison can be made between the data of the different months in view of the influence by the day of the week. This can support the monitoring operation of the observer.
- Further, in terms of the power consumption amount measurement value of the monitor target month and the power consumption amount measurement value of the comparison target month, by selecting, in the setting of the basic information, whether "arrange and display per day by the same date" or "arrange and display per day by matching the day of the week", it is made possible not to implement the process of shifting the date when comparing, between the data of different months, the power consumption amount associated with a device uninfluenced by the day of the week, thus enabling to more simply implement the generating process of the display information.
- Further, as illustrated in the lower part of the comparison bar graph of the power consumption amount of each date of the
graph display area 140 inFig. 3 , the monitoring operation of the observer may be further supported by displaying the graph illustrating the reduction rate of the power consumption amount per day of the monitor target month compared with the comparison target month.. - Further, according to the embodiment, the explanation has been made about the case in which the measurement values of the power consumption amounts transmitted from the outdoor unit 10-1 and indoor units 10-2 to 10-4 are received by and stored in the measurement
value management server 20 but the present invention is not limited to this. It is possible to install a power meter for measuring the power consumption amounts of a plurality of outdoor units and indoor units and obtaining and storing, by the measurementvalue management server 20, the measurement value of the power consumption amount measured by the power meter. - In this case, it is possible to distribute the measurement value measured by the power meter at the operation rate or capacity rate of the outdoor units or indoor units connected to the power meter to thereby calculate and store the power consumption amount by each of the indoor units and outdoor units.
- Further, according to the embodiment, the power consumption amount measurement value of the monitor target month and the power consumption amount measurement value of the comparison target month are arranged and displayed per day on the bar graph for ease of comparison; however, they may be arranged and displayed per day in a form of a numeral table.
- While certain embodiments have been described, these embodiments have been presented by way of example only, and are not intended to limit the scope of the inventions. Indeed, the novel embodiments described herein may be embodied in a variety of other forms; furthermore, various omissions, substitutions and changes in the form of the embodiments described herein may be made without departing from the spirit of the inventions. The accompanying claims and their equivalents are intended to cover such forms or modifications as would fall within the scope and spirit of the inventions.
Claims (6)
- A power consumption amount display connected to a measurement value memory for memorizing a power consumption amount measurement value of a monitor target device, the power consumption amount display comprising:a monitor information selecting portion for a user to select a monitor target month and a comparison target month of the power consumption amount measurement value;a measurement value obtaining portion for obtaining, from the measurement value memory, the power consumption amount measurement values corresponding to the monitor target month and the comparison target month which are selected at the monitor information selecting portion;a display information generating portion capable of generating display information by
shifting a date of the comparison target month obtained at the measurement value obtaining portion, such that a day of a week of the date of the comparison target month coincides with a day of a week of a date of the monitor target month obtained at the measurement value obtaining portion,
allowing the date of the comparison target month to correspond to the date of the monitor target month, and
arranging and displaying per day the power consumption amount measurement values of the corresponding dates; anda display portion for displaying the display information generated at the display information generating portion. - The power consumption amount display according to claim 1, wherein
the monitor information selecting portion allows the user to further select whether to arrange and display per day the power consumption amount measurement value of the monitor target month and the power consumption amount measurement value of the comparison target month by the same date or by matching the day of the week;
when the monitor information selecting portion selects to arrange and display per day by the same date, the display information generating portion generates the display information so as to arrange and display per day by the same date the power consumption amount measurement value of the monitor target month and the power consumption amount measurement value of the comparison target month, and
when the monitor information selecting portion selects to arrange and display per day by matching the day of the week, the display information generating portion generates the display information by
shifting the date of the power consumption amount measurement value of the comparison target month, such that the day of the week of the date of the power consumption amount measurement value of the comparison target month coincides with the day of the week of the date of the power consumption amount measurement value of the monitor target month,
allowing the date of the power consumption amount measurement value of the comparison target month to correspond to the date of the power consumption amount measurement value of the monitor target month, and
arranging and displaying per day the power consumption amount measurement values of the corresponding dates. - The power consumption amount display according to claim 1 or 2, wherein
when shifting the date of the power consumption amount measurement value of the comparison target month, the display information generating portion implements the shifting within a range of three days before and after the date of the monitor target month. - The power consumption amount display according to claim 1 or 2, wherein
when shifting the date of the power consumption amount measurement value of the comparison target month, the display information generating portion implements the shifting within a range of six days after the date of the monitor target month. - The power consumption amount display according to claim 1 or 2, wherein
the display information generating portion generates the display information such that a graph in which the power consumption amount measurement values of the corresponding dates are arranged per day is displayed. - The power consumption amount display according to claim 1 or 2 wherein,
the display information generating portion generates the display information such that a numeral table in which the power consumption amount measurement values of the corresponding dates are arranged per day is displayed.
Applications Claiming Priority (2)
| Application Number | Priority Date | Filing Date | Title |
|---|---|---|---|
| JP2010132781 | 2010-06-10 | ||
| PCT/JP2011/061021 WO2011155285A1 (en) | 2010-06-10 | 2011-05-13 | Power consumption amount display device |
Publications (2)
| Publication Number | Publication Date |
|---|---|
| EP2581873A1 true EP2581873A1 (en) | 2013-04-17 |
| EP2581873A4 EP2581873A4 (en) | 2017-01-11 |
Family
ID=45097897
Family Applications (1)
| Application Number | Title | Priority Date | Filing Date |
|---|---|---|---|
| EP11792243.5A Ceased EP2581873A4 (en) | 2010-06-10 | 2011-05-13 | Power consumption amount display device |
Country Status (4)
| Country | Link |
|---|---|
| EP (1) | EP2581873A4 (en) |
| JP (1) | JP5564563B2 (en) |
| BR (1) | BR112012031462B1 (en) |
| WO (1) | WO2011155285A1 (en) |
Families Citing this family (8)
| Publication number | Priority date | Publication date | Assignee | Title |
|---|---|---|---|---|
| JP6111597B2 (en) * | 2012-01-20 | 2017-04-12 | 株式会社リコー | Management device, management program, and management system |
| JP5948675B2 (en) * | 2012-01-24 | 2016-07-06 | パナソニックIpマネジメント株式会社 | Energy management device, program |
| JP5855548B2 (en) * | 2012-09-05 | 2016-02-09 | 株式会社日立ビルシステム | Energy management system |
| JP5957350B2 (en) * | 2012-09-27 | 2016-07-27 | 株式会社東芝 | Information processing apparatus and information processing method |
| JP2014092814A (en) * | 2012-10-31 | 2014-05-19 | Panasonic Corp | Resource management system, resource management device and display device |
| JP5975891B2 (en) * | 2013-01-21 | 2016-08-23 | 三菱電機ビルテクノサービス株式会社 | Energy billing system and program |
| EP3113085A4 (en) | 2014-02-27 | 2017-01-18 | Panasonic Intellectual Property Corporation of America | Control method, information provision method and program |
| CN111007337B (en) * | 2019-12-04 | 2023-12-19 | 河南昊晟电子科技有限公司 | An intelligent monitoring and information transmission system for safe production electricity |
Family Cites Families (7)
| Publication number | Priority date | Publication date | Assignee | Title |
|---|---|---|---|---|
| JP4051735B2 (en) * | 1997-10-09 | 2008-02-27 | 松下電器産業株式会社 | Information aggregation device and aggregation method |
| WO2001013294A1 (en) * | 1999-08-18 | 2001-02-22 | Yusuke Kojima | Energy-saving assisting method and system for household |
| JP2002027668A (en) * | 2000-07-07 | 2002-01-25 | Hitachi Ltd | Demand monitoring support method and device |
| US7216021B2 (en) * | 2003-10-30 | 2007-05-08 | Hitachi, Ltd. | Method, system and computer program for managing energy consumption |
| JP2005308729A (en) * | 2004-03-26 | 2005-11-04 | Cosmo Life Kk | Electric power consumption monitoring system |
| JP2007257284A (en) * | 2006-03-23 | 2007-10-04 | Asahi Kasei Homes Kk | Living energy reduction support system |
| JP2009070339A (en) * | 2007-09-18 | 2009-04-02 | Denso Facilities Corp | Energy consumption information announcing system |
-
2011
- 2011-05-13 WO PCT/JP2011/061021 patent/WO2011155285A1/en not_active Ceased
- 2011-05-13 EP EP11792243.5A patent/EP2581873A4/en not_active Ceased
- 2011-05-13 JP JP2012519313A patent/JP5564563B2/en active Active
- 2011-05-13 BR BR112012031462-9A patent/BR112012031462B1/en not_active IP Right Cessation
Also Published As
| Publication number | Publication date |
|---|---|
| BR112012031462A2 (en) | 2016-11-08 |
| BR112012031462B1 (en) | 2020-11-24 |
| WO2011155285A1 (en) | 2011-12-15 |
| JP5564563B2 (en) | 2014-07-30 |
| EP2581873A4 (en) | 2017-01-11 |
| JPWO2011155285A1 (en) | 2013-08-01 |
Similar Documents
| Publication | Publication Date | Title |
|---|---|---|
| JP5564563B2 (en) | Power consumption display device | |
| US9412138B2 (en) | Dashboard for monitoring energy consumption and demand | |
| US8515878B2 (en) | Energy consumption management | |
| US9305383B2 (en) | Chart layout which highlights event occurrence patterns | |
| US20150177952A1 (en) | Computer Method And Apparatus For Automated Scheduling | |
| US20140129161A1 (en) | Interval analysis tool for energy consumption | |
| US10643157B2 (en) | Task progress update history visualization system | |
| US20150242783A1 (en) | Method for controlling information device, method for providing information, and computer-readable recording medium | |
| JP5282060B2 (en) | Energy usage indicator | |
| JP2012190385A (en) | Totaling and analysis support device, and computer program | |
| JPWO2017203598A1 (en) | Work support system, allocation system, and allocation method | |
| US8171036B2 (en) | Method and apparatus for processing data records in a given order upon receiving input data from a touchscreen | |
| JP5367832B2 (en) | Energy reduction equipment | |
| JP2009301292A (en) | Production schedule planning system, production schedule planning method, and production schedule planning program | |
| JP6451314B2 (en) | Management device, display device, management device control method, control program, and recording medium | |
| EP4365813A1 (en) | Evaluation device and program | |
| KR101762626B1 (en) | Apparatus and method for calculating electric power charge in power automation system | |
| JP2012113553A (en) | Stock price display device | |
| JP2009271698A (en) | Apparatus for supporting energy saving | |
| US20160300180A1 (en) | Product data analysis | |
| EP4365814A1 (en) | Information processing device, and program | |
| JP7442129B2 (en) | Energy management system and information presentation method | |
| JP2014052729A (en) | Energy control system | |
| JP2017026241A (en) | Energy amount display device and hot water supply system | |
| JP2008033816A (en) | Profit rate management device for construction industry |
Legal Events
| Date | Code | Title | Description |
|---|---|---|---|
| PUAI | Public reference made under article 153(3) epc to a published international application that has entered the european phase |
Free format text: ORIGINAL CODE: 0009012 |
|
| 17P | Request for examination filed |
Effective date: 20130109 |
|
| AK | Designated contracting states |
Kind code of ref document: A1 Designated state(s): AL AT BE BG CH CY CZ DE DK EE ES FI FR GB GR HR HU IE IS IT LI LT LU LV MC MK MT NL NO PL PT RO RS SE SI SK SM TR |
|
| DAX | Request for extension of the european patent (deleted) | ||
| RA4 | Supplementary search report drawn up and despatched (corrected) |
Effective date: 20161212 |
|
| RIC1 | Information provided on ipc code assigned before grant |
Ipc: H02J 3/00 20060101ALI20161206BHEP Ipc: G06F 3/048 20130101ALI20161206BHEP Ipc: G06F 1/28 20060101ALI20161206BHEP Ipc: G06Q 50/00 20120101AFI20161206BHEP Ipc: H02J 3/14 20060101ALI20161206BHEP |
|
| STAA | Information on the status of an ep patent application or granted ep patent |
Free format text: STATUS: EXAMINATION IS IN PROGRESS |
|
| 17Q | First examination report despatched |
Effective date: 20180723 |
|
| REG | Reference to a national code |
Ref country code: DE Ref legal event code: R003 |
|
| STAA | Information on the status of an ep patent application or granted ep patent |
Free format text: STATUS: THE APPLICATION HAS BEEN REFUSED |
|
| 18R | Application refused |
Effective date: 20201207 |