EP2574679B1 - Methods for in vitro hepatocellular carninoma prognosis - Google Patents
Methods for in vitro hepatocellular carninoma prognosis Download PDFInfo
- Publication number
- EP2574679B1 EP2574679B1 EP12182427.0A EP12182427A EP2574679B1 EP 2574679 B1 EP2574679 B1 EP 2574679B1 EP 12182427 A EP12182427 A EP 12182427A EP 2574679 B1 EP2574679 B1 EP 2574679B1
- Authority
- EP
- European Patent Office
- Prior art keywords
- gene
- survival
- hcc
- taf9
- ramp3
- Prior art date
- Legal status (The legal status is an assumption and is not a legal conclusion. Google has not performed a legal analysis and makes no representation as to the accuracy of the status listed.)
- Not-in-force
Links
Images





Classifications
-
- C—CHEMISTRY; METALLURGY
- C12—BIOCHEMISTRY; BEER; SPIRITS; WINE; VINEGAR; MICROBIOLOGY; ENZYMOLOGY; MUTATION OR GENETIC ENGINEERING
- C12Q—MEASURING OR TESTING PROCESSES INVOLVING ENZYMES, NUCLEIC ACIDS OR MICROORGANISMS; COMPOSITIONS OR TEST PAPERS THEREFOR; PROCESSES OF PREPARING SUCH COMPOSITIONS; CONDITION-RESPONSIVE CONTROL IN MICROBIOLOGICAL OR ENZYMOLOGICAL PROCESSES
- C12Q1/00—Measuring or testing processes involving enzymes, nucleic acids or microorganisms; Compositions therefor; Processes of preparing such compositions
- C12Q1/68—Measuring or testing processes involving enzymes, nucleic acids or microorganisms; Compositions therefor; Processes of preparing such compositions involving nucleic acids
- C12Q1/6876—Nucleic acid products used in the analysis of nucleic acids, e.g. primers or probes
- C12Q1/6883—Nucleic acid products used in the analysis of nucleic acids, e.g. primers or probes for diseases caused by alterations of genetic material
- C12Q1/6886—Nucleic acid products used in the analysis of nucleic acids, e.g. primers or probes for diseases caused by alterations of genetic material for cancer
-
- G—PHYSICS
- G01—MEASURING; TESTING
- G01N—INVESTIGATING OR ANALYSING MATERIALS BY DETERMINING THEIR CHEMICAL OR PHYSICAL PROPERTIES
- G01N33/00—Investigating or analysing materials by specific methods not covered by groups G01N1/00 - G01N31/00
- G01N33/48—Biological material, e.g. blood, urine; Haemocytometers
- G01N33/50—Chemical analysis of biological material, e.g. blood, urine; Testing involving biospecific ligand binding methods; Immunological testing
- G01N33/53—Immunoassay; Biospecific binding assay; Materials therefor
- G01N33/575—Immunoassay; Biospecific binding assay; Materials therefor for cancer
- G01N33/57557—Immunoassay; Biospecific binding assay; Materials therefor for cancer of other specific parts of the body, e.g. brain
-
- G—PHYSICS
- G16—INFORMATION AND COMMUNICATION TECHNOLOGY [ICT] SPECIALLY ADAPTED FOR SPECIFIC APPLICATION FIELDS
- G16B—BIOINFORMATICS, i.e. INFORMATION AND COMMUNICATION TECHNOLOGY [ICT] SPECIALLY ADAPTED FOR GENETIC OR PROTEIN-RELATED DATA PROCESSING IN COMPUTATIONAL MOLECULAR BIOLOGY
- G16B25/00—ICT specially adapted for hybridisation; ICT specially adapted for gene or protein expression
- G16B25/10—Gene or protein expression profiling; Expression-ratio estimation or normalisation
-
- G—PHYSICS
- G16—INFORMATION AND COMMUNICATION TECHNOLOGY [ICT] SPECIALLY ADAPTED FOR SPECIFIC APPLICATION FIELDS
- G16B—BIOINFORMATICS, i.e. INFORMATION AND COMMUNICATION TECHNOLOGY [ICT] SPECIALLY ADAPTED FOR GENETIC OR PROTEIN-RELATED DATA PROCESSING IN COMPUTATIONAL MOLECULAR BIOLOGY
- G16B40/00—ICT specially adapted for biostatistics; ICT specially adapted for bioinformatics-related machine learning or data mining, e.g. knowledge discovery or pattern finding
- G16B40/10—Signal processing, e.g. from mass spectrometry [MS] or from PCR
-
- G—PHYSICS
- G16—INFORMATION AND COMMUNICATION TECHNOLOGY [ICT] SPECIALLY ADAPTED FOR SPECIFIC APPLICATION FIELDS
- G16B—BIOINFORMATICS, i.e. INFORMATION AND COMMUNICATION TECHNOLOGY [ICT] SPECIALLY ADAPTED FOR GENETIC OR PROTEIN-RELATED DATA PROCESSING IN COMPUTATIONAL MOLECULAR BIOLOGY
- G16B40/00—ICT specially adapted for biostatistics; ICT specially adapted for bioinformatics-related machine learning or data mining, e.g. knowledge discovery or pattern finding
- G16B40/20—Supervised data analysis
-
- G—PHYSICS
- G16—INFORMATION AND COMMUNICATION TECHNOLOGY [ICT] SPECIALLY ADAPTED FOR SPECIFIC APPLICATION FIELDS
- G16B—BIOINFORMATICS, i.e. INFORMATION AND COMMUNICATION TECHNOLOGY [ICT] SPECIALLY ADAPTED FOR GENETIC OR PROTEIN-RELATED DATA PROCESSING IN COMPUTATIONAL MOLECULAR BIOLOGY
- G16B40/00—ICT specially adapted for biostatistics; ICT specially adapted for bioinformatics-related machine learning or data mining, e.g. knowledge discovery or pattern finding
- G16B40/30—Unsupervised data analysis
-
- C—CHEMISTRY; METALLURGY
- C12—BIOCHEMISTRY; BEER; SPIRITS; WINE; VINEGAR; MICROBIOLOGY; ENZYMOLOGY; MUTATION OR GENETIC ENGINEERING
- C12Q—MEASURING OR TESTING PROCESSES INVOLVING ENZYMES, NUCLEIC ACIDS OR MICROORGANISMS; COMPOSITIONS OR TEST PAPERS THEREFOR; PROCESSES OF PREPARING SUCH COMPOSITIONS; CONDITION-RESPONSIVE CONTROL IN MICROBIOLOGICAL OR ENZYMOLOGICAL PROCESSES
- C12Q2600/00—Oligonucleotides characterized by their use
- C12Q2600/106—Pharmacogenomics, i.e. genetic variability in individual responses to drugs and drug metabolism
-
- C—CHEMISTRY; METALLURGY
- C12—BIOCHEMISTRY; BEER; SPIRITS; WINE; VINEGAR; MICROBIOLOGY; ENZYMOLOGY; MUTATION OR GENETIC ENGINEERING
- C12Q—MEASURING OR TESTING PROCESSES INVOLVING ENZYMES, NUCLEIC ACIDS OR MICROORGANISMS; COMPOSITIONS OR TEST PAPERS THEREFOR; PROCESSES OF PREPARING SUCH COMPOSITIONS; CONDITION-RESPONSIVE CONTROL IN MICROBIOLOGICAL OR ENZYMOLOGICAL PROCESSES
- C12Q2600/00—Oligonucleotides characterized by their use
- C12Q2600/112—Disease subtyping, staging or classification
-
- C—CHEMISTRY; METALLURGY
- C12—BIOCHEMISTRY; BEER; SPIRITS; WINE; VINEGAR; MICROBIOLOGY; ENZYMOLOGY; MUTATION OR GENETIC ENGINEERING
- C12Q—MEASURING OR TESTING PROCESSES INVOLVING ENZYMES, NUCLEIC ACIDS OR MICROORGANISMS; COMPOSITIONS OR TEST PAPERS THEREFOR; PROCESSES OF PREPARING SUCH COMPOSITIONS; CONDITION-RESPONSIVE CONTROL IN MICROBIOLOGICAL OR ENZYMOLOGICAL PROCESSES
- C12Q2600/00—Oligonucleotides characterized by their use
- C12Q2600/118—Prognosis of disease development
-
- C—CHEMISTRY; METALLURGY
- C12—BIOCHEMISTRY; BEER; SPIRITS; WINE; VINEGAR; MICROBIOLOGY; ENZYMOLOGY; MUTATION OR GENETIC ENGINEERING
- C12Q—MEASURING OR TESTING PROCESSES INVOLVING ENZYMES, NUCLEIC ACIDS OR MICROORGANISMS; COMPOSITIONS OR TEST PAPERS THEREFOR; PROCESSES OF PREPARING SUCH COMPOSITIONS; CONDITION-RESPONSIVE CONTROL IN MICROBIOLOGICAL OR ENZYMOLOGICAL PROCESSES
- C12Q2600/00—Oligonucleotides characterized by their use
- C12Q2600/136—Screening for pharmacological compounds
-
- C—CHEMISTRY; METALLURGY
- C12—BIOCHEMISTRY; BEER; SPIRITS; WINE; VINEGAR; MICROBIOLOGY; ENZYMOLOGY; MUTATION OR GENETIC ENGINEERING
- C12Q—MEASURING OR TESTING PROCESSES INVOLVING ENZYMES, NUCLEIC ACIDS OR MICROORGANISMS; COMPOSITIONS OR TEST PAPERS THEREFOR; PROCESSES OF PREPARING SUCH COMPOSITIONS; CONDITION-RESPONSIVE CONTROL IN MICROBIOLOGICAL OR ENZYMOLOGICAL PROCESSES
- C12Q2600/00—Oligonucleotides characterized by their use
- C12Q2600/154—Methylation markers
-
- G—PHYSICS
- G16—INFORMATION AND COMMUNICATION TECHNOLOGY [ICT] SPECIALLY ADAPTED FOR SPECIFIC APPLICATION FIELDS
- G16B—BIOINFORMATICS, i.e. INFORMATION AND COMMUNICATION TECHNOLOGY [ICT] SPECIALLY ADAPTED FOR GENETIC OR PROTEIN-RELATED DATA PROCESSING IN COMPUTATIONAL MOLECULAR BIOLOGY
- G16B25/00—ICT specially adapted for hybridisation; ICT specially adapted for gene or protein expression
-
- G—PHYSICS
- G16—INFORMATION AND COMMUNICATION TECHNOLOGY [ICT] SPECIALLY ADAPTED FOR SPECIFIC APPLICATION FIELDS
- G16B—BIOINFORMATICS, i.e. INFORMATION AND COMMUNICATION TECHNOLOGY [ICT] SPECIALLY ADAPTED FOR GENETIC OR PROTEIN-RELATED DATA PROCESSING IN COMPUTATIONAL MOLECULAR BIOLOGY
- G16B40/00—ICT specially adapted for biostatistics; ICT specially adapted for bioinformatics-related machine learning or data mining, e.g. knowledge discovery or pattern finding
Definitions
- the present invention concerns methods for the in vitro prognosis of hepatocellular carcinoma (HCC).
- HCC hepatocellular carcinoma
- Hepatocellular carcinoma is one of the most frequent solid tumors worldwide and represents the third cause of mortality among deaths from cancer ( Bosch. F.X., et al. Semin Liver Dis 19, 271-85 (1999 )). Its frequency is particularly high in Asia and Africa due to the high frequency of viral hepatitis infections and to Aflatoxin B1 exposure (AFB1). Over the last 10 years the incidence of HCC has noticeably increased in United Kingdom, France and United States ( Taylor-Robinson, S.D. et al. Bmj 319, 640 (1999 ); Deuffic, S. et al. Lancet 351, 214-5 (1998 ). E1-Serag, H.B. & Mason, A.C. N Engl J Med 340, 745-50 (1999 )). This increase is linked to the increase of viral hepatitis C infections.
- Liver cirrhosis of any origin and dysplastic regenerative nodules have long been considered to be the likely precursors of HCC because of their frequent association with the HCC occurrence ( Edmondson, H.A. & Peters, R.L. Semin Roentgenol 18, 75-83 (1983 ); Thorgeirsson, S.S. & Grisham, J.W. Nat Genet 31, 339-46 (2002 )).
- HCC etiological factors particularly HBV infection which can induce chromosome instability ( Aoki, H., et al.
- HCC is thus a very heterogeneous group of tumors that differ by risk factors and genetic alterations.
- the prognosis of HCC is also very heterogeneous.
- the main treatment of HCC is surgical removal of HCC tumor, which may or not be followed by adjuvant chemotherapy.
- Chemotherapy may be very tiresome and painful for patients but is necessary in case of HCC with poor prognosis.
- a classification and prognosis method of HCC tumors would thus also be very helpful to decide whether or not to administer an adjuvant therapy to an HCC patient.
- HCC heterogeneity is well known to those skilled in the art, and quite a lot of efforts have been made to better classify and/or prognose HCC tumors in the prior art.
- HCC tumors have recently tried to classify HCC tumors by global transcriptome analysis. Some of them describe significant expression profiles alterations between HBV and HCV derived HCC respectively ( Okabe et al. Cancer Res. 2001 Mar 1;61(5):2129-37 ; Iizuka et al. Cancer Res. 2002 Jul 15;62(14):3939-44 ).
- HCC classification into two or three subgroups based on various histological features ( Chung et al. Mol Cells. 2002 D e c 31;14(3):382-7 ; Chen et al. Mol Biol Cell. 2002 Jun;13(6):1929-39 ; WO 2004/090163 ) or on survival probability ( Lee et al. Hepatology. 2004 Sep;40(3):667-76 ).
- HCC human Crohn's disease
- WO 2004/108964 discloses that TAF9 is differentially expressed between HCC samples and normal tissue.
- HCC tumors actually clustered into 6 distinct subgroups, closely associated with various clinical and genetic alterations. They also determined a 16-gene diagnostic predictor and a 24-gene predictor of class membership as well as a 5-gene signature predicting patient prognosis irrespective of HCC subgroup and which outperforms common clinical prognostic markers.
- HCC subgroups or classes hereafter named G1 to G6. These 6 subgroups were defined by a non-supervised analysis of global transcriptomic analysis of 57 HCC, 3 hepatocellular adenomas and 5 samples of pooled non-tumor tissue using Affymetrix HG-U133A GeneChipTM arrays. The 6 subgroups are highly associated with clinical and genetic factors, as displayed in the following Table 1, and summarized in Figure 1 . Table 1.
- the 6 subgroups may be defined using their main features as described in following Table 2. Table 2. Definition of the 6 subgroups by the presence (+) or absence (-) of clinical and genetic main features.
- the invention concerns a method of in vitro prognosis of global survival and/or survival without relapse from a liver HCC sample of a subject suffering from HCC, as defined in claim 1.
- the expression profile comprises and preferably consists of a combination of TAF9 and at least one, at least 2, at least 3, or at least 4 additional genes selected from the group consisting of NRCAM, PIR, RAMP3, SLC21A2, TNA, HN1, PSMD1, MRPS7, CDC20, ENO1, HLF, STRA13, RAGD, NRAS, ARFGEF2, RAB1A, G0S2, SMAD3, DNAJA3, HELO1, and RHOQ.
- a "prognosis" of HCC evolution means a prediction of the future evolution of a particular HCC tumor relative to the patient suffering of this particular HCC tumor.
- the methods according to the invention allow for both a global survival prognosis and a survival without relapse prognosis.
- global survival prognosis prognosis of survival, with or without relapse.
- the main current treatment against HCC is tumor surgical resection.
- a "bad global survival prognosis” is defined as the occurrence of death within the 3 years after liver resection, whereas a "good global survival prognosis” is defined as the lack of death during the 5 post-operative years.
- survival without relapse prognosis prognosis of survival in the absence of any relapse.
- a "bad survival without relapse prognosis” is defined as the presence of tumor-relapse within the two years after liver resection, whereas a “good survival without relapse prognosis” is defined as the lack of relapse during the 4 post-operative years.
- the expression profile comprises and preferably consists of a genes combination selected from:
- the expression profile comprises and preferably consists of the following genes combination:
- the expression profile comprises and preferably consists of a genes combination selected from:
- the expression profile comprises and preferably consists of the following genes combination:
- a particular combination of genes may be referred to as a predictor.
- the "liver HCC sample” may be any liver sample comprising HCC tumor tissue.
- the liver HCC sample is a liver HCC biopsy or a HCC tumor surgical resection.
- determining an expression profile is meant the measure of the expression level of a group a selected genes.
- the expression level of each gene may be determined in vitro either at the proteic or at the nucleic level, using any technology known in the art.
- the in vitro measure of the expression level of a particular protein may be performed by any dosage method known by a person skilled in the art, including but not limited to ELISA or mass spectrometry analysis. These technologies are easily adapted to any HCC sample. Indeed, proteins of the HCC sample may be extracted using various technologies well known to those skilled in the art for ELISA or mass spectrometry in solution measure. Alternatively, the expression level of a protein in a HCC tumor slice may be analysed using mass spectrometry directly on the tissue slice.
- the expression profile is determined in vitro at the nucleic level.
- the in vitro measure of the expression level of a gene may be carried out either directly on messenger RNA (mRNA), or on retrotranscribed complementary DNA (cDNA). Any method to measure the expression level may be used, including but not limited to microarray analysis, quantitative PCR, southern analysis.
- the expression profile is determined in vitro using a microarray.
- the expression profile is determined in vitro using quantitative PCR.
- the expression level of any gene is preferably normalized in comparison to the expression level of an internal control gene, generally a household gene, including but not limited to ribosomal RNA (such as for instance 18S ribosomal RNA) or genes such as actin or HPRT.
- ribosomal RNA such as for instance 18S ribosomal RNA
- genes such as actin or HPRT.
- the expression level of each gene may be determined in vitro either at the proteic or at the nucleic level, using any technology known in the art, in particular any technology described above.
- the expression profile is determined in vitro at the nucleic level.
- the expression profile is determined using a microarray.
- the expression profile is determined using quantitative PCR.
- the expression level of any gene is preferably normalized in comparison to the expression level of an internal control gene, generally a household gene, including but not limited to ribosomal RNA (such as for instance 18S ribosomal RNA) or genes such as actin or HPRT.
- a global survival and/or survival without relapse “score” is calculated.
- a "score” is a logistic function taking into account the n expression levels of each selected gene in said tumor sample, weighted by parameters that depend on the chosen combination of genes and may be calculated by optimization on a training group of HCC tumors, followed by validation on a test group of HCC tumors, as explained in more details in Example 3 of the present application.
- an appropriate score function with suitable parameters may be determined.
- the obtained score(s) of global survival and/or survival without relapse are then compared to at least one threshold value, which determines whether the prognosis is bad or good.
- such a threshold value may be determined using the same method as for ⁇ (gene t ) and ⁇ (gene t ) parameters, i.e. by optimization on a training group of HCC tumors, followed by validation on a test group of HCC tumors, as described in more details in Example 3 of the present application.
- the prognosis of a sample will be:
- the expression profile consists of the genes combination of the following Table 4 and is determined using quantitative PCR and the following formula:
- the threshold value used for the global survival prognosis is in an interval of 10%, preferably 9%, 8%, 7%, 6%, 5%; or even 4%, 3%, 2% or 1% around that displayed in Table 4.
- the threshold value used for the prognosis is in an interval of 10%, preferably 9%, 8%, 7%, 6%, 5%; or even 4%, 3%, 2% or 1% around that displayed in Table 5.
- ⁇ Ct(sample i , gene t ) values are calculated relative to ribosomal 18S RNA (R18S).
- the invention further concerns a method for the in vitro determination of the advisability of adjuvant therapy from a liver HCC sample of a subject suffering from HCC, comprising:
- adjuvant therapy is meant an additional antitumoral therapy that may be administered to a subject suffering from HCC after surgical HCC tumor resection.
- adjuvant therapies may include, without being limited to, chemotherapy and radiotherapy.
- the present invention further concerns a kit for the in vitro prognosis of global survival and/or survival without relapse from a liver HCC sample of a subject suffering from HCC, consisting of reagents for the in vitro determination of an expression profile as defined in claim 14.
- the kit for the in vitro prognosis of global survival and/or survival without relapse from a liver HCC sample of a subject suffering from HCC consists of reagents for the in vitro determination of an expression profile consisting of a combination of TAF9 and at least one, at least 2, at least 3, or at least 4 additional genes selected from the group consisting of NRCAM, PIR, RAMP3, SLC21A2, TNA, HN1, PSMD1, MRPS7, CDC20, ENO1, HLF, STRA13, RAGD, NRAS, ARFGEF2, RAB1A, G0S2, SMAD3, DNAJA3, HELO1, and RHOQ.
- the kit for the in vitro prognosis of global survival from a liver HCC sample of a subject suffering from HCC consists of reagents for the in vitro determination of an expression profile consisting of one of the following genes combinations:
- the kit for the in vitro prognosis of global survival from a liver HCC sample of a subject suffering from HCC consists of reagents for the in vitro determination of an expression profile consisting of the following genes combination:
- the kit for the in vitro prognosis of survival without relapse from a liver HCC sample of a subject suffering from HCC consists of reagents for the in vitro determination of an expression profile consisting of one of the following genes combinations:
- the kit for the in vitro prognosis of survival without relapse from a liver HCC sample of a subject suffering from HCC consists of reagents for the in vitro determination of an expression profile consisting of the following genes combination:
- reagents that are provided may allow for the prognosis of only global survival or survival without relapse, or may allow for the prognosis of both global survival and survival without relapse.
- reagents for the determination of an expression profile may include any reagent useful for the determination of a gene expression level. Said determination of the expression level may be carried out at the proteic or nucleic level.
- Reagents suitable for the determination of an expression profile at the proteic level include, without being limited to, antibodies and antibody fragments, reagents for mass spectrometry analysis, and protein microarrays.
- reagents suitable for the determination of an expression profile at the nucleic level include, without being limited to, amplification primers, nucleic probes and nucleic acid microarrays.
- said reagents may be provided with instructions for performing a method of in vitro prognosis of global survival and/or survival without relapse according to the invention.
- the said instructions may either
- the reagents and instructions may be provided together in the same package or separately in two distinct packages.
- Macroscopic and/or microscopic vascular invasion was recorded in 37% of the cases. Satellite tumors defined by nodule(s) found at less than 1 cm from the main tumor was recorded in 41 % of the cases.
- Overall and disease-free survival was assessed in 99 patients with a R0 complete resection after eliminating patients treated by liver transplantation or died within a 3 months post-operative period.
- the mean follow-up in whole series was 38 months (range 3-60 months) and it was 49 months for patients still alive.
- Microarray analyses were performed using 5 ⁇ g of total RNA of each sample as starting material and 20 ⁇ g cRNA per hybridization (GeneChip Fluidics Station 400) of HG-U133A Affymetrix GeneChipTM arrays. Images from each array were generated using HP GeneArray 2500 and analyzed following the manufacturer's protocols (http://www.affymetrix.com/support/technical/manual/expression_manual.affx). Except when indicated, all transcriptome analysis was carried out using either an assortment of R system software (v1.9.0) packages including those of Bioconductor (v1.1.1) or original R code. R packages and versions are indicated when appropriate.
- Raw feature data from 65 Affymetrix HG-U133A GeneChipTM microarrays were normalized and log 2 intensity expression summary values for each probe set were calculated using robust multi-array average (package affy V1.4.32). Probe sets corresponding to control genes or having a "_x_" annotation were masked yielding a total of 19,787 probe sets available for further analyses.
- RNA samples were dissected and stored at -80°C until DNA and RNA extraction using Qiaquick and Rneasy extraction kits, respectively (Qiagen).
- DNAs were quantified by fluorometry (Fluoroskan Thermo Lab-system), RNA were quantified using a spectrophotometer at 260nm (Nanodrop). The quality of DNA and RNA was controlled by gel electrophoresis followed by staining with ethidium bromide and Agilent 2100 bioanalyser. RNAs were qualified if the 28S/18S ratio was more than 1.5 for Affymetrix experiments and more than 1 for quantitative RT-PCR analyses.
- HBS and HBX copies of DNA were quantified in tumor and non-tumor DNAs using Syber green method (Applied Biosystems). Sequences of HBS and HBX DNA were determined in all tumors to ensure that primers used for quantification were chosen in regions outside viral polymorphisms or mutation. Quantification of viral DNA were related to a chromosome 22 PCR amplification. Efficacy of PCR amplification was measured at 95, 97 and 94% for HBS, HBX and chromosome 22 reference, respectively. Tumor and non-tumor DNA samples were also carefully quantified using fluorimetry with Hoechst and concentrations were checked by agarose gel electrophoresis.
- a low number of viral DNA copies in tumors was defined by a ratio HBX /reference and HBS /reference inferior to 0.5 (mean: 0.01, range: 0.002-0.5, standard error: 0.14).
- a high number of viral DNA copies in tumors was defined by a ratio HBX /reference and HBS /reference superior to 1.5 (mean: 25, range: 1.6-212, standard error: 46). No value was found between 0.5 and 1.6.
- DNA methylation at CDH1 and CDKN2A promoter was searched using bisulfite DNA and methylation specific amplification as previously described ( Lee, S. et al. Am J Pathol 163, 1371-8 (2003 ); Zochbauer-Muller, S. et al. Cancer Res 61, 249-55 (2001 )).
- RNA was reverse transcribed using the High capacity Archive kit and random hexamers (Applied Biosystems).
- Applied Biosystems For each sample and tested gene, 1 ⁇ l of cDNA corresponding to 2 ng of reverse transcribed RNA, were analyzed by TaqMan PCR analysis, in duplicate, using TaqMan® Low Density Array and the ABI PRISM® 7900HT System (Applied Biosystems). The quality of cDNAs was assessed using a R18S quantification by real time PCR (coefficient of variation 7% for the entire series).
- ⁇ CT (CT TESTED -CT R18S ) sample - (CT TESTED -CT R18S ) calibrator ( Livak, K.J. & Schmittgen, T.D. Methods 25, 402-8 (2001 )).
- ⁇ CT (CT TESTED -CT R18S ) sample - (CT TESTED -CT R18S ) calibrator ( Livak, K.J. & Schmittgen, T.D. Methods 25, 402-8 (2001 )).
- expression results of a gene were normalized to internal control ribosomal 18S and relatively to a calibrator, consisting in the mean expression level of the corresponding gene in non-tumor samples normalized to internal control ribosomal 18S.
- the values given in tables and graphs express the n-fold ratio of the gene expression in a tested sample compared to the mean of non tumor tissues.
- Frozen tissues were homogenized with a Dounce in 500 ⁇ l ice-cold RIPA Lysis buffer (Santa Cruz) and protein concentration was determined by BCA protein assay kit (Pierce). Immunoblot analysis was performed using 50 ⁇ g of proteins migrated on a SDS 6% polyacrilamide gel, a polyclonal E-cadherin antibody (SC-7870, 1:500, Santa Cruz), a peroxidase-conjugated secondary antibody (1:2000, Santa Cruz) and enhanced chemoluminescence (ECL, Pierce).
- Immunostaining was performed on 5 ⁇ m sections of formalin-fixed, paraffin-embedded liver samples, using monoclonal anti-ß-catenin (1:400, BD Biosciences 610153), biotinyled anti-mouse (1:200, Vector Laboratories BA-2000), Vectastain ABC Elite standard kit (Vector Laboratories PK-6100), DaB kit (Vector Laboratories SK-4100). Prior to immunostaining endogenous peroxidase was blocked and antigen retrieval was performed with 0.001M citrate buffer pH 7 in a pressure cooker (Biogenex).
- the classification of the 65 samples was based on a series of 24 hierarchical cluster analyses, obtained from 8 data subsets and 3 different linkage methods (average, complete and Ward's), using 1-Pearson correlation as a distance metric (package class V 7.2-2).
- the 8 data subsets corresponded to 8 unsupervised selections of the most varying expression profiles. Criteria for this selection were the significant difference of the variance for a given probe set compared to the median variance (P ⁇ 0.01), as well as different "robust" coefficient of variation thresholds (rCVs, calculated by dividing the standard deviation by the mean of a probe set log2 intensity values for n-2 samples eliminating the lowest and highest values). Between 99 and 6,712 probe sets were selected (99.5th and 60th rCV percentiles).
- the stability of the initial 24 dendograms was assessed by comparing each one to cluster results obtained after perturbation/resampling (100 iterations for each, see supplemental information for details on the stability score).
- This predictor was obtained with DLDA algorithm, and predicted set S1 with 100% success rate and set S2 with 94% success rate.
- Non-supervised transcriptome analysis defines clusters of tumors closely associated with clinical and genetic alterations
- HCC human cancer
- 3 hepatocellular adenomas 5 samples of pooled non-tumor tissues were analyzed using Affymetrix HG-U133A GeneChipTM arrays.
- HG-U133A GeneChipTM arrays Based on a non-supervised analysis we have developed a robust model of HCC classification that partitions HCC tumors into 6 subgroups ( Figure 2 ) each of which are highly associated with clinical and genetic factors based on Fisher exact tests (see above Tables 1 and 2).
- the 60 tumor samples are sub-divided into 2 major groups each being further subdivided into 3 smaller subgroups (named here G1 to G6).
- the different subgroups were characterized by TP53 mutations (G2 and G3), an HBV infection (G1 and G2), with low number of HBV DNA copies (G1) and CTNNB1 gene mutations (G5 and G6).
- the inventors' aim was to identify a class-predictor more adapted to a clinical environment by using the more time and cost efficient technology quantitative reverse-transcriptase PCR (QRT-PCR).
- QRT-PCR quantitative reverse-transcriptase PCR
- a predictor was first constructed using the Affymetrix data (see material and methods and following Table 6 ).
- This analysis identified a first 24-gene predictor (ALDH1L1, CD24, CD74, CFHR3, CYP4F12, DNAJA3, DSCR1, EPHA1, EPHB4, FAAH, FGFR2, FLJ10159, GLT8D1, HAL, MATN2, MRPS7, PAK2, PLXNB1, RAB1A, RHOQ, SLC27A5, SLPI, SMARCE1, STRA13) yielding a high success rate of class prediction using Affymetrix data (93.1%) but proved less satisfactory using QRT-PCR data (81%).
- Table 6 List of the 24 genes that were identified as the global HCC predictor for the Affymetrix samples using the Affymetrix data.
- a high correlation between the Affymetrix data and the QRT-PCR data was found with 135 out of the 140 selected genes (Spearman's rho median correlation coefficients of 0.84 using ⁇ Ct values).
- multiple sub-lists of a subset of 103 genes were tested genes in order to identify the best global predictor of the 6 HCC subgroups.
- the new sample is affected to the closest class.
- genes specifically deregulated in one or more HCC subgroups were identified based on the results from an all group-wise t -test analysis combined with ANOVA. For all lists of genes specific of HCC subgroups, association of genes in known pathways was also searched for. An enrichment of cell cycle/proliferation/ DNA metabolism genes specifically over-expressed in subgroups G1 to G3 was observed, corresponding to chromosome instable samples ( P ⁇ 0.01). A high number of genes specifically over-expressed were observed for the G1 subgroup (related to HBV infection with a low number of viral DNA, AXIN1 mutations, a younger age, a high sera level of AFP and frequent origin from Africa, Tables 1 and 2).
- genes encoding for proteins expressed during development were found: myosin heavy chain IIb, MYH4, the transcription factors SOX9 and SOX4, and parentally imprinted genes: insulin like growth factor 2 ( IGF2 ), paternally expressed gene 1, 3 and 10 ( PEG1, PEG3 and PEG10 ), alpha-fetoprotein ( AFP ) and sarcoglycan epsilon ( SGCE ).
- IGF2 insulin like growth factor 2
- PEG1, PEG3 and PEG10 paternally expressed gene 1, 3 and 10
- AFP alpha-fetoprotein
- SGCE sarcoglycan epsilon
- the differential expression of all these genes was validated using QRT-PCR on 109 tumors ( Figure 3a ).
- the imprinted genes tested were highly over-expressed in normal fetal livers ( Figure 3a ) .
- H19 mRNA was also over-expressed, not only in G1 samples but also in fetal samples, correlating with
- Subgroup G2 tumors (related to HBV infection with a high number of viral DNA copies, frequent local and vascular invasion and TP53 mutations) were significantly associated with over-expression cell cycle/proliferation/DNA metabolism genes ( P ⁇ 0.01), an enrichment that was equally observed in G3 (related to TP53 mutations and CDKN2A promoter methylation) and all chromosome instable samples ( P ⁇ 0.007).
- P ⁇ 0.009 A significant over-representation of over-expressed genes implicated in protein phosphorylation was also identified ( P ⁇ 0.009).
- G5 CTNNB1 mutated, no distant nodules
- under-expressed genes involved in stress and immune response such as IFI16, IL4R, IFI44, STAT1, IL10RA, CTSS and HLA-DPA1 / B1 ( P ⁇ 0.002) was observed.
- HCC subgroups G5 and G6 contain 23 and 11 tumors CTNNB1 mutated in 70 and 100% of the cases, respectively.
- ß-catenin targeted genes a list of 280 genes significantly over-expressed in G5 and G6 was found.
- two known ß-catenin target genes in the liver Cadoret, A. et al.
- These genes include: EPHB2, a tyrosine kinase receptor; MME, the enkephalinase CD10; MERTK, an oncogene tyrosine kinase; LAMA3, encoding the alpha-3 chain of the laminin 5; PAP / HIP, encoding a pancreatitis associated protein; SPARCL1 encoding hevin which is associated with extracellular matrix; and the transcription factor TBX3 ( Figure 4a ).
- CDH1 encoding the E-cadherin
- G6 subgroup in Affymetrix and QRT-PCR experiments, Figure 4a ) that may account for the local invasion of these HCC as shown by the quasi-constant presence of satellite nodules found around the principal tumor ( Figure 4c and Tables 1 and 2).
- the level of CDH1 mRNA down-regulation was showed to be highly related to the down-regulated expression of the E-cadherin protein in G6 consistent with the high level of promoter methylation of CDH1 in these tumors (data not shown).
- the inventors believe that the elucidation of the multifaceted classification of HCC was only possible in this application, compared to the previous published classifications into two subgroups, because (1) the studied series of tumors surgically treated in France included the main different risk factors of HCC, i.e. HBV and HCV infections, alcohol abuse and hemochromatosis and (2) the large number of clinical, histopathological and genetic annotations available for the studied sample population.
- the main clinical determinant of class membership is the HBV infection whereas the other main determinants are genetic and epigenetic alterations including chromosome instability, TP53 and CTNNB1 mutations, CDKN2A and CDH1 methylation and the parental imprinting (see Figure 1 ).
- HBV related tumors defining G1 and G2 subgroups are clearly molecularly distinct from the other etiologies. Tumors related to HCV infection and alcohol abuse are interspersed within the subgroups G3 to G6. The present transcriptomic classification has enabled the identification of new entities of tumors.
- Subgroup G1 includes HBV related tumors from younger patients (relative to the other HBV HCCs), frequently from Africa, with an equal sex ratio, a low number of viral DNA copies, frequent AXIN1 mutations, absence of TP53 mutation and an over-expression of genes normally parentally imprinted.
- HBV infection at the early age leads to a specific type of HCC demonstrating immature features with an abnormal parental gene imprinting possibly through the persistence of fetal hepatocytes or through the dedifferentiation of adult hepatocytes.
- Such diversity in tumors may be related to the high-risk populations found by epidemiological studies ( Brechot, C. Gastroenterology 127, S56-61 (2004 ); Yu, M.C. & Yuan, J.M. Gastroenterology 127, S72-8 (2004 )).
- EXAMPLE 3 Prognosis of HCC tumors
- each model was further assessed with the following resampling approach: we obtained 1,000 samplings by dividing 1,000 times, randomly, the whole series of 95 tumors in 2 groups of 47 and 48 samples each (equilibrating the number of death events between both groups); then, using each of the 42 lists of genes, for both groups of each sampling, multivariate Cox models were constructed and the logrank P value calculated from both models were stored. The combination of genes leading to the lowest median logrank P in both groups (among those 1,000 samplings) was kept and a predictor was then derived from this combination.
- the top 16 genes associated with prognostic status of global survival were determined to be: NRCAM, PIR, RAMP3, SLC21A2, TAF9, TNA, HN1, PSMD1, MRPS7, CDC20, ENO1, HLF, STRA13, RAGD, NRAS, ARFGEF2.
- Global survival score sample i ⁇ t ⁇ gene t • 2 - ⁇ ⁇ C ⁇ t sample i gene t - ⁇ gene t , wherein the different ⁇ (gene t ) and ⁇ (gene t ) parameters are those listed in the following Table 8. Table 8. Parameters to be used in the above formula for the best out of top 5 overall survival predictors Global survival ⁇ ⁇ gene 1 ( TAF9 ) 7.28 0.129 gene 2 ( NRCAM ) 1.59 0.252 gene 3 ( RAMP3 ) 0.14 -6.133 gene 4 ( PSMD1 ) 4.66 0.024 gene 5 ( ARFGEF2 ) 3.66 -0.025
- Disease Free survival ⁇ ⁇ gene 1 TAF9
- 7.28 0.127 gene 2 ( NRCAM ) 1.59 0.196 gene 3 ( RAMP3 ) 0.14 -3.886
- HCC belonging to groups G1 to G3 were slightly related to early relapse and early death compared to HCC from G4 to G6, showing that classification and prognosis are somehow related.
- genes identified in the present applications as useful to predict survival had never been previously found associated to patient prognosis and they may be implicated in general cellular processes such as proteasome degradation of proteins (PSMD1, see Yokota, K. et al. Mol Biol Cell 7, 853-70 (1996 )), the initiation of RNA transcription (TAF9, see Michel, B., Komarnitsky, P. & Buratowski, S. Mol Cell 2, 663-73 (1998 )) and cellular proliferation (NRCAM, see Sehgal, A., et al. Anticancer Res 19, 4947-53 (1999 ); and ARFGEF2, see Sheen, V.L. et al. Nat Genet 36, 69-76 (2004 )).
- PSMD1 proteasome degradation of proteins
- TAF9 the initiation of RNA transcription
- NRCAM see Sehgal, A., et al. Anticancer Res 19, 4947-53 (1999 )
- ARFGEF2 see Sheen, V.L. et
- the present global transcriptomic analysis has been carried out and validated using a large series of highly annotated tumors.
- This analysis has established a robust classification reflecting the natural diversity of human HCCs, the structural gene alterations and epigenetic de-regulations accumulated during tumor progression.
- the high diversity of HCC tumor has clinical implications and the present classification has yielded prognostic tools not only for surgically treated patients but also to further identify patients that will benefit of targeted therapies.
Landscapes
- Health & Medical Sciences (AREA)
- Life Sciences & Earth Sciences (AREA)
- Engineering & Computer Science (AREA)
- Physics & Mathematics (AREA)
- Medical Informatics (AREA)
- Chemical & Material Sciences (AREA)
- Biotechnology (AREA)
- General Health & Medical Sciences (AREA)
- Bioinformatics & Cheminformatics (AREA)
- Biophysics (AREA)
- Spectroscopy & Molecular Physics (AREA)
- Data Mining & Analysis (AREA)
- Genetics & Genomics (AREA)
- Molecular Biology (AREA)
- Evolutionary Biology (AREA)
- Bioinformatics & Computational Biology (AREA)
- Theoretical Computer Science (AREA)
- Immunology (AREA)
- Organic Chemistry (AREA)
- Proteomics, Peptides & Aminoacids (AREA)
- Public Health (AREA)
- Evolutionary Computation (AREA)
- Bioethics (AREA)
- Artificial Intelligence (AREA)
- Computer Vision & Pattern Recognition (AREA)
- Databases & Information Systems (AREA)
- Epidemiology (AREA)
- Software Systems (AREA)
- Analytical Chemistry (AREA)
- Pathology (AREA)
- Wood Science & Technology (AREA)
- Zoology (AREA)
- Microbiology (AREA)
- Biochemistry (AREA)
- Oncology (AREA)
- Hospice & Palliative Care (AREA)
- General Engineering & Computer Science (AREA)
- Biomedical Technology (AREA)
- Signal Processing (AREA)
- Hematology (AREA)
Description
- The present invention concerns methods for the in vitro prognosis of hepatocellular carcinoma (HCC). The present methods are based on the determination of the expression profile of particular gene combinations.
- Hepatocellular carcinoma (HCC) is one of the most frequent solid tumors worldwide and represents the third cause of mortality among deaths from cancer (Bosch. F.X., et al. Semin Liver Dis 19, 271-85 (1999)). Its frequency is particularly high in Asia and Africa due to the high frequency of viral hepatitis infections and to Aflatoxin B1 exposure (AFB1). Over the last 10 years the incidence of HCC has noticeably increased in United Kingdom, France and United States (Taylor-Robinson, S.D. et al. Bmj 319, 640 (1999); Deuffic, S. et al. Lancet 351, 214-5 (1998). E1-Serag, H.B. & Mason, A.C. N Engl J Med 340, 745-50 (1999)). This increase is linked to the increase of viral hepatitis C infections.
- Liver cirrhosis of any origin and dysplastic regenerative nodules have long been considered to be the likely precursors of HCC because of their frequent association with the HCC occurrence (Edmondson, H.A. & Peters, R.L. Semin Roentgenol 18, 75-83 (1983); Thorgeirsson, S.S. & Grisham, J.W. Nat Genet 31, 339-46 (2002)). As in other solid tumors, a large number of genetic alterations accumulate during the carcinogenetic process. Some of these genetic alterations are specific to HCC etiological factors, particularly HBV infection which can induce chromosome instability (Aoki, H., et al. Proc Natl Acad Sci U S A 93, 7300-4 (1996)) or insertional mutagenesis (Brechot, C. Gastroenterology 127, S56-61 (2004)). The other genetic alterations specifically associated with risk factors are the R249S TP53 gene mutation in Aflatoxin B1 exposed HCCs (Bressac, B. et al. Proc Natl Acad Sci U S A 87, 1973-7 (1990)), KRAS2 mutations observed in vinyl chloride associated HCCs (Weihrauch, M. et al. Br J Cancer 84, 982-9 (2001)) and TCF1 mutations associated with hepatocellular adenomas (Bluteau, O. et al. Nat Genet 32, 312-5 (2002)). Among the genetic alterations unrelated to HCC risk factors, microsatellite allelotypes and comparative genomic hybridization (CGH) studies have demonstrated recurrent chromosome aberrations. The most frequently deleted chromosome arms are 17p, 8p, 16q, 16p, 4q, 9p, 13q, 1p and 6q whereas the most frequent gains are found on chromosomes 1q, 7q, 8q et 17q (Boige, V. et al. Cancer Res 57, 1986-90 (1997); Wong, N. et al. Clin Cancer Res 6, 4000-9 (2000); Guan, X.Y. et al. Genes Chromosomes Cancer 29, 110-6 (2000)). HCC is thus a very heterogeneous group of tumors that differ by risk factors and genetic alterations.
- This results in a need for a more precise, reliable and easy to perform classification of HCC tumors. Indeed, it is for instance very difficult to search for efficient therapies against very heterogeneous tumors. In contrast, a reliable classification of HCC would allow to study each subgroup separately and to find out new targeted therapies for each subgroup. A reliable and easy to perform classification test would then allow to choose for each patient an adapted treatment.
- In particular, the prognosis of HCC is also very heterogeneous. Currently, the main treatment of HCC is surgical removal of HCC tumor, which may or not be followed by adjuvant chemotherapy. Chemotherapy may be very tiresome and painful for patients but is necessary in case of HCC with poor prognosis. A classification and prognosis method of HCC tumors would thus also be very helpful to decide whether or not to administer an adjuvant therapy to an HCC patient.
- HCC heterogeneity is well known to those skilled in the art, and quite a lot of efforts have been made to better classify and/or prognose HCC tumors in the prior art.
- For instance, several groups have recently tried to classify HCC tumors by global transcriptome analysis. Some of them describe significant expression profiles alterations between HBV and HCV derived HCC respectively (Okabe et al. Cancer Res. 2001 Mar 1;61(5):2129-37; Iizuka et al. Cancer Res. 2002 Jul 15;62(14):3939-44).
- Others describe a HCC classification into two or three subgroups based on various histological features (Chung et al. Mol Cells. 2002 D e c 31;14(3):382-7 ; Chen et al. Mol Biol Cell. 2002 Jun;13(6):1929-39;
WO 2004/090163 ) or on survival probability (Lee et al. Hepatology. 2004 Sep;40(3):667-76). - The inventors, in particular, have previously shown that genetic alterations are indeed closely associated with clinical characteristics of HCC defining two groups of HCC (Legoix, P. et al. Oncogene 18, 4044-6 (1999); Laurent-Puig, P. et al. Gastroenterology 120, 1763-73 (2001)). The first type of HCC was associated with not only a high level of chromosome instability, frequent TP53 and AXIN1 mutations but also closely linked to HBV infection and a bad prognosis. Conversely, the second subgroup of HCC tumors are chromosome stable, with a high incidence of activating ß-catenin alterations and not associated with viral infection.
- Concerning prognosis, several groups have described genes implicated in vascular invasion (Chen et al. Mol Biol Cell. 2002 Jun;13(6):1929-39; Qin et al. J Cancer Res Clin Oncol. 2004 Sep;130(9):497-513) or metastasis (Qin et al. J Cancer Res Clin Oncol. 2004 Sep;130(9):497-513; Ye et al. Nat Med. 2003 Apr ;9(4) :416-23).
- Others have identified groups of genes that allow for a relapse (Kurokawa et al. J Hepatol. 2004 Aug;41(2):284-91 ; Iizuka et al. Lancet. 2003 Mar 15 ;361(9361) :923-9;
WO 2005/017150 ) and/or survival (Lee et al. Hepatology. 2004 Sep;40(3):667-76 ;WO 2005/017150 ) prognosis. -
WO 2004/108964 (see Table 1 and claim 1) discloses that TAF9 is differentially expressed between HCC samples and normal tissue. - However, classification of HCC tumors into two, or even three subgroups, based only on histological or genetic features, is not probable to reflect precisely HCC high heterogeneity. In addition, there is still a need for a simple, easy to perform prognosis test.
- To further investigate genotype-phenotype correlations in HCC, identify pathways and/or biological processes deregulated in such heterogeneous tumors and find new prognostic factors, the inventors thus performed a comprehensive analysis at the clinical, genetic and transcriptomic level of a large series of 123 tumors.
- Although most prior studies were only able to subdivide HCC tumors into two subgroups, the inventors surprisingly found that HCC tumors actually clustered into 6 distinct subgroups, closely associated with various clinical and genetic alterations. They also determined a 16-gene diagnostic predictor and a 24-gene predictor of class membership as well as a 5-gene signature predicting patient prognosis irrespective of HCC subgroup and which outperforms common clinical prognostic markers.
- More precisely, the inventors have defined 6 distinct HCC subgroups or classes (hereafter named G1 to G6). These 6 subgroups were defined by a non-supervised analysis of global transcriptomic analysis of 57 HCC, 3 hepatocellular adenomas and 5 samples of pooled non-tumor tissue using Affymetrix HG-U133A GeneChip™ arrays. The 6 subgroups are highly associated with clinical and genetic factors, as displayed in the following Table 1, and summarized in
Figure 1 .Table 1. Associated clinical and genetic features with HCC subgroups Affymetrix hybridizations (57 HCC) QRT-PCR Validation set (63 HCC) Complete set (109 HCC) G1 HBV low copy number 0.03 0.04 <10-5 AFP > 100 IU/ml 0.01 0.006 <10-4 african origin 0.005 0.3* 0.004 female 0.06 0.05 0.002 Axin1 mutation 0.1 0.009 0.001 16q LOH 0.05 0.04 0.001 G2 HBV high copy nb <10-4 0.07 0.004 hemochromatosis 1* 0.005* 0.03 portal invasion 0.6 0.05 0.01 PIK3CA mutation 0.009* - - G3 TP53 R249S mutation 0.3* 0.002* 0.004 CDKN2A methylation 0.04 0.1 0.01 17p LOH 0.02 0.004 0.0002 5q LOH 0.02 0.02* 0.004 19p LOH 0.002 0.4* 0.004 21 q LOH 0.001 0.05 <10-3 22q LOH 0.007 0.02* <10-4 G1, G2, G3 FAL <10-3 <10-3 <10-3 4q LOH <10-3 0.002 <10-5 16p LOH 0.005 0.05 <10-3 Early relapse 0.005 1 0.3 Early death 0.05 0.7 0.4 G1, G2 Age < 63 years 0.03 0.08 0.001 13 q LOH 0.08 0.0001 <10-4 1p LOH 0.1 0.02 0.007 G2, G3 TP53 mutation 0.03 0.001 0.0001 G4 TCFl** mutation 0.01* -* -* no vascular invasion 0.2 0.03 0.01 G6 Satellite nodules 0.005 - 0.0005 G5, G6 CDH1 methylation 0.01 0.007 <10-3 CTNNB1 mutation <10-10 <10-5 <10-12 Shown are P values obtained from Fisher exact tests based on the given genetic or clinical variable and (i) the original cluster groups for the Affymetrix GeneChip series (ii) the predicted cluster group (based on the 16-gene predictor) for the QRT-PCR series. *Equal or less than 5 samples with this feature in the tested set of tumors. **including the 3 adenoma samples - As described in more details in Example 2, paragraph 2.2, the 6 subgroups may be defined using their main features as described in following Table 2.
Table 2. Definition of the 6 subgroups by the presence (+) or absence (-) of clinical and genetic main features. G1 G2 G3 G4 G5 G6 Chromosome instability + + + - - - Early relapse and death + + + - - - TP53 mutation - + + - - - HBV infection + + - - - - Low copy number + - - - - - High copy number - + - - - - CTNNB1 mutation - - - - + + Satellite nodules - - - - - + - The invention concerns a method of in vitro prognosis of global survival and/or survival without relapse from a liver HCC sample of a subject suffering from HCC, as defined in
claim 1. - The main features of the genes implicated in HCC prognosis are described in the following Table 3.
Table 3. Genes implicated in HCC prognosis Gene symbol* HUGO Gene name* "Entrez Gene" Gene ID** NRCAM neuronal cell adhesion molecule 4897 PIR pirin (iron-binding nuclear protein) 8544 RAMP3 receptor (calcitonin) activity modifying protein 310268 SLCO2A1 solute carrier organic anion transporter family, member 2A1 6578 TAF9 TAF9 RNA polymerase II, TATA box binding protein (TBP)-associated factor, 32kDa 6880 CLEC3B C-type lectin domain family 3, member B7123 HN1 hematological and neurological expressed 1 51155 PSMD1 proteasome (prosome, macropain) 26S subunit, non-ATPase, 1 5707 MRPS7 mitochondrial ribosomal protein S7 51081 CDC20 CDC20 cell division cycle 20 homolog (S. cerevisiae)991 ENO1 enolase 1, (alpha) 2023 HLF hepatic leukemia factor 3131 STRA13 stimulated by retinoic acid 13 homolog (mouse) 201254 RRAGD Ras-related GTP binding D 58528 NRAS neuroblastoma RAS viral (v-ras) oncogene homolog 4893 ARFGEF2 ADP-ribosylation factor guanine nucleotide-exchange factor 2 (brefeldin A-inhibited) 10564 RAB1A RAB1A, member RAS oncogene family 5861 G0S2 G0/ G1 switch 250486 SMAD3 SMAD, mothers against DPP homolog 3 (Drosophila) 4088 DNAJA3 DnaJ (Hsp40) homolog, subfamily A, member 39093 ELOVL5 ELOVL family member 5, elongation of long chain fatty acids (FEN1/Elo2, SUR4/Elo3-like, yeast) 60481 RHOQ ras homolog gene family, member Q 23433 C14orf156 chromosome 14 open reading frame 156 81892 NPEPPS aminopeptidase puromycin sensitive 9520 PDCD2 programmed cell death 25134 PHB prohibitin 5245 KIAA0090 KIAA0090 23065 IMP-3 IGF-II mRNA-binding protein 310643 KPNA2 karyopherin alpha 2 (RAG cohort 1, importin alpha 1)3838 KIAA0268 C219-reactive peptide 348477 UNQ6077 AAAP6077 375056 LOC440751 similar to C219-reactive peptide 440751 G6PD glucose-6-phosphate dehydrogenase 2539 STK6 serine/threonine kinase 6 6790 TFRC transferrin receptor (p90, CD71) 7037 GLA galactosidase, alpha 2717 TRIP 13 thyroid hormone receptor interactor 13 9319 SPP1 secreted phosphoprotein 1 (osteopontin, bone sialoprotein I, early T-lymphocyte activation 1) 6696 AKR1C1 aldo- keto reductase family 1, member C1 (dihydrodiol dehydrogenase 1; 20-alpha (3-alpha)-hydroxysteroid dehydrogenase)1645 AKR1C2 aldo- keto reductase family 1, member C2 (dihydrodiol dehydrogenase 2; bile acid binding protein; 3-alpha hydroxysteroid dehydrogenase, type III)1646 GIMAP5 GTPase, IMAP family member 5 55340 ADM adrenomedullin 133 CCNB1 cyclin B1 891 TKT transketolase (Wernicke-Korsakoff syndrome) 7086 AGPS alkylglycerone phosphate synthase 8540 RAN RAN, member RAS oncogene family 5901 NUDT9 nudix (nucleoside diphosphate linked moiety X)-type motif 9 53343 HRASLS3 HRAS- like suppressor 311145 HLA-DQA1 major histocompatibility complex, class II, DQ alpha 13117 NEU1 sialidase 1 (lysosomal sialidase) 4758 RARRES2 retinoic acid receptor responder (tazarotene induced) 2 5919 PAPOLA poly(A) polymerase alpha 10914 ABCB6 ATP-binding cassette, sub-family B (MDR/TAP), member 6 10058 BIRC5 baculoviral IAP repeat-containing 5 (survivin) 332 FLJ20273 RNA-binding protein 54502 C14orf109 chromosome 14 open reading frame 109 26175 CHKA choline kinase alpha 1119 TUBB2 tubulin, beta 27280 HMGB3 high- mobility group box 33149 TXNRD1 thioredoxin reductase 17296 IFITM1 interferon induced transmembrane protein 1 (9-27) 8519 KIAA0992 palladin 23022 MPPE1 Metallophosphoesterase 1 65258 KLRB1 killer cell lectin-like receptor subfamily B, member 13820 CCL5 chemokine (C-C motif) ligand 5 6352 SYNE1 spectrin repeat containing, nuclear envelope 123345 DNASE1L3 deoxyribonuclease I-like 3 1776 CYP2C18 cytochrome P450, family 2, subfamily C, polypeptide 181562 PACSIN2 protein kinase C and casein kinase substrate in neurons 211252 PON3 paraoxonase 3 5446 PPP2R1B protein phosphatase 2 (formerly 2A), regulatory subunit A (PR 65), beta isoform 5519 * All genes symbols and names are according to the HUGO Gene Nomenclature Committee (available at http://www.gene.ucl.ac.uk/nomenclature/)
** All available information concerning the listed genes of Table 3 can be retrieved from the "Entrez Gene" portal (http://www.ncbi.nlm.nih.gov/entrez/ query.fcgi?CMD=search&DB=gene) using the "Entrez Gene" Gene ID provided in Table 3. - In a preferred embodiment of a method of in vitro prognosis according to the invention, the expression profile comprises and preferably consists of a combination of TAF9 and at least one, at least 2, at least 3, or at least 4 additional genes selected from the group consisting of NRCAM, PIR, RAMP3, SLC21A2, TNA, HN1, PSMD1, MRPS7, CDC20, ENO1, HLF, STRA13, RAGD, NRAS, ARFGEF2, RAB1A, G0S2, SMAD3, DNAJA3, HELO1, and RHOQ.
- According to the invention, a "prognosis" of HCC evolution means a prediction of the future evolution of a particular HCC tumor relative to the patient suffering of this particular HCC tumor. The methods according to the invention allow for both a global survival prognosis and a survival without relapse prognosis.
- By "global survival prognosis" is meant prognosis of survival, with or without relapse. As stated before, the main current treatment against HCC is tumor surgical resection. As a result, a "bad global survival prognosis" is defined as the occurrence of death within the 3 years after liver resection, whereas a "good global survival prognosis" is defined as the lack of death during the 5 post-operative years.
- By "survival without relapse prognosis" is meant prognosis of survival in the absence of any relapse. A "bad survival without relapse prognosis" is defined as the presence of tumor-relapse within the two years after liver resection, whereas a "good survival without relapse prognosis" is defined as the lack of relapse during the 4 post-operative years.
- In a preferred embodiment of a method of in vitro prognosis of global survival according to the invention, the expression profile comprises and preferably consists of a genes combination selected from:
- TAF9, PIR, NRCAM, and RAMP3,
- TAF9, NRCAM, SLC21A2, and PSMD1,
- TAF9, NRCAM, RAMP3, and PSMD1,
- TAF9, NRCAM, NRAS, RAMP3, and PSMD1, or
- TAF9, NRCAM, RAMP3, PSMD1 and ARFGEF2.
- In a still more preferred embodiment of a method of in vitro prognosis of global survival according to the invention, the expression profile comprises and preferably consists of the following genes combination:
- TAF9, NRCAM, RAMP3, PSMD1 and ARFGEF2.
- Alternatively, in a preferred embodiment of a method of in vitro prognosis of survival without relapse according to the invention, the expression profile comprises and preferably consists of a genes combination selected from:
- TAF9, and G0S2,
- TAF9, NRCAM, and RAMP3,
- TAF9, G0S2, and RAMP3,
- TAF9, NRCAM, DNAJA3, and RAMP3, or
- TAF9, NRCAM, G0S2, DNAJA3, and RAMP3.
- In a still more preferred embodiment of a method of in vitro prognosis of survival without relapse according to the invention, the expression profile comprises and preferably consists of the following genes combination:
- TAF9, NRCAM, and RAMP3
- A particular combination of genes may be referred to as a predictor.
- For a method of in vitro prognosis of global survival and/or survival without relapse according to the invention, the "liver HCC sample" may be any liver sample comprising HCC tumor tissue. In a preferred embodiment of a method of in vitro prognosis of global survival and/or survival without relapse according to the invention, the liver HCC sample is a liver HCC biopsy or a HCC tumor surgical resection.
- By "determining an expression profile" is meant the measure of the expression level of a group a selected genes. The expression level of each gene may be determined in vitro either at the proteic or at the nucleic level, using any technology known in the art.
- For instance, at the proteic level, the in vitro measure of the expression level of a particular protein may be performed by any dosage method known by a person skilled in the art, including but not limited to ELISA or mass spectrometry analysis. These technologies are easily adapted to any HCC sample. Indeed, proteins of the HCC sample may be extracted using various technologies well known to those skilled in the art for ELISA or mass spectrometry in solution measure. Alternatively, the expression level of a protein in a HCC tumor slice may be analysed using mass spectrometry directly on the tissue slice.
- In a preferred embodiment of a method of in vitro prognosis according to the invention, the expression profile is determined in vitro at the nucleic level. At the nucleic level, the in vitro measure of the expression level of a gene may be carried out either directly on messenger RNA (mRNA), or on retrotranscribed complementary DNA (cDNA). Any method to measure the expression level may be used, including but not limited to microarray analysis, quantitative PCR, southern analysis. In a preferred embodiment of a method of in vitro prognosis according to the invention the expression profile is determined in vitro using a microarray. In another preferred embodiment of a method of in vitro prognosis according to the invention, the expression profile is determined in vitro using quantitative PCR. In any case, the expression level of any gene is preferably normalized in comparison to the expression level of an internal control gene, generally a household gene, including but not limited to ribosomal RNA (such as for instance 18S ribosomal RNA) or genes such as actin or HPRT. These technologies are also easily adapted to any HCC sample. Indeed, several well known technologies are available to those skilled in the art for extracting mRNA from a tissue sample and retrotranscribing mRNA into cDNA.
- In a method of in vitro prognosis of global survival and/or survival without relapse, the expression level of each gene may be determined in vitro either at the proteic or at the nucleic level, using any technology known in the art, in particular any technology described above.
- In a preferred embodiment of a method of in vitro prognosis of global survival and/or survival without relapse, the expression profile is determined in vitro at the nucleic level. Preferably, the expression profile is determined using a microarray. In another preferred embodiment, the expression profile is determined using quantitative PCR. In any case, the expression level of any gene is preferably normalized in comparison to the expression level of an internal control gene, generally a household gene, including but not limited to ribosomal RNA (such as for instance 18S ribosomal RNA) or genes such as actin or HPRT.
- In any method of in vitro prognosis of global survival and/or survival without relapse according to the invention, a global survival and/or survival without relapse "score" is calculated. For a selected combination of n genes (n ≥ 2), a "score" is a logistic function taking into account the n expression levels of each selected gene in said tumor sample, weighted by parameters that depend on the chosen combination of genes and may be calculated by optimization on a training group of HCC tumors, followed by validation on a test group of HCC tumors, as explained in more details in Example 3 of the present application.
- Depending on the technology used for the determination of the expression profile, an appropriate score function with suitable parameters may be determined.
- In particular, when the expression profile is determined using quantitative PCR, for a given samplei, a global survival or a survival without relapse "score" may be calculated using the following formula:

wherein - n represents the number of genes in the expression profile,
- for each genet, β(genet) and µ(genet) are parameters that depend on the chosen combination of genes and may be calculated by optimization on a training group of HCC tumors, followed by validation on a test group of HCC tumors, as described in more details in Example 3 of the present application.
- In any method of in vitro prognosis of global survival and/or survival without relapse according to the invention, the obtained score(s) of global survival and/or survival without relapse are then compared to at least one threshold value, which determines whether the prognosis is bad or good.
- For a given combination of genes in the expression profile, such a threshold value may be determined using the same method as for β(genet) and µ(genet) parameters, i.e. by optimization on a training group of HCC tumors, followed by validation on a test group of HCC tumors, as described in more details in Example 3 of the present application.
- For a given threshold value, the prognosis of a sample will be:
- a bad prognosis: if its score is superior or equal to said threshold value, or
- a good prognosis: if its score is strictly inferior to said threshold value.
- In a preferred embodiment of a method of in vitro prognosis of global survival according to the invention, the expression profile consists of the genes combination of the following Table 4 and is determined using quantitative PCR and the following formula:
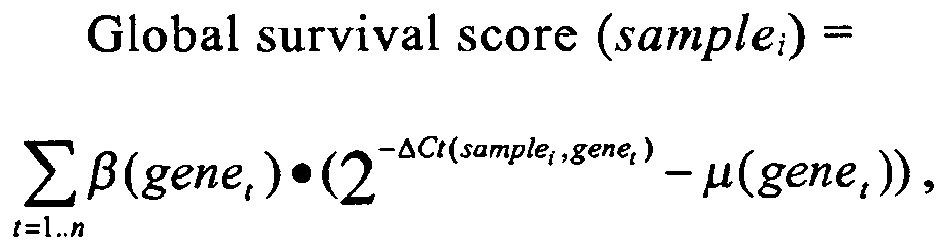
wherein - n represents the number of genes in the combination,
- t represents the number of each gene in the combination displayed in the following Table 4, and
- the value of each β(genet) and µ(genet) coefficients is in an interval of 10%, preferably 9%, 8%, 7%, 6%, 5%; or even 4%, 3%, 2% or 1% around those displayed in Table 4.
- In a most preferred embodiment, the threshold value used for the global survival prognosis is in an interval of 10%, preferably 9%, 8%, 7%, 6%, 5%; or even 4%, 3%, 2% or 1% around that displayed in Table 4.
- In a preferred embodiment of a method of in vitro prognosis of survival without relapse according to the invention, the expression profile consists of the genes combination of the following Table 5 and is determined using quantitative PCR and the following formula:

wherein - n represents the number of genes in the combination,
- t represents the number of each gene in the combination displayed in the following Table 5, and
- the value of each β(genet) and µ(genet) coefficients is in an interval of 10%, preferably 9%, 8%, 7%, 6%, 5%; or even 4%, 3%, 2% or 1% around those displayed in Table 5.
- In a most preferred embodiment, the threshold value used for the prognosis is in an interval of 10%, preferably 9%, 8%, 7%, 6%, 5%; or even 4%, 3%, 2% or 1% around that displayed in Table 5.
- Preferably, ΔCt(samplei, genet) values are calculated relative to ribosomal 18S RNA (R18S).
- The invention further concerns a method for the in vitro determination of the advisability of adjuvant therapy from a liver HCC sample of a subject suffering from HCC, comprising:
- a) determining a survival and/or survival without relapse prognosis according to any method as defined in claims 1-12, and
- b) determining the advisability of adjuvant therapy from said prognosis, wherein:
- in the presence of a bad prognosis, adjuvant therapy is recommended, whereas
- in the absence of a bad prognosis, adjuvant therapy is not recommended.
- By "adjuvant therapy" is meant an additional antitumoral therapy that may be administered to a subject suffering from HCC after surgical HCC tumor resection. Adjuvant therapies may include, without being limited to, chemotherapy and radiotherapy.
- The present invention further concerns a kit for the in vitro prognosis of global survival and/or survival without relapse from a liver HCC sample of a subject suffering from HCC, consisting of reagents for the in vitro determination of an expression profile as defined in claim 14.
- In a preferred embodiment, the kit for the in vitro prognosis of global survival and/or survival without relapse from a liver HCC sample of a subject suffering from HCC, consists of reagents for the in vitro determination of an expression profile consisting of a combination of TAF9 and at least one, at least 2, at least 3, or at least 4 additional genes selected from the group consisting of NRCAM, PIR, RAMP3, SLC21A2, TNA, HN1, PSMD1, MRPS7, CDC20, ENO1, HLF, STRA13, RAGD, NRAS, ARFGEF2, RAB1A, G0S2, SMAD3, DNAJA3, HELO1, and RHOQ.
- In a still more preferred embodiment, the kit for the in vitro prognosis of global survival from a liver HCC sample of a subject suffering from HCC consists of reagents for the in vitro determination of an expression profile consisting of one of the following genes combinations:
- TAF9, PIR, NRCAM, and RAMP3,
- TAF9, NRCAM, SLC21A2, and PSMD1,
- TAF9, NRCAM, RAMP3, and PSMD1,
- TAF9, NRCAM, NRAS, RAMP3, and PSMD1, or
- TAF9, NRCAM, RAMP3, PSMD1 and ARFGEF2.
- In a more preferred embodiment, the kit for the in vitro prognosis of global survival from a liver HCC sample of a subject suffering from HCC consists of reagents for the in vitro determination of an expression profile consisting of the following genes combination:
- TAF9, NRCAM, RAMP3, PSMD1 and ARFGEF2.
- In another preferred embodiment, the kit for the in vitro prognosis of survival without relapse from a liver HCC sample of a subject suffering from HCC consists of reagents for the in vitro determination of an expression profile consisting of one of the following genes combinations:
- TAF9, and G0S2,
- TAF9, NRCAM, and RAMP3,
- TAF9, G0S2, and RAMP3,
- TAF9, NRCAM, DNAJA3, and RAMP3, or
- TAF9, NRCAM, G0S2, DNAJA3, and RAMP3.
- In a more preferred embodiment, the kit for the in vitro prognosis of survival without relapse from a liver HCC sample of a subject suffering from HCC consists of reagents for the in vitro determination of an expression profile consisting of the following genes combination:
- TAF9, NRCAM, and RAMP3.
- In a kit for the in vitro prognosis of global survival and/or survival without relapse according to the invention, reagents that are provided may allow for the prognosis of only global survival or survival without relapse, or may allow for the prognosis of both global survival and survival without relapse.
- In any kit according to the invention, reagents for the determination of an expression profile may include any reagent useful for the determination of a gene expression level. Said determination of the expression level may be carried out at the proteic or nucleic level.
- Reagents suitable for the determination of an expression profile at the proteic level include, without being limited to, antibodies and antibody fragments, reagents for mass spectrometry analysis, and protein microarrays.
- Conversely, reagents suitable for the determination of an expression profile at the nucleic level include, without being limited to, amplification primers, nucleic probes and nucleic acid microarrays.
- In addition, in any kit according to the invention, said reagents may be provided with instructions for performing a method of in vitro prognosis of global survival and/or survival without relapse according to the invention. For instance, the said instructions may either
- 1) allow to the user himself to perform the prognosis, for instance by giving the necessary formulas and various parameters values, or
- 2) instruct the user to enter its expression data into a dedicated software that may be provided in the kit or may for instance be accessible on the internet.
- In this case, the reagents and instructions may be provided together in the same package or separately in two distinct packages.
- Having generally described this invention, a further understanding of characteristics and advantages of the invention can be obtained by reference to certain specific example 3 and
figure 5 which are provided herein for purposes of illustration only and are not intended to be limiting unless otherwise specified. Examples 1-2 andfigures 1-4 illustrate subject-matter which is not claimed in this application. -
-
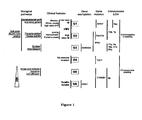
Figure 1 . Schematization of the different HCC subgroups defined by transcriptome analysis with their related clinical, genetic and pathways.
G1 to G6 indicates the HCC subgroups of tumors defined by transcriptome analysis. Vertical lines indicate significant associated features (see Table 1). LOH, loss of heterozygosity; Hemochrom, hemochromatosis; AFP, alpha-fetoprotein, HBV, hepatitis B virus. Solid and dotted lines underlining words indicate primarily over- and under-expressed genes in that particular functional category, respectively. -
Figure 2 . Unsupervised hierarchical clustering.
The dendrogram shown was obtained based on the expression profile of 6,712 probe sets of Affymetrix data from 57 HCC tumors, 3 adenomas and 5 pools of non-tumor tissues using Ward's linkage and 1-Pearson correlation coefficient. Clinical and genetic features are indicated in black and white boxes when positive and negative, respectively. In case of HBV infection, grey boxes indicate low number of viral DNA copies. FAL indicates Fractional Allelic Loss (black indicates tumors containing the deletion of more than 5 chromosome arms (FAL > 0.128)). Other abbreviations are as follows: CTNNB1, ß-catenin gene; Mut, mutation; meth, methylation; sat. nodules, satellite nodules at less than 1 cm from the principal tumor; AFP, Alpha-fetoprotein; CDH1, E-cadherin gene; portal inv., portal invasion. -
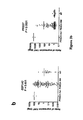
Figure 3 : Characterization of a selected number of HCC subgroup G1 specific genes using QRT-PCR.- a. Validation of genes specifically over-expressed in HCC predicted subgroup G1. IGF2 (Insulin Growth Factor 2), AFP (alpha feto protein), SOX9 (sex determined region Y-box9), MYH4 (Myosin heavy chain IIb), PEG1 and PEG3 (Paternally expressed 1 and 3) were analysed in 109 HCC. Box-plots show (extending from 25th percentile to the 75th percentile with a line at the median (50th percentile) the range of relative (tumor versus the mean of 21 non-tumor (T/NT)) log10 expression values obtained for the indicated gene in each of the 6 predicted subgroups (G1 to G6), in 21 non-tumor samples (NT) and in 19 fetal liver samples (FL). The whiskers extend above and below the box to show the highest and lowest values. The P values from ANOVA tests comparing the expression values in the different HCC subgroups are indicated below the gene symbol.
- b. Validation of genes over-expressed in PIK3CA mutated tumors (PIK3CA mut) compared to 107 non-mutated HCC (PIK3CA NM) for EEF1A2 (eukaryotic
translation elongation factor 1 alpha) and PRSS7 (enterokinase precursor). Resulting P values from a t-test comparing mutated and non-mutated samples are shown below the gene symbol.
-
Figure 4 : Characterization of HCC tumors leading to G5 and G6 subgroups.- a. Validation of genes specially over-expressed in HCC predicted subgroup G5 and G6 using QRT-PCR. Box-plots representing the range of relative (tumor versus mean of non-tumor (T/NT))
log 10 expression values obtained for GLUL (glutamine synthase), TBX3 (transcription factor TBX3), MME (membrane metallo-peptidase, CD10), LAMA3 (alpha-3 chain of laminin 5), SPARCLI (hevin), MERTK (c-mer proto-oncogene tyrosine kinase), PAP (Pancreatitis associated protein), EPHB2 (ephrin receptor B2), LEF1 (lymphoid enhancer-binding factor 1) and CDH1 (E-cadherin) analyzed in 109 HCC samples as described inFigure 3 . - b. ß-catenin immunostaining in representative cases of HCC mutated for ß-catenin and leading to G5 and G6. In case HCC303 (G5), note a low number of stained nuclei and an intense staining of the plasma membrane (white arrows). In case HCC305 (G6), cytoplasm and nuclei of hepatocytes are intensively stained (black arrows) without signal at the plasma membrane.
- c. Protein expression of E-cadherin in HCC of G6 using western blot (upper panels) compared to mRNA level of expression (group G5 and G6) using QRT-PCR (lower panel).
- a. Validation of genes specially over-expressed in HCC predicted subgroup G5 and G6 using QRT-PCR. Box-plots representing the range of relative (tumor versus mean of non-tumor (T/NT))
-
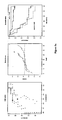
Figure 5 : Predictors of survival- a. Results for overall survival best predictor are shown. The ROC curve gives the specificity and sensibility for different score thresholds. Circles correspond to the training set (n=42) and crosses to the validation set (n=53). Squared circle and cross indicate the sensibility and specificity obtained for the chosen threshold (-0.393). Threshold was chosen in order to have a maximal success rate and a minimal P-value based on the Fisher exact test for the "predicted class/true class" contingency table of the training set samples. The Score curve shows the scores obtained for training set (upper curve) and validation set (lower curve) from the global survival score formula described in Example 3.2 with the parameters of Table 8, while the dotted line indicates the chosen threshold score. Horizontal strokes represent alive patients while vertical strokes represent dead patients. Survival curves for training set (dotted lines) and validation set (solid lines) are stratified by the indicated score threshold.
- b. Results for the best disease free survival predictor, are shown. The same representation code as in
Figure 5a is used. The Score curve shows the scores obtained from the disease-free score formula described in Example 3.2 with the parameters of Table 11. Horizontal strokes represent free of disease patients while vertical strokes represent not free of disease patients.
- Examples 1 and 2 fall outside the scope of the claims.
- A series of 120 hepatocellular carcinomas and 3 hepatocellular adenomas with their corresponding non-tumor tissues were collected from 123 patients treated by liver resection in three French surgical departments from 1992 to 1999. For all cases included in this study, full clinical data and follow up were available. All these tumors were clinically characterized as previously described (Laurent-Puig, P. et al. )). The sex ratio (M:F) was 1:4 and the mean age of the patients was 60 years (median age = 63 years, range from 18 to 85). The patients were born in France (92 cases), sub-Saharan Africa (11 cases), the Mediterranean area (7 cases), the Antilles (4 cases) and Asia (4 cases). Risk factors for HCC of hepatitis B virus, hepatitis C virus, alcohol abuse, and hemochromatosis occurred in 36, 30, 40 and 6% of the tumors, respectively. In 25 cases HCC were developed in the absence of known risk factor and in 16 cases at least two risk factors were found. The histological grade of tumor differentiation was assigned according to the Edmondson and Steiner grading system, grade I (7%), II (49%), III (39%) and IV (4%). In 103 cases the preoperative α-fetoprotein serum level was available and over 100 IU/ml for 37 patients. Macroscopic and/or microscopic vascular invasion was recorded in 37% of the cases. Satellite tumors defined by nodule(s) found at less than 1 cm from the main tumor was recorded in 41 % of the cases. Overall and disease-free survival was assessed in 99 patients with a R0 complete resection after eliminating patients treated by liver transplantation or died within a 3 months post-operative period. To minimize the effect of the occurrence of a second unrelated tumor in cirrhosis, we did not take into account survival data after 5 years. The mean follow-up in whole series was 38 months (range 3-60 months) and it was 49 months for patients still alive. Two qualitative prognosis variables were constructed: (1) "early-relapse" yes or no was defined by the presence of tumor-relapse within the two years after liver resection and the lack of relapse during the 4 post-operative years; (2) "early-death" yes or no was defined by the occurrence of death within the 3 years after liver resection and the lack of death during the 5 post-operative years. For the Affymetrix analysis, 5 pools of 3 non-tumor liver tissues matching the analyzed tumors were used including alcoholic cirrhosis (pool 1), alcoholic non-cirrhotic liver (pool 2), HBV non-cirrhotic liver (pool 3), HCV cirrhosis (pool 4) and HBV cirrhosis (pool 5). In the QRT-PCR experiments, these 15 non-tumors RNAs and 6 additional normal non-tumor liver RNAs were individually analyzed. 19 human fetal liver samples at different stage of pregnancy (ranging from 11 to 29 weeks of pregnancy) were also collected. The study was approved by the local Ethics Committee (CCPPRB Paris Saint-Louis), and informed consent was obtained in accordance with French legislation.
- Microarray analyses were performed using 5 µg of total RNA of each sample as starting material and 20 µg cRNA per hybridization (GeneChip Fluidics Station 400) of HG-U133A Affymetrix GeneChip™ arrays. Images from each array were generated using HP GeneArray 2500 and analyzed following the manufacturer's protocols (http://www.affymetrix.com/support/technical/manual/expression_manual.affx). Except when indicated, all transcriptome analysis was carried out using either an assortment of R system software (v1.9.0) packages including those of Bioconductor (v1.1.1) or original R code. R packages and versions are indicated when appropriate. Raw feature data from 65 Affymetrix HG-U133A GeneChip™ microarrays were normalized and log2 intensity expression summary values for each probe set were calculated using robust multi-array average (package affy V1.4.32). Probe sets corresponding to control genes or having a "_x_" annotation were masked yielding a total of 19,787 probe sets available for further analyses.
- For all samples, tumor and non-tumor DNAs were dissected and stored at -80°C until DNA and RNA extraction using Qiaquick and Rneasy extraction kits, respectively (Qiagen). DNAs were quantified by fluorometry (Fluoroskan Thermo Lab-system), RNA were quantified using a spectrophotometer at 260nm (Nanodrop). The quality of DNA and RNA was controlled by gel electrophoresis followed by staining with ethidium bromide and Agilent 2100 bioanalyser. RNAs were qualified if the 28S/18S ratio was more than 1.5 for Affymetrix experiments and more than 1 for quantitative RT-PCR analyses. Gene mutations were searched in
TP53 exons 2 to 11, CTNNB1 coding for ß-catenin exon 2 to 4,AXIN1 exon 1 to 10,PIK3CA exon 1 to 20, by direct sequencing tumor DNAs using a 3100 Applied Biosystems sequencer. Allelic losses and chromosome imbalance were searched by genotyping 400 markers from LMS2 microsatellites panel (Applied Biosystems) as previously described (Laurent-Puig, P. et al. )). For all samples related to HBV infection either by serological results or viral DNA amplification (Laurent-Puig, P. et al. )), HBS and HBX copies of DNA were quantified in tumor and non-tumor DNAs using Syber green method (Applied Biosystems). Sequences of HBS and HBX DNA were determined in all tumors to ensure that primers used for quantification were chosen in regions outside viral polymorphisms or mutation. Quantification of viral DNA were related to a chromosome 22 PCR amplification. Efficacy of PCR amplification was measured at 95, 97 and 94% for HBS, HBX and chromosome 22 reference, respectively. Tumor and non-tumor DNA samples were also carefully quantified using fluorimetry with Hoechst and concentrations were checked by agarose gel electrophoresis. A low number of viral DNA copies in tumors was defined by a ratio HBX/reference and HBS/reference inferior to 0.5 (mean: 0.01, range: 0.002-0.5, standard error: 0.14). A high number of viral DNA copies in tumors was defined by a ratio HBX/reference and HBS/reference superior to 1.5 (mean: 25, range: 1.6-212, standard error: 46). No value was found between 0.5 and 1.6. DNA methylation at CDH1 and CDKN2A promoter was searched using bisulfite DNA and methylation specific amplification as previously described (Lee, S. et al. Am J Pathol 163, 1371-8 (2003); Zochbauer-Muller, S. et al. Cancer Res 61, 249-55 (2001)). - For quantitative RT-PCR analyses, 3 µg of total RNA was reverse transcribed using the High capacity Archive kit and random hexamers (Applied Biosystems). For each sample and tested gene, 1 µl of cDNA corresponding to 2 ng of reverse transcribed RNA, were analyzed by TaqMan PCR analysis, in duplicate, using TaqMan® Low Density Array and the ABI PRISM® 7900HT System (Applied Biosystems). The quality of cDNAs was assessed using a R18S quantification by real time PCR (coefficient of
variation 7% for the entire series). The relative amount of the tested mRNA in samples, was determined using the 2-ΔΔCT method where ΔΔCT = (CTTESTED-CTR18S)sample - (CTTESTED-CTR18S)calibrator (Livak, K.J. & Schmittgen, T.D. Methods 25, 402-8 (2001)). Briefly, expression results of a gene were normalized to internal control ribosomal 18S and relatively to a calibrator, consisting in the mean expression level of the corresponding gene in non-tumor samples normalized to internal control ribosomal 18S. The values given in tables and graphs express the n-fold ratio of the gene expression in a tested sample compared to the mean of non tumor tissues. - Frozen tissues were homogenized with a Dounce in 500 µl ice-cold RIPA Lysis buffer (Santa Cruz) and protein concentration was determined by BCA protein assay kit (Pierce). Immunoblot analysis was performed using 50 µg of proteins migrated on a SDS 6% polyacrilamide gel, a polyclonal E-cadherin antibody (SC-7870, 1:500, Santa Cruz), a peroxidase-conjugated secondary antibody (1:2000, Santa Cruz) and enhanced chemoluminescence (ECL, Pierce). Immunostaining was performed on 5 µm sections of formalin-fixed, paraffin-embedded liver samples, using monoclonal anti-ß-catenin (1:400, BD Biosciences 610153), biotinyled anti-mouse (1:200, Vector Laboratories BA-2000), Vectastain ABC Elite standard kit (Vector Laboratories PK-6100), DaB kit (Vector Laboratories SK-4100). Prior to immunostaining endogenous peroxidase was blocked and antigen retrieval was performed with 0.001M
citrate buffer pH 7 in a pressure cooker (Biogenex). - The classification of the 65 samples was based on a series of 24 hierarchical cluster analyses, obtained from 8 data subsets and 3 different linkage methods (average, complete and Ward's), using 1-Pearson correlation as a distance metric (package class V 7.2-2). The 8 data subsets corresponded to 8 unsupervised selections of the most varying expression profiles. Criteria for this selection were the significant difference of the variance for a given probe set compared to the median variance (P < 0.01), as well as different "robust" coefficient of variation thresholds (rCVs, calculated by dividing the standard deviation by the mean of a probe set log2 intensity values for n-2 samples eliminating the lowest and highest values). Between 99 and 6,712 probe sets were selected (99.5th and 60th rCV percentiles). The stability of the initial 24 dendograms was assessed by comparing each one to cluster results obtained after perturbation/resampling (100 iterations for each, see supplemental information for details on the stability score). The model was also tested using an k-means clustering approach, with different initial number of clusters (k = 7..15). Using the best run out of 200 for each k (i.e. the one with the maximal distance between the k groups), samples were consistently grouped according to or as subsets of the 6 HCC subgroups.
- Fisher exact tests were carried in order to determine the significance of the association between different clinical and genetic variable and the 6 HCC tumor subgroups. Cluster results obtained from all combinations of linkage methods and gene lists were tested. In addition, variables with multiple modalities (e.g. HBT) were recoded into binomial values and each combination was tested. For the global predictor using the QRT-PCR results (see Table 1), 1,000 random permutations of class labels were used to correct the original P values which means that a P of 0 in the table equates to P < 0.001.
- To build a multi-class predictor, the 65 samples were divided into a training set (n = 36, 6 for each cluster group, randomly selected), and a test set (n = 24 tumors plus 5 non-tumor samples). A six steps learning strategy was then used: (1) gene supervised selection using F-tests and based on the training samples (n = 376 probe sets); (2) gene probe set filtering based on subsampling, on overall intensity levels and redundant HUGO gene symbols and false discovery rate control ( n = 258); (3) random sub-selections of 8 - 25 genes, segmented (or not) by gene cluster bins; (4) rule learning using 5 prediction algorithms; (5) rule selection based on success rate of predicting the test set; (6) rule validation using RT-PCR data and Fisher exact tests to assess the association between clinical and genetic factors to predicted groups.
- More precisely, the different steps were performed as follows:
- 1. Gene selection and 2. gene probe set filtering: using
S 1, we performed an F-test using a multivariate permutation test based on 1000 permutations of sample labels to correct for multiple testing (BRB ArrayToolsv3.0.beta2). This test yielded 1,041 probe sets that contained less than 10 false discoveries. We performed the same test on a sub-selection of 18 samples in S1 (3 randomly selected cases per group) and found 515 significant probe sets (here a p value < 0.001 was used as the threshold criteria due to the low number of samples per class which renders the permutation test unreliable). The intersection of these two lists and filtering out probe sets that had a maximal intensity less than 100 units in all 6 HCC cluster groups yielded 258 probe sets. For the probe sets corresponding to the same HUGO gene symbol, we kept one probe set per symbol by eliminating probe sets having a lower F statistic reducing the list to 225 probe sets. - 3. Random sub-selections of genes: (i) Starting from the 225 probe sets list, we generated, at random, 1000 sub-lists of k number of probe sets (k = 8..25) per list (total of 18,000 sub-lists).(ii) From the 225 probe sets list, we generated 1,000 sub-lists of k number of probe sets (k =15, 30, total of 2,000 sub-lists), by choosing the same proportion of genes from individual gene-cluster bins. Gene-cluster bins were constructed based on complete linkage clustering of the 225 probe sets (using 1-Pearson coefficient as the distance metric), and then cutting the dendrogram to yield 15 cluster nodes (n = 4 to 49 probe sets by cluster bin); (iii) We also generated 1,000 sub-lists of k probe sets (k = 8, 16, 24, a total of 3,000 sub-lists) equally representing gene-cluster bins derived from an average linkage clustering, (1-Pearsoncoefficient) and cutting the dendrogram into 20 nodes, merging small cluster nodes(represented by less than 10 probe sets or a correlation higher than 0.3 with closest neighboring node) yielding a total of 8 major gene-cluster bins (n = 9 - 87 probe sets by cluster bin).
- 4. Rule learning: The expression data from the set S1, restricted to the 23,000 sub-lists ofprobe sets, served to train 5 prediction algorithms (SVM (e1071, v1.4-1), PAM (pamr,v1.14.2), k-NN (class, v7.2-2), DQDA and DLDA (sma, v0.5.14)), yielding 115,000predictors.
- 5. Rule selection: For each algorithm, in combination with each value of k ( (i) k = 8..25; (ii)k = 15,30 ; (iii) k = 8, 16, 24), we selected the best sub-list among 1,000, based on success rate of the corresponding predictor (trained with training set) to classify validation set samples(in case of equality the first sublist encountered was kept); this selection gave 115 predictors. Among those, 7 predictors, related to 6 distinct sub-lists, gave a success rate to classify samples from the validation set higher than 93%. We selected the 24 genes sub-list related to2 predictors (algorithms SVM and PAM) among those 6 sub-lists. We observed that this sublist had a success rate of 97% using Nearest Shrunken Centroids (PAM) of predicting true class membership of the 36 samples in the training set (100% for SVM) and 93.1% of the 29 samples in the validation group.
- 6. Rule validation: RT-PCR data were obtained for 23 out of the 24 genes in the previouslyselected sub-list (no primers were available for CD24), along a series of 109 tumors, including 46 samples previously analysed with Affymetrix HG-U133A GeneChipTMmicroarrays (28 in the original training set (S1a), and 18 HCC in the original validation set(S2a)). Using ΔCt data (with 18S as control gene) for the set S1a, we trained 5 prediction algorithms (SVM, PAM, k-NN, DQDA and DLDA) : applied to set S2a, the predictor derived from SVM yielded 81 % success rate (100% for S1a).
- Given the partial success of the 24 genes predictor transferred from Affymetrix data to PCR data, a new predictor was searched, starting the process from an initial list of 103 genes among the 140 genes analyzed by QRT-PCR. These 103 genes corresponded to the supervised statistical tests comparing the different cluster groups, using all 65 samples in the Affymetrix data set. The same learning strategy was then followed as described for Affymetrix data: random sub-selections of genes; rule learning; rule selection; rule validation. At random, 500 sub-lists of k number of probe sets (k = 5..16) per list (total of 6,000 sub-lists) were generated. Using ΔCt data (control gene 18S), 5 prediction algorithms (SVM, PAM, kNN, DQDA, DLDA) were trained on set S1 and obtained 30,000 predictors. For each algorithm, in combination with each value of k, the best sub-list among 500 was selected, based on success rate of the corresponding predictor (trained with set S1) to classify test set S2 (in case of equality the first sub-list encountered was kept); this selection gave 60 predictors. Among those, 3 predictors gave the highest success rate to classify test set S2, one of which, yielded a success rate (of S2) higher than 88% for 3 different algorithms, and was therefore considered as the best. This predictor was obtained with DLDA algorithm, and predicted set S1 with 100% success rate and set S2 with 94% success rate. As a validation of the selected predictor, the relevance of predicted classes for set S3 was assessed via the P-value of a Fisher exact test measuring the level of association between predicted classes (1,2,3 vs 4,5,6) and FAL (P = 8.5 10-4), as well as between predicted classes (4 vs 5,6) and CTNNB1 mutation (P = 5 10-5).
- All univariate t and F tests were performed using BRB ArrayTools (v3.2 b5) on the log2-transformed intensity values for the 19,787 probe sets. A nominal significance level of each univariate test of P < 0.001 as well as 90% confidence of less than 10 false discoveries was designated based on a multivariate test using 1,000 permutations. All inter-group t-tests were performed to identify genes that were found to be differentially expressed between a given subgroup (or a combination of subgroups) and the remaining samples (Gx versus Gnon-x) as well as the between 5 pooled non-tumoral samples (Gx versus non-tumoral). Genes that were found by both types of tests for a given subgroup (and not between any other group comparison) as well as being significant (P < 0.001, less than 10 false discoveries as described) in an ANOVA analysis (F test described above) were considered to be a HCC subgroup (or combination of subgroups) specific gene.
- For the perturbation, random Gaussian noise (µ = 0, σ = 1.5 x median variance calculated from the data set) was added to a given data set. Each dendrogram was partitioned into k groups (k = 2..18) and the proportion of sample-pair retained in each group compared to the initial dendrogram was used as a stability score (score ranges from 0 and 1 where a score of 1 means the perturbation (or resampling) had no effect on the membership of the cluster group).
- Fifty-seven HCC, 3 hepatocellular adenomas and 5 samples of pooled non-tumor tissues were analyzed using Affymetrix HG-U133A GeneChip™ arrays. Based on a non-supervised analysis we have developed a robust model of HCC classification that partitions HCC tumors into 6 subgroups (
Figure 2 ) each of which are highly associated with clinical and genetic factors based on Fisher exact tests (see above Tables 1 and 2). Based on the conducted analysis, the 60 tumor samples are sub-divided into 2 major groups each being further subdivided into 3 smaller subgroups (named here G1 to G6). This classification was found to be extremely robust when confronted with perturbation/resampling tests (mean reproducibility scores for each cluster analysis was found to be at least 0.9 for the 2 major groups and the 6 subgroups) as well as consistent with an iterative k-means cluster analysis (see Materials and Methods). Moreover the topology of the sample partition was conserved across different gene lists and cluster linkage methods. The two major groups correspond to chromosome instable (G1, G2 and G3) and stable (G4, G5 and G6) samples since G1 to G3 showed significant higher fractional allelic loss (FAL) than G4 to G6 (P < 10-3, Table 2). In addition HCC belonging to G1 to G3 groups were slightly related to early relapse and early death compared to HCC from G4 to G6 (P = 0.05, Table 2). The different subgroups were characterized by TP53 mutations (G2 and G3), an HBV infection (G1 and G2), with low number of HBV DNA copies (G1) and CTNNB1 gene mutations (G5 and G6). The presence of distant cancerous nodules found less than 1 centimeter away from the primary tumor was associated with G6 (P = 0.04, Table 2), indicating a high potential of local invasion of these tumors. The 5 sample-pools of non-tumor liver tissues clustered tightly together and was found within a large, heterogeneous group (G4) containing 20 tumors, four of which, in the same small cluster, had TCF1 mutations (3 adenomas and one HCC). - Given the clinical relevance of the subgroups and the diagnostic potential of this classification, the inventors' aim was to identify a class-predictor more adapted to a clinical environment by using the more time and cost efficient technology quantitative reverse-transcriptase PCR (QRT-PCR). In order to search for genes that can predict class membership to the 6 HCC subgroups a predictor was first constructed using the Affymetrix data (see material and methods and following Table 6). This analysis identified a first 24-gene predictor (ALDH1L1, CD24, CD74, CFHR3, CYP4F12, DNAJA3, DSCR1, EPHA1, EPHB4, FAAH, FGFR2, FLJ10159, GLT8D1, HAL, MATN2, MRPS7, PAK2, PLXNB1, RAB1A, RHOQ, SLC27A5, SLPI, SMARCE1, STRA13) yielding a high success rate of class prediction using Affymetrix data (93.1%) but proved less satisfactory using QRT-PCR data (81%).
Table 6. List of the 24 genes that were identified as the global HCC predictor for the Affymetrix samples using the Affymetrix data. Included are the HUGO gene symbol, the F-statistic from an ANOVA between all 6 classes of samples and associated geometric mean of non-log intensity values per HCC sub-group (G1 -G6). Gene HUGO Symbol F statistic G1 G2 G3 G4 G5 G6 ALDH1L1 13.1 221 226 766 993 2213 2123 CD24 10.7 511 235 274 66 75 17 CD74 5.7 1343 2008 2481 1896 1121 4973 CFHR3 /// CFHR4 5.8 368 1000 174 2527 1567 980 CYP4F12 8.4 341 347 243 461 595 459 DNAJA3 6.8 412 521 621 662 727 658 DSCR1 5.5 139 134 136 205 170 265 EPHA1 16.2 432 972 189 530 230 120 EPHB4 9.3 538 264 204 261 288 220 FAAH 5.6 140 134 127 258 169 186 FGFR2 20.8 373 515 71 47 25 29 FLJ10159 11.9 896 289 168 116 89 40 GLT8D1 8.5 471 433 463 542 933 868 HAL 27.7 380 1065 139 298 83 66 MATN2 10.4 291 180 114 190 60 37 MRPS7 6.5 321 389 725 403 438 448 PAK2 7.6 297 199 337 143 150 119 PLXNB1 6.9 482 343 194 207 304 217 RAB1A 6.5 1960 2490 2388 1820 1601 1722 RHOQ 5.2 220 389 366 259 191 204 SLC27A5 12.2 282 564 437 2309 2147 2152 SLPI 18.0 1148 2766 313 1829 159 141 SMARCE1 7.3 439 395 489 265 303 253 STRA13 13.7 433 570 1170 583 959 1151 - Thus, a series of supervised tests using Affymetrix data and relevant clinical and genetic annotations (i.e. the mutational status of TP53, CTNNB1 and AXIN1 genes, presence and titer of HBV, early relapse and overall survival) was performed. A list of 140 genes was assembled that were shown to be significant in one or more of these supervised tests. All but five of these selected genes were validated by QRT-PCR in 109 HCC tumors (including 46 among the 57 HCC analyzed using Affymetrix microarrays and a validation set of 63 HCC) and 21 non-tumor liver tissues. A high correlation between the Affymetrix data and the QRT-PCR data was found with 135 out of the 140 selected genes (Spearman's rho median correlation coefficients of 0.84 using ΔCt values). Using the QRT-PCR data, multiple sub-lists of a subset of 103 genes (among the 135 tested) were tested genes in order to identify the best global predictor of the 6 HCC subgroups. For this purpose, the 46 HCCs analyzed with Affymetrix microarrays were divided into a training (n=28) and test set (n=18). All genes listed in the previously described Table 3 were at least shown to be significant in one or more of these supervised tests, and most of them were present in at least one or two good classification predictors. The best success rate of predicting true class membership of the training set (100%) and test set (94.4%) was obtained with the Ct values of 16 genes (RAB1A, PAP, NRAS, RAMP3, MERTK, PIR, EPHA1, LAMA3, G0S2, HN1, PAK2, AFP, CYP2C9, CDH2, HAMP, SAE1) using the DLDA prediction algorithm.
- The best predictor follows the following formulas:

wherein
and wherein the different µ(classk, genet) and σ(genet) parameters are those listed in Table 7.Table 7. Parameters for each gene and for each class used in the above quantitative PCR Distance formula (IV) µ class 1 class 2 class 3 class 4 class 5 class 6 σ gene 1 (RABIA) -16.39 -16.04 -16.29 -17.15 -17.33 -16.95 0.23 gene 2 (PAP) -28.75 -27.02 -23.48 -27.87 -19.23 -11.33 16.63 gene 3 (NRAS) -16.92 -17.41 -16.25 -17.31 -16.96 -17.26 0.27 gene 4 (RAMP3) -23.54 -23.12 -25.34 -22.36 -23.09 -23.06 1.23 gene 5 (MERTK) -18.72 -18.43 -21.24 -18.29 -17.03 -16.16 7.23 gene 6 (PIR) -18.44 -19.81 -16.73 -18.28 -17.09 -17.25 0.48 gene 7 (EPHA1) -16.68 -16.51 -19.89 -17.04 -18.70 -21.98 1.57 gene 8 (LAMA3) -20.58 -20.44 -20.19 -21.99 -18.77 -16.85 2.55 gene 9 (G0S2) -14.82 -17.45 -18.18 -14.78 -17.99 -16.06 3.88 gene 10 (HNI) -16.92 -17.16 -15.91 -17.88 -17.72 -17.93 0.54 gene 11 (PAK2) -17.86 -16.56 -16.99 -18.14 -17.92 -17.97 0.58 gene 12 (AFP) -16.68 -12.36 -26.80 -27.28 -25.97 -23.47 14.80 gene 13 (CYP2C9) -18.27 -16.99 -16.26 -16.23 -13.27 -14.44 5.47 gene 14 (CDH2) -15.20 -14.76 -18.91 -15.60 -15.48 -17.32 10.59 gene 15 (HAMP) -19.53 -20.19 -21.32 -18.51 -25.06 -26.10 13.08 gene 16 (SAE1) -17.37 -17.10 -16.79 -18.22 -17.72 -18.16 0.31 - Thus, after having calculated the distance between the given sample and the centroïd representation of each class, the new sample is affected to the closest class.
- This signature was then used to partition the 63 samples of the validation tumor set into 6 subgroups. As observed in the first set of tumors analyzed in Affymetrix experiment, significant associations, using Fisher exact tests, were found between FAL, TP53, HBV infection and CTNNB1 gene mutation and the different predicted subgroups, as well as with those using the complete series of 109 HCC tumors (Table 1).
- To identify key pathways affected in the different HCC subgroups 1,560 genes specifically deregulated in one or more HCC subgroups were identified based on the results from an all group-wise t-test analysis combined with ANOVA. For all lists of genes specific of HCC subgroups, association of genes in known pathways was also searched for. An enrichment of cell cycle/proliferation/ DNA metabolism genes specifically over-expressed in subgroups G1 to G3 was observed, corresponding to chromosome instable samples (P < 0.01). A high number of genes specifically over-expressed were observed for the G1 subgroup (related to HBV infection with a low number of viral DNA, AXIN1 mutations, a younger age, a high sera level of AFP and frequent origin from Africa, Tables 1 and 2). Among them, genes encoding for proteins expressed during development were found: myosin heavy chain IIb, MYH4, the transcription factors SOX9 and SOX4, and parentally imprinted genes: insulin like growth factor 2 (IGF2), paternally expressed
gene Figure 3a ). The imprinted genes tested were highly over-expressed in normal fetal livers (Figure 3a ). H19 mRNA was also over-expressed, not only in G1 samples but also in fetal samples, correlating with IGF2 in these two groups (R2 = 0.4 and 0.6, respectively). - Subgroup G2 tumors (related to HBV infection with a high number of viral DNA copies, frequent local and vascular invasion and TP53 mutations) were significantly associated with over-expression cell cycle/proliferation/DNA metabolism genes (P < 0.01), an enrichment that was equally observed in G3 (related to TP53 mutations and CDKN2A promoter methylation) and all chromosome instable samples (P < 0.007). A significant over-representation of over-expressed genes implicated in protein phosphorylation was also identified (P < 0.009). Interestingly, mutations in the PIK3CA gene predicted to result in the activation of the phosphatidylinositol 3-kinase (PI3K)-AKT pathway were identified in two tumors belonging to G2. These two samples were closely associated in the non-supervised clustering analysis (
Figure 2 ). 38 genes specifically over-expressed in the PIK3CA mutated samples were identified when compared with the other tumors in groups G1 to G3. Among these genes, the over-expression of two genes coding for the protein elongation factor EEFIA2 and the enterokinase PRSS7 was validated, which are specifically over-expressed in PIK3CA mutated tumors using QRT-PCR (P = 0.001,Figure 3b ). Furthermore, GO analysis demonstrated an enrichment of cell communication genes in PIK3CA mutated tumors (P = 0.07). - In G5 (CTNNB1 mutated, no distant nodules), an enrichment of under-expressed genes involved in stress and immune response such as IFI16, IL4R, IFI44, STAT1, IL10RA, CTSS and HLA-DPA1/B1 (P < 0.002) was observed. HCC subgroups G5 and G6 contain 23 and 11 tumors CTNNB1 mutated in 70 and 100% of the cases, respectively. In a search for possible ß-catenin targeted genes, a list of 280 genes significantly over-expressed in G5 and G6 was found. In addition to GPR49 and GLUL, two known ß-catenin target genes in the liver (Cadoret, A. et al. Oncogene 21, 8293-301 (2002); Yamamoto, Y. et al. Hepatology 37, 528-33 (2003)), the over-expression of 7 putative ß-catenin target genes was confirmed using QRT-PCR. These genes include: EPHB2, a tyrosine kinase receptor; MME, the enkephalinase CD10; MERTK, an oncogene tyrosine kinase; LAMA3, encoding the alpha-3 chain of the laminin 5; PAP/HIP, encoding a pancreatitis associated protein; SPARCL1 encoding hevin which is associated with extracellular matrix; and the transcription factor TBX3 (
Figure 4a ). A significant higher level of expression of all these putative ß-catenin targeted genes was observed in G6 when compared with G5, even after exclusion of the samples without CTNNB1 mutation. It was also shown that ß-catenin was more over-expressed in G6 tumors, when compared with G5 tumors, with a loss of signal at the plasma membrane and a strong localization in cytoplasm and nucleus (Figure 4b ). Consistent with this observation, an over-expression of LEF1, a transcription factor that interacts with ß-catenin to activate Wnt-responsive target genes, was found in G6. While both G5 and G6 subgroups were associated withchromosome 8p LOH, no other chromosome deletion specific of G6 was identified. However, an under-expression of CDH1 (encoding the E-cadherin) was found in G6 subgroup (in Affymetrix and QRT-PCR experiments,Figure 4a ) that may account for the local invasion of these HCC as shown by the quasi-constant presence of satellite nodules found around the principal tumor (Figure 4c and Tables 1 and 2). The level of CDH1 mRNA down-regulation was showed to be highly related to the down-regulated expression of the E-cadherin protein in G6 consistent with the high level of promoter methylation of CDH1 in these tumors (data not shown). - Using a non-supervised, genome-wide approach, the inventors obtained a robust classification of HCC in 6 main subgroups reflecting the natural large diversity of these tumors (Bosch, F.X., et al. Gastroenterology 127, S5-S16 (2004); E1-Serag, H.B. Gastroenterology 127, S27-34 (2004)). In addition, this classification could be reproduced using only 16 genes analyzed with QRT-PCR and, more importantly, was confirmed in an independent set of tumors.
- This classification is in agreement with the previously published analyses of HCC (Lee, J.S. et al. ); Breuhahn, K. et al. Cancer Res 64, 6058-64 (2004); Chen, X. et al. Mol Biol Cell 13, 1929-39 (2002)) that have described two main groups of tumors related to chromosome stability (corresponding to the meta-groups G1-G3 and G4-G6). However, the present analysis has extended and refined this classification.
- In short, the inventors believe that the elucidation of the multifaceted classification of HCC was only possible in this application, compared to the previous published classifications into two subgroups, because (1) the studied series of tumors surgically treated in France included the main different risk factors of HCC, i.e. HBV and HCV infections, alcohol abuse and hemochromatosis and (2) the large number of clinical, histopathological and genetic annotations available for the studied sample population. Indeed, the main clinical determinant of class membership is the HBV infection whereas the other main determinants are genetic and epigenetic alterations including chromosome instability, TP53 and CTNNB1 mutations, CDKN2A and CDH1 methylation and the parental imprinting (see
Figure 1 ). - Focusing on the natural history of HCC, it appears that HBV related tumors defining G1 and G2 subgroups are clearly molecularly distinct from the other etiologies. Tumors related to HCV infection and alcohol abuse are interspersed within the subgroups G3 to G6. The present transcriptomic classification has enabled the identification of new entities of tumors. Subgroup G1 includes HBV related tumors from younger patients (relative to the other HBV HCCs), frequently from Africa, with an equal sex ratio, a low number of viral DNA copies, frequent AXIN1 mutations, absence of TP53 mutation and an over-expression of genes normally parentally imprinted. These results suggest that HBV infection at the early age leads to a specific type of HCC demonstrating immature features with an abnormal parental gene imprinting possibly through the persistence of fetal hepatocytes or through the dedifferentiation of adult hepatocytes. Such diversity in tumors may be related to the high-risk populations found by epidemiological studies (Brechot, C. Gastroenterology 127, S56-61 (2004); Yu, M.C. & Yuan, J.M. Gastroenterology 127, S72-8 (2004)).
- Subgroup G6 with a 100% incidence of CTNNB1 mutation, a high level of pathological Wnt pathway activation (higher than in G5) and inactivation of E-cadherin (Kozyraki, R. et al. Gastroenterology 110, 1137-49 (1996)) is consistent with the high invasive potential of these tumors as E-cadherin inactivation is known to participate in cell invasion process (Behrens, J., et al. J Cell Biol 108, 2435-47 (1989)).
- Apart of these large subgroups of tumors, the present transcriptomic analysis has also suggested homogeneous subgroups of tumors related to rare genetic alterations like TCF1 or PIK3CA mutations (Bluteau, O. et al. Nat Genet 32, 312-5 (2002) ; Lee, J.W. et al. Oncogene 24, 1477-80 (2005)). New structural gene alterations characteristic of other small homogeneous subgroups of tumors remained to be identified and conversely, this can be a powerful tool to find new therapeutic targets.
- Quantitative RT-PCR analysis was performed as described in the Material and Methods section of Example 2.
- Based on the 2-ΔCt values (ΔCt = CtTESTED-CtR18S) for 135 genes from the series of 42 samples analyzed with Affymetrix GeneChips, the top 16 genes (maximum logrank P ≤ 10-2) associated with prognostic status (Global Survival at 60 months) were identified using a univariate Cox model (package survival V2.15). Using the same 42 samples, the best combinations of 5 genes or less among these 16 genes (maximum logrank P < 10-5) was then selected using a multivariate Cox model from all possible combinations. A second series of 53 independent HCC was then used to validate those models (maximum logrank P < 10-3), retaining 42 of them. The robustness of each model was further assessed with the following resampling approach: we obtained 1,000 samplings by dividing 1,000 times, randomly, the whole series of 95 tumors in 2 groups of 47 and 48 samples each (equilibrating the number of death events between both groups); then, using each of the 42 lists of genes, for both groups of each sampling, multivariate Cox models were constructed and the logrank P value calculated from both models were stored. The combination of genes leading to the lowest median logrank P in both groups (among those 1,000 samplings) was kept and a predictor was then derived from this combination.
- Although diagnostically useful, the 16-gene classification signature (see Example 2) did not suffice in predicting HCC prognosis as logrank tests yielded high p values of (P = 0.2 and 0.1) testing either the two main groups of tumors (G1 to G3 vs G4 to G6) or the individual 6-subgroups, respectively. As a result, a specific predictor of prognosis was constructed as described in the Material and Methods section.
- Globally, genes found to be useful for prognostic of global survival and/or survival without relapse were those listed in the above described Table 3.
- More precisely, the top 16 genes associated with prognostic status of global survival were determined to be: NRCAM, PIR, RAMP3, SLC21A2, TAF9, TNA, HN1, PSMD1, MRPS7, CDC20, ENO1, HLF, STRA13, RAGD, NRAS, ARFGEF2.
- After testing of all possible combinations of 5 genes or less among these 16 genes as described in Material and Methods, the 5 best models predicted global survival using a multivariate Cox analysis with a P < 10-8. Finally the most useful combination to predict the bad overcome is the association of 5 genes: a low level of RAMP3 combined with a high level of TAF9, NRCAM, PSMD1 and ARFGEF2.
- The best global survival predictor follows the following formulas:

wherein the different β(genet) and µ(genet) parameters are those listed in the following Table 8.Table 8. Parameters to be used in the above formula for the best out of top 5 overall survival predictors Global survival µ β gene 1 (TAF9) 7.28 0.129 gene 2 (NRCAM) 1.59 0.252 gene 3 (RAMP3) 0.14 -6.133 gene 4 (PSMD1) 4.66 0.024 gene 5 (ARFGEF2) 3.66 -0.025 - Results for the best predictor of global survival in term of ROC curve, Score curve and Survival curves are displayed in
Figure 5a , while statistics related to this best predictor of global survival are listed in the following Table 9.Table 9. Statistics related to global survival predictor (for training and validation sets) Global survival Training set Validation set Area under curve 0.88 0.67 Specificity 72.8% 70% Sensibility 88.8% 73.6% Fisher exact test P 4 10-5 9 010-5 Success rate 80.9% 79.2% - In the 53 HCC validation set, this combination of genes correctly predicted early relapse in 79% of the cases (70% for (+), 89% for (-)); and early deaths were correctly predicted in 81% of the cases (73% for (+); 92% for (-)). Among the clinical and morphological features, Edmondson grade and vascular invasion were significantly associated with a poor prognosis (logrank P < 0.04 and 0.0002 respectively). A multivariate Cox model including these two variables plus the best global survival predictor was performed (see following Table 10). This model shows that our gene combination is an independent prognostic variable.
Table 10. Hazard Ratio (HR), logrank P-value (P) and 95% Confidence Interval (CI) from the multivariate Cox model obtained (for overall survival) using the following predictive variables: (i) binary attribution (above or below score threshold) for the best overall survival predictor, (ii) vascular invasion and (iii) Edmondson grade (grade I and II were merged, as only 7 cases were available for grade I). HR P 95% CI Gene predictor 7.8 0.000013 3.1-19.7 Vascular invasion 2.6 0.02 1.2-5.8 Edmondson grade III 0.5 0.09 0.2-1.1 Edmondson grade IV 2.8 0.14 0.7-10.6 - The same strategy was applied to find combinations of genes predicting the disease-free survival. Interestingly, among the top 16 genes (TAF9, NRCAM, ENO1, RAB1A, ARFGEF2, G0S2, PSMD1, MRPS7, RA GD, HN1, PIR, SMAD3, DNAJA3, HELO1, RAMP3, RHOQ), ten were previously identified as the best predictors of the overall survival using univariate Cox model. Finally, all 3 genes included in the best predictor of the disease-free survival were also included in the best predictor of the overall survival.
- The best survival without relapse (or disease-free) predictor follows the following formulas:

wherein the different β(genet) and µ(genet) parameters are those listed in the following Table 11.Table 11. Parameters to be used in the above formula) for the best out of top 5 disease free survival predictors. Disease Free survival µ β gene 1 (TAF9) 7.28 0.127 gene 2 (NRCAM) 1.59 0.196 gene 3 (RAMP3) 0.14 -3.886 - Results for the best predictor of global survival in term of ROC curve, Score curve and Survival curves are displayed in
Figure 5b , while statistics related to this best predictor of global survival are listed in the following Table 12.Table 12. Statistics related to the best disease free survival predictor. Disease Free Survival Training set Validation set Area under curve 0.86 0.84 Specificity 83.4% 84.7% Sensibility 74% 78.5% Fisher exact test P 4 10-3 6 10-6 Success rate 73.8% 81.1 % Logrank P 3 10-4 7 10-6 - Elucidation of the transcriptomic classification is of particular interest for clinical applications. In particular, it appears that HCC belonging to groups G1 to G3 were slightly related to early relapse and early death compared to HCC from G4 to G6, showing that classification and prognosis are somehow related.
- However, the inventors found that using a small specific subset of about 5 genes was superior than using the global classification 16-gene signature in predicting the prognosis of patients treated by complete surgical resection. In contrast to previous published transcriptomic analyses, the performance of the determined survival predictor was verified in a second set of independent tumors including all etiological risk factors and such validations were performed using QRT-PCR in place of hybridization data (Lee, J.S. et al. ); Ye, Q.H. et al. Nat Med 9, 416-23 (2003); Iizuka, N. et al. Lancet 361, 923-9 (2003); Kurokawa, Y. et al. J Hepatol 41, 284-91 (2004)).
- The genes identified in the present applications as useful to predict survival had never been previously found associated to patient prognosis and they may be implicated in general cellular processes such as proteasome degradation of proteins (PSMD1, see Yokota, K. et al. )), the initiation of RNA transcription (TAF9, see Michel, B., Komarnitsky, P. & Buratowski, )) and cellular proliferation (NRCAM, see Sehgal, A., et al. Anticancer Res 19, 4947-53 (1999); and ARFGEF2, see Sheen, V.L. et al. )).
- Interestingly, the best combinations of genes predicting global survival as well as disease-free survival (i.e. survival without relapse) were very similar in this study demonstrating that the determined predictors accurately reflects tumor progression irrespective of non-tumor related hepatic disease.
- It would be also very interesting to evaluate these predictors in patients treated with liver transplantation or radiofrequency in order to estimate the potential usefulness of these markers in the therapeutic choice.
- In conclusion, the present global transcriptomic analysis has been carried out and validated using a large series of highly annotated tumors. This analysis has established a robust classification reflecting the natural diversity of human HCCs, the structural gene alterations and epigenetic de-regulations accumulated during tumor progression. The high diversity of HCC tumor has clinical implications and the present classification has yielded prognostic tools not only for surgically treated patients but also to further identify patients that will benefit of targeted therapies.
-
- 1. Bosch. F.X., et al. Semin Liver Dis 19, 271-85 (1999)
- 2. Taylor-Robinson, S.D. et al. Bmj 319, 640 (1999);
- 3. Deuffic, S. et al. Lancet 351, 214-5 (1998).
- 4. E1-Serag, H.B. & Mason, A.C. N Engl J Med 340, 745-50 (1999)
- 5. Edmondson, H.A. & Peters, R.L. Semin Roentgenol 18, 75-83 (1983);
- 6. Thorgeirsson, S.S. & Grisham, J.W. Nat Genet 31, 339-46 (2002)).
- 7. Aoki, H., et al. Proc Natl Acad Sci U S A 93, 7300-4 (1996)
- 8. Brechot, C. Gastroenterology 127, S56-61 (2004)
- 9. Bressac, B. et al. Proc Natl Acad Sci U S A 87, 1973-7 (1990)
- 10. Weihrauch, M. et al. Br J Cancer 84, 982-9 (2001)
- 11. Bluteau, O. et al. Nat Genet 32, 312-5 (2002)
- 12. Boige, V. et al. Cancer Res 57, 1986-90 (1997);
- 13. Wong, N. et al. Clin Cancer Res 6, 4000-9 (2000);
- 14. Guan, X.Y. et al. Genes Chromosomes Cancer 29, 110-6 (2000)
- 15. Okabe et al. Cancer Res. 2001 ;
- 16. Iizuka et al. Cancer Res. 2002 Jul 15;62(14):3939-44
- 17. Chung et al. Mol Cells. 2002 Dec 31;14(3):382-7 ;
- 18. Chen et al. Mol Biol Cell. 2002 Jun;13(6):1929-39;
- 19.
WO 2004/090163 - 20. Lee et al. Hepatology. 2004 Sep;40(3):667-76
- 21. Legoix, P. et al. Oncogene 18, 4044-6 (1999);
- 22. Laurent-Puig, P. et al. )
- 23. Qin et al. J Cancer Res Clin Oncol. 2004 Sep;130(9):497-513;
- 24. Ye et al. Nat Med. 2003 Apr ;9(4) :416-23
- 25. Kurokawa et al. J Hepatol. 2004 Aug;41(2):284-91 ;
- 26. Iizuka et al. Lancet. 2003 Mar 15 ;361(9361) :923-9;
- 27.
WO 2005/017150 - 28. Lee, S. et al. Am J Pathol 163, 1371-8 (2003);
- 29. Zochbauer-Muller, S. et al. Cancer Res 61, 249-55 (2001)
- 30. Livak, K.J. & Schmittgen, T.D. Methods 25, 402-8 (2001)
- 31. Cadoret, A. et al. Oncogene 21, 8293-301 (2002);
- 32. Yamamoto, Y. et al. Hepatology 37, 528-33 (2003)
- 33. Bosch, F.X., et al. Gastroenterology 127, S5-S16 (2004);
- 34. E1-Serag, H.B. Gastroenterology 127, S27-34 (2004)
- 35. Breuhahn, K. et al. Cancer Res 64, 6058-64 (2004);
- 36. Yu, M.C. & Yuan, J.M. Gastroenterology 127, S72-8 (2004)
- 37. Kozyraki, R. et al. Gastroenterology 110, 1137-49 (1996)
- 38. Behrens, J., et al. J Cell Biol 108, 2435-47 (1989)
- 39. Lee, J.W. et al. Oncogene 24, 1477-80 (2005)
- 40. Yokota, K. et al. )
- 41. Michel, B., Komarnitsky, P. & Buratowski, )
- 42. Sehgal, A., et al. Anticancer Res 19, 4947-53 (1999);
- 43. Sheen, V.L. et al. )).
| | ||||
| Gene number | Gene symbol | µ | β | |
| 1 | | 7,28 | 0,129 | -0,393 |
| 2 | | 1,59 | 0,252 | |
| 3 | | 0,14 | -6,133 | |
| 4 | PSMD1 | 4,66 | 0,024 | |
| 5 | | 3,66 | -0,025 | |
| | ||||
| Gene number | Gene symbol | µ | β | |
| 1 | | 7,28 | 0,127 | -0,461 |
| 2 | | 1,59 | 0,196 | |
| 3 | | 0,14 | -3,886 | |
Claims (15)
- Method of in vitro prognosis of global survival and/or survival without relapse from a liver HCC sample of a subject suffering from HCC, comprising:a) determining an expression profile comprising or consisting of a combination of gene TAF9 and at least 1 gene selected from the group consisting of NRCAM, PIR, RAMP3, SLC21A2, TNA, HN1, PSMD1, MRPS7, CDC20, ENO1, HLF, STRA13, RAGD, NRAS, ARFGEF2, RAB1A, G0S2, SMAD3, DNAJA3, HELO1, RHOQ, C14orf156, NPEPPS, PDCD2, PHB, KIAA0090, IMP-3, KPNA2, KIAA0268 , UNQ6077, LOC440751, G6PD, STK6, TFRC, GLA, TRIP13, SPP1, AKR1C1 , AKR1C2, GIMAP5, ADM, CCNB1, TKT, AGPS, RAN, NUDT9, HRASLS3, HLA-DQA1, NEU1, RARRES2, PAPOLA, ABCB6, BIRC5, FLJ20273, C14orf109, CHKA, TUBB2, HMGB3, TXNRD1, IFITM1, KIAA0992, MPPE1, KLRB1, CCL5, SYNE1, DNASE1L3, CYP2C18, PACSIN2, PON3, and PPP2R1B ;b) calculating from said expression profile a global survival score and/or a survival without relapse score; andc) comparing the obtained global survival score and/or survival without relapse score each with a threshold value, wherein- a global survival/survival without relapse score strictly inferior to said threshold value indicates a good survival/survival without relapse prognosis, whereas- a global survival/survival without relapse score superior or equal to said threshold value indicates a bad survival/survival without relapse prognosis.
- The method of claim 1, wherein the expression profile comprises or consists of a combination of gene TAF9 and at least 1 gene selected from the group consisting of NRCAM, PIR, RAMP3, SLC21A2, TNA, HN1, PSMD1, MRPS7, CDC20, ENO1, HLF, STRA13, RAGD, NRAS, ARFGEF2, RAB1A, G0S2, SMAD3, DNAJA3, HELO1, and RHOQ.
- The method of claim 2, wherein global survival is prognosed and the expression profile comprises or consists of a genes combination selected from:- TAF9, PIR, NRCAM, and RAMP3,- TAF9, NRCAM, SLC21A2, and PSMD1,- TAF9, NRCAM, RAMP3, and PSMD1,- TAF9, NRCAM, NRAS, RAMP3, and PSMD1, or- TAF9, NRCAM, RAMP3, PSMD1 and ARFGEF2.
- The method of claim 3, wherein the expression profile comprises or consists of the following genes combination: TAF9, NRCAM, RAMP3, PSMD1 and ARFGEF2.
- The method of claim 2, wherein survival without relapse is prognosed and the expression profile comprises or consists of a genes combination selected from:- TAF9, and G0S2,- TAF9, NRCAM, and RAMP3,- TAF9, G0S2, and RAMP3,- TAF9, NRCAM, DNAJA3, and RAMP3, or- TAF9, NRCAM, G0S2, DNAJA3, and RAMP3.
- The method of claim 5, wherein the expression profile comprises or consists of the following genes combination: TAF9, NRCAM, and RAMP3.
- The method of any of claims 1 to 6, wherein the expression profile is determined at the nucleic level.
- The method of claim 7, wherein the expression profile is determined at the nucleic level using quantitative PCR.
- The method of claim 8, wherein the expression profile consists of the following genes combination: TAF9, NRCAM, RAMP3, PSMD1 and ARFGEF2, and the following formula is used:

wherein- n represents the number of genes in the combination,- t represents the number of each gene in the combination displayed in Table 4, and- the value of each β(genet) and µ(genet) coefficients is in an interval of 10% around those displayed in Table 4. - The method of claim 9, wherein the threshold value used for the prognosis is in an interval of 10% around that displayed in Table 4.
- The method of claim 8, wherein the expression profile consists of the following genes combination: TAF9, NRCAM, and RAMP3, and the following formula is used:

wherein- n represents the number of genes in the combination,- t represents the number of each gene in the combination displayed in Table 5, and- the value of each β(genet) and µ(genet) coefficients is in an interval of 5 10% around those displayed in Table 5. - The method of claim 11, wherein the threshold value used for the prognosis is in an interval of 10% around that displayed in Table 5.
- The method of any of claims 1 to 11, wherein the liver HCC sample is a liver HCC biopsy or a HCC tumor surgical resection.
- Method for the in vitro determination of the advisability of adjuvant therapy from a liver HCC sample of a subject suffering from HCC, comprising:a) determining a global survival and/or survival without relapse prognosis according to the method of any of claims 1 to 13, andb) determining the advisability of adjuvant therapy from said prognosis, wherein:- in the presence of a bad prognosis, adjuvant therapy is recommended, whereas- in the absence of a trad prognosis, adjuvant therapy is not recommended.
- A kit for the in vitro prognosis of global survival and/or survival without relapse from a liver HCC sample of a subject suffering from HCC, consisting of reagents for the determination of an expression profile consisting of a combination of gene TAF9 and at least 1 gene selected from the group consisting of NRCAM, PIR, RAMP3, SLC21A2, TNA, HN1, PSMD1, MRPS7, CDC20, ENO1, HLF, STRA13, RAGD, NRAS, ARFGEF2, RAB1A, G0S2, SMAD3, DNAJA3, HELO1, RHOQ, C14orf156 NPEPPS, PDCD2, PHB, KIAA0090, IMP-3, KPNA2, KIAA0268 , UNQ6077, LOC440751, G6PD, STK6, TFRC, GLA, TRIP13, SPP1, AKR1C1 , AKR1C2, GIMAP5, ADM, CCNB1, TKT, AGPS, RAN, NUDT9, HRASLS3, HLA-DQA1, NEU1, RARRES2, PAPOLA, ABCB6, BIRC5, FLJ20273, C14orf109, CHKA, TUBB2, HMGB3, TXNRD1, IFITM1, KIAA0992, MPPE1, KLRB1, CCL5, SYNE1, DNASE1L3, CYP2C18, PACSIN2, PON3, and PPP2R1B.
Priority Applications (2)
| Application Number | Priority Date | Filing Date | Title |
|---|---|---|---|
| EP12182427.0A EP2574679B1 (en) | 2005-11-30 | 2006-11-30 | Methods for in vitro hepatocellular carninoma prognosis |
| SI200631913T SI2574679T1 (en) | 2005-11-30 | 2006-11-30 | Methods for in vitro hepatocellular carninoma prognosis |
Applications Claiming Priority (3)
| Application Number | Priority Date | Filing Date | Title |
|---|---|---|---|
| EP05292533A EP1830289A1 (en) | 2005-11-30 | 2005-11-30 | Methods for hepatocellular carninoma classification and prognosis |
| EP12182427.0A EP2574679B1 (en) | 2005-11-30 | 2006-11-30 | Methods for in vitro hepatocellular carninoma prognosis |
| EP06819878.7A EP1958109B1 (en) | 2005-11-30 | 2006-11-30 | Methods and kit for hepatocellular carcinoma classification |
Related Parent Applications (3)
| Application Number | Title | Priority Date | Filing Date |
|---|---|---|---|
| EP06819878.7 Division | 2006-11-30 | ||
| EP06819878.7A Division-Into EP1958109B1 (en) | 2005-11-30 | 2006-11-30 | Methods and kit for hepatocellular carcinoma classification |
| EP06819878.7A Division EP1958109B1 (en) | 2005-11-30 | 2006-11-30 | Methods and kit for hepatocellular carcinoma classification |
Publications (3)
| Publication Number | Publication Date |
|---|---|
| EP2574679A2 EP2574679A2 (en) | 2013-04-03 |
| EP2574679A3 EP2574679A3 (en) | 2013-07-31 |
| EP2574679B1 true EP2574679B1 (en) | 2015-02-25 |
Family
ID=36021836
Family Applications (3)
| Application Number | Title | Priority Date | Filing Date |
|---|---|---|---|
| EP05292533A Withdrawn EP1830289A1 (en) | 2005-11-30 | 2005-11-30 | Methods for hepatocellular carninoma classification and prognosis |
| EP06819878.7A Not-in-force EP1958109B1 (en) | 2005-11-30 | 2006-11-30 | Methods and kit for hepatocellular carcinoma classification |
| EP12182427.0A Not-in-force EP2574679B1 (en) | 2005-11-30 | 2006-11-30 | Methods for in vitro hepatocellular carninoma prognosis |
Family Applications Before (2)
| Application Number | Title | Priority Date | Filing Date |
|---|---|---|---|
| EP05292533A Withdrawn EP1830289A1 (en) | 2005-11-30 | 2005-11-30 | Methods for hepatocellular carninoma classification and prognosis |
| EP06819878.7A Not-in-force EP1958109B1 (en) | 2005-11-30 | 2006-11-30 | Methods and kit for hepatocellular carcinoma classification |
Country Status (7)
| Country | Link |
|---|---|
| US (2) | US8935102B2 (en) |
| EP (3) | EP1830289A1 (en) |
| JP (1) | JP5420247B2 (en) |
| CA (2) | CA2631605C (en) |
| ES (2) | ES2536898T3 (en) |
| SI (2) | SI1958109T1 (en) |
| WO (1) | WO2007063118A1 (en) |
Cited By (1)
| Publication number | Priority date | Publication date | Assignee | Title |
|---|---|---|---|---|
| CN111676282A (en) * | 2020-01-13 | 2020-09-18 | 中南大学湘雅医院 | Application of G0S2 gene in the detection and treatment of myasthenia gravis patients |
Families Citing this family (39)
| Publication number | Priority date | Publication date | Assignee | Title |
|---|---|---|---|---|
| US8285719B1 (en) | 2008-08-08 | 2012-10-09 | The Research Foundation Of State University Of New York | System and method for probabilistic relational clustering |
| EP2687609B1 (en) | 2008-11-10 | 2017-01-04 | The United States of America, as represented by The Secretary, Department of Health and Human Services | Method for treating solid tumor |
| KR100964193B1 (en) * | 2009-04-17 | 2010-06-16 | 씨비에스바이오사이언스 주식회사 | Markers for liver cancer prognosis |
| WO2011122021A1 (en) * | 2010-03-30 | 2011-10-06 | 国立大学法人山口大学 | Marker for prediction of recurrence of hepatocellular carcinoma |
| US9597325B2 (en) | 2010-10-13 | 2017-03-21 | Trustees Of Boston University | Inhibitors of late SV40 factor (LSF) as cancer chemotherapeutics |
| US20120252689A1 (en) * | 2011-04-01 | 2012-10-04 | Zhong Wu | Gene expression signature for wnt/b-catenin signaling pathway and use thereof |
| WO2013025322A2 (en) * | 2011-08-15 | 2013-02-21 | Board Of Regents, The University Of Texas System | Marker-based prognostic risk score in liver cancer |
| KR20150013332A (en) * | 2012-05-31 | 2015-02-04 | 바이엘 파마 악티엔게젤샤프트 | Biomarkers for determining effective response of treatments of hepatocellular carcinoma (hcc) patients |
| JP2014027898A (en) * | 2012-07-31 | 2014-02-13 | Yamaguchi Univ | Method for judging onset risk of hepatocarcinoma |
| JP2015530094A (en) * | 2012-09-21 | 2015-10-15 | シンガポール ヘルス サービシーズ ピーティーイー リミテッド | Method for diagnosing subject liver cancer and kit for diagnosing liver cancer |
| BR112015006302A2 (en) | 2012-09-21 | 2017-07-04 | Inst Nat Sante Rech Med | "In vitro classification method, kit, igfr1 inhibitor, system for classifying a liver sample and computer readable medium" |
| US20150232944A1 (en) * | 2012-09-21 | 2015-08-20 | Integragen | Method for prognosis of global survival and survival without relapse in hepatocellular carcinoma |
| TWI500770B (en) * | 2013-02-20 | 2015-09-21 | Univ Taipei Medical | Use of hoxa9 gene as a biomarker for detection of hepatocellular carcinoma |
| US20150024517A1 (en) * | 2013-07-19 | 2015-01-22 | Texas Instruments Incorporated | Plasma etcher chuck band |
| GB201317609D0 (en) | 2013-10-04 | 2013-11-20 | Cancer Rec Tech Ltd | Inhibitor compounds |
| KR102508957B1 (en) | 2015-03-24 | 2023-03-13 | 스미토모 오사카 세멘토 가부시키가이샤 | electrostatic chuck device |
| GB201505658D0 (en) | 2015-04-01 | 2015-05-13 | Cancer Rec Tech Ltd | Inhibitor compounds |
| GB201617103D0 (en) | 2016-10-07 | 2016-11-23 | Cancer Research Technology Limited | Compound |
| KR102014951B1 (en) * | 2017-01-06 | 2019-08-27 | 강원대학교산학협력단 | Biomarker, kit or composition for detecting cancer caused by inhibition of transcriptional activity of p53, method for providing information or screening drugs, and malignant transformation model |
| WO2018181988A1 (en) * | 2017-03-31 | 2018-10-04 | 公立大学法人福島県立医科大学 | Method for identifying interdependence |
| WO2018189215A1 (en) * | 2017-04-12 | 2018-10-18 | INSERM (Institut National de la Santé et de la Recherche Médicale) | Method for predicting the survival time of a patient suffering from hepatocellular carcinoma |
| CN108333366B (en) * | 2018-01-26 | 2020-06-12 | 南通大学附属医院 | Method for establishing experimental monitoring rat model for malignant transformation process of liver cells |
| CN112301125A (en) * | 2019-07-30 | 2021-02-02 | 立森印迹诊断技术(无锡)有限公司 | A tumor marker and its application |
| KR102055872B1 (en) * | 2019-08-20 | 2019-12-13 | 강원대학교산학협력단 | Biomarker, kit or composition for detecting cancer caused by inhibition of transcriptional activity of p53, method for providing information or screening drugs, and malignant transformation model |
| KR102168498B1 (en) * | 2019-12-09 | 2020-10-21 | 강원대학교산학협력단 | Biomarker, kit or composition for detecting cancer caused by inhibition of transcriptional activity of p53, method for providing information or screening drugs, and malignant transformation model |
| CN111458509B (en) * | 2020-04-14 | 2023-09-22 | 中国人民解放军海军军医大学第三附属医院 | Biomarkers for prognostic assessment of hepatocellular carcinoma and kits and methods thereof |
| CN111537719B (en) * | 2020-06-04 | 2022-10-04 | 复旦大学附属中山医院 | Application of serum Sparcl1 protein in the diagnosis of nonalcoholic steatohepatitis |
| CN111705132A (en) * | 2020-07-03 | 2020-09-25 | 南方医科大学南方医院 | A primer probe set, kit and method for ddPCR detection of liver cancer prognostic marker TP53 R249S |
| KR102185037B1 (en) * | 2020-10-14 | 2020-12-01 | 강원대학교산학협력단 | Biomarker, kit or composition for detecting cancer caused by inhibition of transcriptional activity of p53, method for providing information or screening drugs, and malignant transformation model |
| KR102205224B1 (en) * | 2020-11-24 | 2021-01-20 | 강원대학교산학협력단 | Biomarker, kit or composition for detecting cancer caused by inhibition of transcriptional activity of p53, method for providing information or screening drugs, and malignant transformation model |
| CN114622016A (en) * | 2020-12-11 | 2022-06-14 | 复旦大学附属华山医院 | Genome combination and application thereof in preparation of products for identifying liver canceration, tissue typing and prognosis |
| KR102221671B1 (en) * | 2021-01-13 | 2021-03-02 | 강원대학교산학협력단 | Biomarker, kit or composition for detecting cancer caused by inhibition of transcriptional activity of p53, method for providing information or screening drugs, and malignant transformation model |
| KR102243705B1 (en) * | 2021-02-22 | 2021-04-23 | 강원대학교산학협력단 | Biomarker, kit or composition for detecting cancer caused by inhibition of transcriptional activity of p53, method for providing information or screening drugs, and malignant transformation model |
| KR102260250B1 (en) * | 2021-02-22 | 2021-06-03 | 강원대학교산학협력단 | Biomarker, kit or composition for detecting cancer caused by inhibition of transcriptional activity of p53, method for providing information or screening drugs, and malignant transformation model |
| CN114106097B (en) * | 2021-11-24 | 2023-12-22 | 中国科学院微生物研究所 | Polypeptides for the treatment of hepatocellular carcinoma and their applications |
| CN113913525A (en) * | 2021-11-24 | 2022-01-11 | 广州医科大学 | Application of DNASE1L3 gene as target point for detecting and/or preventing liver cancer invasion and metastasis |
| US20250263699A1 (en) * | 2022-04-07 | 2025-08-21 | The Board Of Regents Of The University Of Texas System | COMPOSITIONS AND METHODS FOR TREATING LIVER DISEASES WITH siRNAS TARGETING TBX3 |
| CN117604108B (en) * | 2024-01-23 | 2024-04-09 | 杭州华得森生物技术有限公司 | Biomarkers for diagnosis and prognosis of liver cancer and their applications |
| CN118256622B (en) * | 2024-03-25 | 2024-12-17 | 中山大学附属第一医院 | Novel marker and application thereof in prognosis evaluation of liver cancer |
Family Cites Families (7)
| Publication number | Priority date | Publication date | Assignee | Title |
|---|---|---|---|---|
| CA2328992A1 (en) * | 1998-04-27 | 1999-11-04 | Northwest Hospital | Nr-cam gene, nucleic acids and nucleic acid products for therapeutic and diagnostic uses for tumors |
| US20020009730A1 (en) * | 1999-11-17 | 2002-01-24 | Alex Chenchik | Human stress array |
| JP2006521794A (en) * | 2003-02-14 | 2006-09-28 | スミスクライン・ビーチャム・コーポレイション | Differentially expressed nucleic acid correlated with KSP expression |
| JP4698228B2 (en) | 2003-04-08 | 2011-06-08 | エフ.ホフマン−ラ ロシュ アーゲー | How to define the stage of tumor differentiation |
| JP2006526405A (en) * | 2003-06-04 | 2006-11-24 | エージェンシー フォー サイエンス,テクノロジー アンド リサーチ | Differentially regulated hepatocellular oncogene and its utilization |
| CA2528669A1 (en) * | 2003-06-09 | 2005-01-20 | The Regents Of The University Of Michigan | Compositions and methods for treating and diagnosing cancer |
| US20050089895A1 (en) * | 2003-08-13 | 2005-04-28 | Cheung Siu T. | Compositions and methods for prognosis and therapy of liver cancer |
-
2005
- 2005-11-30 EP EP05292533A patent/EP1830289A1/en not_active Withdrawn
-
2006
- 2006-11-30 CA CA2631605A patent/CA2631605C/en not_active Expired - Fee Related
- 2006-11-30 SI SI200631919T patent/SI1958109T1/en unknown
- 2006-11-30 ES ES12182427.0T patent/ES2536898T3/en active Active
- 2006-11-30 ES ES06819878.7T patent/ES2535049T3/en active Active
- 2006-11-30 CA CA2897986A patent/CA2897986A1/en not_active Abandoned
- 2006-11-30 US US12/095,604 patent/US8935102B2/en not_active Expired - Fee Related
- 2006-11-30 SI SI200631913T patent/SI2574679T1/en unknown
- 2006-11-30 EP EP06819878.7A patent/EP1958109B1/en not_active Not-in-force
- 2006-11-30 WO PCT/EP2006/069175 patent/WO2007063118A1/en not_active Ceased
- 2006-11-30 EP EP12182427.0A patent/EP2574679B1/en not_active Not-in-force
- 2006-11-30 JP JP2008542772A patent/JP5420247B2/en not_active Expired - Fee Related
-
2014
- 2014-12-23 US US14/580,484 patent/US20150176080A1/en not_active Abandoned
Cited By (1)
| Publication number | Priority date | Publication date | Assignee | Title |
|---|---|---|---|---|
| CN111676282A (en) * | 2020-01-13 | 2020-09-18 | 中南大学湘雅医院 | Application of G0S2 gene in the detection and treatment of myasthenia gravis patients |
Also Published As
| Publication number | Publication date |
|---|---|
| CA2897986A1 (en) | 2007-06-07 |
| JP2009517064A (en) | 2009-04-30 |
| EP2574679A2 (en) | 2013-04-03 |
| EP1958109A1 (en) | 2008-08-20 |
| ES2535049T3 (en) | 2015-05-04 |
| US20150176080A1 (en) | 2015-06-25 |
| US8935102B2 (en) | 2015-01-13 |
| SI2574679T1 (en) | 2015-05-29 |
| EP1958109B1 (en) | 2015-02-18 |
| SI1958109T1 (en) | 2015-05-29 |
| ES2536898T3 (en) | 2015-05-29 |
| EP2574679A3 (en) | 2013-07-31 |
| CA2631605C (en) | 2015-11-17 |
| WO2007063118A1 (en) | 2007-06-07 |
| EP1830289A1 (en) | 2007-09-05 |
| CA2631605A1 (en) | 2007-06-07 |
| JP5420247B2 (en) | 2014-02-19 |
| US20100015605A1 (en) | 2010-01-21 |
Similar Documents
| Publication | Publication Date | Title |
|---|---|---|
| EP1958109B1 (en) | Methods and kit for hepatocellular carcinoma classification | |
| EP3931360B1 (en) | Systems and methods for using sequencing data for pathogen detection | |
| JP4938672B2 (en) | Methods, systems, and arrays for classifying cancer, predicting prognosis, and diagnosing based on association between p53 status and gene expression profile | |
| CN103403543B (en) | Colon cancer gene expression signature and using method | |
| Vachani et al. | A 10-gene classifier for distinguishing head and neck squamous cell carcinoma and lung squamous cell carcinoma | |
| US20080058432A1 (en) | Molecular assay to predict recurrence of Duke's B colon cancer | |
| EP2288741B1 (en) | Prognostic and predictive gene signature for non-small cell lung cancer and adjuvant chemotherapy | |
| CN104769131A (en) | A method for prognosis of global survival and survival without relapse in hepatocellular carcinoma | |
| US8728738B2 (en) | Method for predicting clinical outcome of patients with non-small cell lung carcinoma | |
| US12227808B2 (en) | Compostions and methods for diagnosing lung cancers using gene expression profiles | |
| Kapiteijn et al. | Diploid, microsatellite stable rectal carcinomas show different molecular phenotypes | |
| NZ612471B2 (en) | Colon cancer gene expression signatures and methods of use |
Legal Events
| Date | Code | Title | Description |
|---|---|---|---|
| PUAI | Public reference made under article 153(3) epc to a published international application that has entered the european phase |
Free format text: ORIGINAL CODE: 0009012 |
|
| AC | Divisional application: reference to earlier application |
Ref document number: 1958109 Country of ref document: EP Kind code of ref document: P |
|
| AK | Designated contracting states |
Kind code of ref document: A2 Designated state(s): AT BE BG CH CY CZ DE DK EE ES FI FR GB GR HU IE IS IT LI LT LU LV MC NL PL PT RO SE SI SK TR |
|
| RIC1 | Information provided on ipc code assigned before grant |
Ipc: C12Q 1/68 20060101AFI20130318BHEP Ipc: G01N 33/574 20060101ALI20130318BHEP |
|
| PUAL | Search report despatched |
Free format text: ORIGINAL CODE: 0009013 |
|
| AK | Designated contracting states |
Kind code of ref document: A3 Designated state(s): AT BE BG CH CY CZ DE DK EE ES FI FR GB GR HU IE IS IT LI LT LU LV MC NL PL PT RO SE SI SK TR |
|
| RIC1 | Information provided on ipc code assigned before grant |
Ipc: C12Q 1/68 20060101AFI20130621BHEP Ipc: G01N 33/574 20060101ALI20130621BHEP |
|
| 17P | Request for examination filed |
Effective date: 20140129 |
|
| RBV | Designated contracting states (corrected) |
Designated state(s): AT BE BG CH CY CZ DE DK EE ES FI FR GB GR HU IE IS IT LI LT LU LV MC NL PL PT RO SE SI SK TR |
|
| GRAP | Despatch of communication of intention to grant a patent |
Free format text: ORIGINAL CODE: EPIDOSNIGR1 |
|
| INTG | Intention to grant announced |
Effective date: 20140327 |
|
| GRAP | Despatch of communication of intention to grant a patent |
Free format text: ORIGINAL CODE: EPIDOSNIGR1 |
|
| INTG | Intention to grant announced |
Effective date: 20140925 |
|
| GRAS | Grant fee paid |
Free format text: ORIGINAL CODE: EPIDOSNIGR3 |
|
| GRAA | (expected) grant |
Free format text: ORIGINAL CODE: 0009210 |
|
| AC | Divisional application: reference to earlier application |
Ref document number: 1958109 Country of ref document: EP Kind code of ref document: P |
|
| AK | Designated contracting states |
Kind code of ref document: B1 Designated state(s): AT BE BG CH CY CZ DE DK EE ES FI FR GB GR HU IE IS IT LI LT LU LV MC NL PL PT RO SE SI SK TR |
|
| REG | Reference to a national code |
Ref country code: GB Ref legal event code: FG4D |
|
| REG | Reference to a national code |
Ref country code: CH Ref legal event code: EP |
|
| REG | Reference to a national code |
Ref country code: IE Ref legal event code: FG4D |
|
| REG | Reference to a national code |
Ref country code: CH Ref legal event code: NV Representative=s name: MICHELI AND CIE SA, CH |
|
| REG | Reference to a national code |
Ref country code: DE Ref legal event code: R096 Ref document number: 602006044638 Country of ref document: DE Effective date: 20150409 |
|
| REG | Reference to a national code |
Ref country code: AT Ref legal event code: REF Ref document number: 712078 Country of ref document: AT Kind code of ref document: T Effective date: 20150415 |
|
| REG | Reference to a national code |
Ref country code: NL Ref legal event code: T3 |
|
| REG | Reference to a national code |
Ref country code: SE Ref legal event code: TRGR |
|
| REG | Reference to a national code |
Ref country code: ES Ref legal event code: FG2A Ref document number: 2536898 Country of ref document: ES Kind code of ref document: T3 Effective date: 20150529 |
|
| REG | Reference to a national code |
Ref country code: AT Ref legal event code: MK05 Ref document number: 712078 Country of ref document: AT Kind code of ref document: T Effective date: 20150225 |
|
| REG | Reference to a national code |
Ref country code: LT Ref legal event code: MG4D |
|
| PG25 | Lapsed in a contracting state [announced via postgrant information from national office to epo] |
Ref country code: FI Free format text: LAPSE BECAUSE OF FAILURE TO SUBMIT A TRANSLATION OF THE DESCRIPTION OR TO PAY THE FEE WITHIN THE PRESCRIBED TIME-LIMIT Effective date: 20150225 Ref country code: LT Free format text: LAPSE BECAUSE OF FAILURE TO SUBMIT A TRANSLATION OF THE DESCRIPTION OR TO PAY THE FEE WITHIN THE PRESCRIBED TIME-LIMIT Effective date: 20150225 |
|
| PG25 | Lapsed in a contracting state [announced via postgrant information from national office to epo] |
Ref country code: LV Free format text: LAPSE BECAUSE OF FAILURE TO SUBMIT A TRANSLATION OF THE DESCRIPTION OR TO PAY THE FEE WITHIN THE PRESCRIBED TIME-LIMIT Effective date: 20150225 Ref country code: IS Free format text: LAPSE BECAUSE OF FAILURE TO SUBMIT A TRANSLATION OF THE DESCRIPTION OR TO PAY THE FEE WITHIN THE PRESCRIBED TIME-LIMIT Effective date: 20150625 Ref country code: AT Free format text: LAPSE BECAUSE OF FAILURE TO SUBMIT A TRANSLATION OF THE DESCRIPTION OR TO PAY THE FEE WITHIN THE PRESCRIBED TIME-LIMIT Effective date: 20150225 Ref country code: GR Free format text: LAPSE BECAUSE OF FAILURE TO SUBMIT A TRANSLATION OF THE DESCRIPTION OR TO PAY THE FEE WITHIN THE PRESCRIBED TIME-LIMIT Effective date: 20150526 |
|
| PG25 | Lapsed in a contracting state [announced via postgrant information from national office to epo] |
Ref country code: CZ Free format text: LAPSE BECAUSE OF FAILURE TO SUBMIT A TRANSLATION OF THE DESCRIPTION OR TO PAY THE FEE WITHIN THE PRESCRIBED TIME-LIMIT Effective date: 20150225 Ref country code: RO Free format text: LAPSE BECAUSE OF FAILURE TO SUBMIT A TRANSLATION OF THE DESCRIPTION OR TO PAY THE FEE WITHIN THE PRESCRIBED TIME-LIMIT Effective date: 20150225 Ref country code: SK Free format text: LAPSE BECAUSE OF FAILURE TO SUBMIT A TRANSLATION OF THE DESCRIPTION OR TO PAY THE FEE WITHIN THE PRESCRIBED TIME-LIMIT Effective date: 20150225 Ref country code: EE Free format text: LAPSE BECAUSE OF FAILURE TO SUBMIT A TRANSLATION OF THE DESCRIPTION OR TO PAY THE FEE WITHIN THE PRESCRIBED TIME-LIMIT Effective date: 20150225 Ref country code: DK Free format text: LAPSE BECAUSE OF FAILURE TO SUBMIT A TRANSLATION OF THE DESCRIPTION OR TO PAY THE FEE WITHIN THE PRESCRIBED TIME-LIMIT Effective date: 20150225 |
|
| REG | Reference to a national code |
Ref country code: FR Ref legal event code: PLFP Year of fee payment: 10 |
|
| REG | Reference to a national code |
Ref country code: DE Ref legal event code: R097 Ref document number: 602006044638 Country of ref document: DE |
|
| PG25 | Lapsed in a contracting state [announced via postgrant information from national office to epo] |
Ref country code: PL Free format text: LAPSE BECAUSE OF FAILURE TO SUBMIT A TRANSLATION OF THE DESCRIPTION OR TO PAY THE FEE WITHIN THE PRESCRIBED TIME-LIMIT Effective date: 20150225 |
|
| PGFP | Annual fee paid to national office [announced via postgrant information from national office to epo] |
Ref country code: LU Payment date: 20151026 Year of fee payment: 10 |
|
| PLBE | No opposition filed within time limit |
Free format text: ORIGINAL CODE: 0009261 |
|
| STAA | Information on the status of an ep patent application or granted ep patent |
Free format text: STATUS: NO OPPOSITION FILED WITHIN TIME LIMIT |
|
| PGFP | Annual fee paid to national office [announced via postgrant information from national office to epo] |
Ref country code: DE Payment date: 20151014 Year of fee payment: 10 Ref country code: IT Payment date: 20151109 Year of fee payment: 10 Ref country code: IE Payment date: 20151013 Year of fee payment: 10 Ref country code: GB Payment date: 20151116 Year of fee payment: 10 Ref country code: CH Payment date: 20151020 Year of fee payment: 10 |
|
| 26N | No opposition filed |
Effective date: 20151126 |
|
| PGFP | Annual fee paid to national office [announced via postgrant information from national office to epo] |
Ref country code: FR Payment date: 20151116 Year of fee payment: 10 Ref country code: BE Payment date: 20151123 Year of fee payment: 10 Ref country code: SI Payment date: 20151013 Year of fee payment: 10 Ref country code: NL Payment date: 20151013 Year of fee payment: 10 Ref country code: MC Payment date: 20151020 Year of fee payment: 10 Ref country code: SE Payment date: 20151111 Year of fee payment: 10 Ref country code: ES Payment date: 20151015 Year of fee payment: 10 |
|
| PG25 | Lapsed in a contracting state [announced via postgrant information from national office to epo] |
Ref country code: BE Free format text: LAPSE BECAUSE OF NON-PAYMENT OF DUE FEES Effective date: 20161130 |
|
| PG25 | Lapsed in a contracting state [announced via postgrant information from national office to epo] |
Ref country code: BG Free format text: LAPSE BECAUSE OF FAILURE TO SUBMIT A TRANSLATION OF THE DESCRIPTION OR TO PAY THE FEE WITHIN THE PRESCRIBED TIME-LIMIT Effective date: 20150225 Ref country code: HU Free format text: LAPSE BECAUSE OF FAILURE TO SUBMIT A TRANSLATION OF THE DESCRIPTION OR TO PAY THE FEE WITHIN THE PRESCRIBED TIME-LIMIT; INVALID AB INITIO Effective date: 20061130 |
|
| REG | Reference to a national code |
Ref country code: DE Ref legal event code: R119 Ref document number: 602006044638 Country of ref document: DE |
|
| PG25 | Lapsed in a contracting state [announced via postgrant information from national office to epo] |
Ref country code: CY Free format text: LAPSE BECAUSE OF FAILURE TO SUBMIT A TRANSLATION OF THE DESCRIPTION OR TO PAY THE FEE WITHIN THE PRESCRIBED TIME-LIMIT Effective date: 20150225 |
|
| REG | Reference to a national code |
Ref country code: CH Ref legal event code: PL |
|
| REG | Reference to a national code |
Ref country code: NL Ref legal event code: MM Effective date: 20161201 |
|
| GBPC | Gb: european patent ceased through non-payment of renewal fee |
Effective date: 20161130 |
|
| PG25 | Lapsed in a contracting state [announced via postgrant information from national office to epo] |
Ref country code: LI Free format text: LAPSE BECAUSE OF NON-PAYMENT OF DUE FEES Effective date: 20161130 Ref country code: CH Free format text: LAPSE BECAUSE OF NON-PAYMENT OF DUE FEES Effective date: 20161130 |
|
| REG | Reference to a national code |
Ref country code: SE Ref legal event code: EUG |
|
| REG | Reference to a national code |
Ref country code: IE Ref legal event code: MM4A |
|
| REG | Reference to a national code |
Ref country code: FR Ref legal event code: ST Effective date: 20170731 |
|
| PG25 | Lapsed in a contracting state [announced via postgrant information from national office to epo] |
Ref country code: SE Free format text: LAPSE BECAUSE OF NON-PAYMENT OF DUE FEES Effective date: 20161201 |
|
| PG25 | Lapsed in a contracting state [announced via postgrant information from national office to epo] |
Ref country code: NL Free format text: LAPSE BECAUSE OF NON-PAYMENT OF DUE FEES Effective date: 20161201 Ref country code: LU Free format text: LAPSE BECAUSE OF NON-PAYMENT OF DUE FEES Effective date: 20161130 |
|
| REG | Reference to a national code |
Ref country code: SI Ref legal event code: KO00 Effective date: 20170818 |
|
| PG25 | Lapsed in a contracting state [announced via postgrant information from national office to epo] |
Ref country code: IT Free format text: LAPSE BECAUSE OF NON-PAYMENT OF DUE FEES Effective date: 20161130 Ref country code: FR Free format text: LAPSE BECAUSE OF NON-PAYMENT OF DUE FEES Effective date: 20161130 |
|
| PG25 | Lapsed in a contracting state [announced via postgrant information from national office to epo] |
Ref country code: IE Free format text: LAPSE BECAUSE OF NON-PAYMENT OF DUE FEES Effective date: 20161130 Ref country code: GB Free format text: LAPSE BECAUSE OF NON-PAYMENT OF DUE FEES Effective date: 20161130 Ref country code: SI Free format text: LAPSE BECAUSE OF NON-PAYMENT OF DUE FEES Effective date: 20161201 Ref country code: DE Free format text: LAPSE BECAUSE OF NON-PAYMENT OF DUE FEES Effective date: 20170601 |
|
| REG | Reference to a national code |
Ref country code: BE Ref legal event code: FP Effective date: 20150421 Ref country code: BE Ref legal event code: MM Effective date: 20161130 |
|
| PG25 | Lapsed in a contracting state [announced via postgrant information from national office to epo] |
Ref country code: ES Free format text: LAPSE BECAUSE OF NON-PAYMENT OF DUE FEES Effective date: 20161130 |
|
| PG25 | Lapsed in a contracting state [announced via postgrant information from national office to epo] |
Ref country code: PT Free format text: LAPSE BECAUSE OF FAILURE TO SUBMIT A TRANSLATION OF THE DESCRIPTION OR TO PAY THE FEE WITHIN THE PRESCRIBED TIME-LIMIT Effective date: 20150225 Ref country code: TR Free format text: LAPSE BECAUSE OF FAILURE TO SUBMIT A TRANSLATION OF THE DESCRIPTION OR TO PAY THE FEE WITHIN THE PRESCRIBED TIME-LIMIT Effective date: 20150225 Ref country code: MC Free format text: LAPSE BECAUSE OF NON-PAYMENT OF DUE FEES Effective date: 20161130 |
|
| REG | Reference to a national code |
Ref country code: ES Ref legal event code: FD2A Effective date: 20181122 |
|
| PG25 | Lapsed in a contracting state [announced via postgrant information from national office to epo] |
Ref country code: ES Free format text: LAPSE BECAUSE OF NON-PAYMENT OF DUE FEES Effective date: 20161201 |