EP2535706A1 - Multi-electrode test sensor - Google Patents
Multi-electrode test sensor Download PDFInfo
- Publication number
- EP2535706A1 EP2535706A1 EP12183634A EP12183634A EP2535706A1 EP 2535706 A1 EP2535706 A1 EP 2535706A1 EP 12183634 A EP12183634 A EP 12183634A EP 12183634 A EP12183634 A EP 12183634A EP 2535706 A1 EP2535706 A1 EP 2535706A1
- Authority
- EP
- European Patent Office
- Prior art keywords
- electrode
- test sensor
- sample
- secondary analysis
- electrodes
- Prior art date
- Legal status (The legal status is an assumption and is not a legal conclusion. Google has not performed a legal analysis and makes no representation as to the accuracy of the status listed.)
- Granted
Links
- 238000012360 testing method Methods 0.000 title claims abstract description 150
- 239000012491 analyte Substances 0.000 claims abstract description 96
- 238000004458 analytical method Methods 0.000 claims description 182
- 239000004020 conductor Substances 0.000 claims description 68
- 239000003153 chemical reaction reagent Substances 0.000 claims description 63
- 238000012546 transfer Methods 0.000 claims description 58
- 239000000203 mixture Substances 0.000 claims description 43
- 238000013461 design Methods 0.000 claims description 40
- 238000000034 method Methods 0.000 claims description 17
- 239000000758 substrate Substances 0.000 claims description 17
- 229910052751 metal Inorganic materials 0.000 claims description 14
- 239000002184 metal Substances 0.000 claims description 14
- 238000002156 mixing Methods 0.000 claims description 14
- 239000008363 phosphate buffer Substances 0.000 claims description 14
- 238000002484 cyclic voltammetry Methods 0.000 claims description 11
- 238000004891 communication Methods 0.000 claims description 8
- 239000012530 fluid Substances 0.000 claims description 7
- 229920000642 polymer Polymers 0.000 claims description 6
- 229920000036 polyvinylpyrrolidone Polymers 0.000 claims description 5
- 239000001267 polyvinylpyrrolidone Substances 0.000 claims description 5
- 235000013855 polyvinylpyrrolidone Nutrition 0.000 claims description 5
- 239000001488 sodium phosphate Substances 0.000 claims description 3
- 229910000162 sodium phosphate Inorganic materials 0.000 claims description 3
- RYFMWSXOAZQYPI-UHFFFAOYSA-K trisodium phosphate Chemical compound [Na+].[Na+].[Na+].[O-]P([O-])([O-])=O RYFMWSXOAZQYPI-UHFFFAOYSA-K 0.000 claims description 3
- 238000000840 electrochemical analysis Methods 0.000 abstract description 5
- 239000000523 sample Substances 0.000 description 205
- 238000005259 measurement Methods 0.000 description 37
- 239000011230 binding agent Substances 0.000 description 24
- 229940088598 enzyme Drugs 0.000 description 24
- YAGKRVSRTSUGEY-UHFFFAOYSA-N ferricyanide Chemical compound [Fe+3].N#[C-].N#[C-].N#[C-].N#[C-].N#[C-].N#[C-] YAGKRVSRTSUGEY-UHFFFAOYSA-N 0.000 description 23
- 238000005534 hematocrit Methods 0.000 description 23
- WQZGKKKJIJFFOK-VFUOTHLCSA-N beta-D-glucose Chemical compound OC[C@H]1O[C@@H](O)[C@H](O)[C@@H](O)[C@@H]1O WQZGKKKJIJFFOK-VFUOTHLCSA-N 0.000 description 22
- 239000000126 substance Substances 0.000 description 22
- 102000004190 Enzymes Human genes 0.000 description 21
- 108090000790 Enzymes Proteins 0.000 description 21
- 239000000463 material Substances 0.000 description 21
- WQZGKKKJIJFFOK-GASJEMHNSA-N Glucose Natural products OC[C@H]1OC(O)[C@H](O)[C@@H](O)[C@@H]1O WQZGKKKJIJFFOK-GASJEMHNSA-N 0.000 description 20
- 239000008103 glucose Substances 0.000 description 20
- 238000011049 filling Methods 0.000 description 19
- 238000007254 oxidation reaction Methods 0.000 description 19
- 210000004369 blood Anatomy 0.000 description 18
- 239000008280 blood Substances 0.000 description 18
- 230000003647 oxidation Effects 0.000 description 17
- 229920000663 Hydroxyethyl cellulose Polymers 0.000 description 14
- 239000004354 Hydroxyethyl cellulose Substances 0.000 description 14
- 239000013060 biological fluid Substances 0.000 description 14
- 235000019447 hydroxyethyl cellulose Nutrition 0.000 description 14
- 229940071826 hydroxyethyl cellulose Drugs 0.000 description 14
- 108090000854 Oxidoreductases Proteins 0.000 description 13
- 102000004316 Oxidoreductases Human genes 0.000 description 13
- 238000002955 isolation Methods 0.000 description 12
- -1 polyethylene terephthalate Polymers 0.000 description 12
- 238000000151 deposition Methods 0.000 description 10
- 230000005284 excitation Effects 0.000 description 10
- 238000006479 redox reaction Methods 0.000 description 10
- 238000009792 diffusion process Methods 0.000 description 9
- 230000001965 increasing effect Effects 0.000 description 9
- 238000006722 reduction reaction Methods 0.000 description 9
- 230000008901 benefit Effects 0.000 description 8
- 230000008021 deposition Effects 0.000 description 8
- 230000000694 effects Effects 0.000 description 8
- 239000007788 liquid Substances 0.000 description 8
- 230000009467 reduction Effects 0.000 description 8
- 238000003860 storage Methods 0.000 description 8
- 108010050375 Glucose 1-Dehydrogenase Proteins 0.000 description 7
- 230000027756 respiratory electron transport chain Effects 0.000 description 7
- 230000004044 response Effects 0.000 description 7
- 238000000926 separation method Methods 0.000 description 7
- 238000012935 Averaging Methods 0.000 description 6
- BPYKTIZUTYGOLE-IFADSCNNSA-N Bilirubin Chemical compound N1C(=O)C(C)=C(C=C)\C1=C\C1=C(C)C(CCC(O)=O)=C(CC2=C(C(C)=C(\C=C/3C(=C(C=C)C(=O)N\3)C)N2)CCC(O)=O)N1 BPYKTIZUTYGOLE-IFADSCNNSA-N 0.000 description 6
- 238000004082 amperometric method Methods 0.000 description 6
- 230000004888 barrier function Effects 0.000 description 6
- 229920000139 polyethylene terephthalate Polymers 0.000 description 6
- 239000005020 polyethylene terephthalate Substances 0.000 description 6
- 229920002134 Carboxymethyl cellulose Polymers 0.000 description 5
- 229920003171 Poly (ethylene oxide) Polymers 0.000 description 5
- 238000006243 chemical reaction Methods 0.000 description 5
- 238000001514 detection method Methods 0.000 description 5
- 210000003743 erythrocyte Anatomy 0.000 description 5
- 238000002474 experimental method Methods 0.000 description 5
- 150000003839 salts Chemical class 0.000 description 5
- 238000004832 voltammetry Methods 0.000 description 5
- OKTJSMMVPCPJKN-UHFFFAOYSA-N Carbon Chemical compound [C] OKTJSMMVPCPJKN-UHFFFAOYSA-N 0.000 description 4
- LFQSCWFLJHTTHZ-UHFFFAOYSA-N Ethanol Chemical compound CCO LFQSCWFLJHTTHZ-UHFFFAOYSA-N 0.000 description 4
- KDLHZDBZIXYQEI-UHFFFAOYSA-N Palladium Chemical compound [Pd] KDLHZDBZIXYQEI-UHFFFAOYSA-N 0.000 description 4
- 239000004642 Polyimide Substances 0.000 description 4
- KJTLSVCANCCWHF-UHFFFAOYSA-N Ruthenium Chemical compound [Ru] KJTLSVCANCCWHF-UHFFFAOYSA-N 0.000 description 4
- 229910052799 carbon Inorganic materials 0.000 description 4
- HVYWMOMLDIMFJA-DPAQBDIFSA-N cholesterol Chemical compound C1C=C2C[C@@H](O)CC[C@]2(C)[C@@H]2[C@@H]1[C@@H]1CC[C@H]([C@H](C)CCCC(C)C)[C@@]1(C)CC2 HVYWMOMLDIMFJA-DPAQBDIFSA-N 0.000 description 4
- 238000003487 electrochemical reaction Methods 0.000 description 4
- 230000005518 electrochemistry Effects 0.000 description 4
- 238000001208 nuclear magnetic resonance pulse sequence Methods 0.000 description 4
- BASFCYQUMIYNBI-UHFFFAOYSA-N platinum Chemical compound [Pt] BASFCYQUMIYNBI-UHFFFAOYSA-N 0.000 description 4
- 229920001721 polyimide Polymers 0.000 description 4
- 229910052707 ruthenium Inorganic materials 0.000 description 4
- BPEVHDGLPIIAGH-UHFFFAOYSA-N ruthenium(3+) Chemical compound [Ru+3] BPEVHDGLPIIAGH-UHFFFAOYSA-N 0.000 description 4
- 238000011282 treatment Methods 0.000 description 4
- 101710088194 Dehydrogenase Proteins 0.000 description 3
- MYMOFIZGZYHOMD-UHFFFAOYSA-N Dioxygen Chemical compound O=O MYMOFIZGZYHOMD-UHFFFAOYSA-N 0.000 description 3
- JVTAAEKCZFNVCJ-UHFFFAOYSA-M Lactate Chemical compound CC(O)C([O-])=O JVTAAEKCZFNVCJ-UHFFFAOYSA-M 0.000 description 3
- BAWFJGJZGIEFAR-NNYOXOHSSA-N NAD zwitterion Chemical compound NC(=O)C1=CC=C[N+]([C@H]2[C@@H]([C@H](O)[C@@H](COP([O-])(=O)OP(O)(=O)OC[C@@H]3[C@H]([C@@H](O)[C@@H](O3)N3C4=NC=NC(N)=C4N=C3)O)O2)O)=C1 BAWFJGJZGIEFAR-NNYOXOHSSA-N 0.000 description 3
- 239000004372 Polyvinyl alcohol Substances 0.000 description 3
- 101000767160 Saccharomyces cerevisiae (strain ATCC 204508 / S288c) Intracellular protein transport protein USO1 Proteins 0.000 description 3
- XJLXINKUBYWONI-DQQFMEOOSA-N [[(2r,3r,4r,5r)-5-(6-aminopurin-9-yl)-3-hydroxy-4-phosphonooxyoxolan-2-yl]methoxy-hydroxyphosphoryl] [(2s,3r,4s,5s)-5-(3-carbamoylpyridin-1-ium-1-yl)-3,4-dihydroxyoxolan-2-yl]methyl phosphate Chemical compound NC(=O)C1=CC=C[N+]([C@@H]2[C@H]([C@@H](O)[C@H](COP([O-])(=O)OP(O)(=O)OC[C@@H]3[C@H]([C@@H](OP(O)(O)=O)[C@@H](O3)N3C4=NC=NC(N)=C4N=C3)O)O2)O)=C1 XJLXINKUBYWONI-DQQFMEOOSA-N 0.000 description 3
- 239000002253 acid Substances 0.000 description 3
- QVGXLLKOCUKJST-UHFFFAOYSA-N atomic oxygen Chemical compound [O] QVGXLLKOCUKJST-UHFFFAOYSA-N 0.000 description 3
- 239000002585 base Substances 0.000 description 3
- 239000001768 carboxy methyl cellulose Substances 0.000 description 3
- 235000010948 carboxy methyl cellulose Nutrition 0.000 description 3
- 239000008112 carboxymethyl-cellulose Substances 0.000 description 3
- 229940105329 carboxymethylcellulose Drugs 0.000 description 3
- 230000008859 change Effects 0.000 description 3
- 238000010276 construction Methods 0.000 description 3
- 230000000875 corresponding effect Effects 0.000 description 3
- 238000003869 coulometry Methods 0.000 description 3
- 229910001882 dioxygen Inorganic materials 0.000 description 3
- 239000000499 gel Substances 0.000 description 3
- 230000003993 interaction Effects 0.000 description 3
- 238000012544 monitoring process Methods 0.000 description 3
- 229950006238 nadide Drugs 0.000 description 3
- 229930027945 nicotinamide-adenine dinucleotide Natural products 0.000 description 3
- 230000001590 oxidative effect Effects 0.000 description 3
- 229910052760 oxygen Inorganic materials 0.000 description 3
- 239000001301 oxygen Substances 0.000 description 3
- 229920002451 polyvinyl alcohol Polymers 0.000 description 3
- 229940068984 polyvinyl alcohol Drugs 0.000 description 3
- 235000019422 polyvinyl alcohol Nutrition 0.000 description 3
- 239000011148 porous material Substances 0.000 description 3
- 102000004169 proteins and genes Human genes 0.000 description 3
- 239000007787 solid Substances 0.000 description 3
- XLYOFNOQVPJJNP-UHFFFAOYSA-N water Substances O XLYOFNOQVPJJNP-UHFFFAOYSA-N 0.000 description 3
- AZQWKYJCGOJGHM-UHFFFAOYSA-N 1,4-benzoquinone Chemical compound O=C1C=CC(=O)C=C1 AZQWKYJCGOJGHM-UHFFFAOYSA-N 0.000 description 2
- 108010025188 Alcohol oxidase Proteins 0.000 description 2
- WSNMPAVSZJSIMT-UHFFFAOYSA-N COc1c(C)c2COC(=O)c2c(O)c1CC(O)C1(C)CCC(=O)O1 Chemical compound COc1c(C)c2COC(=O)c2c(O)c1CC(O)C1(C)CCC(=O)O1 WSNMPAVSZJSIMT-UHFFFAOYSA-N 0.000 description 2
- 239000001856 Ethyl cellulose Substances 0.000 description 2
- 108010015776 Glucose oxidase Proteins 0.000 description 2
- 239000004366 Glucose oxidase Substances 0.000 description 2
- 229920002153 Hydroxypropyl cellulose Polymers 0.000 description 2
- 102000003855 L-lactate dehydrogenase Human genes 0.000 description 2
- 108700023483 L-lactate dehydrogenases Proteins 0.000 description 2
- 101100446506 Mus musculus Fgf3 gene Proteins 0.000 description 2
- 229930040373 Paraformaldehyde Natural products 0.000 description 2
- 239000004698 Polyethylene Substances 0.000 description 2
- 239000004743 Polypropylene Substances 0.000 description 2
- BQCADISMDOOEFD-UHFFFAOYSA-N Silver Chemical compound [Ag] BQCADISMDOOEFD-UHFFFAOYSA-N 0.000 description 2
- LEHOTFFKMJEONL-UHFFFAOYSA-N Uric Acid Chemical compound N1C(=O)NC(=O)C2=C1NC(=O)N2 LEHOTFFKMJEONL-UHFFFAOYSA-N 0.000 description 2
- TVWHNULVHGKJHS-UHFFFAOYSA-N Uric acid Natural products N1C(=O)NC(=O)C2NC(=O)NC21 TVWHNULVHGKJHS-UHFFFAOYSA-N 0.000 description 2
- 229920000122 acrylonitrile butadiene styrene Polymers 0.000 description 2
- 229910052783 alkali metal Inorganic materials 0.000 description 2
- 239000012472 biological sample Substances 0.000 description 2
- 230000005540 biological transmission Effects 0.000 description 2
- 229910002091 carbon monoxide Inorganic materials 0.000 description 2
- 210000004027 cell Anatomy 0.000 description 2
- 235000012000 cholesterol Nutrition 0.000 description 2
- 238000000576 coating method Methods 0.000 description 2
- 239000000470 constituent Substances 0.000 description 2
- 238000011109 contamination Methods 0.000 description 2
- 230000002596 correlated effect Effects 0.000 description 2
- 206010012601 diabetes mellitus Diseases 0.000 description 2
- 238000003745 diagnosis Methods 0.000 description 2
- 229920001249 ethyl cellulose Polymers 0.000 description 2
- 235000019325 ethyl cellulose Nutrition 0.000 description 2
- VWWQXMAJTJZDQX-UYBVJOGSSA-N flavin adenine dinucleotide Chemical compound C1=NC2=C(N)N=CN=C2N1[C@@H]([C@H](O)[C@@H]1O)O[C@@H]1CO[P@](O)(=O)O[P@@](O)(=O)OC[C@@H](O)[C@@H](O)[C@@H](O)CN1C2=NC(=O)NC(=O)C2=NC2=C1C=C(C)C(C)=C2 VWWQXMAJTJZDQX-UYBVJOGSSA-N 0.000 description 2
- 235000019162 flavin adenine dinucleotide Nutrition 0.000 description 2
- 239000011714 flavin adenine dinucleotide Substances 0.000 description 2
- 229940093632 flavin-adenine dinucleotide Drugs 0.000 description 2
- 229940116332 glucose oxidase Drugs 0.000 description 2
- 235000019420 glucose oxidase Nutrition 0.000 description 2
- PCHJSUWPFVWCPO-UHFFFAOYSA-N gold Chemical compound [Au] PCHJSUWPFVWCPO-UHFFFAOYSA-N 0.000 description 2
- 229910052737 gold Inorganic materials 0.000 description 2
- 239000010931 gold Substances 0.000 description 2
- 229910052739 hydrogen Inorganic materials 0.000 description 2
- 239000001257 hydrogen Substances 0.000 description 2
- 239000001863 hydroxypropyl cellulose Substances 0.000 description 2
- 235000010977 hydroxypropyl cellulose Nutrition 0.000 description 2
- 150000002576 ketones Chemical class 0.000 description 2
- 238000004519 manufacturing process Methods 0.000 description 2
- 150000002739 metals Chemical class 0.000 description 2
- 229910052763 palladium Inorganic materials 0.000 description 2
- 150000002990 phenothiazines Chemical class 0.000 description 2
- 229910052697 platinum Inorganic materials 0.000 description 2
- 229920001707 polybutylene terephthalate Polymers 0.000 description 2
- 239000004417 polycarbonate Substances 0.000 description 2
- 229920000515 polycarbonate Polymers 0.000 description 2
- 229920000573 polyethylene Polymers 0.000 description 2
- 229920006324 polyoxymethylene Polymers 0.000 description 2
- 229920001155 polypropylene Polymers 0.000 description 2
- 230000008569 process Effects 0.000 description 2
- 108090000623 proteins and genes Proteins 0.000 description 2
- 229910052709 silver Inorganic materials 0.000 description 2
- 239000004332 silver Substances 0.000 description 2
- HKZLPVFGJNLROG-UHFFFAOYSA-M silver monochloride Chemical compound [Cl-].[Ag+] HKZLPVFGJNLROG-UHFFFAOYSA-M 0.000 description 2
- 238000001542 size-exclusion chromatography Methods 0.000 description 2
- 230000001052 transient effect Effects 0.000 description 2
- 150000003626 triacylglycerols Chemical class 0.000 description 2
- 229940116269 uric acid Drugs 0.000 description 2
- LNAZSHAWQACDHT-XIYTZBAFSA-N (2r,3r,4s,5r,6s)-4,5-dimethoxy-2-(methoxymethyl)-3-[(2s,3r,4s,5r,6r)-3,4,5-trimethoxy-6-(methoxymethyl)oxan-2-yl]oxy-6-[(2r,3r,4s,5r,6r)-4,5,6-trimethoxy-2-(methoxymethyl)oxan-3-yl]oxyoxane Chemical compound CO[C@@H]1[C@@H](OC)[C@H](OC)[C@@H](COC)O[C@H]1O[C@H]1[C@H](OC)[C@@H](OC)[C@H](O[C@H]2[C@@H]([C@@H](OC)[C@H](OC)O[C@@H]2COC)OC)O[C@@H]1COC LNAZSHAWQACDHT-XIYTZBAFSA-N 0.000 description 1
- AKRDMBNEEYBOIK-GEMLJDPKSA-N (2s)-2-amino-5-[[(2r)-1-(carboxymethylamino)-1-oxo-3-sulfanylpropan-2-yl]amino]-5-oxopentanoic acid;7,9-dihydro-3h-purine-2,6,8-trione Chemical compound N1C(=O)NC(=O)C2=C1NC(=O)N2.OC(=O)[C@@H](N)CCC(=O)N[C@@H](CS)C(=O)NCC(O)=O AKRDMBNEEYBOIK-GEMLJDPKSA-N 0.000 description 1
- 150000005208 1,4-dihydroxybenzenes Chemical class 0.000 description 1
- WJFKNYWRSNBZNX-UHFFFAOYSA-N 10H-phenothiazine Chemical compound C1=CC=C2NC3=CC=CC=C3SC2=C1 WJFKNYWRSNBZNX-UHFFFAOYSA-N 0.000 description 1
- WHBMMWSBFZVSSR-UHFFFAOYSA-N 3-hydroxybutyric acid Chemical compound CC(O)CC(O)=O WHBMMWSBFZVSSR-UHFFFAOYSA-N 0.000 description 1
- BKIKFYRTTUYTJZ-UHFFFAOYSA-N 7-hydroxy-9,9-dimethylacridin-2-one Chemical compound C1=C(O)C=C2C(C)(C)C3=CC(=O)C=CC3=NC2=C1 BKIKFYRTTUYTJZ-UHFFFAOYSA-N 0.000 description 1
- 229920000936 Agarose Polymers 0.000 description 1
- 102000007698 Alcohol dehydrogenase Human genes 0.000 description 1
- 108010021809 Alcohol dehydrogenase Proteins 0.000 description 1
- 102100039702 Alcohol dehydrogenase class-3 Human genes 0.000 description 1
- 108010006591 Apoenzymes Proteins 0.000 description 1
- 108010015428 Bilirubin oxidase Proteins 0.000 description 1
- UGFAIRIUMAVXCW-UHFFFAOYSA-N Carbon monoxide Chemical compound [O+]#[C-] UGFAIRIUMAVXCW-UHFFFAOYSA-N 0.000 description 1
- 108010089254 Cholesterol oxidase Proteins 0.000 description 1
- RYGMFSIKBFXOCR-UHFFFAOYSA-N Copper Chemical compound [Cu] RYGMFSIKBFXOCR-UHFFFAOYSA-N 0.000 description 1
- 108020005199 Dehydrogenases Proteins 0.000 description 1
- IMROMDMJAWUWLK-UHFFFAOYSA-N Ethenol Chemical group OC=C IMROMDMJAWUWLK-UHFFFAOYSA-N 0.000 description 1
- 229920000896 Ethulose Polymers 0.000 description 1
- ZZSNKZQZMQGXPY-UHFFFAOYSA-N Ethyl cellulose Chemical compound CCOCC1OC(OC)C(OCC)C(OCC)C1OC1C(O)C(O)C(OC)C(CO)O1 ZZSNKZQZMQGXPY-UHFFFAOYSA-N 0.000 description 1
- 239000001859 Ethyl hydroxyethyl cellulose Substances 0.000 description 1
- 108010010803 Gelatin Proteins 0.000 description 1
- 102000002794 Glucosephosphate Dehydrogenase Human genes 0.000 description 1
- 108010018962 Glucosephosphate Dehydrogenase Proteins 0.000 description 1
- 108010063907 Glutathione Reductase Proteins 0.000 description 1
- 102100036442 Glutathione reductase, mitochondrial Human genes 0.000 description 1
- 102000057621 Glycerol kinases Human genes 0.000 description 1
- 108700016170 Glycerol kinases Proteins 0.000 description 1
- UFHFLCQGNIYNRP-UHFFFAOYSA-N Hydrogen Chemical compound [H][H] UFHFLCQGNIYNRP-UHFFFAOYSA-N 0.000 description 1
- COLNVLDHVKWLRT-QMMMGPOBSA-N L-phenylalanine Chemical compound OC(=O)[C@@H](N)CC1=CC=CC=C1 COLNVLDHVKWLRT-QMMMGPOBSA-N 0.000 description 1
- 108010073450 Lactate 2-monooxygenase Proteins 0.000 description 1
- 102100022119 Lipoprotein lipase Human genes 0.000 description 1
- 102000013460 Malate Dehydrogenase Human genes 0.000 description 1
- 108010026217 Malate Dehydrogenase Proteins 0.000 description 1
- 101100348848 Mus musculus Notch4 gene Proteins 0.000 description 1
- 108091005461 Nucleic proteins Proteins 0.000 description 1
- 239000004677 Nylon Substances 0.000 description 1
- BWUHFIMIYXLIIO-FYJGNVAPSA-N OC(=O)C1=CC(C(=O)O)=CC(\N=C/2C=C3SC4=CC=CC=C4N=C3C=C\2)=C1 Chemical compound OC(=O)C1=CC(C(=O)O)=CC(\N=C/2C=C3SC4=CC=CC=C4N=C3C=C\2)=C1 BWUHFIMIYXLIIO-FYJGNVAPSA-N 0.000 description 1
- VBLYLVNRHJELKI-YBFXNURJSA-N OS(=O)(=O)C1=CC=C(S(O)(=O)=O)C(\N=C/2C=C3SC4=CC=CC=C4N=C3C=C\2)=C1 Chemical compound OS(=O)(=O)C1=CC=C(S(O)(=O)=O)C(\N=C/2C=C3SC4=CC=CC=C4N=C3C=C\2)=C1 VBLYLVNRHJELKI-YBFXNURJSA-N 0.000 description 1
- 229920002845 Poly(methacrylic acid) Polymers 0.000 description 1
- 108010039918 Polylysine Proteins 0.000 description 1
- 239000004793 Polystyrene Substances 0.000 description 1
- LCTONWCANYUPML-UHFFFAOYSA-M Pyruvate Chemical compound CC(=O)C([O-])=O LCTONWCANYUPML-UHFFFAOYSA-M 0.000 description 1
- 108010042687 Pyruvate Oxidase Proteins 0.000 description 1
- 108091007187 Reductases Proteins 0.000 description 1
- 229910021607 Silver chloride Inorganic materials 0.000 description 1
- 229920002125 Sokalan® Polymers 0.000 description 1
- 229920002472 Starch Polymers 0.000 description 1
- 108010055297 Sterol Esterase Proteins 0.000 description 1
- 102000000019 Sterol Esterase Human genes 0.000 description 1
- 108010092464 Urate Oxidase Proteins 0.000 description 1
- 0 [*-]c1cc(C(O)=O)cc(N=C2C=C3Sc(cccc4)c4N=C3C=C2)c1 Chemical compound [*-]c1cc(C(O)=O)cc(N=C2C=C3Sc(cccc4)c4N=C3C=C2)c1 0.000 description 1
- DGEZNRSVGBDHLK-UHFFFAOYSA-N [1,10]phenanthroline Chemical compound C1=CN=C2C3=NC=CC=C3C=CC2=C1 DGEZNRSVGBDHLK-UHFFFAOYSA-N 0.000 description 1
- OVHMNBDWISAPSD-PGCULMPHSA-N [NH4+].[O-]C(=O)C1=CC(C(=O)O)=CC(\N=C/2C=C3SC4=CC=CC=C4N=C3C=C\2)=C1 Chemical compound [NH4+].[O-]C(=O)C1=CC(C(=O)O)=CC(\N=C/2C=C3SC4=CC=CC=C4N=C3C=C\2)=C1 OVHMNBDWISAPSD-PGCULMPHSA-N 0.000 description 1
- 230000005856 abnormality Effects 0.000 description 1
- 230000009471 action Effects 0.000 description 1
- 125000003277 amino group Chemical group 0.000 description 1
- 150000003863 ammonium salts Chemical class 0.000 description 1
- 238000003556 assay Methods 0.000 description 1
- 230000009286 beneficial effect Effects 0.000 description 1
- 230000004071 biological effect Effects 0.000 description 1
- 229920001222 biopolymer Polymers 0.000 description 1
- 230000015572 biosynthetic process Effects 0.000 description 1
- 238000011088 calibration curve Methods 0.000 description 1
- 150000001732 carboxylic acid derivatives Chemical class 0.000 description 1
- 230000003197 catalytic effect Effects 0.000 description 1
- 229920002678 cellulose Polymers 0.000 description 1
- 239000001913 cellulose Substances 0.000 description 1
- 238000005229 chemical vapour deposition Methods 0.000 description 1
- 239000011248 coating agent Substances 0.000 description 1
- 150000001875 compounds Chemical class 0.000 description 1
- 229920001940 conductive polymer Polymers 0.000 description 1
- 230000001276 controlling effect Effects 0.000 description 1
- 229910052802 copper Inorganic materials 0.000 description 1
- 239000010949 copper Substances 0.000 description 1
- 230000008878 coupling Effects 0.000 description 1
- 238000010168 coupling process Methods 0.000 description 1
- 238000005859 coupling reaction Methods 0.000 description 1
- 230000009849 deactivation Effects 0.000 description 1
- 230000037213 diet Effects 0.000 description 1
- 235000005911 diet Nutrition 0.000 description 1
- 238000010790 dilution Methods 0.000 description 1
- 239000012895 dilution Substances 0.000 description 1
- ZOMNIUBKTOKEHS-UHFFFAOYSA-L dimercury dichloride Chemical class Cl[Hg][Hg]Cl ZOMNIUBKTOKEHS-UHFFFAOYSA-L 0.000 description 1
- 229940079593 drug Drugs 0.000 description 1
- 239000003814 drug Substances 0.000 description 1
- 239000007772 electrode material Substances 0.000 description 1
- 230000002708 enhancing effect Effects 0.000 description 1
- 235000019326 ethyl hydroxyethyl cellulose Nutrition 0.000 description 1
- 210000003722 extracellular fluid Anatomy 0.000 description 1
- 239000000706 filtrate Substances 0.000 description 1
- 238000001914 filtration Methods 0.000 description 1
- 239000011888 foil Substances 0.000 description 1
- 235000021588 free fatty acids Nutrition 0.000 description 1
- 229920000159 gelatin Polymers 0.000 description 1
- 239000008273 gelatin Substances 0.000 description 1
- 235000019322 gelatine Nutrition 0.000 description 1
- 235000011852 gelatine desserts Nutrition 0.000 description 1
- 239000011521 glass Substances 0.000 description 1
- 108010051015 glutathione-independent formaldehyde dehydrogenase Proteins 0.000 description 1
- 108010054790 glycerol-3-phosphate oxidase Proteins 0.000 description 1
- 239000004312 hexamethylene tetramine Substances 0.000 description 1
- 235000010299 hexamethylene tetramine Nutrition 0.000 description 1
- VKYKSIONXSXAKP-UHFFFAOYSA-N hexamethylenetetramine Chemical compound C1N(C2)CN3CN1CN2C3 VKYKSIONXSXAKP-UHFFFAOYSA-N 0.000 description 1
- 150000004677 hydrates Chemical class 0.000 description 1
- 230000002209 hydrophobic effect Effects 0.000 description 1
- 238000011534 incubation Methods 0.000 description 1
- 238000007641 inkjet printing Methods 0.000 description 1
- 210000002977 intracellular fluid Anatomy 0.000 description 1
- 108010022197 lipoprotein cholesterol Proteins 0.000 description 1
- FPYJFEHAWHCUMM-UHFFFAOYSA-N maleic anhydride Chemical class O=C1OC(=O)C=C1 FPYJFEHAWHCUMM-UHFFFAOYSA-N 0.000 description 1
- 230000001404 mediated effect Effects 0.000 description 1
- 229910021645 metal ion Inorganic materials 0.000 description 1
- 238000001465 metallisation Methods 0.000 description 1
- 229920000609 methyl cellulose Polymers 0.000 description 1
- 239000001923 methylcellulose Substances 0.000 description 1
- 235000010981 methylcellulose Nutrition 0.000 description 1
- BRTPYBXQVFNPCB-UHFFFAOYSA-N n-phenyl-3h-phenoxazin-3-amine Chemical class C1=CC2=NC3=CC=CC=C3OC2=CC1NC1=CC=CC=C1 BRTPYBXQVFNPCB-UHFFFAOYSA-N 0.000 description 1
- DLZPPUIHGWXDNJ-UHFFFAOYSA-N n-phenylphenothiazin-3-imine Chemical class C1=CC=CC=C1N=C1C=C2SC3=CC=CC=C3N=C2C=C1 DLZPPUIHGWXDNJ-UHFFFAOYSA-N 0.000 description 1
- LJXXBBCNKKOAHS-UHFFFAOYSA-N n-phenylphenoxazin-3-imine Chemical class C1=CC=CC=C1N=C1C=C2OC3=CC=CC=C3N=C2C=C1 LJXXBBCNKKOAHS-UHFFFAOYSA-N 0.000 description 1
- BOPGDPNILDQYTO-NNYOXOHSSA-N nicotinamide-adenine dinucleotide Chemical compound C1=CCC(C(=O)N)=CN1[C@H]1[C@H](O)[C@H](O)[C@@H](COP(O)(=O)OP(O)(=O)OC[C@@H]2[C@H]([C@@H](O)[C@@H](O2)N2C3=NC=NC(N)=C3N=C2)O)O1 BOPGDPNILDQYTO-NNYOXOHSSA-N 0.000 description 1
- 102000039446 nucleic acids Human genes 0.000 description 1
- 108020004707 nucleic acids Proteins 0.000 description 1
- 150000007523 nucleic acids Chemical class 0.000 description 1
- 229920001778 nylon Polymers 0.000 description 1
- 230000003287 optical effect Effects 0.000 description 1
- 239000007800 oxidant agent Substances 0.000 description 1
- 229950000688 phenothiazine Drugs 0.000 description 1
- 125000001644 phenoxazinyl group Chemical class C1(=CC=CC=2OC3=CC=CC=C3NC12)* 0.000 description 1
- COLNVLDHVKWLRT-UHFFFAOYSA-N phenylalanine Natural products OC(=O)C(N)CC1=CC=CC=C1 COLNVLDHVKWLRT-UHFFFAOYSA-N 0.000 description 1
- 239000008055 phosphate buffer solution Substances 0.000 description 1
- 210000002381 plasma Anatomy 0.000 description 1
- 229920001308 poly(aminoacid) Polymers 0.000 description 1
- 229920003229 poly(methyl methacrylate) Polymers 0.000 description 1
- 229920001467 poly(styrenesulfonates) Polymers 0.000 description 1
- 239000004584 polyacrylic acid Substances 0.000 description 1
- 229920000656 polylysine Polymers 0.000 description 1
- 239000004926 polymethyl methacrylate Substances 0.000 description 1
- 229960002796 polystyrene sulfonate Drugs 0.000 description 1
- 239000011970 polystyrene sulfonate Substances 0.000 description 1
- 239000004800 polyvinyl chloride Substances 0.000 description 1
- 239000000276 potassium ferrocyanide Substances 0.000 description 1
- 238000004313 potentiometry Methods 0.000 description 1
- 239000002244 precipitate Substances 0.000 description 1
- 102000004196 processed proteins & peptides Human genes 0.000 description 1
- 108090000765 processed proteins & peptides Proteins 0.000 description 1
- 238000012545 processing Methods 0.000 description 1
- MMXZSJMASHPLLR-UHFFFAOYSA-N pyrroloquinoline quinone Chemical compound C12=C(C(O)=O)C=C(C(O)=O)N=C2C(=O)C(=O)C2=C1NC(C(=O)O)=C2 MMXZSJMASHPLLR-UHFFFAOYSA-N 0.000 description 1
- 238000011002 quantification Methods 0.000 description 1
- 150000004053 quinones Chemical class 0.000 description 1
- 239000011347 resin Substances 0.000 description 1
- 229920005989 resin Polymers 0.000 description 1
- YAYGSLOSTXKUBW-UHFFFAOYSA-N ruthenium(2+) Chemical compound [Ru+2] YAYGSLOSTXKUBW-UHFFFAOYSA-N 0.000 description 1
- 210000003296 saliva Anatomy 0.000 description 1
- 239000012488 sample solution Substances 0.000 description 1
- 238000007650 screen-printing Methods 0.000 description 1
- 239000004065 semiconductor Substances 0.000 description 1
- 210000002966 serum Anatomy 0.000 description 1
- 239000002002 slurry Substances 0.000 description 1
- 159000000000 sodium salts Chemical class 0.000 description 1
- 125000006850 spacer group Chemical group 0.000 description 1
- 239000008107 starch Substances 0.000 description 1
- 235000019698 starch Nutrition 0.000 description 1
- 229940066767 systemic antihistamines phenothiazine derivative Drugs 0.000 description 1
- XOGGUFAVLNCTRS-UHFFFAOYSA-N tetrapotassium;iron(2+);hexacyanide Chemical compound [K+].[K+].[K+].[K+].[Fe+2].N#[C-].N#[C-].N#[C-].N#[C-].N#[C-].N#[C-] XOGGUFAVLNCTRS-UHFFFAOYSA-N 0.000 description 1
- 229910052723 transition metal Inorganic materials 0.000 description 1
- 150000003624 transition metals Chemical class 0.000 description 1
- WFKWXMTUELFFGS-UHFFFAOYSA-N tungsten Chemical compound [W] WFKWXMTUELFFGS-UHFFFAOYSA-N 0.000 description 1
- 229910052721 tungsten Inorganic materials 0.000 description 1
- 239000010937 tungsten Substances 0.000 description 1
- 210000002700 urine Anatomy 0.000 description 1
Images


Classifications
-
- G—PHYSICS
- G01—MEASURING; TESTING
- G01N—INVESTIGATING OR ANALYSING MATERIALS BY DETERMINING THEIR CHEMICAL OR PHYSICAL PROPERTIES
- G01N27/00—Investigating or analysing materials by the use of electric, electrochemical, or magnetic means
- G01N27/26—Investigating or analysing materials by the use of electric, electrochemical, or magnetic means by investigating electrochemical variables; by using electrolysis or electrophoresis
- G01N27/28—Electrolytic cell components
- G01N27/30—Electrodes, e.g. test electrodes; Half-cells
- G01N27/327—Biochemical electrodes, e.g. electrical or mechanical details for in vitro measurements
- G01N27/3271—Amperometric enzyme electrodes for analytes in body fluids, e.g. glucose in blood
- G01N27/3272—Test elements therefor, i.e. disposable laminated substrates with electrodes, reagent and channels
-
- C—CHEMISTRY; METALLURGY
- C12—BIOCHEMISTRY; BEER; SPIRITS; WINE; VINEGAR; MICROBIOLOGY; ENZYMOLOGY; MUTATION OR GENETIC ENGINEERING
- C12Q—MEASURING OR TESTING PROCESSES INVOLVING ENZYMES, NUCLEIC ACIDS OR MICROORGANISMS; COMPOSITIONS OR TEST PAPERS THEREFOR; PROCESSES OF PREPARING SUCH COMPOSITIONS; CONDITION-RESPONSIVE CONTROL IN MICROBIOLOGICAL OR ENZYMOLOGICAL PROCESSES
- C12Q1/00—Measuring or testing processes involving enzymes, nucleic acids or microorganisms; Compositions therefor; Processes of preparing such compositions
- C12Q1/001—Enzyme electrodes
-
- G—PHYSICS
- G01—MEASURING; TESTING
- G01N—INVESTIGATING OR ANALYSING MATERIALS BY DETERMINING THEIR CHEMICAL OR PHYSICAL PROPERTIES
- G01N27/00—Investigating or analysing materials by the use of electric, electrochemical, or magnetic means
- G01N27/26—Investigating or analysing materials by the use of electric, electrochemical, or magnetic means by investigating electrochemical variables; by using electrolysis or electrophoresis
- G01N27/28—Electrolytic cell components
- G01N27/30—Electrodes, e.g. test electrodes; Half-cells
- G01N27/327—Biochemical electrodes, e.g. electrical or mechanical details for in vitro measurements
- G01N27/3271—Amperometric enzyme electrodes for analytes in body fluids, e.g. glucose in blood
- G01N27/3274—Corrective measures, e.g. error detection, compensation for temperature or hematocrit, calibration
Definitions
- Biosensors provide an analysis of a biological fluid, such as whole blood, serum, plasma, urine, saliva, interstitial, or intracellular fluid.
- a biological fluid such as whole blood, serum, plasma, urine, saliva, interstitial, or intracellular fluid.
- biosensors have a measurement device that analyzes a sample residing in a test sensor.
- the sample is typically in liquid form and in addition to being a biological fluid, may be the derivative of a biological fluid, such as an extract, a dilution, a filtrate, or a reconstituted precipitate.
- the analysis performed by the biosensor determines the presence and/or concentration of one or more analytes, such as alcohol, glucose, uric acid, lactate, cholesterol, bilirubin, free fatty acids, triglycerides, proteins, ketones, phenylalanine or enzymes, in the biological fluid.
- the analysis may be useful in the diagnosis and treatment of physiological abnormalities. For example, a diabetic individual may use a biosensor to determine
- Biosensors analyze for a single analyte and use various techniques to improve the accuracy and/or precision of the analysis.
- Accuracy may be expressed in terms of bias of the sensor system's analyte reading in comparison to a reference analyte reading, with larger bias values representing less accuracy, while precision may be expressed in terms of the spread or variance among multiple measurements.
- Calibration information may be used to improve the accuracy and/or precision of the analysis and may be read from the test sensor to the measurement device prior to the analysis.
- the measurement device uses the calibration information to adjust the analysis of the biological fluid in response to one or more parameters, such as the type of biological fluid, the particular analyte(s), and the manufacturing variations of the test sensor.
- Biosensors may be implemented using bench-top, portable, and like measurement devices.
- Portable measurement devices may be hand-held and allow for the identification and/or quantification of an analyte in a sample.
- portable measurement systems include the Ascensia Breeze® and Elite® meters of Bayer HealthCare in Tarrytown, New York, while examples of bench-top measurement systems include the Electrochemical Workstation available from CH Instruments in Austin, Texas.
- the electrical signal input to the test sensor by the measurement device may be a potential or current and may be constant, variable, or a combination thereof, such as when an AC signal is applied with a DC signal offset.
- the input signal may be applied as a single pulse or in multiple pulses, sequences, or cycles.
- the analyte or a measurable species undergoes a redox reaction when the input signal is applied to the sample.
- the redox reaction generates the output signal that may be measured constantly or periodically during transient and/or steady-state output. Unlike a transient output signal that is changing, steady-state output is observed when the change of a signal with respect to its independent input variable (time, etc.) is substantially constant, such as within ⁇ 10 or ⁇ 5%.
- amperometry and voltammetry generally measure the rate at which the analyte is oxidized or reduced to determine the analyte concentration in the sample.
- an electrical signal of constant potential (voltage) is applied to the electrical conductors of the test sensor while the measured output signal is a current.
- voltammetry a varying potential is applied to a sample of biological fluid. Gated amperometry and gated voltammetry methods including alternating excitation and relaxation cycles also may be used.
- the "hematocrit effect” is one factor that may reduce the accuracy and/or precision of an analysis performed in a whole blood sample.
- whole blood samples contain red blood cells.
- Hematocrit is the volume of a whole blood sample occupied by red blood cells in relation to the total volume of the whole blood sample and is often expressed as a percentage. The greater the hematocrit percentage deviates from the %-hematocrit system calibration for a whole blood sample, the greater the bias (error) in the analyte readings obtained from the biosensor.
- a conventional biosensor system having one set of calibration constants (slope and intercept for the 40% hematocrit containing whole blood sample, for instance) will report three different glucose concentrations for whole blood samples having identical glucose concentrations, but hematocrit percentages of 20%, 40%, and 60%.
- the system will report that the 20% hematocrit whole blood sample contains more glucose than the 40% hematocrit whole blood sample, and that the 60% hematocrit whole blood sample contains less glucose than the 40% hematocrit whole blood sample.
- any glucose measurement performed on a blood sample containing less or more than 40% hematocrit will include some bias error attributable to the hematocrit effect.
- measurement inaccuracies also may arise when the measurable species concentration does not correlate with the analyte concentration.
- the biosensor determines the concentration of a reduced mediator generated in response to the oxidation of an analyte, any reduced mediator not generated by oxidation of the analyte will lead to an indication that more analyte is present in the sample than is correct due to mediator background.
- the spurious portion of the output signal may be subtracted.
- Conventional systems have attempted to isolate the non-responsive portions of the output signal by placing multiples pairs of working and counter electrodes in a common sample reservoir. By altering the reagents used to form the electrodes, these systems attempted to separate the analyte responsive and non-responsive portions by subtracting the two output signals.
- conventional sensor systems may have multiple detection areas in an undivided sample chamber, where each working electrode faces a reference electrode.
- these systems may have a single reference electrode.
- Systems of these types may provide an on-test sensor calibration system with two known standards or may provide separate electrode systems for analyte, interference, and hematocrit determination, for example.
- a disadvantage common to these systems is the single sample chamber, where the adjacent electrode systems/detection areas may be contaminated chemically from each other due to diffusion and/or liquid movement. This disadvantage may be especially problematic when one reagent system requires a longer assay time than another and/or when the test sensor is mechanically disturbed after filling with sample.
- An analyte test sensor includes at least two substrates forming a reservoir, the reservoir having at least two substantially chemically isolated secondary analysis region; at least one first working electrode including a first conductor and a reagent composition disposed in the reservoir; at least one first counter electrode including a second conductor and at least one first redox species disposed in a first secondary analysis region; and at least one second counterelectrode including a third conductor and at least one second redox species disposed in a second secondary analysis region, where the working electrode, the first counter electrode, and the second counter electrodes are independently addressable.
- An analyte test sensor includes at least two substrates forming a reservoir, the reservoir including at least three independently addressable secondary analysis regions, were each of the secondary analysis regions are substantially chemically isolated.
- a test sensor may be configured where a straight line passing from the working electrode through the first secondary analysis region and through the primary area cannot be drawn through the second secondary analysis region to the counter electrode.
- a test sensor also may be configured where a conductor is disposed between two substrates and at least one portion of a reservoir including a sample port is defined at least by the two substrates and an edge of the conductor. In this instance, the edge of the conductor defines at least a first electrode.
- a test sensor may be configured where a fluid sample entering the at least one sample port does not flow across more than one of the first, the second, and the third electrodes to reach another electrode.
- a test sensor also may be configured where mixing of the first and the second redox species is not observed by an analysis technique selected from cyclic voltammetry and chemoamperometry within 12 minutes if the test sensor is not mechanically disturbed or within 1.4 minutes if the test sensor is mechanically disturbed.
- a method of measuring at least one analyte in a sample includes chemically or biochemically oxidizing or reducing at least one analyte in a sample; applying a first input signal to the sample with at least a first working electrode and a first counter electrode; applying a second input signal at a different potential than the first input signal to the sample with at least the first working electrode and a second counter electrode; analyzing the output signals from the first and the second input signals to determine a concentration of a first measurable species in the sample at the potential of the first counter electrode, and a concentration of a second measurable species in the sample at the potential of the second counter electrode; and converting at least one of the first and the second measurable species concentrations into the concentration of the at least one analyte in the sample.
- a method of measuring at least one analyte in a sample includes introducing the sample to a test sensor including at least two pairs of electrodes, the at least two pairs of electrodes including at least four independently addressable and substantially chemically isolated electrodes, where at least two of the electrodes are working electrodes and at least two of the electrodes are counter electrodes; chemically or biochemically oxidizing or reducing the analyte in the sample; applying a gated input signal to the sample across the at least two pairs of electrodes to generate at least two output signals; combining the at least two output signals; and measuring the concentration of the analyte in the sample from the combined output signals.
- Systems of using the disclosed test sensors with the disclosed methods also are disclosed.
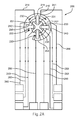
- FIG. 1A represents a test sensor arrangement where the sample is introduced to the top of a primary area through a sample port and flows in a substantially symmetrical manner to fill four secondary analysis regions.
- FIG. 1B represents the test sensor of FIG. 1A with the addition of a reference electrode.
- FIG. 1C represents the test sensor of FIG. 1A with separate counter electrodes.
- FIG. 1D represents the test sensor of FIG. 1C with the addition of a reference electrode.
- FIG. 2A represents a test sensor arrangement where sample introduction occurs from a sample port in a side of the test sensor into a primary area and then flows in an asymmetric manner to fill two secondary analysis region.
- FIG. 2B represents a test sensor having the electrode arrangement of FIG. 2A , but with a different arrangement of the secondary analysis regions.
- FIG. 3A represents a straight-channel test sensor design where the sample flows from a primary area across a first potential electrode location to reach a second potential electrode location.
- FIG. 3B through FIG. 3G represent alternate designs for secondary analysis regions where the sample does not flow across more than one potential electrode location.
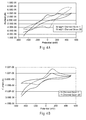
- FIG. 4A shows the cyclic voltammogram of a straight-channel test sensor design, such as represented in FIG. 3A .
- FIG. 4B shows the cyclic voltammogram of a Y-channel design, such as represented in FIG. 3E .
- FIG. 5A shows a chemoamperometry current verses time plot establishing that for a straight-channel test sensor of the type used in FIG. 4A , a ferrocyanide peak was observed at the working electrode within about 5 seconds of introducing the sample.
- FIG. 5B shows a chemoamperometry current verses time plot establishing that for a Y-channel test sensor of the type used in FIG. 4B , substantially no ferrocyanide reached the working electrode after 30 seconds of introducing the sample.
- FIG. 5C is a chemoamperometry current verses time plot establishing that the Y-channel design provides superior chemical isolation between potential electrode locations than a T-channel design.
- FIG. 5D establishes that three Y-channel designs were resistant to such mixing from mechanical disturbance.
- FIG. 6A represents a test sensor having a staggered arrangement of the secondary analysis regions where the sample enters a sample port into a primary area in the form of a channel from which two secondary analysis regions branch.
- FIG. 6B represents a test sensor arrangement where the sample enters the sample port into a primary area in the form of a channel from which three secondary regions branch.
- FIG. 7A and FIG. 7B represent test sensors having staggered secondary analysis region designs.
- FIG. 8A represents a variation of the FIG. 7A test sensor where multiple working electrodes are electrically connected.
- FIG. 8B represents a variation of the FIG. 7A test sensor where multiple counter electrodes are electrically connected.
- FIG. 9A represents a one electron transfer mediator transferring one electron.
- FIG. 9B represents a multi-electron transfer mediator transferring two electrons.
- FIG. 10A represents a system having three independently addressable counter electrodes, each operating at a different potential, and three electrically connected working electrodes, each having a mediator system that operates at a different potential.
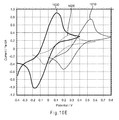
- FIG. 10B shows cyclic voltammograms of ruthenium(III) hexaamine, ferricyanide, and an electro-active organic molecule.
- FIG. 10C is a graph relating counter electrode operating potential and redox conjugate pair ratio.
- FIG. 10D represents the charge transfer systems of multiple independently addressable counter electrodes.
- FIG. 10E shows cyclic voltammograms establishing the different operating potentials that may be provided to one or more working electrodes by multiple independently addressable counter electrodes.
- FIG. 11A establish that the charge transfer systems of FIG. 10E may be replaced with multiple redox conjugate pair ratios to provide multiple potentials to the system.
- FIG. 11B depicts the current profiles obtained when the potential at one substantially chemically isolated working electrode is repetitively controlled in sequence by three substantially chemically isolated and independently addressable counter electrodes, each having a different potential provided by different charge transfer systems.
- FIG. 12A depicts a schematic representation of a biosensor system that determines an analyte concentration in a sample of a biological fluid.
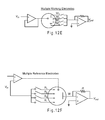
- FIG. 12B through FIG. 12F represent multiple potentiostat variations that may be used with the signal generator of FIG. 12A .
- FIG. 13 represents an electrochemical analysis for determining the presence and/or concentration of at least one analyte in a sample.
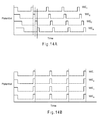
- FIG. 14A represents the input signal from a sequential gated amperometric pulse sequence used in combination with a test sensor having independently addressable counter and working electrodes.
- FIG. 14B represents the input signal from a simultaneous gated amperometric pulse sequence used in combination with a test sensor having independently addressable counter and working electrodes.
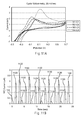
- FIG. 15 shows the results of averaging the results of up to four separate analyses for the same analyte to determine the concentration of the analyte in the sample.
- FIG. 16 depicts the current decays obtained from a signal averaging experiment.
- a biosensor system including test sensors having at least three independently addressable analysis regions is disclosed.
- Each analysis region includes a conductor or electrode and may be substantially chemically isolated.
- the working and counter electrodes of an electrode pair may reside in substantially chemically isolated environments.
- a working electrode may be combined with two or more counter electrodes, where each counter electrode resides in a substantially chemically isolated environment.
- the system may include at least two counter electrodes operating at different potentials.
- the independent addressability of the substantially chemically isolated analysis regions provides for multi-potential electrochemical analysis.
- samples including multiple analytes may be analyzed. Multiple, independent analyses of the same analyte may be performed to increase the accuracy and/or precision of the analysis.
- the configurability of the system allows for increased accuracy and/or precision as the portion of the output signal attributable to sample interferents, hematocrit, mediator background, temperature, manufacturing variability, reagent deactivation, and the like may be determined.
- Analyte interferents are chemical, electrochemical, physiological, or biological species that result in a positive or negative bias in the determined analyte concentration. Once known, these effects may be used to alter or may be removed from the determined analyte concentration. Calibration information also may be provided by analysis regions that are not responsive to an analyte.
- FIG. 1A represents a test sensor 100 arrangement where the sample is introduced to the top of a primary area 110 through a sample port 115 and flows in a substantially symmetrical manner to fill four secondary analysis regions 150.
- Each of the secondary analysis regions 150 includes a vent 120 to allow the sample to exhaust air from the secondary analysis regions 150 during filling.
- the vent 120 may be any shape that is compatible with the shape of the secondary analysis regions 150, such as circular or polygonal.
- the maximum diameter or width of the vent 120 may be any size that provides the desired sample flow into the secondary analysis regions 150, with values from about 0.02 mm to about 1.5 mm being preferred.
- a single counter electrode 130 occupies the primary area, while a working electrode 141-144 is present in each secondary analysis region 150. While depicted with the counter electrode 130 in the primary area 110 and the working electrodes 141-144 in the secondary analysis regions 150, the positioning of the working and counter electrodes could be reversed so multiple counter electrodes surround a single working electrode (not shown). In another aspect, the electrodes may not occupy the same plane. For example, some electrodes may be arranged horizontally while others are arranged vertically. In another example, some electrodes may be placed higher than others so the biological fluid reaches the lower electrodes first. Other electrode configurations may be used. For example, FIG. 1B represents the test sensor of FIG. 1A with the addition of a reference electrode 170 to provide a non-variant potential.
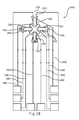
- FIG. 1C represents the test sensor 100 where instead of a single counter electrode 130, four independent counter electrodes 131-134 are provided in the central primary area 110. While depicted with the counter electrodes in the primary area and the working electrodes in the secondary analysis regions, the positioning of any working electrode and any counter electrode may be reversed (not shown). Other electrode configurations may be used.
- FIG. 1D represents the test sensor of FIG. 1C with the addition of a reference electrode 170 to each secondary analysis region to provide a non-variant potential.
- One or more of the reference electrodes 170 may operate at one or more potentials to provide a non-variant potential to each analysis.
- the operating potential of the counter electrodes may vary, one or more reference electrode may be used to reference the potential at the counter electrodes in addition to referencing the potential of the working electrodes as common in conventional systems.
- the use of multiple reference electrodes may provide for increased accuracy and/or precision of the determined analyte concentrations.
- the increase may arise from a reduction in the problems associated with the changing potential of working electrodes implanted in a living organism or otherwise in continuous contact with a biological fluid.
- conductors 160 lead from each electrode toward the rear of the test sensor 100 where each of the conductors 160 may be connected to a measurement device, allowing for each working electrode 141-144 to be independently addressed.
- the electrode is independently addressable.
- the conductors 160 may remain independently addressable or any two or more may be electrically connected (not shown).
- the electrodes are not independently addressable as they are electrically addressed together. For example, by electrically connecting two of the working electrodes 141-144, such as 141 and 144, the resulting test sensor 100 would have three independently addressable working electrodes and one counter electrode 130.
- the test sensor 100 of FIG. 1A and FIG. 1B may potentially perform a different analysis at each of the working electrodes 141-144.
- the single counter electrode 130 may provide a single potential to the system through the use of a charge transfer system that operates at a single potential. Depending on the measurement device, the single counter electrode 130 may provide more than one potential to the system.
- each counter electrode is formed with a different charge transfer system, thus altering the potential provided to the working electrode during analysis.
- the working electrode includes reagents that interact with one or more analytes at four different potentials, each analyte interaction may be independently measured by electrically addressing the appropriate counter electrode.
- each independently addressable counter electrode operates at a single potential or potential range.
- the conductors 160 lead from each electrode toward the rear of the test sensor 100 where each of the conductors 160 may be connected to a measurement device.
- This arrangement allows for each working electrode 141-144 and each counter electrode 131-134 to be independently addressed.
- the conductors 160 may remain electrically isolated or any two or more may be electrically connected (not shown).
- the resulting test sensor would have four independently addressable working electrodes and three independently addressable counter electrodes. Any combination of electrodes may be electrically connected.
- Independently addressable working electrodes potentially allow for a different chemical reaction to be measured at each working electrode 141-144.
- Having independently addressable counter electrodes 131-134 of differing operating potentials allows for a working electrode to be operated against more than one counter electrode potential.
- two charge transfer chemistries present at the same working electrode may be measured independently by two independently addressable counter electrodes where the first counter electrode operates at the potential of the first charge transfer chemistry and the second counter electrode operates at the potential of the second charge transfer chemistry.
- the test sensor 100 of FIG. 1C provides independent addressability to four working electrodes 141-144 and four counter electrodes 131-134. Because each of the counter electrodes 131-134 may provide a different potential, sixteen different analyses potentially may be performed. Thus, the electrochemistry of a single working electrode may be measured at four different potentials and the potential of a single counter electrode may be applied against four different working electrode chemistries.
- the test sensor of FIG. 1D having four independently addressable reference electrodes 170, may provide up to four different non-variant potentials to the system. The measurement device may use one or more of the non-variant potentials to control or determine the operating potential at the working electrodes 141-144 and at the counter electrodes 131-134.
- the secondary analysis regions 150 may have areas of about 0.5 mm 2 and heights of about 0.125 mm to provide interior volumes of about 62 nL each. Preferable secondary analysis regions have interior volumes of 100 nL and less, with interior volumes of 70 nL and less being more preferred. Larger and smaller secondary analysis regions may be used.
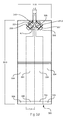
- FIG. 2A represents a test sensor 200 arrangement where sample introduction occurs from a sample port 215 in a front edge 214 of the test sensor 200 into a primary area 210 and then flows in an asymmetric manner to fill a first secondary analysis region 251 and a second secondary analysis region 252.
- Sample flow is asymmetric because the second secondary analysis region 252 is longer than the first secondary analysis region 251.
- the secondary analysis regions 251, 252 may include a vent 220 to allow the sample to exhaust air from the region during filling.
- the sample crosses a first electrode pair defined by working electrode 241 and counter electrode 231. While continuing to cross the first electrode pair, the sample flows toward the second and third electrode pairs, defined by working electrode 242 and counter electrode 232 (second pair) and by working electrode 243 and counter electrode 233 (third pair). The sample flowing across the first and third electrode pairs then continues to flow until crossing the fourth electrode pair, defined by working electrode 244 and counter electrode 234. Thus, the fourth electrode pair is crossed by the sample after the first and third electrode pairs.
- a reagent composition 280 provides electrical conductivity between the pairs of the working and counter electrodes. Independent addressability of the electrode pairs allows for the filling of the secondary analysis regions 251, 252 to be monitored. Other electrode configurations may be used, for example the positioning of any working electrode and any counter electrode may be reversed (not shown).
- the test sensor 200 By monitoring the filling of the secondary analysis regions 251, 252, the test sensor 200 provides an underfill detection system to prevent or screen out analyses associated with sample sizes that are of insufficient volume. Because concentration values obtained from an underfilled test sensor may be inaccurate, the ability to prevent or screen out these inaccurate analyses may increase the accuracy of the concentration values obtained.
- Conventional underfill detection systems have one or more indicator, such as an electrode or conductor, which detect the partial and/or complete filling of the sample reservoir within the test sensor. Having the ability to monitor filling between multiple secondary analysis regions, more accurate determinations of the fill state of the test sensor 200 are possible.
- the electrical signal may be used to indicate whether a sample is present and whether the sample partially or completely fills a specific analysis region.
- FIG. 2B represents the test sensor 200 having the electrode arrangement of FIG. 2A , but with a different arrangement of the secondary analysis regions.
- a primary area 210 including the first electrode pair is provided with the three symmetrically filled secondary analysis regions 253, 254, 255.
- the sample crosses the first electrode pair and then moves independently to cross the second, third, and fourth electrode pairs.
- fluid flow remains asymmetric due to the first electrode pair occupying the primary area, thus filling before the secondary analysis regions.
- Each of the secondary analysis regions 253, 254, 255 may include a vent 220 to allow the sample to exhaust air during filling of the test sensor 200.
- a single reagent composition 280 may extend between each of the four working and counter electrode pairs as shown.
- the electrodes may remain electrically isolated or any two or more may be electrically connected (not shown).
- One or more reference electrodes may be added to provide a non-variant potential (not shown).
- any working and counter electrode may be reversed.
- the four independent working electrodes provide for four different reagent compositions to potentially perform four different analyses. While the four independent counter electrodes each may be operated at a different potential to provide 16 possible analyses, the 90° separation between each electrode pair may make this impractical.
- FIG. 3A represents a straight-channel test sensor design where the sample flows from primary area 310 across a first potential electrode location 320 to reach a second potential electrode location 330.
- FIG. 3B through FIG. 3G represent alternate test sensor designs for secondary analysis regions where the sample does not flow across more than one potential electrode location.
- FIG. 3B represents a T-channel design used in some conventional sensors.
- FIG. 3C represents a multi-T-channel design where additional potential electrode locations 340 and 350 are present. Additional "T" portions may be added if additional potential electrode locations are desired.
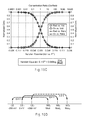
- FIG. 3H depicts a multi-T-channel test sensor 300 having both an independently addressable working electrode 331 and an independently addressable counter electrode 332 in each of four secondary analysis regions 333.
- each working and counter electrode pair shares the same chemical environment, but each pair of electrodes is substantially chemically isolated from every other pair.
- a combined reagent composition charge transfer system 336 is deposited on each electrode pair.
- Each of the working electrodes 331 and each of the counter electrodes 332 is formed from a conductor 334 that terminates in a contact 335.
- Contact 335a and contact 335b correspond to the working and counter electrodes, respectively, of the secondary analysis region 333a.
- the width of each of the secondary analysis regions 333 is 1.2 mm, while the width of primary area 310 is 1.5 mm.
- the straight-line distance between the electrode pairs in opposing secondary analysis regions is 3.46 mm.
- the width of the working electrode of each pair is specified to be 0.50 mm separated from the counter electrode by from about 0.05 mm to about 0.25 mm.
- the circles drawn on each of the working electrodes 331 is the projected coverage area of the reagent composition.
- Other secondary analysis region widths, electrode widths and separations, and reagent composition coverage areas may be used.
- FIG. 3I depicts a multi-T-channel test sensor 300 having an independently addressable working electrode 331 in each of four substantially chemically isolated secondary analysis regions and an independently addressable counter electrode 332 in each of four opposing secondary analysis regions 333.
- each electrode is substantially chemically isolated from every other electrode.
- Each electrode is formed from a conductor 334 that terminates in a contact 335.
- FIG. 3D represents a departure from T-channel designs because the secondary analysis regions are staggered so a straight line 370 passing through the secondary analysis regions and a primary area cannot be drawn between any two potential electrode locations.
- the potential advantage of such a staggered design is the resistance to mixing between the opposing secondary analysis regions if the test sensor is mechanically disturbed while filled with the sample. Mechanically disturbed means applying a sufficient force to the test sensor to cause the fluid sample to move
- the Y-channel designs of FIG. 3E through FIG. 3G resist mixing between potential electrode locations that are closer together than for the designs of FIG. 3B and 3C because the separation of the secondary analysis regions does not solely rely on the distance between potential electrode locations for substantial chemical isolation.
- Chemical separation in a Y-channel also may benefit from the sample having to flow around the "v" portion of the "Y" to mix. As the electrodes may be spaced closer together, but still resist sample mixing, the total volume of the sample reservoir of a Y-channel design may be less in relation to a T-channel design having a similar chemical separation.
- Preferable sample reservoir designs have secondary analysis regions branching from the primary area 310 at an angle 390 of less than 90°, as represented in FIG. 3F .
- fluid may enter the test sensor and reach the potential electrode locations without making a 90° turn. This may allow for the sample to rapidly enter the test sensor while reducing the potential for reagent mixing from sample convection due to vibration.
- More preferable designs lack the straight line 370 as depicted in FIG. 3B and FIG. 3C between electrodes passing through the secondary analysis regions and a primary area and have secondary analysis regions branching from the primary area at an angle of less than 90°.
- FIG. 3J depicts a Y-channel test sensor 300 having both an independently addressable working electrode 331 and an independently addressable counter electrode 332 in each of two secondary analysis regions 333.
- each working and counter electrode pair of electrodes share the same chemical environment, but each pair is substantially chemically isolated from the opposing pair.
- the counter electrode 332 is defined by the perimeter edge of the secondary analysis region 333, which is in turn formed from the conductor 334.
- the secondary analysis regions 333 branch from the primary area 310 at an angle of about 45°.
- Each of the conductors 334 terminate in a contact area 335.
- Other electrode designs could be used, such as those in which a single electrode is formed in one or more secondary analysis regions. Other branching angles for the secondary analysis regions also may be used.
- the substrate of the test sensor 300 has a width of 11.8 mm and a length of 30 mm.
- the width of the primary area 310 is 1.2 mm.
- the distance between the projected outer edges of the two reagent composition depositions is 0.8 mm.
- the contact areas 335 each have a width of 2.9 mm and the diameter of the reagent composition deposition in each of the two secondary analysis regions 333 is 1.8 mm.
- Other substrate dimensions, primary area and contact area widths, and reagent composition deposition diameters may be used.
- the degree of chemical isolation provided by the secondary analysis regions of the sample reservoir affects the number of analyses that may be performed with a test sensor.
- Substantially chemically isolated means that diffusive or convective mixing of the reagents does not substantially occur between the secondary analysis regions during the time of the one or more analyses.
- a working and counter electrode pair is substantially chemically isolated from other working and counter electrode pairs, but not from each other, the pair may perform analyses compatible with the chemistry present at the pair. Such a configuration may allow for rapid diffusive mixing of the reagents present at the working and counter electrodes of the pair.
- each electrode potentially may participate in an analysis with any other electrode, if independently addressable.
- different reagent compositions may be used to provide an electrode with a chemical analysis environment that is different from other electrodes. In combination, substantial chemical isolation between analysis regions allows different reagents to be used at each working and/or counter electrode, while the independent electrical addressability allows each working electrode to be independently measured.
- the secondary analysis regions may be substantially chemically isolated depending on the cross-sectional area of the entrances to the secondary regions, the distances between any two electrodes within the secondary analysis regions, the physical arrangement of the secondary analysis regions in relation to each other and in relation to the primary area, and the like.
- substantial chemical isolation initially may be lost due to reagent mixing as the sample flows across the counter electrode/s ( FIG. 1A through FIG. 1D ) or the electrode pairs at the entrance and at the sides of the test sensor ( FIG. 2A and FIG. 2B ).
- reagent composition may be transported by the sample to multiple electrode pairs.
- flow mixing may be substantially eliminated when the sample does not flow across more than one electrode ( FIG. 3B-FIG. 3J ).
- FIG. 4A shows the cyclic voltammetry plot of a straight-channel design as represented in FIG. 3A .
- the first electrode pair nearest the sample port used a reagent composition including 0.5 M potassium ferrocyanide
- the second electrode pair nearest the terminus of the channel used a reagent composition including the electro-active organic molecule represented by Structure I, below.
- Structure I the electro-active organic molecule represented by Structure I
- ferrocyanide from the first electrode pair was oxidized at the second electrode to form ferricyanide at the second electrode pair.
- the formed ferricyanide then chemically oxidized the reduced species of the Structure I molecule at the second electrode pair.
- FIG. 4B shows the cyclic voltammograms of a Y-channel design as represented in FIG. 3E .
- An electrode was placed near the terminus of each secondary analysis region. Only oxidation of the Structure I molecule is observed after 20 complete cycles (more than 20 minutes), establishing that substantial chemical isolation was achieved for at least 10 minutes with the Y-channel secondary analysis region design.
- These experiments were performed using a CH Instruments Electrochemical Workstation, model CHI 660A running version 2.05 software, at about 22° C and a relative humidity of about 45%.
- the sample was pH 7.0 phosphate buffer containing 0.1 M sodium phosphate and about 16% (w/w) PVP polymer having a weight average molecular weight of about 2000.
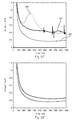
- FIG. 5A a current verses time plot established that for a straight-channel sensor of the type used in FIG. 4A , a second peak was observed with a 400 mV operating potential at the working electrode within about 5 seconds of introducing the sample. Sample introduction generated the first peak in the plot. The second peak correlates with the second voltammetric wave of ferrocyanide in FIG. 4A .
- FIG. 5B it was shown that substantially no ferrocyanide reached the working electrode after 30 seconds, establishing that substantial chemical isolation was achieved with the Y-channel secondary analysis region test sensor. In these experiments, the initial sharp peak represented the sample first establishing electrical communication between the electrodes.
- the amperometry testing was performed using the CH Instruments Electrochemical Workstation at about 22° C and a relative humidity of about 45%.
- the sample was pH 7.0 phosphate buffer containing 0.1 M sodium phosphate and about 16% (w/w) PVP polymer having a weight average molecular weight of about 2000.
- FIG. 5C is an amperometric current plot establishing that the Y-channel design provides superior chemical isolation between potential electrode locations than a T-channel design.
- Y-channel line 501 substantial chemical isolation was observed out to 1000 seconds between the potential electrode locations, as represented by positions 320 and 330 of FIG. 3E .
- T-channel peaks 502, 503 chemical isolation failure and oxidation of the Structure I molecule was observed after about 84 or after about 650 seconds for two T-channel test sensors, such as represented in FIG. 3B .
- the large variability between the 84 and 650 second time variables may be attributed to the susceptibility of the T-channel design to mixing by convection from mechanical disturbance during the analysis.
- FIG. 5D establishes that three Y-channel designs were resistant to such mixing from mechanical disturbance. The slow current rise observed after about 800 seconds may indicate slow mixing by diffusion.
- FIG. 6A represents a test sensor 600 having a staggered arrangement of the secondary analysis regions 651, 652 where the sample enters a sample port 615 into a primary area 610 in the form of a channel from which two secondary analysis regions 650 branch.
- a conductor 690 may extend into the primary area 610 to provide underfill detection capability to the test sensor 600.
- FIG. 6B represents a test sensor arrangement where the sample enters the sample port 615 into a primary area 610 in the form of a channel from which three secondary regions 651-653 branch.
- Each of the secondary regions 651-653 includes an independently addressable electrode or conductor.
- the sample fills the first secondary region 651 on the right, then the second secondary region 652 on the left.
- the sample fills the third secondary region 653 on the left, then the first secondary region 651 on the right, and then the second secondary region 652 on the left.
- the total sample volume held by the test sensor 600 having at least two or three secondary analysis regions may be 210 nL or less.
- Each of the secondary analysis regions and the end of the primary area 610 opposite the sample port 615 may include a vent 620 to allow the sample to exhaust air during filling.
- the test sensor 600 may fill faster than a substantially undivided sample reservoir, such as the straight-channel design represented in FIG. 3A , of the same or similar volume due to the effect of capillary action driven by surface tension.
- subdividing the sample reservoir into smaller secondary analysis regions where each may contain an electrode, an electrode pair, one or more conductors, or a combination thereof, may increase the fill rate for the test sensor 600.
- Substantial chemical isolation between the secondary regions during filling and during the analysis may be provided by filling the secondary regions from the primary area in this manner.
- the secondary regions 651-653 are filled in a substantially sequential manner from the primary area 610. Due to the sequential filling of the secondary regions 651-653, the measurement device can monitor the rate and flow of the sample as the secondary analysis regions 651-653 are filled.
- the flow of the sample also may be monitored by equipping the test sensor 600 with an electrode or conductor near the sample port 615 and/or near the vent 620 of the primary area 610. Thus, one or more conductor and/or electrode may be monitored by the measurement device to determine the fill condition of the test sensor 600.
- the filling of non-sequential filling designs may also be monitored in this manner; however, the system may or may not be able to independently monitor the filling of each secondary analysis region.
- the primary area 610 may be provided with multiple sample ports 615 to allow the sample to be introduced from more than one location, such as at a perimeter and a top location.
- the test sensor 600 may be provided with two or more separate sample reservoirs, each having a primary area and two or more secondary regions, to allow for multiple samples to be analyzed. By altering the vent structure of the reservoir, different samples may be introduced through multiple sample ports into the same reservoir, but remain substantially chemically isolated during the analysis. Other relationships between the primary area or areas and secondary regions may be used.
- the primary area 610 and/or one or more secondary regions 651-653 may include flow-altering materials that modify the flow of the sample as it distributes through the sample reservoir. For example, hydrophilic and/or hydrophobic treatments, coatings, or materials may be used to preferably direct the flow path and/or fill rate of aqueous samples.
- the primary area 610 and/or the secondary regions 651-653 may include structural features, such as walls, grooves, or channels, which preferably direct the flow path and/or fill rate of the sample.
- materials that chemically or physically alter the composition of the sample may be placed in the primary area 610 and/or the secondary regions 651-653. For example, a material that filters red blood cells from the sample may be placed in a portion of the primary area to remove the cells before the sample reaches a secondary region.
- FIG. 7A and FIG. 7B represent test sensors 700 having staggered secondary analysis region designs as previously discussed.
- the design of FIG. 7A includes eight secondary analysis regions with approximately 90° angles to the primary area 710, while FIG. 7B is a similar Y-channel design.
- the test sensor 700 includes a total of nine secondary analysis regions, including the region at the end of primary area 710, each occupied by an electrode or conductor.
- the figure depicts four independently addressable counter electrodes 731-734 and four working electrodes 741-744, each present in one of the eight secondary regions. While the counter electrodes 731-734 reside on one side of the primary area 710 and the working electrodes 741-744 reside on the other side, the arrangement may be mixed.
- the first two secondary analysis regions filled by the sample may be working electrodes while the second two secondary analysis regions filled by the sample may be counter electrodes.
- An optional electrode such as a reference electrode 770, is present at the end of the primary area 710 opposite sample port 715.
- the reference electrode 770 also could be placed in the rearmost secondary region in relation to where the sample is introduced or near the sample port 715, for example.
- one or more reference electrodes may be positioned in the primary area 710 and/or secondary regions to provide a non-variant potential to the system. Residing in a substantially chemically isolated environment from the secondary regions, optional electrodes may provide fill information or information about the sample.
- a conductor 790 electrically connected to the counter electrode 731 is extended into the primary area 710 near the sample port 715.
- the conductor 790 may provide fill information to the measurement device.
- Other configurations of electrodes and/or conductors are possible.
- Each secondary region and the end of the primary area 710 may include a vent (not shown).
- the eight electrodes 731-734 and 741-744 may be addressed independently by the measurement device. As the secondary regions are substantially chemically isolated, each may include a reagent composition providing a different chemistry to interact with the constituents of the sample. Because the reagent composition may be different for each of the working electrodes 741-744, the charge transfer system may be different for each of the counter electrodes 731-734, and each electrode may be independently addressed, four different analyses may be possible when a single reagent composition is present at each of the working electrodes 741-744. In this manner, each working electrode reagent composition may be used with a dedicated counter electrode.
- each of the working electrodes 741-744 were provided with two reagent compositions having different redox potentials, a total of eight different analyses may be possible.
- providing each working electrode with four reagent compositions having different redox potentials may provide up to sixteen different analyses, as each working electrode may be independently addressed with each of the four counter electrodes. Practical considerations, such as unwanted interaction between more than one reagent composition at a working electrode, may limit the actual number of analysis that may be performed by the system. Other sample reservoir constructions and electrode configurations may be used.
- FIG. 8A represents a variation of the FIG. 7A test sensor where multiple working electrodes 841-844 are electrically connected.
- the counter electrodes remain independently addressable. In this manner, each counter electrode may provide a different potential to the electrically connected working electrodes.
- the working electrode having a redox potential closest to that of the potential of the selected counter electrode may operate.
- each working electrode may have a different mediator system, each mediator system having a different redox potential.
- the different mediator systems of the working electrodes may be progressively addressed.
- Other sample reservoir constructions and electrode configurations may be used.
- FIG. 8B depicts a variation of FIG. 7A where multiple counter electrodes 831-834 are electrically connected.
- the working electrodes remain independently addressable.
- the counter electrode having a charge transfer system with the highest potential may provide the potential to the system. In this manner, the electrochemistry responsive to the analyte at each working electrode may be measured.
- Other sample reservoir constructions and electrode configurations may be used.
- the working and counter electrodes present in the secondary analysis regions may be separated by 1,000 micrometers or more. Electrode separation distances less than 1,000 micrometers also may be used.
- the pattern of the electrodes is not limited to those shown in the figures, instead being any pattern compatible with the primary area and secondary analysis regions of the test sensor.
- the electrodes are formed by a rectangular deposition of the reagent composition and/or a charge transfer system. The deposition may be made by screen printing, ink-jetting, micro-pipetting, pin-deposition, or other methods.
- Reagent layers are formed when the reagent composition is applied to the conductor.
- the reagent layer forming a working electrode may include an enzyme, a mediator, and a binder
- the reagent layer forming the counter electrode may include a mediator and a binder.
- Analytes undergo electrochemical reaction at the working electrode while the opposite electrochemical reaction occurs at the counter electrode to allow current flow between the electrodes. For example, if an analyte undergoes oxidation at the working electrode, reduction occurs at the counter electrode.
- test sensors may include reference electrodes that provide a non-variant reference potential to the system. While multiple reference electrode materials are known, a mixture of silver (Ag) and silver chloride (AgCl) is typical due to the insolubility of the metal and its corresponding salt in the aqueous environment of the sample. Since the ratio of Ag metal to Cl - does not significantly change in the sample, the potential of the electrode does not significantly change. If increased in size and/or modified with a conductive metal, a reference electrode also may be used as a counter electrode because it will pass current. However, a counter electrode may not serve as a reference electrode because it lacks the ability to isolate the half cell that provides the reference potential from the sample solution.
- the conductors that form the electrodes may reside on one or more substrates, depending on the arrangement of the electrodes.
- the substrate may be made from any material that is compatible with the formation and operation of the biosensor.
- Preferable materials for the substrate include polyethylene terephthalate (PET), polycarbonate (PC), polyimide (PI), polyethylene (PE), polypropylene (PP), polystyrene (PS), polyvinyl chloride (PVC), polyoxymethylene (POM), monomer-cast nylon (MC), polybutylene terephthalate (PBT), a polymethacrylic resin (PMMA), an ABS resin (ABS), and glass.
- More preferable materials from which to form one or more substrate include polyethylene terephthalate (PET), polycarbonate (PC), and polyimide (PI), with polyethylene terephthalate (PET) being preferred at present.
- PET polyethylene terephthalate
- PC polycarbonate
- PI polyimide
- PET polyethylene terephthalate
- two substrates in the form of a base and a lid may be combined to form a sample reservoir having at least one sample port and at least one vent. Conductors, spacers, and other components may reside between the substrates.
- the material or materials used to form the conductors on the one or more substrates may include any electrical conductor.
- Preferable electrical conductors are non-ionizing, such that the material does not undergo a net oxidation or a net reduction during analysis of the sample.
- the conductors may be made from materials such as solid metals, metal pastes, conductive carbon, conductive carbon pastes, conductive polymers, and the like.
- the conductors preferably include a thin layer of a metal paste or metal, such as gold, silver, platinum, palladium, copper, or tungsten.
- a surface conductor may be deposited on all or a portion of the conductor.
- the surface conductor material preferably includes carbon, gold, platinum, palladium, or combinations thereof. If a surface conductor is not present on a conductor, the conductor is preferably made from a non-ionizing material.
- the conductor and optional surface conductor material may be deposited on the substrate by any means compatible with the operation of the test sensor, including foil deposition, chemical vapor deposition, slurry deposition, metallization, and the like.
- the conductors may be formed by processing a conductive layer into a pattern using a laser and/or mask techniques.
- the reagent composition or compositions used to form the electrodes may be deposited in solid, semi-solid, liquid, gel, gellular, colloidal, or other form and may include reagents and optionally a binder.
- the reagent compositions may have viscosities ranging from about 1 cp to about 100 cp. More preferable reagent compositions have viscosities ranging from about 1 cp to about 20 cp or from about 4 cp to about 10 cp. Reagent compositions with other viscosities may be used. Viscosities were determined with a Brookfield Model DV3 Viscometer equipped with an ULA assembly for measuring reagent compositions having viscosities lower than 300 cp.
- Viscosity measurements were performed at room temperature with the instrument temperature set to 25° C. The measurements were performed at shear rates of 50, 100, 200 and 300 cps (cycle per second) to provide an indication of whether the composition is sheared thin or thick. A 100 mM phosphate buffer solution was used as a control, which typically gave viscosity readings in the range of about 1 to about 1.3 cp under different shear rates.
- the binder is preferably a polymeric material that is at least partially water-soluble.
- the binder may form a gel or gel-like material when hydrated.
- Suitable partially water-soluble polymeric materials for use as the binder may include poly(ethylene oxide) (PEO), carboxy methyl cellulose (CMC), polyvinyl alcohol (PVA), hydroxyethylene cellulose (HEC), hydroxypropyl cellulose (HPC), methyl cellulose, ethyl cellulose, ethyl hydroxyethyl cellulose, carboxymethyl ethyl cellulose, polyvinyl pyrrolidone (PVP), polyamino acids, such as polylysine, polystyrene sulfonate, gelatin and derivatives thereof, polyacrylic acid and derivatives and salts thereof, polymethacrylic acid and derivatives and salts thereof, starch and derivatives thereof, maleic anhydrides and salts thereof, agarose based gels and derivatives thereof.
- the binder may include one
- Binders having molecular weights from 10,000 to 900,000, and preferably from 30,000 to 300,000 (weight/average) are preferred. Binders having other molecular weights may be used. Molecular weights may be determined by size exclusion chromatography (SEC), and are generally expressed as weight averages or number averages.
- the reagent composition used to form the working electrode preferably includes a biomolecule responsive to the analyte of interest.
- Biomolecules may include active enzyme systems, such as oxidoreductases. Biomolecules also may include biopolymers, such as nucleic acids, proteins, and peptides. Other biomolecules may be used.
- Oxidoreductases catalyze the transfer of electrons and facilitate the oxidation or reduction of the analyte and include “oxidases,” which facilitate oxidation reactions where molecular oxygen is the electron acceptor; “reductases,” which facilitate reduction reactions where the analyte is reduced and molecular oxygen is not the analyte; and “dehydrogenases,” which facilitate oxidation reactions in which molecular oxygen is not the electron acceptor. See, for example, Oxford Dictionary of Biochemistry and Molecular Biology, Revised Edition, A.D. Smith, Ed., New York: Oxford University Press (1997) pp. 161, 476, 477, and 560 .
- Table I provides oxidoreductases useful in the analysis of the listed analytes.
- Table I Oxidoreductase Analyte Glucose dehydrogenase ⁇ -glucose Glucose oxidase ⁇ -glucose Cholesterol esterase; cholesterol oxidase Cholesterol Lipoprotein lipase; glycerol kinase; glycerol-3-phosphate oxidase Triglycerides Lactate oxidase; lactate dehydrogenase; Lactate diaphorase Pyruvate oxidase Pyruvate Alcohol oxidase Alcohol Bilirubin oxidase Bilirubin Uricase Uric acid Glutathione reductase NAD(P)H Carbon monoxide oxidoreductase Carbon monoxide
- the biomolecules may include amine functional groups capable of hydrogen bonding interactions.
- Biomolecules having weight/average molecular weights from 10,000 to 500,000 and preferably from 100,000 to 400,000 that maintain biological activity after deposition are preferred.
- oxidoreductases from 0.01 to 100 Units (U), preferably from 0.05 to 10 U, and more preferably from 0.1 to 5 U may be used per test sensor or analysis. In another aspect, at most 1.3 U of the oxidoreductase is used.
- the reagent layer formed from depositing the reagent composition on the conductor may include an enzyme system specific to the analyte that may facilitate the reaction of the analyte while enhancing the specificity of the sensor system to the analyte, especially in complex biological samples.
- the enzyme system may include one or more enzyme, cofactor, and/or other moiety that participates in the redox reaction with the analyte.
- an alcohol oxidase can be used to provide a biosensor that is sensitive to the presence of alcohol in a sample.
- glucose dehydrogenase or glucose oxidase may be used to provide a biosensor that is sensitive to the presence of glucose in a sample. This system could be useful in measuring blood glucose concentrations, for example in patients known or suspected to have diabetes.
- GDH glucose dehydrogenase
- FAD flavin adenine dinucleotide
- PQQ Pyrroloquinolinequinone
- the co-factor in each of these enzyme systems may either be permanently held by the host enzyme or the co-enzyme and the apo-enzyme may be re-constituted before the enzyme system is added to the reagent composition.
- the co-enzyme also may be independently added to the host enzyme moiety in the reagent composition to assist in the catalytic function of the host enzyme, such as in the cases of nicotinamide adenine dinucleotide NAD/NADH + or nicotinamide adenine dinucleotide phosphate NADP/NADPH + .
- dehydrogenase enzyme systems include alcohol dehydrogenase, lactate dehydrogenase, ß-hydroxybutyrate dehydrogenase, glucose-6-phosphate dehydrogenase, glucose dehydrogenase, formaldehyde dehydrogenase, malate dehydrogenase, and 3-hydroxysteroid dehydrogenase.
- the reagent layer also may include a mediator to communicate the results of the analyte reaction to the conductor.
- Mediators may be oxidized or reduced and may transfer one or more electrons.
- a mediator is a reagent in an electrochemical analysis and is not the analyte of interest, but provides for the indirect measurement of the analyte. In a simple system, the mediator undergoes a redox reaction in response to the oxidation or reduction of the analyte. The oxidized or reduced mediator then undergoes the opposite reaction at the working electrode of the test sensor and may be regenerated to its original oxidation number. Thus, the mediator may facilitate the transfer of electrons from the analyte to the working electrode.
- Mediators may be separated into two groups based on their electrochemical activity.
- One electron transfer mediators are chemical moieties capable of taking on one additional electron during the conditions of the electrochemical reaction.
- Multi-electron transfer mediators are chemical moieties capable of taking on more-than-one electron during the conditions of the reaction. As depicted in FIG. 9A , one electron transfer mediators can transfer one electron from the enzyme to the working electrode, while as depicted in FIG. 9B , a multi-electron transfer mediator can transfer two electrons.
- Examples of one electron transfer mediators include compounds, such as 1,1'-dimethyl ferrocene, ferrocyanide and ferricyanide, and ruthenium(III) and ruthenium(II) hexaamine.
- Two electron mediators include the organic quinones and hydroquinones, such as phenanthroline quinone; phenothiazine and phenoxazine derivatives; 3-(phenylamino)-3H-phenoxazines; phenothiazines; and 7-hydroxy-9,9-dimethyl-9H-acridin-2-one and its derivatives.
- Examples of additional two electron mediators include the electro-active organic molecules described in U.S. Pat. Nos. 5,393,615 ; 5,498,542 ; and 5,520,786 , which are incorporated herein by reference, for example.
- Preferred two electron transfer mediators include 3-phenylimino-3H-phenothiazines (PIPT) and 3-phenylimino-3H-phenoxazines (PIPO). More preferred two electron mediators include the carboxylic acid or salt, such as ammonium salts, of phenothiazine derivatives.
- especially preferred two electron mediators include (E)-2-(3H-phenothiazine-3-ylideneamino)benzene-1,4-disulfonic acid (Structure I), (E)-5-(3H-phenothiazine-3-ylideneamino)isophthalic acid (Structure II), ammonium (E)-3-(3H-phenothiazine-3-ylideneamino)-5-carboxybenzoate (Structure III), and combinations thereof.
- the structural formulas of these mediators are presented below. While only the di-acid form of the Structure I mediator is shown, mono-and di-alkali metal salts of the acid are included.
- the sodium salt of the acid is preferred for the Structure I mediator.
- Alkali-metal salts of the Structure II mediator also may be used.
- preferred two electron mediators have a redox potential that is at least 100 mV lower, more preferably at least 150 mV lower, than ferricyanide.
- the charge transfer system is any one or a combination of electrochemically active species that may transfer one or more electrons from or to a counter electrode. For example, if the working electrode of a system transfers electrons to a counter electrode through the measurement device, the charge transfer system of the counter electrode accepts electrons from the counter electrode to allow the measurement of current flow through the system. By accepting electrons at a specific potential or potential range, the charge transfer system influences the potential at which the working electrode may transfer electrons for measurement.
- the charge transfer system may or may not include the mediator present at the working electrode; but if it does, at least a portion of the mediator at the counter electrode preferably has an oxidation state different than the mediator at the working electrode.
- the electrochemistry of multiple working electrodes may be sequentially analyzed from lowest to highest operating potential. If the working and counter electrodes may be independently addressed, a working electrode having a specific redox potential with an analyte can be selectively paired with a counter electrode having the desired potential. If the redox potentials of the analyte, analyte responsive biomolecule, and/or mediator at independently addressable working electrodes are different, separate output signals for individual analysis may be measured when using electrically connected counter electrodes.
- analyte responsive biomolecule such as an oxidoreductase, and/or mediators that transport charge at increasing potentials
- FIG. 10A represents a system having three independently addressable counter electrodes (CE 1 -CE 3 ), each operating at a different potential, and three electrically connected working electrodes, each having a mediator system that operates at a different potential.
- the operating potential of the system is increased at counter electrodes CE 1 through CE 3 , the redox characteristics of mediators (Med 1 -Med 3 ) at the electrically connected working electrodes may be independently measured. For instance, when CE 1 is coupled with the working electrode, Med 1 reacts at the electrode. When CE 2 is coupled with the working electrode, Med 1 and Med 2 react at the electrode. Finally, when CE 3 is coupled with the working electrode, all three mediator systems may react at the working electrode.
- Multiple operating potentials may be provided to the system by altering the charge transfer system deposited on different conductors to form counter electrodes.
- the potential provided by a specific counter electrode may be altered with charge transfer systems including different redox species (moieties that may be oxidized and/or reduced) and/or different ratios of the redox conjugate pairs (reduced and oxidized moieties of the same redox species) of a redox species, such as ferrocyanide/ferricyanide.
- Useful redox species include electro-active organic molecules, organotransition metal complexes, and transition metal coordination complexes. Unlike metal containing organotransition metal complexes and coordination complexes, electro-active organic molecules lack a metal capable of undergoing oxidation or reduction.
- Preferable redox species for use in charge transfer systems include ruthenium(III) hexaamine, ferricyanide, and electro-active organic molecules, such as PIPT and PIPO.
- FIG. 10B shows cyclic voltammograms of the ruthenium(III) hexaamine, ferricyanide, and the electro-active organic molecule represented above in Structure I/II/III. As seen in the graph, the relative potential positions of each redox species are separated by about 200 mV.
- ratios of redox conjugate pairs are the ratio of ferrocyanide to ferricyanide in the charge transfer system.
- a ratio of 9.5:0.5 may be used for the lowest potential counter electrode, while ratios of 8:2, 5:5, 2:8, and 0.5:9.5 may be used to provide counter electrodes having progressively increasing operating potentials.
- Pure ferricyanide may be used to provide a counter electrode having the highest operating potential for the six counter electrodes.
- six independently addressable counter electrodes may be formed using different ratios of redox conjugate pairs, each providing a different potential to the system.
- potential differences less than those obtainable with different redox species such as at least 50 mV, or at least 100 mV, may be obtained using different ratios of the conjugate pairs of a redox species.
- the relationship of counter electrode operating potential vs. redox conjugate pair ratio is characterized by the Nernst equation and is shown in FIG. 10C .
- the desired potential can be provided to the counter electrode by selecting the appropriate redox conjugate pair ratio for the deposited charge transfer system.
- the potential of the charge transfer system may be varied by about ⁇ 150 mV for different ratios of ferrocyanide/ferricyanide.
- different ratios of the conjugates of the redox species may be used.
- Substantial chemical isolation as may be provided by the physical separation between the secondary regions, allows the different charge transfer systems of each counter electrode to provide different operating potentials to the system during the analysis.
- FIG. 10D represents the circumstance where the charge transfer systems of multiple independently addressable counter electrodes (CE 1 - CE 3 ) provide different absolute operating potentials, such as -200 mV, 0 mV, and +200 mV, while maintaining substantially the same relative operating potential of 0.4 V between the counter and working electrodes.
- the center redox couple arbitrarily may be assigned a fixed potential of zero against a Standard Hydrogen Electrode, a Saturated Calomel Electrode, or the like.
- ruthenium hexaamine has a redox potential that is about 200 mV lower and ferricyanide has a redox potential that is about 200 mV higher than that of the Structure I/II/III molecule.
- the system may independently analyze the different mediator systems (Med 1 -Med 3 ) at the electrically connected working electrodes WE 1 through WE 3 .
- FIG. 10E shows cyclic voltammograms establishing the different operating potentials that may be provided to one or more working electrodes by multiple independently addressable counter electrodes.
- a test sensor having a multi-T design with eight secondary analysis regions was fabricated, such as previously depicted in FIG. 3I .
- Four of the secondary analysis regions were provided with independently addressable working electrodes and four of the secondary analysis regions were provided with independently addressable counter electrodes.
- Each working electrode was formed with a reagent composition including 0.5% weight/weight (w/w) HEC binder, 50 mM of the Structure I molecule, and 2 U/ ⁇ L of the PQQ-GDH enzyme system in a phosphate buffer of pH 7.
- the first counter electrode was formed with a charge transfer system including 0.5% (w/w) HEC binder and 100 mM ruthenium hexaamine in phosphate buffer of pH 7.
- the second counter electrode was formed with a charge transfer system including 0.5% (w/w) HEC binder and 100 mM of the Structure I molecule in phosphate buffer of pH 7.
- the third and fourth counter electrodes were formed with a charge transfer system including 0.5% (w/w) HEC binder and 100 mM ferricyanide in phosphate buffer of pH 7.
- the CH Instrument was scanned at a rate of 25 mV/sec for one of the working electrodes and each of the first, second, and third counter electrodes.
- the potential of the ruthenium hexaamine counter electrode, line 1010 peaks at a potential about 400 mV higher than ferricyanide, line 1030, with the Structure I molecule peaking approximately in the middle, line 1020.
- the results observed for the in the cyclic voltammograms of FIG. 10B were reproduced in a multi-T test sensor design having multiple secondary analysis regions.
- the ability of the test sensor to operate at multiple potentials using multiple counter electrodes with different charge transfer systems was demonstrated.
- FIG. 11A establishes that the charge transfer systems of FIG. 10E may be replaced with multiple redox conjugate pair ratios to provide multiple potentials to the system.
- a test sensor was prepared as in FIG. 10E , but the first counter electrode was formed with a charge transfer system including 0.5% (w/w) HEC binder and a 1:9 ratio of ferricyanide:ferrocyanide 200 mM in phosphate buffer of pH 7, the second counter electrode was formed with a charge transfer system including 0.5% (w/w) HEC binder and a 1:1 ratio of ferricyanide:ferrocyanide 200 mM in phosphate buffer of pH 7, the third counter electrode was formed with a charge transfer system including 0.5% (w/w) HEC binder and a 9:1 ratio of ferricyanide:ferrocyanide 200 mM in a phosphate buffer of pH 7, and the fourth counter electrode was formed with a charge transfer system including 0.5% (w/w) HEC binder and substantially pure ferricyanide 200 mM in
- FIG. 11A showed the first counter electrode to have a peak potential of about 0.149 V (W1-C1), the second counter electrode to have a peak potential of about 0.060 V (W2-C2), the third counter electrode to have a peak potential of about -0.007 V (W3-C3), and the fourth counter electrode to have a peak potential of about -0.047 V (W4-C4).
- FIG. 11B depicts the current profiles obtained when the potential at one substantially chemically isolated working electrode is repetitively controlled in sequence by three substantially chemically isolated and independently addressable counter electrodes, each having a different potential provided by different charge transfer systems.
- a test sensor was prepared as in FIG. 10E , but the multiple working electrodes were replaced with a single working electrode.
- a first peak 1110 in each of the six series of three peaks was obtained from the first counter electrode, a second peak 1120 in each of the six series of three peaks was obtained from the second counter electrode, and a third peak 1130 in each of the six series of three peaks was obtained from the third counter electrode.
- the first peaks 1110 demonstrated the current level obtained from using ruthenium hexamine as the charge transfer system at the first counter electrode.
- the second peaks 1120 demonstrated the current level obtained from using the Structure I molecule as the charge transfer system at the second counter electrode.
- the third peaks 1130 demonstrated the current level obtained from using ferricyanide as the charge transfer system at the third counter electrode.
- FIG. 12A depicts a schematic representation of a biosensor system 1200 that determines an analyte concentration in a sample of a biological fluid using an input signal.
- Biosensor system 1200 includes a measurement device 1202 and a test sensor 1204, which may be implemented in an analytical instrument, including a bench-top device, a portable or hand-held device, or the like.
- the biosensor system 1200 may be utilized to determine analyte concentrations, including those of glucose, uric acid, lactate, cholesterol, bilirubin, and the like.
- the biosensor system 1200 may have other configurations, including those with additional components.
- the test sensor 1204 may be adapted for use outside, inside, or partially inside a living organism. When used outside a living organism, a sample of the biological fluid is introduced into a sample reservoir in the test sensor 1204. The test sensor 1204 may be placed in the measurement device before, after, or during the introduction of the sample for analysis. When inside or partially inside a living organism, a test sensor may be continually immersed in the sample or the sample may be intermittently introduced to the sensor.
- the test sensor 1204 has a base 1206 that forms a reservoir 1208 with an opening 1212.
- the reservoir 1208 may be formed by a lid with a vent.
- the reservoir 1208 defines a partially-enclosed volume, but may be open to the sample (not shown). Thus, the sample may continuously flow through the test sensor or be interrupted for analysis.
- the reservoir 1208 may contain a composition that assists in retaining a liquid sample such as water-swellable polymers or porous polymer matrices.
- Reagents may be deposited in the reservoir 1208.
- the reagents may include one or more enzymes, enzyme systems, mediators, binders, and like species.
- the binder may include various types and molecular weights of polymers, such as HEC (hydroxy ethyl cellulose), (CMC (carboxyl methyl cellulose), and/or PEO (polyethylene oxide). In addition to binding the reagents together, the binder may assist in filtering red blood cells, preventing them from coating the electrode surfaces 1211.
- the test sensor 1204 also may have a sample interface 1214 disposed adjacent to the reservoir 1208.
- the sample interface 1214 may partially or completely surround the reservoir 1208.
- the test sensor 1204 may have other configurations.
- the test sensor 1204 may be adapted for transdermal use by forming the reservoir 1208 from a porous material or behind a porous material in which the sample is held.
- the sample interface 1214 has conductors 1290 connected to at least one working electrode and at least two counter electrodes.
- the electrodes may be substantially in the same plane or in more than one plane, such as when facing.
- the electrodes may be disposed on a surface of the base 1206 that forms the reservoir 1208.
- the electrodes may extend or project into the reservoir 1208.
- One or more of the conductors 1290 also may extend into the reservoir 1208 to provide functionality not provided by the electrodes.
- a dielectric layer may partially cover the conductors and/or the electrodes.
- the counter electrodes may be used to balance the potential at one or more working electrode during the analysis.
- the balancing potential may be provided by forming the counter electrode from an inert material, such as carbon, and including a soluble redox species, such as ferricyanide, within the reservoir 1208.
- the balancing potential may be a reference potential achieved by forming the counter electrode from a reference redox couple, such as Ag/AgCl, to provide a combined reference-counter electrode.
- the sample interface 1214 may have other electrodes and conductors.
- the measurement device 1202 includes electrical circuitry 1216 connected to a sensor interface 1218 and a display 1220.
- the electrical circuitry 1216 includes a processor 1222 connected to a signal generator 1224, an optional temperature sensor 1226, and a storage medium 1228.
- the signal generator 1224 provides an electrical input signal to the sensor interface 1218 in response to the processor 1222.
- the electrical input signal may be transmitted by the sensor interface 1218 to the sample interface 1214 to apply the electrical input signal to the sample of the biological fluid.
- the electrical input signal may be transmitted through all or a portion of the conductors 1290 at the sample interface 1214.
- the electrical input signal may be a potential or current and may be constant, variable, or a combination thereof, such as when an AC signal is applied with a DC signal offset.
- the electrical input signal may be applied as a single pulse or in multiple pulses, sequences, or cycles.
- the signal generator 1224 also may record an output signal from the sensor interface as a generator-recorder.
- the signal generator 1224 may include the potentiostat of FIG. 12B , which may switch between multiple independently addressable working and counter electrodes, or may include the multiple potentiostat system of FIG. 12C.
- FIG. 12D represents a potentiostat that may be implemented in the signal generator to switch between four counter electrodes and an electrically connected working electrode.
- FIG. 12E represents a potentiostat implemented to switch between four working electrodes and an electrically connected counter electrode.
- FIG. 12F represents a potentiostat implemented to switch between four reference electrodes and an electrically connected working electrode.
- the one or more potentiostats may provide different operating potentials to the sample interface 1214.
- the signal generator 1224 may be configured where a function generator triggers gated wave inputs to the potentiostat.
- the signal generator 1224 may have other configurations.
- the optional temperature sensor 1226 determines the temperature of the sample in the reservoir of the test sensor 1204.
- the temperature of the sample may be measured, calculated from the output signal, or presumed to be the same or similar to a measurement of the ambient temperature or the temperature of a device implementing the biosensor system.
- the temperature may be measured using a thermister, thermometer, or other temperature sensing device. Other techniques may be used to determine the sample temperature.
- the storage medium 1228 may be a magnetic, optical, or semiconductor memory, another storage device, or the like.
- the storage medium 1228 may be a fixed memory device, a removable memory device, such as a memory card, remotely accessed, or the like.
- the processor 1222 implements the analyte analysis and data treatment using computer readable software code and data stored in the storage medium 1228.
- the processor 1222 may start the analyte analysis in response to the presence of the test sensor 1204 at the sensor interface 1218, the application of a sample to the test sensor 1204, in response to user input, or the like.
- the processor 1222 directs the signal generator 1224 to provide the electrical input signal to the sensor interface 1218.
- the processor 1222 may receive the sample temperature from the optional temperature sensor 1226.
- the processor 1222 receives the output signal from the sensor interface 1218.
- the output signal is generated in response to the redox reaction of the measurable species in the sample.
- the electrical output signal from the test sensor may be a current (as generated by amperometry or voltammetry), a potential (as generated by potentiometry/galvanometry), or an accumulated charge (as generated by coulometry).
- the output signal is correlated with the concentration of one or more analytes in the sample using one or more correlation equations in the processor 1222.
- the results of the analyte analysis may be output to the display 1220 and may be stored in the storage medium 1228.
- the correlation equations between analyte concentrations and output signals may be represented graphically, mathematically, a combination thereof, or the like.
- the correlation equations may be represented by a program number (PNA) table, another look-up table, or the like that is stored in the storage medium 1228.
- PNA program number
- Instructions regarding implementation of the analyte analysis may be provided by the computer readable software code stored in the storage medium 1228.
- the code may be object code or any other code describing or controlling the functionality described herein.
- the data from the analyte analysis may be subjected to one or more data treatments, including the determination of decay rates, K constants, ratios, and the like in the processor 1222.
- the sensor interface 1218 has contacts 1295 that connect or electrically communicate with the conductors 1290 in the sample interface 1214 of the test sensor 1204.
- the sensor interface 1218 transmits the electrical input signal from the signal generator 1224 through a connector in the sensor interface 1218 to the contacts 1295 in the sample interface 1214.
- the sensor interface 1218 also transmits the output signal from the sample through the contacts 1295 to the processor 1222 and/or signal generator 1224.
- the display 1220 may be analog or digital.
- the display may be an LCD display adapted to displaying a numerical reading.
- a liquid sample for analysis is transferred into the reservoir 1208 by introducing the liquid to the sample port 1212.
- the liquid sample flows through the sample port 1212, filling the reservoir 1208 while expelling the previously contained air.
- the liquid sample chemically reacts with the reagents deposited in the secondary analysis regions of the reservoir 1208.
- the test sensor 1202 is disposed adjacent to the measurement device 1202. Adjacent includes positions where the sample interface 1214 is in electrical communication with the sensor interface 1208. Electrical communication includes the transfer of input and/or output signals between contacts in the sensor interface 1218 and the conductors 1290 in the sample interface 1214.
- FIG. 13 represents an electrochemical analysis 1300 for determining the presence and/or concentration of at least one analyte in a sample.
- sample introduction 1310 the sample is introduced to the test sensor.
- redox reaction 1320 a portion of the analyte in the sample undergoes a redox reaction.
- electron transfer 1330 electrons are optionally transferred from the analyte to a mediator.
- first input signal application 1340 an input signal is applied between a working and a first counter electrode.
- second input signal application 1350 an input signal of a different potential is applied between a working and a second counter electrode.
- sample determination 1350 the presence and/or concentration of one or more measurable species in the sample is determined from one or more output signals, and in sample concentration transmission 1360, the determined measurable species concentration may be displayed, stored, further processed, and the like.
- the sample is introduced to the sensor portion of the system, such as a test sensor.
- the test sensor includes at least one working and at least two counter electrodes.
- the electrodes may include one or more reagent composition layers.
- the working electrode may include a diffusion barrier layer that is integral to a reagent composition layer or that is distinct from the reagent composition layer.
- the diffusion barrier layer provides a porous space having an internal volume where a measurable species may reside. The pores of the diffusion barrier layer may be selected so that the measurable species may diffuse into the diffusion barrier layer, while physically larger sample constituents, such as red blood cells, are substantially excluded.
- the working electrode includes a distinct diffusion barrier layer, the reagent layer may or may not be disposed on the diffusion barrier layer.
- the conductors may serve as electrodes.
- the reagents may be present in the sample, such as if deposited adjacent the electrodes.
- a portion of the analyte present in the sample is chemically or biochemically oxidized or reduced, such as by an oxidoreductase or similar species.
- This redox reaction occurs as the sample hydrates the reagents.
- electrons optionally may be transferred between the analyte and a mediator in the electron transfer 1330.
- an ionized measurable species is formed, such as from the analyte or a mediator, having a sample concentration responsive to the analyte. It may be beneficial to provide an initial time delay, or "incubation period,” for the reagents to react with the analyte.
- the system applies an input signal to the sample using a first counter electrode.
- Input signals are electrical signals, such as current or potential, and may be a sequence of excitation pulses separated by relaxations.
- the system may apply one or more input signals to the sample, including those used to determine the presence and/or concentration of the analyte and those used to determine other factors, such as the hematocrit content of the sample or the fill state of the test sensor.
- an initial polling potential may be input before the first input signal application 1340 to determine the presence of the sample.
- a potential also may be applied between any pair of electrodes and/or conductors to remove material from the electrode and/or conductor surface, to alter the chemistry of an electrode, or to oxidize or reduce a portion of the charge transfer system. Such a potential may be applied before the analysis.
- the system applies a second input signal at a different potential to the sample using a second counter electrode.
- the ability to select the working potential of multiple working electrodes and/or the ability to select the operating potential of multiple counter electrodes provides the biosensor system with the ability to perform multiple types of analysis. During an analysis, the potential between any pair of multiple working, counter, and/or reference electrodes may be measured to provide useful information.
- the progress of reservoir filling by the sample may be monitored using the two or more input signal applications 1340, 1350.
- the measurement device analyzes output signals responsive to the two input signals to determine the presence and/or concentration of at least one measurable species in the sample at each potential. If the oxidoreductase or similar species used in the redox reaction 1320 reacts with a single analyte, specificity may be provided to a portion of the generated electrical signal. As more than one measurable species may be ionized by different portions of the input signal, the presence, and/or concentration of multiple analytes, mediators, interferents, and the like may be determined. Additional current, time, and/or other values also may be analyzed. For example, the currents determined for one analyte, mediator, or interferent may be modified with the currents determined for another analyte, mediator, or interferent to increase the measurement performance of the system.
- Gated input signals such as gated amperometric, gated voltammetric, and/or combinations thereof, may be used to address the potential of a specific mediator and solve the linear equation set.
- FIG. 14A represents the input signal from a sequential gated amperometric pulse sequence used in combination with a test sensor having independently addressable counter and working electrodes (WE 1 -WE 4 ). In this instance, one working electrode operates at a time, and the input signal is sequentially input to each electrode pair. In this manner, a multi-potential potentiostat is not required to determine the output signal from multiple pairs of electrodes.
- FIG. 14B represents the input signal from a simultaneous gated amperometric pulse sequence used in combination with a test sensor having independently addressable counter and working electrodes (WE 1 -WE 4 ). In this instance all four electrode pairs are simultaneously operated at the same potential for each excitation. While not shown in the figure, the input signal could be simultaneously applied to two or more of the electrodes while being sequentially applied to other electrodes.
- the output currents resulting from the analysis may be measured separately. This operation may be combined with a gated input signal where one counter electrode is off, while a second counter electrode is on.
- the resulting cascade of measurement currents from independent counter electrodes provides a way to analyze multiple analytes and other components of the sample. Linear combinations of equations may be solved to determine the concentration and/or other parameters of individual analytes.
- Applied input signals may have voltages from 0.05 to 1.0 V, preferably from 0.1 to 0.8 V, and more preferably from 0.2 to 0.5 V.
- the input signals may be provided over a duration of from 0.01 second to 3 minutes, depending on the analyte or analytes of interest. For example, a glucose analysis may be complete in less than 5 seconds while other analytes may benefit from longer duration input signals.
- the duration of each excitation may be from 0.01 to 7 seconds, preferably from 0.5 to 3 seconds, and more preferably from 0.1 to 2 seconds for glucose, for example. Other input signal and excitation durations may be used.
- the measurement device converts at least one measurable species concentration into a sample analyte concentration and may display, store for future reference, further process, and/or use one or more of the determined measurable species concentrations for additional calculations.
- the value determined for one analyte, mediator, or interferent may be modified with the value determined for another analyte, mediator, or interferent to increase the measurement performance of the system.
- a counter electrode having an oxidizable species present in the charge transfer system also may be used as a working electrode lacking the oxidoreductase, thus providing the ability to analyze for hematocrit and determine the background component of the output signal.
- the analyte concentration may be modified with this and other information to increase accuracy and/or precision.
- a counter electrode may be used as a working electrode during an open circuit to measure one or more hematocrit parameters.
- one or more output signals may be correlated with a calibration curve or look-up table to determine hematocrit bias or bias attributable to an interferent.
- the concentration of one analyte may be used to alter the reading of another analyte.
- the concentration of the first analyte may be subtracted from the concentration of the second analyte to increase the accuracy and/or precision of the concentration value determined for the second analyte.
- FIG. 15 shows the results of averaging the results of up to four separate analyses for the same analyte to determine the concentration of the analyte in the sample.
- 98% of the obtained concentration values fell within ⁇ 15% bias limit when compared to a reference YSI instrument.
- test sensors having two or more secondary analysis regions may be configured to perform the same analysis in more than one secondary region in addition to analyzing for different analytes.
- multiple substantially chemically isolated secondary analysis regions may provide the benefits of signal averaging from a single test sensor.
- the ability to perform the same analysis multiple times on a single test sensor may significantly increase the accuracy and/or precision of the determined analyte concentration.
- signal averaging made possible by performing the same analysis multiple times on the same test sensor may provide an enhancement in the signal-to-noise ratio for the test sensor by reducing random noise (as characterized by the standard deviation sd value) at the rate of 1/ ⁇ n in relation to conventional sensor systems.
- FIG. 16 depicts the current decays obtained when a gated amperometric input signal is simultaneously applied to eight individually addressable and substantially chemically isolated electrodes.
- the electrodes were configured in a multi-T-design with four working electrodes opposing four counter electrodes across the primary channel, such as previously depicted in FIG. 31.
- Each working electrode was formed with a reagent composition including 0.5% (w/w) HEC binder, 50 mL of the Structure I molecule, and 2 U/ ⁇ L of the PQQ-GDH enzyme system in a phosphate buffer of pH 7.
- Each counter electrode was formed with a charge transfer system including 0.5% (w/w) HEC binder and substantially pure ferricyanide 100 mM in phosphate buffer of pH 7.
- a sample including 100 mg/dL of glucose in phosphate buffer of pH 7 was introduced to the test sensor and a gated amperometric input signal was simultaneously applied across each of the four opposing electrode pairs.
- the gated input signal included two initial excitations having varying pulse widths followed by seven excitations having a pulse width of 0.375 seconds. The latter seven excitations were separated by one second relaxation periods.
- the four current values corresponding to each electrode pair W1-C1, W2-C2, W3-C3, and W4-C4 are averaged. From this average of four current values, an analyte concentration of the sample may be determined using one or more correlation equations or a similar method. In this manner, the previously discussed accuracy and/or precision benefits obtained from averaging multiple analyses may be obtained from a single test sensor.
Abstract
Description
- This application claims the benefit of
U.S. Provisional Application No. 60/974,823 - Biosensors provide an analysis of a biological fluid, such as whole blood, serum, plasma, urine, saliva, interstitial, or intracellular fluid. Typically, biosensors have a measurement device that analyzes a sample residing in a test sensor. The sample is typically in liquid form and in addition to being a biological fluid, may be the derivative of a biological fluid, such as an extract, a dilution, a filtrate, or a reconstituted precipitate. The analysis performed by the biosensor determines the presence and/or concentration of one or more analytes, such as alcohol, glucose, uric acid, lactate, cholesterol, bilirubin, free fatty acids, triglycerides, proteins, ketones, phenylalanine or enzymes, in the biological fluid. The analysis may be useful in the diagnosis and treatment of physiological abnormalities. For example, a diabetic individual may use a biosensor to determine the glucose level in whole blood for adjustments to diet and/or medication.
- Many biosensors analyze for a single analyte and use various techniques to improve the accuracy and/or precision of the analysis. Accuracy may be expressed in terms of bias of the sensor system's analyte reading in comparison to a reference analyte reading, with larger bias values representing less accuracy, while precision may be expressed in terms of the spread or variance among multiple measurements. Calibration information may be used to improve the accuracy and/or precision of the analysis and may be read from the test sensor to the measurement device prior to the analysis. The measurement device uses the calibration information to adjust the analysis of the biological fluid in response to one or more parameters, such as the type of biological fluid, the particular analyte(s), and the manufacturing variations of the test sensor. Biosensors may be implemented using bench-top, portable, and like measurement devices. Portable measurement devices may be hand-held and allow for the identification and/or quantification of an analyte in a sample. Examples of portable measurement systems include the Ascensia Breeze® and Elite® meters of Bayer HealthCare in Tarrytown, New York, while examples of bench-top measurement systems include the Electrochemical Workstation available from CH Instruments in Austin, Texas.
- The electrical signal input to the test sensor by the measurement device may be a potential or current and may be constant, variable, or a combination thereof, such as when an AC signal is applied with a DC signal offset. The input signal may be applied as a single pulse or in multiple pulses, sequences, or cycles. The analyte or a measurable species undergoes a redox reaction when the input signal is applied to the sample. The redox reaction generates the output signal that may be measured constantly or periodically during transient and/or steady-state output. Unlike a transient output signal that is changing, steady-state output is observed when the change of a signal with respect to its independent input variable (time, etc.) is substantially constant, such as within ±10 or ±5%.
- Various electrochemical processes may be used such as coulometry, amperometry, voltammetry, or the like. Unlike coulometry, amperometry and voltammetry generally measure the rate at which the analyte is oxidized or reduced to determine the analyte concentration in the sample. In amperometry, an electrical signal of constant potential (voltage) is applied to the electrical conductors of the test sensor while the measured output signal is a current. In voltammetry, a varying potential is applied to a sample of biological fluid. Gated amperometry and gated voltammetry methods including alternating excitation and relaxation cycles also may be used.
- The "hematocrit effect" is one factor that may reduce the accuracy and/or precision of an analysis performed in a whole blood sample. In addition to water, glucose, proteins, ketones, and other biological molecules, whole blood samples contain red blood cells. Hematocrit is the volume of a whole blood sample occupied by red blood cells in relation to the total volume of the whole blood sample and is often expressed as a percentage. The greater the hematocrit percentage deviates from the %-hematocrit system calibration for a whole blood sample, the greater the bias (error) in the analyte readings obtained from the biosensor. For example, a conventional biosensor system having one set of calibration constants (slope and intercept for the 40% hematocrit containing whole blood sample, for instance) will report three different glucose concentrations for whole blood samples having identical glucose concentrations, but hematocrit percentages of 20%, 40%, and 60%. Thus, even though the whole blood glucose concentrations are the same, the system will report that the 20% hematocrit whole blood sample contains more glucose than the 40% hematocrit whole blood sample, and that the 60% hematocrit whole blood sample contains less glucose than the 40% hematocrit whole blood sample. As conventional biosensors are generally configured to report glucose concentrations assuming a 40% hematocrit content for the whole blood sample, any glucose measurement performed on a blood sample containing less or more than 40% hematocrit will include some bias error attributable to the hematocrit effect.
- Hematocrit bias may be expressed by the following equation:

where Gm and Gref are the measured glucose and reference glucose readings, respectively, for any hematocrit level. The larger the absolute value of the %-Hct-bias, the larger the hematocrit effect. - In addition to the hematocrit effect, measurement inaccuracies also may arise when the measurable species concentration does not correlate with the analyte concentration. For example, when the biosensor determines the concentration of a reduced mediator generated in response to the oxidation of an analyte, any reduced mediator not generated by oxidation of the analyte will lead to an indication that more analyte is present in the sample than is correct due to mediator background.
- By knowing the output signal attributable to factors not responsive to the concentration of the analyte, the spurious portion of the output signal may be subtracted. Conventional systems have attempted to isolate the non-responsive portions of the output signal by placing multiples pairs of working and counter electrodes in a common sample reservoir. By altering the reagents used to form the electrodes, these systems attempted to separate the analyte responsive and non-responsive portions by subtracting the two output signals.
- For example, conventional sensor systems may have multiple detection areas in an undivided sample chamber, where each working electrode faces a reference electrode. In another aspect, these systems may have a single reference electrode. Systems of these types may provide an on-test sensor calibration system with two known standards or may provide separate electrode systems for analyte, interference, and hematocrit determination, for example. A disadvantage common to these systems is the single sample chamber, where the adjacent electrode systems/detection areas may be contaminated chemically from each other due to diffusion and/or liquid movement. This disadvantage may be especially problematic when one reagent system requires a longer assay time than another and/or when the test sensor is mechanically disturbed after filling with sample.
- As more and more information regarding the analytes present in biological samples is necessary for diagnosis, there is an increasing need for routine monitoring of multiple biological species of medical importance. Accordingly, there is an ongoing need for improved biosensors, especially those that may provide increasingly accurate and/or precise concentration measurements for multiple analytes. The systems, devices, and methods of the present invention avoid or ameliorate at least one of the disadvantages associated with conventional biosensors.
- An analyte test sensor is disclosed that includes at least two substrates forming a reservoir, the reservoir having at least two substantially chemically isolated secondary analysis region; at least one first working electrode including a first conductor and a reagent composition disposed in the reservoir; at least one first counter electrode including a second conductor and at least one first redox species disposed in a first secondary analysis region; and at least one second counterelectrode including a third conductor and at least one second redox species disposed in a second secondary analysis region, where the working electrode, the first counter electrode, and the second counter electrodes are independently addressable.
- An analyte test sensor is disclosed that includes at least two substrates forming a reservoir, the reservoir including at least three independently addressable secondary analysis regions, were each of the secondary analysis regions are substantially chemically isolated.
- In one aspect, a test sensor may be configured where a straight line passing from the working electrode through the first secondary analysis region and through the primary area cannot be drawn through the second secondary analysis region to the counter electrode. A test sensor also may be configured where a conductor is disposed between two substrates and at least one portion of a reservoir including a sample port is defined at least by the two substrates and an edge of the conductor. In this instance, the edge of the conductor defines at least a first electrode.
- In another aspect, a test sensor may be configured where a fluid sample entering the at least one sample port does not flow across more than one of the first, the second, and the third electrodes to reach another electrode. A test sensor also may be configured where mixing of the first and the second redox species is not observed by an analysis technique selected from cyclic voltammetry and chemoamperometry within 12 minutes if the test sensor is not mechanically disturbed or within 1.4 minutes if the test sensor is mechanically disturbed.
- A method of measuring at least one analyte in a sample is disclosed that includes chemically or biochemically oxidizing or reducing at least one analyte in a sample; applying a first input signal to the sample with at least a first working electrode and a first counter electrode; applying a second input signal at a different potential than the first input signal to the sample with at least the first working electrode and a second counter electrode; analyzing the output signals from the first and the second input signals to determine a concentration of a first measurable species in the sample at the potential of the first counter electrode, and a concentration of a second measurable species in the sample at the potential of the second counter electrode; and converting at least one of the first and the second measurable species concentrations into the concentration of the at least one analyte in the sample.
- A method of measuring at least one analyte in a sample is disclosed that includes introducing the sample to a test sensor including at least two pairs of electrodes, the at least two pairs of electrodes including at least four independently addressable and substantially chemically isolated electrodes, where at least two of the electrodes are working electrodes and at least two of the electrodes are counter electrodes; chemically or biochemically oxidizing or reducing the analyte in the sample; applying a gated input signal to the sample across the at least two pairs of electrodes to generate at least two output signals; combining the at least two output signals; and measuring the concentration of the analyte in the sample from the combined output signals. Systems of using the disclosed test sensors with the disclosed methods also are disclosed.
- Other devices, systems, methods, features and advantages of the invention will be, or will become, apparent to one with skill in the art upon examination of the following figures and detailed description. It is intended that all such additional systems, methods, features, and advantages be included within this description, be within the scope of the invention, and be protected by the claims that follow.
- The invention can be better understood with reference to the following drawings and description. The components in the figures are not necessarily to scale, emphasis instead being placed upon illustrating the principles of the invention. Moreover, in the figures, like referenced numerals designate corresponding parts throughout the different views.
-
FIG. 1A represents a test sensor arrangement where the sample is introduced to the top of a primary area through a sample port and flows in a substantially symmetrical manner to fill four secondary analysis regions. -
FIG. 1B represents the test sensor ofFIG. 1A with the addition of a reference electrode. -
FIG. 1C represents the test sensor ofFIG. 1A with separate counter electrodes. -
FIG. 1D represents the test sensor ofFIG. 1C with the addition of a reference electrode. -
FIG. 2A represents a test sensor arrangement where sample introduction occurs from a sample port in a side of the test sensor into a primary area and then flows in an asymmetric manner to fill two secondary analysis region. -
FIG. 2B represents a test sensor having the electrode arrangement ofFIG. 2A , but with a different arrangement of the secondary analysis regions. -
FIG. 3A represents a straight-channel test sensor design where the sample flows from a primary area across a first potential electrode location to reach a second potential electrode location. -
FIG. 3B through FIG. 3G represent alternate designs for secondary analysis regions where the sample does not flow across more than one potential electrode location. -
FIG. 4A shows the cyclic voltammogram of a straight-channel test sensor design, such as represented inFIG. 3A . -
FIG. 4B shows the cyclic voltammogram of a Y-channel design, such as represented inFIG. 3E . -
FIG. 5A shows a chemoamperometry current verses time plot establishing that for a straight-channel test sensor of the type used inFIG. 4A , a ferrocyanide peak was observed at the working electrode within about 5 seconds of introducing the sample. -
FIG. 5B shows a chemoamperometry current verses time plot establishing that for a Y-channel test sensor of the type used inFIG. 4B , substantially no ferrocyanide reached the working electrode after 30 seconds of introducing the sample. -
FIG. 5C is a chemoamperometry current verses time plot establishing that the Y-channel design provides superior chemical isolation between potential electrode locations than a T-channel design. -
FIG. 5D establishes that three Y-channel designs were resistant to such mixing from mechanical disturbance. -
FIG. 6A represents a test sensor having a staggered arrangement of the secondary analysis regions where the sample enters a sample port into a primary area in the form of a channel from which two secondary analysis regions branch. -
FIG. 6B represents a test sensor arrangement where the sample enters the sample port into a primary area in the form of a channel from which three secondary regions branch. -
FIG. 7A and FIG. 7B represent test sensors having staggered secondary analysis region designs. -
FIG. 8A represents a variation of theFIG. 7A test sensor where multiple working electrodes are electrically connected. -
FIG. 8B represents a variation of theFIG. 7A test sensor where multiple counter electrodes are electrically connected. -
FIG. 9A represents a one electron transfer mediator transferring one electron. -
FIG. 9B represents a multi-electron transfer mediator transferring two electrons. -
FIG. 10A represents a system having three independently addressable counter electrodes, each operating at a different potential, and three electrically connected working electrodes, each having a mediator system that operates at a different potential. -
FIG. 10B shows cyclic voltammograms of ruthenium(III) hexaamine, ferricyanide, and an electro-active organic molecule. -
FIG. 10C is a graph relating counter electrode operating potential and redox conjugate pair ratio. -
FIG. 10D represents the charge transfer systems of multiple independently addressable counter electrodes. -
FIG. 10E shows cyclic voltammograms establishing the different operating potentials that may be provided to one or more working electrodes by multiple independently addressable counter electrodes. -
FIG. 11A establish that the charge transfer systems ofFIG. 10E may be replaced with multiple redox conjugate pair ratios to provide multiple potentials to the system. -
FIG. 11B depicts the current profiles obtained when the potential at one substantially chemically isolated working electrode is repetitively controlled in sequence by three substantially chemically isolated and independently addressable counter electrodes, each having a different potential provided by different charge transfer systems. -
FIG. 12A depicts a schematic representation of a biosensor system that determines an analyte concentration in a sample of a biological fluid. -
FIG. 12B through FIG. 12F represent multiple potentiostat variations that may be used with the signal generator ofFIG. 12A . -
FIG. 13 represents an electrochemical analysis for determining the presence and/or concentration of at least one analyte in a sample. -
FIG. 14A represents the input signal from a sequential gated amperometric pulse sequence used in combination with a test sensor having independently addressable counter and working electrodes. -
FIG. 14B represents the input signal from a simultaneous gated amperometric pulse sequence used in combination with a test sensor having independently addressable counter and working electrodes. -
FIG. 15 shows the results of averaging the results of up to four separate analyses for the same analyte to determine the concentration of the analyte in the sample. -
FIG. 16 depicts the current decays obtained from a signal averaging experiment. - A biosensor system including test sensors having at least three independently addressable analysis regions is disclosed. Each analysis region includes a conductor or electrode and may be substantially chemically isolated. Thus, the working and counter electrodes of an electrode pair may reside in substantially chemically isolated environments. A working electrode may be combined with two or more counter electrodes, where each counter electrode resides in a substantially chemically isolated environment. Thus, the system may include at least two counter electrodes operating at different potentials. The independent addressability of the substantially chemically isolated analysis regions provides for multi-potential electrochemical analysis.
- Operating at more than one potential, samples including multiple analytes may be analyzed. Multiple, independent analyses of the same analyte may be performed to increase the accuracy and/or precision of the analysis. In addition to multi-analyte and multi-analysis, the configurability of the system allows for increased accuracy and/or precision as the portion of the output signal attributable to sample interferents, hematocrit, mediator background, temperature, manufacturing variability, reagent deactivation, and the like may be determined. Analyte interferents are chemical, electrochemical, physiological, or biological species that result in a positive or negative bias in the determined analyte concentration. Once known, these effects may be used to alter or may be removed from the determined analyte concentration. Calibration information also may be provided by analysis regions that are not responsive to an analyte.
-
FIG. 1A represents atest sensor 100 arrangement where the sample is introduced to the top of aprimary area 110 through asample port 115 and flows in a substantially symmetrical manner to fill foursecondary analysis regions 150. Each of thesecondary analysis regions 150 includes avent 120 to allow the sample to exhaust air from thesecondary analysis regions 150 during filling. Thevent 120 may be any shape that is compatible with the shape of thesecondary analysis regions 150, such as circular or polygonal. The maximum diameter or width of thevent 120 may be any size that provides the desired sample flow into thesecondary analysis regions 150, with values from about 0.02 mm to about 1.5 mm being preferred. - A
single counter electrode 130 occupies the primary area, while a working electrode 141-144 is present in eachsecondary analysis region 150. While depicted with thecounter electrode 130 in theprimary area 110 and the working electrodes 141-144 in thesecondary analysis regions 150, the positioning of the working and counter electrodes could be reversed so multiple counter electrodes surround a single working electrode (not shown). In another aspect, the electrodes may not occupy the same plane. For example, some electrodes may be arranged horizontally while others are arranged vertically. In another example, some electrodes may be placed higher than others so the biological fluid reaches the lower electrodes first. Other electrode configurations may be used. For example,FIG. 1B represents the test sensor ofFIG. 1A with the addition of areference electrode 170 to provide a non-variant potential. -
FIG. 1C represents thetest sensor 100 where instead of asingle counter electrode 130, four independent counter electrodes 131-134 are provided in the centralprimary area 110. While depicted with the counter electrodes in the primary area and the working electrodes in the secondary analysis regions, the positioning of any working electrode and any counter electrode may be reversed (not shown). Other electrode configurations may be used. -
FIG. 1D represents the test sensor ofFIG. 1C with the addition of areference electrode 170 to each secondary analysis region to provide a non-variant potential. One or more of thereference electrodes 170 may operate at one or more potentials to provide a non-variant potential to each analysis. As the operating potential of the counter electrodes may vary, one or more reference electrode may be used to reference the potential at the counter electrodes in addition to referencing the potential of the working electrodes as common in conventional systems. - Although not shown in the figure, for test sensors implemented in continuous monitoring applications, such as for electrodes implanted in a living organism or otherwise in continuous contact with a biological fluid, the use of multiple reference electrodes may provide for increased accuracy and/or precision of the determined analyte concentrations. The increase may arise from a reduction in the problems associated with the changing potential of working electrodes implanted in a living organism or otherwise in continuous contact with a biological fluid.
- In
FIG. 1A and FIG. 1B ,conductors 160 lead from each electrode toward the rear of thetest sensor 100 where each of theconductors 160 may be connected to a measurement device, allowing for each working electrode 141-144 to be independently addressed. Thus, when theconductor 160 is connected to a single electrode, the electrode is independently addressable. Theconductors 160 may remain independently addressable or any two or more may be electrically connected (not shown). Thus, when more than one electrode is electrically connected to the same conductor, the electrodes are not independently addressable as they are electrically addressed together. For example, by electrically connecting two of the working electrodes 141-144, such as 141 and 144, the resultingtest sensor 100 would have three independently addressable working electrodes and onecounter electrode 130. - When configured with the
single counter electrode 130 and four independently addressable working electrodes 141-144, thetest sensor 100 ofFIG. 1A and FIG. 1B may potentially perform a different analysis at each of the working electrodes 141-144. Thesingle counter electrode 130 may provide a single potential to the system through the use of a charge transfer system that operates at a single potential. Depending on the measurement device, thesingle counter electrode 130 may provide more than one potential to the system. - If the electrode types were reversed for the
test sensor 100 ofFIG. 1A and FIG. 1B so there were four independently addressable counter electrodes and a single working electrode, the electrochemistry at the working electrode potentially could be measured at four different potentials. The independent addressability of the counter electrodes allows for each counter electrode to be formed with a different charge transfer system, thus altering the potential provided to the working electrode during analysis. If the working electrode includes reagents that interact with one or more analytes at four different potentials, each analyte interaction may be independently measured by electrically addressing the appropriate counter electrode. Preferably, each independently addressable counter electrode operates at a single potential or potential range. - In
FIG. 1C and 1D , theconductors 160 lead from each electrode toward the rear of thetest sensor 100 where each of theconductors 160 may be connected to a measurement device. This arrangement allows for each working electrode 141-144 and each counter electrode 131-134 to be independently addressed. Theconductors 160 may remain electrically isolated or any two or more may be electrically connected (not shown). For example, by electrically connecting two of the counter electrodes, such as 132 and 133, the resulting test sensor would have four independently addressable working electrodes and three independently addressable counter electrodes. Any combination of electrodes may be electrically connected. - Independently addressable working electrodes potentially allow for a different chemical reaction to be measured at each working electrode 141-144. Having independently addressable counter electrodes 131-134 of differing operating potentials allows for a working electrode to be operated against more than one counter electrode potential. Thus, two charge transfer chemistries present at the same working electrode may be measured independently by two independently addressable counter electrodes where the first counter electrode operates at the potential of the first charge transfer chemistry and the second counter electrode operates at the potential of the second charge transfer chemistry.
- The
test sensor 100 ofFIG. 1C provides independent addressability to four working electrodes 141-144 and four counter electrodes 131-134. Because each of the counter electrodes 131-134 may provide a different potential, sixteen different analyses potentially may be performed. Thus, the electrochemistry of a single working electrode may be measured at four different potentials and the potential of a single counter electrode may be applied against four different working electrode chemistries. The test sensor ofFIG. 1D , having four independentlyaddressable reference electrodes 170, may provide up to four different non-variant potentials to the system. The measurement device may use one or more of the non-variant potentials to control or determine the operating potential at the working electrodes 141-144 and at the counter electrodes 131-134. - For the
test sensor 100 ofFIG. 1A through FIG. 1D , thesecondary analysis regions 150 may have areas of about 0.5 mm2 and heights of about 0.125 mm to provide interior volumes of about 62 nL each. Preferable secondary analysis regions have interior volumes of 100 nL and less, with interior volumes of 70 nL and less being more preferred. Larger and smaller secondary analysis regions may be used. -
FIG. 2A represents atest sensor 200 arrangement where sample introduction occurs from asample port 215 in afront edge 214 of thetest sensor 200 into aprimary area 210 and then flows in an asymmetric manner to fill a firstsecondary analysis region 251 and a secondsecondary analysis region 252. Sample flow is asymmetric because the secondsecondary analysis region 252 is longer than the firstsecondary analysis region 251. Thesecondary analysis regions vent 220 to allow the sample to exhaust air from the region during filling. - On entry, the sample crosses a first electrode pair defined by working
electrode 241 andcounter electrode 231. While continuing to cross the first electrode pair, the sample flows toward the second and third electrode pairs, defined by workingelectrode 242 and counter electrode 232 (second pair) and by workingelectrode 243 and counter electrode 233 (third pair). The sample flowing across the first and third electrode pairs then continues to flow until crossing the fourth electrode pair, defined by workingelectrode 244 andcounter electrode 234. Thus, the fourth electrode pair is crossed by the sample after the first and third electrode pairs. When crossed by the sample, areagent composition 280 provides electrical conductivity between the pairs of the working and counter electrodes. Independent addressability of the electrode pairs allows for the filling of thesecondary analysis regions - By monitoring the filling of the
secondary analysis regions test sensor 200 provides an underfill detection system to prevent or screen out analyses associated with sample sizes that are of insufficient volume. Because concentration values obtained from an underfilled test sensor may be inaccurate, the ability to prevent or screen out these inaccurate analyses may increase the accuracy of the concentration values obtained. Conventional underfill detection systems have one or more indicator, such as an electrode or conductor, which detect the partial and/or complete filling of the sample reservoir within the test sensor. Having the ability to monitor filling between multiple secondary analysis regions, more accurate determinations of the fill state of thetest sensor 200 are possible. The electrical signal may be used to indicate whether a sample is present and whether the sample partially or completely fills a specific analysis region. -
FIG. 2B represents thetest sensor 200 having the electrode arrangement ofFIG. 2A , but with a different arrangement of the secondary analysis regions. Aprimary area 210 including the first electrode pair is provided with the three symmetrically filledsecondary analysis regions secondary analysis regions vent 220 to allow the sample to exhaust air during filling of thetest sensor 200. - A
single reagent composition 280 may extend between each of the four working and counter electrode pairs as shown. Aconductor 260 leading from each electrode toward the rear of thetest sensor 200 where it may be connected to a measurement device, allowing for each electrode to be independently addressed. While each electrode is independently addressable, each electrode pair share the same chemical environment due to the same reagent layer contacting both the working and counter electrodes of each pair. The electrodes may remain electrically isolated or any two or more may be electrically connected (not shown). One or more reference electrodes may be added to provide a non-variant potential (not shown). - While depicted with the counter electrodes centrally grouped and the working electrodes around the perimeter, the positioning of any working and counter electrode may be reversed. The four independent working electrodes provide for four different reagent compositions to potentially perform four different analyses. While the four independent counter electrodes each may be operated at a different potential to provide 16 possible analyses, the 90° separation between each electrode pair may make this impractical.
-
FIG. 3A represents a straight-channel test sensor design where the sample flows fromprimary area 310 across a firstpotential electrode location 320 to reach a secondpotential electrode location 330.FIG. 3B through FIG. 3G represent alternate test sensor designs for secondary analysis regions where the sample does not flow across more than one potential electrode location.FIG. 3B represents a T-channel design used in some conventional sensors.FIG. 3C represents a multi-T-channel design where additionalpotential electrode locations -
FIG. 3H depicts a multi-T-channel test sensor 300 having both an independently addressable workingelectrode 331 and an independentlyaddressable counter electrode 332 in each of foursecondary analysis regions 333. Thus, each working and counter electrode pair shares the same chemical environment, but each pair of electrodes is substantially chemically isolated from every other pair. A combined reagent compositioncharge transfer system 336 is deposited on each electrode pair. Each of the workingelectrodes 331 and each of thecounter electrodes 332 is formed from aconductor 334 that terminates in acontact 335.Contact 335a andcontact 335b correspond to the working and counter electrodes, respectively, of thesecondary analysis region 333a. The width of each of thesecondary analysis regions 333 is 1.2 mm, while the width ofprimary area 310 is 1.5 mm. The straight-line distance between the electrode pairs in opposing secondary analysis regions is 3.46 mm. The width of the working electrode of each pair is specified to be 0.50 mm separated from the counter electrode by from about 0.05 mm to about 0.25 mm. The circles drawn on each of the workingelectrodes 331 is the projected coverage area of the reagent composition. Other secondary analysis region widths, electrode widths and separations, and reagent composition coverage areas may be used. -
FIG. 3I depicts a multi-T-channel test sensor 300 having an independently addressable workingelectrode 331 in each of four substantially chemically isolated secondary analysis regions and an independentlyaddressable counter electrode 332 in each of four opposingsecondary analysis regions 333. Thus, each electrode is substantially chemically isolated from every other electrode. Each electrode is formed from aconductor 334 that terminates in acontact 335. -
FIG. 3D represents a departure from T-channel designs because the secondary analysis regions are staggered so astraight line 370 passing through the secondary analysis regions and a primary area cannot be drawn between any two potential electrode locations. The potential advantage of such a staggered design is the resistance to mixing between the opposing secondary analysis regions if the test sensor is mechanically disturbed while filled with the sample. Mechanically disturbed means applying a sufficient force to the test sensor to cause the fluid sample to move - In addition to failing the straight line test, the Y-channel designs of
FIG. 3E through FIG. 3G resist mixing between potential electrode locations that are closer together than for the designs ofFIG. 3B and 3C because the separation of the secondary analysis regions does not solely rely on the distance between potential electrode locations for substantial chemical isolation. Chemical separation in a Y-channel also may benefit from the sample having to flow around the "v" portion of the "Y" to mix. As the electrodes may be spaced closer together, but still resist sample mixing, the total volume of the sample reservoir of a Y-channel design may be less in relation to a T-channel design having a similar chemical separation. - Preferable sample reservoir designs have secondary analysis regions branching from the
primary area 310 at anangle 390 of less than 90°, as represented inFIG. 3F . In this manner, fluid may enter the test sensor and reach the potential electrode locations without making a 90° turn. This may allow for the sample to rapidly enter the test sensor while reducing the potential for reagent mixing from sample convection due to vibration. More preferable designs lack thestraight line 370 as depicted inFIG. 3B and FIG. 3C between electrodes passing through the secondary analysis regions and a primary area and have secondary analysis regions branching from the primary area at an angle of less than 90°. Other designs, such as those having one or more bends in the primary area and/or secondary analysis regions and those where the secondary analysis regions branch from the primary area at an angle of greater than 90° also may be used; however, increasing sample size requirements and slower sample filling speeds may be limiting factors. -
FIG. 3J depicts a Y-channel test sensor 300 having both an independently addressable workingelectrode 331 and an independentlyaddressable counter electrode 332 in each of twosecondary analysis regions 333. Thus, each working and counter electrode pair of electrodes share the same chemical environment, but each pair is substantially chemically isolated from the opposing pair. While the workingelectrode 331 crosses thesecondary analysis region 333, thecounter electrode 332 is defined by the perimeter edge of thesecondary analysis region 333, which is in turn formed from theconductor 334. Thesecondary analysis regions 333 branch from theprimary area 310 at an angle of about 45°. Each of theconductors 334 terminate in acontact area 335. Other electrode designs could be used, such as those in which a single electrode is formed in one or more secondary analysis regions. Other branching angles for the secondary analysis regions also may be used. - The substrate of the
test sensor 300 has a width of 11.8 mm and a length of 30 mm. The width of theprimary area 310 is 1.2 mm. The distance between the projected outer edges of the two reagent composition depositions is 0.8 mm. Thecontact areas 335 each have a width of 2.9 mm and the diameter of the reagent composition deposition in each of the twosecondary analysis regions 333 is 1.8 mm. Other substrate dimensions, primary area and contact area widths, and reagent composition deposition diameters may be used. - In addition to the number and type of electrodes and the degree of independent electric addressability of the electrodes, the degree of chemical isolation provided by the secondary analysis regions of the sample reservoir affects the number of analyses that may be performed with a test sensor. Substantially chemically isolated means that diffusive or convective mixing of the reagents does not substantially occur between the secondary analysis regions during the time of the one or more analyses.
- If a working and counter electrode pair is substantially chemically isolated from other working and counter electrode pairs, but not from each other, the pair may perform analyses compatible with the chemistry present at the pair. Such a configuration may allow for rapid diffusive mixing of the reagents present at the working and counter electrodes of the pair. Conversely, if working and counter electrodes are substantially chemically isolated from other working and counter electrodes and from each other, each electrode potentially may participate in an analysis with any other electrode, if independently addressable. Thus, if substantially chemically isolated, different reagent compositions may be used to provide an electrode with a chemical analysis environment that is different from other electrodes. In combination, substantial chemical isolation between analysis regions allows different reagents to be used at each working and/or counter electrode, while the independent electrical addressability allows each working electrode to be independently measured.
- The secondary analysis regions may be substantially chemically isolated depending on the cross-sectional area of the entrances to the secondary regions, the distances between any two electrodes within the secondary analysis regions, the physical arrangement of the secondary analysis regions in relation to each other and in relation to the primary area, and the like. In addition to these concerns, substantial chemical isolation initially may be lost due to reagent mixing as the sample flows across the counter electrode/s (
FIG. 1A through FIG. 1D ) or the electrode pairs at the entrance and at the sides of the test sensor (FIG. 2A andFIG. 2B ). In this manner, reagent composition may be transported by the sample to multiple electrode pairs. Conversely, such flow mixing may be substantially eliminated when the sample does not flow across more than one electrode (FIG. 3B-FIG. 3J ). -
FIG. 4A shows the cyclic voltammetry plot of a straight-channel design as represented inFIG. 3A . The first electrode pair nearest the sample port used a reagent composition including 0.5 M potassium ferrocyanide, while the second electrode pair nearest the terminus of the channel used a reagent composition including the electro-active organic molecule represented by Structure I, below. Within about seven seconds or less, two peaks were observed, with the left peak representing oxidation of the reduced state of the Structure I molecule and the right peak representing oxidation of ferrocyanide, which was initially disposed at the first electrode pair. Within about 20 complete cycles, the Structure I molecule peak disappeared, suggesting that ferricyanide was oxidizing the Structure I molecule. - During the analysis, it is believed that ferrocyanide from the first electrode pair was oxidized at the second electrode to form ferricyanide at the second electrode pair. The formed ferricyanide then chemically oxidized the reduced species of the Structure I molecule at the second electrode pair. These results established that chemical contamination between the electrode pairs rapidly occurs in a straight-channel design. The experiment demonstrates that the stronger oxidizing agent, such as ferricyanide in this instance, will take over mediation from other mediators, such as the Structure I molecule, if the electrodes are not substantially chemically isolated. This contamination is believed attributable to a combination of the sample crossing the counter electrode before reaching the working electrode, diffusion, and convection within the straight-channel reservoir.
- In contrast,
FIG. 4B shows the cyclic voltammograms of a Y-channel design as represented inFIG. 3E . An electrode was placed near the terminus of each secondary analysis region. Only oxidation of the Structure I molecule is observed after 20 complete cycles (more than 20 minutes), establishing that substantial chemical isolation was achieved for at least 10 minutes with the Y-channel secondary analysis region design. These experiments were performed using a CH Instruments Electrochemical Workstation, model CHI 660A running version 2.05 software, at about 22° C and a relative humidity of about 45%. The sample was pH 7.0 phosphate buffer containing 0.1 M sodium phosphate and about 16% (w/w) PVP polymer having a weight average molecular weight of about 2000. - A similar effect was observed for chemoamperometry testing, where current is measured as a function of time. In
FIG. 5A a current verses time plot established that for a straight-channel sensor of the type used inFIG. 4A , a second peak was observed with a 400 mV operating potential at the working electrode within about 5 seconds of introducing the sample. Sample introduction generated the first peak in the plot. The second peak correlates with the second voltammetric wave of ferrocyanide inFIG. 4A . InFIG. 5B , it was shown that substantially no ferrocyanide reached the working electrode after 30 seconds, establishing that substantial chemical isolation was achieved with the Y-channel secondary analysis region test sensor. In these experiments, the initial sharp peak represented the sample first establishing electrical communication between the electrodes. The amperometry testing was performed using the CH Instruments Electrochemical Workstation at about 22° C and a relative humidity of about 45%. The sample was pH 7.0 phosphate buffer containing 0.1 M sodium phosphate and about 16% (w/w) PVP polymer having a weight average molecular weight of about 2000. -
FIG. 5C is an amperometric current plot establishing that the Y-channel design provides superior chemical isolation between potential electrode locations than a T-channel design. As shown by Y-channel line 501, substantial chemical isolation was observed out to 1000 seconds between the potential electrode locations, as represented bypositions FIG. 3E . In contrast, as shown by T-channel peaks FIG. 3B . The large variability between the 84 and 650 second time variables may be attributed to the susceptibility of the T-channel design to mixing by convection from mechanical disturbance during the analysis.FIG. 5D establishes that three Y-channel designs were resistant to such mixing from mechanical disturbance. The slow current rise observed after about 800 seconds may indicate slow mixing by diffusion. -
FIG. 6A represents atest sensor 600 having a staggered arrangement of thesecondary analysis regions sample port 615 into aprimary area 610 in the form of a channel from which two secondary analysis regions 650 branch. Aconductor 690 may extend into theprimary area 610 to provide underfill detection capability to thetest sensor 600. Similarly,FIG. 6B represents a test sensor arrangement where the sample enters thesample port 615 into aprimary area 610 in the form of a channel from which three secondary regions 651-653 branch. Each of the secondary regions 651-653 includes an independently addressable electrode or conductor. - In
FIG. 6A , the sample fills the firstsecondary region 651 on the right, then the secondsecondary region 652 on the left. InFIG. 6B , the sample fills the thirdsecondary region 653 on the left, then the firstsecondary region 651 on the right, and then the secondsecondary region 652 on the left. - The total sample volume held by the
test sensor 600 having at least two or three secondary analysis regions may be 210 nL or less. Each of the secondary analysis regions and the end of theprimary area 610 opposite thesample port 615 may include avent 620 to allow the sample to exhaust air during filling. By dividing the sample reservoir defined by theprimary area 610 and the secondary analysis regions 651-653 into one or more primary areas that fill multiple secondary regions, thetest sensor 600 may fill faster than a substantially undivided sample reservoir, such as the straight-channel design represented inFIG. 3A , of the same or similar volume due to the effect of capillary action driven by surface tension. Thus, subdividing the sample reservoir into smaller secondary analysis regions, where each may contain an electrode, an electrode pair, one or more conductors, or a combination thereof, may increase the fill rate for thetest sensor 600. Substantial chemical isolation between the secondary regions during filling and during the analysis may be provided by filling the secondary regions from the primary area in this manner. - As the sample primarily flows to the
nearest vent 620, the secondary regions 651-653 are filled in a substantially sequential manner from theprimary area 610. Due to the sequential filling of the secondary regions 651-653, the measurement device can monitor the rate and flow of the sample as the secondary analysis regions 651-653 are filled. The flow of the sample also may be monitored by equipping thetest sensor 600 with an electrode or conductor near thesample port 615 and/or near thevent 620 of theprimary area 610. Thus, one or more conductor and/or electrode may be monitored by the measurement device to determine the fill condition of thetest sensor 600. The filling of non-sequential filling designs may also be monitored in this manner; however, the system may or may not be able to independently monitor the filling of each secondary analysis region. - While not shown in the figure, the
primary area 610 may be provided withmultiple sample ports 615 to allow the sample to be introduced from more than one location, such as at a perimeter and a top location. Similarly, thetest sensor 600 may be provided with two or more separate sample reservoirs, each having a primary area and two or more secondary regions, to allow for multiple samples to be analyzed. By altering the vent structure of the reservoir, different samples may be introduced through multiple sample ports into the same reservoir, but remain substantially chemically isolated during the analysis. Other relationships between the primary area or areas and secondary regions may be used. - The
primary area 610 and/or one or more secondary regions 651-653 may include flow-altering materials that modify the flow of the sample as it distributes through the sample reservoir. For example, hydrophilic and/or hydrophobic treatments, coatings, or materials may be used to preferably direct the flow path and/or fill rate of aqueous samples. In another aspect, theprimary area 610 and/or the secondary regions 651-653 may include structural features, such as walls, grooves, or channels, which preferably direct the flow path and/or fill rate of the sample. In another aspect, materials that chemically or physically alter the composition of the sample may be placed in theprimary area 610 and/or the secondary regions 651-653. For example, a material that filters red blood cells from the sample may be placed in a portion of the primary area to remove the cells before the sample reaches a secondary region. -
FIG. 7A and FIG. 7B representtest sensors 700 having staggered secondary analysis region designs as previously discussed. The design ofFIG. 7A includes eight secondary analysis regions with approximately 90° angles to theprimary area 710, whileFIG. 7B is a similar Y-channel design. Thetest sensor 700 includes a total of nine secondary analysis regions, including the region at the end ofprimary area 710, each occupied by an electrode or conductor. The figure depicts four independently addressable counter electrodes 731-734 and four working electrodes 741-744, each present in one of the eight secondary regions. While the counter electrodes 731-734 reside on one side of theprimary area 710 and the working electrodes 741-744 reside on the other side, the arrangement may be mixed. For example, the first two secondary analysis regions filled by the sample may be working electrodes while the second two secondary analysis regions filled by the sample may be counter electrodes. - An optional electrode, such as a
reference electrode 770, is present at the end of theprimary area 710opposite sample port 715. Thereference electrode 770 also could be placed in the rearmost secondary region in relation to where the sample is introduced or near thesample port 715, for example. Thus, one or more reference electrodes may be positioned in theprimary area 710 and/or secondary regions to provide a non-variant potential to the system. Residing in a substantially chemically isolated environment from the secondary regions, optional electrodes may provide fill information or information about the sample. - A
conductor 790 electrically connected to thecounter electrode 731 is extended into theprimary area 710 near thesample port 715. Although not independently addressable, theconductor 790 may provide fill information to the measurement device. Other configurations of electrodes and/or conductors are possible. Each secondary region and the end of theprimary area 710 may include a vent (not shown). - The eight electrodes 731-734 and 741-744 may be addressed independently by the measurement device. As the secondary regions are substantially chemically isolated, each may include a reagent composition providing a different chemistry to interact with the constituents of the sample. Because the reagent composition may be different for each of the working electrodes 741-744, the charge transfer system may be different for each of the counter electrodes 731-734, and each electrode may be independently addressed, four different analyses may be possible when a single reagent composition is present at each of the working electrodes 741-744. In this manner, each working electrode reagent composition may be used with a dedicated counter electrode. Similarly, if each of the working electrodes 741-744 were provided with two reagent compositions having different redox potentials, a total of eight different analyses may be possible. Finally, providing each working electrode with four reagent compositions having different redox potentials may provide up to sixteen different analyses, as each working electrode may be independently addressed with each of the four counter electrodes. Practical considerations, such as unwanted interaction between more than one reagent composition at a working electrode, may limit the actual number of analysis that may be performed by the system. Other sample reservoir constructions and electrode configurations may be used.
-
FIG. 8A represents a variation of theFIG. 7A test sensor where multiple working electrodes 841-844 are electrically connected. The counter electrodes remain independently addressable. In this manner, each counter electrode may provide a different potential to the electrically connected working electrodes. By electrically connecting one or more of the working electrodes, the working electrode having a redox potential closest to that of the potential of the selected counter electrode may operate. In this mode of operation, each working electrode may have a different mediator system, each mediator system having a different redox potential. By stepping the operating potential of the system from low to high using the different potentials of the counter electrodes, the different mediator systems of the working electrodes may be progressively addressed. Other sample reservoir constructions and electrode configurations may be used. -
FIG. 8B depicts a variation ofFIG. 7A where multiple counter electrodes 831-834 are electrically connected. The working electrodes remain independently addressable. By electrically connecting one or more of the counter electrodes, the counter electrode having a charge transfer system with the highest potential may provide the potential to the system. In this manner, the electrochemistry responsive to the analyte at each working electrode may be measured. Other sample reservoir constructions and electrode configurations may be used. - With regard to the previously described test sensors, the working and counter electrodes present in the secondary analysis regions may be separated by 1,000 micrometers or more. Electrode separation distances less than 1,000 micrometers also may be used. The pattern of the electrodes is not limited to those shown in the figures, instead being any pattern compatible with the primary area and secondary analysis regions of the test sensor. Preferably, the electrodes are formed by a rectangular deposition of the reagent composition and/or a charge transfer system. The deposition may be made by screen printing, ink-jetting, micro-pipetting, pin-deposition, or other methods.
- Reagent layers are formed when the reagent composition is applied to the conductor. For example, the reagent layer forming a working electrode may include an enzyme, a mediator, and a binder, while the reagent layer forming the counter electrode may include a mediator and a binder. Analytes undergo electrochemical reaction at the working electrode while the opposite electrochemical reaction occurs at the counter electrode to allow current flow between the electrodes. For example, if an analyte undergoes oxidation at the working electrode, reduction occurs at the counter electrode.
- In addition to working and counter electrodes, test sensors may include reference electrodes that provide a non-variant reference potential to the system. While multiple reference electrode materials are known, a mixture of silver (Ag) and silver chloride (AgCl) is typical due to the insolubility of the metal and its corresponding salt in the aqueous environment of the sample. Since the ratio of Ag metal to Cl- does not significantly change in the sample, the potential of the electrode does not significantly change. If increased in size and/or modified with a conductive metal, a reference electrode also may be used as a counter electrode because it will pass current. However, a counter electrode may not serve as a reference electrode because it lacks the ability to isolate the half cell that provides the reference potential from the sample solution.
- The conductors that form the electrodes may reside on one or more substrates, depending on the arrangement of the electrodes. The substrate may be made from any material that is compatible with the formation and operation of the biosensor. Preferable materials for the substrate include polyethylene terephthalate (PET), polycarbonate (PC), polyimide (PI), polyethylene (PE), polypropylene (PP), polystyrene (PS), polyvinyl chloride (PVC), polyoxymethylene (POM), monomer-cast nylon (MC), polybutylene terephthalate (PBT), a polymethacrylic resin (PMMA), an ABS resin (ABS), and glass. More preferable materials from which to form one or more substrate include polyethylene terephthalate (PET), polycarbonate (PC), and polyimide (PI), with polyethylene terephthalate (PET) being preferred at present. To form a test sensor, two substrates in the form of a base and a lid may be combined to form a sample reservoir having at least one sample port and at least one vent. Conductors, spacers, and other components may reside between the substrates.
- The material or materials used to form the conductors on the one or more substrates may include any electrical conductor. Preferable electrical conductors are non-ionizing, such that the material does not undergo a net oxidation or a net reduction during analysis of the sample. The conductors may be made from materials such as solid metals, metal pastes, conductive carbon, conductive carbon pastes, conductive polymers, and the like. The conductors preferably include a thin layer of a metal paste or metal, such as gold, silver, platinum, palladium, copper, or tungsten. A surface conductor may be deposited on all or a portion of the conductor. The surface conductor material preferably includes carbon, gold, platinum, palladium, or combinations thereof. If a surface conductor is not present on a conductor, the conductor is preferably made from a non-ionizing material.
- The conductor and optional surface conductor material may be deposited on the substrate by any means compatible with the operation of the test sensor, including foil deposition, chemical vapor deposition, slurry deposition, metallization, and the like. In another aspect, the conductors may be formed by processing a conductive layer into a pattern using a laser and/or mask techniques.
- The reagent composition or compositions used to form the electrodes may be deposited in solid, semi-solid, liquid, gel, gellular, colloidal, or other form and may include reagents and optionally a binder. The reagent compositions may have viscosities ranging from about 1 cp to about 100 cp. More preferable reagent compositions have viscosities ranging from about 1 cp to about 20 cp or from about 4 cp to about 10 cp. Reagent compositions with other viscosities may be used. Viscosities were determined with a Brookfield Model DV3 Viscometer equipped with an ULA assembly for measuring reagent compositions having viscosities lower than 300 cp. Viscosity measurements were performed at room temperature with the instrument temperature set to 25° C. The measurements were performed at shear rates of 50, 100, 200 and 300 cps (cycle per second) to provide an indication of whether the composition is sheared thin or thick. A 100 mM phosphate buffer solution was used as a control, which typically gave viscosity readings in the range of about 1 to about 1.3 cp under different shear rates.
- The binder is preferably a polymeric material that is at least partially water-soluble. The binder may form a gel or gel-like material when hydrated. Suitable partially water-soluble polymeric materials for use as the binder may include poly(ethylene oxide) (PEO), carboxy methyl cellulose (CMC), polyvinyl alcohol (PVA), hydroxyethylene cellulose (HEC), hydroxypropyl cellulose (HPC), methyl cellulose, ethyl cellulose, ethyl hydroxyethyl cellulose, carboxymethyl ethyl cellulose, polyvinyl pyrrolidone (PVP), polyamino acids, such as polylysine, polystyrene sulfonate, gelatin and derivatives thereof, polyacrylic acid and derivatives and salts thereof, polymethacrylic acid and derivatives and salts thereof, starch and derivatives thereof, maleic anhydrides and salts thereof, agarose based gels and derivatives thereof. The binder may include one or more of these materials in combination. Among the above binder materials, PEO, PVA, CMC, and HEC are preferred, with CMC being more preferred at present for biosensors. Other binders may be used.
- Binders having molecular weights from 10,000 to 900,000, and preferably from 30,000 to 300,000 (weight/average) are preferred. Binders having other molecular weights may be used. Molecular weights may be determined by size exclusion chromatography (SEC), and are generally expressed as weight averages or number averages.
- The reagent composition used to form the working electrode preferably includes a biomolecule responsive to the analyte of interest. Biomolecules may include active enzyme systems, such as oxidoreductases. Biomolecules also may include biopolymers, such as nucleic acids, proteins, and peptides. Other biomolecules may be used.
- Oxidoreductases catalyze the transfer of electrons and facilitate the oxidation or reduction of the analyte and include "oxidases," which facilitate oxidation reactions where molecular oxygen is the electron acceptor; "reductases," which facilitate reduction reactions where the analyte is reduced and molecular oxygen is not the analyte; and "dehydrogenases," which facilitate oxidation reactions in which molecular oxygen is not the electron acceptor. See, for example, Oxford Dictionary of Biochemistry and Molecular Biology, Revised Edition, A.D. Smith, Ed., New York: Oxford University Press (1997) pp. 161, 476, 477, and 560. For example, Table I, below, provides oxidoreductases useful in the analysis of the listed analytes.
Table I Oxidoreductase Analyte Glucose dehydrogenase β-glucose Glucose oxidase β-glucose Cholesterol esterase; cholesterol oxidase Cholesterol Lipoprotein lipase; glycerol kinase; glycerol-3-phosphate oxidase Triglycerides Lactate oxidase; lactate dehydrogenase; Lactate diaphorase Pyruvate oxidase Pyruvate Alcohol oxidase Alcohol Bilirubin oxidase Bilirubin Uricase Uric acid Glutathione reductase NAD(P)H Carbon monoxide oxidoreductase Carbon monoxide - The biomolecules may include amine functional groups capable of hydrogen bonding interactions. Biomolecules having weight/average molecular weights from 10,000 to 500,000 and preferably from 100,000 to 400,000 that maintain biological activity after deposition are preferred. In the case of oxidoreductases, from 0.01 to 100 Units (U), preferably from 0.05 to 10 U, and more preferably from 0.1 to 5 U may be used per test sensor or analysis. In another aspect, at most 1.3 U of the oxidoreductase is used.
- The reagent layer formed from depositing the reagent composition on the conductor may include an enzyme system specific to the analyte that may facilitate the reaction of the analyte while enhancing the specificity of the sensor system to the analyte, especially in complex biological samples. The enzyme system may include one or more enzyme, cofactor, and/or other moiety that participates in the redox reaction with the analyte. For example, an alcohol oxidase can be used to provide a biosensor that is sensitive to the presence of alcohol in a sample. Such a system could be useful in measuring blood alcohol concentrations. In another example, glucose dehydrogenase or glucose oxidase may be used to provide a biosensor that is sensitive to the presence of glucose in a sample. This system could be useful in measuring blood glucose concentrations, for example in patients known or suspected to have diabetes.
- Preferable enzyme systems are oxygen independent, thus not substantially oxidized by oxygen. One such oxygen independent enzyme family is glucose dehydrogenase (GDH). Using different co-enzymes or co-factors, GDH may be mediated in a different manner by different mediators. Depending on their association with GDH, a co-factor, such as flavin adenine dinucleotide (FAD), can be tightly held by the host enzyme, such as in the case of FAD-GDH; or a co-factor, such as Pyrroloquinolinequinone (PQQ), may be covalently linked to the host enzyme, such as with PQQ-GDH. The co-factor in each of these enzyme systems may either be permanently held by the host enzyme or the co-enzyme and the apo-enzyme may be re-constituted before the enzyme system is added to the reagent composition. The co-enzyme also may be independently added to the host enzyme moiety in the reagent composition to assist in the catalytic function of the host enzyme, such as in the cases of nicotinamide adenine dinucleotide NAD/NADH+ or nicotinamide adenine dinucleotide phosphate NADP/NADPH+. Other useful dehydrogenase enzyme systems include alcohol dehydrogenase, lactate dehydrogenase, ß-hydroxybutyrate dehydrogenase, glucose-6-phosphate dehydrogenase, glucose dehydrogenase, formaldehyde dehydrogenase, malate dehydrogenase, and 3-hydroxysteroid dehydrogenase.
- The reagent layer also may include a mediator to communicate the results of the analyte reaction to the conductor. Mediators may be oxidized or reduced and may transfer one or more electrons. A mediator is a reagent in an electrochemical analysis and is not the analyte of interest, but provides for the indirect measurement of the analyte. In a simple system, the mediator undergoes a redox reaction in response to the oxidation or reduction of the analyte. The oxidized or reduced mediator then undergoes the opposite reaction at the working electrode of the test sensor and may be regenerated to its original oxidation number. Thus, the mediator may facilitate the transfer of electrons from the analyte to the working electrode.
- Mediators may be separated into two groups based on their electrochemical activity. One electron transfer mediators are chemical moieties capable of taking on one additional electron during the conditions of the electrochemical reaction. Multi-electron transfer mediators are chemical moieties capable of taking on more-than-one electron during the conditions of the reaction. As depicted in
FIG. 9A , one electron transfer mediators can transfer one electron from the enzyme to the working electrode, while as depicted inFIG. 9B , a multi-electron transfer mediator can transfer two electrons. - Examples of one electron transfer mediators include compounds, such as 1,1'-dimethyl ferrocene, ferrocyanide and ferricyanide, and ruthenium(III) and ruthenium(II) hexaamine. Two electron mediators include the organic quinones and hydroquinones, such as phenanthroline quinone; phenothiazine and phenoxazine derivatives; 3-(phenylamino)-3H-phenoxazines; phenothiazines; and 7-hydroxy-9,9-dimethyl-9H-acridin-2-one and its derivatives. Examples of additional two electron mediators include the electro-active organic molecules described in
U.S. Pat. Nos. 5,393,615 ;5,498,542 ; and5,520,786 , which are incorporated herein by reference, for example. - Preferred two electron transfer mediators include 3-phenylimino-3H-phenothiazines (PIPT) and 3-phenylimino-3H-phenoxazines (PIPO). More preferred two electron mediators include the carboxylic acid or salt, such as ammonium salts, of phenothiazine derivatives. At present, especially preferred two electron mediators include (E)-2-(3H-phenothiazine-3-ylideneamino)benzene-1,4-disulfonic acid (Structure I), (E)-5-(3H-phenothiazine-3-ylideneamino)isophthalic acid (Structure II), ammonium (E)-3-(3H-phenothiazine-3-ylideneamino)-5-carboxybenzoate (Structure III), and combinations thereof. The structural formulas of these mediators are presented below. While only the di-acid form of the Structure I mediator is shown, mono-and di-alkali metal salts of the acid are included. At present, the sodium salt of the acid is preferred for the Structure I mediator. Alkali-metal salts of the Structure II mediator also may be used.


- The charge transfer system is any one or a combination of electrochemically active species that may transfer one or more electrons from or to a counter electrode. For example, if the working electrode of a system transfers electrons to a counter electrode through the measurement device, the charge transfer system of the counter electrode accepts electrons from the counter electrode to allow the measurement of current flow through the system. By accepting electrons at a specific potential or potential range, the charge transfer system influences the potential at which the working electrode may transfer electrons for measurement. The charge transfer system may or may not include the mediator present at the working electrode; but if it does, at least a portion of the mediator at the counter electrode preferably has an oxidation state different than the mediator at the working electrode.
- Because the electrochemical reaction with the lowest potential will occur first, by providing the working electrodes with one or more analyte responsive biomolecule, such as an oxidoreductase, and/or mediators that transport charge at increasing potentials, the electrochemistry of multiple working electrodes may be sequentially analyzed from lowest to highest operating potential. If the working and counter electrodes may be independently addressed, a working electrode having a specific redox potential with an analyte can be selectively paired with a counter electrode having the desired potential. If the redox potentials of the analyte, analyte responsive biomolecule, and/or mediator at independently addressable working electrodes are different, separate output signals for individual analysis may be measured when using electrically connected counter electrodes. Conversely, if the redox potentials of the charge transfer species at independently addressable counter electrodes are different, separate output signals for individual analysis may be measured when using electrically connected working electrodes. When multiple counter electrodes have different charge transfer species but are electrically connected, the counter electrode having the highest potential will provide the operating potential to the working electrode until the system potential drops to that of the next highest potential counter electrode.
-
FIG. 10A represents a system having three independently addressable counter electrodes (CE1-CE3), each operating at a different potential, and three electrically connected working electrodes, each having a mediator system that operates at a different potential. As the operating potential of the system is increased at counter electrodes CE1 through CE3, the redox characteristics of mediators (Med1-Med3) at the electrically connected working electrodes may be independently measured. For instance, when CE1 is coupled with the working electrode, Med1 reacts at the electrode. When CE2 is coupled with the working electrode, Med1 and Med2 react at the electrode. Finally, when CE3 is coupled with the working electrode, all three mediator systems may react at the working electrode. - Multiple operating potentials may be provided to the system by altering the charge transfer system deposited on different conductors to form counter electrodes. The potential provided by a specific counter electrode may be altered with charge transfer systems including different redox species (moieties that may be oxidized and/or reduced) and/or different ratios of the redox conjugate pairs (reduced and oxidized moieties of the same redox species) of a redox species, such as ferrocyanide/ferricyanide. Examples of different redox species for use in charge transfer systems include soluble or insoluble redox species, where soluble redox species are soluble in water (
pH 7, 25° C) at a level of at least 1.0 grams per Liter and exclude elemental metals and lone metal ions that are insoluble or sparingly soluble in water. Useful redox species include electro-active organic molecules, organotransition metal complexes, and transition metal coordination complexes. Unlike metal containing organotransition metal complexes and coordination complexes, electro-active organic molecules lack a metal capable of undergoing oxidation or reduction. Preferable redox species for use in charge transfer systems include ruthenium(III) hexaamine, ferricyanide, and electro-active organic molecules, such as PIPT and PIPO.FIG. 10B shows cyclic voltammograms of the ruthenium(III) hexaamine, ferricyanide, and the electro-active organic molecule represented above in Structure I/II/III. As seen in the graph, the relative potential positions of each redox species are separated by about 200 mV. - Examples of different ratios of redox conjugate pairs are the ratio of ferrocyanide to ferricyanide in the charge transfer system. For example, a ratio of 9.5:0.5 may be used for the lowest potential counter electrode, while ratios of 8:2, 5:5, 2:8, and 0.5:9.5 may be used to provide counter electrodes having progressively increasing operating potentials. Pure ferricyanide may be used to provide a counter electrode having the highest operating potential for the six counter electrodes. In this manner, six independently addressable counter electrodes may be formed using different ratios of redox conjugate pairs, each providing a different potential to the system. Thus, potential differences less than those obtainable with different redox species, such as at least 50 mV, or at least 100 mV, may be obtained using different ratios of the conjugate pairs of a redox species.
- The relationship of counter electrode operating potential vs. redox conjugate pair ratio is characterized by the Nernst equation and is shown in
FIG. 10C . Depending on whether oxidation or reduction is occurring at the counter electrode during analysis, the desired potential can be provided to the counter electrode by selecting the appropriate redox conjugate pair ratio for the deposited charge transfer system. By selecting different ratios of the redox conjugate pairs for the charge transfer systems, the potential of the charge transfer system may be varied by about ±150 mV for different ratios of ferrocyanide/ferricyanide. Thus, in addition to the use of different redox species to provide different operating potentials to multiple counter electrodes, different ratios of the conjugates of the redox species may be used. Substantial chemical isolation, as may be provided by the physical separation between the secondary regions, allows the different charge transfer systems of each counter electrode to provide different operating potentials to the system during the analysis. -
FIG. 10D represents the circumstance where the charge transfer systems of multiple independently addressable counter electrodes (CE1- CE3) provide different absolute operating potentials, such as -200 mV, 0 mV, and +200 mV, while maintaining substantially the same relative operating potential of 0.4 V between the counter and working electrodes. The center redox couple arbitrarily may be assigned a fixed potential of zero against a Standard Hydrogen Electrode, a Saturated Calomel Electrode, or the like. Thus, ruthenium hexaamine has a redox potential that is about 200 mV lower and ferricyanide has a redox potential that is about 200 mV higher than that of the Structure I/II/III molecule. By operating the counter electrodes at different absolute operating potentials in relation to a known potential, the system may independently analyze the different mediator systems (Med1-Med3) at the electrically connected working electrodes WE1 through WE3. -
FIG. 10E shows cyclic voltammograms establishing the different operating potentials that may be provided to one or more working electrodes by multiple independently addressable counter electrodes. A test sensor having a multi-T design with eight secondary analysis regions was fabricated, such as previously depicted inFIG. 3I . Four of the secondary analysis regions were provided with independently addressable working electrodes and four of the secondary analysis regions were provided with independently addressable counter electrodes. Each working electrode was formed with a reagent composition including 0.5% weight/weight (w/w) HEC binder, 50 mM of the Structure I molecule, and 2 U/µL of the PQQ-GDH enzyme system in a phosphate buffer of pH 7. The first counter electrode was formed with a charge transfer system including 0.5% (w/w) HEC binder and 100 mM ruthenium hexaamine in phosphate buffer of pH 7. The second counter electrode was formed with a charge transfer system including 0.5% (w/w) HEC binder and 100 mM of the Structure I molecule in phosphate buffer of pH 7. The third and fourth counter electrodes were formed with a charge transfer system including 0.5% (w/w) HEC binder and 100 mM ferricyanide in phosphate buffer of pH 7. - After introduction of a sample including 300 mg/dL of glucose, the CH Instrument was scanned at a rate of 25 mV/sec for one of the working electrodes and each of the first, second, and third counter electrodes. As shown in
FIG. 10B , the potential of the ruthenium hexaamine counter electrode,line 1010, peaks at a potential about 400 mV higher than ferricyanide,line 1030, with the Structure I molecule peaking approximately in the middle,line 1020. In this manner, the results observed for the in the cyclic voltammograms ofFIG. 10B were reproduced in a multi-T test sensor design having multiple secondary analysis regions. Thus, the ability of the test sensor to operate at multiple potentials using multiple counter electrodes with different charge transfer systems was demonstrated. -
FIG. 11A establishes that the charge transfer systems ofFIG. 10E may be replaced with multiple redox conjugate pair ratios to provide multiple potentials to the system. A test sensor was prepared as inFIG. 10E , but the first counter electrode was formed with a charge transfer system including 0.5% (w/w) HEC binder and a 1:9 ratio of ferricyanide:ferrocyanide 200 mM in phosphate buffer of pH 7, the second counter electrode was formed with a charge transfer system including 0.5% (w/w) HEC binder and a 1:1 ratio of ferricyanide:ferrocyanide 200 mM in phosphate buffer of pH 7, the third counter electrode was formed with a charge transfer system including 0.5% (w/w) HEC binder and a 9:1 ratio of ferricyanide:ferrocyanide 200 mM in a phosphate buffer of pH 7, and the fourth counter electrode was formed with a charge transfer system including 0.5% (w/w) HEC binder and substantiallypure ferricyanide 200 mM in phosphate buffer of pH 7. - After introduction of a sample including 300 mg/dL of glucose, the instrument was scanned at a rate of 25 mV/sec for one of the working electrodes and each of the first, second, third, and fourth counter electrodes.
FIG. 11A showed the first counter electrode to have a peak potential of about 0.149 V (W1-C1), the second counter electrode to have a peak potential of about 0.060 V (W2-C2), the third counter electrode to have a peak potential of about -0.007 V (W3-C3), and the fourth counter electrode to have a peak potential of about -0.047 V (W4-C4). Thus, the ability of the test sensor to operate at multiple potentials using multiple counter electrodes with charge transfer systems relying on different ratios of a redox conjugate pair was demonstrated. -
FIG. 11B depicts the current profiles obtained when the potential at one substantially chemically isolated working electrode is repetitively controlled in sequence by three substantially chemically isolated and independently addressable counter electrodes, each having a different potential provided by different charge transfer systems. A test sensor was prepared as inFIG. 10E , but the multiple working electrodes were replaced with a single working electrode. Afirst peak 1110 in each of the six series of three peaks was obtained from the first counter electrode, asecond peak 1120 in each of the six series of three peaks was obtained from the second counter electrode, and athird peak 1130 in each of the six series of three peaks was obtained from the third counter electrode. Thefirst peaks 1110 demonstrated the current level obtained from using ruthenium hexamine as the charge transfer system at the first counter electrode. Thesecond peaks 1120 demonstrated the current level obtained from using the Structure I molecule as the charge transfer system at the second counter electrode. Thethird peaks 1130 demonstrated the current level obtained from using ferricyanide as the charge transfer system at the third counter electrode. In this manner, for the same potential different counter electrode potentials will address different oxidation points of the same oxidation wave. Thus, in addition to demonstrating the ability of the multiple counter electrodes to control the operating potential at the working electrode, the ability of the system to conduct three separate analyses at the working electrode with a gated input signal was established. -
FIG. 12A depicts a schematic representation of abiosensor system 1200 that determines an analyte concentration in a sample of a biological fluid using an input signal.Biosensor system 1200 includes ameasurement device 1202 and atest sensor 1204, which may be implemented in an analytical instrument, including a bench-top device, a portable or hand-held device, or the like. Thebiosensor system 1200 may be utilized to determine analyte concentrations, including those of glucose, uric acid, lactate, cholesterol, bilirubin, and the like. - While a particular configuration is shown, the
biosensor system 1200 may have other configurations, including those with additional components. For example, thetest sensor 1204 may be adapted for use outside, inside, or partially inside a living organism. When used outside a living organism, a sample of the biological fluid is introduced into a sample reservoir in thetest sensor 1204. Thetest sensor 1204 may be placed in the measurement device before, after, or during the introduction of the sample for analysis. When inside or partially inside a living organism, a test sensor may be continually immersed in the sample or the sample may be intermittently introduced to the sensor. - The
test sensor 1204 has a base 1206 that forms areservoir 1208 with anopening 1212. Thereservoir 1208 may be formed by a lid with a vent. Thereservoir 1208 defines a partially-enclosed volume, but may be open to the sample (not shown). Thus, the sample may continuously flow through the test sensor or be interrupted for analysis. - The
reservoir 1208 may contain a composition that assists in retaining a liquid sample such as water-swellable polymers or porous polymer matrices. Reagents may be deposited in thereservoir 1208. The reagents may include one or more enzymes, enzyme systems, mediators, binders, and like species. The binder may include various types and molecular weights of polymers, such as HEC (hydroxy ethyl cellulose), (CMC (carboxyl methyl cellulose), and/or PEO (polyethylene oxide). In addition to binding the reagents together, the binder may assist in filtering red blood cells, preventing them from coating the electrode surfaces 1211. Thetest sensor 1204 also may have asample interface 1214 disposed adjacent to thereservoir 1208. Thesample interface 1214 may partially or completely surround thereservoir 1208. Thetest sensor 1204 may have other configurations. For example, thetest sensor 1204 may be adapted for transdermal use by forming thereservoir 1208 from a porous material or behind a porous material in which the sample is held. - The
sample interface 1214 hasconductors 1290 connected to at least one working electrode and at least two counter electrodes. The electrodes may be substantially in the same plane or in more than one plane, such as when facing. The electrodes may be disposed on a surface of the base 1206 that forms thereservoir 1208. The electrodes may extend or project into thereservoir 1208. One or more of theconductors 1290 also may extend into thereservoir 1208 to provide functionality not provided by the electrodes. A dielectric layer may partially cover the conductors and/or the electrodes. The counter electrodes may be used to balance the potential at one or more working electrode during the analysis. The balancing potential may be provided by forming the counter electrode from an inert material, such as carbon, and including a soluble redox species, such as ferricyanide, within thereservoir 1208. Alternatively, the balancing potential may be a reference potential achieved by forming the counter electrode from a reference redox couple, such as Ag/AgCl, to provide a combined reference-counter electrode. Thesample interface 1214 may have other electrodes and conductors. - The
measurement device 1202 includeselectrical circuitry 1216 connected to asensor interface 1218 and adisplay 1220. Theelectrical circuitry 1216 includes aprocessor 1222 connected to asignal generator 1224, anoptional temperature sensor 1226, and astorage medium 1228. - The
signal generator 1224 provides an electrical input signal to thesensor interface 1218 in response to theprocessor 1222. The electrical input signal may be transmitted by thesensor interface 1218 to thesample interface 1214 to apply the electrical input signal to the sample of the biological fluid. The electrical input signal may be transmitted through all or a portion of theconductors 1290 at thesample interface 1214. The electrical input signal may be a potential or current and may be constant, variable, or a combination thereof, such as when an AC signal is applied with a DC signal offset. The electrical input signal may be applied as a single pulse or in multiple pulses, sequences, or cycles. Thesignal generator 1224 also may record an output signal from the sensor interface as a generator-recorder. - The
signal generator 1224 may include the potentiostat ofFIG. 12B , which may switch between multiple independently addressable working and counter electrodes, or may include the multiple potentiostat system ofFIG. 12C. FIG. 12D represents a potentiostat that may be implemented in the signal generator to switch between four counter electrodes and an electrically connected working electrode.FIG. 12E represents a potentiostat implemented to switch between four working electrodes and an electrically connected counter electrode.FIG. 12F represents a potentiostat implemented to switch between four reference electrodes and an electrically connected working electrode. The one or more potentiostats may provide different operating potentials to thesample interface 1214. Thesignal generator 1224 may be configured where a function generator triggers gated wave inputs to the potentiostat. Thesignal generator 1224 may have other configurations. - The
optional temperature sensor 1226 determines the temperature of the sample in the reservoir of thetest sensor 1204. The temperature of the sample may be measured, calculated from the output signal, or presumed to be the same or similar to a measurement of the ambient temperature or the temperature of a device implementing the biosensor system. The temperature may be measured using a thermister, thermometer, or other temperature sensing device. Other techniques may be used to determine the sample temperature. - The
storage medium 1228 may be a magnetic, optical, or semiconductor memory, another storage device, or the like. Thestorage medium 1228 may be a fixed memory device, a removable memory device, such as a memory card, remotely accessed, or the like. - The
processor 1222 implements the analyte analysis and data treatment using computer readable software code and data stored in thestorage medium 1228. Theprocessor 1222 may start the analyte analysis in response to the presence of thetest sensor 1204 at thesensor interface 1218, the application of a sample to thetest sensor 1204, in response to user input, or the like. Theprocessor 1222 directs thesignal generator 1224 to provide the electrical input signal to thesensor interface 1218. Theprocessor 1222 may receive the sample temperature from theoptional temperature sensor 1226. - The
processor 1222 receives the output signal from thesensor interface 1218. The output signal is generated in response to the redox reaction of the measurable species in the sample. The electrical output signal from the test sensor may be a current (as generated by amperometry or voltammetry), a potential (as generated by potentiometry/galvanometry), or an accumulated charge (as generated by coulometry). The output signal is correlated with the concentration of one or more analytes in the sample using one or more correlation equations in theprocessor 1222. The results of the analyte analysis may be output to thedisplay 1220 and may be stored in thestorage medium 1228. - The correlation equations between analyte concentrations and output signals may be represented graphically, mathematically, a combination thereof, or the like. The correlation equations may be represented by a program number (PNA) table, another look-up table, or the like that is stored in the
storage medium 1228. Instructions regarding implementation of the analyte analysis may be provided by the computer readable software code stored in thestorage medium 1228. The code may be object code or any other code describing or controlling the functionality described herein. The data from the analyte analysis may be subjected to one or more data treatments, including the determination of decay rates, K constants, ratios, and the like in theprocessor 1222. - The
sensor interface 1218 hascontacts 1295 that connect or electrically communicate with theconductors 1290 in thesample interface 1214 of thetest sensor 1204. Thesensor interface 1218 transmits the electrical input signal from thesignal generator 1224 through a connector in thesensor interface 1218 to thecontacts 1295 in thesample interface 1214. Thesensor interface 1218 also transmits the output signal from the sample through thecontacts 1295 to theprocessor 1222 and/orsignal generator 1224. - The
display 1220 may be analog or digital. The display may be an LCD display adapted to displaying a numerical reading. - In use, a liquid sample for analysis is transferred into the
reservoir 1208 by introducing the liquid to thesample port 1212. The liquid sample flows through thesample port 1212, filling thereservoir 1208 while expelling the previously contained air. The liquid sample chemically reacts with the reagents deposited in the secondary analysis regions of thereservoir 1208. - The
test sensor 1202 is disposed adjacent to themeasurement device 1202. Adjacent includes positions where thesample interface 1214 is in electrical communication with thesensor interface 1208. Electrical communication includes the transfer of input and/or output signals between contacts in thesensor interface 1218 and theconductors 1290 in thesample interface 1214. -
FIG. 13 represents anelectrochemical analysis 1300 for determining the presence and/or concentration of at least one analyte in a sample. Insample introduction 1310, the sample is introduced to the test sensor. Inredox reaction 1320, a portion of the analyte in the sample undergoes a redox reaction. Inelectron transfer 1330, electrons are optionally transferred from the analyte to a mediator. In firstinput signal application 1340, an input signal is applied between a working and a first counter electrode. In secondinput signal application 1350, an input signal of a different potential is applied between a working and a second counter electrode. Insample determination 1350, the presence and/or concentration of one or more measurable species in the sample is determined from one or more output signals, and insample concentration transmission 1360, the determined measurable species concentration may be displayed, stored, further processed, and the like. - In the
sample introduction 1310, the sample is introduced to the sensor portion of the system, such as a test sensor. The test sensor includes at least one working and at least two counter electrodes. The electrodes may include one or more reagent composition layers. The working electrode may include a diffusion barrier layer that is integral to a reagent composition layer or that is distinct from the reagent composition layer. The diffusion barrier layer provides a porous space having an internal volume where a measurable species may reside. The pores of the diffusion barrier layer may be selected so that the measurable species may diffuse into the diffusion barrier layer, while physically larger sample constituents, such as red blood cells, are substantially excluded. When the working electrode includes a distinct diffusion barrier layer, the reagent layer may or may not be disposed on the diffusion barrier layer. Depending on the nature of theanalysis 1300, the conductors may serve as electrodes. In this aspect, the reagents may be present in the sample, such as if deposited adjacent the electrodes. - In the
redox reaction 1320 ofFIG. 13 , a portion of the analyte present in the sample is chemically or biochemically oxidized or reduced, such as by an oxidoreductase or similar species. This redox reaction occurs as the sample hydrates the reagents. Upon oxidation or reduction, electrons optionally may be transferred between the analyte and a mediator in theelectron transfer 1330. Thus, an ionized measurable species is formed, such as from the analyte or a mediator, having a sample concentration responsive to the analyte. It may be beneficial to provide an initial time delay, or "incubation period," for the reagents to react with the analyte. - In the first
input signal application 1340 ofFIG. 13 , the system applies an input signal to the sample using a first counter electrode. Input signals are electrical signals, such as current or potential, and may be a sequence of excitation pulses separated by relaxations. The system may apply one or more input signals to the sample, including those used to determine the presence and/or concentration of the analyte and those used to determine other factors, such as the hematocrit content of the sample or the fill state of the test sensor. - In addition to the first
input signal application 1340, an initial polling potential may be input before the firstinput signal application 1340 to determine the presence of the sample. A potential also may be applied between any pair of electrodes and/or conductors to remove material from the electrode and/or conductor surface, to alter the chemistry of an electrode, or to oxidize or reduce a portion of the charge transfer system. Such a potential may be applied before the analysis. - In the second
input signal application 1350 ofFIG. 13 , the system applies a second input signal at a different potential to the sample using a second counter electrode. The ability to select the working potential of multiple working electrodes and/or the ability to select the operating potential of multiple counter electrodes provides the biosensor system with the ability to perform multiple types of analysis. During an analysis, the potential between any pair of multiple working, counter, and/or reference electrodes may be measured to provide useful information. By providing the sample reservoir with multiple sequentially filled secondary analysis regions, the progress of reservoir filling by the sample may be monitored using the two or moreinput signal applications - In
sample determination 1360, the measurement device analyzes output signals responsive to the two input signals to determine the presence and/or concentration of at least one measurable species in the sample at each potential. If the oxidoreductase or similar species used in theredox reaction 1320 reacts with a single analyte, specificity may be provided to a portion of the generated electrical signal. As more than one measurable species may be ionized by different portions of the input signal, the presence, and/or concentration of multiple analytes, mediators, interferents, and the like may be determined. Additional current, time, and/or other values also may be analyzed. For example, the currents determined for one analyte, mediator, or interferent may be modified with the currents determined for another analyte, mediator, or interferent to increase the measurement performance of the system. - Gated input signals, such as gated amperometric, gated voltammetric, and/or combinations thereof, may be used to address the potential of a specific mediator and solve the linear equation set. When a test sensor having electrically independent counter electrodes and electrically connected working electrodes is used, for example, the concentrations of three different measurable species may be determined by solving equations (1) through (3):


where ilow, imedium and ihigh are currents from coupling with counter electrodes of low, medium and high potentials; A1, A2 and A3 are the concentrations of the three different measurable species; k1, k2 and k3 are proportionality constants that express the current difference between two of the operating potentials; and S and Int are the slope and intercept for each analyte calibration system, respectively. -
FIG. 14A represents the input signal from a sequential gated amperometric pulse sequence used in combination with a test sensor having independently addressable counter and working electrodes (WE1-WE4). In this instance, one working electrode operates at a time, and the input signal is sequentially input to each electrode pair. In this manner, a multi-potential potentiostat is not required to determine the output signal from multiple pairs of electrodes.FIG. 14B represents the input signal from a simultaneous gated amperometric pulse sequence used in combination with a test sensor having independently addressable counter and working electrodes (WE1-WE4). In this instance all four electrode pairs are simultaneously operated at the same potential for each excitation. While not shown in the figure, the input signal could be simultaneously applied to two or more of the electrodes while being sequentially applied to other electrodes. - By connecting multiple independently addressable counter electrodes to a current/voltage converter, the output currents resulting from the analysis may be measured separately. This operation may be combined with a gated input signal where one counter electrode is off, while a second counter electrode is on. The resulting cascade of measurement currents from independent counter electrodes provides a way to analyze multiple analytes and other components of the sample. Linear combinations of equations may be solved to determine the concentration and/or other parameters of individual analytes.
- Applied input signals may have voltages from 0.05 to 1.0 V, preferably from 0.1 to 0.8 V, and more preferably from 0.2 to 0.5 V. The input signals may be provided over a duration of from 0.01 second to 3 minutes, depending on the analyte or analytes of interest. For example, a glucose analysis may be complete in less than 5 seconds while other analytes may benefit from longer duration input signals. If the input signal includes multiple excitations and relaxations, the duration of each excitation may be from 0.01 to 7 seconds, preferably from 0.5 to 3 seconds, and more preferably from 0.1 to 2 seconds for glucose, for example. Other input signal and excitation durations may be used.
- In
sample concentration transmission 1370 ofFIG. 13 , the measurement device converts at least one measurable species concentration into a sample analyte concentration and may display, store for future reference, further process, and/or use one or more of the determined measurable species concentrations for additional calculations. For example, the value determined for one analyte, mediator, or interferent may be modified with the value determined for another analyte, mediator, or interferent to increase the measurement performance of the system. - A counter electrode having an oxidizable species present in the charge transfer system also may be used as a working electrode lacking the oxidoreductase, thus providing the ability to analyze for hematocrit and determine the background component of the output signal. The analyte concentration may be modified with this and other information to increase accuracy and/or precision. A counter electrode may be used as a working electrode during an open circuit to measure one or more hematocrit parameters. In another aspect, one or more output signals may be correlated with a calibration curve or look-up table to determine hematocrit bias or bias attributable to an interferent.
- Depending on the nature of the analyte, the concentration of one analyte may be used to alter the reading of another analyte. For example, when the concentration of a first analyte positively interferes with the concentration of a second analyte, the concentration of the first analyte may be subtracted from the concentration of the second analyte to increase the accuracy and/or precision of the concentration value determined for the second analyte.
-
FIG. 15 shows the results of averaging the results of up to four separate analyses for the same analyte to determine the concentration of the analyte in the sample. As shown in the graph, by increasing the number of separate analysis performed from one to three, 98% of the obtained concentration values fell within ±15% bias limit when compared to a reference YSI instrument. While the data underlying the graph was obtained from separate test sensors, test sensors having two or more secondary analysis regions may be configured to perform the same analysis in more than one secondary region in addition to analyzing for different analytes. Thus, multiple substantially chemically isolated secondary analysis regions may provide the benefits of signal averaging from a single test sensor. - The ability to perform the same analysis multiple times on a single test sensor may significantly increase the accuracy and/or precision of the determined analyte concentration. Thus, signal averaging made possible by performing the same analysis multiple times on the same test sensor may provide an enhancement in the signal-to-noise ratio for the test sensor by reducing random noise (as characterized by the standard deviation sd value) at the rate of 1/√n in relation to conventional sensor systems.
-
FIG. 16 depicts the current decays obtained when a gated amperometric input signal is simultaneously applied to eight individually addressable and substantially chemically isolated electrodes. The electrodes were configured in a multi-T-design with four working electrodes opposing four counter electrodes across the primary channel, such as previously depicted in FIG. 31. Each working electrode was formed with a reagent composition including 0.5% (w/w) HEC binder, 50 mL of the Structure I molecule, and 2 U/µL of the PQQ-GDH enzyme system in a phosphate buffer of pH 7. Each counter electrode was formed with a charge transfer system including 0.5% (w/w) HEC binder and substantiallypure ferricyanide 100 mM in phosphate buffer of pH 7. - To conduct the experiment, a sample including 100 mg/dL of glucose in phosphate buffer of pH 7 was introduced to the test sensor and a gated amperometric input signal was simultaneously applied across each of the four opposing electrode pairs. The gated input signal included two initial excitations having varying pulse widths followed by seven excitations having a pulse width of 0.375 seconds. The latter seven excitations were separated by one second relaxation periods. Toward the end of the excitation applied at the two second time point, for example, the four current values corresponding to each electrode pair (W1-C1, W2-C2, W3-C3, and W4-C4) are averaged. From this average of four current values, an analyte concentration of the sample may be determined using one or more correlation equations or a similar method. In this manner, the previously discussed accuracy and/or precision benefits obtained from averaging multiple analyses may be obtained from a single test sensor.
- While various embodiments of the invention have been described, it will be apparent to those of ordinary skill in the art that other embodiments and implementations are possible within the scope of the invention. Accordingly, the invention is not to be restricted except in light of the attached claims and their equivalents.
Claims (15)
- An analyte test sensor (600, 700), comprising:at least two substrates forming a reservoir, the reservoir including at least one primary area (610, 710), at least one first secondary analysis region, and at least one second secondary analysis region;at least one electrode pair having a working electrode (741, 742, 743, 744) and a counter electrode (731, 732, 733, 734),
the working electrode formed from a reagent composition and a first conductor disposed in the first secondary analysis region,
the counter electrode formed from a charge transfer system and a second conductor disposed in the second secondary analysis region, and where
the first secondary analysis region opposes the second secondary analysis region across the primary area (610, 710) or where the first and second secondary analysis regions are staggered on opposing sides of the primary area (610, 710);at least one sample port in fluid communication with the reservoir;a first vent in fluid communication with the first secondary analysis region; anda second vent in fluid communication with the second secondary analysis region. - The test sensor (600, 700) of claim 1, where the first secondary analysis region and the second secondary analysis region are substantially chemically isolated.
- The test sensor (600, 700) of any one of the preceding claims, where at least one of the secondary analysis regions branches from the primary area at an angle other than 90°, preferably at an angle of less than 90°.
- The test sensor (600, 700) of any one of the preceding claims, where the reservoir has a Y-channel design.
- The test sensor (600, 700) of any one of the preceding claims, where the reservoir is a multi-Y-channel design.
- The test sensor (600, 700) of any one of the preceding claims comprising more than one reservoir.
- The test sensor (600, 700) of any one of the preceding claims, where a straight line passing from the working electrode through the first secondary analysis region and through the primary area cannot be drawn through the second secondary analysis region to the counter electrode.
- The test sensor (600, 700) of any one of the preceding claims, where at least two counter electrodes are configured to operate at different potentials, where the different potentials are separated by at least 50 mV.
- The test sensor (600, 700) of claim 8, where the redox species of at least two counter electrodes are different, the difference selected from the group consisting of a metal versus an electroactive organic molecule and the elemental identity of a metal.
- The test sensor (600, 700) of claim 8, where the different potential configuration is provided by redox species having different ratios of the conjugates of a redox pair.
- The test sensor (600, 700) of claim 10, where the ratio of the conjugate of a redox pair is at least one of 9.5:0.5, 8:2, 5:5, 2:8, and 0.5:9.5, or where the ratio of the conjugate pair is at least one of 1:9, 1:1, and 9:1.
- The test sensor (600, 700) of any one of the preceding claims, further comprising at least one reference electrode.
- The test sensor (600, 700) of any one of the preceding claims, where at least one of the working and counter electrodes are independently addressable electrically, or where one of the working or counter electrodes are independently addressable electrically and the other of the working or counter electrodes are electrically connected.
- The test sensor (600, 700) of any one of the preceding claims, further comprising:a conductor disposed between the two substrates; andat least one portion of the reservoir including a sample port defined at least by the two substrates and an edge of the conductor, the edge of the conductor defining at least a first electrode.
- The test sensor (600, 700) of any one of the preceding claims, further comprising:first and second secondary analysis regions having a first electrode pair, where the first secondary analysis region includes a first counter electrode having a first redox species in electrical communication with a first conductor;third and fourth secondary analysis regions having a second electrode pair, where the third secondary analysis region includes a second counter electrode having a second redox species in electrical communication with a second conductor, where the second redox species is different than the first redox species; andwhen a sample consisting essentially of a pH 7 phosphate buffer, 0.1 M sodium phosphate, and 16% (w/w) polyvinyl pyrrolidone polymer having a weight average molecular weight of 2000 is introduced to the secondary analysis regions at an atmospheric relative humidity of 45% and at a temperature of 22° C, mixing of the first and the second redox species is not observed by an analysis technique selected from the group consisting of cyclic voltammetry and chemoamperometry within 12 minutes or 16 minutes, or preferably within 1.4 minutes, if the test sensor is not mechanically disturbed.
Priority Applications (1)
| Application Number | Priority Date | Filing Date | Title |
|---|---|---|---|
| PL12183634T PL2535706T3 (en) | 2007-09-24 | 2008-09-24 | Multi-electrode test sensor |
Applications Claiming Priority (2)
| Application Number | Priority Date | Filing Date | Title |
|---|---|---|---|
| US97482307P | 2007-09-24 | 2007-09-24 | |
| EP08832808.3A EP2205964B1 (en) | 2007-09-24 | 2008-09-24 | Multi-region and potential test sensors, methods, and systems |
Related Parent Applications (3)
| Application Number | Title | Priority Date | Filing Date |
|---|---|---|---|
| EP08832808.3A Division-Into EP2205964B1 (en) | 2007-09-24 | 2008-09-24 | Multi-region and potential test sensors, methods, and systems |
| EP08832808.3A Division EP2205964B1 (en) | 2007-09-24 | 2008-09-24 | Multi-region and potential test sensors, methods, and systems |
| EP08832808.3 Division | 2008-09-24 |
Publications (2)
| Publication Number | Publication Date |
|---|---|
| EP2535706A1 true EP2535706A1 (en) | 2012-12-19 |
| EP2535706B1 EP2535706B1 (en) | 2015-08-12 |
Family
ID=40299411
Family Applications (7)
| Application Number | Title | Priority Date | Filing Date |
|---|---|---|---|
| EP08832808.3A Active EP2205964B1 (en) | 2007-09-24 | 2008-09-24 | Multi-region and potential test sensors, methods, and systems |
| EP12183629.0A Active EP2535703B1 (en) | 2007-09-24 | 2008-09-24 | Multi-electrode biosensor system |
| EP19216481.2A Withdrawn EP3660499A1 (en) | 2007-09-24 | 2008-09-24 | Multi-electrode test sensor |
| EP12183634.0A Active EP2535706B1 (en) | 2007-09-24 | 2008-09-24 | Multi-electrode test sensor |
| EP12183631.6A Active EP2535705B1 (en) | 2007-09-24 | 2008-09-24 | Multi-electrode test method |
| EP17158596.1A Active EP3193162B1 (en) | 2007-09-24 | 2008-09-24 | Multi-electrode biosensor system |
| EP12183630.8A Active EP2535704B1 (en) | 2007-09-24 | 2008-09-24 | Multi-electrode test method |
Family Applications Before (3)
| Application Number | Title | Priority Date | Filing Date |
|---|---|---|---|
| EP08832808.3A Active EP2205964B1 (en) | 2007-09-24 | 2008-09-24 | Multi-region and potential test sensors, methods, and systems |
| EP12183629.0A Active EP2535703B1 (en) | 2007-09-24 | 2008-09-24 | Multi-electrode biosensor system |
| EP19216481.2A Withdrawn EP3660499A1 (en) | 2007-09-24 | 2008-09-24 | Multi-electrode test sensor |
Family Applications After (3)
| Application Number | Title | Priority Date | Filing Date |
|---|---|---|---|
| EP12183631.6A Active EP2535705B1 (en) | 2007-09-24 | 2008-09-24 | Multi-electrode test method |
| EP17158596.1A Active EP3193162B1 (en) | 2007-09-24 | 2008-09-24 | Multi-electrode biosensor system |
| EP12183630.8A Active EP2535704B1 (en) | 2007-09-24 | 2008-09-24 | Multi-electrode test method |
Country Status (13)
| Country | Link |
|---|---|
| US (2) | US9846136B2 (en) |
| EP (7) | EP2205964B1 (en) |
| JP (4) | JP5523323B2 (en) |
| CN (3) | CN107576707B (en) |
| BR (1) | BRPI0817189A2 (en) |
| CA (3) | CA2700507C (en) |
| DK (1) | DK2205964T3 (en) |
| ES (5) | ES2779630T3 (en) |
| HR (1) | HRP20150979T1 (en) |
| MX (1) | MX2010003205A (en) |
| PL (4) | PL2535705T3 (en) |
| RU (1) | RU2490622C2 (en) |
| WO (1) | WO2009042631A2 (en) |
Cited By (1)
| Publication number | Priority date | Publication date | Assignee | Title |
|---|---|---|---|---|
| WO2019012262A1 (en) * | 2017-07-10 | 2019-01-17 | Bailrigg Diagnostics Limited | Biomarker sensor apparatus and method of measuring biomarker in blood |
Families Citing this family (87)
| Publication number | Priority date | Publication date | Assignee | Title |
|---|---|---|---|---|
| US8771183B2 (en) | 2004-02-17 | 2014-07-08 | Abbott Diabetes Care Inc. | Method and system for providing data communication in continuous glucose monitoring and management system |
| AU2003303597A1 (en) | 2002-12-31 | 2004-07-29 | Therasense, Inc. | Continuous glucose monitoring system and methods of use |
| US8066639B2 (en) | 2003-06-10 | 2011-11-29 | Abbott Diabetes Care Inc. | Glucose measuring device for use in personal area network |
| US7766829B2 (en) | 2005-11-04 | 2010-08-03 | Abbott Diabetes Care Inc. | Method and system for providing basal profile modification in analyte monitoring and management systems |
| US7620438B2 (en) | 2006-03-31 | 2009-11-17 | Abbott Diabetes Care Inc. | Method and system for powering an electronic device |
| US8226891B2 (en) | 2006-03-31 | 2012-07-24 | Abbott Diabetes Care Inc. | Analyte monitoring devices and methods therefor |
| US20080199894A1 (en) | 2007-02-15 | 2008-08-21 | Abbott Diabetes Care, Inc. | Device and method for automatic data acquisition and/or detection |
| US8123686B2 (en) | 2007-03-01 | 2012-02-28 | Abbott Diabetes Care Inc. | Method and apparatus for providing rolling data in communication systems |
| EP2146622B1 (en) | 2007-04-14 | 2016-05-11 | Abbott Diabetes Care Inc. | Method and apparatus for providing dynamic multi-stage signal amplification in a medical device |
| US8456301B2 (en) | 2007-05-08 | 2013-06-04 | Abbott Diabetes Care Inc. | Analyte monitoring system and methods |
| US8665091B2 (en) | 2007-05-08 | 2014-03-04 | Abbott Diabetes Care Inc. | Method and device for determining elapsed sensor life |
| US8461985B2 (en) | 2007-05-08 | 2013-06-11 | Abbott Diabetes Care Inc. | Analyte monitoring system and methods |
| US7928850B2 (en) | 2007-05-08 | 2011-04-19 | Abbott Diabetes Care Inc. | Analyte monitoring system and methods |
| WO2008157821A1 (en) | 2007-06-21 | 2008-12-24 | Abbott Diabetes Care, Inc. | Health monitor |
| AU2008265541B2 (en) | 2007-06-21 | 2014-07-17 | Abbott Diabetes Care, Inc. | Health management devices and methods |
| CN107576707B (en) * | 2007-09-24 | 2020-03-13 | 安晟信医疗科技控股公司 | Analyte test sensor, system thereof and method for measuring at least one analyte |
| US9402544B2 (en) | 2009-02-03 | 2016-08-02 | Abbott Diabetes Care Inc. | Analyte sensor and apparatus for insertion of the sensor |
| WO2010127050A1 (en) | 2009-04-28 | 2010-11-04 | Abbott Diabetes Care Inc. | Error detection in critical repeating data in a wireless sensor system |
| US9184490B2 (en) | 2009-05-29 | 2015-11-10 | Abbott Diabetes Care Inc. | Medical device antenna systems having external antenna configurations |
| BRPI1011713A2 (en) * | 2009-06-05 | 2016-03-22 | Univ Arizona | integrated optoelectrochemical sensor for nitrogen oxides in gaseous samples |
| JP5629900B2 (en) | 2009-06-16 | 2014-11-26 | カンブリアン イノベーションズ インコーポレイデッド | Systems and devices for treating and monitoring water, wastewater, and other biodegradable materials |
| EP2473963A4 (en) | 2009-08-31 | 2014-01-08 | Abbott Diabetes Care Inc | Medical devices and methods |
| EP2473099A4 (en) | 2009-08-31 | 2015-01-14 | Abbott Diabetes Care Inc | Analyte monitoring system and methods for managing power and noise |
| WO2011026147A1 (en) | 2009-08-31 | 2011-03-03 | Abbott Diabetes Care Inc. | Analyte signal processing device and methods |
| US20120028845A1 (en) * | 2009-10-04 | 2012-02-02 | Ross Teggatz | Sensor for Detecting Biological Agents in Fluid |
| WO2011072065A2 (en) | 2009-12-08 | 2011-06-16 | Intact Labs, Llc | Microbially-based sensors for environmental monitoring |
| WO2011111604A1 (en) * | 2010-03-09 | 2011-09-15 | アークレイ株式会社 | Electrochemical sensor |
| US20110290668A1 (en) * | 2010-05-27 | 2011-12-01 | Lifescan Scotland Limited | Analytical test strip with crossroads exposed electrode configuration |
| JP5580934B2 (en) * | 2010-06-30 | 2014-08-27 | エフ ホフマン−ラ ロッシュ アクチェン ゲゼルシャフト | Method for manufacturing a dual biosensor test strip |
| JP5873085B2 (en) | 2010-07-21 | 2016-03-01 | カンブリアン イノベーション エルエルシー | Bio-electrochemical system for treating wastewater and method for treating acid gas |
| US10851003B2 (en) | 2010-07-21 | 2020-12-01 | Matthew Silver | Denitrification and pH control using bio-electrochemical systems |
| US9084570B2 (en) * | 2010-10-08 | 2015-07-21 | Roche Diagnostics Operations, Inc. | Electrochemical sensor having symmetrically distributed analyte sensitive areas |
| WO2012054629A2 (en) | 2010-10-19 | 2012-04-26 | Cambrian Innovation | Bio-electrochemical systems |
| CA2827196A1 (en) | 2011-02-28 | 2012-11-15 | Jai Karan | Devices, systems, and methods associated with analyte monitoring devices and devices incorporating the same |
| CN103843184B (en) * | 2011-06-14 | 2016-09-14 | 凯博瑞创新公司 | Biological aerobic quantity sensor |
| KR101363020B1 (en) * | 2011-10-31 | 2014-02-26 | 주식회사 세라젬메디시스 | A biosensor for multiple reaction |
| US9069536B2 (en) | 2011-10-31 | 2015-06-30 | Abbott Diabetes Care Inc. | Electronic devices having integrated reset systems and methods thereof |
| AU2012335830B2 (en) * | 2011-11-07 | 2017-05-04 | Abbott Diabetes Care Inc. | Analyte monitoring device and methods |
| DE102012101254A1 (en) * | 2012-02-16 | 2013-08-22 | Endress + Hauser Conducta Gesellschaft für Mess- und Regeltechnik mbH + Co. KG | Measuring arrangement and method for detecting an analyte concentration in a measuring medium |
| TWI513978B (en) * | 2012-06-08 | 2015-12-21 | Hmd Biomedical Inc | Test strip, detecting device and detection method |
| AU2013280268B2 (en) | 2012-06-28 | 2015-02-26 | Siemens Healthcare Diagnostics Inc. | Reader device and method of signal amplification |
| US8992750B1 (en) | 2012-07-02 | 2015-03-31 | Roche Diagnostics Operations, Inc. | Biosensor and methods for manufacturing |
| GB2505694B (en) * | 2012-09-07 | 2017-03-22 | Lifescan Scotland Ltd | Electrochemical-based analytical test strip with bare interferent electrodes |
| US9968306B2 (en) | 2012-09-17 | 2018-05-15 | Abbott Diabetes Care Inc. | Methods and apparatuses for providing adverse condition notification with enhanced wireless communication range in analyte monitoring systems |
| JP6182155B2 (en) * | 2012-12-12 | 2017-08-16 | パナソニックヘルスケアホールディングス株式会社 | Blood component measuring device, blood component measuring method, and biosensor |
| US20140262833A1 (en) * | 2013-03-14 | 2014-09-18 | Magellan Diagnostics, Inc. | Sensor with a bifurcated flowpath |
| US10898116B2 (en) * | 2013-03-15 | 2021-01-26 | Cambridge Medical Technologies LLC | Methods of manufacture to optimize performance of transdermal sampling and analysis device |
| US9458488B2 (en) * | 2013-03-15 | 2016-10-04 | Nanomix, Inc. | Point of care sensor systems |
| EP2990784B1 (en) * | 2013-04-26 | 2017-12-20 | Panasonic Healthcare Holdings Co., Ltd. | Liquid sample measurement method |
| US9395319B2 (en) | 2013-05-02 | 2016-07-19 | Lifescan Scotland Limited | Analytical test meter |
| US9291593B2 (en) * | 2013-11-22 | 2016-03-22 | Cilag Gmbh International | Dual-chamber analytical test strip |
| US9855359B2 (en) | 2013-12-23 | 2018-01-02 | Verily Life Sciences Llc | Analyte sensors with ethylene oxide immunity |
| US9500616B2 (en) * | 2013-12-23 | 2016-11-22 | Cilag Gmbh International | Multi-orientation test strip |
| JP6228018B2 (en) * | 2014-01-10 | 2017-11-08 | 株式会社Soken | Particulate matter detection element, particulate matter detection sensor, and method for manufacturing particulate matter detection element |
| TWI512287B (en) * | 2014-03-31 | 2015-12-11 | Taidoc Technology Corp | Electrochemical biosensing meter, system and measuring method for analyte measurement incorporating filled sample detection |
| US9322797B1 (en) * | 2014-04-30 | 2016-04-26 | Helvetia Wireless Llc | Systems and methods for detecting a liquid |
| US9506886B1 (en) | 2014-04-30 | 2016-11-29 | Helvetia Wireless Llc | Systems and methods for detecting a liquid |
| US9453812B2 (en) * | 2014-06-24 | 2016-09-27 | Lifescan Scotland Limited | End-fill electrochemical-based analytical test strip with perpendicular intersecting sample-receiving chambers |
| KR102247666B1 (en) * | 2014-08-22 | 2021-05-03 | 삼성전자주식회사 | An electrochemical biosensor |
| ES2883115T3 (en) * | 2014-08-25 | 2021-12-07 | Hoffmann La Roche | Two-electrode test strip that compensates for interference |
| GB201507510D0 (en) * | 2015-04-30 | 2015-06-17 | Inside Biometrics Ltd | Electrochemical Test Device |
| JP6126325B1 (en) * | 2016-02-25 | 2017-05-10 | パナソニックヘルスケアホールディングス株式会社 | Biosensor |
| EP3220137B1 (en) * | 2016-03-14 | 2019-01-23 | Roche Diabetes Care GmbH | Method for detecting an interferent contribution in a biosensor |
| US11255834B2 (en) * | 2016-03-22 | 2022-02-22 | Conductive Technologies, Inc. | Physical characteristic determination of a biological sample |
| GB2550967A (en) * | 2016-06-03 | 2017-12-06 | Brandenburg (Uk) Ltd | Sensing of objects |
| CN109690304A (en) * | 2016-07-12 | 2019-04-26 | 安晟信医疗科技控股公司 | The method that electrochemical analysis is carried out by using the alternating output signal from two electrodes |
| CN109804240A (en) * | 2016-10-05 | 2019-05-24 | 豪夫迈·罗氏有限公司 | Detection reagent and electrode arrangement and its application method for multiple analyte diagnostic test element |
| US11782055B2 (en) * | 2016-10-20 | 2023-10-10 | EnLiSense, LLC | Multi-configurable sensing array and methods of using same |
| CN110249219B (en) * | 2016-12-05 | 2022-08-23 | 安晟信医疗科技控股公司 | Risk factor monitoring |
| DE102017200143A1 (en) * | 2017-01-09 | 2018-07-12 | Robert Bosch Gmbh | magnetometer |
| WO2018144018A1 (en) * | 2017-02-03 | 2018-08-09 | Hewlett-Packard Development Company, L.P. | Cassettes with offset vias |
| EP3602074A1 (en) * | 2017-03-22 | 2020-02-05 | Aalto University Foundation SR | Electrochemical assay for the detection of opioids |
| GB2564843A (en) * | 2017-07-04 | 2019-01-30 | Peter Francis Turner Anthony | Addressable systems for monitoring metabolic pathways |
| US20190056345A1 (en) * | 2017-08-16 | 2019-02-21 | Tyson Bioresearch Inc. | Method of operation of a meter |
| CN110869746B (en) * | 2017-08-17 | 2023-08-11 | 雅培医护站股份有限公司 | Techniques for performing optical and electrochemical assays using universal circuitry |
| EP3457121A1 (en) * | 2017-09-18 | 2019-03-20 | Roche Diabetes Care GmbH | Electrochemical sensor and sensor system for detecting at least one analyte |
| EP3710790A4 (en) * | 2017-11-17 | 2021-01-20 | Siemens Healthcare Diagnostics, Inc. | Sensor assembly and method of using same |
| JP7236860B2 (en) * | 2018-03-26 | 2023-03-10 | 日立Astemo株式会社 | voltage detector |
| CN108872342B (en) * | 2018-08-23 | 2020-07-28 | 佛山科学技术学院 | Electrochemical molecular imprinting sensor |
| US20200237275A1 (en) * | 2019-01-28 | 2020-07-30 | Abbott Diabetes Care Inc. | Analyte sensors and sensing methods featuring dual detection of glucose and ketones |
| EP3926338A4 (en) * | 2019-02-15 | 2022-03-30 | PHC Holdings Corporation | Biosensor |
| US11633129B2 (en) | 2019-04-05 | 2023-04-25 | Cambridge Medical Technologies LLC | Non-invasive transdermal sampling and analysis device incorporating redox cofactors |
| US11375931B2 (en) | 2019-08-08 | 2022-07-05 | Cambridge Medical Technologies LLC | Non-invasive transdermal sampling and analysis device incorporating an electrochemical bioassay |
| EP4200597A2 (en) * | 2020-08-21 | 2023-06-28 | Meso Scale Technologies, LLC | Electrochemical cells with auxiliary electrodes having a defined interface potential and methods of using them |
| CN113588749B (en) * | 2021-07-16 | 2022-11-08 | 重庆云芯医联科技有限公司 | Creatinine test paper and preparation method thereof |
| KR102644803B1 (en) * | 2021-11-17 | 2024-03-08 | 한국과학기술원 | Method and Apparatus for Electrochemically Extracting Metabolites Using Nanotransfer Printing-based SERS Device |
| DE102022107214A1 (en) * | 2022-03-28 | 2023-09-28 | Senslab - Gesellschaft Zur Entwicklung Und Herstellung Bioelektrochemischer Sensoren Mbh | Method and sensor for determining a plasma-related analyte concentration in whole blood |
Citations (6)
| Publication number | Priority date | Publication date | Assignee | Title |
|---|---|---|---|---|
| US5393615A (en) | 1994-02-03 | 1995-02-28 | Miles Inc. | Mediators suitable for the electrochemical regeneration of NADH, NADPH or analogs thereof |
| US5498542A (en) | 1994-09-29 | 1996-03-12 | Bayer Corporation | Electrode mediators for regeneration of NADH and NADPH |
| US5520786A (en) | 1995-06-06 | 1996-05-28 | Bayer Corporation | Mediators suitable for the electrochemical regeneration of NADH, NADPH or analogs thereof |
| DE202005020335U1 (en) * | 2005-12-28 | 2006-05-11 | Health & Life Co., Ltd., Chung-Ho | Biosensor for simultaneous determination of several biochemical materials has micro channel connected to specimen carrier, various reaction enzyme zones at ends, working, counter electrodes on substrate connected to reaction enzyme zones |
| EP1707953A1 (en) * | 2003-12-04 | 2006-10-04 | Matsushita Electric Industrial Co., Ltd. | HEMATOCRIT (Htc) MEASURING METHOD, SENSOR USED FOR SAME, AND MEASURING INSTRUMENT |
| US20070202606A1 (en) * | 2004-02-16 | 2007-08-30 | Michael Noble | Devices And Methods For Measuring Clinically Relevant Analytes In Fluids |
Family Cites Families (48)
| Publication number | Priority date | Publication date | Assignee | Title |
|---|---|---|---|---|
| JPH0658338B2 (en) * | 1988-05-18 | 1994-08-03 | 松下電器産業株式会社 | Biosensor |
| WO1989009397A1 (en) * | 1988-03-31 | 1989-10-05 | Matsushita Electric Industrial Co., Ltd. | Biosensor and process for its production |
| JPH04160354A (en) * | 1990-10-24 | 1992-06-03 | New Japan Radio Co Ltd | Biosensor |
| JPH04264246A (en) * | 1991-02-19 | 1992-09-21 | Matsushita Electric Ind Co Ltd | Biosensor |
| IE72524B1 (en) | 1994-11-04 | 1997-04-23 | Elan Med Tech | Analyte-controlled liquid delivery device and analyte monitor |
| US6153069A (en) | 1995-02-09 | 2000-11-28 | Tall Oak Ventures | Apparatus for amperometric Diagnostic analysis |
| US5620579A (en) | 1995-05-05 | 1997-04-15 | Bayer Corporation | Apparatus for reduction of bias in amperometric sensors |
| AUPN661995A0 (en) * | 1995-11-16 | 1995-12-07 | Memtec America Corporation | Electrochemical cell 2 |
| JP3394262B2 (en) | 1997-02-06 | 2003-04-07 | セラセンス、インク. | Small volume in vitro analyte sensor |
| CA2294610A1 (en) | 1997-06-16 | 1998-12-23 | George Moshe Katz | Methods of calibrating and testing a sensor for in vivo measurement of an analyte and devices for use in such methods |
| US5906921A (en) | 1997-09-29 | 1999-05-25 | Matsushita Electric Industrial Co., Ltd. | Biosensor and method for quantitative measurement of a substrate using the same |
| JP3245103B2 (en) * | 1997-09-29 | 2002-01-07 | 松下電器産業株式会社 | Biosensor and Substrate Quantification Method Using It |
| JP3441993B2 (en) * | 1999-01-27 | 2003-09-02 | 松下電器産業株式会社 | Cholesterol sensor |
| JP4050434B2 (en) | 1999-11-29 | 2008-02-20 | 松下電器産業株式会社 | Sample discrimination method |
| CN1432130A (en) * | 2000-03-08 | 2003-07-23 | 糖尿病诊断公司 | Rapid response glucose sensor |
| RU2267120C2 (en) * | 2000-07-14 | 2005-12-27 | Лайфскен, Инк. | Electrochemical mode of measuring of speed of chemical reactions |
| AU2002211389A1 (en) * | 2000-10-03 | 2002-04-15 | California Institute Of Technology | Microfluidic devices and methods of use |
| EP1369684A4 (en) | 2001-01-17 | 2009-07-22 | Arkray Inc | Quantitative analyzing method and quantitative analyzer using sensor |
| US6984307B2 (en) | 2001-10-05 | 2006-01-10 | Stephen Eliot Zweig | Dual glucose-hydroxybutyrate analytical sensors |
| US6946299B2 (en) * | 2002-04-25 | 2005-09-20 | Home Diagnostics, Inc. | Systems and methods for blood glucose sensing |
| US6743635B2 (en) * | 2002-04-25 | 2004-06-01 | Home Diagnostics, Inc. | System and methods for blood glucose sensing |
| JP2004117342A (en) * | 2002-09-03 | 2004-04-15 | Matsushita Electric Ind Co Ltd | Biosensor and measuring method using the same |
| EP1396717A1 (en) * | 2002-09-03 | 2004-03-10 | Matsushita Electric Industrial Co., Ltd. | Biosensor and measuring method using the same |
| US7132041B2 (en) * | 2003-02-11 | 2006-11-07 | Bayer Healthcare Llc | Methods of determining the concentration of an analyte in a fluid test sample |
| FI20030463A0 (en) * | 2003-03-28 | 2003-03-28 | Ani Biotech Oy | Multichannel test instrument, method of its manufacture and its use |
| BRPI0411695A (en) * | 2003-06-20 | 2006-09-19 | Hoffmann La Roche | devices and methods related to electrochemical biosensors |
| JP4334969B2 (en) * | 2003-10-02 | 2009-09-30 | パナソニック株式会社 | Blood component analysis sensor |
| WO2005040407A1 (en) | 2003-10-24 | 2005-05-06 | Bayer Healthcare Llc | Enzymatic electrochemical biosensor |
| US7655119B2 (en) * | 2003-10-31 | 2010-02-02 | Lifescan Scotland Limited | Meter for use in an improved method of reducing interferences in an electrochemical sensor using two different applied potentials |
| EP3273232A2 (en) * | 2003-12-04 | 2018-01-24 | Panasonic Healthcare Holdings Co., Ltd. | Method of measuring blood component, sensor used in the method, and measuring device |
| JP2007523326A (en) | 2004-02-06 | 2007-08-16 | バイエル・ヘルスケア・エルエルシー | Oxidizable species as internal standards for biosensors and methods of use |
| CN101354392A (en) * | 2004-03-01 | 2009-01-28 | 松下电器产业株式会社 | Biosensor, biosensor chip, and biosensor device |
| DE602004011688D1 (en) | 2004-03-05 | 2008-03-20 | Egomedical Swiss Ag | ANALYSIS TEST SYSTEM FOR DETERMINING THE CONCENTRATION OF AN ANALYTE IN A PHYSIOLOGICAL LIQUID |
| CN1243109C (en) * | 2004-03-22 | 2006-02-22 | 复旦大学 | Microchip with multichannel electrodes, preparation method and application |
| CN1938590B (en) | 2004-04-19 | 2010-05-05 | 松下电器产业株式会社 | Method for measuring blood components and biosensor and measuring instrument for use therein |
| EA010662B1 (en) | 2004-08-13 | 2008-10-30 | Эгомедикаль Технологиз Аг | Analyte test system for determining the concentration of an analyte in a physiological or aqueous fluid |
| EP1804912A2 (en) * | 2004-10-05 | 2007-07-11 | Dartmouth College | Apparatus and method for modulating neurochemical levels in the brain |
| WO2006116616A2 (en) | 2005-04-26 | 2006-11-02 | Applera Corporation | Systems and methods for multiple analyte detection |
| ES2717135T3 (en) | 2005-07-20 | 2019-06-19 | Ascensia Diabetes Care Holdings Ag | Method to signal the user to add an additional sample to a test strip, method to measure the temperature of a sample and methods to determine the concentration of an analyte based on controlled amperometry |
| CN101273266B (en) | 2005-09-30 | 2012-08-22 | 拜尔健康护理有限责任公司 | Gated voltammetry |
| JP3120375U (en) * | 2006-01-16 | 2006-03-30 | 合世生醫科技股▲分▼有限公司 | Microchannel sensor test piece capable of simultaneously examining various types of human physiological information |
| CA2643163C (en) * | 2006-02-27 | 2020-01-28 | Bayer Healthcare Llc | Temperature-adjusted analyte determination for biosensor systems |
| GB0607205D0 (en) * | 2006-04-10 | 2006-05-17 | Diagnoswiss Sa | Miniaturised biosensor with optimized anperimetric detection |
| WO2008044530A1 (en) * | 2006-10-05 | 2008-04-17 | Panasonic Corporation | Multicomponent analysis sensor and method of measuring multiple components |
| JP2008096163A (en) * | 2006-10-06 | 2008-04-24 | Matsushita Electric Ind Co Ltd | Instrument for measuring atp (adenosine triphosphate) |
| WO2008047843A1 (en) | 2006-10-19 | 2008-04-24 | Panasonic Corporation | Method for measuring hematocrit value of blood sample, method for measuring concentration of analyte in blood sample, sensor chip and sensor unit |
| US7749766B2 (en) | 2007-01-12 | 2010-07-06 | Nova Biomedical Corporation | Bilirubin sensor |
| CN107576707B (en) * | 2007-09-24 | 2020-03-13 | 安晟信医疗科技控股公司 | Analyte test sensor, system thereof and method for measuring at least one analyte |
-
2008
- 2008-09-24 CN CN201710637614.4A patent/CN107576707B/en active Active
- 2008-09-24 RU RU2010116159/04A patent/RU2490622C2/en active
- 2008-09-24 CA CA2700507A patent/CA2700507C/en not_active Expired - Fee Related
- 2008-09-24 JP JP2010527096A patent/JP5523323B2/en active Active
- 2008-09-24 ES ES17158596T patent/ES2779630T3/en active Active
- 2008-09-24 ES ES12183634.0T patent/ES2546777T3/en active Active
- 2008-09-24 ES ES12183631.6T patent/ES2636676T3/en active Active
- 2008-09-24 MX MX2010003205A patent/MX2010003205A/en active IP Right Grant
- 2008-09-24 BR BRPI0817189 patent/BRPI0817189A2/en not_active IP Right Cessation
- 2008-09-24 PL PL12183631T patent/PL2535705T3/en unknown
- 2008-09-24 DK DK08832808.3T patent/DK2205964T3/en active
- 2008-09-24 WO PCT/US2008/077434 patent/WO2009042631A2/en active Application Filing
- 2008-09-24 EP EP08832808.3A patent/EP2205964B1/en active Active
- 2008-09-24 EP EP12183629.0A patent/EP2535703B1/en active Active
- 2008-09-24 PL PL08832808T patent/PL2205964T3/en unknown
- 2008-09-24 EP EP19216481.2A patent/EP3660499A1/en not_active Withdrawn
- 2008-09-24 EP EP12183634.0A patent/EP2535706B1/en active Active
- 2008-09-24 PL PL12183630T patent/PL2535704T3/en unknown
- 2008-09-24 EP EP12183631.6A patent/EP2535705B1/en active Active
- 2008-09-24 ES ES08832808.3T patent/ES2547493T3/en active Active
- 2008-09-24 CN CN200880114906.9A patent/CN101849180B/en active Active
- 2008-09-24 EP EP17158596.1A patent/EP3193162B1/en active Active
- 2008-09-24 CA CA2899469A patent/CA2899469C/en not_active Expired - Fee Related
- 2008-09-24 EP EP12183630.8A patent/EP2535704B1/en active Active
- 2008-09-24 ES ES12183630.8T patent/ES2547574T3/en active Active
- 2008-09-24 PL PL12183634T patent/PL2535706T3/en unknown
- 2008-09-24 CN CN202010095973.3A patent/CN111505091A/en active Pending
- 2008-09-24 CA CA2984510A patent/CA2984510C/en not_active Expired - Fee Related
-
2010
- 2010-03-22 US US12/728,457 patent/US9846136B2/en active Active
-
2014
- 2014-02-03 JP JP2014018552A patent/JP5944934B2/en active Active
-
2015
- 2015-09-16 HR HRP20150979TT patent/HRP20150979T1/en unknown
- 2015-12-10 JP JP2015240876A patent/JP6150261B2/en active Active
-
2016
- 2016-06-27 JP JP2016126391A patent/JP6150262B2/en active Active
-
2017
- 2017-11-10 US US15/809,365 patent/US10895550B2/en active Active
Patent Citations (6)
| Publication number | Priority date | Publication date | Assignee | Title |
|---|---|---|---|---|
| US5393615A (en) | 1994-02-03 | 1995-02-28 | Miles Inc. | Mediators suitable for the electrochemical regeneration of NADH, NADPH or analogs thereof |
| US5498542A (en) | 1994-09-29 | 1996-03-12 | Bayer Corporation | Electrode mediators for regeneration of NADH and NADPH |
| US5520786A (en) | 1995-06-06 | 1996-05-28 | Bayer Corporation | Mediators suitable for the electrochemical regeneration of NADH, NADPH or analogs thereof |
| EP1707953A1 (en) * | 2003-12-04 | 2006-10-04 | Matsushita Electric Industrial Co., Ltd. | HEMATOCRIT (Htc) MEASURING METHOD, SENSOR USED FOR SAME, AND MEASURING INSTRUMENT |
| US20070202606A1 (en) * | 2004-02-16 | 2007-08-30 | Michael Noble | Devices And Methods For Measuring Clinically Relevant Analytes In Fluids |
| DE202005020335U1 (en) * | 2005-12-28 | 2006-05-11 | Health & Life Co., Ltd., Chung-Ho | Biosensor for simultaneous determination of several biochemical materials has micro channel connected to specimen carrier, various reaction enzyme zones at ends, working, counter electrodes on substrate connected to reaction enzyme zones |
Non-Patent Citations (1)
| Title |
|---|
| "Oxford Dictionary of Biochemistry and Molecular Biology", 1997, OXFORD UNIVERSITY PRESS, pages: 161,476, |
Cited By (1)
| Publication number | Priority date | Publication date | Assignee | Title |
|---|---|---|---|---|
| WO2019012262A1 (en) * | 2017-07-10 | 2019-01-17 | Bailrigg Diagnostics Limited | Biomarker sensor apparatus and method of measuring biomarker in blood |
Also Published As
Similar Documents
| Publication | Publication Date | Title |
|---|---|---|
| US10895550B2 (en) | Multi-region and potential test sensors, methods, and systems | |
| AU2006272909B2 (en) | Gated amperometry | |
| US8871069B2 (en) | Low total salt reagent compositions and systems for biosensors | |
| AU2014218413A1 (en) | Gated amperometry |
Legal Events
| Date | Code | Title | Description |
|---|---|---|---|
| PUAI | Public reference made under article 153(3) epc to a published international application that has entered the european phase |
Free format text: ORIGINAL CODE: 0009012 |
|
| AC | Divisional application: reference to earlier application |
Ref document number: 2205964 Country of ref document: EP Kind code of ref document: P |
|
| AK | Designated contracting states |
Kind code of ref document: A1 Designated state(s): AT BE BG CH CY CZ DE DK EE ES FI FR GB GR HR HU IE IS IT LI LT LU LV MC MT NL NO PL PT RO SE SI SK TR |
|
| 17P | Request for examination filed |
Effective date: 20130619 |
|
| RBV | Designated contracting states (corrected) |
Designated state(s): AT BE BG CH CY CZ DE DK EE ES FI FR GB GR HR HU IE IS IT LI LT LU LV MC MT NL NO PL PT RO SE SI SK TR |
|
| 17Q | First examination report despatched |
Effective date: 20130724 |
|
| RAP1 | Party data changed (applicant data changed or rights of an application transferred) |
Owner name: BAYER HEALTHCARE LLC |
|
| GRAP | Despatch of communication of intention to grant a patent |
Free format text: ORIGINAL CODE: EPIDOSNIGR1 |
|
| INTG | Intention to grant announced |
Effective date: 20150305 |
|
| GRAP | Despatch of communication of intention to grant a patent |
Free format text: ORIGINAL CODE: EPIDOSNIGR1 |
|
| GRAS | Grant fee paid |
Free format text: ORIGINAL CODE: EPIDOSNIGR3 |
|
| GRAA | (expected) grant |
Free format text: ORIGINAL CODE: 0009210 |
|
| INTG | Intention to grant announced |
Effective date: 20150701 |
|
| AC | Divisional application: reference to earlier application |
Ref document number: 2205964 Country of ref document: EP Kind code of ref document: P |
|
| AK | Designated contracting states |
Kind code of ref document: B1 Designated state(s): AT BE BG CH CY CZ DE DK EE ES FI FR GB GR HR HU IE IS IT LI LT LU LV MC MT NL NO PL PT RO SE SI SK TR |
|
| REG | Reference to a national code |
Ref country code: GB Ref legal event code: FG4D |
|
| REG | Reference to a national code |
Ref country code: CH Ref legal event code: EP |
|
| REG | Reference to a national code |
Ref country code: AT Ref legal event code: REF Ref document number: 742606 Country of ref document: AT Kind code of ref document: T Effective date: 20150815 |
|
| REG | Reference to a national code |
Ref country code: IE Ref legal event code: FG4D |
|
| REG | Reference to a national code |
Ref country code: FR Ref legal event code: PLFP Year of fee payment: 8 |
|
| REG | Reference to a national code |
Ref country code: DE Ref legal event code: R096 Ref document number: 602008039611 Country of ref document: DE |
|
| REG | Reference to a national code |
Ref country code: ES Ref legal event code: FG2A Ref document number: 2546777 Country of ref document: ES Kind code of ref document: T3 Effective date: 20150928 |
|
| REG | Reference to a national code |
Ref country code: PL Ref legal event code: T3 |
|
| REG | Reference to a national code |
Ref country code: NL Ref legal event code: FP |
|
| REG | Reference to a national code |
Ref country code: LT Ref legal event code: MG4D |
|
| REG | Reference to a national code |
Ref country code: AT Ref legal event code: MK05 Ref document number: 742606 Country of ref document: AT Kind code of ref document: T Effective date: 20150812 |
|
| PG25 | Lapsed in a contracting state [announced via postgrant information from national office to epo] |
Ref country code: LV Free format text: LAPSE BECAUSE OF FAILURE TO SUBMIT A TRANSLATION OF THE DESCRIPTION OR TO PAY THE FEE WITHIN THE PRESCRIBED TIME-LIMIT Effective date: 20150812 Ref country code: LT Free format text: LAPSE BECAUSE OF FAILURE TO SUBMIT A TRANSLATION OF THE DESCRIPTION OR TO PAY THE FEE WITHIN THE PRESCRIBED TIME-LIMIT Effective date: 20150812 Ref country code: GR Free format text: LAPSE BECAUSE OF FAILURE TO SUBMIT A TRANSLATION OF THE DESCRIPTION OR TO PAY THE FEE WITHIN THE PRESCRIBED TIME-LIMIT Effective date: 20151113 Ref country code: NO Free format text: LAPSE BECAUSE OF FAILURE TO SUBMIT A TRANSLATION OF THE DESCRIPTION OR TO PAY THE FEE WITHIN THE PRESCRIBED TIME-LIMIT Effective date: 20151112 Ref country code: FI Free format text: LAPSE BECAUSE OF FAILURE TO SUBMIT A TRANSLATION OF THE DESCRIPTION OR TO PAY THE FEE WITHIN THE PRESCRIBED TIME-LIMIT Effective date: 20150812 |
|
| PG25 | Lapsed in a contracting state [announced via postgrant information from national office to epo] |
Ref country code: AT Free format text: LAPSE BECAUSE OF FAILURE TO SUBMIT A TRANSLATION OF THE DESCRIPTION OR TO PAY THE FEE WITHIN THE PRESCRIBED TIME-LIMIT Effective date: 20150812 Ref country code: HR Free format text: LAPSE BECAUSE OF FAILURE TO SUBMIT A TRANSLATION OF THE DESCRIPTION OR TO PAY THE FEE WITHIN THE PRESCRIBED TIME-LIMIT Effective date: 20150812 Ref country code: PT Free format text: LAPSE BECAUSE OF FAILURE TO SUBMIT A TRANSLATION OF THE DESCRIPTION OR TO PAY THE FEE WITHIN THE PRESCRIBED TIME-LIMIT Effective date: 20151214 Ref country code: SE Free format text: LAPSE BECAUSE OF FAILURE TO SUBMIT A TRANSLATION OF THE DESCRIPTION OR TO PAY THE FEE WITHIN THE PRESCRIBED TIME-LIMIT Effective date: 20150812 Ref country code: IS Free format text: LAPSE BECAUSE OF FAILURE TO SUBMIT A TRANSLATION OF THE DESCRIPTION OR TO PAY THE FEE WITHIN THE PRESCRIBED TIME-LIMIT Effective date: 20151212 |
|
| PG25 | Lapsed in a contracting state [announced via postgrant information from national office to epo] |
Ref country code: EE Free format text: LAPSE BECAUSE OF FAILURE TO SUBMIT A TRANSLATION OF THE DESCRIPTION OR TO PAY THE FEE WITHIN THE PRESCRIBED TIME-LIMIT Effective date: 20150812 Ref country code: CZ Free format text: LAPSE BECAUSE OF FAILURE TO SUBMIT A TRANSLATION OF THE DESCRIPTION OR TO PAY THE FEE WITHIN THE PRESCRIBED TIME-LIMIT Effective date: 20150812 Ref country code: DK Free format text: LAPSE BECAUSE OF FAILURE TO SUBMIT A TRANSLATION OF THE DESCRIPTION OR TO PAY THE FEE WITHIN THE PRESCRIBED TIME-LIMIT Effective date: 20150812 Ref country code: SK Free format text: LAPSE BECAUSE OF FAILURE TO SUBMIT A TRANSLATION OF THE DESCRIPTION OR TO PAY THE FEE WITHIN THE PRESCRIBED TIME-LIMIT Effective date: 20150812 |
|
| REG | Reference to a national code |
Ref country code: DE Ref legal event code: R097 Ref document number: 602008039611 Country of ref document: DE |
|
| PG25 | Lapsed in a contracting state [announced via postgrant information from national office to epo] |
Ref country code: RO Free format text: LAPSE BECAUSE OF FAILURE TO SUBMIT A TRANSLATION OF THE DESCRIPTION OR TO PAY THE FEE WITHIN THE PRESCRIBED TIME-LIMIT Effective date: 20150812 Ref country code: MC Free format text: LAPSE BECAUSE OF FAILURE TO SUBMIT A TRANSLATION OF THE DESCRIPTION OR TO PAY THE FEE WITHIN THE PRESCRIBED TIME-LIMIT Effective date: 20150812 |
|
| PLBE | No opposition filed within time limit |
Free format text: ORIGINAL CODE: 0009261 |
|
| STAA | Information on the status of an ep patent application or granted ep patent |
Free format text: STATUS: NO OPPOSITION FILED WITHIN TIME LIMIT |
|
| REG | Reference to a national code |
Ref country code: IE Ref legal event code: MM4A |
|
| 26N | No opposition filed |
Effective date: 20160513 |
|
| PG25 | Lapsed in a contracting state [announced via postgrant information from national office to epo] |
Ref country code: IE Free format text: LAPSE BECAUSE OF NON-PAYMENT OF DUE FEES Effective date: 20150924 |
|
| PG25 | Lapsed in a contracting state [announced via postgrant information from national office to epo] |
Ref country code: SI Free format text: LAPSE BECAUSE OF FAILURE TO SUBMIT A TRANSLATION OF THE DESCRIPTION OR TO PAY THE FEE WITHIN THE PRESCRIBED TIME-LIMIT Effective date: 20150812 |
|
| REG | Reference to a national code |
Ref country code: FR Ref legal event code: PLFP Year of fee payment: 9 |
|
| PGFP | Annual fee paid to national office [announced via postgrant information from national office to epo] |
Ref country code: PL Payment date: 20160921 Year of fee payment: 9 |
|
| PG25 | Lapsed in a contracting state [announced via postgrant information from national office to epo] |
Ref country code: BE Free format text: LAPSE BECAUSE OF FAILURE TO SUBMIT A TRANSLATION OF THE DESCRIPTION OR TO PAY THE FEE WITHIN THE PRESCRIBED TIME-LIMIT Effective date: 20150812 |
|
| PG25 | Lapsed in a contracting state [announced via postgrant information from national office to epo] |
Ref country code: MT Free format text: LAPSE BECAUSE OF FAILURE TO SUBMIT A TRANSLATION OF THE DESCRIPTION OR TO PAY THE FEE WITHIN THE PRESCRIBED TIME-LIMIT Effective date: 20150812 |
|
| PG25 | Lapsed in a contracting state [announced via postgrant information from national office to epo] |
Ref country code: BG Free format text: LAPSE BECAUSE OF FAILURE TO SUBMIT A TRANSLATION OF THE DESCRIPTION OR TO PAY THE FEE WITHIN THE PRESCRIBED TIME-LIMIT Effective date: 20150812 Ref country code: HU Free format text: LAPSE BECAUSE OF FAILURE TO SUBMIT A TRANSLATION OF THE DESCRIPTION OR TO PAY THE FEE WITHIN THE PRESCRIBED TIME-LIMIT; INVALID AB INITIO Effective date: 20080924 |
|
| PG25 | Lapsed in a contracting state [announced via postgrant information from national office to epo] |
Ref country code: CY Free format text: LAPSE BECAUSE OF FAILURE TO SUBMIT A TRANSLATION OF THE DESCRIPTION OR TO PAY THE FEE WITHIN THE PRESCRIBED TIME-LIMIT Effective date: 20150812 |
|
| PG25 | Lapsed in a contracting state [announced via postgrant information from national office to epo] |
Ref country code: TR Free format text: LAPSE BECAUSE OF FAILURE TO SUBMIT A TRANSLATION OF THE DESCRIPTION OR TO PAY THE FEE WITHIN THE PRESCRIBED TIME-LIMIT Effective date: 20150812 |
|
| REG | Reference to a national code |
Ref country code: FR Ref legal event code: PLFP Year of fee payment: 10 |
|
| PG25 | Lapsed in a contracting state [announced via postgrant information from national office to epo] |
Ref country code: LU Free format text: LAPSE BECAUSE OF NON-PAYMENT OF DUE FEES Effective date: 20150924 |
|
| REG | Reference to a national code |
Ref country code: FR Ref legal event code: PLFP Year of fee payment: 11 |
|
| PG25 | Lapsed in a contracting state [announced via postgrant information from national office to epo] |
Ref country code: PL Free format text: LAPSE BECAUSE OF NON-PAYMENT OF DUE FEES Effective date: 20170924 |
|
| PGFP | Annual fee paid to national office [announced via postgrant information from national office to epo] |
Ref country code: NL Payment date: 20200926 Year of fee payment: 13 |
|
| PGFP | Annual fee paid to national office [announced via postgrant information from national office to epo] |
Ref country code: ES Payment date: 20201001 Year of fee payment: 13 Ref country code: CH Payment date: 20201002 Year of fee payment: 13 |
|
| REG | Reference to a national code |
Ref country code: NL Ref legal event code: MM Effective date: 20211001 |
|
| REG | Reference to a national code |
Ref country code: CH Ref legal event code: PL |
|
| PG25 | Lapsed in a contracting state [announced via postgrant information from national office to epo] |
Ref country code: NL Free format text: LAPSE BECAUSE OF NON-PAYMENT OF DUE FEES Effective date: 20211001 |
|
| PG25 | Lapsed in a contracting state [announced via postgrant information from national office to epo] |
Ref country code: LI Free format text: LAPSE BECAUSE OF NON-PAYMENT OF DUE FEES Effective date: 20210930 Ref country code: CH Free format text: LAPSE BECAUSE OF NON-PAYMENT OF DUE FEES Effective date: 20210930 |
|
| REG | Reference to a national code |
Ref country code: ES Ref legal event code: FD2A Effective date: 20221128 |
|
| PG25 | Lapsed in a contracting state [announced via postgrant information from national office to epo] |
Ref country code: ES Free format text: LAPSE BECAUSE OF NON-PAYMENT OF DUE FEES Effective date: 20210925 |
|
| P01 | Opt-out of the competence of the unified patent court (upc) registered |
Effective date: 20230512 |
|
| PGFP | Annual fee paid to national office [announced via postgrant information from national office to epo] |
Ref country code: IT Payment date: 20230921 Year of fee payment: 16 Ref country code: GB Payment date: 20230927 Year of fee payment: 16 |
|
| PGFP | Annual fee paid to national office [announced via postgrant information from national office to epo] |
Ref country code: FR Payment date: 20230925 Year of fee payment: 16 Ref country code: DE Payment date: 20230927 Year of fee payment: 16 |