EP2530607A1 - Method and computer program product for interactive changing distances between multidimensional data with structural properties projected on a display device - Google Patents
Method and computer program product for interactive changing distances between multidimensional data with structural properties projected on a display device Download PDFInfo
- Publication number
- EP2530607A1 EP2530607A1 EP11305670A EP11305670A EP2530607A1 EP 2530607 A1 EP2530607 A1 EP 2530607A1 EP 11305670 A EP11305670 A EP 11305670A EP 11305670 A EP11305670 A EP 11305670A EP 2530607 A1 EP2530607 A1 EP 2530607A1
- Authority
- EP
- European Patent Office
- Prior art keywords
- data points
- projection
- projected
- distance
- display device
- Prior art date
- Legal status (The legal status is an assumption and is not a legal conclusion. Google has not performed a legal analysis and makes no representation as to the accuracy of the status listed.)
- Withdrawn
Links
Images



Classifications
-
- G—PHYSICS
- G06—COMPUTING OR CALCULATING; COUNTING
- G06F—ELECTRIC DIGITAL DATA PROCESSING
- G06F16/00—Information retrieval; Database structures therefor; File system structures therefor
- G06F16/50—Information retrieval; Database structures therefor; File system structures therefor of still image data
- G06F16/54—Browsing; Visualisation therefor
-
- G—PHYSICS
- G06—COMPUTING OR CALCULATING; COUNTING
- G06F—ELECTRIC DIGITAL DATA PROCESSING
- G06F16/00—Information retrieval; Database structures therefor; File system structures therefor
- G06F16/30—Information retrieval; Database structures therefor; File system structures therefor of unstructured textual data
- G06F16/34—Browsing; Visualisation therefor
-
- G—PHYSICS
- G06—COMPUTING OR CALCULATING; COUNTING
- G06F—ELECTRIC DIGITAL DATA PROCESSING
- G06F18/00—Pattern recognition
- G06F18/20—Analysing
- G06F18/21—Design or setup of recognition systems or techniques; Extraction of features in feature space; Blind source separation
- G06F18/213—Feature extraction, e.g. by transforming the feature space; Summarisation; Mappings, e.g. subspace methods
- G06F18/2135—Feature extraction, e.g. by transforming the feature space; Summarisation; Mappings, e.g. subspace methods based on approximation criteria, e.g. principal component analysis
Definitions
- the invention relates to a method and a computer program product for interactively changing distances between multidimensional data with structural properties projected on a display device.
- the principle of projection methods is based on the idea that the multidimensional data points can be projected on a lower dimensional space to illustrate the structural properties of the data by distances between projected data points as 2D or 3D graphics.
- Such multidimensional data points are e.g. multimedia documents described by a large set of metadata or other data collections as e.g. a collection of songs, movies or catalogues.
- Specific algorithms are used for visualizing the collection and illustrating a difference or certain conformity of elements of said collection which compute some axes for projection.
- Well known methods to perform such dimension reduction are e.g. a so-called principal component analysis in the following abbreviated as PCA and a so-called Factor Analysis as a data reduction method.
- PCA is a transformation that transforms the data to a new coordinate system such that the greatest variance by any projection of the data comes to lie on the first coordinate called the first principal component, the second greatest variance on the second coordinate, and so on, wherein variance describes how far values lie from the mean.
- Factor analytic techniques are applied to reduce the number of variables and to detect the structure in the relationships between variables. That means that several techniques are well known to display a multidimensional data collection on a display device.
- the projection result does not always fit to user's expectations and a lot of manually rearranging work has to be done if the user changes the distance between projected data points and structural properties in view of other data points interconnected with said changed data points shall not be lost. Therefore, it is desired to have means applicable to reduce manually work load for correct rearranging projected multidimensional data points interconnected with data points for which the distance has been changed by a user.
- a problem to be solved by the invention is to provide a method and computer program product for interactive changing distances between multidimensional data with structural properties projected on a display device and for rearranging data points interconnected with data points for which the distance has been changed by a user.
- the method for an interactive exploration of a data collection of interconnected multidimensional data is based on graphically moving of at least one data point or item respectively and refreshing the display according to a changed distance between projected data.
- the axes used for the projection will be reconsidered so that the distance between the projected points corresponds to the distance interactively specified by the user. Therefore, two weight vectors in case of a 2D projection or three weight vectors in case of a 3D projection are used to describe linear combinations of the current projection.
- the user moves the points by using a graphic user interface, expecting the final distance between the points in the new projected space.
- the line centered version of the matrix describing the documents in a space of coefficients is computed, wherein each column represents a document and each line a coefficient seen as a dimension of the space.
- the Singular Value Decomposition in the following abbreviated as SVD, is performed on the line centered version of the matrix.
- SVD the Singular Value Decomposition
- the key property is that a matrix of orthogonal vectors provides the principal directions of the line centered version of the matrix describing the documents, i.e., the first vector of the real unitary matrix gives the direction of the maximal dispersion and the second is the orthogonal vector with remaining maximal dispersion, etc. and these vectors are directly obtained by the SVD of the centered version of the matrix of documents.
- the typical display based on the Principal Component Analysis uses the two first vectors of the orthogonal matrix as basis and the two first lines of Y as coordinates.
- the singular values may decrease slowly, so the distribution the data over the original space is hardly accounted for when retaining only the 2 or 3 first dimensions.
- the standard solution used in Principal Component Analysis is somewhat arbitrary.
- linear combinations - two for a 2D display or three for a 3D display - among the first dimensions of the first lines are used as coordinates for the elements, e.g. in such a way that the distance between a specified pair of document is as close as possible to a given value.
- a mixture of the old axes and the new axes is used. That means that in case of a 2D projection, two additional weight vectors of a length describing the linear combinations of the lines are used for the current projection.
- the two lines of coordinates that best approach the prescribed distance being selected and additional vectors for which the weight corresponds to a projection using only real eigenvectors is used so that a mixture of expected and real vectors can be generated.
- the final coordinates of the document in the new projection are than determined by updating said additional vectors. The method may be repeated several times until the result of the arrangement fits to the taste and expectations of the user.
- Advantages of the invention are an interactive exploration of a data collection of interconnected multidimensional data based on graphically moving of at least one pair of data points or item respectively and that a time consuming manually calculation and rearrangement of documents automatically will be performed by a computer program product carrying a computer program embodied in a computer readable medium adapted to perform the method described above. That means that a display of a collection of documents which in comparison to an arrangement provided by a known projection method fits better to the taste or desire of the user in a short time and with low expenditure for the user. Furthermore, the present invention contributes to noise reduction as the rearrangement is based on an arrangement of data points best approaches the changed distance.
- the inventive method is suited for an interactive exploration of data collections as e.g. a collection of catalogues, songs or videos to be arranged according to a difference or certain conformity of the elements or items of said collection of interconnected multidimensional data.
- data collections as e.g. a collection of catalogues, songs or videos to be arranged according to a difference or certain conformity of the elements or items of said collection of interconnected multidimensional data.
- a further possible context is the exploration of multimedia documents archive. It applies to the exploration of any data collection whose elements can be described by a large enough set of metadata figures or that can be described by their mutual distances. The metadata or distances can possibly be only partially known.
- Fig. 1 shows a schematic of a projection of multidimensional data points, wherein two data points A and B are arranged in a certain distance, which interactively shall be changed by a user.
- Fig. 2 illustrates by a schematic a projection of the multidimensional data points A and B of Fig. 1 , wherein the two selected data points A and B interactively have been arranged closer and interconnected data points are rearranged according to said change by applying the present invention.
- the user can apply a filter on the data in order to get a subset of it - the filter would consist in some constraints on the metadata. This requires that the user knows the metadata scheme and this could be somewhat laborious - especially in consumer context. The resulting subset is still to be checked. If the documents are complex enough as e.g. movies, many metadata or coefficients are used for their description.
- the metadata may be numbers as for instance the budget or discrete values as actors, genres etc. However, it possible to code all the values as numbers in a sensible manner and to use these numbers as coordinates to locate the document in a space that contains all the documents.
- the Principal component Analysis PCA provides a combination of the coefficients that results into an optimal 2D or 3D representation or so-called projection of the data based on their spreading in the original space. This is also known as the Karhunen-Loeve transformation.
- the advantage of such a projection is that it determines the axis accounting for most of the variability in the coefficients. This ensures a projection having a minimal distortion. Being a linear transformation, it is continuous: a smooth motion in the 2D space corresponds to a smooth motion in the original space.
- the drawback is that the axes used by the projection, being linear combinations of the original axes, make little sense to the user.
- the metadata coefficients are not all available, or only the distance or similarity between each pairs of elements is provided to the system.
- the distances can be computed from the metadata, many functions can be chosen for this purpose.
- the Multi Dimensional Scaling MDS algorithm can create coordinates for elements in a space where the Euclidean distances are close to the distance given in input.
- an algorithm as e.g. the Principal Component Analysis PCA that enables to display in 2D or 3D a collection of objects described by many characteristics or many features, which are naturally located in a huge dimensional space.
- This algorithm determines axes on which to project the documents by selecting the linear combinations of the original axes having a maximal variation. This ensures a projection having minimal distortion.
- a Multi Dimensional Scaling MDS algorithm that can determine coordinates in an Euclidean space for objects in a collection of objects characterized by mutual distances. The coordinates are such that the Euclidian distances between the objects are as close as possible of the distances given input.
- the axes on which the coordinates are measured are such that the first 2 or 3 coordinates form the best representation of the set of objects in 2D or 3D.
- the axes used for the projection will be reconsidered so that the distance between the projected points corresponds to the distance interactively specified by the user. After several interactions, the axes actually used by the projection will hopefully match the way the user regards the data provided that the available variable capture this aspect.
- the user wants to make elements A and B, which represent data points A and B closer. The user then pushes the elements representing data points A and B together by using a graphic interface. The position of each other document is recomputed according to the metadata as said document are interconnected by said metadata.
- a Principal Component Analysis PCA based on Singular Value Decomposition SVD is e.g. presented in the Wikipedia article " Principal Component Analysis” http://en.wikipedia.org/wiki/Principal_component_analysis retrieved on 25th May 2011 , and corresponding terms are here used as it is common practice. That means that e.g. a matrix X T describes a number of documents N in a space of dimension M . Equivalently each document is described by M coefficients. X is a M ⁇ N matrix, each column representing a document and each line a coefficient seen as a dimension of the space. It is customary in data analysis to consider the matrix X T where each document is represented on a line and each coefficient as a column.
- B W ⁇ V T .
- W is a matrix of orthogonal vectors which give the principal directions of B, i.e., the first vector of W gives the direction of the maximal dispersion of B , the second is the orthogonal vector with remaining maximal dispersion, etc.
- the Principal Component Analysis PCA of B consists in using W as basis of the space.
- the typical display based on the Principal Component Analysis PCA uses the two first vectors of W as basis and the two first lines of Y as coordinates. However, for datasets with a large number of variables, the singular values may decrease slowly, so the distribution the data over the original space is hardly accounted for when retaining only the 2 or 3 first dimensions.
- the standard solution used in Principal Component Analysis PCA is somewhat arbitrary.
- FIG. 3 An example plot of singular values on a real life data matrix with a low rank is illustrated in Fig. 3 representing a diagram of singular values SV in view of its space dimension M.
- a case is considered where a 2D projection is used, which is also extendable for a 3D projection.
- the user selects two documents D a and D b in the projected space, wherein a and b corresponding to their indices in the dataset.
- the Principal Component Analysis PCA coordinates of these two documents are ⁇ a and ⁇ b .
- the user moves the points, expecting their final distance in the new projected space is d 2.
- i ⁇ j argmin i , j ⁇ Y ai - Y bi 2 + Y aj - Y bj 2 - d 2
- the data elements A and b representing data points A and B should be moved directly by the user in the projected space. This process is not described in more detail because it is well known, and according to the present invention only the changed distance has to be managed. A further possibility is to designate a set of elements and ask the system to find the representation where their position is as close as possible.
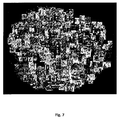
- a projection of catalogues arranged according to a known projection method is illustrated in Fig. 5 .
- Fig. 6 illustrates a projection of catalogues with a changed distance between two selected catalogues and a rearrangement of interconnected catalogues, which may be repeatedly performed for different elements or so-called data points and distances to get a final projection of catalogues as e.g. illustrated in Fig. 7 and desired by a user.
- a further embodiment is e.g. related to a collection of songs, where two songs which are displayed far one from the other. The user considers on the contrary that those two songs are very similar. He/she will then move one song nearer to the other song - and consequently, the dimensions used for the projection will be reconsidered so that the distance between the projected points corresponds to the distance interactively specified by the user. The displaying of the other songs will be refreshed accordingly.
Landscapes
- Engineering & Computer Science (AREA)
- Theoretical Computer Science (AREA)
- Data Mining & Analysis (AREA)
- Physics & Mathematics (AREA)
- General Engineering & Computer Science (AREA)
- General Physics & Mathematics (AREA)
- Databases & Information Systems (AREA)
- Computer Vision & Pattern Recognition (AREA)
- Life Sciences & Earth Sciences (AREA)
- Artificial Intelligence (AREA)
- Bioinformatics & Cheminformatics (AREA)
- Bioinformatics & Computational Biology (AREA)
- Evolutionary Biology (AREA)
- Evolutionary Computation (AREA)
- User Interface Of Digital Computer (AREA)
Abstract
A method and a computer program product for interactively changing distances between multidimensional data (A, B) with structural properties projected on a display device comprising a graphical user interface for interactive changing the distance between selected data points (A, B) projected on the display device and rearranging of data points interconnected with said data points with structural properties are recommended. A Principal Component Analysis and a Singular Value Decomposition are applied to determine a linear combination of projections of a first projection and said linear combination is mixed with a linear combination of projections of a second projection by selecting lines of a projected version of a centered version of the matrix of data points that best approaches the changed distance according to the second projection and determining coordinates for rearranging the data points is performed by using the weights of eigenvectors of the second projection.
Description
- The invention relates to a method and a computer program product for interactively changing distances between multidimensional data with structural properties projected on a display device.
- The principle of projection methods is based on the idea that the multidimensional data points can be projected on a lower dimensional space to illustrate the structural properties of the data by distances between projected data points as 2D or 3D graphics. Such multidimensional data points are e.g. multimedia documents described by a large set of metadata or other data collections as e.g. a collection of songs, movies or catalogues. Specific algorithms are used for visualizing the collection and illustrating a difference or certain conformity of elements of said collection which compute some axes for projection. Well known methods to perform such dimension reduction are e.g. a so-called principal component analysis in the following abbreviated as PCA and a so-called Factor Analysis as a data reduction method. PCA is a transformation that transforms the data to a new coordinate system such that the greatest variance by any projection of the data comes to lie on the first coordinate called the first principal component, the second greatest variance on the second coordinate, and so on, wherein variance describes how far values lie from the mean. Factor analytic techniques are applied to reduce the number of variables and to detect the structure in the relationships between variables. That means that several techniques are well known to display a multidimensional data collection on a display device. However, the projection result does not always fit to user's expectations and a lot of manually rearranging work has to be done if the user changes the distance between projected data points and structural properties in view of other data points interconnected with said changed data points shall not be lost. Therefore, it is desired to have means applicable to reduce manually work load for correct rearranging projected multidimensional data points interconnected with data points for which the distance has been changed by a user.
- A problem to be solved by the invention is to provide a method and computer program product for interactive changing distances between multidimensional data with structural properties projected on a display device and for rearranging data points interconnected with data points for which the distance has been changed by a user.
- It is an aspect of the invention to navigate in a collection of documents, projected on a 2D or 3D display device and having each a certain number of metadata interconnecting said documents, in a personalized way, to change the distance between selected documents and automatically rearranging documents interconnect with said documents which have been changed concerning their distance to each other. That means that although the projected distance between multidimensional data is determined by structural properties, a user shall be able to change the distance between selected points which need to be better represented and nevertheless the system shall try to fulfil the constraints. It is recommended to let the user interact with projections obtained through a known projection method by pointing with a graphic user interface on the documents that should be made closer or more remote in the projected space. This object is achieved by the features specified in independent claims. Advantageous embodiments are specified in dependent claims.
- The method for an interactive exploration of a data collection of interconnected multidimensional data is based on graphically moving of at least one data point or item respectively and refreshing the display according to a changed distance between projected data. Upon selection of two data elements, the axes used for the projection will be reconsidered so that the distance between the projected points corresponds to the distance interactively specified by the user. Therefore, two weight vectors in case of a 2D projection or three weight vectors in case of a 3D projection are used to describe linear combinations of the current projection. The user moves the points by using a graphic user interface, expecting the final distance between the points in the new projected space. Since it is impossible to change the coordinates of the documents in the original space as they correspond to values of the modalities describing each document, it is proposed to seek the axes that will best respect the proximity or remoteness constraint expressed by the user. To obtain a practicable algorithm it is proposed to constrain the sought axes to be ones produced by the projection method applied to the collection, and not fully free axes. In addition, to keep some stability when the proximity or remoteness constrains accumulate, it is proposed to determine the axes using a process having a memory of the constraints already issued.
- According to the invention, it is taken advantage of the Principal Component Analysis in the following abbreviated as PCA and in a first step the line centered version of the matrix describing the documents in a space of coefficients is computed, wherein each column represents a document and each line a coefficient seen as a dimension of the space. To obtain this PCA, the Singular Value Decomposition, in the following abbreviated as SVD, is performed on the line centered version of the matrix. The key property is that a matrix of orthogonal vectors provides the principal directions of the line centered version of the matrix describing the documents, i.e., the first vector of the real unitary matrix gives the direction of the maximal dispersion and the second is the orthogonal vector with remaining maximal dispersion, etc. and these vectors are directly obtained by the SVD of the centered version of the matrix of documents.
- The Principal Component Analysis of the line centered version of the matrix, wherein each column represents a document and each line a coefficient as a dimension of the space, consist in using the real unitary matrix as basis of the space. The coordinates of the documents using this new basis are using the properties of the Singular Value Decomposition. It is customary in Principal Component Analysis theory to observe that the line centered matrix can be approximated by keeping only a few of the non-null singular values of the SVD of the line centered version of the matrix describing the documents. That means that for typical datasets only a limited number of projected coordinates are significantly different from zero, i.e. relevant. The typical display based on the Principal Component Analysis uses the two first vectors of the orthogonal matrix as basis and the two first lines of Y as coordinates. However, for datasets with a large number of variables, the singular values may decrease slowly, so the distribution the data over the original space is hardly accounted for when retaining only the 2 or 3 first dimensions. The standard solution used in Principal Component Analysis is somewhat arbitrary.
- Therefore according to the invention linear combinations - two for a 2D display or three for a 3D display - among the first dimensions of the first lines are used as coordinates for the elements, e.g. in such a way that the distance between a specified pair of document is as close as possible to a given value. Using the two lines which would ensure that the expected distance is best approached and to take into account the already prescribed constraints, a mixture of the old axes and the new axes is used. That means that in case of a 2D projection, two additional weight vectors of a length describing the linear combinations of the lines are used for the current projection. The two lines of coordinates that best approach the prescribed distance being selected and additional vectors for which the weight corresponds to a projection using only real eigenvectors is used so that a mixture of expected and real vectors can be generated. By using a damping factor for stability, the final coordinates of the document in the new projection are than determined by updating said additional vectors. The method may be repeated several times until the result of the arrangement fits to the taste and expectations of the user. Advantages of the invention are an interactive exploration of a data collection of interconnected multidimensional data based on graphically moving of at least one pair of data points or item respectively and that a time consuming manually calculation and rearrangement of documents automatically will be performed by a computer program product carrying a computer program embodied in a computer readable medium adapted to perform the method described above. That means that a display of a collection of documents which in comparison to an arrangement provided by a known projection method fits better to the taste or desire of the user in a short time and with low expenditure for the user. Furthermore, the present invention contributes to noise reduction as the rearrangement is based on an arrangement of data points best approaches the changed distance.
- In principle, the inventive method is suited for an interactive exploration of data collections as e.g. a collection of catalogues, songs or videos to be arranged according to a difference or certain conformity of the elements or items of said collection of interconnected multidimensional data. A further possible context is the exploration of multimedia documents archive. It applies to the exploration of any data collection whose elements can be described by a large enough set of metadata figures or that can be described by their mutual distances. The metadata or distances can possibly be only partially known.
- The specific nature of the invention as well as other objects, advantages, features and uses of the invention will become evident from the following description of a preferred embodiment taken in conjunction with the accompanying drawings.
- Exemplary embodiments of the invention are described with reference to the accompanying drawings, which show in:
- Fig. 1
- a schematic of a projection of multidimensional data points, wherein two data points are arranged in a certain distance;
- Fig. 2
- a schematic of a projection of multidimensional data points of
Fig. 1 , wherein the two points interactively have been arranged closer and interconnected points are rearranged according to said change; - Fig. 3
- a diagram of singular values in view of its space dimension;
- Fig. 4
- a graphic illustration of notations used for the description the of the invention;
- Fig. 5
- a projection of catalogues arranged according to a known projection method;
- Fig. 6
- a projection of catalogues with a changed distance between two catalogues and rearranged interconnected catalogues;
- Fig. 7
- a final projection of catalogues as desired by a user and
- Fig. 8
- a schematic of standard positioning of the elements in a space using standard PCA or Multi Dimensional Scaling.
-
Fig. 1 shows a schematic of a projection of multidimensional data points, wherein two data points A and B are arranged in a certain distance, which interactively shall be changed by a user.Fig. 2 illustrates by a schematic a projection of the multidimensional data points A and B ofFig. 1 , wherein the two selected data points A and B interactively have been arranged closer and interconnected data points are rearranged according to said change by applying the present invention. However, it is also possible to arrange two selected data points interactively in a bigger distance as originally arranged by a known projection method and rearranging interconnected data points according to said change by a method and a computer program product according to the present invention, which perform said rearrangement in a desired manner. Coordinates of the projected data points A and B are illustrated as a horizontal component XP and a vertical component XQ. - The direct display of a collection of documents characterized by many dimensions or modalities is impossible, for the displays can handle only 2D or 3D graphics. It is therefore necessary to visualize the collection using specific algorithms, which compute some axes to use for projection. However, the standard axes, obtained by the standard projection algorithm, called Principal Component Analysis PCA, do not always satisfy the user. It would be interesting to let the user interact with the projection, to express such meaningful for him things as, two elements in the collection are closer or farther than they are represented on the display because he feels that for instance two movies are very alike or very different in subject or genre for instance. Since it is impossible to change the coordinates of the documents in the original space, they correspond to values of the modalities describing each document; it is proposed to seek the axes that will best respect the proximity or remoteness constraint expressed by the user. To obtain a practicable algorithm it is proposed to constrain the sought axes to be ones produced by the Principal Component Analysis PCA of the collection, and not fully free axes. In addition, to keep some stability when the proximity or remoteness constrains accumulate, it is proposed to determine the axes using a process having a memory of the constraints already issued. Let us first describe how the user can get a global view at a large collection and explore it as illustrated in
Fig. 8 by a schematic of standard positioning of the elements in a space using the standard Principal Component Analysis PCA or the Multi Dimensional Scaling MSD. The user can apply a filter on the data in order to get a subset of it - the filter would consist in some constraints on the metadata. This requires that the user knows the metadata scheme and this could be somewhat laborious - especially in consumer context. The resulting subset is still to be checked. If the documents are complex enough as e.g. movies, many metadata or coefficients are used for their description. The metadata may be numbers as for instance the budget or discrete values as actors, genres etc. However, it possible to code all the values as numbers in a sensible manner and to use these numbers as coordinates to locate the document in a space that contains all the documents. - For a 2D or 3D display of the collection, 2 or 3 coefficients should be selected among the full set of metadata to visualize the collection. The selection of the best ones would be a tricky and lengthy process for the user. The Principal component Analysis PCA provides a combination of the coefficients that results into an optimal 2D or 3D representation or so-called projection of the data based on their spreading in the original space. This is also known as the Karhunen-Loeve transformation. The advantage of such a projection is that it determines the axis accounting for most of the variability in the coefficients. This ensures a projection having a minimal distortion. Being a linear transformation, it is continuous: a smooth motion in the 2D space corresponds to a smooth motion in the original space. The drawback is that the axes used by the projection, being linear combinations of the original axes, make little sense to the user.
- In some cases, the metadata coefficients are not all available, or only the distance or similarity between each pairs of elements is provided to the system.
- This distance allows a step by step browsing of the catalog which could be interesting in itself for a user who has no precise goal. But it does not allow a global view of the catalog.
- The distances can be computed from the metadata, many functions can be chosen for this purpose.
- From the square matrix of the distances, the Multi Dimensional Scaling MDS algorithm can create coordinates for elements in a space where the Euclidean distances are close to the distance given in input.
- Besides the Principal Component Analysis PCA and the Multi Dimensional Scaling MDS, there exist several other algorithms that can provide projections as e.g. Spectral Clustering, which differ in how the final projection fits with the original one.
- To summarize, there exists an algorithm as e.g. the Principal Component Analysis PCA that enables to display in 2D or 3D a collection of objects described by many characteristics or many features, which are naturally located in a huge dimensional space. This algorithm determines axes on which to project the documents by selecting the linear combinations of the original axes having a maximal variation. This ensures a projection having minimal distortion. There even exist a Multi Dimensional Scaling MDS algorithm that can determine coordinates in an Euclidean space for objects in a collection of objects characterized by mutual distances. The coordinates are such that the Euclidian distances between the objects are as close as possible of the distances given input. In addition, the axes on which the coordinates are measured are such that the first 2 or 3 coordinates form the best representation of the set of objects in 2D or 3D.
- These methods ensure the best representation of the collection of objects from a global point of view. There may cases however, where the user would like to introduce some knowledge on the projection, by saying that a pair of objects should be closer or farther from they currently are. Therefore it is recommended to let the user interact with the projections obtained through the previous methods by pointing out the elements that should be made closer or more remote in the projected space. When the user examines the projection, he may point out some elements that are similar to him based on his personal a priori feeling while these elements are located apart in the projection.
- This may happen when the current projection i.e., the selected variable combination does not make much sense to the user.
- Upon selection of two data elements, the axes used for the projection will be reconsidered so that the distance between the projected points corresponds to the distance interactively specified by the user. After several interactions, the axes actually used by the projection will hopefully match the way the user regards the data provided that the available variable capture this aspect. As shown in
Fig. 1 , the user wants to make elements A and B, which represent data points A and B closer. The user then pushes the elements representing data points A and B together by using a graphic interface. The position of each other document is recomputed according to the metadata as said document are interconnected by said metadata. - Let us describe here the Principal Component Analysis PCA and the method as well as a computer program according to present invention. A Principal Component Analysis PCA based on Singular Value Decomposition SVD, is e.g. presented in the Wikipedia article "Principal Component Analysis" http://en.wikipedia.org/wiki/Principal_component_analysis retrieved on 25th May 2011, and corresponding terms are here used as it is common practice. That means that e.g. a matrix XT describes a number of documents N in a space of dimension M. Equivalently each document is described by M coefficients. X is a M × N matrix, each column representing a document and each line a coefficient seen as a dimension of the space. It is customary in data analysis to consider the matrix XT where each document is represented on a line and each coefficient as a column.
- Then for Principal Component Analysis PCA as illustrated in
Fig. 4 : - Compute B the line centered version of X:
- Let

wherein u has M lines and 1 column. - Let B=X- 1 1, Nu B=X-1 N,1ur ; the line centered copy of X.
- Let
- It is recommended to decompose B using the Singular Value Decomposition SVD: B=WΣVT . The key property is that W is a matrix of orthogonal vectors which give the principal directions of B, i.e., the first vector of W gives the direction of the maximal dispersion of B, the second is the orthogonal vector with remaining maximal dispersion, etc.
- The Principal Component Analysis PCA of B consists in using W as basis of the space. The coordinates of the documents using this new basis are, using the properties of the SVD:

- It is customary in Principal Component Analysis PCA theory to observe that Y can be approximated by keeping only a few of the non-null singular values of B:

- With Σ k equal to Σ except for the least M-k singular values which are replaced by 0. This is motivated by the fact that, for typical datasets, only k singular values are significantly different from 0.
- The typical display based on the Principal Component Analysis PCA uses the two first vectors of W as basis and the two first lines of Y as coordinates. However, for datasets with a large number of variables, the singular values may decrease slowly, so the distribution the data over the original space is hardly accounted for when retaining only the 2 or 3 first dimensions. The standard solution used in Principal Component Analysis PCA is somewhat arbitrary.
- An example plot of singular values on a real life data matrix with a low rank is illustrated in
Fig. 3 representing a diagram of singular values SV in view of its space dimension M. - According to the present invention it is recommended to choose two linear combinations for a 2D display or three linear combinations for a 3D display among the k first dimensions, which means k first lines of Ŷ as coordinates for the elements, in such a way that the distance between a specified pair of document is as close as possible to a given value.
- As an embodiment of the invention, a case is considered where a 2D projection is used, which is also extendable for a 3D projection.
- It is recommended to use two weight vectors of length k: P and Q to describe the linear combinations (mixtures) of the lines of Ŷ used for the current projection.
- That means that at the initialization:


- XP =PTŶ and XQ =QTŶ are the 2D coordinates of the documents using P and Q.
- The user selects two documents Da and Db in the projected space, wherein a and b corresponding to their indices in the dataset. The Principal Component Analysis PCA coordinates of these two documents are Ŷa and Ŷb .
- In their original position, in the projected space their distance is d 1 = ||Ŷa -Ŷ b||.
- The user moves the points, expecting their final distance in the new projected space is d 2.
- Than it is recommended to select the two lines of Ŷ that best approach the prescribed distance:

- Using the two lines i and j of Ŷ would ensure that the expected distance is best approached. To ensure some stability of the display, and to take into account the already prescribed constraints, we use a mixture of the old axes and the two new axes.
- Furthermore, it is recommended to use two additional vectors Pd and Qd of size k :


, wherein said Pd and Qd are the weight corresponding to a projection using only the i and j eigenvectors. - Then Let:


wherein
Pα and Qα represents the mixture to be found and α is a damping factor used to ensure the stability. - Then XP =Pα TŶ and XQ =Q α TŶ are the final coordinates of the document in the new projection.
- Finally P and Q being updated, so that


- It has to be noted that the distance between only two elements is handled for generating the projection. The damping factor ensures that the previous constraints are incorporated in the memory of the process.
- On a Graphically User Interface GUI, the data elements A and b representing data points A and B should be moved directly by the user in the projected space. This process is not described in more detail because it is well known, and according to the present invention only the changed distance has to be managed. A further possibility is to designate a set of elements and ask the system to find the representation where their position is as close as possible.
- Furthermore, it is interesting to compute intermediate views on a graphical interface, for instance on the basis of the interpolation of the coordinates between XP, XQ and X Pα, X Q
α to ensure smoothness of the display. - As an example, a projection of catalogues arranged according to a known projection method is illustrated in
Fig. 5 . -
Fig. 6 illustrates a projection of catalogues with a changed distance between two selected catalogues and a rearrangement of interconnected catalogues, which may be repeatedly performed for different elements or so-called data points and distances to get a final projection of catalogues as e.g. illustrated inFig. 7 and desired by a user. - A further embodiment is e.g. related to a collection of songs, where two songs which are displayed far one from the other. The user considers on the contrary that those two songs are very similar. He/she will then move one song nearer to the other song - and consequently, the dimensions used for the projection will be reconsidered so that the distance between the projected points corresponds to the distance interactively specified by the user. The displaying of the other songs will be refreshed accordingly.
- Although the invention has been shown and described with respect to specific embodiments thereof, it should be understood by those skilled in the art that the foregoing and various other changes, omissions and additions in the form and detail thereof may be made therein without departing from the spirit and scope of the claims.
Claims (9)
- Method for interactive changing distances between multidimensional data points (A, B) with structural properties projected on a display device
characterised by a graphical user interface for interactively changing the projected distance between selected data points (A, B) projected on the display device and rearranging of data points interconnected with said data points with structural properties by determining an initial representation based on a projection obtained from Principal Component Analysis, and then updating said projection by selecting the data points (A, B) to be brought closer or farther, selecting axes in the initial projection that best respect the distance between said selected data points (A, B) and displaying the collection of points according to projection axes which are a mixture of the initial axes and the axes found to best respect the changed distance between said selected data points (A, B). - Method according to claim 1, wherein the data points are cover sheets of catalogues.
- Method according to claim 1, wherein the data points comprise video pictures.
- Method according to claim 1, wherein the data points are cover sheets of jewel cases of optical media recorded with audio or video or data files.
- Method according to claim 1, interactively changing the projected distance between selected data points (A, B) is successively repeated.
- Method according to claim 1, wherein previous determined projection axes are again used for a next rearranging.
- Method according to claim 1, wherein the distance between data points represents a difference or certain conformity of elements or items at least of the collection of interconnected multidimensional data.
- Computer program product carrying a computer program embodied in a computer readable medium adapted for interactive changing distances between multidimensional data (A, B) with structural properties projected on a display device according to one of the method claims 1 to 7.
- Computer program product according to claim 8, comprising a graphical user interface for interactive changing the distance between selected data points (A, B) projected on the display device and for rearranging of data points interconnected with said data points having interactively changed concerning the distance between two selected data points (A, B).
Priority Applications (1)
| Application Number | Priority Date | Filing Date | Title |
|---|---|---|---|
| EP11305670A EP2530607A1 (en) | 2011-06-01 | 2011-06-01 | Method and computer program product for interactive changing distances between multidimensional data with structural properties projected on a display device |
Applications Claiming Priority (1)
| Application Number | Priority Date | Filing Date | Title |
|---|---|---|---|
| EP11305670A EP2530607A1 (en) | 2011-06-01 | 2011-06-01 | Method and computer program product for interactive changing distances between multidimensional data with structural properties projected on a display device |
Publications (1)
| Publication Number | Publication Date |
|---|---|
| EP2530607A1 true EP2530607A1 (en) | 2012-12-05 |
Family
ID=44453844
Family Applications (1)
| Application Number | Title | Priority Date | Filing Date |
|---|---|---|---|
| EP11305670A Withdrawn EP2530607A1 (en) | 2011-06-01 | 2011-06-01 | Method and computer program product for interactive changing distances between multidimensional data with structural properties projected on a display device |
Country Status (1)
| Country | Link |
|---|---|
| EP (1) | EP2530607A1 (en) |
Cited By (5)
| Publication number | Priority date | Publication date | Assignee | Title |
|---|---|---|---|---|
| CN104021272A (en) * | 2014-05-06 | 2014-09-03 | 国网上海市电力公司 | Method for extracting project budgetary estimate influence factors based on principal component analysis |
| CN111881858A (en) * | 2020-07-31 | 2020-11-03 | 中南大学 | Multi-scale denoising method and device for microseismic signal and readable storage medium |
| CN113095427A (en) * | 2021-04-23 | 2021-07-09 | 中南大学 | High-dimensional data analysis method and face data analysis method based on user guidance |
| CN115099740A (en) * | 2022-06-20 | 2022-09-23 | 江南大学 | Driver behavior evaluation method and system based on network freight platform |
| CN116738156A (en) * | 2023-06-07 | 2023-09-12 | 中国地质科学院地球物理地球化学勘查研究所 | A method for factor analysis and noise reduction of geochemical composition data |
-
2011
- 2011-06-01 EP EP11305670A patent/EP2530607A1/en not_active Withdrawn
Non-Patent Citations (5)
| Title |
|---|
| "Principal Component Analysis", PRINCIPAL COMPONENT ANALYSIS, 25 May 2011 (2011-05-25), Retrieved from the Internet <URL:http://en.wikipedia.org/wiki> |
| JEONG D ET AL: "iPCA: An Interactive System for PCA-based Visual Analytics", TECHNICAL REPORT, no. CVC-UNCC-09-08, 2009, Charlotte Visualization Center, University of North Carolina at Charlotte, NC, US, XP002657831, Retrieved from the Internet <URL:http://viscenter.uncc.edu/techreports.html> [retrieved on 20110830] * |
| JING YANG ET AL: "Semantic Image Browser: Bridging Information Visualization with Automated Intelligent Image Analysis", 2006 IEEE SYMPOSIUM ON VISUAL ANALYTICS AND TECHNOLOGY, 1 October 2006 (2006-10-01), IEEE, pages 191 - 198, XP031032031, ISBN: 978-1-4244-0591-6 * |
| M. GRANITZER ET AL: "Learning Term Spaces Based on Visual Feedback", 17TH INTERNATIONAL CONFERENCE ON DATABASE AND EXPERT SYSTEMS APPLICATIONS (DEXA'06), 2006, pages 176 - 180, XP055005333, ISBN: 978-0-76-952641-6, DOI: 10.1109/DEXA.2006.82 * |
| TATEMURA J: "Graphical relevance feedback: visual exploration in the document space", 2000 IEEE INTERNATIONAL SYMPOSIUM ON VISUAL LANGUAGES, 10 September 2000 (2000-09-10) - 13 September 2000 (2000-09-13), IEEE, PISCATAWAY, NJ, US, pages 39 - 46, XP010514492, ISBN: 978-0-7695-0840-5 * |
Cited By (6)
| Publication number | Priority date | Publication date | Assignee | Title |
|---|---|---|---|---|
| CN104021272A (en) * | 2014-05-06 | 2014-09-03 | 国网上海市电力公司 | Method for extracting project budgetary estimate influence factors based on principal component analysis |
| CN111881858A (en) * | 2020-07-31 | 2020-11-03 | 中南大学 | Multi-scale denoising method and device for microseismic signal and readable storage medium |
| CN111881858B (en) * | 2020-07-31 | 2024-02-13 | 中南大学 | A multi-scale denoising method, device and readable storage medium for microseismic signals |
| CN113095427A (en) * | 2021-04-23 | 2021-07-09 | 中南大学 | High-dimensional data analysis method and face data analysis method based on user guidance |
| CN115099740A (en) * | 2022-06-20 | 2022-09-23 | 江南大学 | Driver behavior evaluation method and system based on network freight platform |
| CN116738156A (en) * | 2023-06-07 | 2023-09-12 | 中国地质科学院地球物理地球化学勘查研究所 | A method for factor analysis and noise reduction of geochemical composition data |
Similar Documents
| Publication | Publication Date | Title |
|---|---|---|
| US6919910B2 (en) | Apparatus and method for distributing representative images in partitioned areas of a three-dimensional graphical environment | |
| US7146576B2 (en) | Automatically designed three-dimensional graphical environments for information discovery and visualization | |
| US8965907B2 (en) | Assisted filtering of multi-dimensional data | |
| US20130097554A1 (en) | Method and system for display of objects in 3d | |
| US20130110838A1 (en) | Method and system to organize and visualize media | |
| JP2009509215A (en) | Mutual rank similarity space for navigation, visualization, and clustering in image databases | |
| US20090106705A1 (en) | Data Management Apparatus And Method For Organizing Data Elements Into Multiple Categories For Display | |
| US11741662B2 (en) | Shaped-based techniques for exploring design spaces | |
| JP4478454B2 (en) | Layout design apparatus and design method for 3D graphic environment | |
| US8120618B2 (en) | System and method for visualization of objects using energy minimization of customized potential functions | |
| US11126330B2 (en) | Shaped-based techniques for exploring design spaces | |
| US11928773B2 (en) | Shaped-based techniques for exploring design spaces | |
| Low et al. | Visual berrypicking in large image collections | |
| Pinho et al. | Voromap: A voronoi-based tool for visual exploration of multi-dimensional data | |
| Orimo et al. | ZASH: a browsing system for multi-dimensional data | |
| WO2020036510A1 (en) | Method of displaying content of a personal database on a computer screen | |
| Yang et al. | Visualizing large hierarchies with drawer trees | |
| Alper | Dynamic visualization of geographic networks using surface deformations | |
| Bajramovic et al. | A Taxonomy of Force-Directed Placement Techniques | |
| Pflüger et al. | Analysis of Visual Arts Collections. | |
| Chang et al. | Automatically Designed 3-D Environments for Intuitive Browsing and Discovery,“ | |
| WO2020092246A1 (en) | Shaped-based techniques for exploring design spaces | |
| Elsid et al. | 3D Graph Drawings: Good Viewing for an Occluded Edges | |
| De Pinho et al. | Voromap: A Voronoi-based tool for visual exploration of multi-dimensional data |
Legal Events
| Date | Code | Title | Description |
|---|---|---|---|
| PUAI | Public reference made under article 153(3) epc to a published international application that has entered the european phase |
Free format text: ORIGINAL CODE: 0009012 |
|
| AK | Designated contracting states |
Kind code of ref document: A1 Designated state(s): AL AT BE BG CH CY CZ DE DK EE ES FI FR GB GR HR HU IE IS IT LI LT LU LV MC MK MT NL NO PL PT RO RS SE SI SK SM TR |
|
| AX | Request for extension of the european patent |
Extension state: BA ME |
|
| STAA | Information on the status of an ep patent application or granted ep patent |
Free format text: STATUS: THE APPLICATION IS DEEMED TO BE WITHDRAWN |
|
| 18D | Application deemed to be withdrawn |
Effective date: 20130606 |