EP2527794A2 - Display of utility data - Google Patents
Display of utility data Download PDFInfo
- Publication number
- EP2527794A2 EP2527794A2 EP12168966A EP12168966A EP2527794A2 EP 2527794 A2 EP2527794 A2 EP 2527794A2 EP 12168966 A EP12168966 A EP 12168966A EP 12168966 A EP12168966 A EP 12168966A EP 2527794 A2 EP2527794 A2 EP 2527794A2
- Authority
- EP
- European Patent Office
- Prior art keywords
- display
- signal
- utility data
- utility
- monitor
- Prior art date
- Legal status (The legal status is an assumption and is not a legal conclusion. Google has not performed a legal analysis and makes no representation as to the accuracy of the status listed.)
- Withdrawn
Links
- 238000004891 communication Methods 0.000 abstract description 25
- 238000000034 method Methods 0.000 description 21
- 238000009826 distribution Methods 0.000 description 14
- 238000003860 storage Methods 0.000 description 12
- 230000008569 process Effects 0.000 description 8
- 230000006870 function Effects 0.000 description 7
- 238000004590 computer program Methods 0.000 description 4
- 238000010586 diagram Methods 0.000 description 4
- 230000005540 biological transmission Effects 0.000 description 3
- 230000000694 effects Effects 0.000 description 3
- 230000005611 electricity Effects 0.000 description 2
- 238000004519 manufacturing process Methods 0.000 description 2
- 238000005259 measurement Methods 0.000 description 2
- 230000003287 optical effect Effects 0.000 description 2
- 230000037361 pathway Effects 0.000 description 2
- 230000008901 benefit Effects 0.000 description 1
- 238000006243 chemical reaction Methods 0.000 description 1
- 230000006837 decompression Effects 0.000 description 1
- 239000007789 gas Substances 0.000 description 1
- 230000010365 information processing Effects 0.000 description 1
- 239000000463 material Substances 0.000 description 1
- 239000004065 semiconductor Substances 0.000 description 1
- 239000010865 sewage Substances 0.000 description 1
- 230000007474 system interaction Effects 0.000 description 1
- 230000000007 visual effect Effects 0.000 description 1
- XLYOFNOQVPJJNP-UHFFFAOYSA-N water Substances O XLYOFNOQVPJJNP-UHFFFAOYSA-N 0.000 description 1
Images


Classifications
-
- G—PHYSICS
- G01—MEASURING; TESTING
- G01D—MEASURING NOT SPECIALLY ADAPTED FOR A SPECIFIC VARIABLE; ARRANGEMENTS FOR MEASURING TWO OR MORE VARIABLES NOT COVERED IN A SINGLE OTHER SUBCLASS; TARIFF METERING APPARATUS; MEASURING OR TESTING NOT OTHERWISE PROVIDED FOR
- G01D4/00—Tariff metering apparatus
- G01D4/02—Details
-
- G—PHYSICS
- G01—MEASURING; TESTING
- G01D—MEASURING NOT SPECIALLY ADAPTED FOR A SPECIFIC VARIABLE; ARRANGEMENTS FOR MEASURING TWO OR MORE VARIABLES NOT COVERED IN A SINGLE OTHER SUBCLASS; TARIFF METERING APPARATUS; MEASURING OR TESTING NOT OTHERWISE PROVIDED FOR
- G01D2204/00—Indexing scheme relating to details of tariff-metering apparatus
- G01D2204/10—Analysing; Displaying
- G01D2204/16—Displaying of utility pricing or cost
-
- G—PHYSICS
- G01—MEASURING; TESTING
- G01D—MEASURING NOT SPECIALLY ADAPTED FOR A SPECIFIC VARIABLE; ARRANGEMENTS FOR MEASURING TWO OR MORE VARIABLES NOT COVERED IN A SINGLE OTHER SUBCLASS; TARIFF METERING APPARATUS; MEASURING OR TESTING NOT OTHERWISE PROVIDED FOR
- G01D2204/00—Indexing scheme relating to details of tariff-metering apparatus
- G01D2204/10—Analysing; Displaying
- G01D2204/18—Remote displaying of utility meter readings
-
- Y—GENERAL TAGGING OF NEW TECHNOLOGICAL DEVELOPMENTS; GENERAL TAGGING OF CROSS-SECTIONAL TECHNOLOGIES SPANNING OVER SEVERAL SECTIONS OF THE IPC; TECHNICAL SUBJECTS COVERED BY FORMER USPC CROSS-REFERENCE ART COLLECTIONS [XRACs] AND DIGESTS
- Y04—INFORMATION OR COMMUNICATION TECHNOLOGIES HAVING AN IMPACT ON OTHER TECHNOLOGY AREAS
- Y04S—SYSTEMS INTEGRATING TECHNOLOGIES RELATED TO POWER NETWORK OPERATION, COMMUNICATION OR INFORMATION TECHNOLOGIES FOR IMPROVING THE ELECTRICAL POWER GENERATION, TRANSMISSION, DISTRIBUTION, MANAGEMENT OR USAGE, i.e. SMART GRIDS
- Y04S20/00—Management or operation of end-user stationary applications or the last stages of power distribution; Controlling, monitoring or operating thereof
- Y04S20/30—Smart metering, e.g. specially adapted for remote reading
Definitions
- This invention relates generally to electronic utility meters and more particularly to a display of utility data from an electronic utility meter.
- Electronic utility meters measure the use of various utilities, for example, electricity, water, sewage, and gas, by both residential and commercial customers.
- Electronic utility meters may include a display on the electronic utility meter that shows information about utility usage.
- Electronic utility meters may be located on an external portion of the customers' buildings or may be located in difficult to reach locations on an internal portion of the customers' buildings. To read or assess utility usage, the customer may have to go outside or to the difficult to reach internal location in order to read the meter display on the electronic utility meter.
- customers benefit from being able to read utility data in order to maximize their use of utilities. For example, peak usage times tend to be more costly for utility usage then off-peak usage times. If an activity does not need to be performed during the peak usage time, the activity could be deferred to the off-peak usage time thereby saving money and reducing demands on the utility distribution system.
- a first aspect of the invention includes a system for a display of utility data from an electronic utility meter on a monitor, the system comprising: a decoupling transformer for decoupling a power line carrier (PLC) signal into a power signal and a communication signal; a filter for removing an excess signal from the communication signal; and a computing device for: generating the display of utility data, and sending a display of utility data signal to the monitor.
- PLC power line carrier
- a second aspect of the invention includes a method for a display of utility data from an electronic utility meter, the method comprising: decoupling, using a decoupling transformer, a power line carrier (PLC) signal into a power signal and a communication signal; removing, using a filter, an excess signal from the communication signal; generating, using the computing device, the display of utility data; and sending a display of utility data signal to a monitor.
- PLC power line carrier
- a third aspect of the invention includes a computer program comprising program code means adapted to perform the above method when run on a computer and in the computer program embodied on a computer readable medium.
- Display of utility data system 102 may include a decoupling transformer 136, a filter 138, and a computing device 104.
- Computing device 104 may include monitor display system 105, which makes computing device 104 operable to receive utility data from an electrical utility meter 106, calculate the utility data, generate a utility display 142 ( FIG. 3 ), and send a display of utility data signal for displaying utility display 142 ( FIG. 3 ) on a monitor 108.
- monitor display system 105 which makes computing device 104 operable to receive utility data from an electrical utility meter 106, calculate the utility data, generate a utility display 142 ( FIG. 3 ), and send a display of utility data signal for displaying utility display 142 ( FIG. 3 ) on a monitor 108.
- a calculating system 112, a generating system 114, and a transmitting system 116 may be optional components (or, modules) in monitor display system 102.
- calculating system 112, generating system 114, and transmitting system 116 may be part of an external system which may perform the functions described herein.
- Computing device 104 is shown in communication with user 118.
- User 118 may be a human, for example, a programmer or operator and/or a computerized system interacting with display of utility data system 102. Communications between user 118 and computing device 104 can be implemented using any solution, such as a graphical interface, an application programming interface (API), and/or the like. Furthermore, communications can utilize any combination of public and/or private networks.
- Computing device 104 is shown including a processing component 122 (e.g., one or more processors), a database 124, a memory 126, an input/output (I/O) component 128 (e.g., one or more I/O interfaces and/or devices), and a communications pathway 130.
- I/O input/output
- processing component 122 executes program code, such as monitor display system 105, which is at least partially embodied in memory 126. While executing program code, processing component 122 can process data, which can result in reading and/or writing the data to/from database 124, memory 126 and/or I/O component 128 for further processing.
- Communications pathway 130 provides a communications link between each of the components in computing device 104.
- I/O component 128 can comprise one or more human I/O devices or storage devices, which enable user 118 to interact with computing device 104 and/or one or more communications devices to enable user 118 to communicate with computing device 104 using any type of communications link.
- display of utility data system 102 can manage a set of interfaces (e.g., graphical user interface(s), application program interface, and/or the like) that enable human and/or system interaction with display of utility data system 102.
- computing device 104 can comprise one or more general purpose computing articles of manufacture (e.g., computing devices) capable of executing program code installed thereon.
- program code means any collection of instructions, in any language, code or notation, that cause a computing device having an information processing capability to perform a particular function either directly or after any combination of the following: (a) conversion to another language, code or notation; (b) reproduction in a different material form; and/or (c) decompression.
- monitor display system 105 can be embodied as any combination of system software and/or application software.
- the technical effect of computing device 104 is to receive utility data from electrical utility meter 106, calculate utility data, generate utility display 142 ( FIG. 3 ), and send display of utility data signal for displaying utility display on monitor 108.
- monitor display system 105 can be implemented using a set of modules 132.
- a module 132 can enable computing device 104 to perform a set of tasks used by monitor display system 105, and can be separately developed and/or implemented apart from other portions of monitor display system 105.
- Monitor display system 105 may include modules 132 which comprise a specific use machine/hardware and/or software. Regardless, it is understood that two or more modules, and/or systems may share some/all of their respective hardware and/or software. Further, it is understood that some of the functionality discussed herein may not be implemented or additional functionality may be included as part of computing device 104.
- each computing device may have only a portion of monitor display system 105 embodied thereon (e.g., one or more modules 132).
- monitor display system 105 embodied thereon
- computing device 104 and monitor display system 105 are only representative of various possible equivalent computing devices that may perform a process described herein.
- the functionality provided by computing device 104 and monitor display system 105 can be at least partially implemented by one or more computing devices that include any combination of general and/or specific purpose hardware with or without program code.
- the hardware and program code if included, can be created using standard engineering and programming techniques, respectively.
- computing device 104 when computing device 104 includes multiple computing devices, the computing devices can communicate over any type of communications link. Further, while performing a process described herein, computing device 104 can communicate with one or more other computing devices using any type of communications link.
- the communications link can comprise any combination of various types of wired and/or wireless links; comprise any combination of one or more types of networks; and/or utilize any combination of various types of transmission techniques and protocols.
- monitor display system 105 enables computing device 104 to calculate utility data, generate utility display, and send a display of utility data signal for displaying utility display 142 ( FIG. 3 ) on monitor 108.
- Monitor display system 105 may include logic, which may include the following functions: calculating system 112, generating system 114, and transmitting system 116.
- monitor display system 105 may include logic to perform the below-stated functions. Structurally, the logic may take any of a variety of forms such as a field programmable gate array (FPGA), a microprocessor, a digital signal processor, an application specific integrated circuit (ASIC) or any other specific use machine structure capable of carrying out the functions described herein.
- FPGA field programmable gate array
- ASIC application specific integrated circuit
- Logic may take any of a variety of forms, such as software and/or hardware. However, for illustrative purposes, monitor display system 105 and logic included therein will be described herein as a specific use machine. As will be understood from the description, while logic is illustrated as including each of the above-stated functions, not all of the functions are necessary according to the teachings of the invention as recited in the appended claims.
- the invention provides a computer program embodied in at least one computer-readable storage medium, which when executed, enables a computing device (e.g., computing device 104) to calculate utility data, generate utility display, and send display of utility data for displaying utility display 142 ( FIG. 3 ) on monitor 108.
- a computing device e.g., computing device 104
- the computer-readable storage medium includes program code, such as monitor display system 105, which implements some or all of a process described herein.
- monitor display system 105 which implements some or all of a process described herein.
- the term "computer-readable storage medium" comprises one or more of any type of tangible medium of expression capable of embodying a copy of the program code (e.g., a physical embodiment).
- the computer-readable storage medium can comprise: one or more portable storage articles of manufacture; one or more memory/storage components of a computing device; paper; and/or the like.
- a computer readable storage medium may be, for example, but not limited to, an electronic, magnetic, optical, electromagnetic, infrared, or semiconductor system, apparatus, or device, or any suitable combination of the foregoing.
- a computer readable storage medium may be any tangible medium that can contain, or store a program for use by or in connection with an instruction execution system, apparatus, or device.
- the invention provides a method of providing a copy of program code, such as monitor display system 105, which implements some or all of a process described herein.
- a computing device can generate and transmit, for reception at a second, distinct location, a set of data signals that has one or more of its characteristics set and/or changed in such a manner as to encode a copy of the program code in the set of data signals.
- an embodiment of the invention provides a method of acquiring a copy of program code that implements some or all of a process described herein, which includes a computing device receiving the set of data signals described herein, and translating the set of data signals into a copy of the computer program embodied in at least one computer-readable medium.
- the set of data signals can be transmitted/received using any type of communications link.
- the invention provides a method of generating a system for calculating utility data, generating utility display, and sending display of utility data signal for displaying utility display 142 ( FIG. 3 ) on monitor 108.
- a computing device such as computing device 104
- one or more modules for performing a process described herein can be obtained (e.g., created, purchased, used, modified, etc.) and deployed to the computing device.
- the deployment can comprise one or more of: (1) installing program code on a computing device from a computer-readable medium; (2) adding one or more computing and/or I/O devices to the computing device; and (3) incorporating and/or modifying the computing device to enable it to perform a process described herein.
- electrical utility meter 106 may include a transmitter 134 for sending a power line carrier (PLC) signal to decoupling transformer 136.
- the PLC signal may include a power signal and a communication signal.
- PLC signal may integrate a transmission of the communication signal and the power signal through the same cable 140.
- Power signal may include electrical power
- communication signal may include utility data.
- decoupling transformer 136 receives the PLC signal and, at S2, decoupling transformer 136 decouples power signal from communication signal.
- a filter 138 may be provided for removing an excess signal, for example, a high frequency signal, e.g., "noise", from the communication signal.
- Decoupling transformer 136 may be operably connected with filter 138 and filter 138 may be operably connected to computing device 104.
- Utility data may include meter data.
- Meter data may include any data read by, measured by, generated at, and/or communicated to the electronic utility meter.
- Meter data may include, for example, present demand, an unbilled amount, a maximum demand, a today's usage, a date, a time, a meter number, a battery status, a load disconnect state, a load disconnect status, and a unit price per kilowatt hour, and any other known or to be developed meter data.
- a person skilled in the art will readily recognize that a variety of meter data from electronic utility meter may be included in utility data.
- Utility data may also include utility distribution network data.
- Utility distribution network data may include data measured and generated by any other nodes and/or components of the utility distribution network.
- Utility distribution network data may include information concerning the utility distribution network.
- Utility distribution network data may be communicated through the electronic utility meter 106.
- Utility distribution network may include, for example, substations, distribution stations, transformers, network nodes, generation stations, head end servers, utility personnel communicating with utility distribution network, and other known or to be developed components of the utility distribution network.
- Utility distribution network data may include, for example, a billing information, a price per kilowatt hour, a message (including text and/or pictorial content), a contact information, a help information, a power outage information, a weather information, a historical utility data, a power grid status, and any other known or to be developed utility distribution network data.
- a billing information a price per kilowatt hour
- a message including text and/or pictorial content
- a contact information including text and/or pictorial content
- help information including text and/or pictorial content
- a power outage information including text and/or pictorial content
- weather information including text and/or pictorial content
- weather information including text and/or pictorial content
- weather information including text and/or pictorial content
- weather information including text and/or pictorial content
- weather information a historical utility data
- a power grid status a variety of utility distribution network data from electronic utility meter may be included in utility data.
- calculating system 112 may receive communication signal from filter 138 and calculate utility data in communication signal.
- Calculating utility data may include calculating new values from the utility data for additional information about utility usage, for example, present demand by price per kilowatt hour, maximum demand per day, and daily time of maximum demand.
- present demand by price per kilowatt hour, maximum demand per day, and daily time of maximum demand.
- generating system 114 may receive utility data from filter 138 and/or calculated utility data from calculating system 112 for generating a display of utility data 142 ( FIG. 3 ).
- display of utility data 142 may be viewed on monitor 108.
- generating system 114 may generate utility data for display on monitor 108 and may send display of utility data signal to monitor 108. Generating may be done by any now known or to be developed method of generating displays for monitors. Sending display of utility data signal to monitor 108 may be done by any now known or to be developed method, for example, via a cable or radio transmission.
- monitor 108 may include a digital display 146 or an analog display 148.
- Monitor 108 may include, for example, televisions, lap top computers, desk top computers, wall panel displays, and video monitors. Monitor 108 may be located in both residential and commercial customer buildings, for example, homes and businesses.
- one embodiment may include a digital-to-analog converter (DAC) 150.
- DAC 150 may receive display of utility data signal in a digital format and may convert the display of utility data signal to analog format before utility display signal is transmitted to analog display 148.
- an amplifier 151 may be included to enhance the analog signal before transmitting to analog display 148.
- monitor 108 may receive and display display of utility data 142 ( FIG. 3 ).
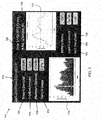
- Display of utility data 142 may include, for example, a present demand display 152, an unbilled amount display 154, a maximum demand display 156, a today's usage display 158, a date display 160, a meter number display 162, a battery status display 164, a load disconnect display 166, and a unit price per kilowatt hour display 168.
- display of utility data 142 may include a title display 170 along with graphic images, for example, a demand per hour graph display 172 and/or a demand per date graph 174.
- a person skilled in the art will recognize that other types of utility data could be displayed and that the placement of the visual images such as graphs within the display may vary.
- a bar graph and line graph are illustrated in FIG. 3 but any type of graphic images to display utility data relationships could be utilized.
Landscapes
- Physics & Mathematics (AREA)
- General Physics & Mathematics (AREA)
- Arrangements For Transmission Of Measured Signals (AREA)
- Selective Calling Equipment (AREA)
- Management, Administration, Business Operations System, And Electronic Commerce (AREA)
Abstract
A system (102) for a display of utility data from an electronic utility meter (106) on a monitor is provided. The system includes a decoupling transformer (136) for decoupling a power line carrier (PLC) signal into a power signal and a communication signal; a filter (138) for removing an excess signal from the communication signal; and a computing device (104) for: generating the display of utility data, and sending a display of utility data signal to a monitor (108).
Description
- This invention relates generally to electronic utility meters and more particularly to a display of utility data from an electronic utility meter.
- Electronic utility meters measure the use of various utilities, for example, electricity, water, sewage, and gas, by both residential and commercial customers. Electronic utility meters may include a display on the electronic utility meter that shows information about utility usage. Electronic utility meters may be located on an external portion of the customers' buildings or may be located in difficult to reach locations on an internal portion of the customers' buildings. To read or assess utility usage, the customer may have to go outside or to the difficult to reach internal location in order to read the meter display on the electronic utility meter.
- At the same time, customers benefit from being able to read utility data in order to maximize their use of utilities. For example, peak usage times tend to be more costly for utility usage then off-peak usage times. If an activity does not need to be performed during the peak usage time, the activity could be deferred to the off-peak usage time thereby saving money and reducing demands on the utility distribution system.
- A first aspect of the invention includes a system for a display of utility data from an electronic utility meter on a monitor, the system comprising: a decoupling transformer for decoupling a power line carrier (PLC) signal into a power signal and a communication signal; a filter for removing an excess signal from the communication signal; and a computing device for: generating the display of utility data, and sending a display of utility data signal to the monitor.
- A second aspect of the invention includes a method for a display of utility data from an electronic utility meter, the method comprising: decoupling, using a decoupling transformer, a power line carrier (PLC) signal into a power signal and a communication signal; removing, using a filter, an excess signal from the communication signal; generating, using the computing device, the display of utility data; and sending a display of utility data signal to a monitor.
- A third aspect of the invention includes a computer program comprising program code means adapted to perform the above method when run on a computer and in the computer program embodied on a computer readable medium.
- Embodiments of the present invention will now be described, by way of example only, with reference to the accompanying drawings in which:
-
FIG. 1 shows a block diagram of one embodiment of a display of utility data system in accordance with the invention. -
FIG. 2 shows a flow diagram for use in describing a method according to an embodiment of the invention. -
FIG. 3 shows a graphical view of one embodiment of a display of utility data in accordance with the invention. - It is noted that the drawings of the invention are not to scale. The drawings are intended to depict only typical aspects of the invention, and therefore should not be considered as limiting the scope of the invention. In the drawings, like numbering represents like elements between the drawings.
- Referring to
FIG. 1 , a block diagram of one embodiment of a display ofutility data system 102 in accordance with the invention is shown. Display ofutility data system 102 may include a decouplingtransformer 136, afilter 138, and acomputing device 104.Computing device 104 may includemonitor display system 105, which makescomputing device 104 operable to receive utility data from anelectrical utility meter 106, calculate the utility data, generate a utility display 142 (FIG. 3 ), and send a display of utility data signal for displaying utility display 142 (FIG. 3 ) on amonitor 108. As indicated inFIG. 1 , a calculatingsystem 112, agenerating system 114, and atransmitting system 116 may be optional components (or, modules) inmonitor display system 102. Alternatively, calculatingsystem 112,generating system 114, and transmittingsystem 116 may be part of an external system which may perform the functions described herein. -
Computing device 104 is shown in communication withuser 118.User 118 may be a human, for example, a programmer or operator and/or a computerized system interacting with display ofutility data system 102. Communications betweenuser 118 andcomputing device 104 can be implemented using any solution, such as a graphical interface, an application programming interface (API), and/or the like. Furthermore, communications can utilize any combination of public and/or private networks.Computing device 104 is shown including a processing component 122 (e.g., one or more processors), adatabase 124, amemory 126, an input/output (I/O) component 128 (e.g., one or more I/O interfaces and/or devices), and acommunications pathway 130. In one embodiment,processing component 122 executes program code, such asmonitor display system 105, which is at least partially embodied inmemory 126. While executing program code,processing component 122 can process data, which can result in reading and/or writing the data to/fromdatabase 124,memory 126 and/or I/O component 128 for further processing.Communications pathway 130 provides a communications link between each of the components incomputing device 104. I/O component 128 can comprise one or more human I/O devices or storage devices, which enableuser 118 to interact withcomputing device 104 and/or one or more communications devices to enableuser 118 to communicate withcomputing device 104 using any type of communications link. To this extent, display ofutility data system 102 can manage a set of interfaces (e.g., graphical user interface(s), application program interface, and/or the like) that enable human and/or system interaction with display ofutility data system 102. - In any event,
computing device 104 can comprise one or more general purpose computing articles of manufacture (e.g., computing devices) capable of executing program code installed thereon. As used herein, it is understood that "program code" means any collection of instructions, in any language, code or notation, that cause a computing device having an information processing capability to perform a particular function either directly or after any combination of the following: (a) conversion to another language, code or notation; (b) reproduction in a different material form; and/or (c) decompression. To this extent,monitor display system 105 can be embodied as any combination of system software and/or application software. In any event, the technical effect ofcomputing device 104 is to receive utility data fromelectrical utility meter 106, calculate utility data, generate utility display 142 (FIG. 3 ), and send display of utility data signal for displaying utility display onmonitor 108. - Further,
monitor display system 105 can be implemented using a set ofmodules 132. In this case, amodule 132 can enablecomputing device 104 to perform a set of tasks used bymonitor display system 105, and can be separately developed and/or implemented apart from other portions ofmonitor display system 105.Monitor display system 105 may includemodules 132 which comprise a specific use machine/hardware and/or software. Regardless, it is understood that two or more modules, and/or systems may share some/all of their respective hardware and/or software. Further, it is understood that some of the functionality discussed herein may not be implemented or additional functionality may be included as part ofcomputing device 104. - When
computing device 104 comprises multiple computing devices, each computing device may have only a portion ofmonitor display system 105 embodied thereon (e.g., one or more modules 132). However, it is understood thatcomputing device 104 andmonitor display system 105 are only representative of various possible equivalent computing devices that may perform a process described herein. To this extent, in other embodiments, the functionality provided bycomputing device 104 andmonitor display system 105 can be at least partially implemented by one or more computing devices that include any combination of general and/or specific purpose hardware with or without program code. In each embodiment, the hardware and program code, if included, can be created using standard engineering and programming techniques, respectively. - Regardless, when
computing device 104 includes multiple computing devices, the computing devices can communicate over any type of communications link. Further, while performing a process described herein,computing device 104 can communicate with one or more other computing devices using any type of communications link. In either case, the communications link can comprise any combination of various types of wired and/or wireless links; comprise any combination of one or more types of networks; and/or utilize any combination of various types of transmission techniques and protocols. - As discussed herein,
monitor display system 105 enablescomputing device 104 to calculate utility data, generate utility display, and send a display of utility data signal for displaying utility display 142 (FIG. 3 ) onmonitor 108.Monitor display system 105 may include logic, which may include the following functions: calculatingsystem 112,generating system 114, and transmittingsystem 116. In one embodiment,monitor display system 105 may include logic to perform the below-stated functions. Structurally, the logic may take any of a variety of forms such as a field programmable gate array (FPGA), a microprocessor, a digital signal processor, an application specific integrated circuit (ASIC) or any other specific use machine structure capable of carrying out the functions described herein. Logic may take any of a variety of forms, such as software and/or hardware. However, for illustrative purposes,monitor display system 105 and logic included therein will be described herein as a specific use machine. As will be understood from the description, while logic is illustrated as including each of the above-stated functions, not all of the functions are necessary according to the teachings of the invention as recited in the appended claims. - In one embodiment, the invention provides a computer program embodied in at least one computer-readable storage medium, which when executed, enables a computing device (e.g., computing device 104) to calculate utility data, generate utility display, and send display of utility data for displaying utility display 142 (
FIG. 3 ) onmonitor 108. To this extent, the computer-readable storage medium includes program code, such asmonitor display system 105, which implements some or all of a process described herein. It is understood that the term "computer-readable storage medium" comprises one or more of any type of tangible medium of expression capable of embodying a copy of the program code (e.g., a physical embodiment). For example, the computer-readable storage medium can comprise: one or more portable storage articles of manufacture; one or more memory/storage components of a computing device; paper; and/or the like. A computer readable storage medium may be, for example, but not limited to, an electronic, magnetic, optical, electromagnetic, infrared, or semiconductor system, apparatus, or device, or any suitable combination of the foregoing. More specific examples (a non-exhaustive list) of the computer readable storage medium would include the following: an electrical connection having one or more wires, a portable computer diskette, a hard disk, a random access memory (RAM), a read-only memory (ROM), an erasable programmable read-only memory (EPROM or Flash memory), a portable compact disc read-only memory (CD-ROM), an optical storage device, a magnetic storage device, or any suitable combination of the foregoing. In the context of this document, a computer readable storage medium may be any tangible medium that can contain, or store a program for use by or in connection with an instruction execution system, apparatus, or device. - In another embodiment, the invention provides a method of providing a copy of program code, such as
monitor display system 105, which implements some or all of a process described herein. In this case, a computing device can generate and transmit, for reception at a second, distinct location, a set of data signals that has one or more of its characteristics set and/or changed in such a manner as to encode a copy of the program code in the set of data signals. Similarly, an embodiment of the invention provides a method of acquiring a copy of program code that implements some or all of a process described herein, which includes a computing device receiving the set of data signals described herein, and translating the set of data signals into a copy of the computer program embodied in at least one computer-readable medium. In either case, the set of data signals can be transmitted/received using any type of communications link. - In still another embodiment, the invention provides a method of generating a system for calculating utility data, generating utility display, and sending display of utility data signal for displaying utility display 142 (
FIG. 3 ) onmonitor 108. In this case, a computing device, such ascomputing device 104, can be obtained (e.g., created, maintained, made available, etc.) and one or more modules for performing a process described herein can be obtained (e.g., created, purchased, used, modified, etc.) and deployed to the computing device. To this extent, the deployment can comprise one or more of: (1) installing program code on a computing device from a computer-readable medium; (2) adding one or more computing and/or I/O devices to the computing device; and (3) incorporating and/or modifying the computing device to enable it to perform a process described herein. - Referring to
FIG. 2 , a flow diagram of a method of displaying utility data from electrical utility meter in one embodiment of the invention is shown. Also, continuing to refer toFIG. 1 ,electrical utility meter 106 may include atransmitter 134 for sending a power line carrier (PLC) signal todecoupling transformer 136. The PLC signal may include a power signal and a communication signal. PLC signal may integrate a transmission of the communication signal and the power signal through thesame cable 140. Power signal may include electrical power, and communication signal may include utility data. As shown inFIG. 2 , at S1,decoupling transformer 136 receives the PLC signal and, at S2,decoupling transformer 136 decouples power signal from communication signal. At S3, afilter 138 may be provided for removing an excess signal, for example, a high frequency signal, e.g., "noise", from the communication signal.Decoupling transformer 136 may be operably connected withfilter 138 and filter 138 may be operably connected tocomputing device 104. - Utility data may include meter data. Meter data may include any data read by, measured by, generated at, and/or communicated to the electronic utility meter. Meter data may include, for example, present demand, an unbilled amount, a maximum demand, a today's usage, a date, a time, a meter number, a battery status, a load disconnect state, a load disconnect status, and a unit price per kilowatt hour, and any other known or to be developed meter data. A person skilled in the art will readily recognize that a variety of meter data from electronic utility meter may be included in utility data.
- Utility data may also include utility distribution network data. Utility distribution network data may include data measured and generated by any other nodes and/or components of the utility distribution network. Utility distribution network data may include information concerning the utility distribution network. Utility distribution network data may be communicated through the
electronic utility meter 106. Utility distribution network may include, for example, substations, distribution stations, transformers, network nodes, generation stations, head end servers, utility personnel communicating with utility distribution network, and other known or to be developed components of the utility distribution network. Utility distribution network data may include, for example, a billing information, a price per kilowatt hour, a message (including text and/or pictorial content), a contact information, a help information, a power outage information, a weather information, a historical utility data, a power grid status, and any other known or to be developed utility distribution network data. A person skilled in the art will readily recognize that a variety of utility distribution network data from electronic utility meter may be included in utility data. - A person skilled in the art will readily recognize that the type of utility data included may vary with the type of utility being metered, for example, measurements of gas usage may differ from measurements of electricity usage.
- In one embodiment, at S4, calculating
system 112 may receive communication signal fromfilter 138 and calculate utility data in communication signal. Calculating utility data may include calculating new values from the utility data for additional information about utility usage, for example, present demand by price per kilowatt hour, maximum demand per day, and daily time of maximum demand. A person skilled in the art will readily recognize that a variety of new values calculated from the utility data may be possible. - At S5, generating
system 114 may receive utility data fromfilter 138 and/or calculated utility data from calculatingsystem 112 for generating a display of utility data 142 (FIG. 3 ). In one embodiment of the invention, display of utility data 142 (FIG. 3 ) may be viewed onmonitor 108. At S6, generatingsystem 114 may generate utility data for display onmonitor 108 and may send display of utility data signal to monitor 108. Generating may be done by any now known or to be developed method of generating displays for monitors. Sending display of utility data signal to monitor 108 may be done by any now known or to be developed method, for example, via a cable or radio transmission. - As shown in
FIG. 1 , monitor 108 may include adigital display 146 or ananalog display 148.Monitor 108 may include, for example, televisions, lap top computers, desk top computers, wall panel displays, and video monitors.Monitor 108 may be located in both residential and commercial customer buildings, for example, homes and businesses. In any event, one embodiment may include a digital-to-analog converter (DAC) 150. At S7,DAC 150 may receive display of utility data signal in a digital format and may convert the display of utility data signal to analog format before utility display signal is transmitted toanalog display 148. In one embodiment, an amplifier 151 may be included to enhance the analog signal before transmitting toanalog display 148. At S9, monitor 108 may receive and display display of utility data 142 (FIG. 3 ). - Referring to
FIG. 3 , a graphic representation of one embodiment of display ofutility data 142 according to the invention is shown. Display ofutility data 142 may include, for example, apresent demand display 152, anunbilled amount display 154, amaximum demand display 156, a today'susage display 158, adate display 160, ameter number display 162, abattery status display 164, aload disconnect display 166, and a unit price perkilowatt hour display 168. Further, display ofutility data 142 may include atitle display 170 along with graphic images, for example, a demand perhour graph display 172 and/or a demand perdate graph 174. A person skilled in the art will recognize that other types of utility data could be displayed and that the placement of the visual images such as graphs within the display may vary. A bar graph and line graph are illustrated inFIG. 3 but any type of graphic images to display utility data relationships could be utilized. - The terminology used herein is for the purpose of describing particular embodiments only and is not intended to be limiting of the disclosure. As used herein, the singular forms "a", "an" and "the" are intended to include the plural forms as well, unless the context clearly indicates otherwise. It will be further understood that the terms "comprises" and/or "comprising," when used in this specification, specify the presence of stated features, integers, steps, operations, elements, and/or components, but do not preclude the presence or addition of one or more other features, integers, steps, operations, elements, components, and/or groups thereof.
- This written description uses examples to disclose the invention, including the best mode, and also to enable any person skilled in the art to practice the invention, including making and using any devices or systems and performing any incorporated methods. The patentable scope of the invention is defined by the claims, and may include other examples that occur to those skilled in the art. Such other examples are intended to be within the scope of the claims if they have structural elements that do not differ from the literal language of the claims, or if they include equivalent structural elements with insubstantial differences from the literal languages of the claims.
Claims (15)
- A system (102) for a display of utility data from an electronic utility meter (106) on a monitor (108), the system (102) comprising:a decoupling transformer (136) for decoupling a power line carrier (PLC) signal into a power signal and a communication signal;a filter (138) for removing an excess signal from the communication signal; anda computing device (104) for:generating the display of utility data, andsending a display of utility data signal to the monitor (108).
- The system (102) of claim 1, wherein the display of utility data includes at least one of a present demand (152), an unbilled amount (154), a maximum demand (156), a today's usage (158), a date (160), a time, a meter number (162), a battery status (164), a load disconnect (166), a unit price per kilowatt hour (168), a billing information, a message, a contact information, a help information, a power outage information, a weather information, a historical utility data, and a power grid status.
- The system (102) of claim 1 or 2, the computing device (104) further providing for:calculating new values from the utility data in the communication signal.
- The system (102) of any of claims 1 to 3, wherein the display of utility data includes a demand per hour graph (172) and a demand per date graph (174).
- The system (102) of any of claims 1 to 4, further comprising a digital-to-analog converter (150) for converting the display of utility data signal from a digital signal to an analog signal.
- The system (102) of claim 5, wherein the monitor is an analog monitor (108) operably coupled to the computing device (104) for:receiving the display of utility data signal; anddisplaying the display of utility data.
- The system (102) of any of claims 1 to 4, wherein the monitor (108) is a digital monitor (108) operably coupled to the computing device (104) for:receiving the display of utility data signal; anddisplaying the display of utility data.
- The system (102) of any preceding claim, further comprising a transmitter (134) for sending the PLC signal from the electronic utility meter (106) to the decoupling transformer (136).
- A method for a display of utility data from an electronic utility meter (106), the method comprising:decoupling, using a decoupling transformer (136), a power line carrier (PLC) signal into a power signal and a communication signal;removing, using a filter (138), an excess signal from the communication signal;generating, using a computing device (104), the display of utility data; andsending a display of utility data signal to a monitor (108).
- The method of claim 9, wherein the display of utility data includes at least one of one of a present demand (152), an unbilled amount (154), a maximum demand (156), a today's usage (158), a date (160), a time, a meter number (162), a battery status (164), a load disconnect (166), a unit price per kilowatt hour (168), a billing information, a message, a contact information, a help information, a power outage information, a weather information, a historical utility data, and a power grid status.
- The method of claim 9 or 10, further comprising:calculating new values from the utility data in the communication signal.
- The method of any of claims 9 to 11, wherein the display of utility data includes a demand per hour graph (172) and a demand per date graph (174).
- The method of any of claims 9 to 12, further comprising converting, using a digital-to-analog converter (150), the display of utility data signal from a digital signal to an analog signal.
- A computer program comprising computer program code means adapted to perform the steps of the method of any of claims 9 to 13, when run on a computer.
- The computer program of claim 14, embodied on a computer program medium.
Applications Claiming Priority (1)
| Application Number | Priority Date | Filing Date | Title |
|---|---|---|---|
| US13/116,064 US20120299746A1 (en) | 2011-05-26 | 2011-05-26 | Display of utility data |
Publications (1)
| Publication Number | Publication Date |
|---|---|
| EP2527794A2 true EP2527794A2 (en) | 2012-11-28 |
Family
ID=46545226
Family Applications (1)
| Application Number | Title | Priority Date | Filing Date |
|---|---|---|---|
| EP12168966A Withdrawn EP2527794A2 (en) | 2011-05-26 | 2012-05-22 | Display of utility data |
Country Status (3)
| Country | Link |
|---|---|
| US (1) | US20120299746A1 (en) |
| EP (1) | EP2527794A2 (en) |
| JP (1) | JP2012249283A (en) |
Family Cites Families (2)
| Publication number | Priority date | Publication date | Assignee | Title |
|---|---|---|---|---|
| US5014218A (en) * | 1986-12-24 | 1991-05-07 | Halliburton Company | Using a remote control computer connected to a vocal control computer and a monitor computer |
| US20010010032A1 (en) * | 1998-10-27 | 2001-07-26 | Ehlers Gregory A. | Energy management and building automation system |
-
2011
- 2011-05-26 US US13/116,064 patent/US20120299746A1/en not_active Abandoned
-
2012
- 2012-05-22 EP EP12168966A patent/EP2527794A2/en not_active Withdrawn
- 2012-05-23 JP JP2012117154A patent/JP2012249283A/en active Pending
Non-Patent Citations (1)
| Title |
|---|
| None |
Also Published As
| Publication number | Publication date |
|---|---|
| JP2012249283A (en) | 2012-12-13 |
| US20120299746A1 (en) | 2012-11-29 |
Similar Documents
| Publication | Publication Date | Title |
|---|---|---|
| Chakraborty et al. | Smart meters for enhancing protection and monitoring functions in emerging distribution systems | |
| Mahmood et al. | Design and implementation of AMR smart grid system | |
| Mir et al. | Review on smart electric metering system based on GSM/IOT | |
| US8140414B2 (en) | System and method for controlling a utility meter | |
| Sendin et al. | Strategies for power line communications smart metering network deployment | |
| US20080154624A1 (en) | System and method for monitoring, controlling, and displaying utility information | |
| US20060007016A1 (en) | Utilities and communication integrator | |
| KR101174254B1 (en) | Meter Data Management System for Smart Grid | |
| US10282794B2 (en) | System and method for determining energy and greenhouse gas (GHG) apportionment | |
| JP2013536666A (en) | Intelligent core engine | |
| Balan et al. | Development of smart energy monitoring using NB-IOT and cloud | |
| CN104620115A (en) | Power monitoring system and method | |
| US7991567B1 (en) | Centralized operating meter for energy technologies | |
| Chatzimisios et al. | A survey on smart grid communications: from an architecture overview to standardization activities | |
| US20200333165A1 (en) | Meter reading schema to enhance system functionality | |
| EP2520905A2 (en) | Calculation of auxiliary value based on meter data from non-smart electronic utility meter | |
| JP5874025B2 (en) | Remote meter reading system, information terminal, communication device, distribution board | |
| EP0834849B1 (en) | Metering Apparatus | |
| Arora et al. | A review on smart energy meters and their market trends | |
| EP2527794A2 (en) | Display of utility data | |
| Bin Rokan et al. | Towards a real IoT-based smart meter system | |
| Edemirukaye et al. | Implementation of an RF based wireless automated energy metering and billing system | |
| JP2015180111A (en) | Information terminal, communication device and distribution board | |
| CN210578654U (en) | Electrical equipment management system of power distribution room | |
| Manamperi et al. | Smart MCB with metering ability to optimize electricity usage |
Legal Events
| Date | Code | Title | Description |
|---|---|---|---|
| PUAI | Public reference made under article 153(3) epc to a published international application that has entered the european phase |
Free format text: ORIGINAL CODE: 0009012 |
|
| AK | Designated contracting states |
Kind code of ref document: A2 Designated state(s): AL AT BE BG CH CY CZ DE DK EE ES FI FR GB GR HR HU IE IS IT LI LT LU LV MC MK MT NL NO PL PT RO RS SE SI SK SM TR |
|
| AX | Request for extension of the european patent |
Extension state: BA ME |
|
| STAA | Information on the status of an ep patent application or granted ep patent |
Free format text: STATUS: THE APPLICATION IS DEEMED TO BE WITHDRAWN |
|
| 18D | Application deemed to be withdrawn |
Effective date: 20141202 |