EP2488870B1 - Multisite biosensor and associated method - Google Patents
Multisite biosensor and associated method Download PDFInfo
- Publication number
- EP2488870B1 EP2488870B1 EP10770679.8A EP10770679A EP2488870B1 EP 2488870 B1 EP2488870 B1 EP 2488870B1 EP 10770679 A EP10770679 A EP 10770679A EP 2488870 B1 EP2488870 B1 EP 2488870B1
- Authority
- EP
- European Patent Office
- Prior art keywords
- test sites
- test
- interest
- sample
- biomolecule
- Prior art date
- Legal status (The legal status is an assumption and is not a legal conclusion. Google has not performed a legal analysis and makes no representation as to the accuracy of the status listed.)
- Active
Links
Images




Classifications
-
- G—PHYSICS
- G01—MEASURING; TESTING
- G01N—INVESTIGATING OR ANALYSING MATERIALS BY DETERMINING THEIR CHEMICAL OR PHYSICAL PROPERTIES
- G01N33/00—Investigating or analysing materials by specific methods not covered by groups G01N1/00 - G01N31/00
- G01N33/48—Biological material, e.g. blood, urine; Haemocytometers
- G01N33/50—Chemical analysis of biological material, e.g. blood, urine; Testing involving biospecific ligand binding methods; Immunological testing
- G01N33/53—Immunoassay; Biospecific binding assay; Materials therefor
- G01N33/543—Immunoassay; Biospecific binding assay; Materials therefor with an insoluble carrier for immobilising immunochemicals
- G01N33/54393—Improving reaction conditions or stability, e.g. by coating or irradiation of surface, by reduction of non-specific binding, by promotion of specific binding
-
- G—PHYSICS
- G01—MEASURING; TESTING
- G01N—INVESTIGATING OR ANALYSING MATERIALS BY DETERMINING THEIR CHEMICAL OR PHYSICAL PROPERTIES
- G01N29/00—Investigating or analysing materials by the use of ultrasonic, sonic or infrasonic waves; Visualisation of the interior of objects by transmitting ultrasonic or sonic waves through the object
- G01N29/22—Details, e.g. general constructional or apparatus details
- G01N29/32—Arrangements for suppressing undesired influences, e.g. temperature or pressure variations, compensating for signal noise
-
- G—PHYSICS
- G01—MEASURING; TESTING
- G01N—INVESTIGATING OR ANALYSING MATERIALS BY DETERMINING THEIR CHEMICAL OR PHYSICAL PROPERTIES
- G01N33/00—Investigating or analysing materials by specific methods not covered by groups G01N1/00 - G01N31/00
- G01N33/48—Biological material, e.g. blood, urine; Haemocytometers
- G01N33/50—Chemical analysis of biological material, e.g. blood, urine; Testing involving biospecific ligand binding methods; Immunological testing
- G01N33/53—Immunoassay; Biospecific binding assay; Materials therefor
-
- G—PHYSICS
- G01—MEASURING; TESTING
- G01N—INVESTIGATING OR ANALYSING MATERIALS BY DETERMINING THEIR CHEMICAL OR PHYSICAL PROPERTIES
- G01N33/00—Investigating or analysing materials by specific methods not covered by groups G01N1/00 - G01N31/00
- G01N33/48—Biological material, e.g. blood, urine; Haemocytometers
- G01N33/50—Chemical analysis of biological material, e.g. blood, urine; Testing involving biospecific ligand binding methods; Immunological testing
- G01N33/53—Immunoassay; Biospecific binding assay; Materials therefor
- G01N33/543—Immunoassay; Biospecific binding assay; Materials therefor with an insoluble carrier for immobilising immunochemicals
-
- G—PHYSICS
- G01—MEASURING; TESTING
- G01N—INVESTIGATING OR ANALYSING MATERIALS BY DETERMINING THEIR CHEMICAL OR PHYSICAL PROPERTIES
- G01N33/00—Investigating or analysing materials by specific methods not covered by groups G01N1/00 - G01N31/00
- G01N33/48—Biological material, e.g. blood, urine; Haemocytometers
- G01N33/50—Chemical analysis of biological material, e.g. blood, urine; Testing involving biospecific ligand binding methods; Immunological testing
- G01N33/53—Immunoassay; Biospecific binding assay; Materials therefor
- G01N33/543—Immunoassay; Biospecific binding assay; Materials therefor with an insoluble carrier for immobilising immunochemicals
- G01N33/54366—Apparatus specially adapted for solid-phase testing
Definitions
- This invention relates to diagnostic tests and more specifically to affinity based diagnostic tests.
- Diagnostic tests that can be performed at the point of care of an individual, such as at the bedside of a patient, at a care provider location, or at the home of the patient, are becoming increasingly popular. Diagnostic tests include tests directed to identifying biomarkers such as Nucleic Acid, protein, and small molecules. Many of the diagnostic testing devices incorporate affinity based sensors which are considered to be the state-of-the-art in detection of biomarkers.
- Affinity based biosensors function according to a "key-lock" principal in which a molecule with very high association factor to the biomarker of interest is used for detection.
- a pregnancy test kit may incorporate a monoclonal antibody specific to a ⁇ -subunit of hCG ( ⁇ hCG).
- ⁇ hCG ⁇ -subunit of hCG
- the antibody is conjugated with a tag, e.g., gold, latex, or fluorophore, which is used for detection. If the targeted molecule binds with the conjugated antibody, the tagged key-lock pair will be detectable such as by a visible test line.
- FIG. 1 depicts an ELISA assay 10 wherein antibodies 12 are immobilized on a substrate 14.
- the substrate 14 may be positioned within a well (not shown).
- a blocker 16 is provided to cover the surface of the substrate around the antibody 12.
- a sample 18 is then added to the well in which the primary antibody 12 is immobilized.
- the sample is incubated for some time.
- the blocker 16 prevents the molecules of interest in the sample from binding to the surface of the substrate 14 in order to avoid false binding.
- some of the molecules of interest 18 become bound with some of the antibodies 12 as depicted in FIG. 2 .
- the remaining sample is washed to remove the unbound primary antibodies 18.
- a secondary antibody 20 with a bound label 22 is added to the well, incubated, and washed resulting in the configuration of FIG. 3 .
- the labeled secondary antibodies 20 are bound to the molecules of interest 18 that are in turn bound to the antibodies 12.
- the number of labels 22 bound by the antibodies 20 to the antigen 18 is proportional to the concentration of the target antigen.
- the number of labels can be finally detected using colorimetry, amperometry, magnetometry, voltammetry, luminescence, or fluorescence detection.
- Other label-free antibody processes such as surface plasmon resonance may alternatively be used.
- the two main figures-of-merit in a detection assay include sensitivity and cross-reactivity; both of which affect the minimum detectable concentration and the diagnosis error rate.
- the sensitivity in such tests is generally limited by label detection accuracy, association factor of the antibody-antigen pair, and the effective density of the probe antibody on the surface.
- an ELISA assay 30 includes antibodies 32 immobilized on a substrate 34 with a blocker 36 coating most of the surface of the substrate 32. Additionally, a labeled secondary antibody 38 is bound to a molecule of interest 40 which is in turn bound by the primary antibody 32. The labeled secondary antibody 38 has also bound to a molecule 42 which exhibited an affinity for the primary antibody 32 and to the labeled secondary antibody 38.
- the sensitivity to a broad range of biomarkers thus increases the false negative/positive rate of diagnostic tests at clinical level as reported, for example, by P.A Benn et al., "Estimates for the sensitivity and false-positive rates for second trimester serum screening for Down syndrome and trisomy 18 with adjustment for cross identification and doublepositive results," Prenatal Diagnosis, Vol. 21, No.1, pp 46-51, 2001 .
- the presence of other molecules (secondary molecules or antigens) in the sample thus affects the minimum detectable concentration by binding to the primary antibody.
- the accuracy of the assay may further be affected by physiosorption. As further depicted in FIG. 4 , some features 44 present in the ELISA assay 30, either contaminants or simply an incongruity, may also be bound to a labeled secondary antibody 38. The physiosorbed labeled secondary antibody 38 thus causes an increased background signal.
- a particular assay is typically optimized by finding a combination of reagents and environmental conditions that maximizes the binding of the molecule of interest to the antibody.
- optimization can entail incorporating highly selective antibodies.
- WO 2007/062666 A1 describes a fluidics device for an assay, wherein samples are exposed to a plurality of chambers with differing chemical and thermal conditions in each chamber to identify the optimal conditions for detecting each of the samples. Examples for suited samples are multiple DNA strands. When the optimal conditions are identified, the multiple DNA strands may be assayed on a single platform by providing each strand with its unique optimal condition.
- the present invention provides a method of detecting a concentration of a biomolecule of interest in a sample comprising: exposing the sample to a plurality of test sites, wherein the same selected capturing agent with an affinity for the biomolecule of interest is immobilized in each of the plurality of test sites; establishing, for each of the plurality of test sites, a respective test environment by controlling an environmental factor during the incubation of the sample, wherein the environmental factor of each of the plurality of test sites is different from the environmental factor of each of the other of the plurality of test sites; washing the plurality of test sites after the sample has been incubated; introducing and incubating a labeled secondary antibody with an affinity for the biomolecule of interest into the plurality of test sites; washing the plurality of test sites after the labeled secondary antibody has been incubated; obtaining a detection signal associated with each of the plurality of test sites of the labeled secondary antibody remaining in said test site; and determining the concentration of the biomolecule of interest based upon the obtained detection signals; characterized in that
- the biosensor system 100 includes an I/O device 102, a processing circuit 104 and a memory 106.
- the I/O device 102 may include a user interface, graphical user interface, keyboards, pointing devices, remote and/or local communication links, displays, and other devices that allow externally generated information to be provided to the biosensor system 100, and that allow internal information of the biosensor system 100 to be communicated externally.
- the processing circuit 104 may suitably be a general purpose computer processing circuit such as a microprocessor and its associated circuitry.
- the processing circuit 104 is operable to carry out the operations attributed to it herein.
- the program instructions 108 are executable by the processing circuit 104 and/or any other components as appropriate.
- Affinity databases 110 are also located within the memory 106.
- the biosensor system 100 further includes environment control equipment 112 and environment detector suite 114.
- the environment control equipment 112 is configured to establish and maintain environmental conditions, in this example, within a microarray 120 depicted in FIG. 6 .
- Various methods may be used to form the microarray platform 120.
- U.S. Patent No. 5,807,522 discloses a method for forming microarrays.
- the microarray platform 120 includes a number of different subarrays 122.
- the subarrays 122 include a number of test sites 124.
- the number of subarrays 122 as well as the number of test sites 124 within each of the subarrays 122 may be varied within the scope of the invention.
- the environment control equipment 112 is operable to establish a temperature profile within the microarray platform 120. The precise temperature within each of the test sites 124 may be detected by the detector suite 114.
- the system 100 further includes a label reader 116.
- the label reader 116 may be included in a single device along with the other components of the system 100. Alternatively, one or more of the components of the system 100 may be provided as a separate device which may be remotely located from the other components of the system 100.
- the test sites 124 are prepared with a capturing agent effective for capturing a biomolecule of interest. Further details regarding the biosensor system 100 are provided with reference to the procedure 130 of FIG. 7 .
- the processor 104 executes the program instructions 108 to execute at least some of the procedure 130 of FIG. 7 . In different embodiments, the procedure 130 may be modified to include more or fewer steps depending upon the specific criterion.
- a molecule of interest is identified and then an antibody with an affinity for the molecule of interest is identified (block 134).
- a binding efficiency coefficient for the molecule of interest ( ⁇ i ) with the identified antibody is then identified for at least two different environmental conditions (block 136) and stored in one of the affinity databases 110 (block 138).
- Potential sources of test signal interference or noise likely to be present in a tested sample are then identified (block 140).
- the identification of signal interference may include, for example, an identification of likely or potential molecules within a sample that also have an affinity for the identified antibody.
- a binding efficiency coefficient for each source of noise ( ⁇ n ) with the identified antibody is then identified for each of the different environmental conditions (block 142) and stored in one of the affinity databases 110 (block 144).
- the microarray platform 120 is prepared by depositing the desired amount of the selected capturing agent in each of the test sites 124.
- a subset of the test sites 124 may be prepared with a first capturing agent while another subset of the test sites 124 may be prepared with a second capturing agent so as to allow two separate tests to be conducted within a single microarray platform 120. Additional configurations within a single microarray platform 120 may also be used.
- each of the test sites within one of the subarrays 122 may be prepared with the same capturing agent while each of the subarrays 122 includes a different capturing agent.
- the number of test sites 124 prepared with a particular capturing agent in this embodiment is selected to be at least the same as the number of noise sources identified above plus the molecule of interest.
- a sample is introduced into the selected set of test sites 124 (block 148).
- the environment within each of the selected set of test sites 124 is controlled to establish, within each of the selected set of test sites 124, a different test environment (block 150).
- the environmental condition that is controlled is temperature.
- a thermal profile is established across the microarray platform 120. Depending upon the particular embodiment, this may be accomplished by providing a unique heater/cooler for each of the selected set of test sites 124 or subarrays 122. In other embodiments, heat is applied at one end of the microarray platform 120 and a heat sink is thermally attached to the opposite end of the microarray platform 120 to establish a thermal gradient across the microarray platform 120.
- the sample is then incubated at the established test environment for a predetermined time (block 152).
- the actual test environment within each of the selected set of test sites 124 is monitored by the environment detector suite 114 and data indicative of the established test environment is provided to the processing circuit 104 (block 154).
- the test sites 124 are washed (block 156) and a labeled secondary antibody is introduced into the selected set of test sites 124 (block 158) and incubated (block 160).
- the selected set of test sites 124 are then washed (block 162) and the labels remaining in the test sites 124 are detected by the label reader 116 (block 164). Based upon the signals associated with the number of labels remaining in the selected set of test sites 124, the concentration of one or more molecules of interest within the sample is calculated by the processing circuit 104.
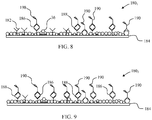
- FIG. 8 depicts a test site 180 1 including antibodies 182 formed on a substrate 184.
- Antigen 186 has been bound to some of the antibodies 182.
- Some interfering antigen 188 has also bound to some of the antibodies 182.
- a labeled secondary antibody 190 has bound to each of the bound antigens 186 and each of the bound interfering antigens 188.
- Some of the labeled secondary antibody 190 has also physiosorbed to the blocked surface of the substrate 184.
- the relative proportion of the signal attributable to each of the contributors is dependent upon the concentration of the particular contributor, the concentration of the other contributors, and the relative affinity to the initially deposited capturing agent of each of the contributors.
- FIG. 9 depicts a test site 180 2 which was prepared identically to the test site 180 1 and exposed to a sample identical to the sample used with the test site 180 1 .
- the test environment in each of the test sites 180 x was different. Accordingly, the labeled secondary antibody 190 bound to the molecule of interest has increased from two in FIG. 8 to four in FIG. 9 . Additionally, the labeled secondary antibody 190 bound to the interfering antigen has increased from two in FIG. 8 to three in FIG. 9 .
- test sites such as four of the test sites 124, are the minimum number of cells prepared at block 144.
- Each term is thus proportional to a binding efficiency factor, ⁇ , which is a function of the molecule affinities and other assay conditions, e.g., mass transport. Accordingly, because the same sample is used in each of the test sites 124, and because the binding efficiency of the molecule of interest and the interfering antigens for the specific environment in each of the test sites 124 is known, the procedure 130 provides four equations and four unknowns. The concentrations of each of the contributors can thus be ascertained in a known manner. Accordingly, the concentrations of multiple molecules of interest within a sample can also be ascertained. In practice the signals are noisy and linear estimation algorithms may be used to estimate the value used for any particular signal. Additionally, one or more sensor sites may be used as a control site to improve the accuracy of the procedure 130.
- An important consideration in selecting the environmental factor(s) controlled at block 148 is ensuring that the binding efficiency factors for each of the contributors do not exhibit a linear change compared with the binding efficiency factors for the other contributors for the different environments selected for each of the selected set of test sites 124.
- An environmental factor which results in large differences in binding efficiency between the signal contributors in a sample will improve accuracy.
- a single environmental factor will provide sufficient differences in binding efficiencies. If needed, however, multiple factors may be modified in various combinations to provide sufficient data to resolve the unknown quantities. As additional factors are included, the minimum number of test sites and the complexity of the subsequent computations are also increased.
- the temperature within each of the test sites 124 was controlled to provide different binding efficiencies.
- a temperature gradient within the chip can be established using on-chip resistors such as polysilicon resistors or integrated Peltier elements.
- Low power on-chip temperature sensors can be used to accurately measure the temperature within each of the test sites.
- a multisite biosensor can thus be implemented on a printed circuit board, glass, plastic substrate, or on a CMOS chip with gold, glass, epoxy, polymer, or gel coating, or even in a well plate such as a 96 well plate. If desired, control, readout, and also sensing for the control can be provided in the printed circuit board or CMOS chip.
- CMOS technology allows multiple sensing sites to be fabricated in close proximity. This assists in maintaining uniformity of non-controlled environmental factors amongst the test sites.
- the chip can be part of a system using stand alone microfluidics or a capillary principle or may used with a separately provided device.
- the signal estimation and the assay data can be hard coded on the CMOS chip if desired.
- the electric field within each of the test sites may be controlled to be different from the electric field within each of the other of the test sites.
- the electric field can be used to modify, e.g., local concentrations, pH, etc.
- the underlying mechanisms include electrolysis and ion attraction.
- the use of an AC signal may further provide local mixing by creating movement of ions within the sample, e.g., through electrohydrodaynamic effects.
- Many voltage ranges which provide the foregoing effects are CMOS compatible. Accordingly, a CMOS chip with surface electrodes may be used. Depending upon the desired effect, one, two or more electrodes may be provided at a particular test site and either exposed or isolated from the test sample.
- Another fabrication method incorporates glass slides with electrodes (e.g., ITO, gold) or plastic or paper membrane with printed electrodes (e.g., carbon, gold, silver).
- the magnetic beads are functionalized with molecules that have high affinity against a range of biomolecules, e.g., antibody, epoxy, Nucleic Acid, or aptamers. As the magnetic beads are moved across the sensor sites, different molecules will bind to them at different rates, thereby scraping the surfaces of the test sites and "cleaning" the test sites. Controlling the magnetic field within the test sites affects the extent of "cleaning” that occurs at each test site, thereby modifying the binding efficiency of different molecules depending upon the strength of the bonds formed between the molecules and the antibodies.
- An external magnet may be used in various embodiments to bias the magnetic field to the desired values since CMOS integrated coils can only generate moderate magnetic fields.
- a further embodiment used to establish different test environments incorporates multiple capturing agents in preparing the test sites.
- the recipe for the capturing agents in each of the test sites may be different antibodies, aptamers, Nucleic Acid, or other biomolecules.
- the capturing agent may be useful even if the capturing agent is not very specific.
- a similar embodiment achieves changes in the binding efficiencies of one or more contributors by a recipe with a modification of the concentration of a single capturing agent between multiple sites.
- Another approach is to modulate the affinities using different pressure at different test sites while washing the spots. Pressure modification can be achieved in a fluidic setup.
- the type of sensor or sensors incorporated into the label reader 116 will vary depending upon the particular label used. Various embodiments may thus use luminescence, fluorescence, colorimetric, electrochemical, impedance, and magnetic sensors. The sensors should be configured to allow isolation of the signal produced by a selected one or more test sites. Likewise, the sensors incorporated into the environment detector suite 114 may include IR sensors, and Hall sensors. AMR sensors or GMR sensors may be provided to monitor the density of magnetic beads on a test site surface. ISFETs or CMOS based charge detection circuits may be used in electrochemical embodiments.
- the effectiveness of the procedure 130 was verified using a simulation model based upon parameters extracted from an experiment with mouse anti-streptavidin monoclonal antibody and rabbit anti-streptavidin polyclonal antibody.
- the two different antibodies were differentiated by modulating the affinities of the antibodies at two different test sites by establishing two different temperatures at the two test sites while using the same labels and same capture molecule at both test sites.
- the detected signal for varying concentrations of an AB diamond antibody was derived.
- the results of the signal from pure samples of the AB diamond antibody are depicted in the graph 400 of FIG. 10 .
- the graph 400 indicates that as the concentration of the AB diamond antibody was increased from 1, to 2, to 4, and then to 8 pg/ml, the detected signal increased in a substantially linear fashion.
- FIG. 11 depicts a graph 410 of the signal obtained when the AB diamond antibody was increased from 1, to 2, to 4, and then to 8 pg/ml in the presence of an AB circle antibody of varying concentrations.
- the AB diamond antibody and the AB circle antibody exhibited similar binding efficiencies at the temperature selected for the modeling which resulted in the graph 410.
- the concentration of the AB circle antibody was varied from 8, to 4, to 8, and back to 4 pg/ml, respectively.
- the graph 410 indicates that the presence of the AB circle antibody masked the signal resulting from the AB diamond antibody.
- the binding efficiency of the AB diamond antibody and the AB circle antibody were modeled with a 6% error, for two different temperatures.
- the binding efficiency of the AB diamond antibody, normalized to the binding efficiency at a first test site was reduced to 0.6 at a second test site.
- the binding efficiency of the AB circle antibody, normalized to the binding efficiency at the first test site was reduced to 0.3 at the second test site.
- the same combinations of AB diamond antibody and AB circle antibody used in generating the graph 410 where then used to generate data using the procedure 130 of FIG. 3 with a temperature difference between the two test sites.
- the results obtained from the simulation scenario are shown in graph 420 of FIG. 12 .
- the computed detected signal based upon the procedure 130 resulting from the AB diamond antibody is depicted as line 422.
- the signal based upon pure AB diamond antibody that was shown in FIG. 4 is depicted as line 424.
- a comparison of the slope of the lines 422 and 424 show a good correlation between the derived signal (line 422) and the actual signal (line 424) with less than 10% variation.
- the procedure 130 of FIG. 3 was also verified experimentally by using the calculations therein to predict a combined signal obtained from combinations of different antibodies at different temperatures.
- test sites on a streptavidin plate with rabbit pAb, mouse mAb, and biotin were exposed to different temperatures.
- One test site was established at 23°C and a second test site was established at 47°C.
- the increased temperature resulted in increased binding efficiencies for the pAb, mAb, and biotin of 2.5x, 1.9x, and 1x, respectively.
- the detected signal resulting from differing concentrations of the pAb, and mAb antibodies are depicted in graph 430 of FIG. 13 .
- the line 432 depicts the detected signal from pure samples of pAb at 23°C and the line 434 depicts the detected signal from pure samples of pAb at 47°C.
- the line 436 depicts the detected signal obtained from pure samples of mAb at 23°C and the line 438 depicts the detected signal from pure samples of mAb at 47°C.
- the triangles 440 depict the predicted signal that would be obtained from samples of pAb/mAb mixed at a 1:1 ratio at 23°C and the diamonds 442 depict the predicted signal that would be obtained from samples of pAb/mAb mixed at a 1:1 ratio at 47°C based upon the procedure 130.
- the experiment was then conducted with the pAb and mAb combined in a 1:1 ratio and the signal was obtained for various concentrations.
- the plus signs (+) 444 depict the experimental signal obtained from mixed samples of pAb/mAb at 23°C and the squares 446 depict the experimental signal obtained from mixed samples of pAb/mAb at 47°C.
- FIG. 13 indicates that a good correlation between the slopes of the predicted signals and the experimental signals was realized.
- FIG. 14 A further comparison of experimental versus predicted signals is provided in FIG. 14 .
- the data points depicted as circles 450 show the correlation between the predicted signal and the experimental signal for mixed samples of pAb/mAb at 23°C and the squares 452 depict the correlation between the predicted signal and the experimental signal for mixed samples of pAb/mAb at 47°C.
- the concentration of a molecule of interest can thus be obtained even in the presence of other antibodies which generate an increase in the detected signal of a label.
- the background noise for a particular assay may also significantly increase the detected signal.
- Various advanced detection and control processes may be used to reduce or eliminate such background noise to increase the sensitivity of the procedure 130.
- the procedure 130 can thus be used in a variety of test site platforms including 96-well plates, plates with fewer or additional wells, microarray platforms, printed circuit board platforms, CMOS chip platforms, multiplexed assays, protein arrays, lateral flow devices, sandwich assays, competitive assays, bead based arrays or other appropriate platforms.
- the procedure 130 may further be used for the detection of a variety of molecules of interest as well as different types of molecules in addition to antibodies.
- the procedure 130 may also be used for the detection of Nucleic Acid, protein, or small molecules.
Landscapes
- Health & Medical Sciences (AREA)
- Life Sciences & Earth Sciences (AREA)
- Immunology (AREA)
- Engineering & Computer Science (AREA)
- Chemical & Material Sciences (AREA)
- Urology & Nephrology (AREA)
- Hematology (AREA)
- Biomedical Technology (AREA)
- Molecular Biology (AREA)
- Physics & Mathematics (AREA)
- Pathology (AREA)
- General Physics & Mathematics (AREA)
- General Health & Medical Sciences (AREA)
- Biochemistry (AREA)
- Analytical Chemistry (AREA)
- Microbiology (AREA)
- Medicinal Chemistry (AREA)
- Food Science & Technology (AREA)
- Cell Biology (AREA)
- Biotechnology (AREA)
- Chemical Kinetics & Catalysis (AREA)
- Apparatus Associated With Microorganisms And Enzymes (AREA)
- Investigating Or Analysing Biological Materials (AREA)
- Investigating Or Analysing Materials By The Use Of Chemical Reactions (AREA)
Description
- This invention relates to diagnostic tests and more specifically to affinity based diagnostic tests.
- Diagnostic tests that can be performed at the point of care of an individual, such as at the bedside of a patient, at a care provider location, or at the home of the patient, are becoming increasingly popular. Diagnostic tests include tests directed to identifying biomarkers such as Nucleic Acid, protein, and small molecules. Many of the diagnostic testing devices incorporate affinity based sensors which are considered to be the state-of-the-art in detection of biomarkers.
- Affinity based biosensors function according to a "key-lock" principal in which a molecule with very high association factor to the biomarker of interest is used for detection. For example, a pregnancy test kit may incorporate a monoclonal antibody specific to a β-subunit of hCG (βhCG). The antibody is conjugated with a tag, e.g., gold, latex, or fluorophore, which is used for detection. If the targeted molecule binds with the conjugated antibody, the tagged key-lock pair will be detectable such as by a visible test line.
- ELISA plates and microarrays (e.g., Nucleic Acid, peptide, and protein) incorporate a similar principal.
FIG. 1 depicts an ELISAassay 10 whereinantibodies 12 are immobilized on asubstrate 14. Thesubstrate 14 may be positioned within a well (not shown). Ablocker 16 is provided to cover the surface of the substrate around theantibody 12. In a typical ELISA assay, asample 18 is then added to the well in which theprimary antibody 12 is immobilized. Next, the sample is incubated for some time. During incubation, theblocker 16 prevents the molecules of interest in the sample from binding to the surface of thesubstrate 14 in order to avoid false binding. During incubation, some of the molecules ofinterest 18 become bound with some of theantibodies 12 as depicted inFIG. 2 . After incubation, the remaining sample is washed to remove the unboundprimary antibodies 18. - Subsequently, a
secondary antibody 20 with a boundlabel 22 is added to the well, incubated, and washed resulting in the configuration ofFIG. 3 . As depicted inFIG. 3 , the labeledsecondary antibodies 20 are bound to the molecules ofinterest 18 that are in turn bound to theantibodies 12. Accordingly, the number oflabels 22 bound by theantibodies 20 to theantigen 18 is proportional to the concentration of the target antigen. Depending on the label used, the number of labels can be finally detected using colorimetry, amperometry, magnetometry, voltammetry, luminescence, or fluorescence detection. Other label-free antibody processes such as surface plasmon resonance may alternatively be used. - The two main figures-of-merit in a detection assay include sensitivity and cross-reactivity; both of which affect the minimum detectable concentration and the diagnosis error rate. The sensitivity in such tests is generally limited by label detection accuracy, association factor of the antibody-antigen pair, and the effective density of the probe antibody on the surface.
- One issue that arises with affinity based sensors is the cross-reactivity of the sensor to other biomarkers. In other words, rather than sensing a single biomarker or molecule of interest, a sensor tends to also sense biomarkers other than the biomarker of interest. The cross-reactivity issue is depicted in
FIG. 4 wherein anELISA assay 30 includesantibodies 32 immobilized on asubstrate 34 with ablocker 36 coating most of the surface of thesubstrate 32. Additionally, a labeledsecondary antibody 38 is bound to a molecule ofinterest 40 which is in turn bound by theprimary antibody 32. The labeledsecondary antibody 38 has also bound to amolecule 42 which exhibited an affinity for theprimary antibody 32 and to the labeledsecondary antibody 38. The sensitivity to a broad range of biomarkers thus increases the false negative/positive rate of diagnostic tests at clinical level as reported, for example, by P.A Benn et al., "Estimates for the sensitivity and false-positive rates for second trimester serum screening for Down syndrome and . The presence of other molecules (secondary molecules or antigens) in the sample thus affects the minimum detectable concentration by binding to the primary antibody. - The accuracy of the assay may further be affected by physiosorption. As further depicted in
FIG. 4 , some features 44 present in theELISA assay 30, either contaminants or simply an incongruity, may also be bound to a labeledsecondary antibody 38. The physiosorbed labeledsecondary antibody 38 thus causes an increased background signal. - In an effort to mitigate the various sensitivity and interference issues involved with affinity based testing, a particular assay is typically optimized by finding a combination of reagents and environmental conditions that maximizes the binding of the molecule of interest to the antibody. Thus, optimization can entail incorporating highly selective antibodies.
- Overcoming the cross-reactivity and background problems can significantly delay development of a new assay test and can increase the cost and complexity of the overall test. For example a typical development of an ELISA assay requires several scientists working for more than a year to identify an acceptable antibody. Cross-reactivity of proteins is a common source of the failure of such development efforts.
- The issue of broad biomarker sensitivity can also be mitigated by incorporating a number of different affinity based sensors into a test device and then determining the relative concentrations of biomarkers. This approach, however, increases the cost of manufacturing the test device and the costs associated with processing the test device.
- A need exists for a device and method of performing an assay incorporating low cost antibodies. A further need exists for low cost assays including multiplexed assays, protein arrays, lateral flow devices, sandwich assays, competitive assays, or bead based arrays which provide accurate results and a method of using such arrays. Methods and devices which provide more accurate results than so-called optimized assays would be a further benefit.
-
WO 2007/062666 A1 describes a fluidics device for an assay, wherein samples are exposed to a plurality of chambers with differing chemical and thermal conditions in each chamber to identify the optimal conditions for detecting each of the samples. Examples for suited samples are multiple DNA strands. When the optimal conditions are identified, the multiple DNA strands may be assayed on a single platform by providing each strand with its unique optimal condition. - Further devices and methods for detection a biomolecule are described in
EP 0 574 782 A2WO 2007/127981 A2 ,US 7 087 373 B2 ,US 7 892 854 B2 and O'Connor T. et al "The dependence of radioimmunoassay detection limits on antibody affinity" (JOURNAL OF IMMUNOLOGICAL METHODS, ELSEVIER SCIENCE PUBLISHERS B.V., Amsterdam; NL, vol. 208, no. 2, 27 October 1997 (1997-10-27), pages 181- 189). - The present invention provides a method of detecting a concentration of a biomolecule of interest in a sample comprising: exposing the sample to a plurality of test sites, wherein the same selected capturing agent with an affinity for the biomolecule of interest is immobilized in each of the plurality of test sites; establishing, for each of the plurality of test sites, a respective test environment by controlling an environmental factor during the incubation of the sample, wherein the environmental factor of each of the plurality of test sites is different from the environmental factor of each of the other of the plurality of test sites; washing the plurality of test sites after the sample has been incubated; introducing and incubating a labeled secondary antibody with an affinity for the biomolecule of interest into the plurality of test sites; washing the plurality of test sites after the labeled secondary antibody has been incubated; obtaining a detection signal associated with each of the plurality of test sites of the labeled secondary antibody remaining in said test site; and determining the concentration of the biomolecule of interest based upon the obtained detection signals; characterized in that the number of different biomolecule types of the biomolecule of interest plus the noise contributing biomolecules in the sample that bind non-specifically to the capturing agent or a surface of the test sites is identified, wherein the number of test sites prepared in the plurality of test sites is selected to be equal to or greater than the identified number; and binding efficiencies for each of the biomolecule of interest and the noise contributing biomolecules for each of the test environments of the plurality of test sites are identified and utilized in the determination of the concentration.
-
-
FIG. 1 depicts a schematic of a prior art test site within an ELISA array with an antibody and blockers formed on a substrate as a sample is added to the test site; -
FIG. 2 depicts the test site ofFIG 1 with a molecule of interest bound to some of the antibodies ofFIG. 1 after the test site has been incubated and washed; -
FIG. 3 depicts the test site ofFIG 2 after a labeled secondary antibody has been added and the test site has again been incubated and washed so that the labeled secondary is bound to the bound molecules of interest; -
FIG. 4 depicts a schematic of a prior art test site within an ELISA array wherein a labeled secondary is bound to interfering molecules due to cross-reactivity and also physiosorbed to the surface of the substrate raising the background noise level of the test; -
FIG. 5 depicts a multi-site biosensor system configured to expose a single sample to different environmental conditions allowing determination of the concentration of a molecule of interest in a sample including other molecules which increase the detected signal; -
FIG. 6 depicts a platform for providing a number of different test sites in the form of a microarray; -
FIG. 7 depicts a procedure that can be used to establish different test environments at various test sites on a platform so as to expose a sample to multiple test environments; -
FIG. 8 depicts a schematic of a test site wherein a labeled secondary is bound to molecules of interest, to interfering molecules due to cross-reactivity, and also physiosorbed to the surface of the substrate raising the background noise level of the test; -
FIG. 9 depicts a schematic of a test site formed identically to the test site ofFIG. 8 and exposed to the same sample to which the test site ofFIG. 8 was exposed, but maintained at a temperature different from the temperature of the test site ofFIG. 8 during incubation, resulting in different binding efficiencies for the different signal contributors; -
FIG. 10 depicts a graph of a modeled detected signal for samples of different concentrations of a molecule of interest showing a linear increase in the detected signal as the concentration of the molecule of interest in the samples increases; -
FIG. 11 depicts a graph of the modeled detected signal for samples of different concentrations of a molecule of interest, and another molecule which increases the detected signal, showing the signal resulting from the molecule of interest to be masked by the signal resulting from the other molecule; -
FIG. 12 depicts a graph of the calculated signal contribution from the molecule of interest in a number of samples after correcting for the increased signal resulting from another molecule using the procedure ofFIG. 7 ; -
FIG. 13 depicts a graph of the detected signal resulting from samples of two different antibodies at two different temperatures along with the predicted and measured signal resulting from a sample including two antibodies; and -
FIG. 14 depicts a graph of the correlation between the predicted and measured signals resulting from a sample including both of the antibodies ofFIG. 13 . - For the purposes of promoting an understanding of the principles of the invention, reference will now be made to the embodiments illustrated in the drawings and described in the following written specification.
- Referring to
FIG. 5 , there is depicted a representation of a multisite biosensor system generally designated 100. Thebiosensor system 100 includes an I/O device 102, aprocessing circuit 104 and amemory 106. The I/O device 102 may include a user interface, graphical user interface, keyboards, pointing devices, remote and/or local communication links, displays, and other devices that allow externally generated information to be provided to thebiosensor system 100, and that allow internal information of thebiosensor system 100 to be communicated externally. - The
processing circuit 104 may suitably be a general purpose computer processing circuit such as a microprocessor and its associated circuitry. Theprocessing circuit 104 is operable to carry out the operations attributed to it herein. - Within the
memory 106 arevarious program instructions 108. Theprogram instructions 108, some of which are described more fully below, are executable by theprocessing circuit 104 and/or any other components as appropriate.Affinity databases 110 are also located within thememory 106. - The
biosensor system 100 further includesenvironment control equipment 112 andenvironment detector suite 114. Theenvironment control equipment 112 is configured to establish and maintain environmental conditions, in this example, within amicroarray 120 depicted inFIG. 6 . Various methods may be used to form themicroarray platform 120. By way of example,U.S. Patent No. 5,807,522 discloses a method for forming microarrays. Themicroarray platform 120 includes a number ofdifferent subarrays 122. Thesubarrays 122 include a number oftest sites 124. The number ofsubarrays 122 as well as the number oftest sites 124 within each of thesubarrays 122 may be varied within the scope of the invention. In this embodiment, theenvironment control equipment 112 is operable to establish a temperature profile within themicroarray platform 120. The precise temperature within each of thetest sites 124 may be detected by thedetector suite 114. - The
system 100 further includes alabel reader 116. Thelabel reader 116 may be included in a single device along with the other components of thesystem 100. Alternatively, one or more of the components of thesystem 100 may be provided as a separate device which may be remotely located from the other components of thesystem 100. - The
test sites 124 are prepared with a capturing agent effective for capturing a biomolecule of interest. Further details regarding thebiosensor system 100 are provided with reference to theprocedure 130 ofFIG. 7 . Theprocessor 104 executes theprogram instructions 108 to execute at least some of theprocedure 130 ofFIG. 7 . In different embodiments, theprocedure 130 may be modified to include more or fewer steps depending upon the specific criterion. - At
block 132, a molecule of interest is identified and then an antibody with an affinity for the molecule of interest is identified (block 134). A binding efficiency coefficient for the molecule of interest (αi) with the identified antibody is then identified for at least two different environmental conditions (block 136) and stored in one of the affinity databases 110 (block 138). - Potential sources of test signal interference or noise likely to be present in a tested sample are then identified (block 140). The identification of signal interference may include, for example, an identification of likely or potential molecules within a sample that also have an affinity for the identified antibody. A binding efficiency coefficient for each source of noise (αn) with the identified antibody is then identified for each of the different environmental conditions (block 142) and stored in one of the affinity databases 110 (block 144).
- At
block 146, themicroarray platform 120 is prepared by depositing the desired amount of the selected capturing agent in each of thetest sites 124. In alternative embodiments, a subset of thetest sites 124 may be prepared with a first capturing agent while another subset of thetest sites 124 may be prepared with a second capturing agent so as to allow two separate tests to be conducted within asingle microarray platform 120. Additional configurations within asingle microarray platform 120 may also be used. By way of example, each of the test sites within one of thesubarrays 122 may be prepared with the same capturing agent while each of thesubarrays 122 includes a different capturing agent. The number oftest sites 124 prepared with a particular capturing agent in this embodiment is selected to be at least the same as the number of noise sources identified above plus the molecule of interest. - Once the
microarray platform 120 is prepared, a sample is introduced into the selected set of test sites 124 (block 148). If not already established, the environment within each of the selected set oftest sites 124 is controlled to establish, within each of the selected set oftest sites 124, a different test environment (block 150). In this example, the environmental condition that is controlled is temperature. Accordingly, a thermal profile is established across themicroarray platform 120. Depending upon the particular embodiment, this may be accomplished by providing a unique heater/cooler for each of the selected set oftest sites 124 orsubarrays 122. In other embodiments, heat is applied at one end of themicroarray platform 120 and a heat sink is thermally attached to the opposite end of themicroarray platform 120 to establish a thermal gradient across themicroarray platform 120. - The sample is then incubated at the established test environment for a predetermined time (block 152). During the incubation, the actual test environment within each of the selected set of
test sites 124 is monitored by theenvironment detector suite 114 and data indicative of the established test environment is provided to the processing circuit 104 (block 154). When the sample has been sufficiently incubated, thetest sites 124 are washed (block 156) and a labeled secondary antibody is introduced into the selected set of test sites 124 (block 158) and incubated (block 160). The selected set oftest sites 124 are then washed (block 162) and the labels remaining in thetest sites 124 are detected by the label reader 116 (block 164). Based upon the signals associated with the number of labels remaining in the selected set oftest sites 124, the concentration of one or more molecules of interest within the sample is calculated by theprocessing circuit 104. - Calculation of the concentration of one or more molecules of interest is possible since the signal obtained by the
label reader 116 for a particular one of the selected set oftest sites 124 is the summation of the contributors to the signal including the molecule of interest, and each of the noise sources such as interfering molecules. By way of example,FIG. 8 depicts a test site 1801 includingantibodies 182 formed on asubstrate 184.Antigen 186 has been bound to some of theantibodies 182. Some interferingantigen 188 has also bound to some of theantibodies 182. A labeledsecondary antibody 190 has bound to each of the boundantigens 186 and each of the bound interferingantigens 188. Some of the labeledsecondary antibody 190 has also physiosorbed to the blocked surface of thesubstrate 184. - The relative proportion of the signal attributable to each of the contributors is dependent upon the concentration of the particular contributor, the concentration of the other contributors, and the relative affinity to the initially deposited capturing agent of each of the contributors. The relationship is reflected in the following equation:

- S1 is the signal associated with the detected label in the
spot 1221, - α1-1 is the binding efficiency proportional to affinity for the identified contributor (1 through x) at the environment established in
spot 1221, and - C is the concentration in the sample of the identified contributor (1 through x).
- Accordingly, because the number of the selected set of
test sites 124 is equal to at least the number of interfering contributors plus one, the number of detected signals will correspond to the number of identified interfering contributors plus the molecule of interest. The contribution of the various sources to the overall signal, as well as the value of the overall signal, will vary from test site to test site. For example,FIG. 9 depicts a test site 1802 which was prepared identically to the test site 1801 and exposed to a sample identical to the sample used with the test site 1801. The test environment in each of the test sites 180x was different. Accordingly, the labeledsecondary antibody 190 bound to the molecule of interest has increased from two inFIG. 8 to four inFIG. 9 . Additionally, the labeledsecondary antibody 190 bound to the interfering antigen has increased from two inFIG. 8 to three inFIG. 9 . - Thus, if three noise contributors are identified in a sample, such as analytes that bind non-specifically to primary antibody sites and prevent the biomarker to bind, analytes that form a sandwich and produce erroneous signals, and analytes that physisorb to the surface of the test site and produce erroneous signals, along with the molecule of interest, four test sites, such as four of the
test sites 124, are the minimum number of cells prepared atblock 144. Therefore, four signals will be obtained, as reflected in the following equations:


- Each term is thus proportional to a binding efficiency factor, α, which is a function of the molecule affinities and other assay conditions, e.g., mass transport. Accordingly, because the same sample is used in each of the
test sites 124, and because the binding efficiency of the molecule of interest and the interfering antigens for the specific environment in each of thetest sites 124 is known, theprocedure 130 provides four equations and four unknowns. The concentrations of each of the contributors can thus be ascertained in a known manner. Accordingly, the concentrations of multiple molecules of interest within a sample can also be ascertained. In practice the signals are noisy and linear estimation algorithms may be used to estimate the value used for any particular signal. Additionally, one or more sensor sites may be used as a control site to improve the accuracy of theprocedure 130. - An important consideration in selecting the environmental factor(s) controlled at
block 148 is ensuring that the binding efficiency factors for each of the contributors do not exhibit a linear change compared with the binding efficiency factors for the other contributors for the different environments selected for each of the selected set oftest sites 124. An environmental factor which results in large differences in binding efficiency between the signal contributors in a sample will improve accuracy. Optimally, a single environmental factor will provide sufficient differences in binding efficiencies. If needed, however, multiple factors may be modified in various combinations to provide sufficient data to resolve the unknown quantities. As additional factors are included, the minimum number of test sites and the complexity of the subsequent computations are also increased. - In the foregoing example, the temperature within each of the
test sites 124 was controlled to provide different binding efficiencies. In embodiments incorporating CMOS technology, a temperature gradient within the chip can be established using on-chip resistors such as polysilicon resistors or integrated Peltier elements. Low power on-chip temperature sensors can be used to accurately measure the temperature within each of the test sites. A multisite biosensor can thus be implemented on a printed circuit board, glass, plastic substrate, or on a CMOS chip with gold, glass, epoxy, polymer, or gel coating, or even in a well plate such as a 96 well plate. If desired, control, readout, and also sensing for the control can be provided in the printed circuit board or CMOS chip. CMOS technology allows multiple sensing sites to be fabricated in close proximity. This assists in maintaining uniformity of non-controlled environmental factors amongst the test sites. The chip can be part of a system using stand alone microfluidics or a capillary principle or may used with a separately provided device. The signal estimation and the assay data can be hard coded on the CMOS chip if desired. - Temperature is not the only environmental factor which can be used to establish different test environments. The electric field in which incubation is conducted has been shown to modify the binding efficiencies of molecules as reported by F.A. Armstrong, "Recent developments in dynamic electrochemical studies of adsorbed enzymes and their active sites," Current Opinion in Chemical Biology, Vol. 9, No. 2, pp 110-117, 2005, R.J. Heaton et al., "Electrostatic surface plasmon resonance: direct electric field-induced hybridization and denaturation in monolayer nucleic acid films and label-free discrimination of base mismatches," Proceedings of National Academy of Science, Vol. 98, No. 7, pp. 3701-3704, 2001, and I. Wong et al., "Dynamic control of biomolecular activity using electrical interfaces," Soft Matter,Vol. 3, No. 3, pp 267-274, 2007.
- In some embodiments, the electric field within each of the test sites may be controlled to be different from the electric field within each of the other of the test sites. The electric field can be used to modify, e.g., local concentrations, pH, etc. The underlying mechanisms include electrolysis and ion attraction. The use of an AC signal may further provide local mixing by creating movement of ions within the sample, e.g., through electrohydrodaynamic effects. Many voltage ranges which provide the foregoing effects are CMOS compatible. Accordingly, a CMOS chip with surface electrodes may be used. Depending upon the desired effect, one, two or more electrodes may be provided at a particular test site and either exposed or isolated from the test sample. Another fabrication method incorporates glass slides with electrodes (e.g., ITO, gold) or plastic or paper membrane with printed electrodes (e.g., carbon, gold, silver).
- Another approach to controlling the test environment is through the use of magnetic beads and a controlled magnetic field. The magnetic beads are functionalized with molecules that have high affinity against a range of biomolecules, e.g., antibody, epoxy, Nucleic Acid, or aptamers. As the magnetic beads are moved across the sensor sites, different molecules will bind to them at different rates, thereby scraping the surfaces of the test sites and "cleaning" the test sites. Controlling the magnetic field within the test sites affects the extent of "cleaning" that occurs at each test site, thereby modifying the binding efficiency of different molecules depending upon the strength of the bonds formed between the molecules and the antibodies. An external magnet may be used in various embodiments to bias the magnetic field to the desired values since CMOS integrated coils can only generate moderate magnetic fields.
- A further embodiment used to establish different test environments incorporates multiple capturing agents in preparing the test sites. By changing the relative concentration of the capturing agents, the binding efficiencies for the contributors in a particular sample can be changed in each of the test sites. The recipe for the capturing agents in each of the test sites may be different antibodies, aptamers, Nucleic Acid, or other biomolecules. Thus, so long as sufficient changes in efficiencies between at least two contributors can be affected by modification of the relative concentration of a capturing agent, the capturing agent may be useful even if the capturing agent is not very specific.
- A similar embodiment achieves changes in the binding efficiencies of one or more contributors by a recipe with a modification of the concentration of a single capturing agent between multiple sites. Another approach is to modulate the affinities using different pressure at different test sites while washing the spots. Pressure modification can be achieved in a fluidic setup.
- The type of sensor or sensors incorporated into the
label reader 116 will vary depending upon the particular label used. Various embodiments may thus use luminescence, fluorescence, colorimetric, electrochemical, impedance, and magnetic sensors. The sensors should be configured to allow isolation of the signal produced by a selected one or more test sites. Likewise, the sensors incorporated into theenvironment detector suite 114 may include IR sensors, and Hall sensors. AMR sensors or GMR sensors may be provided to monitor the density of magnetic beads on a test site surface. ISFETs or CMOS based charge detection circuits may be used in electrochemical embodiments. - The effectiveness of the
procedure 130 was verified using a simulation model based upon parameters extracted from an experiment with mouse anti-streptavidin monoclonal antibody and rabbit anti-streptavidin polyclonal antibody. In the simulation, the two different antibodies were differentiated by modulating the affinities of the antibodies at two different test sites by establishing two different temperatures at the two test sites while using the same labels and same capture molecule at both test sites. - Initially, the detected signal for varying concentrations of an AB diamond antibody was derived. The results of the signal from pure samples of the AB diamond antibody are depicted in the
graph 400 ofFIG. 10 . Thegraph 400 indicates that as the concentration of the AB diamond antibody was increased from 1, to 2, to 4, and then to 8 pg/ml, the detected signal increased in a substantially linear fashion. -
FIG. 11 depicts agraph 410 of the signal obtained when the AB diamond antibody was increased from 1, to 2, to 4, and then to 8 pg/ml in the presence of an AB circle antibody of varying concentrations. The AB diamond antibody and the AB circle antibody exhibited similar binding efficiencies at the temperature selected for the modeling which resulted in thegraph 410. As the AB diamond antibody was increased from 1, to 2, to 4, and then to 8 pg/ml the concentration of the AB circle antibody was varied from 8, to 4, to 8, and back to 4 pg/ml, respectively. Thegraph 410 indicates that the presence of the AB circle antibody masked the signal resulting from the AB diamond antibody. - Within the simulation, the binding efficiency of the AB diamond antibody and the AB circle antibody were modeled with a 6% error, for two different temperatures. The binding efficiency of the AB diamond antibody, normalized to the binding efficiency at a first test site, was reduced to 0.6 at a second test site. The binding efficiency of the AB circle antibody, normalized to the binding efficiency at the first test site, was reduced to 0.3 at the second test site. The same combinations of AB diamond antibody and AB circle antibody used in generating the
graph 410 where then used to generate data using theprocedure 130 ofFIG. 3 with a temperature difference between the two test sites. The results obtained from the simulation scenario are shown ingraph 420 ofFIG. 12 . - In
FIG. 12 , the computed detected signal based upon theprocedure 130 resulting from the AB diamond antibody is depicted asline 422. The signal based upon pure AB diamond antibody that was shown inFIG. 4 is depicted asline 424. A comparison of the slope of thelines - The
procedure 130 ofFIG. 3 was also verified experimentally by using the calculations therein to predict a combined signal obtained from combinations of different antibodies at different temperatures. In this experiment, test sites on a streptavidin plate with rabbit pAb, mouse mAb, and biotin were exposed to different temperatures. One test site was established at 23°C and a second test site was established at 47°C. The increased temperature resulted in increased binding efficiencies for the pAb, mAb, and biotin of 2.5x, 1.9x, and 1x, respectively. - The detected signal resulting from differing concentrations of the pAb, and mAb antibodies are depicted in
graph 430 ofFIG. 13 . InFIG. 13 , theline 432 depicts the detected signal from pure samples of pAb at 23°C and theline 434 depicts the detected signal from pure samples of pAb at 47°C. Additionally, theline 436 depicts the detected signal obtained from pure samples of mAb at 23°C and theline 438 depicts the detected signal from pure samples of mAb at 47°C. - The calculations described above with respect to the
procedure 130 ofFIG 3 were then used to predict the signal that would be detected for a sample including both pAb and mAb at both of the test sites. InFIG. 13 , thetriangles 440 depict the predicted signal that would be obtained from samples of pAb/mAb mixed at a 1:1 ratio at 23°C and thediamonds 442 depict the predicted signal that would be obtained from samples of pAb/mAb mixed at a 1:1 ratio at 47°C based upon theprocedure 130. - The experiment was then conducted with the pAb and mAb combined in a 1:1 ratio and the signal was obtained for various concentrations. In
FIG. 13 , the plus signs (+) 444 depict the experimental signal obtained from mixed samples of pAb/mAb at 23°C and thesquares 446 depict the experimental signal obtained from mixed samples of pAb/mAb at 47°C.FIG. 13 indicates that a good correlation between the slopes of the predicted signals and the experimental signals was realized. - A further comparison of experimental versus predicted signals is provided in
FIG. 14 . InFIG. 14 , the data points depicted ascircles 450 show the correlation between the predicted signal and the experimental signal for mixed samples of pAb/mAb at 23°C and thesquares 452 depict the correlation between the predicted signal and the experimental signal for mixed samples of pAb/mAb at 47°C. - The concentration of a molecule of interest can thus be obtained even in the presence of other antibodies which generate an increase in the detected signal of a label. The background noise for a particular assay may also significantly increase the detected signal. Various advanced detection and control processes may be used to reduce or eliminate such background noise to increase the sensitivity of the
procedure 130. - The
procedure 130 can thus be used in a variety of test site platforms including 96-well plates, plates with fewer or additional wells, microarray platforms, printed circuit board platforms, CMOS chip platforms, multiplexed assays, protein arrays, lateral flow devices, sandwich assays, competitive assays, bead based arrays or other appropriate platforms. Theprocedure 130 may further be used for the detection of a variety of molecules of interest as well as different types of molecules in addition to antibodies. By way of example, theprocedure 130 may also be used for the detection of Nucleic Acid, protein, or small molecules.
Claims (4)
- A method of detecting a concentration of a biomolecule of interest (186) in a sample comprising:exposing the sample to a plurality of test sites (1801, 1802), wherein the same selected capturing agent (182) with an affinity for the biomolecule of interest (186) is immobilized in each of the plurality of test sites (1801, 1802);establishing, for each of the plurality of test sites (1801, 1802), a respective test environment by controlling an environmental factor during the incubation of the sample, wherein the environmental factor of each of the plurality of test sites (1801, 1802) is different from the environmental factor of each of the other of the plurality of test sites (1801, 1802);washing the plurality of test sites (1801, 1802) after the sample has been incubated;introducing and incubating a labeled secondary antibody (190) with an affinity for the biomolecule of interest (186) into the plurality of test sites (1801, 1802);washing the plurality of test sites (1801, 1802) after the labeled secondary antibody (190) has been incubated;obtaining a detection signal associated with each of the plurality of test sites (1801, 1802) of the labeled secondary antibody (190) remaining in said test site (1801, 1802); anddetermining the concentration of the biomolecule of interest (160) based upon the obtained detection signals;
characterized in thatthe number of different biomolecule types of the biomolecule of interest plus the noise contributing biomolecules in the sample that bind non-specifically to the capturing agent or a surface of the test sites is identified, wherein the number of test sites (1801, 1802) prepared in the plurality of test sites (1801, 1802) is selected to be equal to or greater than the identified number; andbinding efficiencies for each of the biomolecule of interest (186) and the noise contributing biomolecules (188) for each of the test environments of the plurality of test sites (1801, 1802) are identified and utilized in the determination of the concentration. - The method of claim 1, wherein determining the concentration of the biomolecule of interest (160) comprises:applying at least one linear estimation algorithm to the obtained detection signals.
- The method of claim 1, further comprising:forming each of the plurality of test sites (1801, 1802) in a respective well of a multi-well plate.
- The method of claim 1, further comprising:forming each of the plurality of test sites (1801, 1802) on a CMOS substrate.
Applications Claiming Priority (2)
| Application Number | Priority Date | Filing Date | Title |
|---|---|---|---|
| US12/580,113 US9927435B2 (en) | 2009-10-15 | 2009-10-15 | Multisite biosensor and associated method |
| PCT/US2010/052472 WO2011047020A1 (en) | 2009-10-15 | 2010-10-13 | Multisite biosensor and associated method |
Publications (2)
| Publication Number | Publication Date |
|---|---|
| EP2488870A1 EP2488870A1 (en) | 2012-08-22 |
| EP2488870B1 true EP2488870B1 (en) | 2017-05-10 |
Family
ID=43088249
Family Applications (1)
| Application Number | Title | Priority Date | Filing Date |
|---|---|---|---|
| EP10770679.8A Active EP2488870B1 (en) | 2009-10-15 | 2010-10-13 | Multisite biosensor and associated method |
Country Status (6)
| Country | Link |
|---|---|
| US (1) | US9927435B2 (en) |
| EP (1) | EP2488870B1 (en) |
| JP (1) | JP5925683B2 (en) |
| KR (1) | KR101816939B1 (en) |
| CN (1) | CN102648413B (en) |
| WO (1) | WO2011047020A1 (en) |
Families Citing this family (19)
| Publication number | Priority date | Publication date | Assignee | Title |
|---|---|---|---|---|
| US9063138B2 (en) | 2009-10-15 | 2015-06-23 | Robert Bosch Gmbh | Device and method for indirect electronic condition control in biomolecule detection platforms |
| US11275084B2 (en) * | 2010-01-15 | 2022-03-15 | Stanford University | Successive sampling device and associated method |
| US8648016B2 (en) | 2010-02-08 | 2014-02-11 | Robert Bosch Gmbh | Array with extended dynamic range and associated method |
| US9188585B2 (en) | 2010-05-13 | 2015-11-17 | Robert Bosch Gmbh | Device and method for indirect modulation of detection environment |
| KR101359379B1 (en) | 2012-03-28 | 2014-02-07 | 광주과학기술원 | High-sensitivity biosensor using pixel analyses of a CMOS image |
| US9910008B2 (en) | 2012-07-06 | 2018-03-06 | Robert Bosch Gmbh | Methods for generating pH/ionic concentration gradient near electrode surfaces for modulating biomolecular interactions |
| US9810688B2 (en) * | 2013-03-15 | 2017-11-07 | Robert Bosch Gmbh | Smart glass slide for microarrays |
| US9874538B2 (en) | 2012-07-06 | 2018-01-23 | Robert Bosch Gmbh | Methods for generating pH/ionic concentration gradient near electrode surfaces for modulating biomolecular interactions |
| US9075041B2 (en) | 2012-07-06 | 2015-07-07 | Robert Bosch Gmbh | Methods for generating pH/ionic concentration gradient near electrode surfaces for modulating biomolecular interactions |
| US10031100B2 (en) | 2013-03-13 | 2018-07-24 | Robert Bosch Gmbh | Generation of pH/temperature/ionic gradients on a lateral flow platform with multiple parallel lanes for modulating protein interactions |
| WO2015121206A1 (en) | 2014-02-13 | 2015-08-20 | Robert Bosch Gmbh | Capacitive bubble detection |
| US9442090B2 (en) * | 2014-03-27 | 2016-09-13 | Honeywell International Inc. | Magnetic stimulus of ISFET-based sensor to enable trimming and self-compensation of sensor measurement errors |
| EP3186634B1 (en) * | 2014-08-29 | 2019-10-09 | Agency For Science, Technology And Research | Test strip assembly |
| WO2017005645A1 (en) | 2015-07-06 | 2017-01-12 | Robert Bosch Gmbh | METHODS FOR GENERATING pH/IONIC CONCENTRATION GRADIENT NEAR ELECTRODE SURFACES FOR MODULATING BIOMOLECULAR INTERACTIONS |
| US10011549B2 (en) | 2015-07-06 | 2018-07-03 | Robert Bosch Gmbh | Electrochemically active agents for pH modulation in biological buffers |
| US10379080B2 (en) | 2015-07-06 | 2019-08-13 | Robert Bosch Gmbh | Electronic control of the pH of a solution close to an electrode surfaces |
| US11867660B2 (en) | 2015-07-06 | 2024-01-09 | Robert Bosch Gmbh | Electronic control of the pH of a solution close to an electrode surface |
| CA3106410A1 (en) | 2018-07-23 | 2020-01-30 | Dna Script | Massively parallel enzymatic synthesis of nucleic acid strands |
| US20220003779A1 (en) * | 2020-07-03 | 2022-01-06 | The Research Foundation For The State University Of New York | Methods for qualitative and quantitative analysis of a plurality of biomarkers |
Citations (3)
| Publication number | Priority date | Publication date | Assignee | Title |
|---|---|---|---|---|
| US7087373B2 (en) * | 2001-06-05 | 2006-08-08 | Tibotec Pharmaceuticals Ltd. | Methods for determining plasma free drug concentration by direct measurement of binding affinity of protease inhibitors to plasma proteins |
| WO2007062666A1 (en) * | 2005-12-02 | 2007-06-07 | Technical University Of Denmark | Fluidics device for assay |
| US7892854B2 (en) * | 2000-06-21 | 2011-02-22 | Bioarray Solutions, Ltd. | Multianalyte molecular analysis using application-specific random particle arrays |
Family Cites Families (18)
| Publication number | Priority date | Publication date | Assignee | Title |
|---|---|---|---|---|
| GB8912682D0 (en) | 1989-06-02 | 1989-07-19 | Thackray Chas F | Improvements in and relating to knee prosthesis |
| CA2096495C (en) | 1992-06-16 | 2002-07-09 | Kathy Palmer Ordonez | Dual analyte immunoassay |
| US5807522A (en) | 1994-06-17 | 1998-09-15 | The Board Of Trustees Of The Leland Stanford Junior University | Methods for fabricating microarrays of biological samples |
| JPH09304393A (en) | 1996-05-15 | 1997-11-28 | Ind Technol Res Inst | Acute myocardial infarction diagnostic kit |
| CN1274085A (en) * | 2000-04-13 | 2000-11-22 | 陈学银 | Protein chip, its preparing process and its application in screening monoclonal antibody |
| US20030232399A1 (en) | 2000-06-14 | 2003-12-18 | Robertson John Forsyth Russell | Cancer detection methods and reagents |
| JP2002272498A (en) | 2001-03-21 | 2002-09-24 | Olympus Optical Co Ltd | Method for biochemical testing |
| CN1330271A (en) * | 2001-07-12 | 2002-01-09 | 上海晶泰生物技术有限公司 | Protein-chip for prenated diagnosis and its preparing process |
| US20030198967A1 (en) * | 2002-04-23 | 2003-10-23 | Matson Robert S. | Multi-functional microarrays and methods |
| JP4218274B2 (en) | 2002-07-29 | 2009-02-04 | ソニー株式会社 | Bioassay device |
| EP1467206A1 (en) | 2003-04-08 | 2004-10-13 | Roche Diagnostics GmbH | Biosensor system |
| JP2005172807A (en) | 2003-11-17 | 2005-06-30 | Sekisui Chem Co Ltd | Inspection method and manufacturing method of inspection array used therefor |
| KR100631208B1 (en) | 2004-07-20 | 2006-10-04 | 삼성전자주식회사 | Bio-combination detection device using electromagnetic induction and detection method using the same |
| CN100394183C (en) * | 2004-11-29 | 2008-06-11 | 开物科技股份有限公司 | Positioning device and positioning method of biochip |
| US7396689B2 (en) * | 2005-02-04 | 2008-07-08 | Decision Biomarkers Incorporated | Method of adjusting the working range of a multi-analyte assay |
| US20070097364A1 (en) | 2005-05-09 | 2007-05-03 | The Trustees Of Columbia University In The City Of New York | Active CMOS biosensor chip for fluorescent-based detection |
| US20070292855A1 (en) * | 2005-08-19 | 2007-12-20 | Intel Corporation | Method and CMOS-based device to analyze molecules and nanomaterials based on the electrical readout of specific binding events on functionalized electrodes |
| WO2007127981A2 (en) | 2006-04-28 | 2007-11-08 | University Of Rochester | Analyte-releasing beads and use thereof in quantitative elispot or fluorispot assay |
-
2009
- 2009-10-15 US US12/580,113 patent/US9927435B2/en active Active
-
2010
- 2010-10-13 EP EP10770679.8A patent/EP2488870B1/en active Active
- 2010-10-13 KR KR1020127012355A patent/KR101816939B1/en not_active Expired - Fee Related
- 2010-10-13 WO PCT/US2010/052472 patent/WO2011047020A1/en not_active Ceased
- 2010-10-13 CN CN201080051665.5A patent/CN102648413B/en active Active
- 2010-10-13 JP JP2012534315A patent/JP5925683B2/en not_active Expired - Fee Related
Patent Citations (3)
| Publication number | Priority date | Publication date | Assignee | Title |
|---|---|---|---|---|
| US7892854B2 (en) * | 2000-06-21 | 2011-02-22 | Bioarray Solutions, Ltd. | Multianalyte molecular analysis using application-specific random particle arrays |
| US7087373B2 (en) * | 2001-06-05 | 2006-08-08 | Tibotec Pharmaceuticals Ltd. | Methods for determining plasma free drug concentration by direct measurement of binding affinity of protease inhibitors to plasma proteins |
| WO2007062666A1 (en) * | 2005-12-02 | 2007-06-07 | Technical University Of Denmark | Fluidics device for assay |
Also Published As
| Publication number | Publication date |
|---|---|
| CN102648413B (en) | 2015-03-18 |
| JP2013508682A (en) | 2013-03-07 |
| KR101816939B1 (en) | 2018-01-09 |
| KR20120085288A (en) | 2012-07-31 |
| US20110091870A1 (en) | 2011-04-21 |
| JP5925683B2 (en) | 2016-05-25 |
| WO2011047020A1 (en) | 2011-04-21 |
| US9927435B2 (en) | 2018-03-27 |
| CN102648413A (en) | 2012-08-22 |
| EP2488870A1 (en) | 2012-08-22 |
Similar Documents
| Publication | Publication Date | Title |
|---|---|---|
| US9927435B2 (en) | Multisite biosensor and associated method | |
| US11143651B2 (en) | Array with extended dynamic range and associated method | |
| US9188585B2 (en) | Device and method for indirect modulation of detection environment | |
| US9063138B2 (en) | Device and method for indirect electronic condition control in biomolecule detection platforms | |
| Sanchez-Carbayo | Antibody arrays: technical considerations and clinical applications in cancer | |
| Panneer Selvam et al. | Nanosensor electrical immunoassay for quantitative detection of NT-pro brain natriuretic peptide | |
| Ceylan et al. | A hand-held point-of-care biosensor device for detection of multiple cancer and cardiac disease biomarkers using interdigitated capacitive arrays | |
| Zhuang et al. | Copper nanocluster-labeled hybridization chain reaction for potentiometric immunoassay of matrix metalloproteinase-7 in acute kidney injury and renal cancer | |
| US9829438B2 (en) | High sensitivity biosensor using pixel analysis of CMOS image sensor | |
| US8158440B2 (en) | Method for quantitative measurement of thyroid related antibodies or antigens in a serum sample | |
| Morozova et al. | Force differentiation in recognition of cross-reactive antigens by magnetic beads | |
| US10488393B2 (en) | Device and method for self-referenced confidence test | |
| EP2783215B1 (en) | Method for self-referenced confidence test | |
| EP2802876A1 (en) | Device and method for indirect electronic condition control in biomolecule detection platforms | |
| Peng et al. | Detection of Biomarkers for Liver Fibrosis Using High‐Throughput Electrochemical Microimmunosensor | |
| JP2007212233A (en) | Biosensor | |
| US11275084B2 (en) | Successive sampling device and associated method | |
| Wilson | Electrochemical Protein Chip for Tumor Marker Analysis |
Legal Events
| Date | Code | Title | Description |
|---|---|---|---|
| PUAI | Public reference made under article 153(3) epc to a published international application that has entered the european phase |
Free format text: ORIGINAL CODE: 0009012 |
|
| 17P | Request for examination filed |
Effective date: 20120515 |
|
| AK | Designated contracting states |
Kind code of ref document: A1 Designated state(s): AL AT BE BG CH CY CZ DE DK EE ES FI FR GB GR HR HU IE IS IT LI LT LU LV MC MK MT NL NO PL PT RO RS SE SI SK SM TR |
|
| DAX | Request for extension of the european patent (deleted) | ||
| 17Q | First examination report despatched |
Effective date: 20141119 |
|
| GRAP | Despatch of communication of intention to grant a patent |
Free format text: ORIGINAL CODE: EPIDOSNIGR1 |
|
| STAA | Information on the status of an ep patent application or granted ep patent |
Free format text: STATUS: GRANT OF PATENT IS INTENDED |
|
| INTG | Intention to grant announced |
Effective date: 20170102 |
|
| GRAS | Grant fee paid |
Free format text: ORIGINAL CODE: EPIDOSNIGR3 |
|
| GRAA | (expected) grant |
Free format text: ORIGINAL CODE: 0009210 |
|
| STAA | Information on the status of an ep patent application or granted ep patent |
Free format text: STATUS: THE PATENT HAS BEEN GRANTED |
|
| AK | Designated contracting states |
Kind code of ref document: B1 Designated state(s): AL AT BE BG CH CY CZ DE DK EE ES FI FR GB GR HR HU IE IS IT LI LT LU LV MC MK MT NL NO PL PT RO RS SE SI SK SM TR |
|
| REG | Reference to a national code |
Ref country code: GB Ref legal event code: FG4D |
|
| REG | Reference to a national code |
Ref country code: AT Ref legal event code: REF Ref document number: 892893 Country of ref document: AT Kind code of ref document: T Effective date: 20170515 Ref country code: CH Ref legal event code: EP |
|
| REG | Reference to a national code |
Ref country code: IE Ref legal event code: FG4D |
|
| REG | Reference to a national code |
Ref country code: DE Ref legal event code: R096 Ref document number: 602010042273 Country of ref document: DE |
|
| REG | Reference to a national code |
Ref country code: NL Ref legal event code: MP Effective date: 20170510 |
|
| REG | Reference to a national code |
Ref country code: LT Ref legal event code: MG4D |
|
| REG | Reference to a national code |
Ref country code: AT Ref legal event code: MK05 Ref document number: 892893 Country of ref document: AT Kind code of ref document: T Effective date: 20170510 |
|
| REG | Reference to a national code |
Ref country code: FR Ref legal event code: PLFP Year of fee payment: 8 |
|
| PG25 | Lapsed in a contracting state [announced via postgrant information from national office to epo] |
Ref country code: ES Free format text: LAPSE BECAUSE OF FAILURE TO SUBMIT A TRANSLATION OF THE DESCRIPTION OR TO PAY THE FEE WITHIN THE PRESCRIBED TIME-LIMIT Effective date: 20170510 Ref country code: AT Free format text: LAPSE BECAUSE OF FAILURE TO SUBMIT A TRANSLATION OF THE DESCRIPTION OR TO PAY THE FEE WITHIN THE PRESCRIBED TIME-LIMIT Effective date: 20170510 Ref country code: NO Free format text: LAPSE BECAUSE OF FAILURE TO SUBMIT A TRANSLATION OF THE DESCRIPTION OR TO PAY THE FEE WITHIN THE PRESCRIBED TIME-LIMIT Effective date: 20170810 Ref country code: FI Free format text: LAPSE BECAUSE OF FAILURE TO SUBMIT A TRANSLATION OF THE DESCRIPTION OR TO PAY THE FEE WITHIN THE PRESCRIBED TIME-LIMIT Effective date: 20170510 Ref country code: GR Free format text: LAPSE BECAUSE OF FAILURE TO SUBMIT A TRANSLATION OF THE DESCRIPTION OR TO PAY THE FEE WITHIN THE PRESCRIBED TIME-LIMIT Effective date: 20170811 Ref country code: HR Free format text: LAPSE BECAUSE OF FAILURE TO SUBMIT A TRANSLATION OF THE DESCRIPTION OR TO PAY THE FEE WITHIN THE PRESCRIBED TIME-LIMIT Effective date: 20170510 Ref country code: LT Free format text: LAPSE BECAUSE OF FAILURE TO SUBMIT A TRANSLATION OF THE DESCRIPTION OR TO PAY THE FEE WITHIN THE PRESCRIBED TIME-LIMIT Effective date: 20170510 |
|
| PG25 | Lapsed in a contracting state [announced via postgrant information from national office to epo] |
Ref country code: SE Free format text: LAPSE BECAUSE OF FAILURE TO SUBMIT A TRANSLATION OF THE DESCRIPTION OR TO PAY THE FEE WITHIN THE PRESCRIBED TIME-LIMIT Effective date: 20170510 Ref country code: BG Free format text: LAPSE BECAUSE OF FAILURE TO SUBMIT A TRANSLATION OF THE DESCRIPTION OR TO PAY THE FEE WITHIN THE PRESCRIBED TIME-LIMIT Effective date: 20170810 Ref country code: RS Free format text: LAPSE BECAUSE OF FAILURE TO SUBMIT A TRANSLATION OF THE DESCRIPTION OR TO PAY THE FEE WITHIN THE PRESCRIBED TIME-LIMIT Effective date: 20170510 Ref country code: PL Free format text: LAPSE BECAUSE OF FAILURE TO SUBMIT A TRANSLATION OF THE DESCRIPTION OR TO PAY THE FEE WITHIN THE PRESCRIBED TIME-LIMIT Effective date: 20170510 Ref country code: NL Free format text: LAPSE BECAUSE OF FAILURE TO SUBMIT A TRANSLATION OF THE DESCRIPTION OR TO PAY THE FEE WITHIN THE PRESCRIBED TIME-LIMIT Effective date: 20170510 Ref country code: LV Free format text: LAPSE BECAUSE OF FAILURE TO SUBMIT A TRANSLATION OF THE DESCRIPTION OR TO PAY THE FEE WITHIN THE PRESCRIBED TIME-LIMIT Effective date: 20170510 Ref country code: IS Free format text: LAPSE BECAUSE OF FAILURE TO SUBMIT A TRANSLATION OF THE DESCRIPTION OR TO PAY THE FEE WITHIN THE PRESCRIBED TIME-LIMIT Effective date: 20170910 |
|
| PG25 | Lapsed in a contracting state [announced via postgrant information from national office to epo] |
Ref country code: SK Free format text: LAPSE BECAUSE OF FAILURE TO SUBMIT A TRANSLATION OF THE DESCRIPTION OR TO PAY THE FEE WITHIN THE PRESCRIBED TIME-LIMIT Effective date: 20170510 Ref country code: RO Free format text: LAPSE BECAUSE OF FAILURE TO SUBMIT A TRANSLATION OF THE DESCRIPTION OR TO PAY THE FEE WITHIN THE PRESCRIBED TIME-LIMIT Effective date: 20170510 Ref country code: CZ Free format text: LAPSE BECAUSE OF FAILURE TO SUBMIT A TRANSLATION OF THE DESCRIPTION OR TO PAY THE FEE WITHIN THE PRESCRIBED TIME-LIMIT Effective date: 20170510 Ref country code: EE Free format text: LAPSE BECAUSE OF FAILURE TO SUBMIT A TRANSLATION OF THE DESCRIPTION OR TO PAY THE FEE WITHIN THE PRESCRIBED TIME-LIMIT Effective date: 20170510 Ref country code: DK Free format text: LAPSE BECAUSE OF FAILURE TO SUBMIT A TRANSLATION OF THE DESCRIPTION OR TO PAY THE FEE WITHIN THE PRESCRIBED TIME-LIMIT Effective date: 20170510 |
|
| REG | Reference to a national code |
Ref country code: DE Ref legal event code: R097 Ref document number: 602010042273 Country of ref document: DE |
|
| PG25 | Lapsed in a contracting state [announced via postgrant information from national office to epo] |
Ref country code: IT Free format text: LAPSE BECAUSE OF FAILURE TO SUBMIT A TRANSLATION OF THE DESCRIPTION OR TO PAY THE FEE WITHIN THE PRESCRIBED TIME-LIMIT Effective date: 20170510 Ref country code: SM Free format text: LAPSE BECAUSE OF FAILURE TO SUBMIT A TRANSLATION OF THE DESCRIPTION OR TO PAY THE FEE WITHIN THE PRESCRIBED TIME-LIMIT Effective date: 20170510 |
|
| PLBE | No opposition filed within time limit |
Free format text: ORIGINAL CODE: 0009261 |
|
| STAA | Information on the status of an ep patent application or granted ep patent |
Free format text: STATUS: NO OPPOSITION FILED WITHIN TIME LIMIT |
|
| 26N | No opposition filed |
Effective date: 20180213 |
|
| PG25 | Lapsed in a contracting state [announced via postgrant information from national office to epo] |
Ref country code: MC Free format text: LAPSE BECAUSE OF FAILURE TO SUBMIT A TRANSLATION OF THE DESCRIPTION OR TO PAY THE FEE WITHIN THE PRESCRIBED TIME-LIMIT Effective date: 20170510 Ref country code: SI Free format text: LAPSE BECAUSE OF FAILURE TO SUBMIT A TRANSLATION OF THE DESCRIPTION OR TO PAY THE FEE WITHIN THE PRESCRIBED TIME-LIMIT Effective date: 20170510 |
|
| REG | Reference to a national code |
Ref country code: CH Ref legal event code: PL |
|
| REG | Reference to a national code |
Ref country code: IE Ref legal event code: MM4A |
|
| PG25 | Lapsed in a contracting state [announced via postgrant information from national office to epo] |
Ref country code: CH Free format text: LAPSE BECAUSE OF NON-PAYMENT OF DUE FEES Effective date: 20171031 Ref country code: LU Free format text: LAPSE BECAUSE OF NON-PAYMENT OF DUE FEES Effective date: 20171013 Ref country code: LI Free format text: LAPSE BECAUSE OF NON-PAYMENT OF DUE FEES Effective date: 20171031 |
|
| REG | Reference to a national code |
Ref country code: BE Ref legal event code: MM Effective date: 20171031 |
|
| PG25 | Lapsed in a contracting state [announced via postgrant information from national office to epo] |
Ref country code: BE Free format text: LAPSE BECAUSE OF NON-PAYMENT OF DUE FEES Effective date: 20171031 |
|
| PG25 | Lapsed in a contracting state [announced via postgrant information from national office to epo] |
Ref country code: MT Free format text: LAPSE BECAUSE OF NON-PAYMENT OF DUE FEES Effective date: 20171013 |
|
| REG | Reference to a national code |
Ref country code: FR Ref legal event code: PLFP Year of fee payment: 9 |
|
| PG25 | Lapsed in a contracting state [announced via postgrant information from national office to epo] |
Ref country code: IE Free format text: LAPSE BECAUSE OF NON-PAYMENT OF DUE FEES Effective date: 20171013 |
|
| PG25 | Lapsed in a contracting state [announced via postgrant information from national office to epo] |
Ref country code: HU Free format text: LAPSE BECAUSE OF FAILURE TO SUBMIT A TRANSLATION OF THE DESCRIPTION OR TO PAY THE FEE WITHIN THE PRESCRIBED TIME-LIMIT; INVALID AB INITIO Effective date: 20101013 |
|
| PG25 | Lapsed in a contracting state [announced via postgrant information from national office to epo] |
Ref country code: CY Free format text: LAPSE BECAUSE OF NON-PAYMENT OF DUE FEES Effective date: 20170510 |
|
| PG25 | Lapsed in a contracting state [announced via postgrant information from national office to epo] |
Ref country code: MK Free format text: LAPSE BECAUSE OF FAILURE TO SUBMIT A TRANSLATION OF THE DESCRIPTION OR TO PAY THE FEE WITHIN THE PRESCRIBED TIME-LIMIT Effective date: 20170510 |
|
| PG25 | Lapsed in a contracting state [announced via postgrant information from national office to epo] |
Ref country code: TR Free format text: LAPSE BECAUSE OF FAILURE TO SUBMIT A TRANSLATION OF THE DESCRIPTION OR TO PAY THE FEE WITHIN THE PRESCRIBED TIME-LIMIT Effective date: 20170510 |
|
| PG25 | Lapsed in a contracting state [announced via postgrant information from national office to epo] |
Ref country code: PT Free format text: LAPSE BECAUSE OF FAILURE TO SUBMIT A TRANSLATION OF THE DESCRIPTION OR TO PAY THE FEE WITHIN THE PRESCRIBED TIME-LIMIT Effective date: 20170510 |
|
| PG25 | Lapsed in a contracting state [announced via postgrant information from national office to epo] |
Ref country code: AL Free format text: LAPSE BECAUSE OF FAILURE TO SUBMIT A TRANSLATION OF THE DESCRIPTION OR TO PAY THE FEE WITHIN THE PRESCRIBED TIME-LIMIT Effective date: 20170510 |
|
| PGFP | Annual fee paid to national office [announced via postgrant information from national office to epo] |
Ref country code: DE Payment date: 20251209 Year of fee payment: 16 |
|
| PGFP | Annual fee paid to national office [announced via postgrant information from national office to epo] |
Ref country code: GB Payment date: 20251024 Year of fee payment: 16 |
|
| PGFP | Annual fee paid to national office [announced via postgrant information from national office to epo] |
Ref country code: FR Payment date: 20251029 Year of fee payment: 16 |