EP2461274A1 - Method and device of determining a saliency map for an image - Google Patents
Method and device of determining a saliency map for an image Download PDFInfo
- Publication number
- EP2461274A1 EP2461274A1 EP11180620A EP11180620A EP2461274A1 EP 2461274 A1 EP2461274 A1 EP 2461274A1 EP 11180620 A EP11180620 A EP 11180620A EP 11180620 A EP11180620 A EP 11180620A EP 2461274 A1 EP2461274 A1 EP 2461274A1
- Authority
- EP
- European Patent Office
- Prior art keywords
- image
- subbands
- colour
- feature maps
- determining
- Prior art date
- Legal status (The legal status is an assumption and is not a legal conclusion. Google has not performed a legal analysis and makes no representation as to the accuracy of the status listed.)
- Withdrawn
Links
Images


Classifications
-
- G—PHYSICS
- G06—COMPUTING OR CALCULATING; COUNTING
- G06V—IMAGE OR VIDEO RECOGNITION OR UNDERSTANDING
- G06V20/00—Scenes; Scene-specific elements
- G06V20/10—Terrestrial scenes
-
- G—PHYSICS
- G06—COMPUTING OR CALCULATING; COUNTING
- G06F—ELECTRIC DIGITAL DATA PROCESSING
- G06F18/00—Pattern recognition
- G06F18/20—Analysing
- G06F18/25—Fusion techniques
- G06F18/253—Fusion techniques of extracted features
-
- G—PHYSICS
- G06—COMPUTING OR CALCULATING; COUNTING
- G06V—IMAGE OR VIDEO RECOGNITION OR UNDERSTANDING
- G06V10/00—Arrangements for image or video recognition or understanding
- G06V10/40—Extraction of image or video features
- G06V10/44—Local feature extraction by analysis of parts of the pattern, e.g. by detecting edges, contours, loops, corners, strokes or intersections; Connectivity analysis, e.g. of connected components
- G06V10/443—Local feature extraction by analysis of parts of the pattern, e.g. by detecting edges, contours, loops, corners, strokes or intersections; Connectivity analysis, e.g. of connected components by matching or filtering
- G06V10/449—Biologically inspired filters, e.g. difference of Gaussians [DoG] or Gabor filters
- G06V10/451—Biologically inspired filters, e.g. difference of Gaussians [DoG] or Gabor filters with interaction between the filter responses, e.g. cortical complex cells
- G06V10/454—Integrating the filters into a hierarchical structure, e.g. convolutional neural networks [CNN]
-
- G—PHYSICS
- G06—COMPUTING OR CALCULATING; COUNTING
- G06V—IMAGE OR VIDEO RECOGNITION OR UNDERSTANDING
- G06V10/00—Arrangements for image or video recognition or understanding
- G06V10/40—Extraction of image or video features
- G06V10/46—Descriptors for shape, contour or point-related descriptors, e.g. scale invariant feature transform [SIFT] or bags of words [BoW]; Salient regional features
- G06V10/462—Salient features, e.g. scale invariant feature transforms [SIFT]
-
- G—PHYSICS
- G06—COMPUTING OR CALCULATING; COUNTING
- G06V—IMAGE OR VIDEO RECOGNITION OR UNDERSTANDING
- G06V10/00—Arrangements for image or video recognition or understanding
- G06V10/70—Arrangements for image or video recognition or understanding using pattern recognition or machine learning
- G06V10/77—Processing image or video features in feature spaces; using data integration or data reduction, e.g. principal component analysis [PCA] or independent component analysis [ICA] or self-organising maps [SOM]; Blind source separation
- G06V10/80—Fusion, i.e. combining data from various sources at the sensor level, preprocessing level, feature extraction level or classification level
- G06V10/806—Fusion, i.e. combining data from various sources at the sensor level, preprocessing level, feature extraction level or classification level of extracted features
-
- G—PHYSICS
- G06—COMPUTING OR CALCULATING; COUNTING
- G06V—IMAGE OR VIDEO RECOGNITION OR UNDERSTANDING
- G06V30/00—Character recognition; Recognising digital ink; Document-oriented image-based pattern recognition
- G06V30/10—Character recognition
- G06V30/26—Techniques for post-processing, e.g. correcting the recognition result
- G06V30/262—Techniques for post-processing, e.g. correcting the recognition result using context analysis, e.g. lexical, syntactic or semantic context
- G06V30/274—Syntactic or semantic context, e.g. balancing
Definitions
- the invention is made in the field of saliency map determination for images.
- Saliency maps reflect that the visual attention which subjects pay for image content varies in dependency on the content depicted. Visual attention is modelled in top-down models and in bottom up models.
- Top-down models are related to voluntary attention resulting from a cognitive task, such as object search, location recognition or face recognition.
- Bottom up models are related to involuntary attention guided only by visually relevant or stimulating areas of the image.
- ICIP 2006 determines saliency maps for object search and uses scene categories for spatially tuning the saliency maps by selecting a spatial stripe and reinforcing saliency in this stripe.
- the invention introduces scene category dependent feature map weighting into bottom-up approaches.
- the invention proposes a method of determining a saliency map for an image according to claim 1 and a device for determining a saliency map for an image according to claim 3.
- the proposed method comprises using a processing device for executing the steps of: determining to which of at least two predetermined scene categories a scene depicted in the image belongs wherein each of the at least two predetermined scene categories is associated with a different predetermined set of weights, each predetermined set of weights comprising weights for colour dependent subbands, selecting the weight set associated with the determined scene category, splitting the image into colour dependent frequency subbands and orientation subbands by splitting the image into colour components and applying wavelet transformation to each colour component, determining early feature maps for the subbands by extracting visual features from the wavelet transforms by a center-surround mechanism based on a Difference of Gaussian, using the selected weight set for weighting the early feature maps and fusing the weighted feature maps.
- the application of predetermined scene category dependent weight sets of which each comprises one weight per colour dependent subband improves the prediction and reliability of the bottom-up visual attention model.
- the invention may be realized on any electronic device comprising a processing device correspondingly adapted.
- the invention may be realized in a television, a mobile phone, a personal computer, a digital still camera, a digital video camera or a car entertainment system.
- Saliency maps can be used in encoding, for instance in that more salient image regions are encoded with higher bit depth than less salient image regions. Or, in a scalable video encoding framework, the more salient image regions are encoded in a base layer while the less salient image regions are encoded in enhancement layers.
- Another field of application for saliency maps is the automated measurement of quality of experience. Such automated measurement is of advantage, for instance, in video provision services with quality dependent service fees, in evaluation of transmission channels or in evaluation of codecs.
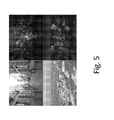
- Fig. 5 depicts examples of stimuli for the STREET category and the OPENCOUNTRY category and its ocular fixation localization.
- At least one embodiment is based on a wavelet transform which splits the original signal into frequency and orientation sub-bands (such as described later). This transform is applied on each colour component independently leading to a final merge of sub-bands and of color components at the end of the process.
- the merge or fusion of sub-bands is dependent on a scene category determined for the current image in order to improve the prediction of the computed saliency maps.
- COAST presents a horizontally stretched diamond spectrum showing the horizontal fundament of the gist
- OPENCOUNTRY provides a more proportioned diamond shaped spectrum which suggests more equality (in mean) for the proportion between horizontal and vertical aspects.
- MOUNTAIN spectrum is isotropic and underlines random aspect of Mountain shapes.
- STREET spectrum is very stretched especially in horizontal axis and in vertical axis what reveals rectilinear elements characterizing scenes with artificial surroundings. Further scene categories are possible.
- the visual signal is hierarchically decomposed. This is exemplarily depicted in figures 2 , 3 and 4 .
- a first step consists in separating the image signal into frequency level and orientation channels.
- the YUV color space separates achromatic (Y) and chromatic (U and V) perceptual signals.
- the chromatic components have half the spatial resolution of the achromatic component.
- a separation of frequency and orientation ranges is performed, for instance through a wavelet transform for its computational efficiency.
- the wavelet transform separates frequencies with a succession of low-pass (H) and high-pass (G) filters followed by critical sub-sampling as exemplarily depicted for one level wavelet decomposition in figure 2 .
- sub-band0 is the low-passed image approximation that is wavelet transformed to get next decomposition level
- sub-band1 contains horizontal frequencies which corresponds to vertical orientation lines in the image
- sub-band2 contains both diagonals
- sub-band3 contains vertical frequencies and corresponds to horizontal orientation lines in the image.
- the number of wavelet levels can be fixed in advance, e.g. two or three, or it can be determined so that the smallest level has frequencies of 1 cycle per degree of visual angle.
- the input image is thus decomposed into four levels L0, L1, L2, L3, each level comprising three orientation sub-bands Ov for vertical orientation, Od for diagonal orientation, and Oh for horizontal orientation.
- the last level also contains an approximation image, e.g. a low-resolution version of the image.
- Table 1 presents the frequency ranges in each level.
- Table 1 Level number 0 1 2 3 Frequency range (cycles per degree) 10.7 - 5.3 5.3 - 2.7 2.7 - 1.3 1.3 - 0.7 (0.7 - 0 for sub-band0)
- a center-surround mechanism based on a Difference of Gaussian (DoG).
- DoG Difference of Gaussian
- the center-surround is computed as the absolute difference between the center pixel and the average of absolute value of the surroundings pixels, e.g. in a five by five pixels square.
- center-surround results are averaged on a neighbourhood, for instance a circular neighborhood of one visual degree of diameter, e.g. one pixel at level L3 up to eleven pixels at level L0.
- weighted fusion of the early feature maps weighted by scene category dependent weights is applied. For each predetermined scene category there is a set of weights.
- scene category determination SCD and determination of scene dependent weights SDW takes place and three fusions are successively applied: orientations fusion, levels fusion and color channels fusion.
- different weights are applied in at least one of the three fusion steps, examples for such different weights being given below in tables 2, 3 and 4. Fusion operation can be, for instance, weighted sums of the per-pixel center-surround values.
- orientation and level uses weighted sums of the per-pixel center-surround values, with level fusion comprising up-sampling between levels.
- Color channel fusion operation keeps the maximum saliency value between Y, U, and V pixels after normalizing with an experimental maximum value taking into account the difference of amplitude between the three channels (Y: 5000, U&V: 1000).
- the output map can be finally normalized on 8 bits integer grayscale image (between 0 and 255).
- Table 2 lists examples of the different weights which can be applied for orientation fusion in dependency on the scene category (OPENCOUNTRY, COAST, MOUNTAIN and STREET). Table 2 All Levels relative energy/NSS Weighting factor Ov Od Oh Ov Od Oh OPENCOUNTRY 1,3 1,8 3,8 0,4 0,5 1,0 COAST 1,5 1,8 5,5 0,3 0,3 1,0 MOUNTAIN 3,2 3,7 5,2 0,6 0,7 1,0 STREET 3,8 2,3 2,9 1,0 0,6 0,8
- Table 3 lists examples of the different weights which can be applied for level fusion in dependency on the scene category.
- Table 3 All Orientations relative energy/NSS Weighting factor L0 L1 L2 L3 L0 L1 L2 L3 OPENCOUNTRY 0,1 0,8 2,0 2,4 0,0 0,3 0,8 1,0 COAST 0,1 0,6 2,3 2,9 0,0 0,2 0,8 1,0 MOUNTAIN 0,1 0,8 3,1 4,3 0,0 0,2 0,7 1,0 STREET 0,1 0,7 2,3 3,4 0,0 0,2 0,7 1,0
- Table 4 lists examples of the different weights which can be applied for colour fusion in dependency on the scene category (OPENCOUNTRY, COAST, MOUNTAIN and STREET). Table 4 All Orientations and level relative energy/NSS Weighting factor Y U V Y U V OPENCOUNTRY 0,5 0,5 0,6 0,8 0,8 1,0 COAST 0,6 0,6 0,6 1,0 1,0 1,0 MOUNTAIN 0,5 0,6 0,7 0,7 0,9 1,0 STREET 0,5 0,4 0,4 1,0 0,8 0,8
- NSS Normalized Scanpath Salience
- NSS Normalized Scanpath Salience
- the NSS is relevant because it allows computing the value of salience. Its particularity is to average per scanpath the saliency at each fixation point locus and so, to provide a similarity metric based on the relevance of each entire scanpath independently of its size. Another advantage is to bring a signed metric centered on zero. It means that a positive value corresponds to similarity, a negative value corresponds to dissimilarity, and a zero value amounts to hazard.
Landscapes
- Engineering & Computer Science (AREA)
- Theoretical Computer Science (AREA)
- Computer Vision & Pattern Recognition (AREA)
- General Physics & Mathematics (AREA)
- Physics & Mathematics (AREA)
- Multimedia (AREA)
- Evolutionary Computation (AREA)
- Artificial Intelligence (AREA)
- Health & Medical Sciences (AREA)
- Computational Linguistics (AREA)
- Life Sciences & Earth Sciences (AREA)
- Data Mining & Analysis (AREA)
- General Health & Medical Sciences (AREA)
- Computing Systems (AREA)
- Databases & Information Systems (AREA)
- Software Systems (AREA)
- Bioinformatics & Cheminformatics (AREA)
- Bioinformatics & Computational Biology (AREA)
- Evolutionary Biology (AREA)
- General Engineering & Computer Science (AREA)
- Biodiversity & Conservation Biology (AREA)
- Biomedical Technology (AREA)
- Molecular Biology (AREA)
- Medical Informatics (AREA)
- Image Analysis (AREA)
Abstract
The invention proposes a method and a device of determining a saliency map for an image.
The proposed method comprises using a processing device for executing the steps of: means for selecting one of at least two different predetermined weight sets each associated with the predetermined scene category by determining to which of the predetermined scene categories a scene depicted in the image belongs, each predetermined weight sets comprising weights for colour dependent subbands, means for splitting the image into colour dependent frequency subbands and orientation subbands by splitting the image into colour components and applying wavelet transformation to each colour component, means for determining early feature maps for the subbands by extracting visual features from the wavelet transforms by a center-surround mechanism based on a Difference of Gaussian, means for weighting the early feature maps using the selected weight set and means for fusing the weighted feature maps.
Description
- The invention is made in the field of saliency map determination for images.
- Saliency maps reflect that the visual attention which subjects pay for image content varies in dependency on the content depicted. Visual attention is modelled in top-down models and in bottom up models.
- Top-down models are related to voluntary attention resulting from a cognitive task, such as object search, location recognition or face recognition. Bottom up models are related to involuntary attention guided only by visually relevant or stimulating areas of the image.
- C. Koch and S. Ullman: "Shifts in selection in Visual Attention: Towards the Underlying Neural Circuitry", Human Neurobiology, vol. 4, No. 4, p. 219-227, 1985, describe a model were early feature are extracted from visual input into several separate parallel channels. After this extraction and a particular treatment, a feature map is obtained for each channel. Next, the saliency map is build by fusing all these maps.
- L. Itti and C. Koch: "Feature combination strategies for saliency-based visual attention systems", JOURNAL OF ELECTRONIC IMAGING, 10 (1), p. 161-169, JAN 2001, study the problem of combining feature maps into a unique saliency map. Four combination strategies are compared: (1) Simple normalized summation, (2) linear combination with learned weights, (3) global nonlinear normalization followed by summation, and (4) local nonlinear competition between salient locations followed by summation.
- O. Le Meur, et al.: "A Coherent Computational Approach to Model Bottom-up Visual Attention", IEEE Trans. On Pattern analysis and Machine intelligence, Vol 28, No. 5, p. 802-817, May 2006, propose extraction of early feature maps by a perceptual channel decomposition of each of three perceptual components by splitting the 2D spatial frequency domain both in spatial radial frequency and in orientation.
- A. Torralba et al.: "Top-down control of visual attention in object detection" ICIP 2006 determines saliency maps for object search and uses scene categories for spatially tuning the saliency maps by selecting a spatial stripe and reinforcing saliency in this stripe.
- The invention introduces scene category dependent feature map weighting into bottom-up approaches.
- The invention proposes a method of determining a saliency map for an image according to
claim 1 and a device for determining a saliency map for an image according toclaim 3. - The proposed method comprises using a processing device for executing the steps of: determining to which of at least two predetermined scene categories a scene depicted in the image belongs wherein each of the at least two predetermined scene categories is associated with a different predetermined set of weights, each predetermined set of weights comprising weights for colour dependent subbands, selecting the weight set associated with the determined scene category, splitting the image into colour dependent frequency subbands and orientation subbands by splitting the image into colour components and applying wavelet transformation to each colour component, determining early feature maps for the subbands by extracting visual features from the wavelet transforms by a center-surround mechanism based on a Difference of Gaussian, using the selected weight set for weighting the early feature maps and fusing the weighted feature maps. The application of predetermined scene category dependent weight sets of which each comprises one weight per colour dependent subband improves the prediction and reliability of the bottom-up visual attention model.
- The features of further advantageous embodiments are specified in the dependent claims.
- Exemplary embodiments of the invention are illustrated in the drawings and are explained in more detail in the following description. The exemplary embodiments are explained only for elucidating the invention, but not limiting the invention's disclosure, scope or spirit defined in the claims.
- In the figures:
- Fig. 1
- depicts representation of the mean spectrum of the 4 exemplary reference scene categories with associated distribution histograms;
- Fig. 2
- depicts an exemplary one-level wavelet decomposition;
- Fig. 3
- depicts an overview over an exemplary visual attention model;
- Fig. 4
- depicts exemplary levels of wavelet decomposition; and
- Fig. 5
- depicts examples of stimuli for the STREET category and the OPENCOUNTRY category and its ocular fixation localization.
- The invention may be realized on any electronic device comprising a processing device correspondingly adapted. For instance, the invention may be realized in a television, a mobile phone, a personal computer, a digital still camera, a digital video camera or a car entertainment system.
- Saliency maps can be used in encoding, for instance in that more salient image regions are encoded with higher bit depth than less salient image regions. Or, in a scalable video encoding framework, the more salient image regions are encoded in a base layer while the less salient image regions are encoded in enhancement layers. Another field of application for saliency maps is the automated measurement of quality of experience. Such automated measurement is of advantage, for instance, in video provision services with quality dependent service fees, in evaluation of transmission channels or in evaluation of codecs.
- Based on some eye-tracking experiments, the inventors identified some typical behavior of observers for different scene categories, e.g. high frequencies have a major role for the prediction of attention regarding a street category and the vertical orientation is dominant in the attention deployment of a street category.
Fig. 5 depicts examples of stimuli for the STREET category and the OPENCOUNTRY category and its ocular fixation localization. - These experiments provided the inventors with a frequency, orientation and colour behavior per scene category which are matched in the following embodiments of visual attention model architectures. At least one embodiment is based on a wavelet transform which splits the original signal into frequency and orientation sub-bands (such as described later). This transform is applied on each colour component independently leading to a final merge of sub-bands and of color components at the end of the process.
- The merge or fusion of sub-bands is dependent on a scene category determined for the current image in order to improve the prediction of the computed saliency maps.
- In an embodiment, four different semantic categories have been characterized by its frequency signal particularities: COAST, MOUNTAIN, STREET and OPENCOUNTRY. These categories are interesting for obtaining typical stimuli because their Fourier spectrums are significantly different as exemplarily illustrated by
figure 1 which depicts representation of the mean spectrum of four reference scene categories described by Torralba and used with the distribution histogram associated. Distribution corresponds to the distance d from the mean spectrum normalized by the standard deviation of the category (d(s) = Σ[s(n,m) - AS(n,m)]/(n*m) ; AS = Average Spectra). This figure shows that spectral profiles are very distinct from one category to another, which reveals the invariant global layouts of the categories. Indeed, COAST presents a horizontally stretched diamond spectrum showing the horizontal fundament of the gist, OPENCOUNTRY provides a more proportioned diamond shaped spectrum which suggests more equality (in mean) for the proportion between horizontal and vertical aspects. MOUNTAIN spectrum is isotropic and underlines random aspect of Mountain shapes. STREET spectrum is very stretched especially in horizontal axis and in vertical axis what reveals rectilinear elements characterizing scenes with artificial surroundings. Further scene categories are possible. - In an embodiment, the visual signal is hierarchically decomposed. This is exemplarily depicted in
figures 2 ,3 and4 . A first step consists in separating the image signal into frequency level and orientation channels. The YUV color space separates achromatic (Y) and chromatic (U and V) perceptual signals. In an embodiment, the chromatic components have half the spatial resolution of the achromatic component. A separation of frequency and orientation ranges is performed, for instance through a wavelet transform for its computational efficiency. The wavelet transform separates frequencies with a succession of low-pass (H) and high-pass (G) filters followed by critical sub-sampling as exemplarily depicted for one level wavelet decomposition infigure 2 . One level wavelet transform results in four sub-bands: sub-band0 is the low-passed image approximation that is wavelet transformed to get next decomposition level; sub-band1 contains horizontal frequencies which corresponds to vertical orientation lines in the image; sub-band2 contains both diagonals; and sub-band3 contains vertical frequencies and corresponds to horizontal orientation lines in the image. - The number of wavelet levels can be fixed in advance, e.g. two or three, or it can be determined so that the smallest level has frequencies of 1 cycle per degree of visual angle. In an embodiment exemplarily depicted in
Figure 4 , the input image is thus decomposed into four levels L0, L1, L2, L3, each level comprising three orientation sub-bands Ov for vertical orientation, Od for diagonal orientation, and Oh for horizontal orientation. The last level also contains an approximation image, e.g. a low-resolution version of the image. Table 1 presents the frequency ranges in each level.Table 1 Level number 0 1 2 3 Frequency range (cycles per degree) 10.7 - 5.3 5.3 - 2.7 2.7 - 1.3 1.3 - 0.7 (0.7 - 0 for sub-band0) - In a second step, early visual features are extracted from the wavelet transformed signal, for instance by a center-surround mechanism based on a Difference of Gaussian (DoG). For each location, the center-surround is computed as the absolute difference between the center pixel and the average of absolute value of the surroundings pixels, e.g. in a five by five pixels square. Afterwards, in order to have the same spatial spreading of each computed value, center-surround results are averaged on a neighbourhood, for instance a circular neighborhood of one visual degree of diameter, e.g. one pixel at level L3 up to eleven pixels at level L0.
- Finally, weighted fusion of the early feature maps weighted by scene category dependent weights is applied. For each predetermined scene category there is a set of weights. In an embodiment exemplarily depicted in
figure 3 , scene category determination SCD and determination of scene dependent weights SDW takes place and three fusions are successively applied: orientations fusion, levels fusion and color channels fusion. In this embodiment, different weights are applied in at least one of the three fusion steps, examples for such different weights being given below in tables 2, 3 and 4. Fusion operation can be, for instance, weighted sums of the per-pixel center-surround values. In an embodiment, orientation and level uses weighted sums of the per-pixel center-surround values, with level fusion comprising up-sampling between levels. Color channel fusion operation keeps the maximum saliency value between Y, U, and V pixels after normalizing with an experimental maximum value taking into account the difference of amplitude between the three channels (Y: 5000, U&V: 1000). The output map can be finally normalized on 8 bits integer grayscale image (between 0 and 255). - Table 2 lists examples of the different weights which can be applied for orientation fusion in dependency on the scene category (OPENCOUNTRY, COAST, MOUNTAIN and STREET).
Table 2 All Levels relative energy/NSS Weighting factor Ov Od Oh Ov Od Oh OPENCOUNTRY 1,3 1,8 3,8 0,4 0,5 1,0 COAST 1,5 1,8 5,5 0,3 0,3 1,0 MOUNTAIN 3,2 3,7 5,2 0,6 0,7 1,0 STREET 3,8 2,3 2,9 1,0 0,6 0,8 - Table 3 lists examples of the different weights which can be applied for level fusion in dependency on the scene category.
Table 3 All Orientations relative energy/NSS Weighting factor L0 L1 L2 L3 L0 L1 L2 L3 OPENCOUNTRY 0,1 0,8 2,0 2,4 0,0 0,3 0,8 1,0 COAST 0,1 0,6 2,3 2,9 0,0 0,2 0,8 1,0 MOUNTAIN 0,1 0,8 3,1 4,3 0,0 0,2 0,7 1,0 STREET 0,1 0,7 2,3 3,4 0,0 0,2 0,7 1,0 - Table 4 lists examples of the different weights which can be applied for colour fusion in dependency on the scene category (OPENCOUNTRY, COAST, MOUNTAIN and STREET).
Table 4 All Orientations and level relative energy/NSS Weighting factor Y U V Y U V OPENCOUNTRY 0,5 0,5 0,6 0,8 0,8 1,0 COAST 0,6 0,6 0,6 1,0 1,0 1,0 MOUNTAIN 0,5 0,6 0,7 0,7 0,9 1,0 STREET 0,5 0,4 0,4 1,0 0,8 0,8 - The evaluation of proposed weights to be used for the merging process are based on the comparison of saliency maps which are either computed from the computational visual attention model or computed from the eye fixations recorded for all observers (
Figure 5 ). - Several metrics can be used to assess the degree of similarity between a ground truth and a prediction. In an embodiment, the NSS metric (NSS stands for Normalized Scanpath Salience) has been chosen for its simplicity and its relevancy. The NSS is relevant because it allows computing the value of salience. Its particularity is to average per scanpath the saliency at each fixation point locus and so, to provide a similarity metric based on the relevance of each entire scanpath independently of its size. Another advantage is to bring a signed metric centered on zero. It means that a positive value corresponds to similarity, a negative value corresponds to dissimilarity, and a zero value amounts to hazard.
Claims (4)
- Method of determining a saliency map for an image, said method comprising using a processing device for executing the steps of- determining to which of at least two predetermined scene categories a scene depicted in the image belongs wherein each of the at least two predetermined scene categories is associated with a different predetermined set of weights, each predetermined set of weights comprising weights for colour dependent subbands,- selecting the weight set associated with the determined scene category,- splitting the image into colour dependent frequency subbands and orientation subbands by splitting the image into colour components and applying wavelet transformation to each colour component,- determining early feature maps for the subbands by extracting visual features from the wavelet transforms by a center-surround mechanism based on a Difference of Gaussian,- using the selected weight set for weighting the early feature maps and- fusing the weighted feature maps.
- Method of claim 1, wherein the early feature maps are successively fused, first by orientation, then by level and finally by colour component.
- Device of determining a saliency map for an image, said device comprising- means for selecting one of at least two different predetermined weight sets each associated with the predetermined scene category by determining to which of the predetermined scene categories a scene depicted in the image belongs, each predetermined weight sets comprising weights for colour dependent subbands,- means for splitting the image into colour dependent frequency subbands and orientation subbands by splitting the image into colour components and applying wavelet transformation to each colour component,- means for determining early feature maps for the subbands by extracting visual features from the wavelet transforms by a center-surround mechanism based on a Difference of Gaussian,- means for weighting the early feature maps using the selected weight set and- means for fusing the weighted feature maps.
- Device of claim 3, wherein the early feature maps are successively fused, first by orientation, then by level and finally by colour component.
Priority Applications (1)
| Application Number | Priority Date | Filing Date | Title |
|---|---|---|---|
| EP11180620A EP2461274A1 (en) | 2010-09-16 | 2011-09-08 | Method and device of determining a saliency map for an image |
Applications Claiming Priority (2)
| Application Number | Priority Date | Filing Date | Title |
|---|---|---|---|
| EP10305989A EP2431919A1 (en) | 2010-09-16 | 2010-09-16 | Method and device of determining a saliency map for an image |
| EP11180620A EP2461274A1 (en) | 2010-09-16 | 2011-09-08 | Method and device of determining a saliency map for an image |
Publications (1)
| Publication Number | Publication Date |
|---|---|
| EP2461274A1 true EP2461274A1 (en) | 2012-06-06 |
Family
ID=43638968
Family Applications (2)
| Application Number | Title | Priority Date | Filing Date |
|---|---|---|---|
| EP10305989A Withdrawn EP2431919A1 (en) | 2010-09-16 | 2010-09-16 | Method and device of determining a saliency map for an image |
| EP11180620A Withdrawn EP2461274A1 (en) | 2010-09-16 | 2011-09-08 | Method and device of determining a saliency map for an image |
Family Applications Before (1)
| Application Number | Title | Priority Date | Filing Date |
|---|---|---|---|
| EP10305989A Withdrawn EP2431919A1 (en) | 2010-09-16 | 2010-09-16 | Method and device of determining a saliency map for an image |
Country Status (2)
| Country | Link |
|---|---|
| US (1) | US8437543B2 (en) |
| EP (2) | EP2431919A1 (en) |
Cited By (1)
| Publication number | Priority date | Publication date | Assignee | Title |
|---|---|---|---|---|
| CN103218815A (en) * | 2013-04-19 | 2013-07-24 | 复旦大学 | Method for statistical calculation of image saliency map by means of natural scenes |
Families Citing this family (25)
| Publication number | Priority date | Publication date | Assignee | Title |
|---|---|---|---|---|
| FR2947069A1 (en) * | 2009-06-19 | 2010-12-24 | Thomson Licensing | METHOD OF SELECTING VERSIONS OF A DOCUMENT AMONG A PLURALITY OF VERSIONS RECEIVED FOLLOWING A SEARCH, AND ASSOCIATED RECEIVER |
| AU2011254040B2 (en) * | 2011-12-14 | 2015-03-12 | Canon Kabushiki Kaisha | Method, apparatus and system for determining a saliency map for an input image |
| US9501710B2 (en) * | 2012-06-29 | 2016-11-22 | Arizona Board Of Regents, A Body Corporate Of The State Of Arizona, Acting For And On Behalf Of Arizona State University | Systems, methods, and media for identifying object characteristics based on fixation points |
| CN102867313B (en) * | 2012-08-29 | 2015-04-22 | 杭州电子科技大学 | Visual saliency detection method with fusion of region color and HoG (histogram of oriented gradient) features |
| CN103065136A (en) * | 2013-01-29 | 2013-04-24 | 中国电子科技集团公司第二十八研究所 | Method for recognizing collaborative target in SAR (Synthetic Aperture Radar) image based on visual attention mechanism |
| CN104834933B (en) * | 2014-02-10 | 2019-02-12 | 华为技术有限公司 | Method and device for detecting image saliency area |
| US10503999B2 (en) | 2015-03-24 | 2019-12-10 | Hrl Laboratories, Llc | System for detecting salient objects in images |
| CN104835129B (en) * | 2015-04-07 | 2017-10-31 | 杭州电子科技大学 | A kind of two-hand infrared image fusion method that use local window vision attention is extracted |
| WO2016207875A1 (en) | 2015-06-22 | 2016-12-29 | Photomyne Ltd. | System and method for detecting objects in an image |
| CN105761238B (en) * | 2015-12-30 | 2018-11-06 | 河南科技大学 | A method of passing through gray-scale statistical data depth information extraction well-marked target |
| CN106447641A (en) * | 2016-08-29 | 2017-02-22 | 努比亚技术有限公司 | Image generation device and method |
| EP3635631B1 (en) * | 2017-06-07 | 2025-12-03 | HRL Laboratories, LLC | System for detecting salient objects in images |
| CN108875750B (en) * | 2017-08-25 | 2021-08-10 | 北京旷视科技有限公司 | Object detection method, device and system and storage medium |
| CN107944354B (en) * | 2017-11-10 | 2021-09-17 | 南京航空航天大学 | Vehicle detection method based on deep learning |
| CN108111778A (en) * | 2017-12-25 | 2018-06-01 | 信利光电股份有限公司 | A kind of photographic device and electronic equipment |
| CN109101946B (en) * | 2018-08-27 | 2021-02-12 | Oppo广东移动通信有限公司 | Image feature extraction method, terminal device and storage medium |
| CN109447136A (en) * | 2018-10-15 | 2019-03-08 | 方玉明 | A kind of conspicuousness detection method for 360 degree of images |
| US11729407B2 (en) | 2018-10-29 | 2023-08-15 | University Of Washington | Saliency-based video compression systems and methods |
| CN109543701A (en) * | 2018-11-30 | 2019-03-29 | 长沙理工大学 | Vision significance method for detecting area and device |
| CN110245660B (en) * | 2019-06-03 | 2022-04-22 | 西北工业大学 | Webpage glance path prediction method based on saliency feature fusion |
| CN110298806B (en) * | 2019-07-04 | 2022-04-12 | 上海融军科技有限公司 | Infrared image enhancement method and system |
| CN111046966B (en) * | 2019-12-18 | 2022-04-05 | 江南大学 | Image caption generation method based on metric attention mechanism |
| CN112633352B (en) * | 2020-12-18 | 2023-08-29 | 浙江大华技术股份有限公司 | A target detection method, device, electronic equipment and storage medium |
| CN114549875B (en) * | 2021-12-28 | 2025-10-28 | 浙江大华技术股份有限公司 | Image difference detection method, electronic device and storage medium |
| CN114549668B (en) * | 2022-01-04 | 2024-07-16 | 华南农业大学 | A method for detecting fruit maturity on trees based on visual saliency maps |
Citations (1)
| Publication number | Priority date | Publication date | Assignee | Title |
|---|---|---|---|---|
| WO2011008236A1 (en) * | 2009-06-30 | 2011-01-20 | Eastman Kodak Company | Method and apparatus for image display control according to viewer factors and responses |
Family Cites Families (5)
| Publication number | Priority date | Publication date | Assignee | Title |
|---|---|---|---|---|
| US7116836B2 (en) * | 2002-01-23 | 2006-10-03 | Sony Corporation | Method and apparatus for enhancing an image using a wavelet-based retinex algorithm |
| US7436981B2 (en) * | 2005-01-28 | 2008-10-14 | Euclid Discoveries, Llc | Apparatus and method for processing video data |
| US8165407B1 (en) * | 2006-10-06 | 2012-04-24 | Hrl Laboratories, Llc | Visual attention and object recognition system |
| US8243068B2 (en) * | 2007-05-17 | 2012-08-14 | University Of Maryland | Method, system and apparatus for determining and modifying saliency of a visual medium |
| WO2011000020A1 (en) | 2009-06-12 | 2011-01-06 | Sbc Research Pty Ltd | Enhanced method of detection |
-
2010
- 2010-09-16 EP EP10305989A patent/EP2431919A1/en not_active Withdrawn
-
2011
- 2011-08-25 US US13/199,303 patent/US8437543B2/en not_active Expired - Fee Related
- 2011-09-08 EP EP11180620A patent/EP2461274A1/en not_active Withdrawn
Patent Citations (1)
| Publication number | Priority date | Publication date | Assignee | Title |
|---|---|---|---|---|
| WO2011008236A1 (en) * | 2009-06-30 | 2011-01-20 | Eastman Kodak Company | Method and apparatus for image display control according to viewer factors and responses |
Non-Patent Citations (17)
| Title |
|---|
| 0. LE MEUR ET AL.: "A Coherent Computational Approach to Model Bottom-up Visual Attention", IEEE TRANS. ON PATTERN ANALYSIS AND MACHINE INTELLIGENCE, vol. 28, no. 5, May 2006 (2006-05-01), pages 802 - 817, XP001520793, DOI: doi:10.1109/TPAMI.2006.86 |
| A. TORRALBA ET AL.: "Top-down control of visual attention in object detection", ICIP, 2006 |
| AJAY DIVAKARAN: "Multimedia Content Analysis", 1 January 2009, SPRINGER, pages: 186 - 187,193, XP002631676 * |
| ANIL BARATH AND MARIA PETROU: "Next Generation Artificial Vision Systems", 1 January 2008, ARTECH HOUSE, pages: 105,120 - 121, XP002631674 * |
| ANIL BARATH AND MARIA PETROU: "Next Generation Artificial Vision Systems", 1 January 2008, ARTECH HOUSE, pages: 28, XP002631675 * |
| C. KOCH, S. ULLMAN: "Shifts in selection in Visual Attention: Towards the Underlying Neural Circuitry", HUMAN NEUROBIOLOGY, vol. 4, no. 4, 1985, pages 219 - 227, XP008134119 |
| ITTI L ET AL: "A model of saliency-based visual attention for rapid scene analysis", IEEE TRANSACTIONS ON PATTERN ANALYSIS AND MACHINE INTELLIGENCE, IEEE SERVICE CENTER, LOS ALAMITOS, CA, US, vol. 20, no. 11, 1 November 1998 (1998-11-01), pages 1254 - 1259, XP002582427, ISSN: 0162-8828 * |
| JOHN P. FRISBY: "Seeing. The Computational Approach to Biological Vision. Second Edition", 1 January 2010, MIT, article "Chapter 6, Seeing and the Retina", XP002674140 * |
| L. ITTI, C. KOCH: "Feature combination strategies for saliency-based visual attention systems", JOURNAL OF ELECTRONIC IMAGING, vol. 10, no. 1, January 2001 (2001-01-01), pages 161 - 169, XP001203934, DOI: doi:10.1117/1.1333677 |
| LAURENT ITTI ET AL: "Neurobiology of Attention", 1 January 2005, 20050101, PAGE(S) 197 - 206, ISBN: 978-0-12-375731-9, article V. NAVALPAKKAM ET AL: "Attention and Scene Understanding", pages: 197, XP008094224 * |
| LAURENT ITTI ET AL: "Neurobiology of Attention", 1 January 2005, 20050101, PAGE(S) 586 - 592, ISBN: 978-0-12-375731-9, article ANTONIO TORRALBA: "Contextual Influences on Saliency", pages: 586 - 592, XP008094234 * |
| LAURENT ITTI ET AL: "Neurobiology of Attention", 1 January 2005, ELSEVIER, article LAURENT ITTI: "Models of Bottom-up Attention and Saliency", pages: 576 - 582, XP002674137 * |
| NAVALPAKKAM V ET AL: "An Integrated Model of Top-Down and Bottom-Up Attention for Optimizing Detection Speed", CONFERENCE ON COMPUTER VISION AND PATTERN RECOGNITION, 2006 IEEE COMPUTER SOCIETY , NEW YORK, NY, USA, vol. 2, 17 June 2006 (2006-06-17) - 22 June 2003 (2003-06-22), IEEE, PISCATAWAY, NJ, USA, pages 2049 - 2056, XP010923105, ISBN: 978-0-7695-2597-6, DOI: 10.1109/CVPR.2006.54 * |
| OLIVIER LE MEUR: "Attention sélective en visualisation d'images fixes et animées affichées sur écran: modèles et évaluation de performances - applications", THÈSE DE DOCTORAT, 24 October 2005 (2005-10-24), Nantes, FR, XP002674141, Retrieved from the Internet <URL:http://www.irisa.fr/temics/staff/lemeur/publi/LeMeur_These.pdf> [retrieved on 20120405] * |
| STEPHEN E. PALMER: "Vision Science. Photons to Phenomenology", 1 January 1999, MIT, article "Chapter 4, Processing Image Structure", pages: 145 - 197, XP002674138 * |
| STEPHEN E. PALMER: "Vision Science. Photons to Phenomenology", 1 January 1999, MIT, pages: 116 - 120, 557, XP002674139 * |
| URBAN F ET AL: "Medium spatial frequencies, a strong predictor of salience", COGNITIVE COMPUTATION, 23 November 2010 (2010-11-23), pages 37 - 47, XP008134126, ISSN: 1866-9956, [retrieved on 20101123], DOI: 10.1007/S12559-010-9086-8 * |
Cited By (2)
| Publication number | Priority date | Publication date | Assignee | Title |
|---|---|---|---|---|
| CN103218815A (en) * | 2013-04-19 | 2013-07-24 | 复旦大学 | Method for statistical calculation of image saliency map by means of natural scenes |
| CN103218815B (en) * | 2013-04-19 | 2016-03-30 | 复旦大学 | Utilize the method for natural scene statistical computation image saliency map |
Also Published As
| Publication number | Publication date |
|---|---|
| EP2431919A1 (en) | 2012-03-21 |
| US8437543B2 (en) | 2013-05-07 |
| US20130028511A1 (en) | 2013-01-31 |
Similar Documents
| Publication | Publication Date | Title |
|---|---|---|
| US8437543B2 (en) | Method and device of determining a saliency map for an image | |
| US11830230B2 (en) | Living body detection method based on facial recognition, and electronic device and storage medium | |
| Rivadeneira et al. | Thermal image super-resolution: A novel architecture and dataset. | |
| Jia et al. | Inconsistency-aware wavelet dual-branch network for face forgery detection | |
| US8608073B2 (en) | System and method for robust real-time 1D barcode detection | |
| CN108629744B (en) | Image enhancement method | |
| Anjum et al. | Recapture detection technique based on edge-types by analysing high-frequency components in digital images acquired through LCD screens | |
| KR20120019425A (en) | Image processing device, method, and program | |
| Abraham | Moiré pattern detection using wavelet decomposition and convolutional neural network | |
| Kaur et al. | Survey on multifocus image fusion techniques | |
| CN120672589A (en) | Hyperspectral and multispectral image fusion method based on wavelet feature fusion and contrast learning | |
| CN108932492A (en) | A kind of image fingerprint extracting method based on non-sampled shearing wave conversion | |
| CN120783224A (en) | Single wood trunk structure extraction method and system based on deep learning | |
| Wang et al. | Infrared weak-small targets fusion based on latent low-rank representation and DWT | |
| Yao et al. | Screen-shot and Demoiréd image identification based on DenseNet and DeepViT | |
| Xie et al. | Just noticeable visual redundancy forecasting: a deep multimodal-driven approach | |
| Lu et al. | Towards low-visibility enhancement in maritime video surveillance: An efficient and effective multi-deep neural network | |
| CN120219895A (en) | Infrared small target detection method based on high and low frequency decoupling | |
| CN107832696A (en) | A kind of electric operating object in situ security feature identifying system | |
| Wu et al. | Review of imaging device identification based on machine learning | |
| CN116664461A (en) | A color image multi-focus information fusion method based on image information decomposition and image information fusion | |
| CN116958758A (en) | Data processing methods and devices, equipment, storage media, and program products | |
| Le Meur et al. | Performance assessment of a visual attention system entirely based on a human vision modeling | |
| Chao | Feature-preserving image and video compression. | |
| Lamicchane et al. | Geometric feature based approach for 360 image saliency estimation |
Legal Events
| Date | Code | Title | Description |
|---|---|---|---|
| PUAI | Public reference made under article 153(3) epc to a published international application that has entered the european phase |
Free format text: ORIGINAL CODE: 0009012 |
|
| AK | Designated contracting states |
Kind code of ref document: A1 Designated state(s): AL AT BE BG CH CY CZ DE DK EE ES FI FR GB GR HR HU IE IS IT LI LT LU LV MC MK MT NL NO PL PT RO RS SE SI SK SM TR |
|
| AX | Request for extension of the european patent |
Extension state: BA ME |
|
| 17P | Request for examination filed |
Effective date: 20121206 |
|
| STAA | Information on the status of an ep patent application or granted ep patent |
Free format text: STATUS: THE APPLICATION HAS BEEN WITHDRAWN |
|
| RAP1 | Party data changed (applicant data changed or rights of an application transferred) |
Owner name: THOMSON LICENSING DTV |
|
| 18W | Application withdrawn |
Effective date: 20170421 |