EP2443611B1 - Image analysis method - Google Patents
Image analysis method Download PDFInfo
- Publication number
- EP2443611B1 EP2443611B1 EP10726166.1A EP10726166A EP2443611B1 EP 2443611 B1 EP2443611 B1 EP 2443611B1 EP 10726166 A EP10726166 A EP 10726166A EP 2443611 B1 EP2443611 B1 EP 2443611B1
- Authority
- EP
- European Patent Office
- Prior art keywords
- image
- tooth
- model
- area
- variations
- Prior art date
- Legal status (The legal status is an assumption and is not a legal conclusion. Google has not performed a legal analysis and makes no representation as to the accuracy of the status listed.)
- Active
Links
Images





Classifications
-
- G—PHYSICS
- G06—COMPUTING OR CALCULATING; COUNTING
- G06T—IMAGE DATA PROCESSING OR GENERATION, IN GENERAL
- G06T7/00—Image analysis
- G06T7/0002—Inspection of images, e.g. flaw detection
- G06T7/0012—Biomedical image inspection
- G06T7/0014—Biomedical image inspection using an image reference approach
-
- A—HUMAN NECESSITIES
- A61—MEDICAL OR VETERINARY SCIENCE; HYGIENE
- A61B—DIAGNOSIS; SURGERY; IDENTIFICATION
- A61B6/00—Apparatus or devices for radiation diagnosis; Apparatus or devices for radiation diagnosis combined with radiation therapy equipment
- A61B6/50—Apparatus or devices for radiation diagnosis; Apparatus or devices for radiation diagnosis combined with radiation therapy equipment specially adapted for specific body parts; specially adapted for specific clinical applications
- A61B6/51—Apparatus or devices for radiation diagnosis; Apparatus or devices for radiation diagnosis combined with radiation therapy equipment specially adapted for specific body parts; specially adapted for specific clinical applications for dentistry
- A61B6/512—Intraoral means
-
- A—HUMAN NECESSITIES
- A61—MEDICAL OR VETERINARY SCIENCE; HYGIENE
- A61B—DIAGNOSIS; SURGERY; IDENTIFICATION
- A61B6/00—Apparatus or devices for radiation diagnosis; Apparatus or devices for radiation diagnosis combined with radiation therapy equipment
- A61B6/52—Devices using data or image processing specially adapted for radiation diagnosis
- A61B6/5211—Devices using data or image processing specially adapted for radiation diagnosis involving processing of medical diagnostic data
- A61B6/5229—Devices using data or image processing specially adapted for radiation diagnosis involving processing of medical diagnostic data combining image data of a patient, e.g. combining a functional image with an anatomical image
- A61B6/5235—Devices using data or image processing specially adapted for radiation diagnosis involving processing of medical diagnostic data combining image data of a patient, e.g. combining a functional image with an anatomical image combining images from the same or different ionising radiation imaging techniques, e.g. PET and CT
-
- G—PHYSICS
- G06—COMPUTING OR CALCULATING; COUNTING
- G06T—IMAGE DATA PROCESSING OR GENERATION, IN GENERAL
- G06T2207/00—Indexing scheme for image analysis or image enhancement
- G06T2207/10—Image acquisition modality
- G06T2207/10116—X-ray image
-
- G—PHYSICS
- G06—COMPUTING OR CALCULATING; COUNTING
- G06T—IMAGE DATA PROCESSING OR GENERATION, IN GENERAL
- G06T2207/00—Indexing scheme for image analysis or image enhancement
- G06T2207/20—Special algorithmic details
- G06T2207/20212—Image combination
- G06T2207/20221—Image fusion; Image merging
-
- G—PHYSICS
- G06—COMPUTING OR CALCULATING; COUNTING
- G06T—IMAGE DATA PROCESSING OR GENERATION, IN GENERAL
- G06T2207/00—Indexing scheme for image analysis or image enhancement
- G06T2207/30—Subject of image; Context of image processing
- G06T2207/30004—Biomedical image processing
- G06T2207/30036—Dental; Teeth
Definitions
- the present invention relates to a method for detecting indications of dental caries in an image of a tooth such as an intra-oral radiograph.
- Carious lesions that have penetrated into the dentine are treatable only by removing the decayed tissue and filling the cavity with a dental restorative material.
- the present invention provides a method in which areas of the tooth image which are analysed to identify dental caries are defined with reference to a model fitted to an outer tooth edge.
- areas of the tooth image which are analysed to identify dental caries are defined with reference to a model fitted to an outer tooth edge.
- areas for analysis with reference to a model of an outer tooth edge more accurate determination of caries can be achieved.
- fitting of a model to the outer edge of a tooth allows that outer edge to be accurately located in the image.
- the inventors have found that such accurate location of the outer tooth edge provides a valuable reference for the identification of areas which are to be analysed to detect indications of dental caries.
- image variations in an area of the image close to the edge of a tooth may be analysed to provide early indications of dental caries.
- the area of the image in which image variations are analysed may be a plurality of areas of the image, each area being defined with reference to the fitted model.
- the or each area of the image in which image variations are analysed may be elongate. Further, the or each area of the image in which image variations are analysed may extend generally parallel to the fitted model and image variations in a direction generally parallel to the fitted model may be analysed. That is, the inventors have found that considering image variation along elongate profiles extending generally parallel to the fitted model allows indications of dental caries to be effectively identified.
- Analysing image variations may comprise analysing changes in pixel values (e.g. grey level values) to identify a local maximum or minimum in the pixel values, for example a maximum or minimum of a predetermined magnitude. That is, while pixel values along the elongate profiles may be expected to include no maxima or minima of any great magnitude in a healthy tooth, dental caries maybe indicated by such a maximum or minimum.
- pixel values e.g. grey level values
- Analysing image variations in an area of the image may comprise obtaining data comprising pixel values for pixels in each of a plurality of areas of the image, each area representing a part of the tooth and each area being defined with reference to the fitted model, combining the obtained data from the plurality of areas and analysing image variations in the combined data to detect indications of dental caries.
- the obtained data may be clustered into groups of obtained data. Each cluster may be averaged and analysis performed on the average cluster values.
- the method may further comprise defining a plurality of projections extending generally perpendicular to the fitted model, and defining the or each area by reference to corresponding points on each of said projections.
- the or each area may extend generally parallel to the fitted model.
- the method may further comprise identifying a location in the image that is an approximation of the centre of the tooth in the image, and initializing a model fitting process based upon the identified location to identify the part of the image representing an outside edge of the tooth.
- Identifying a location in the image which is an approximation of the centre of the tooth in the image may comprise at least partially identifying the boundaries of the tooth in the image, and identifying a point within the identified boundaries for which the shortest distance to a boundary is a maximum for all points within the identified boundaries.
- the location may be based upon the identified point.
- the identification of such a point may be carried out by applying a distance transform operation to the image.
- At least partially identifying the boundaries of the tooth in the image may comprise detecting edges in the image, and identifying the boundaries based upon the detected edges.
- the method may further comprise fitting a model to the image to identify a part of the image representing at least part of the dentinoenamel junction.
- Image variations may be analysed in areas between the fitted model identifying a part of the image representing an outside edge of the tooth and the fitted model identifying the part of the image representing at least part of the dentinoenamel junction. Such variations may be considered to be indicative of dental caries in the enamel of the tooth, that is the area of the image between the model fitted to the part of the image representing an outside edge of the tooth, and the model fitted to the part of the image representing at least part of the dentine enamel junction.
- Image variations may additionally be analysed in a part of the image representing dentine of the tooth defined by the fitted model identifying the part of the image representing the at least part of the dentinoenamel junction, to determine whether dental caries extends into the dentine.
- Dental caries detected in the enamel of the tooth but not in the dentine of the tooth is typically suitable for non-surgical treatment.
- Fitting a model to the image to identify a part of the image representing an outside edge of the tooth may comprise fitting a first tooth edge model to a left side of the tooth, and fitting a second tooth edge model to a right side of the tooth.
- Fitting a model to the image to identify a part of the image representing at least part of the dentinoenamel junction may comprise fitting a first dentinoenamel junction model to a left dentinoenamel junction of the tooth, and fitting a second dentinoenamel junction model to a right dentinoenamel junction of the tooth.
- the fitting of the dentinoenamel junction model may be based upon the model fitted to a corresponding outside edge of a tooth.
- the image may depict a plurality of teeth. Data may be generated indicating the presence of dental caries in each of said teeth based upon analysed image variations.
- each model may be a shape model.
- each model may be a point distribution model.
- each model may be an Active Shape Model.
- Embodiments of the invention can also be implemented by way of suitable computer programs. Accordingly, the invention provides such computer programs and further provides computer readable media carrying such computer programs.
- Such computer readable media include tangible carrier media such as CD's, DVD's and floppy disks and intangible carrier media such as communication signals.
- a radiograph of the patient's teeth is received.
- the radiograph is a bitewing radiograph of the kind commonly used by dentists to detect dental caries.
- Figure 2 shows an example of a suitable bitewing radiograph.
- FIG. 2 shows seven teeth.
- a tooth 1 is labelled to aid description.
- Each tooth comprises an enamel portion 2 and a dentine portion 3.
- the dentinoenamel junction 4 is the boundary at which the enamel portion 2 meets the dentine portion 3.
- an approximate centre of each tooth is determined.
- the approximate centre of each tooth is used as a starting position to fit right and left tooth edge models to the left and right edges of each tooth.
- each outside edge of each tooth (identified by the fitted right and left tooth edge models) is used as a starting position to fit right and left dentinoenamel junction models to the right and left dentinoenamel junctions of each tooth. It will be appreciated that after the processing of step S4 is complete, four models will have been fitted to each tooth, identifying the positions of the outside edges and dentinoenamel junctions of each tooth. As is described below, the identification of the right and left edges and right and left dentinoenamel junctions of each tooth can be useful in the identification of dental caries.
- an adaptive threshold is applied to the bitewing radiograph received at step S1 of Figure 1 .
- the adaptive threshold is applied by processing the image in windows of size 128 x 128 pixels. For each window the mean of all pixel values in that window is generated. The adaptive threshold for all pixels in the window is then set at 70% of the generated mean value. If a respective pixel has a value which exceeds the adaptive threshold for the window in which it is located, the pixel is set to have a value of '1' (i.e. to be white) while if the pixel has a value which does not exceed its adaptive threshold it is set to have a value of '0' (i.e. to be black).
- window size and thresholding values may be chosen or calculated using any appropriate method as will be apparent to those skilled in the art. However, by ensuring that each window, includes pixels representing tooth structures and pixels representing non-tooth structures, a threshold is generated which can effectively distinguish pixels representing tooth structures from pixels which represent non-tooth structures.
- Figure 4 shows the results of applying adaptive thresholding of the type described above to the bitewing radiograph of Figure 2 .
- edge detection is applied to the bitewing radiograph ( Figure 2 ) and the thresholded image ( Figure 4 ) to generate respective edge images at step S6.
- Figure 5 is an edge image showing edges detected by applying a gradient based edge detection operation to the bitewing radiograph of Figure 2 . It will be appreciated that any suitable edge detection algorithm may be used. The resulting edge image may be subjected to a smoothing operation so as to improve the continuity of detected edges.
- the two edge images generated at step S6 are combined.
- the combination is such that a pixel in the combined image has a value given by adding the pixel values of the corresponding pixels of each of the edge images.
- the combined image is shown in Figure 6.
- Figure 6 shows a smoothed version of the image of Figure 5 combined with an edge image generated from the adaptive threshold image of Figure 4 . Referring to Figure 6 it can be seen that where the pixels of the edge images overlap, the pixels of the combined image are brighter than the pixels appearing in only one of the edge images.
- the combined image is processed to determine pairs of edges which can be classified as boundaries of a single tooth. For example, by horizontally scanning the image of Figure 6 for pixels which exceed a particular threshold (the threshold chosen such that only overlapping pixels from the two edge images exceed the threshold) edges 5 to 10 on the maxillary teeth will be found. Such horizontal scanning is carried out for each row of pixels in the image in turn. Each consecutively encountered pair of edges (e.g. 5 and 6, 7 and 8, 9 and 10) defines the edges of a tooth. The upper extremes of the maxillary teeth and the lower extremes of the mandibular teeth can then be determined based upon the termination of the edges defining each tooth.
- a particular threshold the threshold chosen such that only overlapping pixels from the two edge images exceed the threshold
- the image of Figure 6 can also be vertically scanned to identify pixels which exceed the threshold described above. Such vertical scanning is carried out for each column of pixels in turn, and allows identification of the lower edges of the maxillary teeth and upper edges of the mandibular teeth.
- a distance transform for example a Euclidean distance transform
- a distance transform image such as that shown in Figure 8 . It can be seen that the pixels of the image of Figure 8 increase in brightness as the distance from their nearest edge increases. In this way, those pixels for which the shortest distance to an edge is a maximum for all of the pixels within the determined tooth boundaries (i.e. those pixels near to the centre of the tooth) are the brightest pixels.
- the distance transform image generated at step S10 is subjected to a thresholding operation at step S11.
- Figure 9 shows the distance transform image of Figure 8 after a thresholding operation.
- the thresholding is arranged such that pixels which exceed the threshold maintain their value before thresholding, while pixels which do not exceed the threshold have a value of '0' (i.e. appear black). As such the thresholding separates the distance transform image into a plurality of areas of non-zero pixels, each area being surrounded by zero-pixels.
- the thresholded distance transform image of Figure 9 is used to determine the approximate centre of each tooth.
- the pixel having the highest distance value defines a point near to the centre of that tooth. That is, if a pixel within a tooth with coordinate (i,j) has the highest distance value, the corresponding pixel (i,j) of the bitewing radiograph should define a point near to the centre of that tooth.
- Each discrete area of the thresholded distance transform image of Figure 9 having non-zero pixel values is processed in turn to determine the brightest pixel in that area and thereby determine an estimate of the centre of a respective tooth.
- Figure 10 shows the bitewing radiograph of Figure 2 with the approximate centre points of each tooth marked.
- steps S1 and S2 are carried out at steps S1 and S2 to locate the centre of each tooth.
- steps S3 and S4 are now described in more detail.
- steps S3 and S4 fits four point distribution models to each tooth. That is, for each tooth, the processing fits a point distribution model to the left and right outer edges of the tooth and a point distribution model to the left and right dentinoenamel junctions of the tooth.
- the nature of the models which are fitted to the teeth and the creation of the models are now described before the process of fitting the models to the teeth is described.
- the models used to locate both the tooth boundaries and the dentinoenamel junctions are of similar form, and the models are therefore described generically.
- the models used to identify the right and left tooth boundaries and the right and left dentinoenamel junctions are point distribution models.
- the models are created by manual annotation of training images aligned to a common co-ordinate system. That is, points to be included within the model are marked by a human expert in a plurality of training images. These manually placed points are used as a basis for interpolation so as to provide a point distribution model. It has been found that placing 20 points along a tooth edge, and 11 points along a dentinoenamel junction allows effective models to be created.
- two human experts each annotate each of the training images, and the annotations of each expert are combined by taking a mean of the marked points, although in some cases annotation by a single expert may be sufficient for model generation.
- Each shape annotated in the manner described above is represented by a respective shape vector, comprising a concatenation of the coordinates of the marked points.
- a plurality of shape vectors, one for each training image can be used to generate a matrix X, in which each row represents a shape vector.
- Each of these shapes is translated, rotated and scaled so that their centroids coincide and the sum of squared differences between the points on each shape and those on the mean shape is minimised.
- the eigenvectors of the matrix S can be determined and a matrix P of the t most significant eigenvectors can be created.
- the eigenvectors P i are sorted according to their eigenvalues ⁇ i , which describe the observed variance over the training shapes associated with each eigenvector. That is to say the ⁇ i represent the proportions of variance from the mean shape that are described by each of the eigenvectors.
- t ⁇ N
- Each eigenvector included in the matrix P represents a mode of variation of the modelled shape.
- Varying values of elements of the vector b allows generation of shapes within the range observed within images of the training images. That is, variation of one element b 1 of the vector b will affect one characteristic of the modelled shape, while variation of a second element b 2 will affect a different characteristic of the modelled shape.
- point distribution models may be created for each of the left and right edges and left and right dentinoenamel junctions of different types of tooth. For example, separate point distribution models may be created for molars and pre-molars. Alternatively, the same point distribution models may be used for both molars and pre-molars. Similarly, different point distribution models may be created for the relevant parts of both the upper and lower teeth.
- an outside tooth edge model is fitted to a tooth (step S3) before a model of the dentinoenamel junction is fitted to that tooth (step S4).
- the point distribution models are used as Active Shape Models (ASMs).
- ASMs Active Shape Models
- an Active Shape Model is a statistical model of shape, such as a Point Distribution Model (above) which can be iteratively adjusted to fit image data while retaining the shape constraints expressed by the model.
- ASMs are described in further detail in Cootes, T.F.; Taylor C.J.; Cooper, D.H.; and Graham, J: "Active Shape Models - Their Training and Application” Computer Vision and Image Understanding, vol 61(1) pp 38-59; 1995 .
- ASMs are further described in " Model-Based Methods in Analysis of Biomedical Images” in Ed. R. Baldock and J. Graham, “Image Processing and Analysis”, Chapter 7, pp223-248, Oxford University Press, 2000 , or in P. Danny Allen et al.: “Detecting Reduced Bone Mineral Density From Dental Radiographs Using Statistical Shape Models", IEEE Transactions on Information Technology in Biomedicine, vol. 11, no. 6, pp 601-610, 1. November 2007 .
- a previously generated point distribution model of the outside edge of a tooth is fitted to the bitewing radiograph.
- the centre of the tooth determined as described above with reference to the processing of Figure 3 , is used to initialise the fit of the previously generated point distribution model.
- the point distribution models acting as ASMs are fitted using a process of iterative local refinement.
- an initial shape is defined by the average shape of the relevant shape model.
- the initial shape 15 is placed at the centre point 16 of a tooth as shown in Figure 11 .
- the ASM then attempts to correctly locate the tooth edge.
- an instance of the Point Distribution Model is essentially a set of points defining the boundary of a shape.
- a search is made along a line perpendicular to the shape border at that point for the best candidate location to move that point to in the next iteration of the search.
- the best location is defined as the position of maximum gradient where the polarity of the gradient is such that the image intensity changes from light within the tooth to dark outside the tooth.
- the distance along the perpendicular included in this search is known as the 'Profile Length', and its relevance is discussed in further detail below.
- Equation (6) provides a constraint on the allowed variation in shape by restricting the modes of variation to those described by the point distribution model.
- the values of the vector b are modified iteratively until a distribution of points considered to be sufficiently accurate is determined. Iterative modification typically ends when changes in positions between subsequent iterations are sufficiently small.
- any ASM search a number of parameters need to be set such as sample profile length, degree of PDM shape constraint (defined by the sum of equation (7)) number of resolution levels, and so on. In the experiments carried out, these parameters were determined empirically.
- a plurality of ASM searches can be performed with each search using different parameters.
- a first search can be used to generate an approximate fit and a second search can then be used to more accurately fit the ASM to the outer tooth edge.
- the first search uses a relatively long profile length to allow the ASM to move from an initial position at the centre of the tooth to the outer edge of the tooth while being relatively constrained to the mean shape (as indicated by equation 7).
- the search length can be shortened, and the PDM shape constraint can be relaxed to allow for greater variability from the mean.
- Figure 12 shows the results of performing a first ASM search from the starting position shown in Figure 11 using a relatively long profile length of 25 pixels and PDM shape constraint of approximately 30% from the mean. It can be seen that while the ASM search has successfully located the outer edge of the tooth, the model 15 is not accurately fitted to the outer edge.
- Figure 13 shows the results of performing a second search from the position shown in Figure 12 using a relatively short profile length of 10 pixels and a PDM shape constraint (defined by equation (7)) of approximately 99% from the mean (i.e. allowing greater variance). It can be seen that after the second iteration, the model 15 is more accurately fitted to the outer edge of the tooth.
- the first search allows the model points to move sufficiently far from the centre to reach the outer tooth edge, while at the same time ensuring that the shape of the model does not vary so far from the mean that it cannot be fitted to the outer tooth edge.
- the profile length can be shortened as the model points have less distance to travel, and the PDM shape constraint can be set such as to allow the model points to more closely fit the outer tooth edge even if the shape of the tooth edge varies significantly from the mean shape.
- an ASM search is used to locate the dentinoenamel junction at step S4.
- the difference in intensity between the dentine and the enamel may not be great enough to allow a search to be based upon the strongest edge.
- the training set is used to build a statistical model of the grey-level structure around the dentinoenamel junction by sampling along a profile normal to each dentinoenamel junction model point in each image in the training set.
- the derivative along the profile can be sampled rather than the absolute grey-level values.
- the dentinoenamel junction ASM was initialized such that a fourth point from an end of the dentinoenamel junction model was located at a selected point of the fitted outer tooth edge ASM. During search, this fourth point was kept fixed leaving the other points to move along their normals to find the dentinoenamel junction. This procedure was repeated by selecting each point of the fitted outer tooth edge ASM to correspond to the fourth point of the dentinoenamel junction model in turn, resulting in a plurality of fitted dentinoenamel junction models.
- the best fit of the fitted dentinoenamel junction models is chosen by selecting the fit having the lowest associated Mahalanobis distance.
- Mahalanobis distance as a measure of quality of fit will be well known to those skilled in the art.
- the Mahalanobis distance between two profiles is the sum of the squared differences between the corresponding profile values weighted by the inverse of the covariance matrix
- Figure 15 shows the results of performing an ASM search as described above with a PDM shape constraint of approximately 30% starting from the position shown in Figure 14 . It can be seen that the ASM 18 has managed to accurately locate the dentinoenamel junction of the tooth 17. In experiments, it has not been necessary to perform multiple searches to locate the dentinoenamel junction, although it will be appreciated that a multi-resolution search can be performed if desired.
- An ASM search is conducted for each of the left and right edges, and the left and right dentinoenamel junctions for each tooth, thereby fitting models to each of the left and right edges and left and right dentinoenamel junctions of the tooth. The location of these anatomical features in the detection of dental caries is now described.
- Figure 16 is a further bitewing radiograph showing a carious lesion 26 in a tooth 25, the carious lesion 26 being indicated with a circle to aid visibility.
- the carious lesion appears as a relatively dark area in the bitewing radiograph.
- the pixels in the tooth image are examined for darkening.
- the grey-level intensity values of pixels are sampled along profiles parallel to the detected tooth edge.
- the first profile along which grey-level intensity values are sampled is defined by the detected tooth edge (identified by the fitting of the tooth edge models described above).
- Grey-level intensity values are sampled along a number of subsequent profiles (parallel to the detected tooth edge) continuing into the dentine (the start of the dentine identified by the fitting of the dentinoenamel junction models described above). Profiles extending a little way into the dentine are examined.
- Figure 17 illustrates the area 27 of the tooth 25 in which pixels are sampled along profiles parallel to the tooth edge in the general direction of the arrow 28.
- the profiles may be defined in any suitable way as will be apparent to those skilled in the art.
- projections may be defined perpendicular to each of a plurality of points at the tooth edge, and a plurality of points may be defined on each projection.
- Profiles parallel to the tooth edge may then be defined based upon corresponding points on each of the plurality of projections.
- Figure 18 is a schematic illustration of profiles 30 along which grey-level intensity values are sampled. It can be seen that a tooth edge 31 comprises a plurality of points 32 from which a projection 33 extends normal to the tooth edge at that point. Grey-level intensity values may be sampled at points 34 along the projections 33 so as to define the profiles 30. Also shown in Figure 18 is a dentinoenamel junction 35. It will be appreciated that samples are also taken along the tooth edge 31.
- samples can be processed at sub-pixel resolution to provide greater accuracy. That is, when sampling a particular pixel grey-level intensity values at a point 34, it may be desirable to process grey-level intensity values of certain pixels surrounding the particular pixel in order to obtain a more accurate sample. For example, where an example point 34a does not lie precisely at a pixel centre, a value to be associated with the point 34a may be obtained by interpolating among neighbouring pixel values. It will be appreciated that such an interpolation may be achieved in several ways using, for example bilinear, bicubic or other interpolation techniques. Processing samples at sub-pixel resolution is especially useful where the initial bitewing radiograph has a low resolution.
- the sampled grey-level values can be plotted on a graph as shown in Figure 19 where the x-axis measures the distance along each tooth profile in the direction of the arrow 28 of Figure 17 .
- the y-axis indicates the grey-level intensity value of a particular sample point.
- the top most plot is labelled to indicate that the samples of that plot are taken from the inner-most profile, while the samples of the bottom-most plot are taken from the tooth edge.
- determination of whether that lesion extends into the dentine can be achieved by determining the last profile to exhibit the identified intensity dip and further determine if that profile is beyond the location of the dentinoenamel junction identified by fitment of the dentinoenamel junction ASM at step S4 of Figure 1 .
- the computer comprises a CPU 40 which is configured to read and execute instructions stored in a volatile memory 21 which takes the form of a random access memory.
- the volatile memory 41 stores instructions for execution by the CPU 40 and data used by those instructions. For example, in use, instructions to perform the processing of Figure 1 may be stored in the volatile memory 41.
- the computer 40 further comprises non-volatile storage in the form of a hard disc drive 42.
- the computer 40 further comprises an I/O interface 43 to which are connected peripheral devices used in connection with the computer 40.
- a display 44 is configured so as to display output from the computer 40.
- the display 44 may, for example, display bitewing radiographs, and the results of processing an analysis performed on the bitewing radiographs as described above.
- Input devices are also connected to the I/O interface 43. Such input devices include a keyboard 45 and a mouse 46 which allow user interaction With the computer.
- a network interface 47 allows the computer to be connected to an appropriate computer network so as to receive and transmit data (such as bitewing radiographs and results from processing those bitewing radiographs) from and to other computing devices.
- the CPU 40, volatile memory 41, hard disc drive 42, I/O interface 43, and network interface 47 are connected together by a bus 48.
- outer tooth edges may be located by fitting a variety of statistical models of shape and/or appearance, generated from an annotated training set of images.
- the fitted outer tooth edge models may be used, as described above, to initialize the fit of dentinoenamel junction models.
- AAMs Active Appearance Models
- AAMs are well known in the art and are described in Cootes,T.F.; Edwards, G.J. and Taylor, C.J: “Active Appearance Models", IEEE Transactions On Pattern Analysis And Machine Intelligence, Vol. 23, No. 6, 2001 .
Landscapes
- Engineering & Computer Science (AREA)
- Health & Medical Sciences (AREA)
- Life Sciences & Earth Sciences (AREA)
- Medical Informatics (AREA)
- Nuclear Medicine, Radiotherapy & Molecular Imaging (AREA)
- General Health & Medical Sciences (AREA)
- Physics & Mathematics (AREA)
- Radiology & Medical Imaging (AREA)
- Molecular Biology (AREA)
- Computer Vision & Pattern Recognition (AREA)
- Pathology (AREA)
- High Energy & Nuclear Physics (AREA)
- Biomedical Technology (AREA)
- Heart & Thoracic Surgery (AREA)
- Biophysics (AREA)
- Surgery (AREA)
- Animal Behavior & Ethology (AREA)
- Optics & Photonics (AREA)
- Public Health (AREA)
- Veterinary Medicine (AREA)
- Quality & Reliability (AREA)
- General Physics & Mathematics (AREA)
- Theoretical Computer Science (AREA)
- Dentistry (AREA)
- Oral & Maxillofacial Surgery (AREA)
- Image Analysis (AREA)
- Image Processing (AREA)
- Apparatus For Radiation Diagnosis (AREA)
Description
- The present invention relates to a method for detecting indications of dental caries in an image of a tooth such as an intra-oral radiograph.
- Although largely preventable, dental caries is a widespread disease, affecting around 97% of the population. Caries occurs as a result of tooth demineralisation caused by acid released by bacteria on the teeth.
- While early, non-surgical therapeutic treatment of dental caries is possible, dentists are often unable to detect a carious lesion at a stage where such therapeutic treatment can be effectively used to reverse the disease process. Indeed, such non-surgical treatment is typically only effective while the carious lesion is confined to the enamel and before the carious lesion has penetrated into the dentine. If the caries is confined to the enamel, the non-surgical therapeutic treatment can be used to encourage remineralisation and therefore reversal of the carious lesion.
- Carious lesions that have penetrated into the dentine, on the other hand, are treatable only by removing the decayed tissue and filling the cavity with a dental restorative material.
- While dentists can typically visually identify large carious lesions of the type which can be treated by removal of decayed tissue and filling of the cavity with a restorative material, they have difficulty recognising the early signs of carious lesions and in recording the depth of such carious lesions. This is especially true where a carious lesion has not penetrated into the dentine, that is when a carious lesion is restricted to the enamel. It is difficult to visually examine interproximal tooth surfaces, such that dentists rely on radiographs to identify interproximal lesions. Recognising a carious lesion has not penetrated into the dentine in a radiograph is a challenging clinical task.
- The difficulties in identifying carious lesions restricted to the enamel mean that in almost all cases, dental caries is treated by surgical restorative dentistry.
- Given the difficulties in detecting carious lesions, and the further difficulties in detecting whether those carious lesions have penetrated into the dentine, automated analysis methods have been proposed which can be applied to process dental radiographs. Currently proposed methods have not, however, been able to accurately provide acceptable caries detection.
- It is an object of some embodiments of the present invention to obviate or mitigate the problems outlined above.
- According to an aspect of the present invention there is provided a method, a computer program, a computer readable medium and an apparatus as set out in the appended claim 5.
- The present invention provides a method in which areas of the tooth image which are analysed to identify dental caries are defined with reference to a model fitted to an outer tooth edge. By defining the areas for analysis with reference to a model of an outer tooth edge more accurate determination of caries can be achieved. In particular, fitting of a model to the outer edge of a tooth allows that outer edge to be accurately located in the image. The inventors have found that such accurate location of the outer tooth edge provides a valuable reference for the identification of areas which are to be analysed to detect indications of dental caries. In particular, image variations in an area of the image close to the edge of a tooth (as identified by the fitted model) may be analysed to provide early indications of dental caries.
- The area of the image in which image variations are analysed may be a plurality of areas of the image, each area being defined with reference to the fitted model. The or each area of the image in which image variations are analysed may be elongate. Further, the or each area of the image in which image variations are analysed may extend generally parallel to the fitted model and image variations in a direction generally parallel to the fitted model may be analysed. That is, the inventors have found that considering image variation along elongate profiles extending generally parallel to the fitted model allows indications of dental caries to be effectively identified.
- Analysing image variations may comprise analysing changes in pixel values (e.g. grey level values) to identify a local maximum or minimum in the pixel values, for example a maximum or minimum of a predetermined magnitude. That is, while pixel values along the elongate profiles may be expected to include no maxima or minima of any great magnitude in a healthy tooth, dental caries maybe indicated by such a maximum or minimum.
- Analysing image variations in an area of the image may comprise obtaining data comprising pixel values for pixels in each of a plurality of areas of the image, each area representing a part of the tooth and each area being defined with reference to the fitted model, combining the obtained data from the plurality of areas and analysing image variations in the combined data to detect indications of dental caries. For example, in order to reduce the effects of local variability, the obtained data may be clustered into groups of obtained data. Each cluster may be averaged and analysis performed on the average cluster values.
- The method may further comprise defining a plurality of projections extending generally perpendicular to the fitted model, and defining the or each area by reference to corresponding points on each of said projections. The or each area may extend generally parallel to the fitted model.
- The method may further comprise identifying a location in the image that is an approximation of the centre of the tooth in the image, and initializing a model fitting process based upon the identified location to identify the part of the image representing an outside edge of the tooth.
- Identifying a location in the image which is an approximation of the centre of the tooth in the image may comprise at least partially identifying the boundaries of the tooth in the image, and identifying a point within the identified boundaries for which the shortest distance to a boundary is a maximum for all points within the identified boundaries. The location may be based upon the identified point. The identification of such a point may be carried out by applying a distance transform operation to the image.
- At least partially identifying the boundaries of the tooth in the image may comprise detecting edges in the image, and identifying the boundaries based upon the detected edges.
- The method may further comprise fitting a model to the image to identify a part of the image representing at least part of the dentinoenamel junction.
- Image variations may be analysed in areas between the fitted model identifying a part of the image representing an outside edge of the tooth and the fitted model identifying the part of the image representing at least part of the dentinoenamel junction. Such variations may be considered to be indicative of dental caries in the enamel of the tooth, that is the area of the image between the model fitted to the part of the image representing an outside edge of the tooth, and the model fitted to the part of the image representing at least part of the dentine enamel junction.
- Image variations may additionally be analysed in a part of the image representing dentine of the tooth defined by the fitted model identifying the part of the image representing the at least part of the dentinoenamel junction, to determine whether dental caries extends into the dentine. Dental caries detected in the enamel of the tooth but not in the dentine of the tooth is typically suitable for non-surgical treatment.
- Fitting a model to the image to identify a part of the image representing an outside edge of the tooth may comprise fitting a first tooth edge model to a left side of the tooth, and fitting a second tooth edge model to a right side of the tooth.
- Fitting a model to the image to identify a part of the image representing at least part of the dentinoenamel junction may comprise fitting a first dentinoenamel junction model to a left dentinoenamel junction of the tooth, and fitting a second dentinoenamel junction model to a right dentinoenamel junction of the tooth. The fitting of the dentinoenamel junction model may be based upon the model fitted to a corresponding outside edge of a tooth.
- The image may depict a plurality of teeth. Data may be generated indicating the presence of dental caries in each of said teeth based upon analysed image variations.
- The or each model may be a shape model. For example, each model may be a point distribution model. Further, each model may be an Active Shape Model.
- All aspects of the present invention can be implemented by way of methods, systems and apparatus. Embodiments of the invention can also be implemented by way of suitable computer programs. Accordingly, the invention provides such computer programs and further provides computer readable media carrying such computer programs. Such computer readable media include tangible carrier media such as CD's, DVD's and floppy disks and intangible carrier media such as communication signals.
- Embodiments of the present invention will now be described, by way of example, with reference to the accompanying drawings, in which:
-
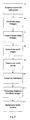
Figure 1 is a flowchart of processing carried out to fit shape models to an image of a patient's teeth to identify in the image the left and right outer edges of the teeth and the left and right dentinoenamel junctions within the teeth; -
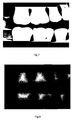
Figure 2 is a bitewing radiograph of a patient's teeth; -
Figure 3 is a flowchart of processing carried out to find approximate centres of the teeth shown in the bitewing radiograph ofFigure 2 ; -
Figure 4 is a binary image generated by applying an adaptive threshold to the bitewing radiograph ofFigure 2 ; -
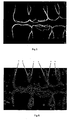
Figure 5 is an edge image showing edges in the bitewing radiograph ofFigure 2 ; -
Figure 6 is an image generated by combining the edge image ofFigure 5 and an edge image created from the image ofFigure 4 ; -
Figure 7 is a binary image generated based upon the images ofFigures 4 and6 , showing tooth pixels in white and non-tooth pixels in black; -
Figure 8 is an image created by performing a Euclidian distance transform operation on the image ofFigure 7 ; -
Figure 9 is an image created by applying a threshold to the image ofFigure 8 ; -
Figure 10 is the bitewing radiograph ofFigure 2 in which approximate tooth centres are labelled; -
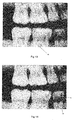
Figure 11 shows an initial placement of an outer tooth edge active shape model at the centre of a tooth; -
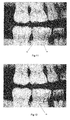
Figure 12 shows the results of a first active shape model search to locate an outer tooth edge; -
Figure 13 shows the results of a second active shape model search to more accurately locate the outer tooth edge allowing more variability but with shorter r search length; -
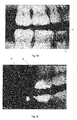
Figure 14 shows an initial placement of a dentinoenamel junction active shape model based upon the located outer tooth edge; -
Figure 15 shows the results of an active shape model search to locate the dentinoenamel junction of a tooth; -
Figure 16 is a bitewing radiograph in which a carious lesion is indicated; -
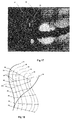
Figure 17 shows a profile area of the image ofFigure 16 which is analysed to detect carious lesions; -
Figure 18 is a schematic illustration of a profile area of a tooth showing profiles parallel to a modelled tooth edge which are analysed to detect carious lesions; -
Figure 19 is a plot of grey-level intensity values in the profile area ofFigure 16 ; -
Figure 20 shows the plot ofFigure 19 after processing; and -
Figure 21 schematically illustrates a computer arranged to carry out the processing illustrated inFigure 1 . - An overview of a process for locating the left and right outer edges of a patient's teeth, and the left and right dentinoenamel junctions of the teeth in a radiograph is now described with reference to the flowchart of
Figure 1 . At step S1, a radiograph of the patient's teeth is received. Preferably, the radiograph is a bitewing radiograph of the kind commonly used by dentists to detect dental caries.Figure 2 shows an example of a suitable bitewing radiograph. - Referring to
Figure 2 the relevant tooth structure is now briefly described.Figure 2 shows seven teeth. Atooth 1 is labelled to aid description. Each tooth comprises anenamel portion 2 and adentine portion 3. Thedentinoenamel junction 4 is the boundary at which theenamel portion 2 meets thedentine portion 3. - Referring again to
Figure 1 , at step S2, an approximate centre of each tooth is determined. At step S3, the approximate centre of each tooth is used as a starting position to fit right and left tooth edge models to the left and right edges of each tooth. At step S4, each outside edge of each tooth (identified by the fitted right and left tooth edge models) is used as a starting position to fit right and left dentinoenamel junction models to the right and left dentinoenamel junctions of each tooth. It will be appreciated that after the processing of step S4 is complete, four models will have been fitted to each tooth, identifying the positions of the outside edges and dentinoenamel junctions of each tooth. As is described below, the identification of the right and left edges and right and left dentinoenamel junctions of each tooth can be useful in the identification of dental caries. - The processing carried out in each of the steps S2 to S4 of
Figure 1 is now described in more detail with reference toFigures 3 to 9 . Firstly, the processing performed to locate a centre of each tooth is described with reference toFigure 3 . - Referring to
Figure 3 , at step S5 an adaptive threshold is applied to the bitewing radiograph received at step S1 ofFigure 1 . The adaptive threshold is applied by processing the image in windows of size 128 x 128 pixels. For each window the mean of all pixel values in that window is generated. The adaptive threshold for all pixels in the window is then set at 70% of the generated mean value. If a respective pixel has a value which exceeds the adaptive threshold for the window in which it is located, the pixel is set to have a value of '1' (i.e. to be white) while if the pixel has a value which does not exceed its adaptive threshold it is set to have a value of '0' (i.e. to be black). - It will be appreciated that window size and thresholding values may be chosen or calculated using any appropriate method as will be apparent to those skilled in the art. However, by ensuring that each window, includes pixels representing tooth structures and pixels representing non-tooth structures, a threshold is generated which can effectively distinguish pixels representing tooth structures from pixels which represent non-tooth structures.
Figure 4 shows the results of applying adaptive thresholding of the type described above to the bitewing radiograph ofFigure 2 . - After adaptive thresholding of the bitewing radiograph at step S5, edge detection is applied to the bitewing radiograph (
Figure 2 ) and the thresholded image (Figure 4 ) to generate respective edge images at step S6.Figure 5 is an edge image showing edges detected by applying a gradient based edge detection operation to the bitewing radiograph ofFigure 2 . It will be appreciated that any suitable edge detection algorithm may be used. The resulting edge image may be subjected to a smoothing operation so as to improve the continuity of detected edges. - At step S7 the two edge images generated at step S6 (one generated from the bitewing radiograph of
Figure 2 and one generated from the image ofFigure 4 ) are combined. The combination is such that a pixel in the combined image has a value given by adding the pixel values of the corresponding pixels of each of the edge images. The combined image is shown inFigure 6. Figure 6 shows a smoothed version of the image ofFigure 5 combined with an edge image generated from the adaptive threshold image ofFigure 4 . Referring toFigure 6 it can be seen that where the pixels of the edge images overlap, the pixels of the combined image are brighter than the pixels appearing in only one of the edge images. - At step S8 the combined image is processed to determine pairs of edges which can be classified as boundaries of a single tooth. For example, by horizontally scanning the image of
Figure 6 for pixels which exceed a particular threshold (the threshold chosen such that only overlapping pixels from the two edge images exceed the threshold) edges 5 to 10 on the maxillary teeth will be found. Such horizontal scanning is carried out for each row of pixels in the image in turn. Each consecutively encountered pair of edges (e.g. 5 and 6, 7 and 8, 9 and 10) defines the edges of a tooth. The upper extremes of the maxillary teeth and the lower extremes of the mandibular teeth can then be determined based upon the termination of the edges defining each tooth. - The image of
Figure 6 can also be vertically scanned to identify pixels which exceed the threshold described above. Such vertical scanning is carried out for each column of pixels in turn, and allows identification of the lower edges of the maxillary teeth and upper edges of the mandibular teeth. - The horizontal and vertical scanning operations described above allow the identification of boundaries of the teeth, and can be used, in combination with the image of
Figure 4 to generate the image ofFigure 7 at step S9. More specifically, having identified the boundaries of the teeth, in the image ofFigure 7 pixels between the identified boundaries have values equal to those of corresponding pixels in the image ofFigure 4 . - Processing then passes to step S10 at which a distance transform, for example a Euclidean distance transform, is used to label each pixel in the image generated at step S9 with a distance from its nearest edge. The resulting distance labels are used to generate a distance transform image such as that shown in
Figure 8 . It can be seen that the pixels of the image ofFigure 8 increase in brightness as the distance from their nearest edge increases. In this way, those pixels for which the shortest distance to an edge is a maximum for all of the pixels within the determined tooth boundaries (i.e. those pixels near to the centre of the tooth) are the brightest pixels. - The distance transform image generated at step S10 is subjected to a thresholding operation at step S11.
Figure 9 shows the distance transform image ofFigure 8 after a thresholding operation. The thresholding is arranged such that pixels which exceed the threshold maintain their value before thresholding, while pixels which do not exceed the threshold have a value of '0' (i.e. appear black). As such the thresholding separates the distance transform image into a plurality of areas of non-zero pixels, each area being surrounded by zero-pixels. - At step S12, the thresholded distance transform image of
Figure 9 is used to determine the approximate centre of each tooth. As described above, for any tooth, the pixel having the highest distance value defines a point near to the centre of that tooth. That is, if a pixel within a tooth with coordinate (i,j) has the highest distance value, the corresponding pixel (i,j) of the bitewing radiograph should define a point near to the centre of that tooth. Each discrete area of the thresholded distance transform image ofFigure 9 having non-zero pixel values is processed in turn to determine the brightest pixel in that area and thereby determine an estimate of the centre of a respective tooth. - It will be appreciated that because some of the teeth in the image of
Figure 7 are not completely discrete structures, the distance transform does not determine an absolute centre, but only determines an approximate centre of each tooth.Figure 10 shows the bitewing radiograph ofFigure 2 with the approximate centre points of each tooth marked. - Referring back to
Figure 1 , the processing described above is carried out at steps S1 and S2 to locate the centre of each tooth. The processing of steps S3 and S4 are now described in more detail. - In general terms, and as described above the processing of steps S3 and S4 fits four point distribution models to each tooth. That is, for each tooth, the processing fits a point distribution model to the left and right outer edges of the tooth and a point distribution model to the left and right dentinoenamel junctions of the tooth. The nature of the models which are fitted to the teeth and the creation of the models are now described before the process of fitting the models to the teeth is described. The models used to locate both the tooth boundaries and the dentinoenamel junctions are of similar form, and the models are therefore described generically.
- The models used to identify the right and left tooth boundaries and the right and left dentinoenamel junctions are point distribution models. The models are created by manual annotation of training images aligned to a common co-ordinate system. That is, points to be included within the model are marked by a human expert in a plurality of training images. These manually placed points are used as a basis for interpolation so as to provide a point distribution model. It has been found that placing 20 points along a tooth edge, and 11 points along a dentinoenamel junction allows effective models to be created.
- In some embodiments, two human experts each annotate each of the training images, and the annotations of each expert are combined by taking a mean of the marked points, although in some cases annotation by a single expert may be sufficient for model generation.
- Each shape annotated in the manner described above is represented by a respective shape vector, comprising a concatenation of the coordinates of the marked points. The shape vector x for a particular marked shape takes the form:

- where n=20 for a tooth edge model; and
- n=11 for a dentinoenamel junction model
- A mean shape vector
x can be calculated according to equation (2):
Where N is the number of shapes. - A plurality of shape vectors, one for each training image can be used to generate a matrix X, in which each row represents a shape vector. Each of these shapes is translated, rotated and scaled so that their centroids coincide and the sum of squared differences between the points on each shape and those on the mean shape is minimised.
- A covariance matrix S can be created from the aligned shapes by first calculating the mean shape vector using equation (2). For each shape in the training set the deviation d x i from the mean shape can be calculated from equation 3:

- The covariance matrix S is then calculated using equation (4):

- The eigenvectors of the matrix S can be determined and a matrix P of the t most significant eigenvectors can be created.
- In this way, any shape can be represented according to equation (5):

- where x is a vector representing the shape ;
-
x is a mean shape vector generated from shape vectors of images in the training set (according to equation 2); - P is the matrix of eigenvectors described above; and
- b is a t-element vector of weights to be applied to eigenvectors of the matrix P to generate the vector x for the shape.
- The components of b (bi , i = 1...t) are referred to as shape parameters. The eigenvectors P i are sorted according to their eigenvalues λ i , which describe the observed variance over the training shapes associated with each eigenvector. That is to say the λ i represent the proportions of variance from the mean shape that are described by each of the eigenvectors. By selecting a value of t (≤ N), the model can be made to represent some chosen proportion of the total variance observed in the training shapes.
- Each eigenvector included in the matrix P represents a mode of variation of the modelled shape. Varying values of elements of the vector b allows generation of shapes within the range observed within images of the training images. That is, variation of one element b1 of the vector b will affect one characteristic of the modelled shape, while variation of a second element b2 will affect a different characteristic of the modelled shape.
- It will further be appreciated that point distribution models may be created for each of the left and right edges and left and right dentinoenamel junctions of different types of tooth. For example, separate point distribution models may be created for molars and pre-molars. Alternatively, the same point distribution models may be used for both molars and pre-molars. Similarly, different point distribution models may be created for the relevant parts of both the upper and lower teeth.
- Having described creation of a point distribution model, the fitting of that point distribution model to images at steps S3 and S4 of
Figure 1 is now described in further detail. - As indicated, an outside tooth edge model is fitted to a tooth (step S3) before a model of the dentinoenamel junction is fitted to that tooth (step S4). In fitting point distribution models to the tooth, the point distribution models are used as Active Shape Models (ASMs). In general terms, an Active Shape Model is a statistical model of shape, such as a Point Distribution Model (above) which can be iteratively adjusted to fit image data while retaining the shape constraints expressed by the model. ASMs are described in further detail in Cootes, T.F.; Taylor C.J.; Cooper, D.H.; and Graham, J: "Active Shape Models - Their Training and Application" Computer Vision and Image Understanding, vol 61(1) pp 38-59; 1995. ASMs are further described in "Model-Based Methods in Analysis of Biomedical Images" in Ed. R. Baldock and J. Graham, "Image Processing and Analysis", , or in P. Danny Allen et al.: "Detecting Reduced Bone Mineral Density From Dental Radiographs Using Statistical Shape Models", IEEE Transactions on Information Technology in Biomedicine, vol. 11, no. 6, pp 601-610, 1. November 2007.
- At step S3, a previously generated point distribution model of the outside edge of a tooth is fitted to the bitewing radiograph. The centre of the tooth, determined as described above with reference to the processing of
Figure 3 , is used to initialise the fit of the previously generated point distribution model. - In general terms, the point distribution models acting as ASMs are fitted using a process of iterative local refinement. At step S3 of
Figure 1 , to fit the outside tooth edge model to a tooth, an initial shape is defined by the average shape of the relevant shape model. Theinitial shape 15 is placed at thecentre point 16 of a tooth as shown inFigure 11 . The ASM then attempts to correctly locate the tooth edge. - As described above, an instance of the Point Distribution Model (PDM) is essentially a set of points defining the boundary of a shape. At each point on the start shape (which is the mean shape in some embodiments although pose information may be included to account for tooth orientation), a search is made along a line perpendicular to the shape border at that point for the best candidate location to move that point to in the next iteration of the search. In this particular implementation the best location is defined as the position of maximum gradient where the polarity of the gradient is such that the image intensity changes from light within the tooth to dark outside the tooth. The distance along the perpendicular included in this search is known as the 'Profile Length', and its relevance is discussed in further detail below.
- Allowing each modelled point to vary independently will result in the generation of shapes which are not legally defined by the point distribution model, and it is therefore necessary to limit movement of the points relative to one another. From equation (5) the change in the parameter vector d b arising from a change in shape d x is given by equation (6):

- Equation (6) provides a constraint on the allowed variation in shape by restricting the modes of variation to those described by the point distribution model.
- Further limitation is also required to restrict how much the overall shape model can vary from the mean shape. That is, even with the limitation of equation (6) it is still possible to produce shapes which do not sufficiently resemble a likely outside tooth edge shape. This is achieved by taking appropriate data from the training images. More specifically, considering each shape parameter bi and its associated eigenvalue λ i , it would be expected that the sum of equation (7) should follow a χ2 distribution.

- Thus, by setting a limit on the sum of equation (7), using the area under the χ2 distribution the desired proportion of variance observed in the training set can be retained for images to which the model is fitted.
- As indicated, the values of the vector b are modified iteratively until a distribution of points considered to be sufficiently accurate is determined. Iterative modification typically ends when changes in positions between subsequent iterations are sufficiently small.
- In any ASM search a number of parameters need to be set such as sample profile length, degree of PDM shape constraint (defined by the sum of equation (7)) number of resolution levels, and so on. In the experiments carried out, these parameters were determined empirically.
- In order to balance robustness and accuracy, a plurality of ASM searches can be performed with each search using different parameters. In experiments it has been found that conducting two ASM searches provides good results for locating the outer tooth edge. More specifically, a first search can be used to generate an approximate fit and a second search can then be used to more accurately fit the ASM to the outer tooth edge. The first search uses a relatively long profile length to allow the ASM to move from an initial position at the centre of the tooth to the outer edge of the tooth while being relatively constrained to the mean shape (as indicated by equation 7). Once an approximate fit has been located, the search length can be shortened, and the PDM shape constraint can be relaxed to allow for greater variability from the mean.
-
Figure 12 shows the results of performing a first ASM search from the starting position shown inFigure 11 using a relatively long profile length of 25 pixels and PDM shape constraint of approximately 30% from the mean. It can be seen that while the ASM search has successfully located the outer edge of the tooth, themodel 15 is not accurately fitted to the outer edge. -
Figure 13 shows the results of performing a second search from the position shown inFigure 12 using a relatively short profile length of 10 pixels and a PDM shape constraint (defined by equation (7)) of approximately 99% from the mean (i.e. allowing greater variance). It can be seen that after the second iteration, themodel 15 is more accurately fitted to the outer edge of the tooth. - Using the parameters of profile length and PDM shape constraint described above, the first search allows the model points to move sufficiently far from the centre to reach the outer tooth edge, while at the same time ensuring that the shape of the model does not vary so far from the mean that it cannot be fitted to the outer tooth edge. Once the outer tooth edge is found approximately, the profile length can be shortened as the model points have less distance to travel, and the PDM shape constraint can be set such as to allow the model points to more closely fit the outer tooth edge even if the shape of the tooth edge varies significantly from the mean shape.
- Referring back to
Figure 1 , once the outer edge of the tooth has been accurately located at step S3, an ASM search is used to locate the dentinoenamel junction at step S4. - In some images the difference in intensity between the dentine and the enamel may not be great enough to allow a search to be based upon the strongest edge. Instead, the training set is used to build a statistical model of the grey-level structure around the dentinoenamel junction by sampling along a profile normal to each dentinoenamel junction model point in each image in the training set. In order to reduce the effects of global intensity change along the profile, the derivative along the profile can be sampled rather than the absolute grey-level values.
- At each iteration in the ASM search a profile is taken at a normal to the points of the fitted model, and these samples are used as a basis for comparison with the statistical shape model to determine a quality of fit. In experiments, the dentinoenamel junction ASM was initialized such that a fourth point from an end of the dentinoenamel junction model was located at a selected point of the fitted outer tooth edge ASM. During search, this fourth point was kept fixed leaving the other points to move along their normals to find the dentinoenamel junction. This procedure was repeated by selecting each point of the fitted outer tooth edge ASM to correspond to the fourth point of the dentinoenamel junction model in turn, resulting in a plurality of fitted dentinoenamel junction models. The best fit of the fitted dentinoenamel junction models is chosen by selecting the fit having the lowest associated Mahalanobis distance.. The use of Mahalanobis distance as a measure of quality of fit will be well known to those skilled in the art. In general terms, the Mahalanobis distance between two profiles is the sum of the squared differences between the corresponding profile values weighted by the inverse of the covariance matrix
-
Figure 15 shows the results of performing an ASM search as described above with a PDM shape constraint of approximately 30% starting from the position shown inFigure 14 . It can be seen that theASM 18 has managed to accurately locate the dentinoenamel junction of thetooth 17. In experiments, it has not been necessary to perform multiple searches to locate the dentinoenamel junction, although it will be appreciated that a multi-resolution search can be performed if desired. - An ASM search is conducted for each of the left and right edges, and the left and right dentinoenamel junctions for each tooth, thereby fitting models to each of the left and right edges and left and right dentinoenamel junctions of the tooth. The location of these anatomical features in the detection of dental caries is now described.
-
Figure 16 is a further bitewing radiograph showing acarious lesion 26 in atooth 25, thecarious lesion 26 being indicated with a circle to aid visibility. The carious lesion appears as a relatively dark area in the bitewing radiograph. - In order to detect such carious lesions, the pixels in the tooth image are examined for darkening. The grey-level intensity values of pixels are sampled along profiles parallel to the detected tooth edge. The first profile along which grey-level intensity values are sampled is defined by the detected tooth edge (identified by the fitting of the tooth edge models described above). Grey-level intensity values are sampled along a number of subsequent profiles (parallel to the detected tooth edge) continuing into the dentine (the start of the dentine identified by the fitting of the dentinoenamel junction models described above). Profiles extending a little way into the dentine are examined. It will be appreciated that as a carious lesion extends further into the dentine, the darkening of the radiograph image is likely to become more pronounced, making visual identification of a carious lesion by a trained clinician more feasible. The following methods are therefore of most use where it is unclear whether a carious lesion extends into the dentine. It is therefore often unnecessary to sample profiles extending significant distances into the dentine, although it will be appreciated that the number of profiles within the dentine along which pixel values are sampled may vary.
-
Figure 17 illustrates thearea 27 of thetooth 25 in which pixels are sampled along profiles parallel to the tooth edge in the general direction of thearrow 28. The profiles may be defined in any suitable way as will be apparent to those skilled in the art. For example, projections may be defined perpendicular to each of a plurality of points at the tooth edge, and a plurality of points may be defined on each projection. Profiles parallel to the tooth edge may then be defined based upon corresponding points on each of the plurality of projections. -
Figure 18 is a schematic illustration ofprofiles 30 along which grey-level intensity values are sampled. It can be seen that atooth edge 31 comprises a plurality ofpoints 32 from which aprojection 33 extends normal to the tooth edge at that point. Grey-level intensity values may be sampled atpoints 34 along theprojections 33 so as to define theprofiles 30. Also shown inFigure 18 is adentinoenamel junction 35. It will be appreciated that samples are also taken along thetooth edge 31. - Having identified the desired profiles, samples can be processed at sub-pixel resolution to provide greater accuracy. That is, when sampling a particular pixel grey-level intensity values at a
point 34, it may be desirable to process grey-level intensity values of certain pixels surrounding the particular pixel in order to obtain a more accurate sample. For example, where anexample point 34a does not lie precisely at a pixel centre, a value to be associated with thepoint 34a may be obtained by interpolating among neighbouring pixel values. It will be appreciated that such an interpolation may be achieved in several ways using, for example bilinear, bicubic or other interpolation techniques. Processing samples at sub-pixel resolution is especially useful where the initial bitewing radiograph has a low resolution. - The sampled grey-level values can be plotted on a graph as shown in
Figure 19 where the x-axis measures the distance along each tooth profile in the direction of thearrow 28 ofFigure 17 . The y-axis indicates the grey-level intensity value of a particular sample point. The top most plot is labelled to indicate that the samples of that plot are taken from the inner-most profile, while the samples of the bottom-most plot are taken from the tooth edge. - As can be seen in the graph of
Figure 19 , it is possible that individual plots will exhibit spikes or dips as a result of noise or artefacts in the radiograph image. To compensate for such random variability, the profiles are averaged over five neighbouring profiles. Averaging the profiles plotted inFigure 19 over five neighbouring profiles results in the plot shown inFigure 20 where the axis are the same as those inFigure 19 . - Provided with the averaged profile plot of
Figure 20 it is possible to determine possible carious regions by examining the plots for corresponding dips in grey-level intensity repeated in a predetermined number of plots. Thecarious lesion 26 has been identified in the plot ofFigure 20 and is indicated with anellipse 36. - Having located a particular carious lesion, determination of whether that lesion extends into the dentine can be achieved by determining the last profile to exhibit the identified intensity dip and further determine if that profile is beyond the location of the dentinoenamel junction identified by fitment of the dentinoenamel junction ASM at step S4 of
Figure 1 . - The processing of
Figure 1 described above may be carried out using a computer having components as shown inFigure 21 . - It can be seen that the computer comprises a
CPU 40 which is configured to read and execute instructions stored in a volatile memory 21 which takes the form of a random access memory. Thevolatile memory 41 stores instructions for execution by theCPU 40 and data used by those instructions. For example, in use, instructions to perform the processing ofFigure 1 may be stored in thevolatile memory 41. - The
computer 40 further comprises non-volatile storage in the form of ahard disc drive 42. Thecomputer 40 further comprises an I/O interface 43 to which are connected peripheral devices used in connection with thecomputer 40. More particularly, adisplay 44 is configured so as to display output from thecomputer 40. Thedisplay 44 may, for example, display bitewing radiographs, and the results of processing an analysis performed on the bitewing radiographs as described above. Input devices are also connected to the I/O interface 43. Such input devices include akeyboard 45 and amouse 46 which allow user interaction With the computer. Anetwork interface 47 allows the computer to be connected to an appropriate computer network so as to receive and transmit data (such as bitewing radiographs and results from processing those bitewing radiographs) from and to other computing devices. TheCPU 40,volatile memory 41,hard disc drive 42, I/O interface 43, andnetwork interface 47, are connected together by abus 48. - It has been described above that point distribution models are used to locate the outer tooth edge and dentinoenamel junction, and an example has been described which uses Active Shape Models. It will be readily appreciated by those skilled in the art that other suitable modelling techniques may be used, alone or in combination, for the location of one, or both of, the outer tooth edges and dentinoenamel junctions. For example, outer tooth edges may be located by fitting a variety of statistical models of shape and/or appearance, generated from an annotated training set of images. The fitted outer tooth edge models may be used, as described above, to initialize the fit of dentinoenamel junction models.
- Suitable approaches to modelling include Active Appearance Models (AAMs) and variants thereof. AAMs are well known in the art and are described in Cootes,T.F.; Edwards, G.J. and Taylor, C.J: "Active Appearance Models", IEEE Transactions On Pattern Analysis And Machine Intelligence, Vol. 23, No. 6, 2001. Examples of applicable variants of AAMs are further described in "Roberts, M.G, Cootes, T.F and Adams, J.E: "Robust Active Appearance Models with Iteratively Rescaled Kernels", British Machine Vision Conference, 2007; Scott, I.M, Cootes, T.F and Taylor, C.J: "Improving Appearance Model matching Using Local Image Structure", Information Processing in Medical Imaging, 18th International Conference, pg 258-269, 2003; and Saragih, J. and Goecke, R: "A Nonlinear Discriminative Approach to AAM Fitting". Any or all of these modeling techniques may be used in the techniques described above, as may other suitable techniques.
- Embodiments of the present invention have been described above, it will be appreciated that the embodiments described are in no way limiting. Indeed, many variations to the described embodiments will be apparent to an ordinary skilled person, and such variations are within the scope of the present invention as set out in the appended claims.
Claims (15)
- A method for analysing an image of a tooth, the method comprising:fitting a model to the image to identify a part of the image representing an outside edge of the tooth;the method being characterised by:analysing image variations in an area of the image to detect indications of dental caries, the area of the image representing a part of the tooth and being defined with reference to the fitted model; andgenerating data indicating the presence of dental caries based upon said analysed image variations.
- A method according to claim 1, wherein the area of the image in which image variations are analysed is a plurality of areas of the image, each area being defined with reference to the fitted model.
- A method according to claim 1 or 2, wherein the or each area of the image in which image variations are analysed is an elongate area.
- A method according to claim 1, 2 or 3, wherein the or each area of the image in which image variations are analysed extends generally parallel to the fitted model and image variations in a direction generally parallel to the fitted model are analysed.
- A method according to any preceding claim, wherein analysing image variations comprises analysing changes in pixel values to identify a local maximum or minimum in the pixel values.
- A method according to any preceding claim, further comprising:defining a plurality of projections extending generally perpendicular to the fitted model; anddefining the or each area by reference to corresponding points on each of said projections.
- A method according to any preceding claim, further comprising:identifying a location in the image which is an approximation of the centre of the tooth in the image; andfitting the model based upon the identified location.
- A method according to claim 7, wherein identifying a location in the image which is an approximation of the centre of the tooth in the image comprises:at least partially identifying the boundaries of the tooth in the image; andidentifying a point within the identified boundaries for which the shortest distance to a boundary is a maximum for all points within the identified boundaries;wherein the location is based upon the identified point.
- A method according to claim 8, wherein at least partially identifying the boundaries of the tooth in the image comprises:detecting edges in the image; andidentifying the boundaries based upon the detected edges.
- A method according to any preceding claim, further comprising:fitting a model to the image to identify a part of the image representing at least part of the dentinoenamel junction.
- A method according to claim 10, wherein image variations are analysed In areas between the fitted model identifying a part of the image representing an outside edge of the tooth and the fitted model identifying the part of the image representing at least part of the dentinoenamel junction.
- A method according to claim 11, wherein image variations are additionally analysed in a part of the image representing dentine of the tooth defined by the fitted model identifying the part of the image representing the at least part of the dentinoenamel junction, to determine whether dental caries extends into the dentine.
- A computer program comprising computer readable instructions configured to cause a computer to carry out a method according to any one of claims 1 to 12.
- A computer readable medium carrying a computer program according to claim 13.
- Apparatus for analysing an image of a tooth, the apparatus comprising:means for fitting a model to the image to identify a part of the image representing an outside edge of the tooth;the apparatus being characterised by:means for analysing image variations in an area of the image to detect indications of dental caries, the area of image representing a part the tooth, and the area being defined with reference to the fitted model; andmeans for generating data indicating the presence of dental caries based upon said analysed image variations.
Applications Claiming Priority (2)
| Application Number | Priority Date | Filing Date | Title |
|---|---|---|---|
| GBGB0910316.9A GB0910316D0 (en) | 2009-06-16 | 2009-06-16 | Image analysis method |
| PCT/GB2010/001146 WO2010146333A1 (en) | 2009-06-16 | 2010-06-11 | Image analysis method |
Publications (2)
| Publication Number | Publication Date |
|---|---|
| EP2443611A1 EP2443611A1 (en) | 2012-04-25 |
| EP2443611B1 true EP2443611B1 (en) | 2015-06-03 |
Family
ID=40940861
Family Applications (1)
| Application Number | Title | Priority Date | Filing Date |
|---|---|---|---|
| EP10726166.1A Active EP2443611B1 (en) | 2009-06-16 | 2010-06-11 | Image analysis method |
Country Status (8)
| Country | Link |
|---|---|
| US (1) | US8737706B2 (en) |
| EP (1) | EP2443611B1 (en) |
| CA (1) | CA2797326C (en) |
| DK (1) | DK2443611T3 (en) |
| ES (1) | ES2540546T3 (en) |
| GB (1) | GB0910316D0 (en) |
| PT (1) | PT2443611E (en) |
| WO (1) | WO2010146333A1 (en) |
Families Citing this family (7)
| Publication number | Priority date | Publication date | Assignee | Title |
|---|---|---|---|---|
| JP6298594B2 (en) * | 2013-01-17 | 2018-03-20 | 株式会社Pfu | Information processing apparatus, method, and program |
| US10248883B2 (en) * | 2015-08-20 | 2019-04-02 | Align Technology, Inc. | Photograph-based assessment of dental treatments and procedures |
| US10631799B2 (en) * | 2016-12-07 | 2020-04-28 | Harris Corporation | Dental image collection device providing optical alignment features and related system and methods |
| WO2019222135A1 (en) | 2018-05-16 | 2019-11-21 | Benevis Informatics, Llc | Systems and methods for review of computer-aided detection of pathology in images |
| US11389131B2 (en) | 2018-06-27 | 2022-07-19 | Denti.Ai Technology Inc. | Systems and methods for processing of dental images |
| MX2021000465A (en) | 2018-07-13 | 2021-06-23 | Plaqless Ltd | An apparatus for detecting oral diseases and hazards. |
| WO2026092215A1 (en) * | 2024-10-31 | 2026-05-07 | 上海时代天使医疗器械有限公司 | Tooth segmentation method and apparatus, method and apparatus for determining degree of alveolar bone resorption, and device and medium |
Family Cites Families (8)
| Publication number | Priority date | Publication date | Assignee | Title |
|---|---|---|---|---|
| US5742700A (en) * | 1995-08-10 | 1998-04-21 | Logicon, Inc. | Quantitative dental caries detection system and method |
| DE10108295B4 (en) | 2001-02-21 | 2004-01-29 | Sirona Dental Systems Gmbh | Tooth identification on digital x-rays and assignment of information to digital x-rays |
| US20040109608A1 (en) | 2002-07-12 | 2004-06-10 | Love Patrick B. | Systems and methods for analyzing two-dimensional images |
| WO2004086972A2 (en) * | 2003-03-25 | 2004-10-14 | Imaging Therapeutics, Inc. | Methods for the compensation of imaging technique in the processing of radiographic images |
| CN1723855A (en) | 2005-06-27 | 2006-01-25 | 首都医科大学附属北京口腔医院 | The tooth proximal surface dental caries are decreased the processing method of X line image with computer |
| US20080062429A1 (en) | 2006-09-12 | 2008-03-13 | Rongguang Liang | Low coherence dental oct imaging |
| US7702139B2 (en) * | 2006-10-13 | 2010-04-20 | Carestream Health, Inc. | Apparatus for caries detection |
| JP4918383B2 (en) | 2007-03-16 | 2012-04-18 | オリンパス株式会社 | Outline detecting apparatus, outline detecting method and program thereof |
-
2009
- 2009-06-16 GB GBGB0910316.9A patent/GB0910316D0/en not_active Ceased
-
2010
- 2010-06-11 PT PT107261661T patent/PT2443611E/en unknown
- 2010-06-11 ES ES10726166.1T patent/ES2540546T3/en active Active
- 2010-06-11 EP EP10726166.1A patent/EP2443611B1/en active Active
- 2010-06-11 US US13/378,502 patent/US8737706B2/en active Active
- 2010-06-11 CA CA2797326A patent/CA2797326C/en active Active
- 2010-06-11 WO PCT/GB2010/001146 patent/WO2010146333A1/en not_active Ceased
- 2010-06-11 DK DK10726166.1T patent/DK2443611T3/en active
Also Published As
| Publication number | Publication date |
|---|---|
| GB0910316D0 (en) | 2009-07-29 |
| US8737706B2 (en) | 2014-05-27 |
| CA2797326C (en) | 2017-10-10 |
| DK2443611T3 (en) | 2015-07-13 |
| PT2443611E (en) | 2015-08-21 |
| EP2443611A1 (en) | 2012-04-25 |
| WO2010146333A1 (en) | 2010-12-23 |
| ES2540546T3 (en) | 2015-07-10 |
| US20120171634A1 (en) | 2012-07-05 |
| CA2797326A1 (en) | 2010-12-23 |
Similar Documents
| Publication | Publication Date | Title |
|---|---|---|
| Zhao et al. | TSASNet: Tooth segmentation on dental panoramic X-ray images by Two-Stage Attention Segmentation Network | |
| Hosntalab et al. | Segmentation of teeth in CT volumetric dataset by panoramic projection and variational level set | |
| JP6678172B2 (en) | Detection of tooth wear using three-dimensional intraoral scan | |
| Lin et al. | Teeth segmentation of dental periapical radiographs based on local singularity analysis | |
| US8737706B2 (en) | Image analysis method | |
| EP2688479B1 (en) | A method for tooth surface classification | |
| US9710907B2 (en) | Diagnosis support system using panoramic radiograph and diagnosis support program using panoramic radiograph | |
| Li et al. | Semi-automatic computer aided lesion detection in dental X-rays using variational level set | |
| BR112020021508A2 (en) | AUTOMATED CORRECTION OF VOXEL REPRESENTATIONS AFFECTED BY METAL OF X-RAY DATA USING DEEP LEARNING TECHNIQUES | |
| CN110415234A (en) | Brain tumor dividing method based on multi-parameter magnetic resonance imaging | |
| CN115205469A (en) | Tooth and alveolar bone reconstruction method, equipment and medium based on CBCT | |
| Chen et al. | Detection of various dental conditions on dental panoramic radiography using faster R-CNN | |
| JPH11510419A (en) | Quantitative dental caries inspection system and method | |
| ALbahbah et al. | Detection of caries in panoramic dental X-ray images using back-propagation neural network | |
| Razali et al. | Sobel and canny edges segmentations for the dental age assessment | |
| Duy et al. | Automatic detection and classification of teeth in CT data | |
| Wang et al. | A segmentation and classification scheme for single tooth in MicroCT images based on 3D level set and k-means++ | |
| Kondo et al. | Computer-based extraction of the inferior alveolar nerve canal in 3-D space | |
| CN118967950A (en) | Three-dimensional image-guided correction planning method, system, device and medium | |
| Keyhaninejad et al. | Automated segmentation of teeth in multi-slice CT images | |
| Jain et al. | Dental image analysis for disease diagnosis | |
| van der Stelt et al. | Computer-aided interpretation and quantification of angular periodontal bone defects on dental radiographs | |
| Cunha et al. | A method for segmentation of dental implants and crestal bone | |
| Gleason et al. | A new deformable model for analysis of X-ray CT images in preclinical studies of mice for polycystic kidney disease | |
| CN119169307A (en) | A CBCT image recognition method and system based on tooth calcification |
Legal Events
| Date | Code | Title | Description |
|---|---|---|---|
| PUAI | Public reference made under article 153(3) epc to a published international application that has entered the european phase |
Free format text: ORIGINAL CODE: 0009012 |
|
| 17P | Request for examination filed |
Effective date: 20111214 |
|
| AK | Designated contracting states |
Kind code of ref document: A1 Designated state(s): AL AT BE BG CH CY CZ DE DK EE ES FI FR GB GR HR HU IE IS IT LI LT LU LV MC MK MT NL NO PL PT RO SE SI SK SM TR |
|
| DAX | Request for extension of the european patent (deleted) | ||
| RIN1 | Information on inventor provided before grant (corrected) |
Inventor name: DEVLIN, HUGH Inventor name: GRAHAM, JAMES |
|
| GRAP | Despatch of communication of intention to grant a patent |
Free format text: ORIGINAL CODE: EPIDOSNIGR1 |
|
| INTG | Intention to grant announced |
Effective date: 20141223 |
|
| GRAS | Grant fee paid |
Free format text: ORIGINAL CODE: EPIDOSNIGR3 |
|
| GRAA | (expected) grant |
Free format text: ORIGINAL CODE: 0009210 |
|
| AK | Designated contracting states |
Kind code of ref document: B1 Designated state(s): AL AT BE BG CH CY CZ DE DK EE ES FI FR GB GR HR HU IE IS IT LI LT LU LV MC MK MT NL NO PL PT RO SE SI SK SM TR |
|
| REG | Reference to a national code |
Ref country code: GB Ref legal event code: FG4D |
|
| REG | Reference to a national code |
Ref country code: FR Ref legal event code: PLFP Year of fee payment: 6 |
|
| REG | Reference to a national code |
Ref country code: CH Ref legal event code: EP |
|
| REG | Reference to a national code |
Ref country code: SE Ref legal event code: TRGR |
|
| REG | Reference to a national code |
Ref country code: ES Ref legal event code: FG2A Ref document number: 2540546 Country of ref document: ES Kind code of ref document: T3 Effective date: 20150710 |
|
| REG | Reference to a national code |
Ref country code: DK Ref legal event code: T3 Effective date: 20150709 |
|
| REG | Reference to a national code |
Ref country code: AT Ref legal event code: REF Ref document number: 730259 Country of ref document: AT Kind code of ref document: T Effective date: 20150715 Ref country code: NL Ref legal event code: T3 Ref country code: IE Ref legal event code: FG4D |
|
| REG | Reference to a national code |
Ref country code: DE Ref legal event code: R096 Ref document number: 602010025054 Country of ref document: DE Effective date: 20150716 |
|
| REG | Reference to a national code |
Ref country code: CH Ref legal event code: NV Representative=s name: MICHELI AND CIE SA, CH |
|
| REG | Reference to a national code |
Ref country code: PT Ref legal event code: SC4A Free format text: AVAILABILITY OF NATIONAL TRANSLATION Effective date: 20150701 |
|
| REG | Reference to a national code |
Ref country code: AT Ref legal event code: MK05 Ref document number: 730259 Country of ref document: AT Kind code of ref document: T Effective date: 20150603 |
|
| REG | Reference to a national code |
Ref country code: NO Ref legal event code: T2 Effective date: 20150603 |
|
| PG25 | Lapsed in a contracting state [announced via postgrant information from national office to epo] |
Ref country code: LT Free format text: LAPSE BECAUSE OF FAILURE TO SUBMIT A TRANSLATION OF THE DESCRIPTION OR TO PAY THE FEE WITHIN THE PRESCRIBED TIME-LIMIT Effective date: 20150603 Ref country code: HR Free format text: LAPSE BECAUSE OF FAILURE TO SUBMIT A TRANSLATION OF THE DESCRIPTION OR TO PAY THE FEE WITHIN THE PRESCRIBED TIME-LIMIT Effective date: 20150603 |
|
| REG | Reference to a national code |
Ref country code: LT Ref legal event code: MG4D |
|
| PG25 | Lapsed in a contracting state [announced via postgrant information from national office to epo] |
Ref country code: GR Free format text: LAPSE BECAUSE OF FAILURE TO SUBMIT A TRANSLATION OF THE DESCRIPTION OR TO PAY THE FEE WITHIN THE PRESCRIBED TIME-LIMIT Effective date: 20150904 Ref country code: BG Free format text: LAPSE BECAUSE OF FAILURE TO SUBMIT A TRANSLATION OF THE DESCRIPTION OR TO PAY THE FEE WITHIN THE PRESCRIBED TIME-LIMIT Effective date: 20150903 Ref country code: LV Free format text: LAPSE BECAUSE OF FAILURE TO SUBMIT A TRANSLATION OF THE DESCRIPTION OR TO PAY THE FEE WITHIN THE PRESCRIBED TIME-LIMIT Effective date: 20150603 Ref country code: AT Free format text: LAPSE BECAUSE OF FAILURE TO SUBMIT A TRANSLATION OF THE DESCRIPTION OR TO PAY THE FEE WITHIN THE PRESCRIBED TIME-LIMIT Effective date: 20150603 |
|
| PG25 | Lapsed in a contracting state [announced via postgrant information from national office to epo] |
Ref country code: EE Free format text: LAPSE BECAUSE OF FAILURE TO SUBMIT A TRANSLATION OF THE DESCRIPTION OR TO PAY THE FEE WITHIN THE PRESCRIBED TIME-LIMIT Effective date: 20150603 |
|
| PG25 | Lapsed in a contracting state [announced via postgrant information from national office to epo] |
Ref country code: CZ Free format text: LAPSE BECAUSE OF FAILURE TO SUBMIT A TRANSLATION OF THE DESCRIPTION OR TO PAY THE FEE WITHIN THE PRESCRIBED TIME-LIMIT Effective date: 20150603 Ref country code: IS Free format text: LAPSE BECAUSE OF FAILURE TO SUBMIT A TRANSLATION OF THE DESCRIPTION OR TO PAY THE FEE WITHIN THE PRESCRIBED TIME-LIMIT Effective date: 20151003 Ref country code: PL Free format text: LAPSE BECAUSE OF FAILURE TO SUBMIT A TRANSLATION OF THE DESCRIPTION OR TO PAY THE FEE WITHIN THE PRESCRIBED TIME-LIMIT Effective date: 20150603 Ref country code: SK Free format text: LAPSE BECAUSE OF FAILURE TO SUBMIT A TRANSLATION OF THE DESCRIPTION OR TO PAY THE FEE WITHIN THE PRESCRIBED TIME-LIMIT Effective date: 20150603 Ref country code: RO Free format text: LAPSE BECAUSE OF NON-PAYMENT OF DUE FEES Effective date: 20150603 |
|
| REG | Reference to a national code |
Ref country code: DE Ref legal event code: R097 Ref document number: 602010025054 Country of ref document: DE |
|
| RAP2 | Party data changed (patent owner data changed or rights of a patent transferred) |
Owner name: MANCHESTER IMAGING LIMITED |
|
| RAP4 | Party data changed (patent owner data changed or rights of a patent transferred) |
Owner name: MANCHESTER IMAGING LIMITED |
|
| PG25 | Lapsed in a contracting state [announced via postgrant information from national office to epo] |
Ref country code: MC Free format text: LAPSE BECAUSE OF FAILURE TO SUBMIT A TRANSLATION OF THE DESCRIPTION OR TO PAY THE FEE WITHIN THE PRESCRIBED TIME-LIMIT Effective date: 20150603 |
|
| PLBE | No opposition filed within time limit |
Free format text: ORIGINAL CODE: 0009261 |
|
| STAA | Information on the status of an ep patent application or granted ep patent |
Free format text: STATUS: NO OPPOSITION FILED WITHIN TIME LIMIT |
|
| 26N | No opposition filed |
Effective date: 20160304 |
|
| REG | Reference to a national code |
Ref country code: DE Ref legal event code: R082 Ref document number: 602010025054 Country of ref document: DE Representative=s name: HERNANDEZ, YORCK, DIPL.-ING., DE |
|
| PG25 | Lapsed in a contracting state [announced via postgrant information from national office to epo] |
Ref country code: SI Free format text: LAPSE BECAUSE OF FAILURE TO SUBMIT A TRANSLATION OF THE DESCRIPTION OR TO PAY THE FEE WITHIN THE PRESCRIBED TIME-LIMIT Effective date: 20150603 |
|
| REG | Reference to a national code |
Ref country code: FR Ref legal event code: PLFP Year of fee payment: 7 |
|
| PG25 | Lapsed in a contracting state [announced via postgrant information from national office to epo] |
Ref country code: MT Free format text: LAPSE BECAUSE OF FAILURE TO SUBMIT A TRANSLATION OF THE DESCRIPTION OR TO PAY THE FEE WITHIN THE PRESCRIBED TIME-LIMIT Effective date: 20150603 |
|
| REG | Reference to a national code |
Ref country code: DE Ref legal event code: R081 Ref document number: 602010025054 Country of ref document: DE Owner name: MANCHESTER IMAGING LIMITED, GB Free format text: FORMER OWNER: THE UNIVERSITY OF MANCHESTER, MANCHESTER, LANCASHIRE, GB Ref country code: DE Ref legal event code: R082 Ref document number: 602010025054 Country of ref document: DE Representative=s name: HERNANDEZ, YORCK, DIPL.-ING., DE |
|
| PG25 | Lapsed in a contracting state [announced via postgrant information from national office to epo] |
Ref country code: HU Free format text: LAPSE BECAUSE OF FAILURE TO SUBMIT A TRANSLATION OF THE DESCRIPTION OR TO PAY THE FEE WITHIN THE PRESCRIBED TIME-LIMIT; INVALID AB INITIO Effective date: 20100611 Ref country code: SM Free format text: LAPSE BECAUSE OF FAILURE TO SUBMIT A TRANSLATION OF THE DESCRIPTION OR TO PAY THE FEE WITHIN THE PRESCRIBED TIME-LIMIT Effective date: 20150603 |
|
| REG | Reference to a national code |
Ref country code: FR Ref legal event code: PLFP Year of fee payment: 8 |
|
| REG | Reference to a national code |
Ref country code: CH Ref legal event code: PFA Owner name: MANCHESTER IMAGING LIMITED, GB Free format text: FORMER OWNER: MANCHESTER IMAGING, GB Ref country code: CH Ref legal event code: PUE Owner name: MANCHESTER IMAGING, GB Free format text: FORMER OWNER: THE UNIVERSITY OF MANCHESTER, GB |
|
| PG25 | Lapsed in a contracting state [announced via postgrant information from national office to epo] |
Ref country code: CY Free format text: LAPSE BECAUSE OF FAILURE TO SUBMIT A TRANSLATION OF THE DESCRIPTION OR TO PAY THE FEE WITHIN THE PRESCRIBED TIME-LIMIT Effective date: 20150603 |
|
| REG | Reference to a national code |
Ref country code: GB Ref legal event code: 732E Free format text: REGISTERED BETWEEN 20170608 AND 20170614 Ref country code: NL Ref legal event code: PD Owner name: MANCHESTER IMAGING LIMITED; GB Free format text: DETAILS ASSIGNMENT: CHANGE OF OWNER(S), ASSIGNMENT; FORMER OWNER NAME: THE UNIVERSITY OF MANCHESTER Effective date: 20170424 |
|
| PG25 | Lapsed in a contracting state [announced via postgrant information from national office to epo] |
Ref country code: TR Free format text: LAPSE BECAUSE OF FAILURE TO SUBMIT A TRANSLATION OF THE DESCRIPTION OR TO PAY THE FEE WITHIN THE PRESCRIBED TIME-LIMIT Effective date: 20150603 |
|
| PG25 | Lapsed in a contracting state [announced via postgrant information from national office to epo] |
Ref country code: LU Free format text: LAPSE BECAUSE OF NON-PAYMENT OF DUE FEES Effective date: 20150611 |
|
| REG | Reference to a national code |
Ref country code: FR Ref legal event code: PLFP Year of fee payment: 9 |
|
| PG25 | Lapsed in a contracting state [announced via postgrant information from national office to epo] |
Ref country code: MK Free format text: LAPSE BECAUSE OF FAILURE TO SUBMIT A TRANSLATION OF THE DESCRIPTION OR TO PAY THE FEE WITHIN THE PRESCRIBED TIME-LIMIT Effective date: 20150603 |
|
| PG25 | Lapsed in a contracting state [announced via postgrant information from national office to epo] |
Ref country code: AL Free format text: LAPSE BECAUSE OF FAILURE TO SUBMIT A TRANSLATION OF THE DESCRIPTION OR TO PAY THE FEE WITHIN THE PRESCRIBED TIME-LIMIT Effective date: 20150603 |
|
| PGFP | Annual fee paid to national office [announced via postgrant information from national office to epo] |
Ref country code: PT Payment date: 20200604 Year of fee payment: 11 Ref country code: IE Payment date: 20200604 Year of fee payment: 11 |
|
| PGFP | Annual fee paid to national office [announced via postgrant information from national office to epo] |
Ref country code: BE Payment date: 20200605 Year of fee payment: 11 |
|
| PGFP | Annual fee paid to national office [announced via postgrant information from national office to epo] |
Ref country code: CH Payment date: 20200701 Year of fee payment: 11 |
|
| PG25 | Lapsed in a contracting state [announced via postgrant information from national office to epo] |
Ref country code: PT Free format text: LAPSE BECAUSE OF NON-PAYMENT OF DUE FEES Effective date: 20211213 |
|
| REG | Reference to a national code |
Ref country code: CH Ref legal event code: PL |
|
| REG | Reference to a national code |
Ref country code: BE Ref legal event code: MM Effective date: 20210630 |
|
| PG25 | Lapsed in a contracting state [announced via postgrant information from national office to epo] |
Ref country code: LI Free format text: LAPSE BECAUSE OF NON-PAYMENT OF DUE FEES Effective date: 20210630 Ref country code: IE Free format text: LAPSE BECAUSE OF NON-PAYMENT OF DUE FEES Effective date: 20210611 Ref country code: CH Free format text: LAPSE BECAUSE OF NON-PAYMENT OF DUE FEES Effective date: 20210630 |
|
| PG25 | Lapsed in a contracting state [announced via postgrant information from national office to epo] |
Ref country code: BE Free format text: LAPSE BECAUSE OF NON-PAYMENT OF DUE FEES Effective date: 20210630 |
|
| PGFP | Annual fee paid to national office [announced via postgrant information from national office to epo] |
Ref country code: DE Payment date: 20240619 Year of fee payment: 15 |
|
| PGFP | Annual fee paid to national office [announced via postgrant information from national office to epo] |
Ref country code: DK Payment date: 20240612 Year of fee payment: 15 |
|
| PGFP | Annual fee paid to national office [announced via postgrant information from national office to epo] |
Ref country code: NL Payment date: 20240614 Year of fee payment: 15 |
|
| PGFP | Annual fee paid to national office [announced via postgrant information from national office to epo] |
Ref country code: NO Payment date: 20240618 Year of fee payment: 15 Ref country code: FR Payment date: 20240604 Year of fee payment: 15 Ref country code: FI Payment date: 20240607 Year of fee payment: 15 |
|
| PGFP | Annual fee paid to national office [announced via postgrant information from national office to epo] |
Ref country code: IT Payment date: 20240604 Year of fee payment: 15 |
|
| PGFP | Annual fee paid to national office [announced via postgrant information from national office to epo] |
Ref country code: ES Payment date: 20240708 Year of fee payment: 15 |
|
| PGFP | Annual fee paid to national office [announced via postgrant information from national office to epo] |
Ref country code: GB Payment date: 20250529 Year of fee payment: 16 |
|
| PGFP | Annual fee paid to national office [announced via postgrant information from national office to epo] |
Ref country code: SE Payment date: 20250620 Year of fee payment: 16 |
|
| REG | Reference to a national code |
Ref country code: DE Ref legal event code: R119 Ref document number: 602010025054 Country of ref document: DE |
|
| PG25 | Lapsed in a contracting state [announced via postgrant information from national office to epo] |
Ref country code: FI Free format text: LAPSE BECAUSE OF NON-PAYMENT OF DUE FEES Effective date: 20250611 |
|
| REG | Reference to a national code |
Ref country code: DK Ref legal event code: EBP Effective date: 20250630 |
|
| REG | Reference to a national code |
Ref country code: NL Ref legal event code: MM Effective date: 20250701 |
|
| PG25 | Lapsed in a contracting state [announced via postgrant information from national office to epo] |
Ref country code: NL Free format text: LAPSE BECAUSE OF NON-PAYMENT OF DUE FEES Effective date: 20250701 |
|
| PG25 | Lapsed in a contracting state [announced via postgrant information from national office to epo] |
Ref country code: DE Free format text: LAPSE BECAUSE OF NON-PAYMENT OF DUE FEES Effective date: 20260101 Ref country code: NO Free format text: LAPSE BECAUSE OF NON-PAYMENT OF DUE FEES Effective date: 20250630 |
|
| PG25 | Lapsed in a contracting state [announced via postgrant information from national office to epo] |
Ref country code: IT Free format text: LAPSE BECAUSE OF NON-PAYMENT OF DUE FEES Effective date: 20250611 |
|
| PG25 | Lapsed in a contracting state [announced via postgrant information from national office to epo] |
Ref country code: FR Free format text: LAPSE BECAUSE OF NON-PAYMENT OF DUE FEES Effective date: 20250630 |