EP2443449B1 - Determination of coronary artery disease risk. - Google Patents
Determination of coronary artery disease risk. Download PDFInfo
- Publication number
- EP2443449B1 EP2443449B1 EP10790073.0A EP10790073A EP2443449B1 EP 2443449 B1 EP2443449 B1 EP 2443449B1 EP 10790073 A EP10790073 A EP 10790073A EP 2443449 B1 EP2443449 B1 EP 2443449B1
- Authority
- EP
- European Patent Office
- Prior art keywords
- marker
- term
- algorithm
- cad
- auc
- Prior art date
- Legal status (The legal status is an assumption and is not a legal conclusion. Google has not performed a legal analysis and makes no representation as to the accuracy of the status listed.)
- Not-in-force
Links
- 208000029078 coronary artery disease Diseases 0.000 title claims description 205
- 239000003550 marker Substances 0.000 claims description 973
- 230000014509 gene expression Effects 0.000 claims description 150
- 238000004458 analytical method Methods 0.000 claims description 116
- 102100038916 Caspase-5 Human genes 0.000 claims description 75
- 238000007477 logistic regression Methods 0.000 claims description 75
- 101000741072 Homo sapiens Caspase-5 Proteins 0.000 claims description 74
- 101000610602 Homo sapiens Tumor necrosis factor receptor superfamily member 10C Proteins 0.000 claims description 73
- 102100040115 Tumor necrosis factor receptor superfamily member 10C Human genes 0.000 claims description 73
- 102100028989 C-X-C chemokine receptor type 2 Human genes 0.000 claims description 72
- 101000916059 Homo sapiens C-X-C chemokine receptor type 2 Proteins 0.000 claims description 72
- 102100022753 Potassium voltage-gated channel subfamily E member 3 Human genes 0.000 claims description 72
- 101000974715 Homo sapiens Potassium voltage-gated channel subfamily E member 3 Proteins 0.000 claims description 71
- 101000847156 Homo sapiens Tumor necrosis factor-inducible gene 6 protein Proteins 0.000 claims description 71
- 102100032807 Tumor necrosis factor-inducible gene 6 protein Human genes 0.000 claims description 71
- 238000000034 method Methods 0.000 claims description 70
- 101001019615 Homo sapiens Interleukin-18 receptor accessory protein Proteins 0.000 claims description 69
- 101000669447 Homo sapiens Toll-like receptor 4 Proteins 0.000 claims description 69
- 102100035010 Interleukin-18 receptor accessory protein Human genes 0.000 claims description 69
- 102100039360 Toll-like receptor 4 Human genes 0.000 claims description 69
- 108700016890 S100A12 Proteins 0.000 claims description 65
- 101150097337 S100A12 gene Proteins 0.000 claims description 65
- 108010052500 Calgranulin A Proteins 0.000 claims description 62
- 101000990902 Homo sapiens Matrix metalloproteinase-9 Proteins 0.000 claims description 62
- 102100030412 Matrix metalloproteinase-9 Human genes 0.000 claims description 62
- 102100032442 Protein S100-A8 Human genes 0.000 claims description 62
- 102100022278 Arachidonate 5-lipoxygenase-activating protein Human genes 0.000 claims description 57
- 101000755875 Homo sapiens Arachidonate 5-lipoxygenase-activating protein Proteins 0.000 claims description 57
- 102100029812 Protein S100-A12 Human genes 0.000 claims description 57
- 101000946863 Homo sapiens T-cell surface glycoprotein CD3 delta chain Proteins 0.000 claims description 51
- 102100023617 Neutrophil cytosol factor 4 Human genes 0.000 claims description 51
- 108010064862 Nicotinamide phosphoribosyltransferase Proteins 0.000 claims description 51
- 102000015532 Nicotinamide phosphoribosyltransferase Human genes 0.000 claims description 51
- 102100035891 T-cell surface glycoprotein CD3 delta chain Human genes 0.000 claims description 51
- 108010086154 neutrophil cytosol factor 40K Proteins 0.000 claims description 51
- 101000771402 Homo sapiens Aquaporin-7 Proteins 0.000 claims description 50
- 101000771413 Homo sapiens Aquaporin-9 Proteins 0.000 claims description 50
- 101000851515 Homo sapiens Transmembrane channel-like protein 8 Proteins 0.000 claims description 50
- 102100036770 Transmembrane channel-like protein 8 Human genes 0.000 claims description 50
- 101000837443 Homo sapiens T-complex protein 1 subunit beta Proteins 0.000 claims description 48
- 102100028679 T-complex protein 1 subunit beta Human genes 0.000 claims description 48
- 101001112224 Homo sapiens Neutrophil cytosol factor 2 Proteins 0.000 claims description 47
- 102100023618 Neutrophil cytosol factor 2 Human genes 0.000 claims description 47
- 102100034000 Heterogeneous nuclear ribonucleoprotein F Human genes 0.000 claims description 46
- 101001017544 Homo sapiens Heterogeneous nuclear ribonucleoprotein F Proteins 0.000 claims description 46
- 102100033658 Alpha-globin transcription factor CP2 Human genes 0.000 claims description 44
- 101000800875 Homo sapiens Alpha-globin transcription factor CP2 Proteins 0.000 claims description 44
- 102100040139 Glycosyltransferase 1 domain-containing protein 1 Human genes 0.000 claims description 43
- 101001037042 Homo sapiens Glycosyltransferase 1 domain-containing protein 1 Proteins 0.000 claims description 43
- 101001047681 Homo sapiens Tyrosine-protein kinase Lck Proteins 0.000 claims description 43
- 102100024036 Tyrosine-protein kinase Lck Human genes 0.000 claims description 43
- 238000003752 polymerase chain reaction Methods 0.000 claims description 42
- 102100027203 B-cell antigen receptor complex-associated protein beta chain Human genes 0.000 claims description 39
- 101000914491 Homo sapiens B-cell antigen receptor complex-associated protein beta chain Proteins 0.000 claims description 39
- 101000825182 Homo sapiens Transcription factor Spi-B Proteins 0.000 claims description 39
- 102100022281 Transcription factor Spi-B Human genes 0.000 claims description 39
- 102100036407 Thioredoxin Human genes 0.000 claims description 36
- 102100035919 Acyl-CoA-binding domain-containing protein 5 Human genes 0.000 claims description 35
- 101000782705 Homo sapiens Acyl-CoA-binding domain-containing protein 5 Proteins 0.000 claims description 35
- 102100021660 60S ribosomal protein L28 Human genes 0.000 claims description 33
- 102100021334 Bcl-2-related protein A1 Human genes 0.000 claims description 33
- 101000676271 Homo sapiens 60S ribosomal protein L28 Proteins 0.000 claims description 33
- 101000894929 Homo sapiens Bcl-2-related protein A1 Proteins 0.000 claims description 33
- 210000000440 neutrophil Anatomy 0.000 claims description 33
- 102100021407 ATP-dependent RNA helicase DDX18 Human genes 0.000 claims description 31
- 102100024222 B-lymphocyte antigen CD19 Human genes 0.000 claims description 31
- 101001041703 Homo sapiens ATP-dependent RNA helicase DDX18 Proteins 0.000 claims description 31
- 101000980825 Homo sapiens B-lymphocyte antigen CD19 Proteins 0.000 claims description 31
- 101001109472 Homo sapiens NKG2-F type II integral membrane protein Proteins 0.000 claims description 30
- 101000633784 Homo sapiens SLAM family member 7 Proteins 0.000 claims description 30
- 102100022700 NKG2-F type II integral membrane protein Human genes 0.000 claims description 30
- 102100029198 SLAM family member 7 Human genes 0.000 claims description 30
- 230000006870 function Effects 0.000 claims description 30
- 102100039236 Histone H3.3 Human genes 0.000 claims description 29
- 101000946843 Homo sapiens T-cell surface glycoprotein CD8 alpha chain Proteins 0.000 claims description 29
- 102100034922 T-cell surface glycoprotein CD8 alpha chain Human genes 0.000 claims description 29
- 102100027053 Tyrosine-protein kinase Blk Human genes 0.000 claims description 29
- 208000037265 diseases, disorders, signs and symptoms Diseases 0.000 claims description 29
- 101001035966 Homo sapiens Histone H3.3 Proteins 0.000 claims description 28
- 101000809875 Homo sapiens TYRO protein tyrosine kinase-binding protein Proteins 0.000 claims description 28
- 102100038717 TYRO protein tyrosine kinase-binding protein Human genes 0.000 claims description 28
- 201000010099 disease Diseases 0.000 claims description 28
- 102100028166 FACT complex subunit SSRP1 Human genes 0.000 claims description 26
- 101000697353 Homo sapiens FACT complex subunit SSRP1 Proteins 0.000 claims description 26
- 208000031481 Pathologic Constriction Diseases 0.000 claims description 25
- 230000036262 stenosis Effects 0.000 claims description 25
- 208000037804 stenosis Diseases 0.000 claims description 25
- 102100038083 Endosialin Human genes 0.000 claims description 24
- 101000884275 Homo sapiens Endosialin Proteins 0.000 claims description 24
- 108090000835 CX3C Chemokine Receptor 1 Proteins 0.000 claims description 22
- 102100039196 CX3C chemokine receptor 1 Human genes 0.000 claims description 22
- 206010008479 Chest Pain Diseases 0.000 claims description 22
- 101000760337 Homo sapiens Urokinase plasminogen activator surface receptor Proteins 0.000 claims description 22
- 108010009491 Lysosomal-Associated Membrane Protein 2 Proteins 0.000 claims description 22
- 102100038225 Lysosome-associated membrane glycoprotein 2 Human genes 0.000 claims description 22
- 102100024689 Urokinase plasminogen activator surface receptor Human genes 0.000 claims description 22
- 238000003757 reverse transcription PCR Methods 0.000 claims description 22
- 101150084398 PTAFR gene Proteins 0.000 claims description 19
- 108700023400 Platelet-activating factor receptors Proteins 0.000 claims description 19
- 102000030769 platelet activating factor receptor Human genes 0.000 claims description 19
- 238000003860 storage Methods 0.000 claims description 19
- 101000794187 Homo sapiens Tetraspanin-18 Proteins 0.000 claims description 10
- 102100030175 Tetraspanin-18 Human genes 0.000 claims description 10
- 210000004976 peripheral blood cell Anatomy 0.000 claims description 9
- 101000852559 Homo sapiens Thioredoxin Proteins 0.000 claims description 8
- 208000024891 symptom Diseases 0.000 claims description 8
- 101000984551 Homo sapiens Tyrosine-protein kinase Blk Proteins 0.000 claims description 7
- 230000035488 systolic blood pressure Effects 0.000 claims description 7
- UIIMBOGNXHQVGW-UHFFFAOYSA-M Sodium bicarbonate Chemical compound [Na+].OC([O-])=O UIIMBOGNXHQVGW-UHFFFAOYSA-M 0.000 claims description 5
- 230000035487 diastolic blood pressure Effects 0.000 claims description 5
- 238000012417 linear regression Methods 0.000 claims description 5
- 238000012545 processing Methods 0.000 claims description 5
- 230000000284 resting effect Effects 0.000 claims description 5
- 230000036961 partial effect Effects 0.000 claims description 4
- 238000000638 solvent extraction Methods 0.000 claims description 4
- 238000009396 hybridization Methods 0.000 claims description 3
- 102100028699 C-type lectin domain family 4 member E Human genes 0.000 claims 9
- 101000766921 Homo sapiens C-type lectin domain family 4 member E Proteins 0.000 claims 9
- 102000058242 S100A12 Human genes 0.000 claims 8
- 102100029406 Aquaporin-7 Human genes 0.000 claims 6
- 238000004422 calculation algorithm Methods 0.000 description 484
- 108090000623 proteins and genes Proteins 0.000 description 156
- 230000002596 correlated effect Effects 0.000 description 133
- 230000002829 reductive effect Effects 0.000 description 69
- 239000000523 sample Substances 0.000 description 65
- 102100029464 Aquaporin-9 Human genes 0.000 description 44
- 206010012601 diabetes mellitus Diseases 0.000 description 43
- 230000000694 effects Effects 0.000 description 41
- 238000007619 statistical method Methods 0.000 description 41
- 238000002790 cross-validation Methods 0.000 description 40
- 238000011161 development Methods 0.000 description 40
- 230000018109 developmental process Effects 0.000 description 40
- 229910003460 diamond Inorganic materials 0.000 description 39
- 239000010432 diamond Substances 0.000 description 39
- 238000004364 calculation method Methods 0.000 description 38
- 238000010200 validation analysis Methods 0.000 description 35
- 230000000414 obstructive effect Effects 0.000 description 31
- 210000004369 blood Anatomy 0.000 description 30
- 239000008280 blood Substances 0.000 description 30
- 210000004027 cell Anatomy 0.000 description 23
- 210000004698 lymphocyte Anatomy 0.000 description 20
- 230000027455 binding Effects 0.000 description 18
- 238000002493 microarray Methods 0.000 description 18
- 208000010125 myocardial infarction Diseases 0.000 description 18
- 230000004060 metabolic process Effects 0.000 description 17
- -1 CD 19 Proteins 0.000 description 16
- 230000008901 benefit Effects 0.000 description 15
- 238000012360 testing method Methods 0.000 description 15
- 238000003556 assay Methods 0.000 description 14
- 230000002526 effect on cardiovascular system Effects 0.000 description 14
- 210000001744 T-lymphocyte Anatomy 0.000 description 13
- 230000001965 increasing effect Effects 0.000 description 13
- 230000008569 process Effects 0.000 description 13
- 210000003719 b-lymphocyte Anatomy 0.000 description 11
- 239000003153 chemical reaction reagent Substances 0.000 description 11
- 238000010606 normalization Methods 0.000 description 11
- 230000015572 biosynthetic process Effects 0.000 description 9
- 230000004087 circulation Effects 0.000 description 9
- 230000007423 decrease Effects 0.000 description 9
- 102000004169 proteins and genes Human genes 0.000 description 9
- 230000001105 regulatory effect Effects 0.000 description 9
- 108091032973 (ribonucleotides)n+m Proteins 0.000 description 8
- 206010002383 Angina Pectoris Diseases 0.000 description 8
- 210000000265 leukocyte Anatomy 0.000 description 8
- 210000003819 peripheral blood mononuclear cell Anatomy 0.000 description 8
- 238000006467 substitution reaction Methods 0.000 description 8
- 238000002583 angiography Methods 0.000 description 7
- 230000009286 beneficial effect Effects 0.000 description 7
- 230000001413 cellular effect Effects 0.000 description 7
- 230000003828 downregulation Effects 0.000 description 7
- 238000011156 evaluation Methods 0.000 description 7
- 238000002586 coronary angiography Methods 0.000 description 6
- 230000007717 exclusion Effects 0.000 description 6
- 210000003714 granulocyte Anatomy 0.000 description 6
- 238000002955 isolation Methods 0.000 description 6
- 238000005259 measurement Methods 0.000 description 6
- 210000000822 natural killer cell Anatomy 0.000 description 6
- 230000035945 sensitivity Effects 0.000 description 6
- 201000001320 Atherosclerosis Diseases 0.000 description 5
- 230000033228 biological regulation Effects 0.000 description 5
- 239000000872 buffer Substances 0.000 description 5
- 238000003759 clinical diagnosis Methods 0.000 description 5
- 230000007547 defect Effects 0.000 description 5
- 238000013461 design Methods 0.000 description 5
- IZEKFCXSFNUWAM-UHFFFAOYSA-N dipyridamole Chemical compound C=12N=C(N(CCO)CCO)N=C(N3CCCCC3)C2=NC(N(CCO)CCO)=NC=1N1CCCCC1 IZEKFCXSFNUWAM-UHFFFAOYSA-N 0.000 description 5
- 230000004968 inflammatory condition Effects 0.000 description 5
- 230000003902 lesion Effects 0.000 description 5
- 210000001616 monocyte Anatomy 0.000 description 5
- 230000000250 revascularization Effects 0.000 description 5
- 230000019491 signal transduction Effects 0.000 description 5
- 208000032928 Dyslipidaemia Diseases 0.000 description 4
- 241000282412 Homo Species 0.000 description 4
- 101000946889 Homo sapiens Monocyte differentiation antigen CD14 Proteins 0.000 description 4
- 101000581981 Homo sapiens Neural cell adhesion molecule 1 Proteins 0.000 description 4
- 101000794155 Homo sapiens Tetraspanin-16 Proteins 0.000 description 4
- 206010020772 Hypertension Diseases 0.000 description 4
- 208000017170 Lipid metabolism disease Diseases 0.000 description 4
- 102100035877 Monocyte differentiation antigen CD14 Human genes 0.000 description 4
- 102100027347 Neural cell adhesion molecule 1 Human genes 0.000 description 4
- 238000002123 RNA extraction Methods 0.000 description 4
- 102100030159 Tetraspanin-16 Human genes 0.000 description 4
- 230000004913 activation Effects 0.000 description 4
- 239000002246 antineoplastic agent Substances 0.000 description 4
- 210000000601 blood cell Anatomy 0.000 description 4
- 210000000170 cell membrane Anatomy 0.000 description 4
- 238000005119 centrifugation Methods 0.000 description 4
- 210000004351 coronary vessel Anatomy 0.000 description 4
- 230000000875 corresponding effect Effects 0.000 description 4
- 229940127089 cytotoxic agent Drugs 0.000 description 4
- 238000003745 diagnosis Methods 0.000 description 4
- 238000009826 distribution Methods 0.000 description 4
- 238000005194 fractionation Methods 0.000 description 4
- 239000003018 immunosuppressive agent Substances 0.000 description 4
- 229940125721 immunosuppressive agent Drugs 0.000 description 4
- 208000015181 infectious disease Diseases 0.000 description 4
- 230000002458 infectious effect Effects 0.000 description 4
- 230000003834 intracellular effect Effects 0.000 description 4
- 239000012528 membrane Substances 0.000 description 4
- 210000005060 membrane bound organelle Anatomy 0.000 description 4
- 102000039446 nucleic acids Human genes 0.000 description 4
- 108020004707 nucleic acids Proteins 0.000 description 4
- 150000007523 nucleic acids Chemical class 0.000 description 4
- 210000005259 peripheral blood Anatomy 0.000 description 4
- 239000011886 peripheral blood Substances 0.000 description 4
- 238000011160 research Methods 0.000 description 4
- 230000004044 response Effects 0.000 description 4
- 102100028550 40S ribosomal protein S4, Y isoform 1 Human genes 0.000 description 3
- 102100036006 Adenosine receptor A3 Human genes 0.000 description 3
- 102100021253 Antileukoproteinase Human genes 0.000 description 3
- 108020004414 DNA Proteins 0.000 description 3
- 101000696103 Homo sapiens 40S ribosomal protein S4, Y isoform 1 Proteins 0.000 description 3
- 101000783645 Homo sapiens Adenosine receptor A3 Proteins 0.000 description 3
- 101000615334 Homo sapiens Antileukoproteinase Proteins 0.000 description 3
- 101000752037 Homo sapiens Arginase-1 Proteins 0.000 description 3
- 101000934338 Homo sapiens Myeloid cell surface antigen CD33 Proteins 0.000 description 3
- 101000653540 Homo sapiens Transcription factor 7 Proteins 0.000 description 3
- 101000800287 Homo sapiens Tubulointerstitial nephritis antigen-like Proteins 0.000 description 3
- 241000699666 Mus <mouse, genus> Species 0.000 description 3
- 102100025243 Myeloid cell surface antigen CD33 Human genes 0.000 description 3
- 102000001253 Protein Kinase Human genes 0.000 description 3
- 238000010240 RT-PCR analysis Methods 0.000 description 3
- 108090000088 Symporters Proteins 0.000 description 3
- 102000003673 Symporters Human genes 0.000 description 3
- 102100030627 Transcription factor 7 Human genes 0.000 description 3
- 102100033469 Tubulointerstitial nephritis antigen-like Human genes 0.000 description 3
- 238000013103 analytical ultracentrifugation Methods 0.000 description 3
- 239000003146 anticoagulant agent Substances 0.000 description 3
- 230000006907 apoptotic process Effects 0.000 description 3
- 238000013459 approach Methods 0.000 description 3
- 238000004820 blood count Methods 0.000 description 3
- 210000001124 body fluid Anatomy 0.000 description 3
- 230000000052 comparative effect Effects 0.000 description 3
- 230000001086 cytosolic effect Effects 0.000 description 3
- 230000001419 dependent effect Effects 0.000 description 3
- LOKCTEFSRHRXRJ-UHFFFAOYSA-I dipotassium trisodium dihydrogen phosphate hydrogen phosphate dichloride Chemical compound P(=O)(O)(O)[O-].[K+].P(=O)(O)([O-])[O-].[Na+].[Na+].[Cl-].[K+].[Cl-].[Na+] LOKCTEFSRHRXRJ-UHFFFAOYSA-I 0.000 description 3
- 229940079593 drug Drugs 0.000 description 3
- 239000003814 drug Substances 0.000 description 3
- 238000003384 imaging method Methods 0.000 description 3
- 230000015788 innate immune response Effects 0.000 description 3
- 230000003993 interaction Effects 0.000 description 3
- 238000010208 microarray analysis Methods 0.000 description 3
- MRWXACSTFXYYMV-FDDDBJFASA-N nebularine Chemical compound O[C@@H]1[C@H](O)[C@@H](CO)O[C@H]1N1C2=NC=NC=C2N=C1 MRWXACSTFXYYMV-FDDDBJFASA-N 0.000 description 3
- 239000013610 patient sample Substances 0.000 description 3
- 239000002953 phosphate buffered saline Substances 0.000 description 3
- 238000000159 protein binding assay Methods 0.000 description 3
- 108060006633 protein kinase Proteins 0.000 description 3
- 238000000746 purification Methods 0.000 description 3
- 230000002441 reversible effect Effects 0.000 description 3
- 150000003431 steroids Chemical class 0.000 description 3
- 230000009466 transformation Effects 0.000 description 3
- 230000003827 upregulation Effects 0.000 description 3
- 101150111660 53 gene Proteins 0.000 description 2
- 102100040637 60S ribosomal protein L34 Human genes 0.000 description 2
- KDCGOANMDULRCW-UHFFFAOYSA-N 7H-purine Chemical compound N1=CNC2=NC=NC2=C1 KDCGOANMDULRCW-UHFFFAOYSA-N 0.000 description 2
- 239000005541 ACE inhibitor Substances 0.000 description 2
- 102100021305 Acyl-CoA:lysophosphatidylglycerol acyltransferase 1 Human genes 0.000 description 2
- 206010002388 Angina unstable Diseases 0.000 description 2
- 102100035875 C-C chemokine receptor type 5 Human genes 0.000 description 2
- 101710149870 C-C chemokine receptor type 5 Proteins 0.000 description 2
- 102100022291 C-Jun-amino-terminal kinase-interacting protein 1 Human genes 0.000 description 2
- 102100028672 C-type lectin domain family 4 member D Human genes 0.000 description 2
- 101150019620 CAD gene Proteins 0.000 description 2
- 108060001826 COP1 Proteins 0.000 description 2
- 102100025877 Complement component C1q receptor Human genes 0.000 description 2
- 201000000057 Coronary Stenosis Diseases 0.000 description 2
- 206010011089 Coronary artery stenosis Diseases 0.000 description 2
- 102100031237 Cystatin-A Human genes 0.000 description 2
- 102000004127 Cytokines Human genes 0.000 description 2
- 108090000695 Cytokines Proteins 0.000 description 2
- 230000004568 DNA-binding Effects 0.000 description 2
- 102100032045 E3 ubiquitin-protein ligase AMFR Human genes 0.000 description 2
- 238000002965 ELISA Methods 0.000 description 2
- 102000004190 Enzymes Human genes 0.000 description 2
- 108090000790 Enzymes Proteins 0.000 description 2
- 108091059597 FAIM3 Proteins 0.000 description 2
- 102100037815 Fas apoptotic inhibitory molecule 3 Human genes 0.000 description 2
- WQZGKKKJIJFFOK-GASJEMHNSA-N Glucose Natural products OC[C@H]1OC(O)[C@H](O)[C@@H](O)[C@@H]1O WQZGKKKJIJFFOK-GASJEMHNSA-N 0.000 description 2
- 229940121710 HMGCoA reductase inhibitor Drugs 0.000 description 2
- 101150096895 HSPB1 gene Proteins 0.000 description 2
- 102100039165 Heat shock protein beta-1 Human genes 0.000 description 2
- 102100031573 Hematopoietic progenitor cell antigen CD34 Human genes 0.000 description 2
- 101000672659 Homo sapiens 60S ribosomal protein L34 Proteins 0.000 description 2
- 101001042227 Homo sapiens Acyl-CoA:lysophosphatidylglycerol acyltransferase 1 Proteins 0.000 description 2
- 101001046660 Homo sapiens C-Jun-amino-terminal kinase-interacting protein 1 Proteins 0.000 description 2
- 101000766905 Homo sapiens C-type lectin domain family 4 member D Proteins 0.000 description 2
- 101000888518 Homo sapiens Chemokine-like factor Proteins 0.000 description 2
- 101000933665 Homo sapiens Complement component C1q receptor Proteins 0.000 description 2
- 101000921786 Homo sapiens Cystatin-A Proteins 0.000 description 2
- 101000776154 Homo sapiens E3 ubiquitin-protein ligase AMFR Proteins 0.000 description 2
- 101000777663 Homo sapiens Hematopoietic progenitor cell antigen CD34 Proteins 0.000 description 2
- 101001055315 Homo sapiens Immunoglobulin heavy constant alpha 1 Proteins 0.000 description 2
- 101001056814 Homo sapiens Integral membrane protein 2C Proteins 0.000 description 2
- 101001043809 Homo sapiens Interleukin-7 receptor subunit alpha Proteins 0.000 description 2
- 101001044432 Homo sapiens Intraflagellar transport protein 46 homolog Proteins 0.000 description 2
- 101001139130 Homo sapiens Krueppel-like factor 5 Proteins 0.000 description 2
- 101000957316 Homo sapiens Lysophospholipid acyltransferase 2 Proteins 0.000 description 2
- 101001043352 Homo sapiens Lysyl oxidase homolog 2 Proteins 0.000 description 2
- 101000969763 Homo sapiens Myelin protein zero-like protein 1 Proteins 0.000 description 2
- 101001120753 Homo sapiens Oligodendrocyte transcription factor 1 Proteins 0.000 description 2
- 101001029173 Homo sapiens Proto-oncogene FRAT1 Proteins 0.000 description 2
- 101001119130 Homo sapiens RNA polymerase I-specific transcription initiation factor RRN3 Proteins 0.000 description 2
- 101001106090 Homo sapiens Receptor expression-enhancing protein 5 Proteins 0.000 description 2
- 101000666634 Homo sapiens Rho-related GTP-binding protein RhoH Proteins 0.000 description 2
- 101001069710 Homo sapiens Serine protease 23 Proteins 0.000 description 2
- 101000946860 Homo sapiens T-cell surface glycoprotein CD3 epsilon chain Proteins 0.000 description 2
- 101001115218 Homo sapiens Ubiquitin-40S ribosomal protein S27a Proteins 0.000 description 2
- 101000955962 Homo sapiens Vacuolar protein sorting-associated protein 51 homolog Proteins 0.000 description 2
- UFHFLCQGNIYNRP-UHFFFAOYSA-N Hydrogen Chemical compound [H][H] UFHFLCQGNIYNRP-UHFFFAOYSA-N 0.000 description 2
- 102100026217 Immunoglobulin heavy constant alpha 1 Human genes 0.000 description 2
- 102100025464 Integral membrane protein 2C Human genes 0.000 description 2
- 102100021593 Interleukin-7 receptor subunit alpha Human genes 0.000 description 2
- 102100022489 Intraflagellar transport protein 46 homolog Human genes 0.000 description 2
- 102100020680 Krueppel-like factor 5 Human genes 0.000 description 2
- 102100038805 Lysophospholipid acyltransferase 2 Human genes 0.000 description 2
- 102100021948 Lysyl oxidase homolog 2 Human genes 0.000 description 2
- 102000000440 Melanoma-associated antigen Human genes 0.000 description 2
- 108050008953 Melanoma-associated antigen Proteins 0.000 description 2
- 102100021270 Myelin protein zero-like protein 1 Human genes 0.000 description 2
- 230000006051 NK cell activation Effects 0.000 description 2
- 102100026073 Oligodendrocyte transcription factor 1 Human genes 0.000 description 2
- 102000004316 Oxidoreductases Human genes 0.000 description 2
- 108090000854 Oxidoreductases Proteins 0.000 description 2
- 102100032420 Protein S100-A9 Human genes 0.000 description 2
- 102100037072 Proto-oncogene FRAT1 Human genes 0.000 description 2
- 102100026763 RNA polymerase I-specific transcription initiation factor RRN3 Human genes 0.000 description 2
- 238000011530 RNeasy Mini Kit Methods 0.000 description 2
- 102100021077 Receptor expression-enhancing protein 5 Human genes 0.000 description 2
- 102100038338 Rho-related GTP-binding protein RhoH Human genes 0.000 description 2
- 102100033835 Serine protease 23 Human genes 0.000 description 2
- 208000007718 Stable Angina Diseases 0.000 description 2
- 102100035794 T-cell surface glycoprotein CD3 epsilon chain Human genes 0.000 description 2
- 101150076211 TH gene Proteins 0.000 description 2
- 102100023341 Ubiquitin-40S ribosomal protein S27a Human genes 0.000 description 2
- 208000007814 Unstable Angina Diseases 0.000 description 2
- 150000001336 alkenes Chemical class 0.000 description 2
- 229940044094 angiotensin-converting-enzyme inhibitor Drugs 0.000 description 2
- 230000000702 anti-platelet effect Effects 0.000 description 2
- 239000000427 antigen Substances 0.000 description 2
- 108091007433 antigens Proteins 0.000 description 2
- 102000036639 antigens Human genes 0.000 description 2
- 238000003491 array Methods 0.000 description 2
- 230000003143 atherosclerotic effect Effects 0.000 description 2
- 239000011324 bead Substances 0.000 description 2
- 239000000090 biomarker Substances 0.000 description 2
- 238000010804 cDNA synthesis Methods 0.000 description 2
- 230000007211 cardiovascular event Effects 0.000 description 2
- 150000001768 cations Chemical class 0.000 description 2
- 230000024245 cell differentiation Effects 0.000 description 2
- 210000002939 cerumen Anatomy 0.000 description 2
- 238000006243 chemical reaction Methods 0.000 description 2
- HVYWMOMLDIMFJA-DPAQBDIFSA-N cholesterol Chemical compound C1C=C2C[C@@H](O)CC[C@]2(C)[C@@H]2[C@@H]1[C@@H]1CC[C@H]([C@H](C)CCCC(C)C)[C@@]1(C)CC2 HVYWMOMLDIMFJA-DPAQBDIFSA-N 0.000 description 2
- 210000003040 circulating cell Anatomy 0.000 description 2
- 238000004590 computer program Methods 0.000 description 2
- 238000011109 contamination Methods 0.000 description 2
- 230000003247 decreasing effect Effects 0.000 description 2
- 230000003205 diastolic effect Effects 0.000 description 2
- 230000004069 differentiation Effects 0.000 description 2
- 238000010195 expression analysis Methods 0.000 description 2
- 238000000556 factor analysis Methods 0.000 description 2
- 239000012634 fragment Substances 0.000 description 2
- 239000008103 glucose Substances 0.000 description 2
- 239000003102 growth factor Substances 0.000 description 2
- 230000003862 health status Effects 0.000 description 2
- 229910052739 hydrogen Inorganic materials 0.000 description 2
- 239000001257 hydrogen Substances 0.000 description 2
- 230000028993 immune response Effects 0.000 description 2
- 230000006872 improvement Effects 0.000 description 2
- 201000004332 intermediate coronary syndrome Diseases 0.000 description 2
- 210000005061 intracellular organelle Anatomy 0.000 description 2
- 150000002617 leukotrienes Chemical class 0.000 description 2
- 230000019231 macromolecule metabolic process Effects 0.000 description 2
- 230000001404 mediated effect Effects 0.000 description 2
- 238000002483 medication Methods 0.000 description 2
- 230000002503 metabolic effect Effects 0.000 description 2
- 238000012737 microarray-based gene expression Methods 0.000 description 2
- 238000010172 mouse model Methods 0.000 description 2
- 238000012243 multiplex automated genomic engineering Methods 0.000 description 2
- 230000035772 mutation Effects 0.000 description 2
- 239000002773 nucleotide Substances 0.000 description 2
- 125000003729 nucleotide group Chemical group 0.000 description 2
- 210000003463 organelle Anatomy 0.000 description 2
- 238000003068 pathway analysis Methods 0.000 description 2
- 210000004909 pre-ejaculatory fluid Anatomy 0.000 description 2
- 102000004196 processed proteins & peptides Human genes 0.000 description 2
- 108090000765 processed proteins & peptides Proteins 0.000 description 2
- 239000002212 purine nucleoside Substances 0.000 description 2
- 230000003938 response to stress Effects 0.000 description 2
- 238000012552 review Methods 0.000 description 2
- 210000001812 small ribosome subunit Anatomy 0.000 description 2
- 230000008093 supporting effect Effects 0.000 description 2
- 230000009885 systemic effect Effects 0.000 description 2
- 210000001519 tissue Anatomy 0.000 description 2
- 238000013518 transcription Methods 0.000 description 2
- 230000035897 transcription Effects 0.000 description 2
- 102000040606 transmembrane transporter activity Human genes 0.000 description 2
- 108091023038 transmembrane transporter activity Proteins 0.000 description 2
- 150000004670 unsaturated fatty acids Chemical class 0.000 description 2
- 235000021122 unsaturated fatty acids Nutrition 0.000 description 2
- 238000011179 visual inspection Methods 0.000 description 2
- XOYCLJDJUKHHHS-LHBOOPKSSA-N (2s,3s,4s,5r,6r)-6-[[(2s,3s,5r)-3-amino-5-(5-methyl-2,4-dioxopyrimidin-1-yl)oxolan-2-yl]methoxy]-3,4,5-trihydroxyoxane-2-carboxylic acid Chemical compound O=C1NC(=O)C(C)=CN1[C@@H]1O[C@H](CO[C@H]2[C@@H]([C@@H](O)[C@H](O)[C@H](O2)C(O)=O)O)[C@@H](N)C1 XOYCLJDJUKHHHS-LHBOOPKSSA-N 0.000 description 1
- 101150084750 1 gene Proteins 0.000 description 1
- 102100026152 1-acyl-sn-glycerol-3-phosphate acyltransferase epsilon Human genes 0.000 description 1
- 102100035905 1-acylglycerol-3-phosphate O-acyltransferase ABHD5 Human genes 0.000 description 1
- 102100040685 14-3-3 protein zeta/delta Human genes 0.000 description 1
- AVTLBBWTUPQRAY-UHFFFAOYSA-N 2-(2-cyanobutan-2-yldiazenyl)-2-methylbutanenitrile Chemical compound CCC(C)(C#N)N=NC(C)(CC)C#N AVTLBBWTUPQRAY-UHFFFAOYSA-N 0.000 description 1
- FDFPSNISSMYYDS-UHFFFAOYSA-N 2-ethyl-N,2-dimethylheptanamide Chemical compound CCCCCC(C)(CC)C(=O)NC FDFPSNISSMYYDS-UHFFFAOYSA-N 0.000 description 1
- 101150029857 23 gene Proteins 0.000 description 1
- 102100036652 26S proteasome non-ATPase regulatory subunit 8 Human genes 0.000 description 1
- 102100021750 39S ribosomal protein L53, mitochondrial Human genes 0.000 description 1
- 102100026744 40S ribosomal protein S10 Human genes 0.000 description 1
- 102100023216 40S ribosomal protein S15 Human genes 0.000 description 1
- 102100037710 40S ribosomal protein S21 Human genes 0.000 description 1
- 102100022681 40S ribosomal protein S27 Human genes 0.000 description 1
- 102100023679 40S ribosomal protein S28 Human genes 0.000 description 1
- 102100034088 40S ribosomal protein S4, X isoform Human genes 0.000 description 1
- 102100036184 5'-3' exonuclease PLD3 Human genes 0.000 description 1
- 102100034406 5'-deoxynucleotidase HDDC2 Human genes 0.000 description 1
- 102100031020 5-aminolevulinate synthase, erythroid-specific, mitochondrial Human genes 0.000 description 1
- 102100022406 60S ribosomal protein L10a Human genes 0.000 description 1
- 102100023990 60S ribosomal protein L17 Human genes 0.000 description 1
- 102100021690 60S ribosomal protein L18a Human genes 0.000 description 1
- 102100037685 60S ribosomal protein L22 Human genes 0.000 description 1
- 102100023777 60S ribosomal protein L31 Human genes 0.000 description 1
- 102100031002 60S ribosomal protein L36a Human genes 0.000 description 1
- 102100040131 60S ribosomal protein L37 Human genes 0.000 description 1
- 102100035988 60S ribosomal protein L39 Human genes 0.000 description 1
- 102100035931 60S ribosomal protein L8 Human genes 0.000 description 1
- 102100029824 ADP-ribosyl cyclase/cyclic ADP-ribose hydrolase 2 Human genes 0.000 description 1
- 102100022911 ADP-ribosylation factor-like protein 17 Human genes 0.000 description 1
- 102000017919 ADRB2 Human genes 0.000 description 1
- 102100028780 AP-1 complex subunit sigma-2 Human genes 0.000 description 1
- 108010004483 APOBEC-3G Deaminase Proteins 0.000 description 1
- 102100030835 AT-rich interactive domain-containing protein 5B Human genes 0.000 description 1
- 102100025581 ATP synthase subunit delta, mitochondrial Human genes 0.000 description 1
- 102100028161 ATP-binding cassette sub-family C member 2 Human genes 0.000 description 1
- 102100025339 ATP-dependent DNA helicase DDX11 Human genes 0.000 description 1
- 102100033392 ATP-dependent RNA helicase DDX3Y Human genes 0.000 description 1
- 102100022781 ATP-sensitive inward rectifier potassium channel 15 Human genes 0.000 description 1
- 102100022144 Achaete-scute homolog 2 Human genes 0.000 description 1
- 102100027863 Acidic fibroblast growth factor intracellular-binding protein Human genes 0.000 description 1
- 102100040958 Aconitate hydratase, mitochondrial Human genes 0.000 description 1
- 102100020963 Actin-binding LIM protein 1 Human genes 0.000 description 1
- 102100038820 Actin-related protein 2/3 complex subunit 1B Human genes 0.000 description 1
- 102100027647 Activin receptor type-2B Human genes 0.000 description 1
- 102100022385 Activity-dependent neuroprotector homeobox protein Human genes 0.000 description 1
- 208000004476 Acute Coronary Syndrome Diseases 0.000 description 1
- 102100032488 Acylamino-acid-releasing enzyme Human genes 0.000 description 1
- 102100039140 Acyloxyacyl hydrolase Human genes 0.000 description 1
- 102100039162 Adenine nucleotide translocase lysine N-methyltransferase Human genes 0.000 description 1
- 108010024223 Adenine phosphoribosyltransferase Proteins 0.000 description 1
- 102100029457 Adenine phosphoribosyltransferase Human genes 0.000 description 1
- 102100040149 Adenylyl-sulfate kinase Human genes 0.000 description 1
- 102100026425 Adhesion G protein-coupled receptor E3 Human genes 0.000 description 1
- 102100040024 Adhesion G-protein coupled receptor G5 Human genes 0.000 description 1
- 102100023809 Adipocyte plasma membrane-associated protein Human genes 0.000 description 1
- 102100031971 Alpha-N-acetylgalactosaminide alpha-2,6-sialyltransferase 3 Human genes 0.000 description 1
- 102100021763 Alpha-mannosidase 2x Human genes 0.000 description 1
- 102100038046 Alpha/beta hydrolase domain-containing protein 17A Human genes 0.000 description 1
- 102100040409 Ameloblastin Human genes 0.000 description 1
- 108091093088 Amplicon Proteins 0.000 description 1
- 102100036439 Amyloid beta precursor protein binding family B member 1 Human genes 0.000 description 1
- 102100036441 Amyloid-beta A4 precursor protein-binding family A member 2 Human genes 0.000 description 1
- 102100034613 Annexin A2 Human genes 0.000 description 1
- 102100034618 Annexin A3 Human genes 0.000 description 1
- 102100029647 Apoptosis-associated speck-like protein containing a CARD Human genes 0.000 description 1
- 108010036221 Aquaporin 2 Proteins 0.000 description 1
- 102100034414 Aquaporin-2 Human genes 0.000 description 1
- 102100029463 Aquaporin-8 Human genes 0.000 description 1
- 102100038105 Arpin Human genes 0.000 description 1
- 206010003210 Arteriosclerosis Diseases 0.000 description 1
- BSYNRYMUTXBXSQ-UHFFFAOYSA-N Aspirin Chemical compound CC(=O)OC1=CC=CC=C1C(O)=O BSYNRYMUTXBXSQ-UHFFFAOYSA-N 0.000 description 1
- 208000037260 Atherosclerotic Plaque Diseases 0.000 description 1
- 108091008875 B cell receptors Proteins 0.000 description 1
- 102100035526 B melanoma antigen 1 Human genes 0.000 description 1
- 108700009171 B-Cell Lymphoma 3 Proteins 0.000 description 1
- 102100021630 B-cell CLL/lymphoma 7 protein family member A Human genes 0.000 description 1
- 102100021570 B-cell lymphoma 3 protein Human genes 0.000 description 1
- 102100021631 B-cell lymphoma 6 protein Human genes 0.000 description 1
- 102100022983 B-cell lymphoma/leukemia 11B Human genes 0.000 description 1
- 230000003844 B-cell-activation Effects 0.000 description 1
- 101150072667 Bcl3 gene Proteins 0.000 description 1
- 102100027387 Beta-1,4-galactosyltransferase 5 Human genes 0.000 description 1
- 102100029945 Beta-galactoside alpha-2,6-sialyltransferase 1 Human genes 0.000 description 1
- 102100027990 Beta/gamma crystallin domain-containing protein 2 Human genes 0.000 description 1
- 102100035754 Biorientation of chromosomes in cell division protein 1-like 1 Human genes 0.000 description 1
- 241000283690 Bos taurus Species 0.000 description 1
- 102100027310 Bromodomain adjacent to zinc finger domain protein 1A Human genes 0.000 description 1
- 102100025371 Butyrophilin-like protein 8 Human genes 0.000 description 1
- 102100021714 Bystin Human genes 0.000 description 1
- 102100034673 C-C motif chemokine 3-like 1 Human genes 0.000 description 1
- 102100021411 C-terminal-binding protein 2 Human genes 0.000 description 1
- 102100026094 C-type lectin domain family 12 member A Human genes 0.000 description 1
- 102100026197 C-type lectin domain family 2 member D Human genes 0.000 description 1
- 108091058539 C10orf54 Proteins 0.000 description 1
- 102100025752 CASP8 and FADD-like apoptosis regulator Human genes 0.000 description 1
- 101150116295 CAT2 gene Proteins 0.000 description 1
- 102100034798 CCAAT/enhancer-binding protein beta Human genes 0.000 description 1
- 102100034799 CCAAT/enhancer-binding protein delta Human genes 0.000 description 1
- 210000001266 CD8-positive T-lymphocyte Anatomy 0.000 description 1
- 102100027221 CD81 antigen Human genes 0.000 description 1
- 102100030155 CDC42 small effector protein 2 Human genes 0.000 description 1
- 102100040531 CKLF-like MARVEL transmembrane domain-containing protein 2 Human genes 0.000 description 1
- 102100027098 CMP-N-acetylneuraminate-beta-galactosamide-alpha-2,3-sialyltransferase 1 Human genes 0.000 description 1
- 102100022436 CMRF35-like molecule 8 Human genes 0.000 description 1
- 102100022618 COMM domain-containing protein 6 Human genes 0.000 description 1
- 102000015347 COP1 Human genes 0.000 description 1
- 101100496114 Caenorhabditis elegans clc-2 gene Proteins 0.000 description 1
- 101100326920 Caenorhabditis elegans ctl-1 gene Proteins 0.000 description 1
- 102100032213 Calcium and integrin-binding family member 3 Human genes 0.000 description 1
- BHPQYMZQTOCNFJ-UHFFFAOYSA-N Calcium cation Chemical compound [Ca+2] BHPQYMZQTOCNFJ-UHFFFAOYSA-N 0.000 description 1
- 229940127291 Calcium channel antagonist Drugs 0.000 description 1
- 102100038597 Calcium homeostasis modulator protein 2 Human genes 0.000 description 1
- 102100023074 Calcium-activated potassium channel subunit beta-1 Human genes 0.000 description 1
- 102100021534 Calcium/calmodulin-dependent protein kinase kinase 2 Human genes 0.000 description 1
- 102100025926 Calmodulin-3 Human genes 0.000 description 1
- 102100029398 Calpain small subunit 1 Human genes 0.000 description 1
- 241000282465 Canis Species 0.000 description 1
- 101001110283 Canis lupus familiaris Ras-related C3 botulinum toxin substrate 1 Proteins 0.000 description 1
- 102100025472 Carcinoembryonic antigen-related cell adhesion molecule 4 Human genes 0.000 description 1
- 206010007559 Cardiac failure congestive Diseases 0.000 description 1
- 208000024172 Cardiovascular disease Diseases 0.000 description 1
- 102100025634 Caspase recruitment domain-containing protein 16 Human genes 0.000 description 1
- 102100025597 Caspase-4 Human genes 0.000 description 1
- 101710090333 Caspase-5 Proteins 0.000 description 1
- 102100037182 Cation-independent mannose-6-phosphate receptor Human genes 0.000 description 1
- 102100032346 Cell cycle progression protein 1 Human genes 0.000 description 1
- 102100034231 Cell surface A33 antigen Human genes 0.000 description 1
- 102100024175 Centriole, cilia and spindle-associated protein Human genes 0.000 description 1
- 206010050337 Cerumen impaction Diseases 0.000 description 1
- 108010012236 Chemokines Proteins 0.000 description 1
- 102000019034 Chemokines Human genes 0.000 description 1
- 102100038731 Chitinase-3-like protein 2 Human genes 0.000 description 1
- 102100034667 Chloride intracellular channel protein 1 Human genes 0.000 description 1
- 102100033687 Cilia- and flagella-associated protein 65 Human genes 0.000 description 1
- 102100034624 Cilia- and flagella-associated protein 97 Human genes 0.000 description 1
- KRKNYBCHXYNGOX-UHFFFAOYSA-K Citrate Chemical compound [O-]C(=O)CC(O)(CC([O-])=O)C([O-])=O KRKNYBCHXYNGOX-UHFFFAOYSA-K 0.000 description 1
- 102100034963 Coiled-coil domain-containing protein 167 Human genes 0.000 description 1
- 102100032355 Coiled-coil domain-containing protein 92 Human genes 0.000 description 1
- 102100024203 Collagen alpha-1(XIV) chain Human genes 0.000 description 1
- 206010056370 Congestive cardiomyopathy Diseases 0.000 description 1
- 102100040499 Contactin-associated protein-like 2 Human genes 0.000 description 1
- 102100027591 Copper-transporting ATPase 2 Human genes 0.000 description 1
- 102100041023 Coronin-2A Human genes 0.000 description 1
- JPVYNHNXODAKFH-UHFFFAOYSA-N Cu2+ Chemical compound [Cu+2] JPVYNHNXODAKFH-UHFFFAOYSA-N 0.000 description 1
- 108010049894 Cyclic AMP-Dependent Protein Kinases Proteins 0.000 description 1
- 102000008130 Cyclic AMP-Dependent Protein Kinases Human genes 0.000 description 1
- 102100027309 Cyclic AMP-responsive element-binding protein 5 Human genes 0.000 description 1
- 108010016788 Cyclin-Dependent Kinase Inhibitor p21 Proteins 0.000 description 1
- 102000004480 Cyclin-Dependent Kinase Inhibitor p57 Human genes 0.000 description 1
- 108010017222 Cyclin-Dependent Kinase Inhibitor p57 Proteins 0.000 description 1
- 102100033270 Cyclin-dependent kinase inhibitor 1 Human genes 0.000 description 1
- 102100034746 Cyclin-dependent kinase-like 5 Human genes 0.000 description 1
- 102100032756 Cysteine-rich protein 1 Human genes 0.000 description 1
- 102100038688 Cysteine-rich secretory protein LCCL domain-containing 2 Human genes 0.000 description 1
- 108010074922 Cytochrome P-450 CYP1A2 Proteins 0.000 description 1
- 102100026533 Cytochrome P450 1A2 Human genes 0.000 description 1
- 102100024902 Cytochrome P450 4F2 Human genes 0.000 description 1
- 102100024901 Cytochrome P450 4F3 Human genes 0.000 description 1
- 102100024899 Cytochrome P450 4F8 Human genes 0.000 description 1
- 102100031654 Cytochrome c oxidase subunit 6B2 Human genes 0.000 description 1
- 102100028202 Cytochrome c oxidase subunit 6C Human genes 0.000 description 1
- 102100039061 Cytokine receptor common subunit beta Human genes 0.000 description 1
- 102100037579 D-3-phosphoglycerate dehydrogenase Human genes 0.000 description 1
- 102100030418 DENN domain-containing protein 3 Human genes 0.000 description 1
- 102100038076 DNA dC->dU-editing enzyme APOBEC-3G Human genes 0.000 description 1
- 102100037373 DNA-(apurinic or apyrimidinic site) endonuclease Human genes 0.000 description 1
- 102100024762 DNA-binding death effector domain-containing protein 2 Human genes 0.000 description 1
- 102100022204 DNA-dependent protein kinase catalytic subunit Human genes 0.000 description 1
- 102100021429 DNA-directed RNA polymerase II subunit RPB1 Human genes 0.000 description 1
- 102100028472 DNA-directed RNA polymerases I, II, and III subunit RPABC5 Human genes 0.000 description 1
- 101100457345 Danio rerio mapk14a gene Proteins 0.000 description 1
- 101100457347 Danio rerio mapk14b gene Proteins 0.000 description 1
- 102100031602 Dedicator of cytokinesis protein 10 Human genes 0.000 description 1
- 102100024350 Dedicator of cytokinesis protein 8 Human genes 0.000 description 1
- 102100037699 Dehydrogenase/reductase SDR family member 7B Human genes 0.000 description 1
- 102100036503 Dehydrogenase/reductase SDR family member on chromosome X Human genes 0.000 description 1
- 102100025535 Delta(14)-sterol reductase TM7SF2 Human genes 0.000 description 1
- 102100040515 Delta(3,5)-Delta(2,4)-dienoyl-CoA isomerase, mitochondrial Human genes 0.000 description 1
- 102100030442 Derlin-3 Human genes 0.000 description 1
- 102100037124 Developmental pluripotency-associated 5 protein Human genes 0.000 description 1
- 102100024746 Dihydrofolate reductase Human genes 0.000 description 1
- 102100022317 Dihydropteridine reductase Human genes 0.000 description 1
- 102100037829 Docking protein 3 Human genes 0.000 description 1
- 102100029906 Dolichol-phosphate mannosyltransferase subunit 3 Human genes 0.000 description 1
- 102100032082 Dr1-associated corepressor Human genes 0.000 description 1
- 108010083068 Dual Oxidases Proteins 0.000 description 1
- 102100021217 Dual oxidase 2 Human genes 0.000 description 1
- 102100028944 Dual specificity protein phosphatase 13 isoform B Human genes 0.000 description 1
- 102100024673 Dual specificity protein phosphatase 3 Human genes 0.000 description 1
- 102100024749 Dynein light chain Tctex-type 1 Human genes 0.000 description 1
- 102100025032 Dynein regulatory complex protein 1 Human genes 0.000 description 1
- 102100025907 Dyslexia-associated protein KIAA0319-like protein Human genes 0.000 description 1
- 102100025800 E3 SUMO-protein ligase ZBED1 Human genes 0.000 description 1
- 102100021183 E3 ubiquitin-protein ligase RNF130 Human genes 0.000 description 1
- 102100039812 E3 ubiquitin-protein ligase RNF182 Human genes 0.000 description 1
- 102100029672 E3 ubiquitin-protein ligase TRIM7 Human genes 0.000 description 1
- 102100039639 E3 ubiquitin-protein ligase pellino homolog 1 Human genes 0.000 description 1
- 102100020960 E3 ubiquitin-protein transferase RMND5A Human genes 0.000 description 1
- KCXVZYZYPLLWCC-UHFFFAOYSA-N EDTA Chemical compound OC(=O)CN(CC(O)=O)CCN(CC(O)=O)CC(O)=O KCXVZYZYPLLWCC-UHFFFAOYSA-N 0.000 description 1
- 101150115146 EEF2 gene Proteins 0.000 description 1
- 102100029722 Ectonucleoside triphosphate diphosphohydrolase 1 Human genes 0.000 description 1
- 102100027262 Electron transfer flavoprotein subunit beta Human genes 0.000 description 1
- 102100031334 Elongation factor 2 Human genes 0.000 description 1
- 102100033238 Elongation factor Tu, mitochondrial Human genes 0.000 description 1
- 102000005593 Endopeptidases Human genes 0.000 description 1
- 108010059378 Endopeptidases Proteins 0.000 description 1
- 102100027117 Engulfment and cell motility protein 2 Human genes 0.000 description 1
- 102100030880 Enoyl-CoA hydratase domain-containing protein 3, mitochondrial Human genes 0.000 description 1
- 102100030146 Epithelial membrane protein 3 Human genes 0.000 description 1
- 102100021793 Epsilon-sarcoglycan Human genes 0.000 description 1
- 102100021469 Equilibrative nucleoside transporter 1 Human genes 0.000 description 1
- 241000283073 Equus caballus Species 0.000 description 1
- 241001125671 Eretmochelys imbricata Species 0.000 description 1
- LFQSCWFLJHTTHZ-UHFFFAOYSA-N Ethanol Chemical compound CCO LFQSCWFLJHTTHZ-UHFFFAOYSA-N 0.000 description 1
- 102100039408 Eukaryotic translation initiation factor 1A, X-chromosomal Human genes 0.000 description 1
- 102100029602 Eukaryotic translation initiation factor 4B Human genes 0.000 description 1
- 102100026761 Eukaryotic translation initiation factor 5A-1 Human genes 0.000 description 1
- 102100026976 Exocyst complex component 6 Human genes 0.000 description 1
- 102100026063 Exosome complex component MTR3 Human genes 0.000 description 1
- 102100026353 F-box-like/WD repeat-containing protein TBL1XR1 Human genes 0.000 description 1
- 102100037338 F-box/LRR-repeat protein 5 Human genes 0.000 description 1
- 102100040834 FXYD domain-containing ion transport regulator 5 Human genes 0.000 description 1
- 102100023636 FYVE, RhoGEF and PH domain-containing protein 4 Human genes 0.000 description 1
- 102100022366 Fatty acyl-CoA reductase 1 Human genes 0.000 description 1
- 241000282324 Felis Species 0.000 description 1
- 102100020760 Ferritin heavy chain Human genes 0.000 description 1
- 102100021066 Fibroblast growth factor receptor substrate 2 Human genes 0.000 description 1
- 102100021064 Fibroblast growth factor receptor substrate 3 Human genes 0.000 description 1
- 102100026545 Fibronectin type III domain-containing protein 3B Human genes 0.000 description 1
- 101710088570 Flagellar hook-associated protein 1 Proteins 0.000 description 1
- 102100035143 Folate receptor gamma Human genes 0.000 description 1
- 102100041006 Forkhead box protein J1 Human genes 0.000 description 1
- 102100028122 Forkhead box protein P1 Human genes 0.000 description 1
- 102100022629 Fructose-2,6-bisphosphatase Human genes 0.000 description 1
- 102100025353 G-protein coupled bile acid receptor 1 Human genes 0.000 description 1
- 102100031183 G-protein coupled receptor 37-like 1 Human genes 0.000 description 1
- 108700031835 GRB10 Adaptor Proteins 0.000 description 1
- 102100037121 GSK-3-binding protein FRAT2 Human genes 0.000 description 1
- 108010001498 Galectin 1 Proteins 0.000 description 1
- 102100021736 Galectin-1 Human genes 0.000 description 1
- 102100033296 Gamma-aminobutyric acid receptor-associated protein-like 1 Human genes 0.000 description 1
- 102100022951 Gamma-secretase subunit APH-1A Human genes 0.000 description 1
- 102100038073 General transcription factor II-I Human genes 0.000 description 1
- 102100041007 Glia maturation factor gamma Human genes 0.000 description 1
- 102100039611 Glutamine synthetase Human genes 0.000 description 1
- 102100029846 Glutaminyl-peptide cyclotransferase Human genes 0.000 description 1
- 102100025945 Glutaredoxin-1 Human genes 0.000 description 1
- 102100030943 Glutathione S-transferase P Human genes 0.000 description 1
- 102100023541 Glutathione S-transferase omega-1 Human genes 0.000 description 1
- 102100038055 Glutathione S-transferase theta-1 Human genes 0.000 description 1
- 102100036669 Glycerol-3-phosphate dehydrogenase [NAD(+)], cytoplasmic Human genes 0.000 description 1
- 102100029481 Glycogen phosphorylase, liver form Human genes 0.000 description 1
- 102100039280 Glycogenin-1 Human genes 0.000 description 1
- 102100023122 Glycylpeptide N-tetradecanoyltransferase 2 Human genes 0.000 description 1
- 102100034190 Glypican-1 Human genes 0.000 description 1
- 102100031488 Golgi-associated plant pathogenesis-related protein 1 Human genes 0.000 description 1
- 102100028113 Granulocyte-macrophage colony-stimulating factor receptor subunit alpha Human genes 0.000 description 1
- 102100038395 Granzyme K Human genes 0.000 description 1
- 101150090959 Grb10 gene Proteins 0.000 description 1
- 102100028491 Growth arrest and DNA damage-inducible proteins-interacting protein 1 Human genes 0.000 description 1
- 102100023910 Growth factor receptor-bound protein 10 Human genes 0.000 description 1
- 102100040579 Guanidinoacetate N-methyltransferase Human genes 0.000 description 1
- 102100034192 Guanine nucleotide exchange factor MSS4 Human genes 0.000 description 1
- 102100035354 Guanine nucleotide-binding protein G(I)/G(S)/G(T) subunit beta-1 Human genes 0.000 description 1
- NYHBQMYGNKIUIF-UUOKFMHZSA-N Guanosine Chemical compound C1=NC=2C(=O)NC(N)=NC=2N1[C@@H]1O[C@H](CO)[C@@H](O)[C@H]1O NYHBQMYGNKIUIF-UUOKFMHZSA-N 0.000 description 1
- 102100028541 Guanylate-binding protein 2 Human genes 0.000 description 1
- 108091059596 H3F3A Proteins 0.000 description 1
- 102100028970 HLA class I histocompatibility antigen, alpha chain E Human genes 0.000 description 1
- 102100028966 HLA class I histocompatibility antigen, alpha chain F Human genes 0.000 description 1
- 102100028640 HLA class II histocompatibility antigen, DR beta 5 chain Human genes 0.000 description 1
- 108010016996 HLA-DRB5 Chains Proteins 0.000 description 1
- 206010019280 Heart failures Diseases 0.000 description 1
- 102100040352 Heat shock 70 kDa protein 1A Human genes 0.000 description 1
- 102100027529 Heat shock factor-binding protein 1 Human genes 0.000 description 1
- 102100031963 Heme-binding protein 2 Human genes 0.000 description 1
- 102100031017 Hepatoma-derived growth factor-like protein 1 Human genes 0.000 description 1
- 102100028896 Heterogeneous nuclear ribonucleoprotein Q Human genes 0.000 description 1
- 102100024227 High affinity cGMP-specific 3',5'-cyclic phosphodiesterase 9A Human genes 0.000 description 1
- 102100038006 High affinity immunoglobulin epsilon receptor subunit alpha Human genes 0.000 description 1
- 102100022128 High mobility group protein B2 Human genes 0.000 description 1
- 102100039849 Histone H2A type 1 Human genes 0.000 description 1
- 102100039266 Histone H2A type 1-B/E Human genes 0.000 description 1
- 102100039265 Histone H2A type 1-C Human genes 0.000 description 1
- 102100039269 Histone H2A type 1-J Human genes 0.000 description 1
- 102100027363 Histone H2A type 2-C Human genes 0.000 description 1
- 102100023919 Histone H2A.Z Human genes 0.000 description 1
- 102100030690 Histone H2B type 1-C/E/F/G/I Human genes 0.000 description 1
- 102100021454 Histone deacetylase 4 Human genes 0.000 description 1
- 102100023357 Histone deacetylase complex subunit SAP30 Human genes 0.000 description 1
- 102100025061 Homeobox protein Hox-B7 Human genes 0.000 description 1
- 102100023603 Homer protein homolog 3 Human genes 0.000 description 1
- 101000691569 Homo sapiens 1-acyl-sn-glycerol-3-phosphate acyltransferase epsilon Proteins 0.000 description 1
- 101000929840 Homo sapiens 1-acylglycerol-3-phosphate O-acyltransferase ABHD5 Proteins 0.000 description 1
- 101000964898 Homo sapiens 14-3-3 protein zeta/delta Proteins 0.000 description 1
- 101001136717 Homo sapiens 26S proteasome non-ATPase regulatory subunit 8 Proteins 0.000 description 1
- 101001107013 Homo sapiens 39S ribosomal protein L53, mitochondrial Proteins 0.000 description 1
- 101001119189 Homo sapiens 40S ribosomal protein S10 Proteins 0.000 description 1
- 101000623543 Homo sapiens 40S ribosomal protein S15 Proteins 0.000 description 1
- 101001097814 Homo sapiens 40S ribosomal protein S21 Proteins 0.000 description 1
- 101000678466 Homo sapiens 40S ribosomal protein S27 Proteins 0.000 description 1
- 101000623076 Homo sapiens 40S ribosomal protein S28 Proteins 0.000 description 1
- 101000732165 Homo sapiens 40S ribosomal protein S4, X isoform Proteins 0.000 description 1
- 101001074389 Homo sapiens 5'-3' exonuclease PLD3 Proteins 0.000 description 1
- 101001066900 Homo sapiens 5'-deoxynucleotidase HDDC2 Proteins 0.000 description 1
- 101001083755 Homo sapiens 5-aminolevulinate synthase, erythroid-specific, mitochondrial Proteins 0.000 description 1
- 101000755323 Homo sapiens 60S ribosomal protein L10a Proteins 0.000 description 1
- 101000682512 Homo sapiens 60S ribosomal protein L17 Proteins 0.000 description 1
- 101000752293 Homo sapiens 60S ribosomal protein L18a Proteins 0.000 description 1
- 101001097555 Homo sapiens 60S ribosomal protein L22 Proteins 0.000 description 1
- 101001113162 Homo sapiens 60S ribosomal protein L31 Proteins 0.000 description 1
- 101001127203 Homo sapiens 60S ribosomal protein L36a Proteins 0.000 description 1
- 101001127258 Homo sapiens 60S ribosomal protein L36a-like Proteins 0.000 description 1
- 101000671735 Homo sapiens 60S ribosomal protein L37 Proteins 0.000 description 1
- 101000716179 Homo sapiens 60S ribosomal protein L39 Proteins 0.000 description 1
- 101000853659 Homo sapiens 60S ribosomal protein L8 Proteins 0.000 description 1
- 101000794082 Homo sapiens ADP-ribosyl cyclase/cyclic ADP-ribose hydrolase 2 Proteins 0.000 description 1
- 101000974511 Homo sapiens ADP-ribosylation factor-like protein 17 Proteins 0.000 description 1
- 101000768016 Homo sapiens AP-1 complex subunit sigma-2 Proteins 0.000 description 1
- 101000792947 Homo sapiens AT-rich interactive domain-containing protein 5B Proteins 0.000 description 1
- 101000766510 Homo sapiens ATP synthase subunit delta, mitochondrial Proteins 0.000 description 1
- 101000722210 Homo sapiens ATP-dependent DNA helicase DDX11 Proteins 0.000 description 1
- 101000870664 Homo sapiens ATP-dependent RNA helicase DDX3Y Proteins 0.000 description 1
- 101001047184 Homo sapiens ATP-sensitive inward rectifier potassium channel 15 Proteins 0.000 description 1
- 101000901109 Homo sapiens Achaete-scute homolog 2 Proteins 0.000 description 1
- 101001060527 Homo sapiens Acidic fibroblast growth factor intracellular-binding protein Proteins 0.000 description 1
- 101000965314 Homo sapiens Aconitate hydratase, mitochondrial Proteins 0.000 description 1
- 101000783802 Homo sapiens Actin-binding LIM protein 1 Proteins 0.000 description 1
- 101000809459 Homo sapiens Actin-related protein 2/3 complex subunit 1B Proteins 0.000 description 1
- 101000937269 Homo sapiens Activin receptor type-2B Proteins 0.000 description 1
- 101000755474 Homo sapiens Activity-dependent neuroprotector homeobox protein Proteins 0.000 description 1
- 101000798584 Homo sapiens Acylamino-acid-releasing enzyme Proteins 0.000 description 1
- 101000889541 Homo sapiens Acyloxyacyl hydrolase Proteins 0.000 description 1
- 101000889392 Homo sapiens Adenine nucleotide translocase lysine N-methyltransferase Proteins 0.000 description 1
- 101000610215 Homo sapiens Adenylyl-sulfate kinase Proteins 0.000 description 1
- 101000718235 Homo sapiens Adhesion G protein-coupled receptor E3 Proteins 0.000 description 1
- 101000959600 Homo sapiens Adhesion G-protein coupled receptor G5 Proteins 0.000 description 1
- 101000684373 Homo sapiens Adipocyte plasma membrane-associated protein Proteins 0.000 description 1
- 101000703721 Homo sapiens Alpha-N-acetylgalactosaminide alpha-2,6-sialyltransferase 3 Proteins 0.000 description 1
- 101000615966 Homo sapiens Alpha-mannosidase 2x Proteins 0.000 description 1
- 101000742837 Homo sapiens Alpha/beta hydrolase domain-containing protein 17A Proteins 0.000 description 1
- 101000891247 Homo sapiens Ameloblastin Proteins 0.000 description 1
- 101000928670 Homo sapiens Amyloid beta precursor protein binding family B member 1 Proteins 0.000 description 1
- 101000928677 Homo sapiens Amyloid-beta A4 precursor protein-binding family A member 2 Proteins 0.000 description 1
- 101000924474 Homo sapiens Annexin A2 Proteins 0.000 description 1
- 101000924454 Homo sapiens Annexin A3 Proteins 0.000 description 1
- 101000728679 Homo sapiens Apoptosis-associated speck-like protein containing a CARD Proteins 0.000 description 1
- 101000771417 Homo sapiens Aquaporin-8 Proteins 0.000 description 1
- 101000884441 Homo sapiens Arpin Proteins 0.000 description 1
- 101000874316 Homo sapiens B melanoma antigen 1 Proteins 0.000 description 1
- 101000971230 Homo sapiens B-cell CLL/lymphoma 7 protein family member A Proteins 0.000 description 1
- 101000971234 Homo sapiens B-cell lymphoma 6 protein Proteins 0.000 description 1
- 101000937496 Homo sapiens Beta-1,4-galactosyltransferase 5 Proteins 0.000 description 1
- 101000959437 Homo sapiens Beta-2 adrenergic receptor Proteins 0.000 description 1
- 101000863864 Homo sapiens Beta-galactoside alpha-2,6-sialyltransferase 1 Proteins 0.000 description 1
- 101000859450 Homo sapiens Beta/gamma crystallin domain-containing protein 2 Proteins 0.000 description 1
- 101000874052 Homo sapiens Biorientation of chromosomes in cell division protein 1-like 1 Proteins 0.000 description 1
- 101000933364 Homo sapiens Brain protein I3 Proteins 0.000 description 1
- 101000937778 Homo sapiens Bromodomain adjacent to zinc finger domain protein 1A Proteins 0.000 description 1
- 101000934742 Homo sapiens Butyrophilin-like protein 8 Proteins 0.000 description 1
- 101000896419 Homo sapiens Bystin Proteins 0.000 description 1
- 101000946370 Homo sapiens C-C motif chemokine 3-like 1 Proteins 0.000 description 1
- 101000912622 Homo sapiens C-type lectin domain family 12 member A Proteins 0.000 description 1
- 101000912615 Homo sapiens C-type lectin domain family 2 member D Proteins 0.000 description 1
- 101000914211 Homo sapiens CASP8 and FADD-like apoptosis regulator Proteins 0.000 description 1
- 101000945426 Homo sapiens CB1 cannabinoid receptor-interacting protein 1 Proteins 0.000 description 1
- 101000945963 Homo sapiens CCAAT/enhancer-binding protein beta Proteins 0.000 description 1
- 101000945965 Homo sapiens CCAAT/enhancer-binding protein delta Proteins 0.000 description 1
- 101000914479 Homo sapiens CD81 antigen Proteins 0.000 description 1
- 101000794294 Homo sapiens CDC42 small effector protein 2 Proteins 0.000 description 1
- 101000749427 Homo sapiens CKLF-like MARVEL transmembrane domain-containing protein 2 Proteins 0.000 description 1
- 101000836774 Homo sapiens CMP-N-acetylneuraminate-beta-galactosamide-alpha-2,3-sialyltransferase 1 Proteins 0.000 description 1
- 101000901669 Homo sapiens CMRF35-like molecule 8 Proteins 0.000 description 1
- 101000899991 Homo sapiens COMM domain-containing protein 6 Proteins 0.000 description 1
- 101000943458 Homo sapiens Calcium and integrin-binding family member 3 Proteins 0.000 description 1
- 101000741349 Homo sapiens Calcium homeostasis modulator protein 2 Proteins 0.000 description 1
- 101001049849 Homo sapiens Calcium-activated potassium channel subunit beta-1 Proteins 0.000 description 1
- 101000971617 Homo sapiens Calcium/calmodulin-dependent protein kinase kinase 2 Proteins 0.000 description 1
- 101000933777 Homo sapiens Calmodulin-3 Proteins 0.000 description 1
- 101000919194 Homo sapiens Calpain small subunit 1 Proteins 0.000 description 1
- 101000914325 Homo sapiens Carcinoembryonic antigen-related cell adhesion molecule 4 Proteins 0.000 description 1
- 101000933112 Homo sapiens Caspase-4 Proteins 0.000 description 1
- 101001028831 Homo sapiens Cation-independent mannose-6-phosphate receptor Proteins 0.000 description 1
- 101000868629 Homo sapiens Cell cycle progression protein 1 Proteins 0.000 description 1
- 101000996823 Homo sapiens Cell surface A33 antigen Proteins 0.000 description 1
- 101000980796 Homo sapiens Centriole, cilia and spindle-associated protein Proteins 0.000 description 1
- 101000883325 Homo sapiens Chitinase-3-like protein 2 Proteins 0.000 description 1
- 101000946430 Homo sapiens Chloride intracellular channel protein 1 Proteins 0.000 description 1
- 101000944485 Homo sapiens Cilia- and flagella-associated protein 65 Proteins 0.000 description 1
- 101000710072 Homo sapiens Cilia- and flagella-associated protein 97 Proteins 0.000 description 1
- 101000946681 Homo sapiens Coiled-coil domain-containing protein 167 Proteins 0.000 description 1
- 101000797732 Homo sapiens Coiled-coil domain-containing protein 92 Proteins 0.000 description 1
- 101000909626 Homo sapiens Collagen alpha-1(XIV) chain Proteins 0.000 description 1
- 101000749877 Homo sapiens Contactin-associated protein-like 2 Proteins 0.000 description 1
- 101000936280 Homo sapiens Copper-transporting ATPase 2 Proteins 0.000 description 1
- 101000748858 Homo sapiens Coronin-2A Proteins 0.000 description 1
- 101000726193 Homo sapiens Cyclic AMP-responsive element-binding protein 5 Proteins 0.000 description 1
- 101000945692 Homo sapiens Cyclin-dependent kinase-like 5 Proteins 0.000 description 1
- 101000942084 Homo sapiens Cysteine-rich protein 1 Proteins 0.000 description 1
- 101000957715 Homo sapiens Cysteine-rich secretory protein LCCL domain-containing 2 Proteins 0.000 description 1
- 101000909122 Homo sapiens Cytochrome P450 4F2 Proteins 0.000 description 1
- 101000909121 Homo sapiens Cytochrome P450 4F3 Proteins 0.000 description 1
- 101000909112 Homo sapiens Cytochrome P450 4F8 Proteins 0.000 description 1
- 101000922370 Homo sapiens Cytochrome c oxidase subunit 6B2 Proteins 0.000 description 1
- 101000861049 Homo sapiens Cytochrome c oxidase subunit 6C Proteins 0.000 description 1
- 101001033280 Homo sapiens Cytokine receptor common subunit beta Proteins 0.000 description 1
- 101000739890 Homo sapiens D-3-phosphoglycerate dehydrogenase Proteins 0.000 description 1
- 101000842747 Homo sapiens DENN domain-containing protein 3 Proteins 0.000 description 1
- 101000830366 Homo sapiens DNA-binding death effector domain-containing protein 2 Proteins 0.000 description 1
- 101000619536 Homo sapiens DNA-dependent protein kinase catalytic subunit Proteins 0.000 description 1
- 101001106401 Homo sapiens DNA-directed RNA polymerase II subunit RPB1 Proteins 0.000 description 1
- 101000723805 Homo sapiens DNA-directed RNA polymerases I, II, and III subunit RPABC5 Proteins 0.000 description 1
- 101000866268 Homo sapiens Dedicator of cytokinesis protein 10 Proteins 0.000 description 1
- 101001052946 Homo sapiens Dedicator of cytokinesis protein 8 Proteins 0.000 description 1
- 101000880879 Homo sapiens Dehydrogenase/reductase SDR family member 7B Proteins 0.000 description 1
- 101000928743 Homo sapiens Dehydrogenase/reductase SDR family member on chromosome X Proteins 0.000 description 1
- 101001056901 Homo sapiens Delta(14)-sterol reductase TM7SF2 Proteins 0.000 description 1
- 101000966982 Homo sapiens Delta(3,5)-Delta(2,4)-dienoyl-CoA isomerase, mitochondrial Proteins 0.000 description 1
- 101000842622 Homo sapiens Derlin-3 Proteins 0.000 description 1
- 101000881848 Homo sapiens Developmental pluripotency-associated 5 protein Proteins 0.000 description 1
- 101000902365 Homo sapiens Dihydropteridine reductase Proteins 0.000 description 1
- 101000805167 Homo sapiens Docking protein 3 Proteins 0.000 description 1
- 101000864172 Homo sapiens Dolichol-phosphate mannosyltransferase subunit 3 Proteins 0.000 description 1
- 101000638315 Homo sapiens Dr1-associated corepressor Proteins 0.000 description 1
- 101000838551 Homo sapiens Dual specificity protein phosphatase 13 isoform A Proteins 0.000 description 1
- 101000838549 Homo sapiens Dual specificity protein phosphatase 13 isoform B Proteins 0.000 description 1
- 101000908482 Homo sapiens Dual specificity protein phosphatase 3 Proteins 0.000 description 1
- 101000908688 Homo sapiens Dynein light chain Tctex-type 1 Proteins 0.000 description 1
- 101000908373 Homo sapiens Dynein regulatory complex protein 1 Proteins 0.000 description 1
- 101001076904 Homo sapiens Dyslexia-associated protein KIAA0319-like protein Proteins 0.000 description 1
- 101000786317 Homo sapiens E3 SUMO-protein ligase ZBED1 Proteins 0.000 description 1
- 101000667703 Homo sapiens E3 ubiquitin-protein ligase RNF182 Proteins 0.000 description 1
- 101000795296 Homo sapiens E3 ubiquitin-protein ligase TRIM7 Proteins 0.000 description 1
- 101000606708 Homo sapiens E3 ubiquitin-protein ligase pellino homolog 1 Proteins 0.000 description 1
- 101001012447 Homo sapiens Ectonucleoside triphosphate diphosphohydrolase 1 Proteins 0.000 description 1
- 101001057122 Homo sapiens Electron transfer flavoprotein subunit beta Proteins 0.000 description 1
- 101001057855 Homo sapiens Engulfment and cell motility protein 2 Proteins 0.000 description 1
- 101000919891 Homo sapiens Enoyl-CoA hydratase domain-containing protein 3, mitochondrial Proteins 0.000 description 1
- 101001011788 Homo sapiens Epithelial membrane protein 3 Proteins 0.000 description 1
- 101000616437 Homo sapiens Epsilon-sarcoglycan Proteins 0.000 description 1
- 101001036349 Homo sapiens Eukaryotic translation initiation factor 1A, X-chromosomal Proteins 0.000 description 1
- 101000840282 Homo sapiens Eukaryotic translation initiation factor 4B Proteins 0.000 description 1
- 101001054354 Homo sapiens Eukaryotic translation initiation factor 5A-1 Proteins 0.000 description 1
- 101000866606 Homo sapiens Excitatory amino acid transporter 5 Proteins 0.000 description 1
- 101000911670 Homo sapiens Exocyst complex component 6 Proteins 0.000 description 1
- 101001055984 Homo sapiens Exosome complex component MTR3 Proteins 0.000 description 1
- 101000835675 Homo sapiens F-box-like/WD repeat-containing protein TBL1XR1 Proteins 0.000 description 1
- 101001026853 Homo sapiens F-box/LRR-repeat protein 5 Proteins 0.000 description 1
- 101000893718 Homo sapiens FXYD domain-containing ion transport regulator 5 Proteins 0.000 description 1
- 101000827819 Homo sapiens FYVE, RhoGEF and PH domain-containing protein 4 Proteins 0.000 description 1
- 101000824458 Homo sapiens Fatty acyl-CoA reductase 1 Proteins 0.000 description 1
- 101001002987 Homo sapiens Ferritin heavy chain Proteins 0.000 description 1
- 101000818410 Homo sapiens Fibroblast growth factor receptor substrate 2 Proteins 0.000 description 1
- 101000818396 Homo sapiens Fibroblast growth factor receptor substrate 3 Proteins 0.000 description 1
- 101000913642 Homo sapiens Fibronectin type III domain-containing protein 3B Proteins 0.000 description 1
- 101001023202 Homo sapiens Folate receptor gamma Proteins 0.000 description 1
- 101000892910 Homo sapiens Forkhead box protein J1 Proteins 0.000 description 1
- 101001059893 Homo sapiens Forkhead box protein P1 Proteins 0.000 description 1
- 101000823463 Homo sapiens Fructose-2,6-bisphosphatase Proteins 0.000 description 1
- 101000857733 Homo sapiens G-protein coupled bile acid receptor 1 Proteins 0.000 description 1
- 101001066101 Homo sapiens G-protein coupled receptor 37-like 1 Proteins 0.000 description 1
- 101001099051 Homo sapiens GPI inositol-deacylase Proteins 0.000 description 1
- 101001029171 Homo sapiens GSK-3-binding protein FRAT2 Proteins 0.000 description 1
- 101000574654 Homo sapiens GTP-binding protein Rit1 Proteins 0.000 description 1
- 101000926844 Homo sapiens Gamma-aminobutyric acid receptor-associated protein-like 1 Proteins 0.000 description 1
- 101000757496 Homo sapiens Gamma-secretase subunit APH-1A Proteins 0.000 description 1
- 101001032427 Homo sapiens General transcription factor II-I Proteins 0.000 description 1
- 101001039458 Homo sapiens Glia maturation factor gamma Proteins 0.000 description 1
- 101000888841 Homo sapiens Glutamine synthetase Proteins 0.000 description 1
- 101000585315 Homo sapiens Glutaminyl-peptide cyclotransferase Proteins 0.000 description 1
- 101000856983 Homo sapiens Glutaredoxin-1 Proteins 0.000 description 1
- 101001010139 Homo sapiens Glutathione S-transferase P Proteins 0.000 description 1
- 101000906386 Homo sapiens Glutathione S-transferase omega-1 Proteins 0.000 description 1
- 101001032462 Homo sapiens Glutathione S-transferase theta-1 Proteins 0.000 description 1
- 101001072574 Homo sapiens Glycerol-3-phosphate dehydrogenase [NAD(+)], cytoplasmic Proteins 0.000 description 1
- 101000700616 Homo sapiens Glycogen phosphorylase, liver form Proteins 0.000 description 1
- 101000888201 Homo sapiens Glycogenin-1 Proteins 0.000 description 1
- 101000979544 Homo sapiens Glycylpeptide N-tetradecanoyltransferase 2 Proteins 0.000 description 1
- 101001070736 Homo sapiens Glypican-1 Proteins 0.000 description 1
- 101000922994 Homo sapiens Golgi-associated plant pathogenesis-related protein 1 Proteins 0.000 description 1
- 101000916625 Homo sapiens Granulocyte-macrophage colony-stimulating factor receptor subunit alpha Proteins 0.000 description 1
- 101001033007 Homo sapiens Granzyme K Proteins 0.000 description 1
- 101001061336 Homo sapiens Growth arrest and DNA damage-inducible proteins-interacting protein 1 Proteins 0.000 description 1
- 101000893897 Homo sapiens Guanidinoacetate N-methyltransferase Proteins 0.000 description 1
- 101001134268 Homo sapiens Guanine nucleotide exchange factor MSS4 Proteins 0.000 description 1
- 101001024316 Homo sapiens Guanine nucleotide-binding protein G(I)/G(S)/G(T) subunit beta-1 Proteins 0.000 description 1
- 101001058858 Homo sapiens Guanylate-binding protein 2 Proteins 0.000 description 1
- 101000986085 Homo sapiens HLA class I histocompatibility antigen, alpha chain E Proteins 0.000 description 1
- 101000986080 Homo sapiens HLA class I histocompatibility antigen, alpha chain F Proteins 0.000 description 1
- 101001037759 Homo sapiens Heat shock 70 kDa protein 1A Proteins 0.000 description 1
- 101001080298 Homo sapiens Heat shock factor-binding protein 1 Proteins 0.000 description 1
- 101000843836 Homo sapiens Heme-binding protein 2 Proteins 0.000 description 1
- 101001083786 Homo sapiens Hepatoma-derived growth factor-like protein 1 Proteins 0.000 description 1
- 101000839069 Homo sapiens Heterogeneous nuclear ribonucleoprotein Q Proteins 0.000 description 1
- 101001117259 Homo sapiens High affinity cGMP-specific 3',5'-cyclic phosphodiesterase 9A Proteins 0.000 description 1
- 101000878611 Homo sapiens High affinity immunoglobulin epsilon receptor subunit alpha Proteins 0.000 description 1
- 101001045791 Homo sapiens High mobility group protein B2 Proteins 0.000 description 1
- 101001035431 Homo sapiens Histone H2A type 1 Proteins 0.000 description 1
- 101001036111 Homo sapiens Histone H2A type 1-B/E Proteins 0.000 description 1
- 101001036109 Homo sapiens Histone H2A type 1-C Proteins 0.000 description 1
- 101001036102 Homo sapiens Histone H2A type 1-J Proteins 0.000 description 1
- 101001009465 Homo sapiens Histone H2A type 2-C Proteins 0.000 description 1
- 101000905054 Homo sapiens Histone H2A.Z Proteins 0.000 description 1
- 101001084682 Homo sapiens Histone H2B type 1-C/E/F/G/I Proteins 0.000 description 1
- 101000899259 Homo sapiens Histone deacetylase 4 Proteins 0.000 description 1
- 101000686001 Homo sapiens Histone deacetylase complex subunit SAP30 Proteins 0.000 description 1
- 101001077539 Homo sapiens Homeobox protein Hox-B7 Proteins 0.000 description 1
- 101001048461 Homo sapiens Homer protein homolog 3 Proteins 0.000 description 1
- 101001042781 Homo sapiens Hydroxysteroid dehydrogenase-like protein 2 Proteins 0.000 description 1
- 101000913082 Homo sapiens IgGFc-binding protein Proteins 0.000 description 1
- 101000878602 Homo sapiens Immunoglobulin alpha Fc receptor Proteins 0.000 description 1
- 101000809239 Homo sapiens Inactive ubiquitin carboxyl-terminal hydrolase 53 Proteins 0.000 description 1
- 101001056180 Homo sapiens Induced myeloid leukemia cell differentiation protein Mcl-1 Proteins 0.000 description 1
- 101001044118 Homo sapiens Inosine-5'-monophosphate dehydrogenase 1 Proteins 0.000 description 1
- 101001044094 Homo sapiens Inositol monophosphatase 2 Proteins 0.000 description 1
- 101001011393 Homo sapiens Interferon regulatory factor 2 Proteins 0.000 description 1
- 101001011441 Homo sapiens Interferon regulatory factor 4 Proteins 0.000 description 1
- 101000926535 Homo sapiens Interferon-induced, double-stranded RNA-activated protein kinase Proteins 0.000 description 1
- 101001057504 Homo sapiens Interferon-stimulated gene 20 kDa protein Proteins 0.000 description 1
- 101001076422 Homo sapiens Interleukin-1 receptor type 2 Proteins 0.000 description 1
- 101000977768 Homo sapiens Interleukin-1 receptor-associated kinase 3 Proteins 0.000 description 1
- 101001003147 Homo sapiens Interleukin-11 receptor subunit alpha Proteins 0.000 description 1
- 101001003135 Homo sapiens Interleukin-13 receptor subunit alpha-1 Proteins 0.000 description 1
- 101000961065 Homo sapiens Interleukin-18 receptor 1 Proteins 0.000 description 1
- 101000852980 Homo sapiens Interleukin-23 subunit alpha Proteins 0.000 description 1
- 101000975509 Homo sapiens Jun dimerization protein 2 Proteins 0.000 description 1
- 101001050318 Homo sapiens Junctional adhesion molecule-like Proteins 0.000 description 1
- 101001045824 Homo sapiens Kelch-like protein 3 Proteins 0.000 description 1
- 101000971533 Homo sapiens Killer cell lectin-like receptor subfamily G member 1 Proteins 0.000 description 1
- 101001137642 Homo sapiens Kinase suppressor of Ras 1 Proteins 0.000 description 1
- 101001006886 Homo sapiens Krueppel-like factor 12 Proteins 0.000 description 1
- 101001139126 Homo sapiens Krueppel-like factor 6 Proteins 0.000 description 1
- 101001042354 Homo sapiens LIM and senescent cell antigen-like-containing domain protein 2 Proteins 0.000 description 1
- 101001054649 Homo sapiens Latent-transforming growth factor beta-binding protein 2 Proteins 0.000 description 1
- 101001054646 Homo sapiens Latent-transforming growth factor beta-binding protein 3 Proteins 0.000 description 1
- 101000941865 Homo sapiens Leucine-rich repeat neuronal protein 3 Proteins 0.000 description 1
- 101000777628 Homo sapiens Leukocyte antigen CD37 Proteins 0.000 description 1
- 101001010513 Homo sapiens Leukocyte elastase inhibitor Proteins 0.000 description 1
- 101000984197 Homo sapiens Leukocyte immunoglobulin-like receptor subfamily A member 2 Proteins 0.000 description 1
- 101000984192 Homo sapiens Leukocyte immunoglobulin-like receptor subfamily B member 3 Proteins 0.000 description 1
- 101001065658 Homo sapiens Leukocyte-specific transcript 1 protein Proteins 0.000 description 1
- 101000799318 Homo sapiens Long-chain-fatty-acid-CoA ligase 1 Proteins 0.000 description 1
- 101001137987 Homo sapiens Lymphocyte activation gene 3 protein Proteins 0.000 description 1
- 101001063392 Homo sapiens Lymphocyte function-associated antigen 3 Proteins 0.000 description 1
- 101001098256 Homo sapiens Lysophospholipase Proteins 0.000 description 1
- 101000597817 Homo sapiens Lysoplasmalogenase-like protein TMEM86A Proteins 0.000 description 1
- 101000634835 Homo sapiens M1-specific T cell receptor alpha chain Proteins 0.000 description 1
- 101001051810 Homo sapiens MORC family CW-type zinc finger protein 3 Proteins 0.000 description 1
- 101000969827 Homo sapiens Maestro heat-like repeat-containing protein family member 1 Proteins 0.000 description 1
- 101000575041 Homo sapiens Male-enhanced antigen 1 Proteins 0.000 description 1
- 101001052076 Homo sapiens Maltase-glucoamylase Proteins 0.000 description 1
- 101000615941 Homo sapiens Mannosyl-oligosaccharide 1,2-alpha-mannosidase IC Proteins 0.000 description 1
- 101000962483 Homo sapiens Max dimerization protein 1 Proteins 0.000 description 1
- 101001057158 Homo sapiens Melanoma-associated antigen D1 Proteins 0.000 description 1
- 101001057154 Homo sapiens Melanoma-associated antigen D2 Proteins 0.000 description 1
- 101001057135 Homo sapiens Melanoma-associated antigen H1 Proteins 0.000 description 1
- 101001116751 Homo sapiens Methionine-R-sulfoxide reductase B1 Proteins 0.000 description 1
- 101000578920 Homo sapiens Microtubule-actin cross-linking factor 1, isoforms 1/2/3/5 Proteins 0.000 description 1
- 101001018270 Homo sapiens Mitochondrial amidoxime-reducing component 1 Proteins 0.000 description 1
- 101001018141 Homo sapiens Mitogen-activated protein kinase kinase kinase 2 Proteins 0.000 description 1
- 101001018145 Homo sapiens Mitogen-activated protein kinase kinase kinase 3 Proteins 0.000 description 1
- 101001059984 Homo sapiens Mitogen-activated protein kinase kinase kinase kinase 4 Proteins 0.000 description 1
- 101001011663 Homo sapiens Mixed lineage kinase domain-like protein Proteins 0.000 description 1
- 101000969594 Homo sapiens Modulator of apoptosis 1 Proteins 0.000 description 1
- 101000929655 Homo sapiens Monoacylglycerol lipase ABHD2 Proteins 0.000 description 1
- 101000623712 Homo sapiens Motile sperm domain-containing protein 2 Proteins 0.000 description 1
- 101001133091 Homo sapiens Mucin-20 Proteins 0.000 description 1
- 101000955275 Homo sapiens Multiple epidermal growth factor-like domains protein 10 Proteins 0.000 description 1
- 101000577891 Homo sapiens Myeloid cell nuclear differentiation antigen Proteins 0.000 description 1
- 101001128460 Homo sapiens Myosin light polypeptide 6 Proteins 0.000 description 1
- 101000990985 Homo sapiens Myosin regulatory light chain 12B Proteins 0.000 description 1
- 101000990929 Homo sapiens Myosin regulatory light chain 2, skeletal muscle isoform Proteins 0.000 description 1
- 101000588964 Homo sapiens Myosin-14 Proteins 0.000 description 1
- 101000958744 Homo sapiens Myosin-7B Proteins 0.000 description 1
- 101000584362 Homo sapiens Myosin-binding protein H Proteins 0.000 description 1
- 101001128623 Homo sapiens NADH dehydrogenase [ubiquinone] 1 beta subcomplex subunit 3 Proteins 0.000 description 1
- 101000979227 Homo sapiens NADH dehydrogenase [ubiquinone] iron-sulfur protein 7, mitochondrial Proteins 0.000 description 1
- 101000636705 Homo sapiens NADH dehydrogenase [ubiquinone] iron-sulfur protein 8, mitochondrial Proteins 0.000 description 1
- 101001109503 Homo sapiens NKG2-C type II integral membrane protein Proteins 0.000 description 1
- 101000581940 Homo sapiens Napsin-A Proteins 0.000 description 1
- 101000973264 Homo sapiens Neuferricin Proteins 0.000 description 1
- 101000979122 Homo sapiens Neurensin-2 Proteins 0.000 description 1
- 101001024599 Homo sapiens Neuroblastoma breakpoint family member 11 Proteins 0.000 description 1
- 101000929203 Homo sapiens Neutrophil defensin 4 Proteins 0.000 description 1
- 101000583239 Homo sapiens Nicotinate-nucleotide pyrophosphorylase [carboxylating] Proteins 0.000 description 1
- 101000973177 Homo sapiens Nuclear factor interleukin-3-regulated protein Proteins 0.000 description 1
- 101000603420 Homo sapiens Nuclear pore complex-interacting protein family member A1 Proteins 0.000 description 1
- 101000603404 Homo sapiens Nuclear pore complex-interacting protein family member B15 Proteins 0.000 description 1
- 101000978926 Homo sapiens Nuclear receptor subfamily 1 group D member 1 Proteins 0.000 description 1
- 101001109700 Homo sapiens Nuclear receptor subfamily 4 group A member 1 Proteins 0.000 description 1
- 101000577335 Homo sapiens Nuclear receptor-binding factor 2 Proteins 0.000 description 1
- 101000633310 Homo sapiens Nuclear receptor-interacting protein 3 Proteins 0.000 description 1
- 101001024723 Homo sapiens Nucleoporin NDC1 Proteins 0.000 description 1
- 101001125026 Homo sapiens Nucleotide-binding oligomerization domain-containing protein 2 Proteins 0.000 description 1
- 101000958669 Homo sapiens Nucleus accumbens-associated protein 2 Proteins 0.000 description 1
- 101001122435 Homo sapiens Olfactory receptor 4C15 Proteins 0.000 description 1
- 101000982755 Homo sapiens Olfactory receptor 52B2 Proteins 0.000 description 1
- 101000839399 Homo sapiens Oxidoreductase HTATIP2 Proteins 0.000 description 1
- 101000614300 Homo sapiens Oxidoreductase NAD-binding domain-containing protein 1 Proteins 0.000 description 1
- 101000720696 Homo sapiens Oxysterol-binding protein-related protein 2 Proteins 0.000 description 1
- 101000992392 Homo sapiens Oxysterol-binding protein-related protein 6 Proteins 0.000 description 1
- 101000579857 Homo sapiens PC-esterase domain-containing protein 1B Proteins 0.000 description 1
- 101001134647 Homo sapiens PDZ and LIM domain protein 7 Proteins 0.000 description 1
- 101000692944 Homo sapiens PHD finger-like domain-containing protein 5A Proteins 0.000 description 1
- 101001131670 Homo sapiens PWWP domain-containing DNA repair factor 3A Proteins 0.000 description 1
- 101001125854 Homo sapiens Peptidase inhibitor 16 Proteins 0.000 description 1
- 101001060736 Homo sapiens Peptidyl-prolyl cis-trans isomerase FKBP1B Proteins 0.000 description 1
- 101000878253 Homo sapiens Peptidyl-prolyl cis-trans isomerase FKBP5 Proteins 0.000 description 1
- 101001031398 Homo sapiens Peptidyl-prolyl cis-trans isomerase FKBP9 Proteins 0.000 description 1
- 101000833892 Homo sapiens Peroxisomal acyl-coenzyme A oxidase 1 Proteins 0.000 description 1
- 101000721645 Homo sapiens Phosphatidylinositol 4-phosphate 3-kinase C2 domain-containing subunit beta Proteins 0.000 description 1
- 101000595859 Homo sapiens Phosphatidylinositol transfer protein alpha isoform Proteins 0.000 description 1
- 101001096169 Homo sapiens Phosphatidylserine decarboxylase proenzyme, mitochondrial Proteins 0.000 description 1
- 101001001852 Homo sapiens Phospholipase B-like 1 Proteins 0.000 description 1
- 101000923320 Homo sapiens Phospholipid-transporting ATPase IF Proteins 0.000 description 1
- 101000981515 Homo sapiens Phospholysine phosphohistidine inorganic pyrophosphate phosphatase Proteins 0.000 description 1
- 101001097889 Homo sapiens Platelet-activating factor acetylhydrolase Proteins 0.000 description 1
- 101001096190 Homo sapiens Pleckstrin homology domain-containing family A member 1 Proteins 0.000 description 1
- 101000583178 Homo sapiens Pleckstrin homology domain-containing family M member 1 Proteins 0.000 description 1
- 101001094872 Homo sapiens Plexin-C1 Proteins 0.000 description 1
- 101000583616 Homo sapiens Polyhomeotic-like protein 2 Proteins 0.000 description 1
- 101000620009 Homo sapiens Polyunsaturated fatty acid 5-lipoxygenase Proteins 0.000 description 1
- 101001064864 Homo sapiens Polyunsaturated fatty acid lipoxygenase ALOX12 Proteins 0.000 description 1
- 101001047102 Homo sapiens Potassium voltage-gated channel subfamily G member 1 Proteins 0.000 description 1
- 101000693750 Homo sapiens Prefoldin subunit 5 Proteins 0.000 description 1
- 101000857740 Homo sapiens Probable G-protein coupled receptor 160 Proteins 0.000 description 1
- 101001088739 Homo sapiens Probable inactive ribonuclease-like protein 12 Proteins 0.000 description 1
- 101000734650 Homo sapiens Programmed cell death protein 7 Proteins 0.000 description 1
- 101001095095 Homo sapiens Proline-rich acidic protein 1 Proteins 0.000 description 1
- 101001102318 Homo sapiens Prostate tumor-overexpressed gene 1 protein Proteins 0.000 description 1
- 101001136981 Homo sapiens Proteasome subunit beta type-9 Proteins 0.000 description 1
- 101000933252 Homo sapiens Protein BEX3 Proteins 0.000 description 1
- 101000876829 Homo sapiens Protein C-ets-1 Proteins 0.000 description 1
- 101001048762 Homo sapiens Protein FAM117B Proteins 0.000 description 1
- 101000995300 Homo sapiens Protein NDRG2 Proteins 0.000 description 1
- 101000668432 Homo sapiens Protein RCC2 Proteins 0.000 description 1
- 101000653788 Homo sapiens Protein S100-A11 Proteins 0.000 description 1
- 101000739146 Homo sapiens Protein SFI1 homolog Proteins 0.000 description 1
- 101000690460 Homo sapiens Protein argonaute-4 Proteins 0.000 description 1
- 101000928791 Homo sapiens Protein diaphanous homolog 1 Proteins 0.000 description 1
- 101001051777 Homo sapiens Protein kinase C alpha type Proteins 0.000 description 1
- 101000983130 Homo sapiens Protein kinase C and casein kinase substrate in neurons protein 2 Proteins 0.000 description 1
- 101001026854 Homo sapiens Protein kinase C delta type Proteins 0.000 description 1
- 101000942742 Homo sapiens Protein lin-7 homolog A Proteins 0.000 description 1
- 101000942726 Homo sapiens Protein lin-7 homolog B Proteins 0.000 description 1
- 101001000069 Homo sapiens Protein phosphatase 1 regulatory subunit 12B Proteins 0.000 description 1
- 101001135804 Homo sapiens Protein tyrosine phosphatase receptor type C-associated protein Proteins 0.000 description 1
- 101000786806 Homo sapiens Protein yippee-like 4 Proteins 0.000 description 1
- 101000630088 Homo sapiens Protein-L-histidine N-pros-methyltransferase Proteins 0.000 description 1
- 101000649073 Homo sapiens Protein-tyrosine sulfotransferase 1 Proteins 0.000 description 1
- 101001125116 Homo sapiens Putative serine/threonine-protein kinase PRKY Proteins 0.000 description 1
- 101001103597 Homo sapiens RING finger protein 24 Proteins 0.000 description 1
- 101000690074 Homo sapiens RNA pseudouridylate synthase domain-containing protein 2 Proteins 0.000 description 1
- 101000604114 Homo sapiens RNA-binding protein Nova-1 Proteins 0.000 description 1
- 101001077015 Homo sapiens Rab GTPase-activating protein 1-like Proteins 0.000 description 1
- 101001077011 Homo sapiens Rab GTPase-activating protein 1-like, isoform 10 Proteins 0.000 description 1
- 101001095987 Homo sapiens RalBP1-associated Eps domain-containing protein 2 Proteins 0.000 description 1
- 101000712956 Homo sapiens Ras association domain-containing protein 2 Proteins 0.000 description 1
- 101000712974 Homo sapiens Ras association domain-containing protein 7 Proteins 0.000 description 1
- 101001110313 Homo sapiens Ras-related C3 botulinum toxin substrate 2 Proteins 0.000 description 1
- 101001130302 Homo sapiens Ras-related protein Rab-24 Proteins 0.000 description 1
- 101001060862 Homo sapiens Ras-related protein Rab-31 Proteins 0.000 description 1
- 101001060859 Homo sapiens Ras-related protein Rab-32 Proteins 0.000 description 1
- 101001130458 Homo sapiens Ras-related protein Ral-B Proteins 0.000 description 1
- 101000665846 Homo sapiens Receptor expression-enhancing protein 3 Proteins 0.000 description 1
- 101000591201 Homo sapiens Receptor-type tyrosine-protein phosphatase kappa Proteins 0.000 description 1
- 101000591205 Homo sapiens Receptor-type tyrosine-protein phosphatase mu Proteins 0.000 description 1
- 101001074552 Homo sapiens Regulating synaptic membrane exocytosis protein 4 Proteins 0.000 description 1
- 101000849744 Homo sapiens Regulation of nuclear pre-mRNA domain-containing protein 1B Proteins 0.000 description 1
- 101001090935 Homo sapiens Regulator of nonsense transcripts 3A Proteins 0.000 description 1
- 101000580351 Homo sapiens Respirasome Complex Assembly Factor 1 Proteins 0.000 description 1
- 101000727462 Homo sapiens Reticulon-3 Proteins 0.000 description 1
- 101001099922 Homo sapiens Retinoic acid-induced protein 1 Proteins 0.000 description 1
- 101001096330 Homo sapiens Retinoid-binding protein 7 Proteins 0.000 description 1
- 101001090901 Homo sapiens Retroelement silencing factor 1 Proteins 0.000 description 1
- 101000733752 Homo sapiens Retroviral-like aspartic protease 1 Proteins 0.000 description 1
- 101000856728 Homo sapiens Rho GDP-dissociation inhibitor 1 Proteins 0.000 description 1
- 101001091990 Homo sapiens Rho GTPase-activating protein 24 Proteins 0.000 description 1
- 101000581151 Homo sapiens Rho GTPase-activating protein 9 Proteins 0.000 description 1
- 101000704874 Homo sapiens Rho family-interacting cell polarization regulator 2 Proteins 0.000 description 1
- 101000669921 Homo sapiens Rho-associated protein kinase 2 Proteins 0.000 description 1
- 101000581118 Homo sapiens Rho-related GTP-binding protein RhoC Proteins 0.000 description 1
- 101000581128 Homo sapiens Rho-related GTP-binding protein RhoG Proteins 0.000 description 1
- 101000984584 Homo sapiens Ribosome biogenesis protein BOP1 Proteins 0.000 description 1
- 101001088129 Homo sapiens Ropporin-1-like protein Proteins 0.000 description 1
- 101001092917 Homo sapiens SAM domain-containing protein SAMSN-1 Proteins 0.000 description 1
- 101001093937 Homo sapiens SEC14-like protein 1 Proteins 0.000 description 1
- 101100203078 Homo sapiens SF3B6 gene Proteins 0.000 description 1
- 101000616518 Homo sapiens SH2 domain-containing protein 5 Proteins 0.000 description 1
- 101000825291 Homo sapiens SPRY domain-containing SOCS box protein 2 Proteins 0.000 description 1
- 101000835998 Homo sapiens SRA stem-loop-interacting RNA-binding protein, mitochondrial Proteins 0.000 description 1
- 101000826081 Homo sapiens SRSF protein kinase 1 Proteins 0.000 description 1
- 101000687634 Homo sapiens SWI/SNF-related matrix-associated actin-dependent regulator of chromatin subfamily D member 3 Proteins 0.000 description 1
- 101000654339 Homo sapiens Secernin-2 Proteins 0.000 description 1
- 101000863845 Homo sapiens Sedoheptulokinase Proteins 0.000 description 1
- 101000707534 Homo sapiens Serine incorporator 1 Proteins 0.000 description 1
- 101000661819 Homo sapiens Serine/threonine-protein kinase 17B Proteins 0.000 description 1
- 101001001648 Homo sapiens Serine/threonine-protein kinase pim-2 Proteins 0.000 description 1
- 101001123140 Homo sapiens Serine/threonine-protein phosphatase 4 regulatory subunit 2 Proteins 0.000 description 1
- 101000836079 Homo sapiens Serpin B8 Proteins 0.000 description 1
- 101000806155 Homo sapiens Short-chain dehydrogenase/reductase 3 Proteins 0.000 description 1
- 101000709268 Homo sapiens Signal-regulatory protein beta-2 Proteins 0.000 description 1
- 101000835928 Homo sapiens Signal-regulatory protein gamma Proteins 0.000 description 1
- 101000664956 Homo sapiens Single-strand selective monofunctional uracil DNA glycosylase Proteins 0.000 description 1
- 101000587445 Homo sapiens Single-stranded DNA-binding protein 4 Proteins 0.000 description 1
- 101000879758 Homo sapiens Sjoegren syndrome nuclear autoantigen 1 Proteins 0.000 description 1
- 101000974846 Homo sapiens Sodium/potassium-transporting ATPase subunit beta-2 Proteins 0.000 description 1
- 101000713169 Homo sapiens Solute carrier family 52, riboflavin transporter, member 2 Proteins 0.000 description 1
- 101000972449 Homo sapiens Sperm-egg fusion protein LLCFC1 Proteins 0.000 description 1
- 101000808799 Homo sapiens Splicing factor U2AF 35 kDa subunit Proteins 0.000 description 1
- 101000701440 Homo sapiens Stanniocalcin-1 Proteins 0.000 description 1
- 101000831940 Homo sapiens Stathmin Proteins 0.000 description 1
- 101000829425 Homo sapiens Steroid receptor RNA activator 1 Proteins 0.000 description 1
- 101000633429 Homo sapiens Structural maintenance of chromosomes protein 1A Proteins 0.000 description 1
- 101000826408 Homo sapiens Sulfotransferase 1B1 Proteins 0.000 description 1
- 101000617738 Homo sapiens Survival motor neuron protein Proteins 0.000 description 1
- 101000626390 Homo sapiens Synaptotagmin-15 Proteins 0.000 description 1
- 101000706160 Homo sapiens Syntaxin-10 Proteins 0.000 description 1
- 101000642688 Homo sapiens Syntaxin-3 Proteins 0.000 description 1
- 101000740523 Homo sapiens Syntenin-1 Proteins 0.000 description 1
- 101000634836 Homo sapiens T cell receptor alpha chain MC.7.G5 Proteins 0.000 description 1
- 101000596234 Homo sapiens T-cell surface protein tactile Proteins 0.000 description 1
- 101000652482 Homo sapiens TBC1 domain family member 8 Proteins 0.000 description 1
- 101000658588 Homo sapiens TP53-target gene 3 protein Proteins 0.000 description 1
- 101000665590 Homo sapiens Tax1-binding protein 1 Proteins 0.000 description 1
- 101000835708 Homo sapiens Tectonin beta-propeller repeat-containing protein 1 Proteins 0.000 description 1
- 101000642188 Homo sapiens Terminal uridylyltransferase 7 Proteins 0.000 description 1
- 101000759892 Homo sapiens Tetraspanin-13 Proteins 0.000 description 1
- 101000658614 Homo sapiens Tetraspanin-33 Proteins 0.000 description 1
- 101000763314 Homo sapiens Thrombomodulin Proteins 0.000 description 1
- 101000831567 Homo sapiens Toll-like receptor 2 Proteins 0.000 description 1
- 101000669460 Homo sapiens Toll-like receptor 5 Proteins 0.000 description 1
- 101000669402 Homo sapiens Toll-like receptor 7 Proteins 0.000 description 1
- 101000800483 Homo sapiens Toll-like receptor 8 Proteins 0.000 description 1
- 101000838086 Homo sapiens Transaldolase Proteins 0.000 description 1
- 101000835720 Homo sapiens Transcription elongation factor A protein 1 Proteins 0.000 description 1
- 101000891649 Homo sapiens Transcription elongation factor A protein-like 1 Proteins 0.000 description 1
- 101000596772 Homo sapiens Transcription factor 7-like 1 Proteins 0.000 description 1
- 101000596771 Homo sapiens Transcription factor 7-like 2 Proteins 0.000 description 1
- 101000666382 Homo sapiens Transcription factor E2-alpha Proteins 0.000 description 1
- 101000714243 Homo sapiens Transcription factor IIIB 90 kDa subunit Proteins 0.000 description 1
- 101000711846 Homo sapiens Transcription factor SOX-9 Proteins 0.000 description 1
- 101000715157 Homo sapiens Transcription initiation factor TFIID subunit 9B Proteins 0.000 description 1
- 101000904499 Homo sapiens Transcription regulator protein BACH2 Proteins 0.000 description 1
- 101000844519 Homo sapiens Transient receptor potential cation channel subfamily M member 6 Proteins 0.000 description 1
- 101000655133 Homo sapiens Transmembrane protein 102 Proteins 0.000 description 1
- 101000851417 Homo sapiens Transmembrane protein 68 Proteins 0.000 description 1
- 101000766332 Homo sapiens Tribbles homolog 1 Proteins 0.000 description 1
- 101000795107 Homo sapiens Triggering receptor expressed on myeloid cells 1 Proteins 0.000 description 1
- 101000788517 Homo sapiens Tubulin beta-2A chain Proteins 0.000 description 1
- 101000987017 Homo sapiens Tumor protein p53-inducible protein 11 Proteins 0.000 description 1
- 101000997832 Homo sapiens Tyrosine-protein kinase JAK2 Proteins 0.000 description 1
- 101000818543 Homo sapiens Tyrosine-protein kinase ZAP-70 Proteins 0.000 description 1
- 101000941170 Homo sapiens U6 snRNA phosphodiesterase 1 Proteins 0.000 description 1
- 101000965658 Homo sapiens U6 snRNA-associated Sm-like protein LSm7 Proteins 0.000 description 1
- 101001004754 Homo sapiens U7 snRNA-associated Sm-like protein LSm10 Proteins 0.000 description 1
- 101000991942 Homo sapiens U8 snoRNA-decapping enzyme Proteins 0.000 description 1
- 101000607626 Homo sapiens Ubiquilin-1 Proteins 0.000 description 1
- 101000809261 Homo sapiens Ubiquitin carboxyl-terminal hydrolase 11 Proteins 0.000 description 1
- 101000643895 Homo sapiens Ubiquitin carboxyl-terminal hydrolase 6 Proteins 0.000 description 1
- 101001121442 Homo sapiens Ubiquitin thioesterase OTU1 Proteins 0.000 description 1
- 101000772913 Homo sapiens Ubiquitin-conjugating enzyme E2 D3 Proteins 0.000 description 1
- 101000761646 Homo sapiens Ubiquitin-conjugating enzyme E2 G2 Proteins 0.000 description 1
- 101000772767 Homo sapiens Ubiquitin-like protein 5 Proteins 0.000 description 1
- 101000887051 Homo sapiens Ubiquitin-like-conjugating enzyme ATG3 Proteins 0.000 description 1
- 101001000119 Homo sapiens Unconventional myosin-If Proteins 0.000 description 1
- 101001000116 Homo sapiens Unconventional myosin-Ig Proteins 0.000 description 1
- 101001030254 Homo sapiens Unconventional myosin-XVB Proteins 0.000 description 1
- 101000776508 Homo sapiens Up-regulator of cell proliferation Proteins 0.000 description 1
- 101000743488 Homo sapiens V-set and immunoglobulin domain-containing protein 4 Proteins 0.000 description 1
- 101000954434 Homo sapiens V-type proton ATPase 21 kDa proteolipid subunit c'' Proteins 0.000 description 1
- 101000805613 Homo sapiens Vacuole membrane protein 1 Proteins 0.000 description 1
- 101000860430 Homo sapiens Versican core protein Proteins 0.000 description 1
- 101000654576 Homo sapiens Vesicle transport protein SFT2A Proteins 0.000 description 1
- 101000631907 Homo sapiens Vesicle-trafficking protein SEC22b Proteins 0.000 description 1
- 101000621945 Homo sapiens Vitamin K epoxide reductase complex subunit 1 Proteins 0.000 description 1
- 101000740759 Homo sapiens Voltage-dependent calcium channel subunit alpha-2/delta-2 Proteins 0.000 description 1
- 101000771662 Homo sapiens WD repeat and FYVE domain-containing protein 3 Proteins 0.000 description 1
- 101000667308 Homo sapiens WD repeat-containing protein 18 Proteins 0.000 description 1
- 101000649231 Homo sapiens XK-related protein 8 Proteins 0.000 description 1
- 101000976607 Homo sapiens Zinc finger protein 135 Proteins 0.000 description 1
- 101000782167 Homo sapiens Zinc finger protein 234 Proteins 0.000 description 1
- 101000760248 Homo sapiens Zinc finger protein 346 Proteins 0.000 description 1
- 101000818823 Homo sapiens Zinc finger protein 438 Proteins 0.000 description 1
- 101000802324 Homo sapiens Zinc finger protein 550 Proteins 0.000 description 1
- 101000818706 Homo sapiens Zinc finger protein 618 Proteins 0.000 description 1
- 101000931048 Homo sapiens Zinc finger protein DPF3 Proteins 0.000 description 1
- 101000691578 Homo sapiens Zinc finger protein PLAG1 Proteins 0.000 description 1
- 101000730644 Homo sapiens Zinc finger protein PLAGL2 Proteins 0.000 description 1
- 101001117143 Homo sapiens [Pyruvate dehydrogenase (acetyl-transferring)] kinase isozyme 2, mitochondrial Proteins 0.000 description 1
- 101000734339 Homo sapiens [Pyruvate dehydrogenase (acetyl-transferring)] kinase isozyme 4, mitochondrial Proteins 0.000 description 1
- 101001026573 Homo sapiens cAMP-dependent protein kinase type I-alpha regulatory subunit Proteins 0.000 description 1
- 101000614791 Homo sapiens cAMP-dependent protein kinase type I-beta regulatory subunit Proteins 0.000 description 1
- 101000818522 Homo sapiens fMet-Leu-Phe receptor Proteins 0.000 description 1
- 101000802094 Homo sapiens mRNA decay activator protein ZFP36L1 Proteins 0.000 description 1
- 101000615763 Homo sapiens tRNA-splicing endonuclease subunit Sen34 Proteins 0.000 description 1
- 101000782222 Homo sapiens von Willebrand factor C and EGF domain-containing protein Proteins 0.000 description 1
- 102000004157 Hydrolases Human genes 0.000 description 1
- 108090000604 Hydrolases Proteins 0.000 description 1
- 102100021656 Hydroxysteroid dehydrogenase-like protein 2 Human genes 0.000 description 1
- 102100026103 IgGFc-binding protein Human genes 0.000 description 1
- 102000017727 Immunoglobulin Variable Region Human genes 0.000 description 1
- 108010067060 Immunoglobulin Variable Region Proteins 0.000 description 1
- 102100038005 Immunoglobulin alpha Fc receptor Human genes 0.000 description 1
- 102100038425 Inactive ubiquitin carboxyl-terminal hydrolase 53 Human genes 0.000 description 1
- 241000976924 Inca Species 0.000 description 1
- 102100026539 Induced myeloid leukemia cell differentiation protein Mcl-1 Human genes 0.000 description 1
- 206010061218 Inflammation Diseases 0.000 description 1
- 102100021602 Inosine-5'-monophosphate dehydrogenase 1 Human genes 0.000 description 1
- 102100021608 Inositol monophosphatase 2 Human genes 0.000 description 1
- 102100029838 Interferon regulatory factor 2 Human genes 0.000 description 1
- 102100030126 Interferon regulatory factor 4 Human genes 0.000 description 1
- 102100034170 Interferon-induced, double-stranded RNA-activated protein kinase Human genes 0.000 description 1
- 102100027268 Interferon-stimulated gene 20 kDa protein Human genes 0.000 description 1
- 102100026017 Interleukin-1 receptor type 2 Human genes 0.000 description 1
- 102100023530 Interleukin-1 receptor-associated kinase 3 Human genes 0.000 description 1
- 102100020787 Interleukin-11 receptor subunit alpha Human genes 0.000 description 1
- 102100020791 Interleukin-13 receptor subunit alpha-1 Human genes 0.000 description 1
- 102000003810 Interleukin-18 Human genes 0.000 description 1
- 108090000171 Interleukin-18 Proteins 0.000 description 1
- 102100039340 Interleukin-18 receptor 1 Human genes 0.000 description 1
- 102100036705 Interleukin-23 subunit alpha Human genes 0.000 description 1
- 102100023976 Jun dimerization protein 2 Human genes 0.000 description 1
- 102100023437 Junctional adhesion molecule-like Human genes 0.000 description 1
- 102100022101 Kelch-like protein 3 Human genes 0.000 description 1
- 102100021457 Killer cell lectin-like receptor subfamily G member 1 Human genes 0.000 description 1
- 102100021001 Kinase suppressor of Ras 1 Human genes 0.000 description 1
- 102100027792 Krueppel-like factor 12 Human genes 0.000 description 1
- 102100020679 Krueppel-like factor 6 Human genes 0.000 description 1
- 102100029137 L-xylulose reductase Human genes 0.000 description 1
- 108010080643 L-xylulose reductase Proteins 0.000 description 1
- 102000017578 LAG3 Human genes 0.000 description 1
- 102000007330 LDL Lipoproteins Human genes 0.000 description 1
- 108010007622 LDL Lipoproteins Proteins 0.000 description 1
- 102100021755 LIM and senescent cell antigen-like-containing domain protein 2 Human genes 0.000 description 1
- 102100027017 Latent-transforming growth factor beta-binding protein 2 Human genes 0.000 description 1
- 108010020246 Leucine-Rich Repeat Serine-Threonine Protein Kinase-2 Proteins 0.000 description 1
- 102100032657 Leucine-rich repeat neuronal protein 3 Human genes 0.000 description 1
- 102100032693 Leucine-rich repeat serine/threonine-protein kinase 2 Human genes 0.000 description 1
- 102100031586 Leukocyte antigen CD37 Human genes 0.000 description 1
- 102100030635 Leukocyte elastase inhibitor Human genes 0.000 description 1
- 102100025586 Leukocyte immunoglobulin-like receptor subfamily A member 2 Human genes 0.000 description 1
- 102100025582 Leukocyte immunoglobulin-like receptor subfamily B member 3 Human genes 0.000 description 1
- 238000003657 Likelihood-ratio test Methods 0.000 description 1
- 102100034238 Linker for activation of T-cells family member 2 Human genes 0.000 description 1
- 229940086609 Lipase inhibitor Drugs 0.000 description 1
- 108090001030 Lipoproteins Proteins 0.000 description 1
- 102000004895 Lipoproteins Human genes 0.000 description 1
- 102000003820 Lipoxygenases Human genes 0.000 description 1
- 108090000128 Lipoxygenases Proteins 0.000 description 1
- 102100033995 Long-chain-fatty-acid-CoA ligase 1 Human genes 0.000 description 1
- 102000004317 Lyases Human genes 0.000 description 1
- 108090000856 Lyases Proteins 0.000 description 1
- 108010066789 Lymphocyte Antigen 96 Proteins 0.000 description 1
- 102100033446 Lymphocyte antigen 96 Human genes 0.000 description 1
- 102100030984 Lymphocyte function-associated antigen 3 Human genes 0.000 description 1
- 102100037611 Lysophospholipase Human genes 0.000 description 1
- 102100035301 Lysoplasmalogenase-like protein TMEM86A Human genes 0.000 description 1
- 108700012928 MAPK14 Proteins 0.000 description 1
- 102100024822 MORC family CW-type zinc finger protein 3 Human genes 0.000 description 1
- 101150020396 MSRB2 gene Proteins 0.000 description 1
- 102100021343 Maestro heat-like repeat-containing protein family member 1 Human genes 0.000 description 1
- 102100025532 Male-enhanced antigen 1 Human genes 0.000 description 1
- 102100024295 Maltase-glucoamylase Human genes 0.000 description 1
- 241000124008 Mammalia Species 0.000 description 1
- 102100021770 Mannosyl-oligosaccharide 1,2-alpha-mannosidase IC Human genes 0.000 description 1
- 101150003941 Mapk14 gene Proteins 0.000 description 1
- 102100039185 Max dimerization protein 1 Human genes 0.000 description 1
- 102100027247 Melanoma-associated antigen D1 Human genes 0.000 description 1
- 102100027251 Melanoma-associated antigen D2 Human genes 0.000 description 1
- 102100027256 Melanoma-associated antigen H1 Human genes 0.000 description 1
- 102100037258 Membrane-associated transporter protein Human genes 0.000 description 1
- 108010041559 Methionine Sulfoxide Reductases Proteins 0.000 description 1
- 102000000532 Methionine Sulfoxide Reductases Human genes 0.000 description 1
- 102100024874 Methionine-R-sulfoxide reductase B1 Human genes 0.000 description 1
- 102100024862 Methionine-R-sulfoxide reductase B2, mitochondrial Human genes 0.000 description 1
- 102100028322 Microtubule-actin cross-linking factor 1, isoforms 1/2/3/5 Human genes 0.000 description 1
- 102100033255 Mitochondrial amidoxime-reducing component 1 Human genes 0.000 description 1
- 102100040200 Mitochondrial uncoupling protein 2 Human genes 0.000 description 1
- 102100037984 Mitoferrin-1 Human genes 0.000 description 1
- 102000054819 Mitogen-activated protein kinase 14 Human genes 0.000 description 1
- 102100033058 Mitogen-activated protein kinase kinase kinase 2 Human genes 0.000 description 1
- 102100033059 Mitogen-activated protein kinase kinase kinase 3 Human genes 0.000 description 1
- 102100028194 Mitogen-activated protein kinase kinase kinase kinase 4 Human genes 0.000 description 1
- 102100030177 Mixed lineage kinase domain-like protein Human genes 0.000 description 1
- 102100021440 Modulator of apoptosis 1 Human genes 0.000 description 1
- 102100036617 Monoacylglycerol lipase ABHD2 Human genes 0.000 description 1
- 102100025276 Monocarboxylate transporter 4 Human genes 0.000 description 1
- 102100023092 Motile sperm domain-containing protein 2 Human genes 0.000 description 1
- 102100034242 Mucin-20 Human genes 0.000 description 1
- 108010066419 Multidrug Resistance-Associated Protein 2 Proteins 0.000 description 1
- 102100039007 Multiple epidermal growth factor-like domains protein 10 Human genes 0.000 description 1
- 241001529936 Murinae Species 0.000 description 1
- 102100027994 Myeloid cell nuclear differentiation antigen Human genes 0.000 description 1
- 108060008487 Myosin Proteins 0.000 description 1
- 102000003505 Myosin Human genes 0.000 description 1
- 102100031829 Myosin light polypeptide 6 Human genes 0.000 description 1
- 102100030330 Myosin regulatory light chain 12B Human genes 0.000 description 1
- 102100032972 Myosin-14 Human genes 0.000 description 1
- 102100030626 Myosin-binding protein H Human genes 0.000 description 1
- 102100027445 N-acetylserotonin O-methyltransferase-like protein Human genes 0.000 description 1
- 101710111485 N-acetylserotonin O-methyltransferase-like protein Proteins 0.000 description 1
- UWSDONTXWQOZFN-UHFFFAOYSA-N N-nitrosopiperidine Chemical compound O=NN1CCCCC1 UWSDONTXWQOZFN-UHFFFAOYSA-N 0.000 description 1
- 102100032195 NADH dehydrogenase [ubiquinone] 1 beta subcomplex subunit 3 Human genes 0.000 description 1
- 102100023212 NADH dehydrogenase [ubiquinone] iron-sulfur protein 7, mitochondrial Human genes 0.000 description 1
- 102100031919 NADH dehydrogenase [ubiquinone] iron-sulfur protein 8, mitochondrial Human genes 0.000 description 1
- XJLXINKUBYWONI-NNYOXOHSSA-O NADP(+) Chemical compound NC(=O)C1=CC=C[N+]([C@H]2[C@@H]([C@H](O)[C@@H](COP(O)(=O)OP(O)(=O)OC[C@@H]3[C@H]([C@@H](OP(O)(O)=O)[C@@H](O3)N3C4=NC=NC(N)=C4N=C3)O)O2)O)=C1 XJLXINKUBYWONI-NNYOXOHSSA-O 0.000 description 1
- 108010018525 NFATC Transcription Factors Proteins 0.000 description 1
- 102000002673 NFATC Transcription Factors Human genes 0.000 description 1
- 108091008877 NK cell receptors Proteins 0.000 description 1
- 102100022683 NKG2-C type II integral membrane protein Human genes 0.000 description 1
- 102100027343 Napsin-A Human genes 0.000 description 1
- 102000010648 Natural Killer Cell Receptors Human genes 0.000 description 1
- 102100022158 Neuferricin Human genes 0.000 description 1
- 102100023232 Neurensin-2 Human genes 0.000 description 1
- 102100037030 Neuroblastoma breakpoint family member 11 Human genes 0.000 description 1
- 108090000772 Neuropilin-1 Proteins 0.000 description 1
- 101100126846 Neurospora crassa (strain ATCC 24698 / 74-OR23-1A / CBS 708.71 / DSM 1257 / FGSC 987) katG gene Proteins 0.000 description 1
- 102100036348 Neutrophil defensin 4 Human genes 0.000 description 1
- 102100030830 Nicotinate-nucleotide pyrophosphorylase [carboxylating] Human genes 0.000 description 1
- 238000000636 Northern blotting Methods 0.000 description 1
- 102100022163 Nuclear factor interleukin-3-regulated protein Human genes 0.000 description 1
- 102100038845 Nuclear pore complex-interacting protein family member A1 Human genes 0.000 description 1
- 102100038872 Nuclear pore complex-interacting protein family member B15 Human genes 0.000 description 1
- 102100023170 Nuclear receptor subfamily 1 group D member 1 Human genes 0.000 description 1
- 102100022679 Nuclear receptor subfamily 4 group A member 1 Human genes 0.000 description 1
- 102100028791 Nuclear receptor-binding factor 2 Human genes 0.000 description 1
- 102100029561 Nuclear receptor-interacting protein 3 Human genes 0.000 description 1
- 102100037826 Nucleoporin NDC1 Human genes 0.000 description 1
- 102100029441 Nucleotide-binding oligomerization domain-containing protein 2 Human genes 0.000 description 1
- 102100038140 Nucleus accumbens-associated protein 2 Human genes 0.000 description 1
- 102100027146 Olfactory receptor 4C15 Human genes 0.000 description 1
- 102100026996 Olfactory receptor 52B2 Human genes 0.000 description 1
- 108091034117 Oligonucleotide Proteins 0.000 description 1
- 102100040558 Osteoclast-stimulating factor 1 Human genes 0.000 description 1
- 108700005081 Overlapping Genes Proteins 0.000 description 1
- 102100027952 Oxidoreductase HTATIP2 Human genes 0.000 description 1
- 102100040459 Oxidoreductase NAD-binding domain-containing protein 1 Human genes 0.000 description 1
- 102100025925 Oxysterol-binding protein-related protein 2 Human genes 0.000 description 1
- 102100032149 Oxysterol-binding protein-related protein 6 Human genes 0.000 description 1
- 102100027501 PC-esterase domain-containing protein 1B Human genes 0.000 description 1
- 102100033337 PDZ and LIM domain protein 7 Human genes 0.000 description 1
- 102100026389 PHD finger-like domain-containing protein 5A Human genes 0.000 description 1
- 229910019142 PO4 Inorganic materials 0.000 description 1
- 108010011536 PTEN Phosphohydrolase Proteins 0.000 description 1
- 102100029324 Peptidase inhibitor 16 Human genes 0.000 description 1
- 102000035195 Peptidases Human genes 0.000 description 1
- 108091005804 Peptidases Proteins 0.000 description 1
- 102100037026 Peptidyl-prolyl cis-trans isomerase FKBP5 Human genes 0.000 description 1
- 102100038809 Peptidyl-prolyl cis-trans isomerase FKBP9 Human genes 0.000 description 1
- 102100026798 Peroxisomal acyl-coenzyme A oxidase 1 Human genes 0.000 description 1
- 102100032543 Phosphatidylinositol 3,4,5-trisphosphate 3-phosphatase and dual-specificity protein phosphatase PTEN Human genes 0.000 description 1
- 102100025059 Phosphatidylinositol 4-phosphate 3-kinase C2 domain-containing subunit beta Human genes 0.000 description 1
- 102100036062 Phosphatidylinositol transfer protein alpha isoform Human genes 0.000 description 1
- 102100036316 Phospholipase B-like 1 Human genes 0.000 description 1
- 229940124154 Phospholipase inhibitor Drugs 0.000 description 1
- 102100032687 Phospholipid-transporting ATPase IF Human genes 0.000 description 1
- 102100024111 Phospholysine phosphohistidine inorganic pyrophosphate phosphatase Human genes 0.000 description 1
- OAICVXFJPJFONN-UHFFFAOYSA-N Phosphorus Chemical compound [P] OAICVXFJPJFONN-UHFFFAOYSA-N 0.000 description 1
- 108091000080 Phosphotransferase Proteins 0.000 description 1
- 108010022233 Plasminogen Activator Inhibitor 1 Proteins 0.000 description 1
- 102100039418 Plasminogen activator inhibitor 1 Human genes 0.000 description 1
- 102100037518 Platelet-activating factor acetylhydrolase Human genes 0.000 description 1
- 102100037862 Pleckstrin homology domain-containing family A member 1 Human genes 0.000 description 1
- 102100030349 Pleckstrin homology domain-containing family M member 1 Human genes 0.000 description 1
- 102100035381 Plexin-C1 Human genes 0.000 description 1
- 108010064218 Poly (ADP-Ribose) Polymerase-1 Proteins 0.000 description 1
- 102100023712 Poly [ADP-ribose] polymerase 1 Human genes 0.000 description 1
- 102100030903 Polyhomeotic-like protein 2 Human genes 0.000 description 1
- 102100022364 Polyunsaturated fatty acid 5-lipoxygenase Human genes 0.000 description 1
- 102100031949 Polyunsaturated fatty acid lipoxygenase ALOX12 Human genes 0.000 description 1
- 102100022783 Potassium voltage-gated channel subfamily G member 1 Human genes 0.000 description 1
- 102100025513 Prefoldin subunit 5 Human genes 0.000 description 1
- 102100025346 Probable G-protein coupled receptor 160 Human genes 0.000 description 1
- 102100034694 Programmed cell death protein 7 Human genes 0.000 description 1
- 102100037034 Proline-rich acidic protein 1 Human genes 0.000 description 1
- 102100039279 Prostate tumor-overexpressed gene 1 protein Human genes 0.000 description 1
- 239000004365 Protease Substances 0.000 description 1
- 102100035764 Proteasome subunit beta type-9 Human genes 0.000 description 1
- 102100025955 Protein BEX3 Human genes 0.000 description 1
- 102100035251 Protein C-ets-1 Human genes 0.000 description 1
- 102100023780 Protein FAM117B Human genes 0.000 description 1
- 102100034436 Protein NDRG2 Human genes 0.000 description 1
- 102100039972 Protein RCC2 Human genes 0.000 description 1
- 102100029811 Protein S100-A11 Human genes 0.000 description 1
- 102100021494 Protein S100-P Human genes 0.000 description 1
- 102100037271 Protein SFI1 homolog Human genes 0.000 description 1
- 102100026800 Protein argonaute-4 Human genes 0.000 description 1
- 102100036490 Protein diaphanous homolog 1 Human genes 0.000 description 1
- 102100024924 Protein kinase C alpha type Human genes 0.000 description 1
- 102100026843 Protein kinase C and casein kinase substrate in neurons protein 2 Human genes 0.000 description 1
- 102100037340 Protein kinase C delta type Human genes 0.000 description 1
- 102100023068 Protein kinase C-binding protein NELL1 Human genes 0.000 description 1
- 102100032928 Protein lin-7 homolog A Human genes 0.000 description 1
- 102100032890 Protein lin-7 homolog B Human genes 0.000 description 1
- 102100036545 Protein phosphatase 1 regulatory subunit 12B Human genes 0.000 description 1
- 102100036937 Protein tyrosine phosphatase receptor type C-associated protein Human genes 0.000 description 1
- 102100025545 Protein yippee-like 4 Human genes 0.000 description 1
- 108091000520 Protein-Arginine Deiminase Type 4 Proteins 0.000 description 1
- 102100026221 Protein-L-histidine N-pros-methyltransferase Human genes 0.000 description 1
- 102100035731 Protein-arginine deiminase type-4 Human genes 0.000 description 1
- 102100028081 Protein-tyrosine sulfotransferase 1 Human genes 0.000 description 1
- 102100029403 Putative serine/threonine-protein kinase PRKY Human genes 0.000 description 1
- 102100039516 RING finger protein 24 Human genes 0.000 description 1
- 108091007868 RMND5A Proteins 0.000 description 1
- 102100024051 RNA pseudouridylate synthase domain-containing protein 2 Human genes 0.000 description 1
- 239000013614 RNA sample Substances 0.000 description 1
- 102100038427 RNA-binding protein Nova-1 Human genes 0.000 description 1
- 108091007333 RNF130 Proteins 0.000 description 1
- 102100025165 Rab GTPase-activating protein 1-like, isoform 10 Human genes 0.000 description 1
- 102000028671 Rab24 Human genes 0.000 description 1
- 102100023320 Ral guanine nucleotide dissociation stimulator Human genes 0.000 description 1
- 102100037884 RalBP1-associated Eps domain-containing protein 2 Human genes 0.000 description 1
- 101150015043 Ralgds gene Proteins 0.000 description 1
- 102100033242 Ras association domain-containing protein 2 Human genes 0.000 description 1
- 102100033241 Ras association domain-containing protein 7 Human genes 0.000 description 1
- 102100022122 Ras-related C3 botulinum toxin substrate 1 Human genes 0.000 description 1
- 102100022129 Ras-related C3 botulinum toxin substrate 2 Human genes 0.000 description 1
- 102100039767 Ras-related protein Rab-27A Human genes 0.000 description 1
- 102100027838 Ras-related protein Rab-31 Human genes 0.000 description 1
- 102100027915 Ras-related protein Rab-32 Human genes 0.000 description 1
- 102100031425 Ras-related protein Ral-B Human genes 0.000 description 1
- 102100038273 Receptor expression-enhancing protein 3 Human genes 0.000 description 1
- 102100034089 Receptor-type tyrosine-protein phosphatase kappa Human genes 0.000 description 1
- 102100034090 Receptor-type tyrosine-protein phosphatase mu Human genes 0.000 description 1
- 108020004511 Recombinant DNA Proteins 0.000 description 1
- 102100036260 Regulating synaptic membrane exocytosis protein 4 Human genes 0.000 description 1
- 102100033796 Regulation of nuclear pre-mRNA domain-containing protein 1B Human genes 0.000 description 1
- 102100020981 Regulator of G-protein signaling 16 Human genes 0.000 description 1
- 101710148341 Regulator of G-protein signaling 16 Proteins 0.000 description 1
- 102100021035 Regulator of G-protein signaling 18 Human genes 0.000 description 1
- 101710148110 Regulator of G-protein signaling 18 Proteins 0.000 description 1
- 102100021258 Regulator of G-protein signaling 2 Human genes 0.000 description 1
- 101710140412 Regulator of G-protein signaling 2 Proteins 0.000 description 1
- 102100035026 Regulator of nonsense transcripts 3A Human genes 0.000 description 1
- 102100027558 Respirasome Complex Assembly Factor 1 Human genes 0.000 description 1
- 102100029832 Reticulon-3 Human genes 0.000 description 1
- 102100038470 Retinoic acid-induced protein 1 Human genes 0.000 description 1
- 102100037879 Retinoid-binding protein 7 Human genes 0.000 description 1
- 102100034981 Retroelement silencing factor 1 Human genes 0.000 description 1
- 102100033717 Retroviral-like aspartic protease 1 Human genes 0.000 description 1
- 102100025642 Rho GDP-dissociation inhibitor 1 Human genes 0.000 description 1
- 102100035741 Rho GTPase-activating protein 24 Human genes 0.000 description 1
- 102100027658 Rho GTPase-activating protein 9 Human genes 0.000 description 1
- 102100032023 Rho family-interacting cell polarization regulator 2 Human genes 0.000 description 1
- 102100039314 Rho-associated protein kinase 2 Human genes 0.000 description 1
- 102100027610 Rho-related GTP-binding protein RhoC Human genes 0.000 description 1
- 102100027605 Rho-related GTP-binding protein RhoG Human genes 0.000 description 1
- 102100027055 Ribosome biogenesis protein BOP1 Human genes 0.000 description 1
- 102100032261 Ropporin-1-like protein Human genes 0.000 description 1
- 102100036195 SAM domain-containing protein SAMSN-1 Human genes 0.000 description 1
- 102100035214 SEC14-like protein 1 Human genes 0.000 description 1
- 102100021777 SH2 domain-containing protein 5 Human genes 0.000 description 1
- 108091006601 SLC16A3 Proteins 0.000 description 1
- 102000012986 SLC1A7 Human genes 0.000 description 1
- 108091006744 SLC22A1 Proteins 0.000 description 1
- 108091006749 SLC22A15 Proteins 0.000 description 1
- 108091006737 SLC22A4 Proteins 0.000 description 1
- 108091006469 SLC25A37 Proteins 0.000 description 1
- 108091006551 SLC29A1 Proteins 0.000 description 1
- 108091006307 SLC2A10 Proteins 0.000 description 1
- 108091006302 SLC2A14 Proteins 0.000 description 1
- 108091006956 SLC35B4 Proteins 0.000 description 1
- 108091006925 SLC37A3 Proteins 0.000 description 1
- 108091006976 SLC40A1 Proteins 0.000 description 1
- 108091007563 SLC45A2 Proteins 0.000 description 1
- 108091006238 SLC7A8 Proteins 0.000 description 1
- 108091006253 SLC8A1 Proteins 0.000 description 1
- 101700004678 SLIT3 Proteins 0.000 description 1
- 102100022330 SPRY domain-containing SOCS box protein 2 Human genes 0.000 description 1
- 102100025491 SRA stem-loop-interacting RNA-binding protein, mitochondrial Human genes 0.000 description 1
- 102100023010 SRSF protein kinase 1 Human genes 0.000 description 1
- 101150058731 STAT5A gene Proteins 0.000 description 1
- 102100024837 SWI/SNF-related matrix-associated actin-dependent regulator of chromatin subfamily D member 3 Human genes 0.000 description 1
- 101100501116 Saccharomyces cerevisiae (strain ATCC 204508 / S288c) TUF1 gene Proteins 0.000 description 1
- 102100031318 Secernin-2 Human genes 0.000 description 1
- 102100029990 Sedoheptulokinase Human genes 0.000 description 1
- 102100031707 Serine incorporator 1 Human genes 0.000 description 1
- 102100037959 Serine/threonine-protein kinase 17B Human genes 0.000 description 1
- 102100036120 Serine/threonine-protein kinase pim-2 Human genes 0.000 description 1
- 102100028619 Serine/threonine-protein phosphatase 4 regulatory subunit 2 Human genes 0.000 description 1
- 102100025520 Serpin B8 Human genes 0.000 description 1
- 102100037857 Short-chain dehydrogenase/reductase 3 Human genes 0.000 description 1
- 102100024481 Signal transducer and activator of transcription 5A Human genes 0.000 description 1
- 102100025795 Signal-regulatory protein gamma Human genes 0.000 description 1
- 102100038661 Single-strand selective monofunctional uracil DNA glycosylase Human genes 0.000 description 1
- 102100029702 Single-stranded DNA-binding protein 4 Human genes 0.000 description 1
- 102100037330 Sjoegren syndrome nuclear autoantigen 1 Human genes 0.000 description 1
- 102100025490 Slit homolog 1 protein Human genes 0.000 description 1
- 102100035088 Sodium/calcium exchanger 1 Human genes 0.000 description 1
- 102100022791 Sodium/potassium-transporting ATPase subunit beta-2 Human genes 0.000 description 1
- 102100039670 Solute carrier family 2, facilitated glucose transporter member 10 Human genes 0.000 description 1
- 102100039672 Solute carrier family 2, facilitated glucose transporter member 14 Human genes 0.000 description 1
- 102100032416 Solute carrier family 22 member 1 Human genes 0.000 description 1
- 102100021477 Solute carrier family 22 member 15 Human genes 0.000 description 1
- 102100036928 Solute carrier family 22 member 4 Human genes 0.000 description 1
- 102100032008 Solute carrier family 40 member 1 Human genes 0.000 description 1
- 102100036862 Solute carrier family 52, riboflavin transporter, member 2 Human genes 0.000 description 1
- 102100027233 Solute carrier organic anion transporter family member 1B1 Human genes 0.000 description 1
- 238000002105 Southern blotting Methods 0.000 description 1
- 102100022736 Sperm-egg fusion protein LLCFC1 Human genes 0.000 description 1
- 102100021817 Splicing factor 3B subunit 6 Human genes 0.000 description 1
- 102100038501 Splicing factor U2AF 35 kDa subunit Human genes 0.000 description 1
- 102100027779 Splicing factor, arginine/serine-rich 19 Human genes 0.000 description 1
- 102100030511 Stanniocalcin-1 Human genes 0.000 description 1
- 102100024237 Stathmin Human genes 0.000 description 1
- 102100029538 Structural maintenance of chromosomes protein 1A Human genes 0.000 description 1
- 238000000692 Student's t-test Methods 0.000 description 1
- 102100038952 Sugar phosphate exchanger 3 Human genes 0.000 description 1
- 102100023988 Sulfotransferase 1B1 Human genes 0.000 description 1
- 102100032891 Superoxide dismutase [Mn], mitochondrial Human genes 0.000 description 1
- 208000002847 Surgical Wound Diseases 0.000 description 1
- 102100021947 Survival motor neuron protein Human genes 0.000 description 1
- 102100024613 Synaptotagmin-15 Human genes 0.000 description 1
- 102100031099 Syntaxin-10 Human genes 0.000 description 1
- 102100035937 Syntaxin-3 Human genes 0.000 description 1
- 102100037219 Syntenin-1 Human genes 0.000 description 1
- 230000006044 T cell activation Effects 0.000 description 1
- 102100029454 T cell receptor alpha chain MC.7.G5 Human genes 0.000 description 1
- 102100035268 T-cell surface protein tactile Human genes 0.000 description 1
- 102100030302 TBC1 domain family member 8 Human genes 0.000 description 1
- 108091007178 TNFRSF10A Proteins 0.000 description 1
- 108700012411 TNFSF10 Proteins 0.000 description 1
- 102100034899 TP53-target gene 3 protein Human genes 0.000 description 1
- 102000003608 TRPM6 Human genes 0.000 description 1
- 101150026786 TUFM gene Proteins 0.000 description 1
- 108010027179 Tacrolimus Binding Proteins Proteins 0.000 description 1
- 102000018679 Tacrolimus Binding Proteins Human genes 0.000 description 1
- 102100038193 Tax1-binding protein 1 Human genes 0.000 description 1
- 102100026429 Tectonin beta-propeller repeat-containing protein 1 Human genes 0.000 description 1
- 102100033224 Terminal uridylyltransferase 7 Human genes 0.000 description 1
- 102100024996 Tetraspanin-13 Human genes 0.000 description 1
- 102100034916 Tetraspanin-33 Human genes 0.000 description 1
- 102100026966 Thrombomodulin Human genes 0.000 description 1
- 102100024333 Toll-like receptor 2 Human genes 0.000 description 1
- 102100039357 Toll-like receptor 5 Human genes 0.000 description 1
- 102100039390 Toll-like receptor 7 Human genes 0.000 description 1
- 102100033110 Toll-like receptor 8 Human genes 0.000 description 1
- 102100022610 Trafficking protein particle complex subunit 2-like protein Human genes 0.000 description 1
- 102100028601 Transaldolase Human genes 0.000 description 1
- 230000010632 Transcription Factor Activity Effects 0.000 description 1
- 102100026430 Transcription elongation factor A protein 1 Human genes 0.000 description 1
- 102100040250 Transcription elongation factor A protein-like 1 Human genes 0.000 description 1
- 102100035101 Transcription factor 7-like 2 Human genes 0.000 description 1
- 102100038313 Transcription factor E2-alpha Human genes 0.000 description 1
- 102100036535 Transcription factor IIIB 90 kDa subunit Human genes 0.000 description 1
- 102100036653 Transcription initiation factor TFIID subunit 9B Human genes 0.000 description 1
- 102100023998 Transcription regulator protein BACH2 Human genes 0.000 description 1
- 102100033026 Transmembrane protein 102 Human genes 0.000 description 1
- 102100036926 Transmembrane protein 68 Human genes 0.000 description 1
- 102100026387 Tribbles homolog 1 Human genes 0.000 description 1
- 102100029681 Triggering receptor expressed on myeloid cells 1 Human genes 0.000 description 1
- 102100025225 Tubulin beta-2A chain Human genes 0.000 description 1
- 102100040113 Tumor necrosis factor receptor superfamily member 10A Human genes 0.000 description 1
- 102100027873 Tumor protein p53-inducible protein 11 Human genes 0.000 description 1
- 102100033444 Tyrosine-protein kinase JAK2 Human genes 0.000 description 1
- 102100021125 Tyrosine-protein kinase ZAP-70 Human genes 0.000 description 1
- 102100031314 U6 snRNA phosphodiesterase 1 Human genes 0.000 description 1
- 102100040951 U6 snRNA-associated Sm-like protein LSm7 Human genes 0.000 description 1
- 108091026822 U6 spliceosomal RNA Proteins 0.000 description 1
- 102100025507 U7 snRNA-associated Sm-like protein LSm10 Human genes 0.000 description 1
- 102100030662 U8 snoRNA-decapping enzyme Human genes 0.000 description 1
- 102100032874 UDP-xylose and UDP-N-acetylglucosamine transporter Human genes 0.000 description 1
- 102100039934 Ubiquilin-1 Human genes 0.000 description 1
- 102100038462 Ubiquitin carboxyl-terminal hydrolase 11 Human genes 0.000 description 1
- 102100021015 Ubiquitin carboxyl-terminal hydrolase 6 Human genes 0.000 description 1
- 102100026369 Ubiquitin thioesterase OTU1 Human genes 0.000 description 1
- 102100030425 Ubiquitin-conjugating enzyme E2 D3 Human genes 0.000 description 1
- 102100024870 Ubiquitin-conjugating enzyme E2 G2 Human genes 0.000 description 1
- 102100030580 Ubiquitin-like protein 5 Human genes 0.000 description 1
- 102100039930 Ubiquitin-like-conjugating enzyme ATG3 Human genes 0.000 description 1
- 102100035825 Unconventional myosin-If Human genes 0.000 description 1
- 102100035824 Unconventional myosin-Ig Human genes 0.000 description 1
- 102100038933 Unconventional myosin-XVB Human genes 0.000 description 1
- 108010021111 Uncoupling Protein 2 Proteins 0.000 description 1
- 102100031205 Up-regulator of cell proliferation Human genes 0.000 description 1
- 102100038296 V-set and immunoglobulin domain-containing protein 4 Human genes 0.000 description 1
- 102100038282 V-type immunoglobulin domain-containing suppressor of T-cell activation Human genes 0.000 description 1
- 102100037167 V-type proton ATPase 21 kDa proteolipid subunit c'' Human genes 0.000 description 1
- 102100038001 Vacuole membrane protein 1 Human genes 0.000 description 1
- 102100028437 Versican core protein Human genes 0.000 description 1
- 102100032651 Vesicle transport protein SFT2A Human genes 0.000 description 1
- 102100028753 Vesicle-trafficking protein SEC22b Human genes 0.000 description 1
- 102100023485 Vitamin K epoxide reductase complex subunit 1 Human genes 0.000 description 1
- 102100037058 Voltage-dependent calcium channel subunit alpha-2/delta-2 Human genes 0.000 description 1
- 102100029465 WD repeat and FYVE domain-containing protein 3 Human genes 0.000 description 1
- 102100039743 WD repeat-containing protein 18 Human genes 0.000 description 1
- 108091007416 X-inactive specific transcript Proteins 0.000 description 1
- 108091035715 XIST (gene) Proteins 0.000 description 1
- 102100027905 XK-related protein 8 Human genes 0.000 description 1
- 108010004696 Xenotropic and Polytropic Retrovirus Receptor Proteins 0.000 description 1
- 102100036974 Xenotropic and polytropic retrovirus receptor 1 Human genes 0.000 description 1
- 238000001801 Z-test Methods 0.000 description 1
- 102100023555 Zinc finger protein 135 Human genes 0.000 description 1
- 102100036555 Zinc finger protein 234 Human genes 0.000 description 1
- 102100024723 Zinc finger protein 346 Human genes 0.000 description 1
- 102100021348 Zinc finger protein 438 Human genes 0.000 description 1
- 102100034642 Zinc finger protein 550 Human genes 0.000 description 1
- 102100021103 Zinc finger protein 618 Human genes 0.000 description 1
- 102100036296 Zinc finger protein DPF3 Human genes 0.000 description 1
- 102100026200 Zinc finger protein PLAG1 Human genes 0.000 description 1
- 102100032571 Zinc finger protein PLAGL2 Human genes 0.000 description 1
- JLCPHMBAVCMARE-UHFFFAOYSA-N [3-[[3-[[3-[[3-[[3-[[3-[[3-[[3-[[3-[[3-[[3-[[5-(2-amino-6-oxo-1H-purin-9-yl)-3-[[3-[[3-[[3-[[3-[[3-[[5-(2-amino-6-oxo-1H-purin-9-yl)-3-[[5-(2-amino-6-oxo-1H-purin-9-yl)-3-hydroxyoxolan-2-yl]methoxy-hydroxyphosphoryl]oxyoxolan-2-yl]methoxy-hydroxyphosphoryl]oxy-5-(5-methyl-2,4-dioxopyrimidin-1-yl)oxolan-2-yl]methoxy-hydroxyphosphoryl]oxy-5-(6-aminopurin-9-yl)oxolan-2-yl]methoxy-hydroxyphosphoryl]oxy-5-(6-aminopurin-9-yl)oxolan-2-yl]methoxy-hydroxyphosphoryl]oxy-5-(6-aminopurin-9-yl)oxolan-2-yl]methoxy-hydroxyphosphoryl]oxy-5-(6-aminopurin-9-yl)oxolan-2-yl]methoxy-hydroxyphosphoryl]oxyoxolan-2-yl]methoxy-hydroxyphosphoryl]oxy-5-(5-methyl-2,4-dioxopyrimidin-1-yl)oxolan-2-yl]methoxy-hydroxyphosphoryl]oxy-5-(4-amino-2-oxopyrimidin-1-yl)oxolan-2-yl]methoxy-hydroxyphosphoryl]oxy-5-(5-methyl-2,4-dioxopyrimidin-1-yl)oxolan-2-yl]methoxy-hydroxyphosphoryl]oxy-5-(5-methyl-2,4-dioxopyrimidin-1-yl)oxolan-2-yl]methoxy-hydroxyphosphoryl]oxy-5-(6-aminopurin-9-yl)oxolan-2-yl]methoxy-hydroxyphosphoryl]oxy-5-(6-aminopurin-9-yl)oxolan-2-yl]methoxy-hydroxyphosphoryl]oxy-5-(4-amino-2-oxopyrimidin-1-yl)oxolan-2-yl]methoxy-hydroxyphosphoryl]oxy-5-(4-amino-2-oxopyrimidin-1-yl)oxolan-2-yl]methoxy-hydroxyphosphoryl]oxy-5-(4-amino-2-oxopyrimidin-1-yl)oxolan-2-yl]methoxy-hydroxyphosphoryl]oxy-5-(6-aminopurin-9-yl)oxolan-2-yl]methoxy-hydroxyphosphoryl]oxy-5-(4-amino-2-oxopyrimidin-1-yl)oxolan-2-yl]methyl [5-(6-aminopurin-9-yl)-2-(hydroxymethyl)oxolan-3-yl] hydrogen phosphate Polymers Cc1cn(C2CC(OP(O)(=O)OCC3OC(CC3OP(O)(=O)OCC3OC(CC3O)n3cnc4c3nc(N)[nH]c4=O)n3cnc4c3nc(N)[nH]c4=O)C(COP(O)(=O)OC3CC(OC3COP(O)(=O)OC3CC(OC3COP(O)(=O)OC3CC(OC3COP(O)(=O)OC3CC(OC3COP(O)(=O)OC3CC(OC3COP(O)(=O)OC3CC(OC3COP(O)(=O)OC3CC(OC3COP(O)(=O)OC3CC(OC3COP(O)(=O)OC3CC(OC3COP(O)(=O)OC3CC(OC3COP(O)(=O)OC3CC(OC3COP(O)(=O)OC3CC(OC3COP(O)(=O)OC3CC(OC3COP(O)(=O)OC3CC(OC3COP(O)(=O)OC3CC(OC3COP(O)(=O)OC3CC(OC3COP(O)(=O)OC3CC(OC3CO)n3cnc4c(N)ncnc34)n3ccc(N)nc3=O)n3cnc4c(N)ncnc34)n3ccc(N)nc3=O)n3ccc(N)nc3=O)n3ccc(N)nc3=O)n3cnc4c(N)ncnc34)n3cnc4c(N)ncnc34)n3cc(C)c(=O)[nH]c3=O)n3cc(C)c(=O)[nH]c3=O)n3ccc(N)nc3=O)n3cc(C)c(=O)[nH]c3=O)n3cnc4c3nc(N)[nH]c4=O)n3cnc4c(N)ncnc34)n3cnc4c(N)ncnc34)n3cnc4c(N)ncnc34)n3cnc4c(N)ncnc34)O2)c(=O)[nH]c1=O JLCPHMBAVCMARE-UHFFFAOYSA-N 0.000 description 1
- 102100024150 [Pyruvate dehydrogenase (acetyl-transferring)] kinase isozyme 2, mitochondrial Human genes 0.000 description 1
- 102100034825 [Pyruvate dehydrogenase (acetyl-transferring)] kinase isozyme 4, mitochondrial Human genes 0.000 description 1
- 229960001138 acetylsalicylic acid Drugs 0.000 description 1
- 239000012190 activator Substances 0.000 description 1
- 230000001154 acute effect Effects 0.000 description 1
- 230000033289 adaptive immune response Effects 0.000 description 1
- 150000001408 amides Chemical class 0.000 description 1
- 125000000539 amino acid group Chemical group 0.000 description 1
- 210000004381 amniotic fluid Anatomy 0.000 description 1
- 230000003321 amplification Effects 0.000 description 1
- 238000000540 analysis of variance Methods 0.000 description 1
- 230000003288 anthiarrhythmic effect Effects 0.000 description 1
- 230000006909 anti-apoptosis Effects 0.000 description 1
- 230000002424 anti-apoptotic effect Effects 0.000 description 1
- 230000003178 anti-diabetic effect Effects 0.000 description 1
- 230000003276 anti-hypertensive effect Effects 0.000 description 1
- 230000003110 anti-inflammatory effect Effects 0.000 description 1
- 239000003416 antiarrhythmic agent Substances 0.000 description 1
- 229940127219 anticoagulant drug Drugs 0.000 description 1
- 239000003472 antidiabetic agent Substances 0.000 description 1
- 239000003524 antilipemic agent Substances 0.000 description 1
- 230000001640 apoptogenic effect Effects 0.000 description 1
- 210000001742 aqueous humor Anatomy 0.000 description 1
- 230000000778 atheroprotective effect Effects 0.000 description 1
- QVGXLLKOCUKJST-UHFFFAOYSA-N atomic oxygen Chemical compound [O] QVGXLLKOCUKJST-UHFFFAOYSA-N 0.000 description 1
- 210000003651 basophil Anatomy 0.000 description 1
- 210000000941 bile Anatomy 0.000 description 1
- 230000031018 biological processes and functions Effects 0.000 description 1
- 238000001574 biopsy Methods 0.000 description 1
- 230000017531 blood circulation Effects 0.000 description 1
- 238000009534 blood test Methods 0.000 description 1
- 239000010839 body fluid Substances 0.000 description 1
- 102100037490 cAMP-dependent protein kinase type I-alpha regulatory subunit Human genes 0.000 description 1
- 102100021203 cAMP-dependent protein kinase type I-beta regulatory subunit Human genes 0.000 description 1
- 239000000480 calcium channel blocker Substances 0.000 description 1
- 229910001424 calcium ion Inorganic materials 0.000 description 1
- 150000001720 carbohydrates Chemical class 0.000 description 1
- 235000014633 carbohydrates Nutrition 0.000 description 1
- 150000001735 carboxylic acids Chemical class 0.000 description 1
- 230000000747 cardiac effect Effects 0.000 description 1
- 230000015556 catabolic process Effects 0.000 description 1
- 230000003197 catalytic effect Effects 0.000 description 1
- 230000020411 cell activation Effects 0.000 description 1
- 230000023402 cell communication Effects 0.000 description 1
- 230000030833 cell death Effects 0.000 description 1
- 230000003915 cell function Effects 0.000 description 1
- 230000024856 cell surface receptor signaling pathway Effects 0.000 description 1
- 230000011228 cellular component movement Effects 0.000 description 1
- 230000011552 cellular defense response Effects 0.000 description 1
- 230000019522 cellular metabolic process Effects 0.000 description 1
- 230000033077 cellular process Effects 0.000 description 1
- 230000011994 cellular protein metabolic process Effects 0.000 description 1
- 230000036755 cellular response Effects 0.000 description 1
- 230000022427 cellular response to chemical stimulus Effects 0.000 description 1
- 210000001175 cerebrospinal fluid Anatomy 0.000 description 1
- 239000003795 chemical substances by application Substances 0.000 description 1
- 238000000546 chi-square test Methods 0.000 description 1
- 235000012000 cholesterol Nutrition 0.000 description 1
- 238000004587 chromatography analysis Methods 0.000 description 1
- 230000001684 chronic effect Effects 0.000 description 1
- 210000001268 chyle Anatomy 0.000 description 1
- 210000004913 chyme Anatomy 0.000 description 1
- 238000002967 competitive immunoassay Methods 0.000 description 1
- 230000000295 complement effect Effects 0.000 description 1
- 150000001875 compounds Chemical class 0.000 description 1
- 238000010968 computed tomography angiography Methods 0.000 description 1
- 238000012790 confirmation Methods 0.000 description 1
- 239000002872 contrast media Substances 0.000 description 1
- 238000007796 conventional method Methods 0.000 description 1
- 229910001431 copper ion Inorganic materials 0.000 description 1
- 101150052649 ctbp2 gene Proteins 0.000 description 1
- 102000003675 cytokine receptors Human genes 0.000 description 1
- 108010057085 cytokine receptors Proteins 0.000 description 1
- 210000000805 cytoplasm Anatomy 0.000 description 1
- 210000000172 cytosol Anatomy 0.000 description 1
- 238000013480 data collection Methods 0.000 description 1
- 230000034994 death Effects 0.000 description 1
- 230000004665 defense response Effects 0.000 description 1
- 230000012969 defense response to bacterium Effects 0.000 description 1
- 239000007857 degradation product Substances 0.000 description 1
- 238000009795 derivation Methods 0.000 description 1
- 238000002405 diagnostic procedure Methods 0.000 description 1
- 238000010586 diagram Methods 0.000 description 1
- 235000014113 dietary fatty acids Nutrition 0.000 description 1
- 108020001096 dihydrofolate reductase Proteins 0.000 description 1
- 201000011304 dilated cardiomyopathy 1A Diseases 0.000 description 1
- 238000006471 dimerization reaction Methods 0.000 description 1
- 230000009266 disease activity Effects 0.000 description 1
- 208000035475 disorder Diseases 0.000 description 1
- 125000002228 disulfide group Chemical group 0.000 description 1
- 210000003979 eosinophil Anatomy 0.000 description 1
- 230000029142 excretion Effects 0.000 description 1
- 238000013401 experimental design Methods 0.000 description 1
- 210000003722 extracellular fluid Anatomy 0.000 description 1
- 102100021145 fMet-Leu-Phe receptor Human genes 0.000 description 1
- 229930195729 fatty acid Natural products 0.000 description 1
- 239000000194 fatty acid Substances 0.000 description 1
- 150000004665 fatty acids Chemical class 0.000 description 1
- 238000000684 flow cytometry Methods 0.000 description 1
- 238000009472 formulation Methods 0.000 description 1
- 230000005182 global health Effects 0.000 description 1
- PCHJSUWPFVWCPO-UHFFFAOYSA-N gold Chemical compound [Au] PCHJSUWPFVWCPO-UHFFFAOYSA-N 0.000 description 1
- 230000037308 hair color Effects 0.000 description 1
- 230000036541 health Effects 0.000 description 1
- 230000011132 hemopoiesis Effects 0.000 description 1
- 230000005148 hemopoietic or lymphoid organ development Effects 0.000 description 1
- 235000020256 human milk Nutrition 0.000 description 1
- 210000004251 human milk Anatomy 0.000 description 1
- 230000028996 humoral immune response Effects 0.000 description 1
- 230000005934 immune activation Effects 0.000 description 1
- 210000002865 immune cell Anatomy 0.000 description 1
- 230000033209 immune effector process Effects 0.000 description 1
- 230000034435 immune system development Effects 0.000 description 1
- 230000016788 immune system process Effects 0.000 description 1
- 238000003018 immunoassay Methods 0.000 description 1
- 238000010166 immunofluorescence Methods 0.000 description 1
- 238000001114 immunoprecipitation Methods 0.000 description 1
- 230000001506 immunosuppresive effect Effects 0.000 description 1
- 238000000338 in vitro Methods 0.000 description 1
- 238000001727 in vivo Methods 0.000 description 1
- 230000006882 induction of apoptosis Effects 0.000 description 1
- 230000007435 induction of apoptosis by extracellular signals Effects 0.000 description 1
- 230000015084 induction of apoptosis via death domain receptors Effects 0.000 description 1
- 230000010661 induction of programmed cell death Effects 0.000 description 1
- 230000002757 inflammatory effect Effects 0.000 description 1
- 230000004054 inflammatory process Effects 0.000 description 1
- 230000028709 inflammatory response Effects 0.000 description 1
- 230000002401 inhibitory effect Effects 0.000 description 1
- 210000002977 intracellular fluid Anatomy 0.000 description 1
- 230000031146 intracellular signal transduction Effects 0.000 description 1
- 238000001990 intravenous administration Methods 0.000 description 1
- 150000002500 ions Chemical class 0.000 description 1
- 230000000302 ischemic effect Effects 0.000 description 1
- 150000004715 keto acids Chemical class 0.000 description 1
- 150000002576 ketones Chemical class 0.000 description 1
- 229940043355 kinase inhibitor Drugs 0.000 description 1
- 230000021633 leukocyte mediated immunity Effects 0.000 description 1
- 150000002632 lipids Chemical class 0.000 description 1
- 238000005461 lubrication Methods 0.000 description 1
- 210000002751 lymph Anatomy 0.000 description 1
- 239000003120 macrolide antibiotic agent Substances 0.000 description 1
- 230000018729 macromolecule modification Effects 0.000 description 1
- 210000002540 macrophage Anatomy 0.000 description 1
- 238000004949 mass spectrometry Methods 0.000 description 1
- 239000000463 material Substances 0.000 description 1
- 210000004914 menses Anatomy 0.000 description 1
- 239000002207 metabolite Substances 0.000 description 1
- 229910021645 metal ion Inorganic materials 0.000 description 1
- 238000013508 migration Methods 0.000 description 1
- 230000005012 migration Effects 0.000 description 1
- 238000005065 mining Methods 0.000 description 1
- 230000004898 mitochondrial function Effects 0.000 description 1
- 239000000203 mixture Substances 0.000 description 1
- 230000004048 modification Effects 0.000 description 1
- 238000012986 modification Methods 0.000 description 1
- 238000010369 molecular cloning Methods 0.000 description 1
- 239000003068 molecular probe Substances 0.000 description 1
- 230000014313 molecular transducer activity Effects 0.000 description 1
- 210000003097 mucus Anatomy 0.000 description 1
- 230000003387 muscular Effects 0.000 description 1
- 230000002107 myocardial effect Effects 0.000 description 1
- 210000004165 myocardium Anatomy 0.000 description 1
- 230000017074 necrotic cell death Effects 0.000 description 1
- 230000007837 negative regulation of B cell activation Effects 0.000 description 1
- 230000018485 negative regulation of S phase of mitotic cell cycle Effects 0.000 description 1
- 230000013184 negative regulation of T cell differentiation Effects 0.000 description 1
- 230000007777 negative regulation of adaptive immune response Effects 0.000 description 1
- 230000005720 negative regulation of adaptive immune response based on somatic recombination of immune receptors built from immunoglobulin superfamily domains Effects 0.000 description 1
- 230000010807 negative regulation of binding Effects 0.000 description 1
- 230000016864 negative regulation of biological process Effects 0.000 description 1
- 230000023578 negative regulation of cell adhesion Effects 0.000 description 1
- 230000029266 negative regulation of cell death Effects 0.000 description 1
- 230000035407 negative regulation of cell proliferation Effects 0.000 description 1
- 230000011260 negative regulation of cellular process Effects 0.000 description 1
- 230000011008 negative regulation of cytokine biosynthetic process Effects 0.000 description 1
- 230000030449 negative regulation of immune effector process Effects 0.000 description 1
- 230000012177 negative regulation of immune response Effects 0.000 description 1
- 230000014040 negative regulation of leukocyte activation Effects 0.000 description 1
- 230000015200 negative regulation of leukocyte mediated immunity Effects 0.000 description 1
- 230000005375 negative regulation of lymphocyte activation Effects 0.000 description 1
- 230000021213 negative regulation of lymphocyte differentiation Effects 0.000 description 1
- 230000015226 negative regulation of lymphocyte mediated immunity Effects 0.000 description 1
- 230000018572 negative regulation of macromolecule biosynthetic process Effects 0.000 description 1
- 230000020604 negative regulation of macromolecule metabolic process Effects 0.000 description 1
- 230000018901 negative regulation of programmed cell death Effects 0.000 description 1
- 230000013738 negative regulation of sequence-specific DNA binding transcription factor activity Effects 0.000 description 1
- 230000023933 negative regulation of transcription from RNA polymerase II promoter Effects 0.000 description 1
- 238000004848 nephelometry Methods 0.000 description 1
- 230000031972 neutrophil apoptotic process Effects 0.000 description 1
- 235000020925 non fasting Nutrition 0.000 description 1
- 239000000041 non-steroidal anti-inflammatory agent Substances 0.000 description 1
- 229940021182 non-steroidal anti-inflammatory drug Drugs 0.000 description 1
- 238000003199 nucleic acid amplification method Methods 0.000 description 1
- 239000002777 nucleoside Substances 0.000 description 1
- 150000003833 nucleoside derivatives Chemical class 0.000 description 1
- 210000004940 nucleus Anatomy 0.000 description 1
- 150000007524 organic acids Chemical class 0.000 description 1
- 108010027635 osteoclast stimulating factor Proteins 0.000 description 1
- 230000033116 oxidation-reduction process Effects 0.000 description 1
- 229910052760 oxygen Inorganic materials 0.000 description 1
- 239000001301 oxygen Substances 0.000 description 1
- 230000004802 pathophysiological signal Effects 0.000 description 1
- 239000008188 pellet Substances 0.000 description 1
- 150000002972 pentoses Chemical class 0.000 description 1
- 230000006190 peptidyl-amino acid modification Effects 0.000 description 1
- 230000020925 peptidyl-tyrosine modification Effects 0.000 description 1
- 230000010412 perfusion Effects 0.000 description 1
- 230000000144 pharmacologic effect Effects 0.000 description 1
- NBIIXXVUZAFLBC-UHFFFAOYSA-K phosphate Chemical compound [O-]P([O-])([O-])=O NBIIXXVUZAFLBC-UHFFFAOYSA-K 0.000 description 1
- 239000010452 phosphate Substances 0.000 description 1
- 239000003428 phospholipase inhibitor Substances 0.000 description 1
- 229910052698 phosphorus Inorganic materials 0.000 description 1
- 239000011574 phosphorus Substances 0.000 description 1
- 230000026731 phosphorylation Effects 0.000 description 1
- 238000006366 phosphorylation reaction Methods 0.000 description 1
- 102000020233 phosphotransferase Human genes 0.000 description 1
- 239000003757 phosphotransferase inhibitor Substances 0.000 description 1
- 210000002381 plasma Anatomy 0.000 description 1
- 210000004910 pleural fluid Anatomy 0.000 description 1
- 102000054765 polymorphisms of proteins Human genes 0.000 description 1
- 229920001184 polypeptide Chemical group 0.000 description 1
- 230000004815 positive regulation of T cell activation Effects 0.000 description 1
- 230000028046 positive regulation of T cell differentiation Effects 0.000 description 1
- 230000006659 positive regulation of apoptotic process Effects 0.000 description 1
- 230000016919 positive regulation of biological process Effects 0.000 description 1
- 230000006045 positive regulation of cell activation Effects 0.000 description 1
- 230000026229 positive regulation of cell death Effects 0.000 description 1
- 230000035119 positive regulation of cellular process Effects 0.000 description 1
- 230000010842 positive regulation of defense response Effects 0.000 description 1
- 230000027317 positive regulation of immune response Effects 0.000 description 1
- 230000006979 positive regulation of immune system process Effects 0.000 description 1
- 230000023123 positive regulation of leukocyte activation Effects 0.000 description 1
- 230000030454 positive regulation of lymphocyte activation Effects 0.000 description 1
- 230000021215 positive regulation of lymphocyte differentiation Effects 0.000 description 1
- 230000018855 positive regulation of programmed cell death Effects 0.000 description 1
- 230000024421 positive regulation of response to stimulus Effects 0.000 description 1
- 230000031479 positive regulation of translation Effects 0.000 description 1
- 230000004481 post-translational protein modification Effects 0.000 description 1
- 238000007781 pre-processing Methods 0.000 description 1
- 238000004321 preservation Methods 0.000 description 1
- 230000019525 primary metabolic process Effects 0.000 description 1
- 238000002731 protein assay Methods 0.000 description 1
- 230000020167 protein autophosphorylation Effects 0.000 description 1
- 230000022558 protein metabolic process Effects 0.000 description 1
- 230000033998 protein modification process Effects 0.000 description 1
- 230000009822 protein phosphorylation Effects 0.000 description 1
- 230000005451 protein repair Effects 0.000 description 1
- 210000004915 pus Anatomy 0.000 description 1
- 238000001303 quality assessment method Methods 0.000 description 1
- 238000004445 quantitative analysis Methods 0.000 description 1
- 108010033990 rab27 GTP-Binding Proteins Proteins 0.000 description 1
- 108010062302 rac1 GTP Binding Protein Proteins 0.000 description 1
- 230000005855 radiation Effects 0.000 description 1
- 102000016914 ras Proteins Human genes 0.000 description 1
- 108010014186 ras Proteins Proteins 0.000 description 1
- 239000003642 reactive oxygen metabolite Substances 0.000 description 1
- 238000003753 real-time PCR Methods 0.000 description 1
- 108700015048 receptor decoy activity proteins Proteins 0.000 description 1
- 102000005962 receptors Human genes 0.000 description 1
- 108020003175 receptors Proteins 0.000 description 1
- 230000006798 recombination Effects 0.000 description 1
- 238000005215 recombination Methods 0.000 description 1
- 230000009467 reduction Effects 0.000 description 1
- 238000000611 regression analysis Methods 0.000 description 1
- 230000003830 regulated secretory pathway Effects 0.000 description 1
- 230000007974 regulation of B cell activation Effects 0.000 description 1
- 230000019067 regulation of B cell mediated immunity Effects 0.000 description 1
- 230000019908 regulation of T cell activation Effects 0.000 description 1
- 230000013183 regulation of T cell differentiation Effects 0.000 description 1
- 230000034575 regulation of T-helper 2 cell differentiation Effects 0.000 description 1
- 230000016413 regulation of adaptive immune response Effects 0.000 description 1
- 230000031473 regulation of adaptive immune response based on somatic recombination of immune receptors built from immunoglobulin superfamily domains Effects 0.000 description 1
- 230000025915 regulation of apoptotic process Effects 0.000 description 1
- 230000012385 regulation of binding Effects 0.000 description 1
- 230000015909 regulation of biological process Effects 0.000 description 1
- 230000007980 regulation of cell activation Effects 0.000 description 1
- 230000024155 regulation of cell adhesion Effects 0.000 description 1
- 230000020129 regulation of cell death Effects 0.000 description 1
- 230000025053 regulation of cell proliferation Effects 0.000 description 1
- 230000011363 regulation of cellular process Effects 0.000 description 1
- 230000011053 regulation of cytokine biosynthetic process Effects 0.000 description 1
- 230000024833 regulation of cytokine production Effects 0.000 description 1
- 230000012500 regulation of defense response Effects 0.000 description 1
- 230000013840 regulation of hydrogen peroxide metabolic process Effects 0.000 description 1
- 230000025323 regulation of immune effector process Effects 0.000 description 1
- 230000012121 regulation of immune response Effects 0.000 description 1
- 230000004985 regulation of immune system process Effects 0.000 description 1
- 230000015137 regulation of immunoglobulin mediated immune response Effects 0.000 description 1
- 230000031337 regulation of inflammatory response Effects 0.000 description 1
- 230000014176 regulation of innate immune response Effects 0.000 description 1
- 230000014038 regulation of leukocyte activation Effects 0.000 description 1
- 230000015863 regulation of leukocyte mediated immunity Effects 0.000 description 1
- 230000034442 regulation of leukocyte proliferation Effects 0.000 description 1
- 230000005334 regulation of lymphocyte activation Effects 0.000 description 1
- 230000013598 regulation of lymphocyte differentiation Effects 0.000 description 1
- 230000015237 regulation of lymphocyte mediated immunity Effects 0.000 description 1
- 230000006716 regulation of lymphocyte proliferation Effects 0.000 description 1
- 230000034602 regulation of mononuclear cell proliferation Effects 0.000 description 1
- 230000018866 regulation of programmed cell death Effects 0.000 description 1
- 230000004356 regulation of respiratory burst Effects 0.000 description 1
- 230000012664 regulation of response to stimulus Effects 0.000 description 1
- 230000020274 regulation of response to stress Effects 0.000 description 1
- 230000007155 regulation of transcription from RNA polymerase II promoter Effects 0.000 description 1
- 230000018060 regulation of type 2 immune response Effects 0.000 description 1
- 230000010076 replication Effects 0.000 description 1
- 230000012423 response to bacterium Effects 0.000 description 1
- 230000024428 response to biotic stimulus Effects 0.000 description 1
- 230000025969 response to chemical stimulus Effects 0.000 description 1
- 230000008268 response to external stimulus Effects 0.000 description 1
- 230000003756 response to other organism Effects 0.000 description 1
- 230000021670 response to stimulus Effects 0.000 description 1
- 230000008399 response to wounding Effects 0.000 description 1
- 206010039073 rheumatoid arthritis Diseases 0.000 description 1
- 239000002342 ribonucleoside Substances 0.000 description 1
- 210000004708 ribosome subunit Anatomy 0.000 description 1
- 150000003873 salicylate salts Chemical class 0.000 description 1
- 210000003296 saliva Anatomy 0.000 description 1
- 238000007790 scraping Methods 0.000 description 1
- 210000002374 sebum Anatomy 0.000 description 1
- 230000024053 secondary metabolic process Effects 0.000 description 1
- 210000000582 semen Anatomy 0.000 description 1
- 210000002966 serum Anatomy 0.000 description 1
- 230000029003 signal transducer activity Effects 0.000 description 1
- 102000030938 small GTPase Human genes 0.000 description 1
- 108060007624 small GTPase Proteins 0.000 description 1
- 230000000391 smoking effect Effects 0.000 description 1
- 239000007787 solid Substances 0.000 description 1
- 238000010561 standard procedure Methods 0.000 description 1
- 102000003314 structural constituent of ribosome Human genes 0.000 description 1
- 108040010326 structural constituent of ribosome Proteins 0.000 description 1
- 239000000126 substance Substances 0.000 description 1
- 125000004354 sulfur functional group Chemical group 0.000 description 1
- 108010045815 superoxide dismutase 2 Proteins 0.000 description 1
- 238000012706 support-vector machine Methods 0.000 description 1
- 210000004243 sweat Anatomy 0.000 description 1
- 210000001179 synovial fluid Anatomy 0.000 description 1
- 238000012353 t test Methods 0.000 description 1
- 102100021776 tRNA-splicing endonuclease subunit Sen34 Human genes 0.000 description 1
- 210000001138 tear Anatomy 0.000 description 1
- 238000000844 transformation Methods 0.000 description 1
- 238000013519 translation Methods 0.000 description 1
- 102000027257 transmembrane receptors Human genes 0.000 description 1
- 108091008578 transmembrane receptors Proteins 0.000 description 1
- 150000003626 triacylglycerols Chemical class 0.000 description 1
- 239000001226 triphosphate Substances 0.000 description 1
- 235000011178 triphosphate Nutrition 0.000 description 1
- UNXRWKVEANCORM-UHFFFAOYSA-N triphosphoric acid Chemical compound OP(O)(=O)OP(O)(=O)OP(O)(O)=O UNXRWKVEANCORM-UHFFFAOYSA-N 0.000 description 1
- 238000004879 turbidimetry Methods 0.000 description 1
- 210000002700 urine Anatomy 0.000 description 1
- 229940124549 vasodilator Drugs 0.000 description 1
- 239000003071 vasodilator agent Substances 0.000 description 1
- 230000029812 viral genome replication Effects 0.000 description 1
- 210000004916 vomit Anatomy 0.000 description 1
- 230000008673 vomiting Effects 0.000 description 1
- 102100036538 von Willebrand factor C and EGF domain-containing protein Human genes 0.000 description 1
- 238000001262 western blot Methods 0.000 description 1
Images


Classifications
-
- G—PHYSICS
- G16—INFORMATION AND COMMUNICATION TECHNOLOGY [ICT] SPECIALLY ADAPTED FOR SPECIFIC APPLICATION FIELDS
- G16H—HEALTHCARE INFORMATICS, i.e. INFORMATION AND COMMUNICATION TECHNOLOGY [ICT] SPECIALLY ADAPTED FOR THE HANDLING OR PROCESSING OF MEDICAL OR HEALTHCARE DATA
- G16H50/00—ICT specially adapted for medical diagnosis, medical simulation or medical data mining; ICT specially adapted for detecting, monitoring or modelling epidemics or pandemics
- G16H50/30—ICT specially adapted for medical diagnosis, medical simulation or medical data mining; ICT specially adapted for detecting, monitoring or modelling epidemics or pandemics for calculating health indices; for individual health risk assessment
-
- C—CHEMISTRY; METALLURGY
- C12—BIOCHEMISTRY; BEER; SPIRITS; WINE; VINEGAR; MICROBIOLOGY; ENZYMOLOGY; MUTATION OR GENETIC ENGINEERING
- C12Q—MEASURING OR TESTING PROCESSES INVOLVING ENZYMES, NUCLEIC ACIDS OR MICROORGANISMS; COMPOSITIONS OR TEST PAPERS THEREFOR; PROCESSES OF PREPARING SUCH COMPOSITIONS; CONDITION-RESPONSIVE CONTROL IN MICROBIOLOGICAL OR ENZYMOLOGICAL PROCESSES
- C12Q1/00—Measuring or testing processes involving enzymes, nucleic acids or microorganisms; Compositions therefor; Processes of preparing such compositions
- C12Q1/68—Measuring or testing processes involving enzymes, nucleic acids or microorganisms; Compositions therefor; Processes of preparing such compositions involving nucleic acids
- C12Q1/6876—Nucleic acid products used in the analysis of nucleic acids, e.g. primers or probes
- C12Q1/6883—Nucleic acid products used in the analysis of nucleic acids, e.g. primers or probes for diseases caused by alterations of genetic material
-
- G—PHYSICS
- G01—MEASURING; TESTING
- G01N—INVESTIGATING OR ANALYSING MATERIALS BY DETERMINING THEIR CHEMICAL OR PHYSICAL PROPERTIES
- G01N33/00—Investigating or analysing materials by specific methods not covered by groups G01N1/00 - G01N31/00
- G01N33/48—Biological material, e.g. blood, urine; Haemocytometers
- G01N33/50—Chemical analysis of biological material, e.g. blood, urine; Testing involving biospecific ligand binding methods; Immunological testing
- G01N33/53—Immunoassay; Biospecific binding assay; Materials therefor
- G01N33/5308—Immunoassay; Biospecific binding assay; Materials therefor for analytes not provided for elsewhere, e.g. nucleic acids, uric acid, worms, mites
-
- G—PHYSICS
- G16—INFORMATION AND COMMUNICATION TECHNOLOGY [ICT] SPECIALLY ADAPTED FOR SPECIFIC APPLICATION FIELDS
- G16B—BIOINFORMATICS, i.e. INFORMATION AND COMMUNICATION TECHNOLOGY [ICT] SPECIALLY ADAPTED FOR GENETIC OR PROTEIN-RELATED DATA PROCESSING IN COMPUTATIONAL MOLECULAR BIOLOGY
- G16B25/00—ICT specially adapted for hybridisation; ICT specially adapted for gene or protein expression
-
- G—PHYSICS
- G16—INFORMATION AND COMMUNICATION TECHNOLOGY [ICT] SPECIALLY ADAPTED FOR SPECIFIC APPLICATION FIELDS
- G16B—BIOINFORMATICS, i.e. INFORMATION AND COMMUNICATION TECHNOLOGY [ICT] SPECIALLY ADAPTED FOR GENETIC OR PROTEIN-RELATED DATA PROCESSING IN COMPUTATIONAL MOLECULAR BIOLOGY
- G16B25/00—ICT specially adapted for hybridisation; ICT specially adapted for gene or protein expression
- G16B25/10—Gene or protein expression profiling; Expression-ratio estimation or normalisation
-
- G—PHYSICS
- G16—INFORMATION AND COMMUNICATION TECHNOLOGY [ICT] SPECIALLY ADAPTED FOR SPECIFIC APPLICATION FIELDS
- G16B—BIOINFORMATICS, i.e. INFORMATION AND COMMUNICATION TECHNOLOGY [ICT] SPECIALLY ADAPTED FOR GENETIC OR PROTEIN-RELATED DATA PROCESSING IN COMPUTATIONAL MOLECULAR BIOLOGY
- G16B40/00—ICT specially adapted for biostatistics; ICT specially adapted for bioinformatics-related machine learning or data mining, e.g. knowledge discovery or pattern finding
- G16B40/20—Supervised data analysis
-
- G—PHYSICS
- G16—INFORMATION AND COMMUNICATION TECHNOLOGY [ICT] SPECIALLY ADAPTED FOR SPECIFIC APPLICATION FIELDS
- G16B—BIOINFORMATICS, i.e. INFORMATION AND COMMUNICATION TECHNOLOGY [ICT] SPECIALLY ADAPTED FOR GENETIC OR PROTEIN-RELATED DATA PROCESSING IN COMPUTATIONAL MOLECULAR BIOLOGY
- G16B40/00—ICT specially adapted for biostatistics; ICT specially adapted for bioinformatics-related machine learning or data mining, e.g. knowledge discovery or pattern finding
- G16B40/30—Unsupervised data analysis
-
- G—PHYSICS
- G16—INFORMATION AND COMMUNICATION TECHNOLOGY [ICT] SPECIALLY ADAPTED FOR SPECIFIC APPLICATION FIELDS
- G16H—HEALTHCARE INFORMATICS, i.e. INFORMATION AND COMMUNICATION TECHNOLOGY [ICT] SPECIALLY ADAPTED FOR THE HANDLING OR PROCESSING OF MEDICAL OR HEALTHCARE DATA
- G16H10/00—ICT specially adapted for the handling or processing of patient-related medical or healthcare data
-
- C—CHEMISTRY; METALLURGY
- C12—BIOCHEMISTRY; BEER; SPIRITS; WINE; VINEGAR; MICROBIOLOGY; ENZYMOLOGY; MUTATION OR GENETIC ENGINEERING
- C12Q—MEASURING OR TESTING PROCESSES INVOLVING ENZYMES, NUCLEIC ACIDS OR MICROORGANISMS; COMPOSITIONS OR TEST PAPERS THEREFOR; PROCESSES OF PREPARING SUCH COMPOSITIONS; CONDITION-RESPONSIVE CONTROL IN MICROBIOLOGICAL OR ENZYMOLOGICAL PROCESSES
- C12Q2600/00—Oligonucleotides characterized by their use
- C12Q2600/112—Disease subtyping, staging or classification
-
- C—CHEMISTRY; METALLURGY
- C12—BIOCHEMISTRY; BEER; SPIRITS; WINE; VINEGAR; MICROBIOLOGY; ENZYMOLOGY; MUTATION OR GENETIC ENGINEERING
- C12Q—MEASURING OR TESTING PROCESSES INVOLVING ENZYMES, NUCLEIC ACIDS OR MICROORGANISMS; COMPOSITIONS OR TEST PAPERS THEREFOR; PROCESSES OF PREPARING SUCH COMPOSITIONS; CONDITION-RESPONSIVE CONTROL IN MICROBIOLOGICAL OR ENZYMOLOGICAL PROCESSES
- C12Q2600/00—Oligonucleotides characterized by their use
- C12Q2600/158—Expression markers
-
- C—CHEMISTRY; METALLURGY
- C12—BIOCHEMISTRY; BEER; SPIRITS; WINE; VINEGAR; MICROBIOLOGY; ENZYMOLOGY; MUTATION OR GENETIC ENGINEERING
- C12Q—MEASURING OR TESTING PROCESSES INVOLVING ENZYMES, NUCLEIC ACIDS OR MICROORGANISMS; COMPOSITIONS OR TEST PAPERS THEREFOR; PROCESSES OF PREPARING SUCH COMPOSITIONS; CONDITION-RESPONSIVE CONTROL IN MICROBIOLOGICAL OR ENZYMOLOGICAL PROCESSES
- C12Q2600/00—Oligonucleotides characterized by their use
- C12Q2600/16—Primer sets for multiplex assays
-
- G—PHYSICS
- G16—INFORMATION AND COMMUNICATION TECHNOLOGY [ICT] SPECIALLY ADAPTED FOR SPECIFIC APPLICATION FIELDS
- G16B—BIOINFORMATICS, i.e. INFORMATION AND COMMUNICATION TECHNOLOGY [ICT] SPECIALLY ADAPTED FOR GENETIC OR PROTEIN-RELATED DATA PROCESSING IN COMPUTATIONAL MOLECULAR BIOLOGY
- G16B40/00—ICT specially adapted for biostatistics; ICT specially adapted for bioinformatics-related machine learning or data mining, e.g. knowledge discovery or pattern finding
Definitions
- the invention relates to predictive models for determining the extent of coronary artery disease (CAD) risk based on marker expression measurements, to their methods of use, and to computer systems and software for their implementation.
- CAD coronary artery disease
- the "gold standard" for detecting CAD is invasive coronary angiography; however, this is costly, and can pose risk to the patient.
- non-invasive diagnostic modalities such as myocardial perfusion imaging (MPI) and CT-angiography may be used, however these have complications including radiation exposure, contrast agent sensitivity, and only add moderately to obstructive CAD identification. 9,10
- WO 2009/049257 A2 (Cardio DX, Inc.) published on 16 April 2009; WO 2005/040422 A2 (Novartis AG/Novartis Pharma GmbH) published on 6 May 2005; Ma and Liew, Journal of Molecular and Cellular Cardiology, vol. 35, no. 8, pages 993-998, published on 1 August 2003 ; WO 2005/103720 A1 (Medstar Research Institute) published on 3 November 2005; and US 2007/238124 A1 (Chibout et al) published on 11 October 2007 disclose potential biomarkers for diagnosing or assessing CAD.
- a non-invasive blood test that could reliably identify patients with CAD would have significant clinical utility.
- a major advancement in the fight against atherosclerosis would be the development of non-invasive diagnostic tests that can aid in the diagnosis and assessment of the extent of CAD in patients.
- marker expression and clinical factors e.g., age and gender
- the invention provides a computer-implemented method for predicting coronary artery disease (CAD) by scoring a sample obtained from a subject, comprising:
- the dataset comprises a quantitative expression level value for each marker in at least two terms selected from the group consisting of term 1, term 2, term 3, term 4, term 5, term 6, and term 7. In an embodiment, the dataset comprises a quantitative expression level value for each marker in at least three terms selected from the group consisting of term 1, term 2, term 3, term 4, term 5, term 6, and term 7. In an embodiment, the dataset comprises a quantitative expression level value for each marker in at least four terms selected from the group consisting of term 1, term 2, term 3, term 4, term 5, term 6, and term 7. In an embodiment, the dataset comprises a quantitative expression level value for each marker in at least five terms selected from the group consisting of term 1, term 2, term 3, term 4, term 5, term 6, and term 7.
- the dataset comprises a quantitative expression level value for each marker in at least six terms selected from the group consisting of term 1, term 2, term 3, term 4, term 5, term 6, and term 7. In an embodiment, the dataset comprises a quantitative expression level value for each marker in term 1, term 2, term 3, term 4, term 5, term 6, and term 7.
- the interpretation function is based on a predictive model.
- the predictive model is selected from the group consisting of a partial least squares model, a logistic regression model, a linear regression model, a linear discriminant analysis model, a ridge regression model, and a tree-based recursive partitioning model.
- the predictive model performance is characterized by an area under the curve (AUC) ranging from 0.68 to 0.70.
- the predictive model performance is characterized by an AUC ranging from 0.70 to 0.79.
- the predictive model performance is characterized by an AUC ranging from 0.80 to 0.89.
- the predictive model performance is characterized by an AUC ranging from 0.90 to 0.99.
- the dataset further includes a clinical factor.
- the clinical factor is selected from the group consisting of: age, gender, chest pain type, neutrophil count, ethnicity, disease duration, diastolic blood pressure, systolic blood pressure, a family history parameter, a medical history parameter, a medical symptom parameter, height, weight, a body-mass index, resting heart rate, and smoker/non-smoker status.
- the obtaining the dataset associated with the sample includes obtaining the sample and processing the sample to experimentally determine the dataset. In an embodiment, the obtaining the dataset associated with the sample includes receiving the dataset from a third party that has processed the sample to experimentally determine the dataset.
- the method includes classifying the sample according to a score. In an embodiment, the classifying is predictive of the presence or absence of CAD in the subject. In an embodiment, the classifying is predictive of the extent of CAD in the subject. In an embodiment, the classifying is predictive of the risk of CAD in the subject. In an embodiment, the method includes rating CAD risk based on the score.
- the sample includes peripheral blood cells.
- the peripheral blood cells include leukocytes.
- the sample includes RNA extracted from peripheral blood cells.
- the quantitative expression data are derived from hybridization data. In an embodiment, the quantitative expression data are derived from polymerase chain reaction data. In an embodiment, the quantitative expression data are derived from an antibody binding assay. In an embodiment, the dataset is obtained stored on a storage memory.
- the subject is a human. In an embodiment, the subject has stable chest pain. In an embodiment, the subject has typical angina or atypical angina or an anginal equivalent. In an embodiment, the subject has no previous diagnosis of myocardial infarction (MI). In an embodiment, the subject has not had a revascularization procedure. In an embodiment, the subject does not have diabetes. In an embodiment, the subject does not have an inflammatory condition or an infectious condition. In an embodiment, the subject is not currently taking a steroid, an immunosuppressive agent, or a chemotherapeutic agent.
- MI myocardial infarction
- a computer-implemented method for scoring a sample obtained from a subject comprising: obtaining a dataset associated with the sample, wherein the dataset comprises at least one clinical factor and quantitative expression level values for at least two markers selected from the group consisting of Genbank accession number AF161365, HNRPF, ACBD5, TFCP2, DDX18, Genbank accession number AF289562, CD248, CD79B, CD 19, SPIB, BLK, CD3D, LCK, TMC8, CCT2, S100A12, MMP9, CLEC4E, ALOX5AP, S100A8, NAMPT, RPL28, SSRP1, AQP9, GLT1D1, NCF4, NCF2, CASP5, H3F3B, IL18RAP, TXN, TNFAIP6, PLAUR, IL8RB, BCL2A1, TNFRSF10C, PTAFR, KCNE3, LAMP2, TLR4, TYROBP, SLAMF7, CX3CR1, K
- the dataset includes a clinical factor.
- the clinical factor is age and/or gender.
- the clinical factor is selected from the group consisting of: age, gender, chest pain type, neutrophil count, ethnicity, disease duration, diastolic blood pressure, systolic blood pressure, a family history parameter, a medical history parameter, a medical symptom parameter, height, weight, a body-mass index, resting heart rate, and smoker/non-smoker status.
- the dataset includes quantitative expression data for at least three markers. In an embodiment, the dataset includes quantitative expression data for at least four markers. In an embodiment, the dataset includes quantitative expression data for at least five markers. In an embodiment, the dataset includes quantitative expression data for at least six markers.
- the interpretation function is based on a predictive model.
- the predictive model is selected from the group consisting of a partial least squares model, a logistic regression model, a linear regression model, a linear discriminant analysis model, a ridge regression model, and a tree-based recursive partitioning model.
- the predictive model performance is characterized by an area under the curve (AUC) ranging from 0.68 to 0.70.
- the predictive model performance is characterized by an AUC ranging from 0.70 to 0.79.
- the predictive model performance is characterized by an AUC ranging from 0.80 to 0.89.
- the predictive model performance is characterized by an AUC ranging from 0.90 to 0.99.
- the obtaining the dataset associated with the sample includes obtaining the sample and processing the sample to experimentally determine the dataset. In an embodiment, the obtaining the dataset associated with the sample includes receiving the dataset from a third party that has processed the sample to experimentally determine the dataset.
- the method includes classifying the sample according to the score. In an embodiment, the classifying is predictive of the presence or absence of CAD in the subject. In an embodiment, the classifying is predictive of the extent of CAD in the subject. In an embodiment, the classifying is predictive of the risk of CAD in the subject. In an embodiment, the method includes rating CAD risk based on the score.
- the sample includes peripheral blood cells.
- the peripheral blood cells include leukocytes.
- the sample includes RNA extracted from peripheral blood cells.
- the quantitative expression data are derived from hybridization data. In an embodiment, the quantitative expression data are derived from polymerase chain reaction data. In an embodiment, the quantitative expression data are derived from an antibody binding assay. In an embodiment, the dataset is obtained stored on a storage memory.
- the subject is a human. In an embodiment, the subject has stable chest pain. In an embodiment, the subject has typical angina or atypical angina or an anginal equivalent. In an embodiment, the subject has no previous diagnosis of myocardial infarction (MI). In an embodiment, the subject has not had a revascularization procedure. In an embodiment, the subject does not have diabetes. In an embodiment, the subject does not have an inflammatory condition or an infectious condition. In an embodiment, the subject is not currently taking a steroid, an immunosuppressive agent, or a chemotherapeutic agent.
- MI myocardial infarction
- Also described herein is a method for predicting CAD in a subject, including: obtaining a sample from the subject, wherein the sample includes a plurality of analytes; contacting the sample with a reagent; generating a plurality of complexes between the reagent and the plurality of analytes; detecting the plurality of complexes to obtain a dataset associated with the sample, wherein the first dataset includes quantitative expression data for at least one marker set selected from the group consisting of the marker sets in term 1, term 2, term 3, term 4, term 5, term 6, and term 7; wherein term 1 includes marker 1, marker 2, and marker 3, wherein marker 1 includes AF161365, wherein marker 2 includes HNRPF or ACBD5, and wherein marker 3 includes TFCP2 or DDX18; wherein term 2 includes marker 4, marker 5, and marker 6, wherein marker 4 includes AF289562 or CD248, wherein marker 5 includes HNRPF or ACBD5, and wherein marker 6 includes TFCP2 or DDX18; wherein term 3 includes marker 7, marker
- kits for predicting CAD in a subject including: a set of reagents including a plurality of reagents for determining from a sample obtained from the subject quantitative expression data for at least one marker set selected from the group consisting of the marker sets in term 1, term 2, term 3, term 4, term 5, term 6, and term 7; wherein term 1 includes marker 1, marker 2, and marker 3, wherein marker 1 includes AF161365, wherein marker 2 includes HNRPF or ACBD5, and wherein marker 3 includes TFCP2 or DDX18; wherein term 2 includes marker 4, marker 5, and marker 6, wherein marker 4 includes AF289562 or CD248, wherein marker 5 includes HNRPF or ACBD5, and wherein marker 6 includes TFCP2 or DDX18; wherein term 3 includes marker 7, marker 8, marker 9, and marker 10 wherein marker 7 includes CD79B or CD 19, wherein marker 8 includes SPIB or BLK, wherein marker 9 includes CD3D or LCK, and wherein marker 10 includes TMC8 or CCT2; wherein
- the instructions include instructions for conducting a microarray assay. In an aspect the instructions include instructions for conducting a polymerase chain reaction assay.
- a storage memory for storing a dataset associated with a sample obtained from the subject, wherein the dataset includes quantitative expression data for at least two markers selected from the group consisting of AF161365, HNRPF, ACBD5, TFCP2, DDX18, AF289562, CD248, CD79B, CD19, SPIB, BLK, CD3D, LCK, TMC8, CCT2, S100A12, MMP9, CLEC4E, ALOX5AP, S100A8, NAMPT, RPL28, SSRP1, AQP9, GLT1D1, NCF4, NCF2, CASP5, H3F3B, IL18RAP, TXN, TNFAIP6, PLAUR, IL8RB, BCL2A1, TNFRSF10C, PTAFR, KCNE3, LAMP2, TLR4, TYROBP, SLAMF7, CX3CR1, KLRC4, and CD8A; and
- a computer-readable storage medium storing computer-executable program code, the program code including: program code for storing a dataset associated with a sample obtained from the subject, wherein the dataset includes quantitative expression data for at least two markers selected from the group consisting of AF161365, HNRPF, ACBD5, TFCP2, DDX18, AF289562, CD248, CD79B, CD19, SPIB, BLK, CD3D, LCK, TMC8, CCT2, S100A12, MMP9, CLEC4E, ALOX5AP, S100A8, NAMPT, RPL28, SSRP1, AQP9, GLT1D1, NCF4, NCF2, CASP5, H3F3B, IL18RAP, TXN, TNFAIP6, PLAUR, IL8RB, BCL2A1, TNFRSF10C, PTAFR, KCNE3, LAMP2, TLR4, TYROBP, SLAMF7, CX3CR1, KLRC4, and CD8
- Also described herein is a method for predicting CAD in a subject, including: obtaining a sample from the subject, wherein the sample includes a plurality of analytes; contacting the sample with a reagent; generating a plurality of complexes between the reagent and the plurality of analytes; detecting the plurality of complexes to obtain a dataset associated with the sample, wherein the dataset includes quantitative expression data for at least two markers selected from the group consisting of AF161365, HNRPF, ACBD5, TFCP2, DDX18, AF289562, CD248, CD79B, CD19, SPIB, BLK, CD3D, LCK, TMC8, CCT2, S100A12, MMP9, CLEC4E, ALOX5AP, S100A8, NAMPT, RPL28, SSRP1, AQP9, GLT1D1, NCF4, NCF2, CASP5, H3F3B, IL18RAP, TXN, TNFAIP6, PLA
- kits for predicting CAD in a subject including: a set of reagents including a plurality of reagents for determining from a sample obtained from the subject quantitative expression data for at least two markers selected from the group consisting of AF161365, HNRPF, ACBD5, TFCP2, DDX18, AF289562, CD248, CD79B, CD19, SPIB, BLK, CD3D, LCK, TMC8, CCT2, S100A12, MMP9, CLEC4E, ALOX5AP, S100A8, NAMPT, RPL28, SSRP1, AQP9, GLT1D1, NCF4, NCF2, CASP5, H3F3B, IL18RAP, TXN, TNFAIP6, PLAUR, IL8RB, BCL2A1, TNFRSF10C, PTAFR, KCNE3, LAMP2, TLR4, TYROBP, SLAMF7, CX3CR1, KLRC4, and CD8A
- acute coronary syndrome encompasses all forms of unstable coronary artery disease.
- coronary artery disease or "CAD” encompasses all forms of atherosclerotic disease affecting the coronary arteries.
- Ct refers to cycle threshold and is defined as the PCR cycle number where the fluorescent value is above a set threshold. Therefore, a low Ct value corresponds to a high level of expression, and a high Ct value corresponds to a low level of expression.
- Cp refers to the crossing point and is defined as the intersection of the best fit of the log-linear portion of a standard's amplification curve in a real time PCR instrument such as, e.g., a LightCycler, and the noise band (set according to background fluorescence measurements).
- FDR means to false discovery rate. FDR can be estimated by analyzing randomly-permuted datasets and tabulating the average number of genes at a given p-value threshold.
- GL GM
- GUI GL
- marker encompass, without limitation, lipids, lipoproteins, proteins, cytokines, chemokines, growth factors, peptides, nucleic acids, genes, and oligonucleotides, together with their related complexes, metabolites, mutations, variants, polymorphisms, modifications, fragments, subunits, degradation products, elements, and other analytes or sample-derived measures.
- a marker can also include mutated proteins, mutated nucleic acids, variations in copy numbers, and/or transcript variants, in circumstances in which such mutations, variations in copy number and/or transcript variants are useful for generating a predictive model, or are useful in predictive models developed using related markers (e.g., non-mutated versions of the proteins or nucleic acids, alternative transcripts, etc.).
- highly correlated gene expression or “highly correlated marker expression” refer to gene or marker expression values that have a sufficient degree of correlation to allow their interchangeable use in a predictive model of coronary artery disease.
- highly correlated marker or “highly correlated substitute marker” refer to markers that can be substituted into and/or added to a predictive model based on, e.g., the above criteria.
- a highly correlated marker can be used in at least two ways: (1) by substitution of the highly correlated marker(s) for the original marker(s) and generation of a new model for predicting CAD risk; or (2) by substitution of the highly correlated marker(s) for the original marker(s) in the existing model for predicting CAD risk.
- mammal encompasses both humans and non-humans and includes but is not limited to humans, non-human primates, canines, felines, murines, bovines, equines, and porcines.
- myocardial infarction refers to an ischemic myocardial necrosis. This is usually the result of abrupt reduction in coronary blood flow to a segment of the myocardium, the muscular tissue of the heart. Myocardial infarction can be classified into ST-elevation and non-ST elevation MI (also referred to as unstable angina). Myocardial necrosis results in either classification. Myocardial infarction, of either ST-elevation or non-ST elevation classification, is an unstable form of atherosclerotic cardiovascular disease.
- sample can include a single cell or multiple cells or fragments of cells or an aliquot of body fluid, taken from a subject, by means including venipuncture, excretion, ejaculation, massage, biopsy, needle aspirate, lavage sample, scraping, surgical incision, or intervention or other means known in the art.
- subject encompasses a cell, tissue, or organism, human or non-human, whether in vivo, ex vivo, or in vitro, male or female.
- obtaining a dataset associated with a sample encompasses obtaining a set of data determined from at least one sample.
- Obtaining a dataset encompasses obtaining a sample, and processing the sample to experimentally determine the data.
- the phrase also encompasses receiving a set of data, e.g., from a third party that has processed the sample to experimentally determine the dataset.
- the phrase encompasses mining data from at least one database or at least one publication or a combination of databases and publications.
- a dataset can be obtained by one of skill in the art via a variety of known ways including stored on a storage memory.
- Clinical factor refers to a measure of a condition of a subject, e.g., disease activity or severity.
- “Clinical factor” encompasses all markers of a subject's health status, including non-sample markers, and/or other characteristics of a subject, such as, without limitation, age and gender.
- a clinical factor can be a score, a value, or a set of values that can be obtained from evaluation of a sample (or population of samples) from a subject or a subject under a determined condition.
- a clinical factor can also be predicted by markers and/or other parameters such as gene expression surrogates.
- the quantity of one or more markers of the invention can be indicated as a value.
- a value can be one or more numerical values resulting from evaluation of a sample under a condition.
- the values can be obtained, for example, by experimentally obtaining measures from a sample by an assay performed in a laboratory, or alternatively, obtaining a dataset from a service provider such as a laboratory, or from a database or a server on which the dataset has been stored, e.g., on a storage memory.
- the quantity of one or more markers can be one or more numerical values associated with expression levels of: AF161365, HNRPF, ACBD5, TFCP2, DDX18, AF289562, CD248, HNRPF, ACBD5, TFCP2, DDX18, CD79B, CD19, SPIB, BLK, CD3D, LCK, TMC8, CCT2, S100A12, MMP9, CLEC4E, ALOX5AP, S100A8, NAMPT, RPL28, SSRP1, S100A12, MMP9, CLEC4E, ALOX5AP, S100A8, NAMPT, AQP9, GLT1D1, NCF4, NCF2, CASP5, H3F3B, IL18RAP, TXN, TNFAIP6, PLAUR, IL8RB, BCL2A1, TNFRSF10C, PTAFR, KCNE3, LAMP2, TLR4, TYROBP, SLAMF7, CX3CR1, KLRC4,
- HGNC Human Genome Organisation
- accession number(s) and aliases can be found by entering the gene name into the search page on the HGNC Search genenames.org website. For example, entering the term "CD3D" into the Simple Search field of the HGNC website on June 1,2010 returns the approved gene name of CD3D (CD3d molecule, delta (CD3-TCR complex)), the sequence accession IDs of CD3D (X01451; NM_000732), and the previous symbols of CD3D (T3D). Further human gene names are provided in the Examples section below.
- a condition can include one clinical factor or a plurality of clinical factors.
- a clinical factor can be included within a dataset.
- a dataset can include one or more, two or more, three or more, four or more, five or more, six or more, seven or more, eight or more, nine or more, ten or more, eleven or more, twelve or more, thirteen or more, fourteen or more, fifteen or more, sixteen or more, seventeen or more, eighteen or more, nineteen or more, twenty or more, twenty-one or more, twenty-two or more, twenty-three or more, twenty-four or more, twenty-five or more, twenty-six or more, twenty-seven or more, twenty-eight or more, twenty-nine or more, or thirty or more overlapping or distinct clinical factor(s).
- a clinical factor can be, for example, the condition of a subject in the presence of a disease or in the absence of a disease.
- a clinical factor can be the health status of a subject.
- a clinical factor can be age, gender, chest pain type, neutrophil count, ethnicity, disease duration, diastolic blood pressure, systolic blood pressure, a family history parameter, a medical history parameter, a medical symptom parameter, height, weight, a body-mass index, resting heart rate, and smoker/non-smoker status.
- Clinical factors can include whether the subject has stable chest pain, whether the subject has typical angina, whether the subject has atypical angina, whether the subject has an anginal equivalent, whether the subject has been previously diagnosed with MI, whether the subject has had a revascularization procedure, whether the subject has diabetes, whether the subject has an inflammatory condition, whether the subject has an infectious condition, whether the subject is taking a steroid, whether the subject is taking an immunosuppressive agent, and/or whether the subject is taking a chemotherapeutic agent.
- Other examples of clinical factors are listed in the Tables and Figures.
- a marker's associated value can be included in a dataset associated with a sample obtained from a subject.
- a dataset can include the marker expression value of two or more, three or more, four or more, five or more, six or more, seven or more, eight or more, nine or more, ten or more, eleven or more, twelve or more, thirteen or more, fourteen or more, fifteen or more, sixteen or more, seventeen or more, eighteen or more, nineteen or more, twenty or more, twenty-one or more, twenty-two or more, twenty-three or more, twenty-four or more, twenty-five or more, twenty-six or more, twenty-seven or more, twenty-eight or more, twenty-nine or more, or thirty or more marker(s).
- a dataset can include the expression values for AF161365, HNRPF, ACBD5; AF161365, HNRPF; or AF161365, ACBD5. Other combinations are described in more detail in the Examples section below.
- one or more markers can be divided into terms. Terms can include one marker, but generally include three or more markers. Terms can be included in a dataset associated with a sample obtained from a subject. The dataset can include one or more terms, two or more terms, three or more terms, four or more terms, five or more terms, six or more terms, seven or more terms, eight or more terms, nine or more terms, or ten or more terms.
- a term can include one or more, two or more, three or more, four or more, five or more, six or more, seven or more, eight or more, nine or more, ten or more, eleven or more, twelve or more, thirteen or more, fourteen or more, fifteen or more, sixteen or more, seventeen or more, eighteen or more, nineteen or more, twenty or more, twenty-one or more, twenty-two or more, twenty-three or more, twenty-four or more, twenty-five or more, twenty-six or more, twenty-seven or more, twenty-eight or more, twenty-nine or more, or thirty or more marker(s).
- the markers are divided into seven distinct terms: term 1, term 2, term 3, term 4, term 5, term 6, and term 7.
- term 1 can include marker 1, marker 2, and marker 3, where marker 1 includes AF161365, where marker 2 includes HNRPF or ACBD5, and where marker 3 includes TFCP2 or DDX18.
- term 2 can include marker 4, marker 5, and marker 6, where marker 4 includes AF289562 or CD248, where marker 5 includes HNRPF or ACBD5, and where marker 6 includes TFCP2 or DDX18.
- term 3 can include marker 7, marker 8, marker 9, and marker 10 where marker 7 includes CD79B or CD19, where marker 8 includes SPIB or BLK, where marker 9 includes CD3D or LCK, and where marker 10 includes TMC8 or CCT2.
- term 4 can include marker 11, marker 12, marker 13, and marker 14, where marker 11 includes S100A12 or MMP9, where marker 12 includes CLEC4E or ALOX5AP, where marker 13 includes S100A8 or NAMPT, and where marker 14 includes RPL28 or SSRP1.
- term 5 can include marker 15, marker 16, marker 17, marker 18, and marker 19, where marker 15 includes S100A12 or MMP9, where marker 16 includes CLEC4E or ALOX5AP, where marker 17 includes S100A8 or NAMPT, where marker 18 includes AQP9 or GLT1D1, and where marker 19 includes NCF4 or NCF2.
- term 6 can include marker 20, marker 21, marker 22, marker 23, marker 24, marker 25, and marker 26, where marker 20 includes CASP5 or H3F3B, where marker 21 includes IL18RAP or TXN, where marker 22 includes TNFAIP6 or PLAUR, where marker 23 includes IL8RB or BCL2A1, where marker 24 includes TNFRSF10C or PTAFR, where marker 25 includes KCNE3 or LAMP2, and where marker 26 includes TLR4 or TYROBP.
- term 7 can include marker 27, marker 28, marker 29, and marker 30, where marker 27 includes SLAMF7 or CX3CR1, where marker 28 includes KLRC4 or CD8A, where marker 29 includes CD3D or LCK, and where marker 30 includes TMC8 or CCT2.
- the invention includes obtaining a sample associated with a subject, where the sample includes one or more markers.
- the sample can be obtained by the subject or by a third party, e.g., a medical professional.
- medical professionals include physicians, emergency medical technicians, nurses, first responders, psychologists, medical physics personnel, nurse practitioners, surgeons, dentists, and any other obvious medical professional as would be known to one skilled in the art.
- a sample can include peripheral blood cells, isolated leukocytes, or RNA extracted from peripheral blood cells or isolated leukocytes.
- the sample can be obtained from any bodily fluid, for example, amniotic fluid, aqueous humor, bile, lymph, breast milk, interstitial fluid, blood, blood plasma, cerumen (earwax), Cowper's fluid (pre-ejaculatory fluid), chyle, chyme, female ejaculate, menses, mucus, saliva, urine, vomit, tears, vaginal lubrication, sweat, serum, semen, sebum, pus, pleural fluid, cerebrospinal fluid, synovial fluid, intracellular fluid, and vitreous humour.
- the sample is obtained by a blood draw, where the medical professional draws blood from a subject, such as by a syringe.
- the bodily fluid can then be tested to determine the value of one or more markers using an assay.
- the value of the one or more markers can then be evaluated by the same party that performed the assay using the methods of the invention or sent to a third party for evaluation using the methods of the invention.
- an interpretation function can be a function produced by a predictive model.
- An interpretation function can also be produced by a plurality of predictive models.
- an interpretation function can include terms Norm 1 , Norm 2 , NK up , T cell , B cell , Neut, N up , N down , SCA 1 , AF 2 , TSPAN, SEX, and INTERCEPT.
- Norm 1 RPL28
- Norm 2 (.5*HNRPF + .5*TFCP2)
- NK up (.5*SLAMF7 + .5*KLRC4)
- T cell (.5*CD3D + .5*TMC8)
- B cell (2/3 *CD79B + 1/3 * SPIB)
- Neut (.5*AQP9 + .5*NCF4)
- N up (1/3 * CASP5 + 1/3*IL18RAP + 1/3*TNFAIP6)
- N down (.25*IL8RB + .25*TNFRSF10C + .25*TLR4 + .25*KCNE3)
- SCA 1 (1/3*S100A12 + 1/3*CLEC4E + 1/3*S100A8)
- AF 2 AF289562
- SEX 1 for Males, 0 for Females.
- INTERCEPT Intercept + SEX + MAGE *Age, with Age in years
- INTERCEPT Intercept + OFAGE2 *max(0,Age-60)
- coefficients Intercept 1.82120871
- SEX 0.851181
- OFAGE2 0.123283
- MAGE 0.044868
- TSPAN -0.48182
- AF2 --0.24592
- Bcell -0.13717
- SCA1M -0.30754
- NeutF -0.54778
- Nupdown -0.75514
- NK -0.40579.
- a score is determined according to INTERCEPT - Nupdown *(N up - N down ) - NK*(NK up - T cell ) - SCA1M *SEX*(SCA 1 - Norm 1 ) - Bcell * (B cell - T cell ) - NeutF *(1-SEX)*( SCA 1 - Neut) - TSPANcoef *SEX*(TSPAN) - AF2 *(AF 2 - Norm 2 ).
- an interpretation function can include any linear combination of age, gender (i.e., sex), and one or more terms.
- a predictive model can include a partial least squares model, a logistic regression model, a linear regression model, a linear discriminant analysis model, a ridge regression model, and a tree-based recursive partitioning model.
- a predictive model can also include Support Vector Machines, quadratic discriminant analysis, or a LASSO regression model. See Elements of Statistical Learning, Springer 2003, Hastie, Tibshirani, Friedman; which is herein incorporated by reference in its entirety for all purposes.
- Predictive model performance can be characterized by an area under the curve (AUC). In an embodiment, predictive model performance is characterized by an AUC ranging from 0.68 to 0.70.
- predictive model performance is characterized by an AUC ranging from 0.70 to 0.79. In an embodiment, predictive model performance is characterized by an AUC ranging from 0.80 to 0.89. In an embodiment, predictive model performance is characterized by an AUC ranging from 0.90 to 0.99.
- assays for one or more markers include DNA assays, microarrays, polymerase chain reaction (PCR), RT-PCR, Southern blots, Northern blots, antibody-binding assays, enzyme-linked immunosorbent assays (ELISAs), flow cytometry, protein assays, Western blots, nephelometry, turbidimetry, chromatography, mass spectrometry, immunoassays, including, by way of example, but not limitation, RIA, immunofluorescence, immunochemiluminescence, immunoelectrochemiluminescence, or competitive immunoassays, immunoprecipitation, and the assays described in the Examples section below.
- the information from the assay can be quantitative and sent to a computer system of the invention.
- the information can also be qualitative, such as observing patterns or fluorescence, which can be translated into a quantitative measure by a user or automatically by a reader or computer system.
- the subject can also provide information other than assay information to a computer system, such as race, height, weight, age, gender, eye color, hair color, family medical history and any other information that may be useful to a user, such as a clinical factor described above.
- exemplary markers identified in this application by name, accession number, or sequence included within the scope of the invention are all operable predictive models of CAD and methods for their use to score and optionally classify samples using expression values of variant sequences having at least 90% or at least 95% or at least 97% or greater identity to the exemplified sequences or that encode proteins having sequences with at least 90% or at least 95% or at least 97% or greater identity to those encoded by the exemplified genes or sequences.
- the percentage of sequence identity may be determined using algorithms well known to those of ordinary skill in the art, including, e.g., BLASTn, and BLASTp, as described in Stephen F. Altschul et al., J. Mol. Biol.
- a computer comprises at least one processor coupled to a chipset. Also coupled to the chipset are a memory, a storage device, a keyboard, a graphics adapter, a pointing device, and a network adapter. A display is coupled to the graphics adapter. In one embodiment, the functionality of the chipset is provided by a memory controller hub and an I/O controller hub. In another embodiment, the memory is coupled directly to the processor instead of the chipset.
- the storage device is any device capable of holding data, like a hard drive, compact disk read-only memory (CD-ROM), DVD, or a solid-state memory device.
- the memory holds instructions and data used by the processor.
- the pointing device may be a mouse, track ball, or other type of pointing device, and is used in combination with the keyboard to input data into the computer system.
- the graphics adapter displays images and other information on the display.
- the network adapter couples the computer system to a local or wide area network.
- a computer can have different and/or other components than those described previously.
- the computer can lack certain components.
- the storage device can be local and/or remote from the computer (such as embodied within a storage area network (SAN)).
- SAN storage area network
- module refers to computer program logic utilized to provide the specified functionality.
- a module can be implemented in hardware, firmware, and/or software.
- program modules are stored on the storage device, loaded into the memory, and executed by the processor.
- percent “identity,” in the context of two or more nucleic acid or polypeptide sequences, refer to two or more sequences or subsequences that have a specified percentage of nucleotides or amino acid residues that are the same, when compared and aligned for maximum correspondence, as measured using one of the sequence comparison algorithms described below (e.g., BLASTP and BLASTN or other algorithms available to persons of skill) or by visual inspection.
- sequence comparison algorithms e.g., BLASTP and BLASTN or other algorithms available to persons of skill
- the percent “identity” can exist over a region of the sequence being compared, e.g., over a functional domain, or, alternatively, exist over the full length of the two sequences to be compared.
- sequence comparison typically one sequence acts as a reference sequence to which test sequences are compared.
- test and reference sequences are input into a computer, subsequence coordinates are designated, if necessary, and sequence algorithm program parameters are designated.
- sequence comparison algorithm then calculates the percent sequence identity for the test sequence(s) relative to the reference sequence, based on the designated program parameters.
- Optimal alignment of sequences for comparison can be conducted, e.g., by the local homology algorithm of Smith & Waterman, Adv. Appl. Math. 2:482 (1981 ), by the homology alignment algorithm of Needleman & Wunsch, J. Mol. Biol. 48:443 (1970 ), by the search for similarity method of Pearson & Lipman, Proc. Nat'l. Acad. Sci. USA 85:2444 (1988 ), by computerized implementations of these algorithms (GAP, BESTFIT, FASTA, and TFASTA in the Wisconsin Genetics Software Package, Genetics Computer Group, 575 Science Dr., Madison, Wis.), or by visual inspection (see generally Ausubel et al., infra).
- BLAST algorithm One example of an algorithm that is suitable for determining percent sequence identity and sequence similarity is the BLAST algorithm, which is described in Altschul et al., J. Mol. Biol. 215:403-410 (1990 ). Software for performing BLAST analyses is publicly available through the National Center for Biotechnology Information.
- Embodiments of the entities described herein can include other and/or different modules than the ones described here.
- the functionality attributed to the modules can be performed by other or different modules in other embodiments.
- this description occasionally omits the term "module" for purposes of clarity and convenience.
- Phase 1 was Initial Gene Discovery from the Duke University CATHGEN registry, a retrospective blood repository. 11 Briefly, 198 subjects (88 cases, 110 controls) from this repository were enrolled between August 2004 and November, 2005. Clinical inclusion and exclusion criteria were described previously and included both diabetic and non-diabetic patients. 7 All CATHGEN patients gave written informed consent and the study protocol was approved by the Duke University IRB. Microarrays were performed to identify CAD sensitive genes, and a subset of genes was selected for RT-PCR replication. Given the phase 1 findings, only non-diabetic subjects were included subsequently.
- Phase 2 was a prospective gene discovery phase with subjects from the PREDICT study, where 198 patients (99 case: control pairs, matched for age and sex) underwent microarray analysis to identify differentially expressed genes.
- Phase 3 was prospective algorithm development with 640 patients (210 cases, 430 controls) to determine the inter-relationships between clinical factors, blood cell counts, gene expression, and CAD.
- Subjects from PREDICT were eligible if they had a history of chest pain, suspected anginal-equivalent symptoms, or a high risk of CAD with no known prior MI, revascularization, or CAD. Detailed inclusion/exclusion criteria have been described. 12 Diabetic status was defined by clinical identification, blood glucose (non-fasting ⁇ 200 or fasting ⁇ 126), rorhemoglobin A1c, ( ⁇ 6.5), or diabetic medication prescription. Complete blood counts with differentials were obtained for all patients. PREDICT patients gave written informed consent, and the study protocol was approved by the Western Institutional Review Board.
- PREDICT samples an automated method using the Agencourt RNAdvance system was employed.
- Microarray samples were labeled and hybridized to 41K Human Whole Genome Arrays (Agilent, PN #G4112A) using the manufacturer's protocol.
- PN #G4112A 41K Human Whole Genome Arrays
- Cell fractionation was performed on fresh blood collected in EDTA tubes. 120 ml blood pooled from 4 different donors was 1:1 diluted with 1X PBS. 15% of the blood was used for granulocyte isolation by density centrifugation and 85% of the blood was used for PBMC isolation prior to T cells, B cells, NK cells, and monocytes fractionation.
- PBMC Peripheral Blood Mononuclear Cell
- PBMC peripheral blood mononuclear cells
- 20 ml diluted blood was layered on 20ml Histopaque 1077 (Sigma Cat No.10771) in 50ml conical tubes and was centrifuged at room temperature for 30 min at 400Xg.
- the PBMC layer was carefully aspirated into new tubes and washed with 1X phosphate-buffered saline (PBS) twice and centrifuged at 200Xg for 10 min.
- the washed PBMC was re-suspended in cold buffer1 (1XPBS, 0.1%BSA and 2mMEDTA) and stored on ice.
- 5% of the cells were lysed in RLT buffer (Qiagen RNeasy Mini kit, Cat No. 74104) for pre-selection RNA isolation.
- Granulocytes (neutrophils, eosinophils, basophils) were purified by density centrifugation using two different density mediums.
- 3ml Hisopaque 1077 was layered on 3ml Histopaque 1119 (Sigma Cat No.11191) and 6ml of the diluted blood was then layered on Histopaque 1077.
- the tube was centrifuged at room temperature (RT) for 30min at 700Xg.
- the granulocyte layer was then aspirated into a new tube and washed twice.
- the pellet was re-suspended in RLT buffer for granulocyte RNA isolation.
- T cells T cells, B cells, natural killer (NK) cells, monocytes
- NK cells monocytes
- PBMC peripheral blood mononuclear cells
- RNA samples in RLT buffer were purified using the Qiagen RNeasy Mini kit following the manufacturer's instructions.
- Cases had ⁇ 50% stenosis in at least one major coronary vessel and controls ⁇ 50% stenosis in all major vessels.
- Agilent processed signal values for array normalization were scaled to a trimmed mean of 100 and then log2 transformed.
- Standard array QC metrics percent present, pairwise correlation, and signal intensity
- Genes for RT-PCR were selected based on significance, fold-change, pathway analysis, and literature support. Hierarchical clustering based on gene: gene correlations ensured that RT-PCR genes represented multiple clusters. Normalization genes were selected based on low variance, moderate to high expression, and no significant association with case: control status, sex, age, or cell counts.
- Hierarchical clustering was used to group genes using a correlation cutoff. Clusters were reduced to meta-genes 14 and normalization genes based on correlation structure, known biology, and cell count correlation. For meta-gene pairs with high correlation and opposite disease regulation, ratio terms (differences on the log scale) were defined. Meta-genes independently associated with outcome were selected by the LASSO method, with sex by meta-gene interactions allowed during variable selection. 15
- the final algorithm was fit using Ridge regression 16 , where the outcome variable was case:control status and the predictors the LASSO-selected meta-genes and sex-specific age terms. Sex was a binary predictor, and age a linear predictor with separate slopes for males, females >60, and females ⁇ 60. Gene expression term penalization was based on cross-validation and prior evidence. Model performance was estimated using leave-one-out cross-validation. Algorithm performance was validated in an independent patient cohort with ROC analysis as primary endpoint.
- an algorithm score will not be calculated for a subject.
- Reasons for this include low PAXgene® tube blood volume, lab QC failure, etc. The frequency of occurrence of these failures will be tabulated, though these subjects will not be included in the analysis set. Subjects with missing Diamond Forrester scores will not be included in the analysis set.
- raw algorithm scores For clinical reporting purposes, as well as ease of presentation, raw scores may be transformed into a transformed score with a scale designed for ease of clinical use as follows:
- the CATHGEN diabetic subjects encompassed a range of disease severity and a variety of medications, some of which modulate gene expression and affect cardiovascular disease. 17
- Microarray CAD gene discovery on 210 PREDICT patient samples used a paired case:control experimental design, to reduce confounding effects of age, sex, and microarray batch processing.
- CAD analysis on the 99 case:control pairs after QC exclusions yielded 5935 significant genes (p ⁇ 0.05) with 655 genes in common with the CATHGEN results ( Figure 3 , Table 5).
- Gene Ontology (GO) analysis of these 655 genes identified 189 significant biological process terms (p ⁇ 0.05, Table 6), largely reflecting inflammation, cellular and stress response, cell death, and apoptosis.
- the cellular and molecular ontologies showed enrichment of 32 and 49 terms respectively, including mitochondrial function, apoptotic protease activator activity, and antigen binding.
- the algorithm was derived using the RT-PCR and clinical data from the PREDICT development cohort.
- the most significant clinical factors for CAD:gene expression association were age, sex, chest pain type, and neutrophil count.
- Age and sex were independent risk factors for CAD (Table 1) and showed significant gene expression correlation.
- Gene expression correlations for all genes to neutrophil and lymphocyte fraction were computed ( Figure 4 ).
- There was significant gender-specific regulation of neutrophil correlated genes males 40/42 genes up-regulated, females, 41/42 down-regulated
- lymphocyte gene down-regulation was gender independent.
- the PCR algorithm development set was sufficiently powered to investigate the relationship between CAD, clinical factors, and gene expression.
- the most significant independent clinical risk factors for CAD were age, gender, and chest pain type, the components of the Diamond-Forrester risk model for CAD likelihood, 1 supporting its use as a reference to assess algorithm performance. 12
- Lymphocyte-associated gene expression decreases with CAD in a gender-independent fashion, consistent with decreased lymphocyte counts being correlated with increased cardiovascular risk. 8
- neutrophil-associated genes display significant sex-specific expression differences with CAD: in males 95% of the neutrophil genes were up-regulated whereas 98% were down-regulated in females, consistent with increased granulocyte counts in males being associated with higher CAD risk, with smaller effects in females. 20
- the use of correlated meta-genes as building blocks for the algorithm is significantly reflective of gene expression cell-type specificity.
- the algorithm genes are expressed selectively in multiple types of circulating cells including neutrophils, NK cells, B and T-lymphocytes 21 , supporting roles for both adaptive and innate immune responses in atherosclerosis. 4
- Algorithm term 1 genes ( Figure 5 ) preferentially expressed in neutrophils, may reflect neutrophil apoptosis, as caspase-5 is increased with CAD, whereas TNFRSF10C, an anti-apoptotic decoy receptor of TRAIL, is decreased. 22 Term 2 genes up-regulated with CAD likely reflect both innate immune activation (S100A8 and S100A12), 23 and a cellular necrosis response (CLEC4E). 24 S100A8 and S100A12 are up-regulated in chronic inflammatory conditions, perhaps reflecting a more general pathophysiological signal, consistent with increased CAD in disorders such as rheumatoid arthritis. 25, 26
- Term 2 is normalized in a gender specific manner. In males normalization to RPL28, which is strongly expressed in lymphocytes, reflects the neutrophil to lymphocyte ratio, which is prognostic for death or MI in a CAD population. 8 In females normalization to AQP9 and NCF4, two CAD insensitive neutrophil genes, permits assessment of neutrophil up-regulation of the S100s and CLEC4E.
- Term 3 consists of 2 NK cell receptors, SLAMF7 and KLRC4, normalized to T-cell specific genes (TMC8 and CD3D).
- SLAMF7 may specifically activate NK cell function, while inhibiting B and T cells.
- KLRC4 is also likely involved in NK cell activation.
- NK cells have been associated with atherosclerosis in both mouse models and humans, and reduced lymphocyte counts associated with cardiac events. 8, 29
- Term 4 is a gene expression based measure of the B/T-cell ratio.
- the role of T cells is complex, whereas B cells have been shown in mouse models to be athero-protective. 30, 31 In this study apparent up-regulation of B-cell specific genes is correlated with CAD, perhaps indicating an immunological response to disease.
- the last two terms, based on AF289562 (AF2) and TSPAN16 are genes of unknown function.
- This study presents the development and validation of a whole blood derived RT-PCR based gene-expression algorithm for assessment of obstructive CAD likelihood in non-diabetic patients, and includes several key findings.
- gene expression patterns that differentiate diabetic patients with and without CAD were very different from those for study patients without diabetes.
- 2438 genes were differentially expressed in cases versus controls.
- 5935 genes were differentially expressed and 655 overlapped with the initial gene discovery genes. Based on overall correlations and biological significance, 113 of these 655 genes, were selected for RT-PCR analysis in the independent algorithm development cohort (Phase III), which also identified relationships between clinical factors, cell counts, and gene expression.
- the ability of the algorithm to determine the likelihood of CAD in the absence of seven out of the seven marker expression terms was assessed. Seven distinct terms were removed from the algorithm while maintaining the clinical factors of age and gender. Two statistical methods were used for the assessment: logistic regression and ridge regression. For the analysis, the area under the ROC curve (AUC) was the primary accuracy metric used. AUC was computed using cross validation. Summary statistics for the calculations are shown in Table 14. AUC's greater than the upper bound of the confidence interval for the AUC of Diamond Forrester (DF) were considered significantly better than the DF model. See Table 8. The age plus gender plus zero-marker expression term set tested was significantly better than the DF model indicating that the algorithm remains predictive of the likelihood of CAD even after removal of all seven marker expression terms. This indicates that the algorithm weighting of gender and age is superior to the weighting of clinical factors in the DF model.
- Example 14 Replacement of S100A12 with a highly correlated substitute marker.
- MMP9 was substituted for S100A12 in all relevant terms of the algorithm, here MMP9 was substituted for S100A12 in terms 4 and 5.
- the altered algorithm was as follows:
- Example 15 Replacement of CLEC4E with a highly correlated substitute marker.
- ALOX5AP was substituted for CLEC4E in all relevant terms of the algorithm. Summary statistics for the calculations are shown in Table 15. AUC's greater than the upper bound of the confidence interval for the AUC of Diamond Forrester (DF) were considered significantly better than the DF model. See Table 16 for DF AUC. The algorithm with the substitute marker remained significantly better than the DF model indicating that the algorithm remains predictive of the likelihood of CAD even after replacement of the algorithm marker with the highly correlated substitute marker.
- Example 16 Replacement of S100A8 with a highly correlated substitute marker.
- NAMPT was substituted for S100A8 in all relevant terms of the algorithm. Summary statistics for the calculations are shown in Table 15. AUC's greater than the upper bound of the confidence interval for the AUC of Diamond Forrester (DF) were considered significantly better than the DF model. See Table 16 for DF AUC. The algorithm with the substitute marker remained significantly better than the DF model indicating that the algorithm remains predictive of the likelihood of CAD even after replacement of the algorithm marker with the highly correlated substitute marker.
- Example 17 Replacement of CASP5 with a highly correlated substitute marker.
- H3F3B was substituted for CASP5 in all relevant terms of the algorithm. Summary statistics for the calculations are shown in Table 15. AUC's greater than the upper bound of the confidence interval for the AUC of Diamond Forrester (DF) were considered significantly better than the DF model. See Table 16 for DF AUC. The algorithm with the substitute marker remained significantly better than the DF model indicating that the algorithm remains predictive of the likelihood of CAD even after replacement of the algorithm marker with the highly correlated substitute marker.
- Example 18 Replacement of IL18RAP with a highly correlated substitute marker.
- TXN was substituted for IL18RAP in all relevant terms of the algorithm. Summary statistics for the calculations are shown in Table 15. AUC's greater than the upper bound of the confidence interval for the AUC of Diamond Forrester (DF) were considered significantly better than the DF model. See Table 16 for DF AUC. The algorithm with the substitute marker remained significantly better than the DF model indicating that the algorithm remains predictive of the likelihood of CAD even after replacement of the algorithm marker with the highly correlated substitute marker.
- DF Diamond Forrester
- Example 19 Replacement of TNFAIP6 with a highly correlated substitute marker.
- PLAUR was substituted for TNFAIP6 in all relevant terms of the algorithm. Summary statistics for the calculations are shown in Table 15. AUC's greater than the upper bound of the confidence interval for the AUC of Diamond Forrester (DF) were considered significantly better than the DF model. See Table 16 for DF AUC. The algorithm with the substitute marker remained significantly better than the DF model indicating that the algorithm remains predictive of the likelihood of CAD even after replacement of the algorithm marker with the highly correlated substitute marker.
- Example 20 Replacement of AQP9 with a highly correlated substitute marker.
- GLT1D1 was substituted for AQP9 in all relevant terms of the algorithm. Summary statistics for the calculations are shown in Table 15. AUC's greater than the upper bound of the confidence interval for the AUC of Diamond Forrester (DF) were considered significantly better than the DF model. See Table 16 for DF AUC. The algorithm with the substitute marker remained significantly better than the DF model indicating that the algorithm remains predictive of the likelihood of CAD even after replacement of the algorithm marker with the highly correlated substitute marker.
- DF Diamond Forrester
- Example 21 Replacement of NCF4 with a highly correlated substitute marker.
- NCF2 was substituted for NCF4 in all relevant terms of the algorithm. Summary statistics for the calculations are shown in Table 15. AUC's greater than the upper bound of the confidence interval for the AUC of Diamond Forrester (DF) were considered significantly better than the DF model. See Table 16 for DF AUC. The algorithm with the substitute marker remained significantly better than the DF model indicating that the algorithm remains predictive of the likelihood of CAD even after replacement of the algorithm marker with the highly correlated substitute marker.
- DF Diamond Forrester
- Example 22 Replacement of CD3D with a highly correlated substitute marker.
- LCK was substituted for CD3D in all relevant terms of the algorithm. Summary statistics for the calculations are shown in Table 15. AUC's greater than the upper bound of the confidence interval for the AUC of Diamond Forrester (DF) were considered significantly better than the DF model. See Table 16 for DF AUC. The algorithm with the substitute marker remained significantly better than the DF model indicating that the algorithm remains predictive of the likelihood of CAD even after replacement of the algorithm marker with the highly correlated substitute marker.
- Example 23 Replacement of TMC8 with a highly correlated substitute marker.
- CCT2 was substituted for TMC8 in all relevant terms of the algorithm. Summary statistics for the calculations are shown in Table 15. AUC's greater than the upper bound of the confidence interval for the AUC of Diamond Forrester (DF) were considered significantly better than the DF model. See Table 16 for DF AUC. The algorithm with the substitute marker remained significantly better than the DF model indicating that the algorithm remains predictive of the likelihood of CAD even after replacement of the algorithm marker with the highly correlated substitute marker.
- Example 24 Replacement of CD79B with a highly correlated substitute marker.
- CD19 was substituted for CD79B in all relevant terms of the algorithm. Summary statistics for the calculations are shown in Table 15. AUC's greater than the upper bound of the confidence interval for the AUC of Diamond Forrester (DF) were considered significantly better than the DF model. See Table 16 for DF AUC. The algorithm with the substitute marker remained significantly better than the DF model indicating that the algorithm remains predictive of the likelihood of CAD even after replacement of the algorithm marker with the highly correlated substitute marker.
- Example 25 Replacement of SPIB with a highly correlated substitute marker.
- BLK was substituted for SPIB in all relevant terms of the algorithm. Summary statistics for the calculations are shown in Table 15. AUC's greater than the upper bound of the confidence interval for the AUC of Diamond Forrester (DF) were considered significantly better than the DF model. See Table 16 for DF AUC. The algorithm with the substitute marker remained significantly better than the DF model indicating that the algorithm remains predictive of the likelihood of CAD even after replacement of the algorithm marker with the highly correlated substitute marker.
- Example 26 Replacement of HNRPF with a highly correlated substitute marker.
- Example 27 Replacement of TFCP2 with a highly correlated substitute marker.
- DDX18 was substituted for TFCP2 in all relevant terms of the algorithm. Summary statistics for the calculations are shown in Table 15. AUC's greater than the upper bound of the confidence interval for the AUC of Diamond Forrester (DF) were considered significantly better than the DF model. See Table 16 for DF AUC. The algorithm with the substitute marker remained significantly better than the DF model indicating that the algorithm remains predictive of the likelihood of CAD even after replacement of the algorithm marker with the highly correlated substitute marker.
- DF Diamond Forrester
- Example 28 Replacement of RPL28 with a highly correlated substitute marker.
- SSRP1 was substituted for RPL28 in all relevant terms of the algorithm. Summary statistics for the calculations are shown in Table 15. AUC's greater than the upper bound of the confidence interval for the AUC of Diamond Forrester (DF) were considered significantly better than the DF model. See Table 16 for DF AUC. The algorithm with the substitute marker remained significantly better than the DF model indicating that the algorithm remains predictive of the likelihood of CAD even after replacement of the algorithm marker with the highly correlated substitute marker.
- Example 29 Replacement of AF289562 with a highly correlated substitute marker.
- CD248 was substituted for AF289562 in all relevant terms of the algorithm. Summary statistics for the calculations are shown in Table 15. AUC's greater than the upper bound of the confidence interval for the AUC of Diamond Forrester (DF) were considered significantly better than the DF model. See Table 16 for DF AUC. The algorithm with the substitute marker remained significantly better than the DF model indicating that the algorithm remains predictive of the likelihood of CAD even after replacement of the algorithm marker with the highly correlated substitute marker.
- DF Diamond Forrester
- Example 30 Replacement of SLAMF7 with a highly correlated substitute marker.
- CX3CR1 was substituted for SLAMF7 in all relevant terms of the algorithm. Summary statistics for the calculations are shown in Table 15. AUC's greater than the upper bound of the confidence interval for the AUC of Diamond Forrester (DF) were considered significantly better than the DF model. See Table 16 for DF AUC. The algorithm with the substitute marker remained significantly better than the DF model indicating that the algorithm remains predictive of the likelihood of CAD even after replacement of the algorithm marker with the highly correlated substitute marker.
- DF Diamond Forrester
- Example 31 Replacement of KLRC24 with a highly correlated substitute marker.
- CD8A was substituted for KLRC4 in all relevant terms of the algorithm. Summary statistics for the calculations are shown in Table 15. AUC's greater than the upper bound of the confidence interval for the AUC of Diamond Forrester (DF) were considered significantly better than the DF model. See Table 16 for DF AUC. The algorithm with the substitute marker remained significantly better than the DF model indicating that the algorithm remains predictive of the likelihood of CAD even after replacement of the algorithm marker with the highly correlated substitute marker.
- Example 32 Replacement of IL8RB with a highly correlated substitute marker.
- BCL2A1 was substituted for IL8RB in all relevant terms of the algorithm. Summary statistics for the calculations are shown in Table 15. AUC's greater than the upper bound of the confidence interval for the AUC of Diamond Forrester (DF) were considered significantly better than the DF model. See Table 16 for DF AUC. The algorithm with the substitute marker remained significantly better than the DF model indicating that the algorithm remains predictive of the likelihood of CAD even after replacement of the algorithm marker with the highly correlated substitute marker.
- DF Diamond Forrester
- Example 33 Replacement of TNFRSF10C with a highly correlated substitute marker.
- Example 34 Replacement of KCNE3 with a highly correlated substitute marker.
- LAMP2 was substituted for KCNE3 in all relevant terms of the algorithm. Summary statistics for the calculations are shown in Table 15. AUC's greater than the upper bound of the confidence interval for the AUC of Diamond Forrester (DF) were considered significantly better than the DF model. See Table 16 for DF AUC. The algorithm with the substitute marker remained significantly better than the DF model indicating that the algorithm remains predictive of the likelihood of CAD even after replacement of the algorithm marker with the highly correlated substitute marker.
- DF Diamond Forrester
- Example 35 Replacement of TLR4 with a highly correlated substitute marker.
- TYROBP was substituted for TLR4 in all relevant terms of the algorithm. Summary statistics for the calculations are shown in Table 15. AUC's greater than the upper bound of the confidence interval for the AUC of Diamond Forrester (DF) were considered significantly better than the DF model. See Table 16 for DF AUC. The algorithm with the substitute marker remained significantly better than the DF model indicating that the algorithm remains predictive of the likelihood of CAD even after replacement of the algorithm marker with the highly correlated substitute marker.
- Example 36 Random replacement of five algorithm markers with five distinct, highly correlated substitute markers.
- a highly correlated, non-algorithm substitute marker was identified from the Phase III PCR data set described above. For each marker, a Pearson correlation value between that marker and all other markers was computed and then we picked the substitute marker with maximal correlation to the algorithm marker of interest. This substitute was the marker with the highest correlation to the algorithm marker, subject to the restriction that a substitute marker was not used more than once in the terms of the algorithm. See Table 15 for the highly correlated substitute markers. Two statistical methods were used for the analysis: logistic regression and ridge regression. For the analysis, the area under the ROC curve (AUC) was the primary accuracy metric. AUC was computed using cross validation. Accuracy was computed for models that randomly substituted five highly correlated markers at a time for five distinct algorithm markers.
- Example 37 Random replacement of ten algorithm markers with ten distinct, highly correlated substitute markers.
- a highly correlated, non-algorithm substitute marker was identified from the Phase III PCR data set described above. For each marker, a Pearson correlation value between that marker and all other markers was computed and then we picked the substitute marker with maximal correlation to the algorithm marker of interest. This substitute was the marker with the highest correlation to the algorithm marker, subject to the restriction that a substitute marker was not used more than once in the terms of the algorithm. See Table 15 for the highly correlated substitute markers. Two statistical methods were used for the analysis: logistic regression and ridge regression. For the analysis, the area under the ROC curve (AUC) was the primary accuracy metric. AUC was computed using cross validation. Accuracy was computed for models that randomly substituted ten highly correlated markers at a time for ten distinct algorithm markers.
- Example 38 Random replacement of fifteen algorithm markers with fifteen distinct, highly correlated substitute markers.
- a highly correlated, non-algorithm substitute marker was identified from the Phase III PCR data set described above. For each marker, a Pearson correlation value between that marker and all other markers was computed and then we picked the substitute marker with maximal correlation to the algorithm marker of interest. This substitute was the marker with the highest correlation to the algorithm marker, subject to the restriction that a substitute marker was not used more than once in the terms of the algorithm. See Table 15 for the highly correlated substitute markers. Two statistical methods were used for the analysis: logistic regression and ridge regression. For the analysis, the area under the ROC curve (AUC) was the primary accuracy metric. AUC was computed using cross validation. Accuracy was computed for models that randomly substituted fifteen highly correlated markers at a time for fifteen distinct algorithm markers.
- Example 39 Random replacement of twenty algorithm markers with twenty distinct, highly correlated substitute markers.
- a highly correlated, non-algorithm substitute marker was identified from the Phase III PCR data set described above. For each marker, a Pearson correlation value between that marker and all other markers was computed and then we picked the substitute marker with maximal correlation to the algorithm marker of interest. This substitute was the marker with the highest correlation to the algorithm marker, subject to the restriction that a substitute marker was not used more than once in the terms of the algorithm. See Table 15 for the highly correlated substitute markers. Two statistical methods were used for the analysis: logistic regression and ridge regression. For the analysis, the area under the ROC curve (AUC) was the primary accuracy metric. AUC was computed using cross validation. Accuracy was computed for models that randomly substituted twenty highly correlated markers at a time for twenty distinct algorithm markers.
- Example 40 Random replacement of all algorithm markers with distinct, highly correlated substitute markers.
- a highly correlated, non-algorithm substitute marker was identified from the Phase III PCR data set described above. For each marker, a Pearson correlation value between that marker and all other markers was computed and then we picked the substitute marker with maximal correlation to the algorithm marker of interest. This substitute was the marker with the highest correlation to the algorithm marker, subject to the restriction that a substitute marker was not used more than once in the terms of the algorithm. See Table 15 for the highly correlated substitute markers. Two statistical methods were used for the analysis: logistic regression and ridge regression. For the analysis, the area under the ROC curve (AUC) was the primary accuracy metric. AUC was computed using cross validation. Accuracy was computed for models that randomly substituted highly correlated markers at a time for all algorithm markers.
- Term 1 algorithm and highly correlated substitute markers were sequentially removed from the algorithm to determine whether the algorithm would remain predictive of the likelihood of CAD in their absence. All other terms and their associated markers were removed from the algorithm, thus in this analysis each term was considered on its own.
- Each term on the model is a delta term, with n_i markers on the left side of the delta term and m_i markers on the right side of the delta term.
- n_i left-hand side markers and one of the possible m_i right-hand side markers was used in the term. There were thus n_i*m_i possible two marker reduced terms.
- models were fit including gender, age, and the reduced term, and cross-validated AUC's were estimated. These cross validated AUC's were compared to the AUC's from a model that included gender, age, and the full term. For each reduced term, we tested whether there was still a statistically significant predictive effect of the term, i.e., whether the decrease in AUC was sufficient to render the marker reduced set not beneficial in prediction of CAD. The same process was repeated for all reduced marker sets where correlated replacement markers were used in place of original algorithm markers.
- Term 2 algorithm and highly correlated substitute markers were sequentially removed from the algorithm to determine whether the algorithm would remain predictive of the likelihood of CAD in their absence. All other terms and their associated markers were removed from the algorithm, thus in this analysis each term was considered on its own.
- Each term on the model is a delta term, with n_i markers on the left side of the delta term and m_i markers on the right side of the delta term.
- n_i left-hand side markers and one of the possible m_i right-hand side markers was used in the term. There were thus n_i*m_i possible two marker reduced terms.
- models were fit including gender, age, and the reduced term, and cross-validated AUC's were estimated. These cross validated AUC's were compared to the AUC's from a model that included gender, age, and the full term. For each reduced term, we tested whether there was still a statistically significant predictive effect of the term, i.e., whether the decrease in AUC was sufficient to render the marker reduced set not beneficial in prediction of CAD. The same process was repeated for all reduced marker sets where correlated replacement markers were used in place of original algorithm markers.
- Term 3 algorithm and highly correlated substitute markers were sequentially removed from the algorithm to determine whether the algorithm would remain predictive of the likelihood of CAD in their absence. All other terms and their associated markers were removed from the algorithm, thus in this analysis each term was considered on its own.
- Each term on the model is a delta term, with n_i markers on the left side of the delta term and m_i markers on the right side of the delta term.
- n_i left-hand side markers and one of the possible m_i right-hand side markers was used in the term. There were thus n_i*m_i possible two marker reduced terms.
- models were fit including gender, age, and the reduced term, and cross-validated AUC's were estimated. These cross validated AUC's were compared to the AUC's from a model that included gender, age, and the full term.
- the same process was repeated for all reduced marker sets where correlated replacement markers were used in place of original algorithm markers.
- the same process was repeated again where one correlated replacement marker was used along with one original algorithm marker.
- Term 4 algorithm and highly correlated substitute markers were sequentially removed from the algorithm to determine whether the algorithm would remain predictive of the likelihood of CAD in their absence. All other terms and their associated markers were removed from the algorithm, thus in this analysis each term was considered on its own.
- Each term on the model is a delta term, with n_i markers on the left side of the delta term and m_i markers on the right side of the delta term.
- n_i left-hand side markers and one of the possible m_i right-hand side markers was used in the term. There were thus n_i*m_i possible two marker reduced terms.
- models were fit including gender, age, and the reduced term, and cross-validated AUC's were estimated. These cross validated AUC's were compared to the AUC's from a model that included gender, age, and the full term. For each reduced term, we tested whether there was still a statistically significant predictive effect of the term, i.e., whether the decrease in AUC was sufficient to render the marker reduced set not beneficial in prediction of CAD. The same process was repeated for all reduced marker sets where correlated replacement markers were used in place of original algorithm markers.
- Term 5 algorithm and highly correlated substitute markers were sequentially removed from the algorithm to determine whether the algorithm would remain predictive of the likelihood of CAD in their absence. All other terms and their associated markers were removed from the algorithm, thus in this analysis each term was considered on its own.
- Each term on the model is a delta term, with n_i markers on the left side of the delta term and m_i markers on the right side of the delta term.
- n_i left-hand side markers and one of the possible m_i right-hand side markers was used in the term. There were thus n_i*m_i possible two marker reduced terms.
- models were fit including gender, age, and the reduced term, and cross-validated AUC's were estimated. These cross validated AUC's were compared to the AUC's from a model that included gender, age, and the full term.
- the same process was repeated for all reduced marker sets where correlated replacement markers were used in place of original algorithm markers.
- the same process was repeated again where one correlated replacement marker was used along with one original algorithm marker.
- Term 6 algorithm and highly correlated substitute markers were sequentially removed from the algorithm to determine whether the algorithm would remain predictive of the likelihood of CAD in their absence. All other terms and their associated markers were removed from the algorithm, thus in this analysis each term was considered on its own.
- Each term on the model is a delta term, with n_i markers on the left side of the delta term and m_i markers on the right side of the delta term.
- n_i left-hand side markers and one of the possible m_i right-hand side markers was used in the term. There were thus n_i*m_i possible two marker reduced terms.
- models were fit including gender, age, and the reduced term, and cross-validated AUC's were estimated. These cross validated AUC's were compared to the AUC's from a model that included gender, age, and the full term.
- the same process was repeated for all reduced marker sets where correlated replacement markers were used in place of original algorithm markers.
- the same process was repeated again where one correlated replacement marker was used along with one original algorithm marker.
- Term 7 algorithm and highly correlated substitute markers were sequentially removed from the algorithm to determine whether the algorithm would remain predictive of the likelihood of CAD in their absence. All other terms and their associated markers were removed from the algorithm, thus in this analysis each term was considered on its own.
- Each term on the model is a delta term, with n_i markers on the left side of the delta term and m_i markers on the right side of the delta term.
- n_i left-hand side markers and one of the possible m_i right-hand side markers was used in the term. There were thus n_i*m_i possible two marker reduced terms.
- models were fit including gender, age, and the reduced term, and cross-validated AUC's were estimated. These cross validated AUC's were compared to the AUC's from a model that included gender, age, and the full term.
- the same process was repeated for all reduced marker sets where correlated replacement markers were used in place of original algorithm markers.
- the same process was repeated again where one correlated replacement marker was used along with one original algorithm marker.
- Example 48 Validation of the diagnostic accuracy of the algorithm for assessment of CAD in non-diabetic patients.
- obstructive CAD defined as one or more coronary atherosclerotic lesions causing ⁇ 50% luminal diameter stenosis, in non-diabetic patients with suspected CAD.
- Subjects were enrolled in PREDICT, a 39 center (US) prospective study, between July 2007 and April 2009. The study was approved at the institutional review board at all participating centers and all patients gave written informed consent.
- Subjects referred for diagnostic coronary angiography were eligible if they had a history of chest pain, suspected anginal-equivalent symptoms, or a high risk of CAD, and no known prior myocardial infarction (MI), revascularization, or obstructive CAD.
- Subjects were ineligible if at catheterization, they had acute MI, high risk unstable angina, severe non-coronary heart disease (congestive heart failure, cardiomyopathy or valve disease), systemic infectious or inflammatory conditions, or were taking immunosuppressive or chemotherapeutic agents.
- Pre-specified clinical data including demographics, medications, clinical history and presentation, and MPI results were obtained by research study coordinators at study sites using standardized data collection methods and data were verified by independent study monitors.
- Coronary angiograms were analyzed by computer-assisted QCA. Specifically, clinically-indicated coronary angiograms performed according to site protocols were digitized, de-identified and analyzed with a validated quantitative protocol at Cardiovascular Research Foundation, New York, NY ( Lansky AJ, Popma JJ. Qualitative and quantitative angiography Philadelphia, PA: Saunders; 1998 Text Book of Interventional Cardiology)). Trained technicians, blinded to clinical and gene expression data, visually identified all lesions >10% diameter stenosis (DS) in vessels with diameter >1.5mm.
- DS diameter stenosis
- MLD minimal lumen diameter
- RLD reference lumen diameter of normal segments proximal and distal of lesion
- %DS (1 - MLD/RLD) x 100
- the Diamond-Forrester (D-F) risk score comprised of age, sex, and chest pain type, was prospectively chosen to evaluate the added value of the gene expression score to clinical factors ( Diamond GA, Forrester JS. Analysis of probability as an aid in the clinical diagnosis of coronary-artery disease. N Engl J Med. 1979;300(24):1350-8 ). D-F classifications of chest pain type (typical angina, atypical angina and non-anginal chest pain) were assigned based on subject interviews ( Diamond GA, Forrester JS. Analysis of probability as an aid in the clinical diagnosis of coronary-artery disease. N Engl J Med.
- venous blood samples Prior to coronary angiography, venous blood samples were collected in PAXgene ® RNA-preservation tubes. Samples were treated according to manufacturer's instructions, then frozen at -20°C.
- RNA purification from whole blood samples using the Agencourt RNAdvance system, cDNA synthesis, and RT-PCR were performed as described ( Elashoff MR, Wingrove JA, Beineke P, et al. Development of a Blood-based Gene Expression Algorithm for Assessment of Obstructive Coronary Artery Disease in Non-Diabetic Patients, submitted. Circulation: Cardiovascular Genetics. 2010 .). All PCR reactions were run in triplicate and median values used for analysis. Genomic DNA contamination was detected by comparison of expression values for splice-junction spanning and intronic ADORA3 assays normalized to expression values of TFCP2 and HNRPF.
- the RPS4Y1 assay was run as confirmation of sex for all patients; patients were excluded if there was an apparent mismatch with clinical data.
- Sample QC metrics and pass-fail criteria were pre-defined and applied prior to evaluation of results as described ( Elashoff MR, Wingrove JA, Beineke P, et al. Development of a Blood-based Gene Expression Algorithm for Assessment of Obstructive Coronary Artery Disease in Non-Diabetic Patients, submitted. Circulation: Cardiovascular Genetics. 2010 .).
- ROC curves were estimated for the a) gene expression algorithm score, b) the D-F risk score, c) a combined model of algorithm score and D-F risk score, d) MPI, and e) a combined model of algorithm score and MPI.
- Standard methods Newson R. Confidence intervals for rank statistics: Somers' D and extensions. Stata Journal. 2006;6:309-334 .
- Paired AUC comparisons i) gene expression algorithm score plus D-F risk score vs D-F risk score, and ii) gene expression algorithm score plus MPI vs MPI; were performed by bootstrap. For each comparison, 10,000 bootstrap iterations were run, and the observed AUC difference computed. The median bootstrapped AUC difference was used to estimate the AUC difference, and the p-value estimated using the empirical distribution of bootstrapped AUC differences (i.e. the observed quantile for 0 AUC difference in the empirical distribution).
- a series of logistic regression models were fit with disease status as the binary dependent variable, and compared using a likelihood ratio test between nested models. Comparisons were: i) gene expression algorithm score plus D-F risk score versus D-F risk score alone; ii) gene expression algorithm score plus MPI versus MPI alone; iii) gene expression algorithm score versus the demographic component of the gene expression algorithm score.
- D-F risk score analysis a reclassified subject was defined as i) D-F intermediate risk to low or high algorithm score, ii) D-F high risk to algorithm low risk, or iii) D-F low risk to algorithm high.
- a reclassified subject included i) MPI positive to low risk based on algorithm score, or ii) MPI negative to high risk based on algorithm score.
- NRI Net reclassification improvement
- D-F risk score model Model Term Odds Ratio 95% CI p-value Model AIC D-F risk score 1.018 1.012 to 1.023 ⁇ .001 652.53 Gene expression algorithm score + D-F risk score Model Term Odds Ratio 95% CI p-value Model AIC D-F risk score 1.012 1.007 to 1.018 ⁇ .001 Gene expression algorithm score 1.64 1.37 to 1.96 ⁇ .001 622.3 MPI model Model Term Odds Ratio 95% CI p-value Model AIC MPI 1.52 0.88 to 2.67 .14 388.53 Gene expression algorithm score + MPI Model Term Odds Ratio 95% CI p-value Model AIC MPI 1.04 0.57 to 1.90 .90 Gene expression algorithm score 1.85 1.45 to 2.37 ⁇ .001 362.15
- Vickers ⁇ Vickers et al., 2008 ⁇ defines the net benefit curve for a diagnostic as a function of p t , a threshold probability that represents the tradeoff between false positives and false negatives.
- the net benefit curve for the gene expression algorithm is the upper curve in Figure 8 , and is greater than either reference line over clinically relevant range for p t .
- a logistic regression model was then fit using disease status as the dependent variable and these 11 factors as predictor variables.
- a subject's 'full clinical model score' was the subject's predicted value from this model.
- Results are reported for the validation set.
- the nested logistic regression comparison of the gene expression algorithm plus the full clinical model versus the full clinical model alone gave a p-value of .014.
- Samples were classified as gene expression outliers based on the following criterion: ⁇
- the gene expression algorithm was developed as described above, with obstructive CAD defined by QCA as ⁇ 50% stenosis in ⁇ 1 major coronary artery. This corresponds approximately to 65-70% stenosis based on clinical angiographic read.
- the prospectively defined primary endpoint was the area under the ROC curve for algorithm score prediction of disease status.
- the AUC was 0.70 ⁇ 0.02, (p ⁇ 0.001) with independently significant performance in male (0.66) and female subsets (0.65) (p ⁇ 0.001 for each).
- D-F Diamond-Forrester
- the Diamond-Forrester (D-F) risk score was developed to quantify likelihood of current CAD and validated in a large cohort (Diamond GA, Forrester JS. Analysis of probability as an aid in the clinical diagnosis of coronary-artery disease. N Engl J Med. 1979;300(24):1350-8 .; Chaitman BR, Bourassa MG, Davis K, et al.
- Sensitivity and specificity were determined at an algorithm score threshold of 14.75, corresponding to a disease likelihood of 20%, with 33% of patients having scores below this value. At this threshold, the sensitivity was 85% with a specificity of 43%, corresponding to negative and positive predictive values of 83% and 46%, respectively.
- the average scores for patients with and without obstructive CAD were 25 and 17, respectively.
- Reclassification may be a more clinically relevant measure of a predictor's comparative performance than standard measures such as AUC ( Cook NR, Ridker PM. Advances in measuring the effect of individual predictors of cardiovascular risk: the role of reclassification measures. Ann Intern Med. 2009;150(11):795-802 .).
- Tables 25A and 25B show reclassification results for the gene expression algorithm compared to D-F risk score and MPI. In this study the net reclassification improvement for the gene expression algorithm score compared to the D-F risk score was 20% (p ⁇ 0.001), and to MPI was 21% (p ⁇ 0.001).
- This gene-expression test could have clinical advantages over current non-invasive CAD diagnostic modalities since it requires only a standard venous blood draw, and no need for radiation, intravenous contrast, or physiologic and pharmacologic stressors.
- One potential clinical benefit of improving non-invasive assessment of CAD is to reduce invasive diagnostic coronary angiograms in patients without obstructive CAD. In the validation cohort, for example, only 37% of patients undergoing invasive angiography had obstructive CAD and the rate was particularly low in women (26%).
Landscapes
- Health & Medical Sciences (AREA)
- Life Sciences & Earth Sciences (AREA)
- Engineering & Computer Science (AREA)
- Physics & Mathematics (AREA)
- Medical Informatics (AREA)
- General Health & Medical Sciences (AREA)
- Chemical & Material Sciences (AREA)
- Biotechnology (AREA)
- Biophysics (AREA)
- Bioinformatics & Cheminformatics (AREA)
- Genetics & Genomics (AREA)
- Data Mining & Analysis (AREA)
- Bioinformatics & Computational Biology (AREA)
- Theoretical Computer Science (AREA)
- Evolutionary Biology (AREA)
- Spectroscopy & Molecular Physics (AREA)
- Molecular Biology (AREA)
- Public Health (AREA)
- Epidemiology (AREA)
- Organic Chemistry (AREA)
- Proteomics, Peptides & Aminoacids (AREA)
- Databases & Information Systems (AREA)
- Analytical Chemistry (AREA)
- Computer Vision & Pattern Recognition (AREA)
- Software Systems (AREA)
- Evolutionary Computation (AREA)
- Bioethics (AREA)
- Artificial Intelligence (AREA)
- Zoology (AREA)
- Wood Science & Technology (AREA)
- Pathology (AREA)
- Immunology (AREA)
- Biochemistry (AREA)
- Microbiology (AREA)
- Biomedical Technology (AREA)
- General Engineering & Computer Science (AREA)
- Primary Health Care (AREA)
- Hematology (AREA)
- Urology & Nephrology (AREA)
- Food Science & Technology (AREA)
Description
- The invention relates to predictive models for determining the extent of coronary artery disease (CAD) risk based on marker expression measurements, to their methods of use, and to computer systems and software for their implementation.
- Mortality and morbidity from CAD and myocardial infarction (MI) are a major global health burden. Major determinants of current CAD likelihood are sex, age, and chest-pain type.1,2 Other risk factors such as diabetes, smoking, dyslipidemia, and family history have been associated with future cardiovascular event risk.3 In addition, atherosclerosis has a systemic inflammatory component including activation and migration of immune cells into the vessel wall.4,5 In fact, since such cells are derived from and have interactions with circulating blood, quantitative measurements of circulating blood cell gene expression reflects the extent of CAD.6,7 These observations likely reflect both changes in cell type distributions, which have prognostic value for cardiovascular events8 and gene expression changes within a specific cell type or lineage.
- The "gold standard" for detecting CAD is invasive coronary angiography; however, this is costly, and can pose risk to the patient. Prior to angiography, non-invasive diagnostic modalities such as myocardial perfusion imaging (MPI) and CT-angiography may be used, however these have complications including radiation exposure, contrast agent sensitivity, and only add moderately to obstructive CAD identification.9,10
-
WO 2009/049257 A2 (Cardio DX, Inc.) published on 16 April 2009;WO 2005/040422 A2 (Novartis AG/Novartis Pharma GmbH) published on 6 May 2005; Ma and Liew, Journal of Molecular and Cellular Cardiology, vol. 35, no. 8, pages 993-998, published on 1 August 2003;WO 2005/103720 A1 (Medstar Research Institute) published on 3 November 2005; andUS 2007/238124 A1 (Chibout et al) published on 11 October 2007 disclose potential biomarkers for diagnosing or assessing CAD. - A non-invasive blood test that could reliably identify patients with CAD would have significant clinical utility. As such, a major advancement in the fight against atherosclerosis would be the development of non-invasive diagnostic tests that can aid in the diagnosis and assessment of the extent of CAD in patients. Herein the development and validation of an algorithm using marker expression and clinical factors (e.g., age and gender) for such a purpose is described.
- The invention provides a computer-implemented method for predicting coronary artery disease (CAD) by scoring a sample obtained from a subject, comprising:
- obtaining a dataset associated with the sample, wherein the dataset comprises a quantitative expression level value for each marker in at least one term selected from the group consisting of
term 1,term 2,term 3,term 4,term 5,term 6, andterm 7; whereinterm 1 comprisesmarker 1,marker 2, andmarker 3, whereinmarker 1 comprises GenBank accession number AF161365, whereinmarker 2 comprises HNRPF or ACBD5, and whereinmarker 3 comprises TFCP2 or DDX18; whereinterm 2 comprisesmarker 4,marker 5, andmarker 6, whereinmarker 4 comprises AF289562 or CD248, whereinmarker 5 comprises HNRPF or ACBD5, and whereinmarker 6 comprises TFCP2 or DDX18; whereinterm 3 comprisesmarker 7,marker 8,marker 9, andmarker 10 whereinmarker 7 comprises CD79B or CD 19, whereinmarker 8 comprises SPIB or BLK, whereinmarker 9 comprises CD3D or LCK, and whereinmarker 10 comprises TMC8 or CCT2; whereinterm 4 comprises marker 11,marker 12, marker 13, and marker 14, wherein marker 11 comprises S100A12 or MMP9, whereinmarker 12 comprises CLEC4E or ALOX5AP, wherein marker 13 comprises S100A8 or NAMPT, and wherein marker 14 comprises RPL28 or SSRP1; whereinterm 5 comprisesmarker 15,marker 16,marker 17, marker 18, and marker 19, whereinmarker 15 comprises S100A12 or MMP9, whereinmarker 16 comprises CLEC4E or ALOX5AP, whereinmarker 17 comprises S100A8 or NAMPT, wherein marker 18 comprises AQP9 or GLT1D1, and wherein marker 19 comprises NCF4 or NCF2; whereinterm 6 comprisesmarker 20, marker 21,marker 22,marker 23, marker 24, marker 25, and marker 26, whereinmarker 20 comprises CASP5 or H3F3B, wherein marker 21 comprises IL18RAP or TXN, whereinmarker 22 comprises TNFAIP6 or PLAUR, whereinmarker 23 comprises IL8RB or BCL2A1, wherein marker 24 comprises TNFRSF10C or PTAFR, wherein marker 25 comprises KCNE3 or LAMP2, and wherein marker 26 comprises TLR4 or TYROBP; and whereinterm 7 comprises marker 27, marker 28,marker 29, andmarker 30, wherein marker 27 comprises SLAMF7 or CX3CR1, wherein marker 28 comprises KLRC4 or CD8A, whereinmarker 29 comprises CD3D or LCK, and whereinmarker 30 comprises TMC8 or CCT2; and determining, by a computer processor, a score from the dataset using an interpretation function, wherein a higher score relative to a control having less than 50% stenosis in all major vessels indicates that the subject has a higher likelihood of CAD. - In an embodiment, the dataset comprises a quantitative expression level value for each marker in at least two terms selected from the group consisting of
term 1,term 2,term 3,term 4,term 5,term 6, andterm 7. In an embodiment, the dataset comprises a quantitative expression level value for each marker in at least three terms selected from the group consisting ofterm 1,term 2,term 3,term 4,term 5,term 6, andterm 7. In an embodiment, the dataset comprises a quantitative expression level value for each marker in at least four terms selected from the group consisting ofterm 1,term 2,term 3,term 4,term 5,term 6, andterm 7. In an embodiment, the dataset comprises a quantitative expression level value for each marker in at least five terms selected from the group consisting ofterm 1,term 2,term 3,term 4,term 5,term 6, andterm 7. In an embodiment, the dataset comprises a quantitative expression level value for each marker in at least six terms selected from the group consisting ofterm 1,term 2,term 3,term 4,term 5,term 6, andterm 7. In an embodiment, the dataset comprises a quantitative expression level value for each marker interm 1,term 2,term 3,term 4,term 5,term 6, andterm 7. - In an embodiment, the interpretation function is based on a predictive model. In an embodiment, the predictive model is selected from the group consisting of a partial least squares model, a logistic regression model, a linear regression model, a linear discriminant analysis model, a ridge regression model, and a tree-based recursive partitioning model. In an embodiment, the predictive model performance is characterized by an area under the curve (AUC) ranging from 0.68 to 0.70. In an embodiment, the predictive model performance is characterized by an AUC ranging from 0.70 to 0.79. In an embodiment, the predictive model performance is characterized by an AUC ranging from 0.80 to 0.89. In an embodiment, the predictive model performance is characterized by an AUC ranging from 0.90 to 0.99.
- In an embodiment, the dataset further includes a clinical factor. In an embodiment, the clinical factor is selected from the group consisting of: age, gender, chest pain type, neutrophil count, ethnicity, disease duration, diastolic blood pressure, systolic blood pressure, a family history parameter, a medical history parameter, a medical symptom parameter, height, weight, a body-mass index, resting heart rate, and smoker/non-smoker status.
- In an embodiment, the obtaining the dataset associated with the sample includes obtaining the sample and processing the sample to experimentally determine the dataset. In an embodiment, the obtaining the dataset associated with the sample includes receiving the dataset from a third party that has processed the sample to experimentally determine the dataset.
- In an embodiment, the method includes classifying the sample according to a score. In an embodiment, the classifying is predictive of the presence or absence of CAD in the subject. In an embodiment, the classifying is predictive of the extent of CAD in the subject. In an embodiment, the classifying is predictive of the risk of CAD in the subject. In an embodiment, the method includes rating CAD risk based on the score.
- In an embodiment, the sample includes peripheral blood cells. In an embodiment, the peripheral blood cells include leukocytes. In an embodiment, the sample includes RNA extracted from peripheral blood cells.
- In an embodiment, the quantitative expression data are derived from hybridization data. In an embodiment, the quantitative expression data are derived from polymerase chain reaction data. In an embodiment, the quantitative expression data are derived from an antibody binding assay. In an embodiment, the dataset is obtained stored on a storage memory.
- In an embodiment, the subject is a human. In an embodiment, the subject has stable chest pain. In an embodiment, the subject has typical angina or atypical angina or an anginal equivalent. In an embodiment, the subject has no previous diagnosis of myocardial infarction (MI). In an embodiment, the subject has not had a revascularization procedure. In an embodiment, the subject does not have diabetes. In an embodiment, the subject does not have an inflammatory condition or an infectious condition. In an embodiment, the subject is not currently taking a steroid, an immunosuppressive agent, or a chemotherapeutic agent.
- Also provided is a computer-implemented method for scoring a sample obtained from a subject, comprising: obtaining a dataset associated with the sample, wherein the dataset comprises at least one clinical factor and quantitative expression level values for at least two markers selected from the group consisting of Genbank accession number AF161365, HNRPF, ACBD5, TFCP2, DDX18, Genbank accession number AF289562, CD248, CD79B, CD 19, SPIB, BLK, CD3D, LCK, TMC8, CCT2, S100A12, MMP9, CLEC4E, ALOX5AP, S100A8, NAMPT, RPL28, SSRP1, AQP9, GLT1D1, NCF4, NCF2, CASP5, H3F3B, IL18RAP, TXN, TNFAIP6, PLAUR, IL8RB, BCL2A1, TNFRSF10C, PTAFR, KCNE3, LAMP2, TLR4, TYROBP, SLAMF7, CX3CR1, KLRC4, and CD8A; and determining, by a computer processor, the score from the dataset using an interpretation function, wherein the score is predictive of CAD in the subject and wherein a higher score relative to a control having less than 50% stenosis in all major vessels indicates that the subject has a higher likelihood of CAD.
- In an embodiment, the dataset includes a clinical factor. In an embodiment, the clinical factor is age and/or gender. In an embodiment, the clinical factor is selected from the group consisting of: age, gender, chest pain type, neutrophil count, ethnicity, disease duration, diastolic blood pressure, systolic blood pressure, a family history parameter, a medical history parameter, a medical symptom parameter, height, weight, a body-mass index, resting heart rate, and smoker/non-smoker status.
- In an embodiment, the dataset includes quantitative expression data for at least three markers. In an embodiment, the dataset includes quantitative expression data for at least four markers. In an embodiment, the dataset includes quantitative expression data for at least five markers. In an embodiment, the dataset includes quantitative expression data for at least six markers.
- In an embodiment, the interpretation function is based on a predictive model. In an embodiment, the predictive model is selected from the group consisting of a partial least squares model, a logistic regression model, a linear regression model, a linear discriminant analysis model, a ridge regression model, and a tree-based recursive partitioning model. In an embodiment, the predictive model performance is characterized by an area under the curve (AUC) ranging from 0.68 to 0.70. In an embodiment, the predictive model performance is characterized by an AUC ranging from 0.70 to 0.79. In an embodiment, the predictive model performance is characterized by an AUC ranging from 0.80 to 0.89. In an embodiment, the predictive model performance is characterized by an AUC ranging from 0.90 to 0.99.
- In an embodiment, the obtaining the dataset associated with the sample includes obtaining the sample and processing the sample to experimentally determine the dataset. In an embodiment, the obtaining the dataset associated with the sample includes receiving the dataset from a third party that has processed the sample to experimentally determine the dataset.
- In an embodiment, the method includes classifying the sample according to the score. In an embodiment, the classifying is predictive of the presence or absence of CAD in the subject. In an embodiment, the classifying is predictive of the extent of CAD in the subject. In an embodiment, the classifying is predictive of the risk of CAD in the subject. In an embodiment, the method includes rating CAD risk based on the score.
- In an embodiment, the sample includes peripheral blood cells. In an embodiment, the peripheral blood cells include leukocytes. In an embodiment, the sample includes RNA extracted from peripheral blood cells.
- In an embodiment, the quantitative expression data are derived from hybridization data. In an embodiment, the quantitative expression data are derived from polymerase chain reaction data. In an embodiment, the quantitative expression data are derived from an antibody binding assay. In an embodiment, the dataset is obtained stored on a storage memory.
- In an embodiment, the subject is a human. In an embodiment, the subject has stable chest pain. In an embodiment, the subject has typical angina or atypical angina or an anginal equivalent. In an embodiment, the subject has no previous diagnosis of myocardial infarction (MI). In an embodiment, the subject has not had a revascularization procedure. In an embodiment, the subject does not have diabetes. In an embodiment, the subject does not have an inflammatory condition or an infectious condition. In an embodiment, the subject is not currently taking a steroid, an immunosuppressive agent, or a chemotherapeutic agent.
- Also provided is a system for predicting CAD in a subject, the system comprising:
- a storage memory for storing a dataset associated with a sample obtained from the subject, wherein the dataset comprises a quantitative expression level value for each marker in at least one term selected from the group consisting of term 1, term 2, term 3, term 4, term 5, term 6, and term 7; wherein term 1 comprises marker 1, marker 2, and marker 3, wherein marker 1 comprises GenBank accession number AF161365, wherein marker 2 comprises HNRPF or ACBD5, and wherein marker 3 comprises TFCP2 or DDX18; wherein term 2 comprises marker 4, marker 5, and marker 6, wherein marker 4 comprises GenBank accession number AF289562 or CD248, wherein marker 5 comprises HNRPF or ACBD5, and wherein marker 6 comprises TFCP2 or DDX18; wherein term 3 comprises marker 7, marker 8, marker 9, and marker 10 wherein marker 7 comprises CD79B or CD19, wherein marker 8 comprises SPIB or BLK, wherein marker 9 comprises CD3D or LCK, and wherein marker 10 comprises TMC8 or CCT2; wherein term 4 comprises marker 11, marker 12, marker 13, and marker 14, wherein marker 11 comprises S100A12 or MMP9, wherein marker 12 comprises CLEC4E or ALOX5AP, wherein marker 13 comprises S100A8 or NAMPT, and wherein marker 14 comprises RPL28 or SSRP1; wherein term 5 comprises marker 15, marker 16, marker 17, marker 18, and marker 19, wherein marker 15 comprises S100A12 or MMP9, wherein marker 16 comprises CLEC4E or ALOX5AP, wherein marker 17 comprises S100A8 or NAMPT, wherein marker 18 comprises AQP9 or GLT1D1, and wherein marker 19 comprises NCF4 or NCF2; wherein term 6 comprises marker 20, marker 21, marker 22, marker 23, marker 24, marker 25, and marker 26, wherein marker 20 comprises CASP5 or H3F3B, wherein marker 21 comprises IL18RAP or TXN, wherein marker 22 comprises TNFAIP6 or PLAUR, wherein marker 23 comprises IL8RB or BCL2A1, wherein marker 24 comprises TNFRSF10C or PTAFR, wherein marker 25 comprises KCNE3 or LAMP2, and wherein marker 26 comprises TLR4 or TYROBP; and wherein term 7 comprises marker 27, marker 28, marker 29, and marker 30, wherein marker 27 comprises SLAMF7 or CX3CR1, wherein marker 28 comprises KLRC4 or CD8A, wherein marker 29 comprises CD3D or LCK, and wherein marker 30 comprises TMC8 or CCT2; and a processor communicatively coupled to the storage memory for determining a score with an interpretation function, wherein a higher score relative to a control having less than 50% stenosis in all major vessels indicates that the subject has a higher likelihood of CAD.
- Also provided is a computer-readable storage medium storing computer-executable program code, the program code comprising:
- program code for storing a dataset associated with a sample obtained from the subject, wherein the dataset comprises a quantitative expression level value for each marker in at least one term selected from the group consisting of term 1, term 2, term 3, term 4, term 5, term 6, and term 7; wherein term 1 comprises marker 1, marker 2, and marker 3, wherein marker 1 comprises GenBank accession number AF161365, wherein marker 2 comprises HNRPF or ACBD5, and wherein marker 3 comprises TFCP2 or DDX18; wherein term 2 comprises marker 4, marker 5, and marker 6, wherein marker 4 comprises GenBank accession number AF289562 or CD248, wherein marker 5 comprises HNRPF or ACBD5, and wherein marker 6 comprises TFCP2 or DDX18; wherein term 3 comprises marker 7, marker 8, marker 9, and marker 10 wherein marker 7 comprises CD79B or CD19, wherein marker 8 comprises SPIB or BLK, wherein marker 9 comprises CD3D or LCK, and wherein marker 10 comprises TMC8 or CCT2; wherein term 4 comprises marker 11, marker 12, marker 13, and marker 14, wherein marker 11 comprises S100A12 or MMP9, wherein marker 12 comprises CLEC4E or ALOX5AP, wherein marker 13 comprises S100A8 or NAMPT, and wherein marker 14 comprises RPL28 or SSRP1; wherein term 5 comprises marker 15, marker 16, marker 17, marker 18, and marker 19, wherein marker 15 comprises S100A12 or MMP9, wherein marker 16 comprises CLEC4E or ALOX5AP, wherein marker 17 comprises S100A8 or NAMPT, wherein marker 18 comprises AQP9 or GLT1D1, and wherein marker 19 comprises NCF4 or NCF2; wherein term 6 comprises marker 20, marker 21, marker 22, marker 23, marker 24, marker 25, and marker 26, wherein marker 20 comprises CASP5 or H3F3B, wherein marker 21 comprises IL18RAP or TXN, wherein marker 22 comprises TNFAIP6 or PLAUR, wherein marker 23 comprises IL8RB or BCL2A1, wherein marker 24 comprises TNFRSF10C or PTAFR, wherein marker 25 comprises KCNE3 or LAMP2, and wherein marker 26 comprises TLR4 or TYROBP; and wherein term 7 comprises marker 27, marker 28, marker 29, and marker 30, wherein marker 27 comprises SLAMF7 or CX3CR1, wherein marker 28 comprises KLRC4 or CD8A, wherein marker 29 comprises CD3D or LCK, and wherein marker 30 comprises TMC8 or CCT2; and program code for determining a score with an interpretation function, wherein a higher score relative to a control having less than 50% stenosis in all major vessels indicates that the subject has a higher likelihood of CAD.
- Also described herein is a method for predicting CAD in a subject, including: obtaining a sample from the subject, wherein the sample includes a plurality of analytes; contacting the sample with a reagent; generating a plurality of complexes between the reagent and the plurality of analytes; detecting the plurality of complexes to obtain a dataset associated with the sample, wherein the first dataset includes quantitative expression data for at least one marker set selected from the group consisting of the marker sets in term 1, term 2, term 3, term 4, term 5, term 6, and term 7; wherein term 1 includes marker 1, marker 2, and marker 3, wherein marker 1 includes AF161365, wherein marker 2 includes HNRPF or ACBD5, and wherein marker 3 includes TFCP2 or DDX18; wherein term 2 includes marker 4, marker 5, and marker 6, wherein marker 4 includes AF289562 or CD248, wherein marker 5 includes HNRPF or ACBD5, and wherein marker 6 includes TFCP2 or DDX18; wherein term 3 includes marker 7, marker 8, marker 9, and marker 10 wherein marker 7 includes CD79B or CD 19, wherein marker 8 includes SPIB or BLK, wherein marker 9 includes CD3D or LCK, and wherein marker 10 includes TMC8 or CCT2; wherein term 4 includes marker 11, marker 12, marker 13, and marker 14, wherein marker 11 includes S100A12 or MMP9, wherein marker 12 includes CLEC4E or ALOX5AP, wherein marker 13 includes S100A8 or NAMPT, and wherein marker 14 includes RPL28 or SSRP1; wherein term 5 includes marker 15, marker 16, marker 17, marker 18, and marker 19, wherein marker 15 includes S100A12 or MMP9, wherein marker 16 includes CLEC4E or ALOX5AP, wherein marker 17 includes S100A8 or NAMPT, wherein marker 18 includes AQP9 or GLT1D1, and wherein marker 19 includes NCF4 or NCF2; wherein term 6 includes marker 20, marker 21, marker 22, marker 23, marker 24, marker 25, and marker 26, wherein marker 20 includes CASP5 or H3F3B, wherein marker 21 includes IL18RAP or TXN, wherein marker 22 includes TNFAIP6 or PLAUR, wherein marker 23 includes IL8RB or BCL2A1, wherein marker 24 includes TNFRSF10C or PTAFR, wherein marker 25 includes KCNE3 or LAMP2, and wherein marker 26 includes TLR4 or TYROBP; and wherein term 7 includes marker 27, marker 28, marker 29, and marker 30, wherein marker 27 includes SLAMF7 or CX3CR1, wherein marker 28 includes KLRC4 or CD8A, wherein marker 29 includes CD3D or LCK, and wherein marker 30 includes TMC8 or CCT2; and determining a score from the dataset using an interpretation function, wherein the score is predictive of CAD in the subject.
- Also described herein is a kit for predicting CAD in a subject, including: a set of reagents including a plurality of reagents for determining from a sample obtained from the subject quantitative expression data for at least one marker set selected from the group consisting of the marker sets in term 1, term 2, term 3, term 4, term 5, term 6, and term 7; wherein term 1 includes marker 1, marker 2, and marker 3, wherein marker 1 includes AF161365, wherein marker 2 includes HNRPF or ACBD5, and wherein marker 3 includes TFCP2 or DDX18; wherein term 2 includes marker 4, marker 5, and marker 6, wherein marker 4 includes AF289562 or CD248, wherein marker 5 includes HNRPF or ACBD5, and wherein marker 6 includes TFCP2 or DDX18; wherein term 3 includes marker 7, marker 8, marker 9, and marker 10 wherein marker 7 includes CD79B or CD 19, wherein marker 8 includes SPIB or BLK, wherein marker 9 includes CD3D or LCK, and wherein marker 10 includes TMC8 or CCT2; wherein term 4 includes marker 11, marker 12, marker 13, and marker 14, wherein marker 11 includes S100A12 or MMP9, wherein marker 12 includes CLEC4E or ALOX5AP, wherein marker 13 includes S100A8 or NAMPT, and wherein marker 14 includes RPL28 or SSRP1; wherein term 5 includes marker 15, marker 16, marker 17, marker 18, and marker 19, wherein marker 15 includes S100A12 or MMP9, wherein marker 16 includes CLEC4E or ALOX5AP, wherein marker 17 includes S100A8 or NAMPT, wherein marker 18 includes AQP9 or GLT1D1, and wherein marker 19 includes NCF4 or NCF2; wherein term 6 includes marker 20, marker 21, marker 22, marker 23, marker 24, marker 25, and marker 26, wherein marker 20 includes CASP5 or H3F3B, wherein marker 21 includes IL18RAP or TXN, wherein marker 22 includes TNFAIP6 or PLAUR, wherein marker 23 includes IL8RB or BCL2A1, wherein marker 24 includes TNFRSF10C or PTAFR, wherein marker 25 includes KCNE3 or LAMP2, and wherein marker 26 includes TLR4 or TYROBP; and wherein term 7 includes marker 27, marker 28, marker 29, and marker 30, wherein marker 27 includes SLAMF7 or CX3CR1, wherein marker 28 includes KLRC4 or CD8A, wherein marker 29 includes CD3D or LCK, and wherein marker 30 includes TMC8 or CCT2; and instructions for using the plurality of reagents to determine quantitative data from the sample, wherein the instructions include instructions for determining a score from the dataset wherein the score is predictive of CAD in the subject.
- In an aspect the instructions include instructions for conducting a microarray assay. In an aspect the instructions include instructions for conducting a polymerase chain reaction assay.
- Also described herein is a system for predicting CAD in a subject, the system including: a storage memory for storing a dataset associated with a sample obtained from the subject, wherein the dataset includes quantitative expression data for at least two markers selected from the group consisting of AF161365, HNRPF, ACBD5, TFCP2, DDX18, AF289562, CD248, CD79B, CD19, SPIB, BLK, CD3D, LCK, TMC8, CCT2, S100A12, MMP9, CLEC4E, ALOX5AP, S100A8, NAMPT, RPL28, SSRP1, AQP9, GLT1D1, NCF4, NCF2, CASP5, H3F3B, IL18RAP, TXN, TNFAIP6, PLAUR, IL8RB, BCL2A1, TNFRSF10C, PTAFR, KCNE3, LAMP2, TLR4, TYROBP, SLAMF7, CX3CR1, KLRC4, and CD8A; and a processor communicatively coupled to the storage memory for determining a score with an interpretation function wherein the score is predictive of CAD in the subject.
- Also described herein is a computer-readable storage medium storing computer-executable program code, the program code including: program code for storing a dataset associated with a sample obtained from the subject, wherein the dataset includes quantitative expression data for at least two markers selected from the group consisting of AF161365, HNRPF, ACBD5, TFCP2, DDX18, AF289562, CD248, CD79B, CD19, SPIB, BLK, CD3D, LCK, TMC8, CCT2, S100A12, MMP9, CLEC4E, ALOX5AP, S100A8, NAMPT, RPL28, SSRP1, AQP9, GLT1D1, NCF4, NCF2, CASP5, H3F3B, IL18RAP, TXN, TNFAIP6, PLAUR, IL8RB, BCL2A1, TNFRSF10C, PTAFR, KCNE3, LAMP2, TLR4, TYROBP, SLAMF7, CX3CR1, KLRC4, and CD8A; and program code for determining a score with an interpretation function wherein the score is predictive of CAD in the subject.
- Also described herein is a method for predicting CAD in a subject, including: obtaining a sample from the subject, wherein the sample includes a plurality of analytes; contacting the sample with a reagent; generating a plurality of complexes between the reagent and the plurality of analytes; detecting the plurality of complexes to obtain a dataset associated with the sample, wherein the dataset includes quantitative expression data for at least two markers selected from the group consisting of AF161365, HNRPF, ACBD5, TFCP2, DDX18, AF289562, CD248, CD79B, CD19, SPIB, BLK, CD3D, LCK, TMC8, CCT2, S100A12, MMP9, CLEC4E, ALOX5AP, S100A8, NAMPT, RPL28, SSRP1, AQP9, GLT1D1, NCF4, NCF2, CASP5, H3F3B, IL18RAP, TXN, TNFAIP6, PLAUR, IL8RB, BCL2A1, TNFRSF10C, PTAFR, KCNE3, LAMP2, TLR4, TYROBP, SLAMF7, CX3CR1, KLRC4, and CD8A; and determining a score from the dataset using an interpretation function, wherein the score is predictive of CAD in the subject.
- Also described herein is a kit for predicting CAD in a subject, including: a set of reagents including a plurality of reagents for determining from a sample obtained from the subject quantitative expression data for at least two markers selected from the group consisting of AF161365, HNRPF, ACBD5, TFCP2, DDX18, AF289562, CD248, CD79B, CD19, SPIB, BLK, CD3D, LCK, TMC8, CCT2, S100A12, MMP9, CLEC4E, ALOX5AP, S100A8, NAMPT, RPL28, SSRP1, AQP9, GLT1D1, NCF4, NCF2, CASP5, H3F3B, IL18RAP, TXN, TNFAIP6, PLAUR, IL8RB, BCL2A1, TNFRSF10C, PTAFR, KCNE3, LAMP2, TLR4, TYROBP, SLAMF7, CX3CR1, KLRC4, and CD8A; and instructions for using the plurality of reagents to determine quantitative data from the sample, wherein the instructions include instructions for determining a score from the dataset, wherein the score is predictive of CAD in the subject.
- These and other features, aspects, and advantages of the present invention will become better understood with regard to the following description, and accompanying drawings, where:
-
Figure 1 - Gene Discovery, Algorithm Development, and Validation Patient and Logic Flow Schematic. Initial gene discovery (CATHGEN repository) included both diabetic and non-diabetic patients. Gene discovery from Personalized Risk Evaluation and Diagnosis in the Coronary Tree (PREDICT) involved non-diabetic patients in a paired microarray analysis, that yielded 655 significant genes in common with those from the CATHGEN arrays. For RT-PCR 113 genes were selected and tested on 640 PREDICT patient samples, from which the final algorithm was derived and locked, followed by validation in the PREDICT validation cohort (N=526). -
Figure 2 - RT-PCR Analysis of Diabetics vs Non-diabetic Significant Genes from CATHGEN Microarray analysis. Significance of individual genes selected from the CATHGEN microarray cohort in non-diabetic (ND) and diabetic (D) patients is shown. The sex/age adjusted p values from a CAD logistic regression analysis in each subset are plotted (log scale). Significant p values (<0.05) are indicated in red with gene symbols (upper left quadrant and lower right quadrant), non-significant ones in black (upper right quadrant). -
Figure 3 - Venn Diagram of microarray, RT-PCR, and algorithm gene sources. A total of 7718 genes were identified, 2438 and 5935, respectively, from the CATHGEN and PREDICT microarray analyses, with an intersection of 655 genes. For the 113 RT-PCR genes, 52 were from PREDICT, 22 from CATHGEN, and 29 from both; 10 were either normalization genes or from previous studies.7 The final algorithm contained 20 informative genes: 10 from both microarray studies, 8 PREDICT alone, and 2 CATHGEN alone. -
Figure 4 - Correlation of PCR gene expression to lymphocyte fraction (y-axis) and neutrophil fraction (x-axis) for the 113 PCR genes measured in the PREDICT algorithm development cohort. The range of correlation is up to 0.6 and a total of 42 genes were correlated with neutrophil fraction at >0.2 whereas 39 genes were correlated with lymphocyte count at the same threshold. Genes are identified using the numbering scheme in Table 2. -
Figure 5 - Schematic of the Algorithm Structure and Genes. The algorithm consists of overlapping gene expression functions for males and females with a sex-specific linear age function for the former and a non-linear age function for the latter. For the gene expression components, 16/23 genes in 4 terms are gender independent: Term 1 - neutrophil activation and apoptosis, Term 3 - NK cell activation to T cell ratio,Term 4, B to T cell ratio, and Term 5 -AF289562 expression normalized to TFCP2 and HNRPF. In addition,Term 2 consists of 3 sex-independent neutrophil/innate immunity genes (S100A8, S100A12, CLEC4E) normalized to overall neutrophil gene expression (AQP9, NCF4) for females and to RPL28 (lymphocytes) for males. The final male specific term is the normalized expression of TSPAN16. Algorithm score is defined as 1.821- .755*Term1-.406*Term3 -.308*Term2*Sex-.137*Term4 -.548*Term2*(1-Sex) -.246*Term5 -.481*Term6*Sex +.851*Sex +.045*Sex*Age +.123*(1-Sex)*max(0,Age-55), where Sex is a 0/1 indicator of sex (0=female, 1=male) and age is in years, and is calculated as described (Methods Section below). -
Figure 6 - Comparison of Algorithm Performance between Cross-Validation Estimate and Independent Validation. ROC curves of the cross-validation (dashed line) and independent validation (solid line) of the algorithm is shown relative to an AUC of 0.50 (dotted line). The 95% confidence intervals are indicated by the solid areas. The AUC values are: for cross-validation 0.77 (95% CI, 0.73-0.81) and for the independent validation cohort 0.70 (95% CI, 0.65-0.75, p=10-16). -
Figure 7 -Allocation of Patients from the PREDICT trial for algorithm development and validation. From a total of 1569 subjects meeting the study inclusion/exclusion criteria 226 were used for gene discovery. The remaining 1343 were divided into independent cohorts for algorithm development (694) and validation (649) as shown; 94% of patients in these cohorts came from the same centers. For algorithm development a total of 640 patient samples were used; 54 were excluded due to incomplete data (Diamond GA, Forrester JS. Analysis of probability as an aid in the clinical diagnosis of coronary-artery disease. N Engl J Med. 1979;300(24):1350-8.), inadequate blood volume (Stangl V, Witzel V, Baumann G, Stangl K. Current diagnostic concepts to detect coronary artery disease in women. Eur Heart J. 2008;29(6):707-17.), sex mismatch between experimental and clinical records (Gibbons RJ, Abrams J, Chatterjee K, et al. ACC/AHA 2002 guideline update for the management of patients with chronic stable angina--summary article: a report of the American College of Cardiology/American Heart Association Task Force on practice guidelines (Committee on the Management of Patients With Chronic Stable Angina). J Am Coll Cardiol. 2003;41(1):159-68.), or statistical outlier assessment (Cook NR, Ridker PM. Advances in measuring the effect of individual predictors of cardiovascular risk: the role of reclassification measures. Ann Intern Med. 2009;150(11):795-802.). For the validation cohort a total of 123 samples were excluded based on: inadequate blood volume or RNA yield (43), significant contamination with genomic DNA (78), or prespecified statistical outlier assessment (2). -
Figure 8 - The net benefit curve for a diagnostic as a function of pt, a threshold probability that represents the tradeoff between false positives and false negatives. The curve quantifies the net benefit to following the decision rule of score>pt = positive, over a range of possible value for pt. The reference lines reflect the net benefit of a) all subjects positive (lower curve) or b) all subjects negative (line at net benefit = 0). The net benefit curve for the gene expression algorithm is shown as the top curve, and is greater than either reference line over clinically relevant range for pt. -
Figure 9 - ROC analysis of Validation Cohort Performance For Algorithm and Clinical Variables. Algorithm performance adds to Clinical Factors by Diamond-Forrester. Comparison of the combination of D-F score and algorithm score (heavy solid line) to D-F score alone (---) in ROC analysis is shown. The AUC=0.50 line (light solid line) is shown for reference. A total of 525 of the 526 validation cohort patients had information available to calculate D-F scores. The AUCs for the two ROC curves are 0.721 ± 0.023 and 0.663 ±0.025, p = 0.003. -
Figure 10 - Dependence of Algorithm Score on % Maximum Stenosis in the Validation Cohort. The extent of disease for each patient was quantified by QCA maximum % stenosis and grouped into 5 categories: no measurable disease, 1-24%, 25-49% in ≥1 vessel, 1 vessel ≥50%, and >1 vessel ≥50%. The average algorithm score for each group is illustrated; error bars correspond to 95% confidence intervals. - In general, terms used in the claims and the specification are intended to be construed as having the plain meaning understood by a person of ordinary skill in the art. Certain terms are defined below to provide additional clarity. In case of conflict between the plain meaning and the provided definitions, the provided definitions are to be used.
- The term "acute coronary syndrome" encompasses all forms of unstable coronary artery disease.
- The term "coronary artery disease" or "CAD" encompasses all forms of atherosclerotic disease affecting the coronary arteries.
- The term "Ct" refers to cycle threshold and is defined as the PCR cycle number where the fluorescent value is above a set threshold. Therefore, a low Ct value corresponds to a high level of expression, and a high Ct value corresponds to a low level of expression.
- The term "Cp" refers to the crossing point and is defined as the intersection of the best fit of the log-linear portion of a standard's amplification curve in a real time PCR instrument such as, e.g., a LightCycler, and the noise band (set according to background fluorescence measurements).
- The term "FDR" means to false discovery rate. FDR can be estimated by analyzing randomly-permuted datasets and tabulating the average number of genes at a given p-value threshold.
- The terms "GL" "GM" and "GU" respectively refer to 1st percentile, median, and 99th percentile of Cp for that gene in the Algorithm Development data set.
- The terms "marker" or "markers" encompass, without limitation, lipids, lipoproteins, proteins, cytokines, chemokines, growth factors, peptides, nucleic acids, genes, and oligonucleotides, together with their related complexes, metabolites, mutations, variants, polymorphisms, modifications, fragments, subunits, degradation products, elements, and other analytes or sample-derived measures. A marker can also include mutated proteins, mutated nucleic acids, variations in copy numbers, and/or transcript variants, in circumstances in which such mutations, variations in copy number and/or transcript variants are useful for generating a predictive model, or are useful in predictive models developed using related markers (e.g., non-mutated versions of the proteins or nucleic acids, alternative transcripts, etc.).
- The terms "highly correlated gene expression" or "highly correlated marker expression" refer to gene or marker expression values that have a sufficient degree of correlation to allow their interchangeable use in a predictive model of coronary artery disease. For example, if gene x having expression value X is used to construct a predictive model, highly correlated gene y having expression value Y can be substituted into the predictive model in a straightforward way readily apparent to those having ordinary skill in the art and the benefit of the instant disclosure. Assuming an approximately linear relationship between the expression values of genes x and y such that Y = a + bX, then X can be substituted into the predictive model with (Y-a)/b. For non-linear correlations, similar mathematical transformations can be used that effectively convert the expression value of gene y into the corresponding expression value for gene x. The terms "highly correlated marker" or "highly correlated substitute marker" refer to markers that can be substituted into and/or added to a predictive model based on, e.g., the above criteria. A highly correlated marker can be used in at least two ways: (1) by substitution of the highly correlated marker(s) for the original marker(s) and generation of a new model for predicting CAD risk; or (2) by substitution of the highly correlated marker(s) for the original marker(s) in the existing model for predicting CAD risk.
- The term "mammal" encompasses both humans and non-humans and includes but is not limited to humans, non-human primates, canines, felines, murines, bovines, equines, and porcines.
- The term "metagene" refers to a set of genes whose expression values are combined to generate a single value that can be used as a component in a predictive model. (Brunet, J.P., et al. Proc. Natl. Acad. Sciences 2004;101(12):4164-9)
- The term "myocardial infarction" refers to an ischemic myocardial necrosis. This is usually the result of abrupt reduction in coronary blood flow to a segment of the myocardium, the muscular tissue of the heart. Myocardial infarction can be classified into ST-elevation and non-ST elevation MI (also referred to as unstable angina). Myocardial necrosis results in either classification. Myocardial infarction, of either ST-elevation or non-ST elevation classification, is an unstable form of atherosclerotic cardiovascular disease.
- The term "sample" can include a single cell or multiple cells or fragments of cells or an aliquot of body fluid, taken from a subject, by means including venipuncture, excretion, ejaculation, massage, biopsy, needle aspirate, lavage sample, scraping, surgical incision, or intervention or other means known in the art.
- The term "subject" encompasses a cell, tissue, or organism, human or non-human, whether in vivo, ex vivo, or in vitro, male or female.
- The term "obtaining a dataset associated with a sample" encompasses obtaining a set of data determined from at least one sample. Obtaining a dataset encompasses obtaining a sample, and processing the sample to experimentally determine the data. The phrase also encompasses receiving a set of data, e.g., from a third party that has processed the sample to experimentally determine the dataset. Additionally, the phrase encompasses mining data from at least one database or at least one publication or a combination of databases and publications. A dataset can be obtained by one of skill in the art via a variety of known ways including stored on a storage memory.
- The term "clinical factor" refers to a measure of a condition of a subject, e.g., disease activity or severity. "Clinical factor" encompasses all markers of a subject's health status, including non-sample markers, and/or other characteristics of a subject, such as, without limitation, age and gender. A clinical factor can be a score, a value, or a set of values that can be obtained from evaluation of a sample (or population of samples) from a subject or a subject under a determined condition. A clinical factor can also be predicted by markers and/or other parameters such as gene expression surrogates.
- It must be noted that, as used in the specification and the appended claims, the singular forms "a," "an," and "the" include plural referents unless the context clearly dictates otherwise.
- The quantity of one or more markers of the invention can be indicated as a value. A value can be one or more numerical values resulting from evaluation of a sample under a condition. The values can be obtained, for example, by experimentally obtaining measures from a sample by an assay performed in a laboratory, or alternatively, obtaining a dataset from a service provider such as a laboratory, or from a database or a server on which the dataset has been stored, e.g., on a storage memory.
- In an embodiment, the quantity of one or more markers can be one or more numerical values associated with expression levels of: AF161365, HNRPF, ACBD5, TFCP2, DDX18, AF289562, CD248, HNRPF, ACBD5, TFCP2, DDX18, CD79B, CD19, SPIB, BLK, CD3D, LCK, TMC8, CCT2, S100A12, MMP9, CLEC4E, ALOX5AP, S100A8, NAMPT, RPL28, SSRP1, S100A12, MMP9, CLEC4E, ALOX5AP, S100A8, NAMPT, AQP9, GLT1D1, NCF4, NCF2, CASP5, H3F3B, IL18RAP, TXN, TNFAIP6, PLAUR, IL8RB, BCL2A1, TNFRSF10C, PTAFR, KCNE3, LAMP2, TLR4, TYROBP, SLAMF7, CX3CR1, KLRC4, CD8A, CD3D, LCK, TMC8, or CCT2; resulting from evaluation of a sample under a condition. This nomenclature is used to refer to human genes in accordance with guidelines provided by the Human Genome Organisation (HUGO) Gene Nomenclature Committee (HGNC). Further information about each human gene, such as accession number(s) and aliases, can be found by entering the gene name into the search page on the HGNC Search genenames.org website. For example, entering the term "CD3D" into the Simple Search field of the HGNC website on June 1,2010 returns the approved gene name of CD3D (CD3d molecule, delta (CD3-TCR complex)), the sequence accession IDs of CD3D (X01451; NM_000732), and the previous symbols of CD3D (T3D). Further human gene names are provided in the Examples section below.
- In an embodiment, a condition can include one clinical factor or a plurality of clinical factors. In an embodiment, a clinical factor can be included within a dataset. A dataset can include one or more, two or more, three or more, four or more, five or more, six or more, seven or more, eight or more, nine or more, ten or more, eleven or more, twelve or more, thirteen or more, fourteen or more, fifteen or more, sixteen or more, seventeen or more, eighteen or more, nineteen or more, twenty or more, twenty-one or more, twenty-two or more, twenty-three or more, twenty-four or more, twenty-five or more, twenty-six or more, twenty-seven or more, twenty-eight or more, twenty-nine or more, or thirty or more overlapping or distinct clinical factor(s). A clinical factor can be, for example, the condition of a subject in the presence of a disease or in the absence of a disease. Alternatively, or in addition, a clinical factor can be the health status of a subject. Alternatively, or in addition, a clinical factor can be age, gender, chest pain type, neutrophil count, ethnicity, disease duration, diastolic blood pressure, systolic blood pressure, a family history parameter, a medical history parameter, a medical symptom parameter, height, weight, a body-mass index, resting heart rate, and smoker/non-smoker status. Clinical factors can include whether the subject has stable chest pain, whether the subject has typical angina, whether the subject has atypical angina, whether the subject has an anginal equivalent, whether the subject has been previously diagnosed with MI, whether the subject has had a revascularization procedure, whether the subject has diabetes, whether the subject has an inflammatory condition, whether the subject has an infectious condition, whether the subject is taking a steroid, whether the subject is taking an immunosuppressive agent, and/or whether the subject is taking a chemotherapeutic agent. Other examples of clinical factors are listed in the Tables and Figures.
- In an embodiment, a marker's associated value can be included in a dataset associated with a sample obtained from a subject. A dataset can include the marker expression value of two or more, three or more, four or more, five or more, six or more, seven or more, eight or more, nine or more, ten or more, eleven or more, twelve or more, thirteen or more, fourteen or more, fifteen or more, sixteen or more, seventeen or more, eighteen or more, nineteen or more, twenty or more, twenty-one or more, twenty-two or more, twenty-three or more, twenty-four or more, twenty-five or more, twenty-six or more, twenty-seven or more, twenty-eight or more, twenty-nine or more, or thirty or more marker(s). For example, a dataset can include the expression values for AF161365, HNRPF, ACBD5; AF161365, HNRPF; or AF161365, ACBD5. Other combinations are described in more detail in the Examples section below.
- In an embodiment, one or more markers can be divided into terms. Terms can include one marker, but generally include three or more markers. Terms can be included in a dataset associated with a sample obtained from a subject. The dataset can include one or more terms, two or more terms, three or more terms, four or more terms, five or more terms, six or more terms, seven or more terms, eight or more terms, nine or more terms, or ten or more terms. In an embodiment, a term can include one or more, two or more, three or more, four or more, five or more, six or more, seven or more, eight or more, nine or more, ten or more, eleven or more, twelve or more, thirteen or more, fourteen or more, fifteen or more, sixteen or more, seventeen or more, eighteen or more, nineteen or more, twenty or more, twenty-one or more, twenty-two or more, twenty-three or more, twenty-four or more, twenty-five or more, twenty-six or more, twenty-seven or more, twenty-eight or more, twenty-nine or more, or thirty or more marker(s). In an embodiment, the markers are divided into seven distinct terms:
term 1,term 2,term 3,term 4,term 5,term 6, andterm 7. In an embodiment,term 1 can includemarker 1,marker 2, andmarker 3, wheremarker 1 includes AF161365, wheremarker 2 includes HNRPF or ACBD5, and wheremarker 3 includes TFCP2 or DDX18. In an embodiment,term 2 can includemarker 4,marker 5, andmarker 6, wheremarker 4 includes AF289562 or CD248, wheremarker 5 includes HNRPF or ACBD5, and wheremarker 6 includes TFCP2 or DDX18. In an embodiment,term 3 can includemarker 7,marker 8,marker 9, andmarker 10 wheremarker 7 includes CD79B or CD19, wheremarker 8 includes SPIB or BLK, wheremarker 9 includes CD3D or LCK, and wheremarker 10 includes TMC8 or CCT2. In an embodiment,term 4 can include marker 11,marker 12, marker 13, and marker 14, where marker 11 includes S100A12 or MMP9, wheremarker 12 includes CLEC4E or ALOX5AP, where marker 13 includes S100A8 or NAMPT, and where marker 14 includes RPL28 or SSRP1. In an embodiment,term 5 can includemarker 15,marker 16,marker 17, marker 18, and marker 19, wheremarker 15 includes S100A12 or MMP9, wheremarker 16 includes CLEC4E or ALOX5AP, wheremarker 17 includes S100A8 or NAMPT, where marker 18 includes AQP9 or GLT1D1, and where marker 19 includes NCF4 or NCF2. In an embodiment,term 6 can includemarker 20, marker 21,marker 22,marker 23, marker 24, marker 25, and marker 26, wheremarker 20 includes CASP5 or H3F3B, where marker 21 includes IL18RAP or TXN, wheremarker 22 includes TNFAIP6 or PLAUR, wheremarker 23 includes IL8RB or BCL2A1, where marker 24 includes TNFRSF10C or PTAFR, where marker 25 includes KCNE3 or LAMP2, and where marker 26 includes TLR4 or TYROBP. In an embodiment,term 7 can include marker 27, marker 28,marker 29, andmarker 30, where marker 27 includes SLAMF7 or CX3CR1, where marker 28 includes KLRC4 or CD8A, wheremarker 29 includes CD3D or LCK, and wheremarker 30 includes TMC8 or CCT2. - In another embodiment, the invention includes obtaining a sample associated with a subject, where the sample includes one or more markers. The sample can be obtained by the subject or by a third party, e.g., a medical professional. Examples of medical professionals include physicians, emergency medical technicians, nurses, first responders, psychologists, medical physics personnel, nurse practitioners, surgeons, dentists, and any other obvious medical professional as would be known to one skilled in the art. A sample can include peripheral blood cells, isolated leukocytes, or RNA extracted from peripheral blood cells or isolated leukocytes. The sample can be obtained from any bodily fluid, for example, amniotic fluid, aqueous humor, bile, lymph, breast milk, interstitial fluid, blood, blood plasma, cerumen (earwax), Cowper's fluid (pre-ejaculatory fluid), chyle, chyme, female ejaculate, menses, mucus, saliva, urine, vomit, tears, vaginal lubrication, sweat, serum, semen, sebum, pus, pleural fluid, cerebrospinal fluid, synovial fluid, intracellular fluid, and vitreous humour. In an example, the sample is obtained by a blood draw, where the medical professional draws blood from a subject, such as by a syringe. The bodily fluid can then be tested to determine the value of one or more markers using an assay. The value of the one or more markers can then be evaluated by the same party that performed the assay using the methods of the invention or sent to a third party for evaluation using the methods of the invention.
- In an embodiment, an interpretation function can be a function produced by a predictive model. An interpretation function can also be produced by a plurality of predictive models. In an embodiment, an interpretation function can include terms Norm1, Norm2, NKup, Tcell, Bcell, Neut, Nup, Ndown, SCA1, AF2, TSPAN, SEX, and INTERCEPT. In a related embodiment, Norm1 = RPL28, Norm2 = (.5*HNRPF + .5*TFCP2), NKup = (.5*SLAMF7 + .5*KLRC4), Tcell = (.5*CD3D + .5*TMC8), Bcell = (2/3 *CD79B + 1/3 * SPIB), Neut = (.5*AQP9 + .5*NCF4), Nup = (1/3 * CASP5 + 1/3*IL18RAP + 1/3*TNFAIP6), Ndown = (.25*IL8RB + .25*TNFRSF10C + .25*TLR4 + .25*KCNE3), SCA1 = (1/3*S100A12 + 1/3*CLEC4E + 1/3*S100A8), AF2 = AF289562, TSPAN = 1 if (AF161365-Norm2 > 6.27 or AF161365=NoCall), 0 otherwise, SEX = 1 for Males, 0 for Females. In a related embodiment, for Males, INTERCEPT = Intercept + SEX + MAGE *Age, with Age in years, and for Females, INTERCEPT = Intercept + OFAGE2 *max(0,Age-60), with Age in years. In a related embodiment, coefficients Intercept = 1.82120871, SEX = 0.851181, OFAGE2 = 0.123283, MAGE = 0.044868, TSPAN = -0.48182, AF2 = --0.24592, Bcell = -0.13717, SCA1M = -0.30754, NeutF = -0.54778, Nupdown = -0.75514, and NK = -0.40579. In a related embodiment, a score is determined according to INTERCEPT - Nupdown *(Nup - Ndown) - NK*(NKup - Tcell) - SCA1M *SEX*(SCA1- Norm1) - Bcell * (Bcell- Tcell) - NeutF *(1-SEX)*( SCA1- Neut) - TSPANcoef *SEX*(TSPAN) - AF2 *(AF2- Norm2). In an embodiment, an interpretation function can include any linear combination of age, gender (i.e., sex), and one or more terms.
- In an embodiment, a predictive model can include a partial least squares model, a logistic regression model, a linear regression model, a linear discriminant analysis model, a ridge regression model, and a tree-based recursive partitioning model. In an embodiment, a predictive model can also include Support Vector Machines, quadratic discriminant analysis, or a LASSO regression model. See Elements of Statistical Learning, Springer 2003, Hastie, Tibshirani, Friedman; which is herein incorporated by reference in its entirety for all purposes. Predictive model performance can be characterized by an area under the curve (AUC). In an embodiment, predictive model performance is characterized by an AUC ranging from 0.68 to 0.70. In an embodiment, predictive model performance is characterized by an AUC ranging from 0.70 to 0.79. In an embodiment, predictive model performance is characterized by an AUC ranging from 0.80 to 0.89. In an embodiment, predictive model performance is characterized by an AUC ranging from 0.90 to 0.99.
- Examples of assays for one or more markers include DNA assays, microarrays, polymerase chain reaction (PCR), RT-PCR, Southern blots, Northern blots, antibody-binding assays, enzyme-linked immunosorbent assays (ELISAs), flow cytometry, protein assays, Western blots, nephelometry, turbidimetry, chromatography, mass spectrometry, immunoassays, including, by way of example, but not limitation, RIA, immunofluorescence, immunochemiluminescence, immunoelectrochemiluminescence, or competitive immunoassays, immunoprecipitation, and the assays described in the Examples section below. The information from the assay can be quantitative and sent to a computer system of the invention. The information can also be qualitative, such as observing patterns or fluorescence, which can be translated into a quantitative measure by a user or automatically by a reader or computer system. In an embodiment, the subject can also provide information other than assay information to a computer system, such as race, height, weight, age, gender, eye color, hair color, family medical history and any other information that may be useful to a user, such as a clinical factor described above.
- In addition to the specific, exemplary markers identified in this application by name, accession number, or sequence, included within the scope of the invention are all operable predictive models of CAD and methods for their use to score and optionally classify samples using expression values of variant sequences having at least 90% or at least 95% or at least 97% or greater identity to the exemplified sequences or that encode proteins having sequences with at least 90% or at least 95% or at least 97% or greater identity to those encoded by the exemplified genes or sequences. The percentage of sequence identity may be determined using algorithms well known to those of ordinary skill in the art, including, e.g., BLASTn, and BLASTp, as described in Stephen F. Altschul et al., J. Mol. Biol. 215:403-410 (1990) and available at the National Center for Biotechnology Information website maintained by the National Institutes of Health. As described below, in accordance with an embodiment of the present invention, are all operable predictive models and methods for their use in scoring and optionally classifying samples that use a marker expression measurement that is now known or later discovered to be highly correlated with the expression of an exemplary marker expression value in addition to or in lieu of that exemplary marker expression value. For the purposes of the present invention, such highly correlated genes are contemplated either to be within the literal scope of the claimed inventions or alternatively encompassed as equivalents to the exemplary markers. Identification of markers having expression values that are highly correlated to those of the exemplary markers, and their use as a component of a predictive model is well within the level of ordinary skill in the art. The Examples section below provides numerous examples of methods for identifying highly correlated markers and substituting them for algorithm markers in predictive models of CAD and methods for their use to score and optionally classify samples.
- In one embodiment, a computer comprises at least one processor coupled to a chipset. Also coupled to the chipset are a memory, a storage device, a keyboard, a graphics adapter, a pointing device, and a network adapter. A display is coupled to the graphics adapter. In one embodiment, the functionality of the chipset is provided by a memory controller hub and an I/O controller hub. In another embodiment, the memory is coupled directly to the processor instead of the chipset.
- The storage device is any device capable of holding data, like a hard drive, compact disk read-only memory (CD-ROM), DVD, or a solid-state memory device. The memory holds instructions and data used by the processor. The pointing device may be a mouse, track ball, or other type of pointing device, and is used in combination with the keyboard to input data into the computer system. The graphics adapter displays images and other information on the display. The network adapter couples the computer system to a local or wide area network.
- As is known in the art, a computer can have different and/or other components than those described previously. In addition, the computer can lack certain components. Moreover, the storage device can be local and/or remote from the computer (such as embodied within a storage area network (SAN)).
- As is known in the art, the computer is adapted to execute computer program modules for providing functionality described herein. As used herein, the term "module" refers to computer program logic utilized to provide the specified functionality. Thus, a module can be implemented in hardware, firmware, and/or software. In one embodiment, program modules are stored on the storage device, loaded into the memory, and executed by the processor.
- The term percent "identity," in the context of two or more nucleic acid or polypeptide sequences, refer to two or more sequences or subsequences that have a specified percentage of nucleotides or amino acid residues that are the same, when compared and aligned for maximum correspondence, as measured using one of the sequence comparison algorithms described below (e.g., BLASTP and BLASTN or other algorithms available to persons of skill) or by visual inspection. Depending on the application, the percent "identity" can exist over a region of the sequence being compared, e.g., over a functional domain, or, alternatively, exist over the full length of the two sequences to be compared.
- For sequence comparison, typically one sequence acts as a reference sequence to which test sequences are compared. When using a sequence comparison algorithm, test and reference sequences are input into a computer, subsequence coordinates are designated, if necessary, and sequence algorithm program parameters are designated. The sequence comparison algorithm then calculates the percent sequence identity for the test sequence(s) relative to the reference sequence, based on the designated program parameters.
- Optimal alignment of sequences for comparison can be conducted, e.g., by the local homology algorithm of Smith & Waterman, Adv. Appl. Math. 2:482 (1981), by the homology alignment algorithm of Needleman & Wunsch, J. Mol. Biol. 48:443 (1970), by the search for similarity method of Pearson & Lipman, Proc. Nat'l. Acad. Sci. USA 85:2444 (1988), by computerized implementations of these algorithms (GAP, BESTFIT, FASTA, and TFASTA in the Wisconsin Genetics Software Package, Genetics Computer Group, 575 Science Dr., Madison, Wis.), or by visual inspection (see generally Ausubel et al., infra).
- One example of an algorithm that is suitable for determining percent sequence identity and sequence similarity is the BLAST algorithm, which is described in Altschul et al., J. Mol. Biol. 215:403-410 (1990). Software for performing BLAST analyses is publicly available through the National Center for Biotechnology Information.
- Embodiments of the entities described herein can include other and/or different modules than the ones described here. In addition, the functionality attributed to the modules can be performed by other or different modules in other embodiments. Moreover, this description occasionally omits the term "module" for purposes of clarity and convenience.
- Below are examples of specific embodiments for carrying out the present invention. The examples are offered for illustrative purposes only, and are not intended to limit the scope of the present invention in any way. Efforts have been made to ensure accuracy with respect to numbers used (e.g., amounts, temperatures, etc.), but some experimental error and deviation should, of course, be allowed for.
- The practice of the present invention will employ, unless otherwise indicated, conventional methods of protein chemistry, biochemistry, recombinant DNA techniques and pharmacology, within the skill of the art. Such techniques are explained fully in the literature. See, e.g., T.E. Creighton, Proteins: Structures and Molecular Properties (W.H. Freeman and Company, 1993); A.L. Lehninger, Biochemistry (Worth Publishers, Inc., current addition); Sambrook, et al., Molecular Cloning: A Laboratory Manual (2nd Edition, 1989); Methods In Enzymology (S. Colowick and N. Kaplan eds., Academic Press, Inc.); Remington's Pharmaceutical Sciences, 18th Edition (Easton, Pennsylvania: Mack Publishing Company, 1990); Carey and Sundberg Advanced Organic Chemistry 3rd Ed. (Plenum Press) Vols A and B(1992).
- The overall study design is shown in
Figure 1 . This study had four distinct, consecutive phases. The PREDICT clinical trial registration information is available on the clinicaltrials.gov website at NCT00500617 on May 28, 2010. -
Phase 1 was Initial Gene Discovery from the Duke University CATHGEN registry, a retrospective blood repository.11 Briefly, 198 subjects (88 cases, 110 controls) from this repository were enrolled between August 2004 and November, 2005. Clinical inclusion and exclusion criteria were described previously and included both diabetic and non-diabetic patients.7 All CATHGEN patients gave written informed consent and the study protocol was approved by the Duke University IRB. Microarrays were performed to identify CAD sensitive genes, and a subset of genes was selected for RT-PCR replication. Given thephase 1 findings, only non-diabetic subjects were included subsequently. -
Phase 2 was a prospective gene discovery phase with subjects from the PREDICT study, where 198 patients (99 case: control pairs, matched for age and sex) underwent microarray analysis to identify differentially expressed genes. -
Phase 3 was prospective algorithm development with 640 patients (210 cases, 430 controls) to determine the inter-relationships between clinical factors, blood cell counts, gene expression, and CAD. - After Phase III was completed the locked algorithm was prospectively validated in an independent cohort of 526 patients (192 cases, 334 controls).
- Subjects from PREDICT were eligible if they had a history of chest pain, suspected anginal-equivalent symptoms, or a high risk of CAD with no known prior MI, revascularization, or CAD. Detailed inclusion/exclusion criteria have been described.12 Diabetic status was defined by clinical identification, blood glucose (non-fasting ≥200 or fasting ≥126), rorhemoglobin A1c, (≥6.5), or diabetic medication prescription. Complete blood counts with differentials were obtained for all patients. PREDICT patients gave written informed consent, and the study protocol was approved by the Western Institutional Review Board.
- Whole blood samples were collected in PAXgene® tubes prior to coronary angiography, according to the manufacturer's instructions, and then frozen at -20°C. For the CATHGEN samples RNA was purified as described (PreAnalytix, Franklin Lakes, NJ), followed by quantitative analysis (Ribogreen, Molecular Probes, Eugene, OR). For the PREDICT samples an automated method using the Agencourt RNAdvance system was employed. Microarray samples were labeled and hybridized to 41K Human Whole Genome Arrays (Agilent, PN #G4112A) using the manufacturer's protocol. For PREDICT microarrays all matched pairs were labeled and hybridized together to minimize microarray batch effects. Microarray data sets have been deposited in GEO (GSE 20686).
- Amplicon design, cDNA synthesis, and RT-PCR were performed as previously described.7, 12 All PCR reactions were run in triplicate and median values used for analysis. The primers and probes are shown in the Informal Sequence Listing below. The primers and probe for marker CD3D were obtained commercially from Applied Biosystems, Inc. (Assay ID: Hs00174158_m1; Part No. 4331182).
- Cell fractionation was performed on fresh blood collected in EDTA tubes. 120 ml blood pooled from 4 different donors was 1:1 diluted with 1X PBS. 15% of the blood was used for granulocyte isolation by density centrifugation and 85% of the blood was used for PBMC isolation prior to T cells, B cells, NK cells, and monocytes fractionation.
- PBMC was isolated by density centrifugation. 20 ml diluted blood was layered on 20ml Histopaque 1077 (Sigma Cat No.10771) in 50ml conical tubes and was centrifuged at room temperature for 30 min at 400Xg. The PBMC layer was carefully aspirated into new tubes and washed with 1X phosphate-buffered saline (PBS) twice and centrifuged at 200Xg for 10 min. The washed PBMC was re-suspended in cold buffer1 (1XPBS, 0.1%BSA and 2mMEDTA) and stored on ice. 5% of the cells were lysed in RLT buffer (Qiagen RNeasy Mini kit, Cat No. 74104) for pre-selection RNA isolation.
- Granulocytes (neutrophils, eosinophils, basophils) were purified by density centrifugation using two different density mediums. In 15ml conical tube, 3ml Hisopaque 1077 was layered on 3ml Histopaque 1119 (Sigma Cat No.11191) and 6ml of the diluted blood was then layered on Histopaque 1077. The tube was centrifuged at room temperature (RT) for 30min at 700Xg. The granulocyte layer was then aspirated into a new tube and washed twice. The pellet was re-suspended in RLT buffer for granulocyte RNA isolation.
- The subsequent cell types (T cells, B cells, natural killer (NK) cells, monocytes) were positively selected from PBMC used the following reagents and the recommended procedures.
- CD8+ T cells - Dynal® CD8 positive isolation kit (Invitrogen Cat. No.113.33D)
- CD3+ T cells - Dynabeads® CD3 (Invitrogen Cat. No.111.51D)
- CD19+ B cells - Dynabeads® CD19 pan B (Invitrogen Cat. No.111.43D)
- CD14+ Monocytes - Dynabeads® CD14 (monocytes/macrophages) (Invitrogen Cat. No.111.49D)
- CD56+ NK cells- Dynabeads® Pan Mouse IgG (Invitrogen Cat. No.110.41) crosslinked with mouse anti-human CD56 antibodies (BD bioscience Cat No.556325)
- Briefly, PBMC were incubated with antibody-coupled magnetic beads at 4°C for 20 min and washed 3 times with
buffer 1 on the magnet. The selected cells were then re-suspended in RLT buffer for RNA isolation. - The RNA samples in RLT buffer were purified using the Qiagen RNeasy Mini kit following the manufacturer's instructions.
- All patients were clinically referred for angiography and angiograms were performed based on local, institutional protocols. For CATHGEN patients, clinical angiographic interpretation defined cases as ≥75% maximum stenosis in one major vessel or ≥50% in two vessels and controls as <25% stenosis in all major vessels.
- For PREDICT patients, core laboratory QCA reads (Cardiovascular Research Foundation New York) were used for case: control classification. Cases had ≥50% stenosis in at least one major coronary vessel and controls <50% stenosis in all major vessels.
- Correlations with complete blood counts and database gene expression analysis (SymAtlas) were used to identify highly cell-type selective genes. In addition, whole blood cell fractionation by density centrifugation or through positive antibody selection followed by RT-PCR was performed on specific cell fractions.
- All statistical methods were performed using the R software package. The statistical methods used are described and referenced in greater detail below.
- Agilent processed signal values for array normalization were scaled to a trimmed mean of 100 and then log2 transformed. Standard array QC metrics (percent present, pairwise correlation, and signal intensity) were used for quality assessment, resulting in 3 of 198 CATHGEN and 12 of 210 PREDICT samples being excluded.
- For the CATHGEN array, logistic regression (unadjusted and sex/age adjusted) was used to assess gene expression association with case: control status. For the PREDICT array, given the paired design, conditional logistic regression was used. False discovery rates were used to account for multiple comparisons. GOEAST was used to determine over-representation of Gene Ontology (GO) terms.13
- Genes for RT-PCR were selected based on significance, fold-change, pathway analysis, and literature support. Hierarchical clustering based on gene: gene correlations ensured that RT-PCR genes represented multiple clusters. Normalization genes were selected based on low variance, moderate to high expression, and no significant association with case: control status, sex, age, or cell counts.
- Clinical/demographic factors were assessed for CAD association using univariate and multivariate logistic regression. Gene expression association with CAD and other clinical/demographic factors was assessed by robust logistic regression (unadjusted and sex/age adjusted).7
- Hierarchical clustering was used to group genes using a correlation cutoff. Clusters were reduced to meta-genes14 and normalization genes based on correlation structure, known biology, and cell count correlation. For meta-gene pairs with high correlation and opposite disease regulation, ratio terms (differences on the log scale) were defined. Meta-genes independently associated with outcome were selected by the LASSO method, with sex by meta-gene interactions allowed during variable selection.15
- The final algorithm was fit using Ridge regression16, where the outcome variable was case:control status and the predictors the LASSO-selected meta-genes and sex-specific age terms. Sex was a binary predictor, and age a linear predictor with separate slopes for males, females >60, and females <60. Gene expression term penalization was based on cross-validation and prior evidence. Model performance was estimated using leave-one-out cross-validation. Algorithm performance was validated in an independent patient cohort with ROC analysis as primary endpoint.
-
- 1) Compute median of triplicate wells for each algorithm gene/sample a. If one well has a no call, take the median of the two remaining wells b. If two or three wells have a no call, the algorithm gene receives a no call for that sample
- 2) If AF161365 (TSPAN16) receives a no call, impute the value of 38 as the median value for that gene.
- 3) If any algorithm gene other than AF161365 receives a no call, the sample fails for Missing Gene Cp. None of the 640 samples in Algorithm Development would fail this metric.
- 4) Compute the median of the algorithm gene SD's, excluding AF161365. If this value is greater than .15, the sample fails for High Replicate SD.
- 5) For each algorithm gene i, floor the Cp value by replacing values less than GLi with GLi This value represents the 1st percentile of Cp for that gene in the Algorithm Development set.
- 6) For each algorithm gene i, ceiling the Cp value by replacing values greater than GUi with GUi. This value represents the 99th percentile of Cp for that gene in the Algorithm Development set.
- 7) For each algorithm gene i, compute the absolute value of the difference between its Cp value and GMi, where GMi represents the median Cp for that gene in the Algorithm Development set. Sum this value across the algorithm genes (excluding AF161365). If the sum is greater than 27.17, the sample fails for Expression Profile Out of Range. 27.17 represents the largest value of this metric within the Algorithm Development set.
- In certain cases, an algorithm score will not be calculated for a subject. Reasons for this include low PAXgene® tube blood volume, lab QC failure, etc. The frequency of occurrence of these failures will be tabulated, though these subjects will not be included in the analysis set. Subjects with missing Diamond Forrester scores will not be included in the analysis set.
-
- 1) Define Norm1 = RPL28
- 2) Define Norm2 = (.5*HNRPF + .5*TFCP2)
- 3) Define NKup = (.5*SLAMF7 + .5*KLRC4)
- 4) Define Tcell = (.5*CD3D + .5*TMC88)
- 5) Define Bcell = (2/3 *CD79B + 1/3 * SPIB)
- 6) Define Neut = (.5*AQP9 + .5*NCF4)
- 7) Define Nup = (1/3 * CASP5 + 1/3*IL18RAP + 1/3*TNFAIP6)
- 8) Define Ndown = (.25*IL8RB + .25*TNFRSF10C + .25*TLR4 + .25*KCNE3)
- 9) Define SCA1 = (1/3*S100A12 + 1/3*CLEC4E + 1/3*S100A8)
- 10) Define AF2 = AF289562
- 11) Define TSPAN = 1 if (AF161365-Norm2 > 6.27 or AF161365=NoCall), 0 otherwise
- 12) Define SEX= 1 for Males, 0 for Females
- 13) Define Intercept
- a. For Males, INTERCEPT = 2.672 + 0.0449*Age
- b. For Females, INTERCEPT = 1.821 + 0.123*(Age-60), if negative set to 0
- 14) Define Score = INTERCEPT - 0.755 *(Nup - Ndown) - 0.406*(NKup - Tcell) - 0.308 *SEX*(SCA1- Norm1)- 0.137* (Bcell- Tcell)- 0.548 *(1-SEX)*( SCA1- Neut)- 0.482 *SEX*(TSPAN)- 0.246 *(AF2- Norm2)
- The endpoint analyses defined were performed using raw algorithm scores. For clinical reporting purposes, as well as ease of presentation, raw scores may be transformed into a transformed score with a scale designed for ease of clinical use as follows:
- Input is Raw Score
- If Raw Score< -2.95, set RawScore = -2.95
- If Raw Score> 1.57, set RawScore = 1.57
- Raw Score = 2.95 + RawScore
- Final Score = RawScore*40/4.52
- Round Final Score up to nearest integer
- If Final Score is greater than 40, set to 40
- If Final Score is less than 1, set to 1
- Value obtained is the Final Transformed Score
- A total of 41 replicate samples were tested from a large PAXgene® blood pool. The standard deviation of the raw score for these replicates was .13. The confidence interval around a given raw score was then the raw score plus or minus 1.96*.13. The upper and lower bounds of this confidence interval were linearly transformed to the 0 to 40 scale, and then transformed to a confidence interval around the likelihood using the score to likelihood function described above.
- Baseline demographic characteristics of the CATHGEN registry and PREDICT study patient cohorts are shown in Table 1. In general, CAD cases were more frequently men, older, had higher SBP, and more dyslipidemia.
- A total of 2438 genes showed significant CAD association (p <0.05) in a 195 subject case:control analysis (
Figure 1 ). Clinical and demographic factor analysis of gene expression showed diabetes as the most significant (p=0.0006, Table 3). Based on statistical significance and biological relevance, 88 genes (Table 4) were selected for RT-PCR analysis on these same samples. CAD-gene expression analysis in non-diabetic and diabetic subsets (N = 124 and 71, respectively), showed 42 and 12 significant genes, respectively (p<0.05), with no intersection (Figure 2 ). Further work was thus limited to non-diabetics. - We observed a strong diabetes-gene expression interaction effect on CAD risk in the CATHGEN cohort, and thus restricted algorithm development to PREDICT non-diabetics. The CATHGEN diabetic subjects encompassed a range of disease severity and a variety of medications, some of which modulate gene expression and affect cardiovascular disease.17
- Microarray CAD gene discovery on 210 PREDICT patient samples used a paired case:control experimental design, to reduce confounding effects of age, sex, and microarray batch processing. CAD analysis on the 99 case:control pairs after QC exclusions yielded 5935 significant genes (p <0.05) with 655 genes in common with the CATHGEN results (
Figure 3 , Table 5). - Gene Ontology (GO) analysis of these 655 genes identified 189 significant biological process terms (p<0.05, Table 6), largely reflecting inflammation, cellular and stress response, cell death, and apoptosis. The cellular and molecular ontologies showed enrichment of 32 and 49 terms respectively, including mitochondrial function, apoptotic protease activator activity, and antigen binding.
- A total of 113 genes (Table 2) were selected by statistical significance, biological relevance, and prior association with CAD and gene expression measured by RT-PCR in the PREDICT development cohort. Known cell-type specific markers, those correlated with cell counts in PREDICT, and candidate normalization genes, were also represented.
- The algorithm was derived using the RT-PCR and clinical data from the PREDICT development cohort. The most significant clinical factors for CAD:gene expression association were age, sex, chest pain type, and neutrophil count. Age and sex were independent risk factors for CAD (Table 1) and showed significant gene expression correlation. Chest pain type was also a significant independent risk factor (p=0.005), but was gene expression independent. Neutrophil count was significantly correlated (positively or negatively) to expression of 93 of 113 RT-PCR genes, and was significantly associated with CAD in males (p=0.049), but not females (p=0.77). Gene expression correlations for all genes to neutrophil and lymphocyte fraction were computed (
Figure 4 ). A correlation cut-off of >0.2 yielded 39 genes as lymphocyte-associated and 42 genes as neutrophil-associated. Neutrophil-associated genes showed both up and down regulation with CAD status, whereas lymphocyte-associated genes were generally down-regulated. There was significant gender-specific regulation of neutrophil correlated genes (males 40/42 genes up-regulated, females, 41/42 down-regulated) whereas lymphocyte gene down-regulation was gender independent. - Hierarchical clustering of the 113 PCR genes resulted in 18 correlated clusters (Table 2), with finer correlation substructure within the lymphocyte and neutrophil associated genes. There were 3 lymphocyte subgroups representing T-cells (
clusters - previously described neutrophil genes (IL8RB, S100A8, S100A12, TXN, BCL2A1; cluster 13, 16); newly identified up-regulated neutrophil genes (CLEC4E, CASP5, TNFAIP6; cluster 16) and down-regulated neutrophil genes (KCNE3, TLR4, TNFRSF10C; clusters 13, 14).7 The 29 genes in clusters 4-11 did not have clear cell-type association.
- Based on the correlation and cell-type analyses, 15 meta-genes and 3 normalization genes were defined as inputs for model variable selection. Selection by the LASSO method, and weight penalization by Ridge regression resulted in the final, locked algorithm, comprising 20 CAD-associated genes and 3 normalization genes in 6 meta-genes (
Figure 5 ). The algorithm score was defined as the predicted regression model value. - The PCR algorithm development set was sufficiently powered to investigate the relationship between CAD, clinical factors, and gene expression. The most significant independent clinical risk factors for CAD were age, gender, and chest pain type, the components of the Diamond-Forrester risk model for CAD likelihood,1 supporting its use as a reference to assess algorithm performance.12
- The relationships between age, gender, CAD, and gene expression are complex. Increasing age and male gender are well-known risk-factors for CAD which affects gene expression in circulating cells.18, 19 The majority of genes measured by RT-PCR in this study correlated with lymphocyte or neutrophil fraction (
Figure 4 ; r >0.2 for 39 and 42 genes respectively). Genes in the neutrophil-associated group include many we previously identified (clusters 6,13,14; Table 2).7 Lymphocyte group genes include those known to be expressed in T-cells (CD3, TMC8), B-cells (SPIB, CD79B), and NK-cells (SLAMF7, KLRC4) (Clusters - The use of correlated meta-genes as building blocks for the algorithm is significantly reflective of gene expression cell-type specificity. The algorithm genes are expressed selectively in multiple types of circulating cells including neutrophils, NK cells, B and T-lymphocytes 21, supporting roles for both adaptive and innate immune responses in atherosclerosis.4
-
Algorithm term 1 genes (Figure 5 ) preferentially expressed in neutrophils, may reflect neutrophil apoptosis, as caspase-5 is increased with CAD, whereas TNFRSF10C, an anti-apoptotic decoy receptor of TRAIL, is decreased.22Term 2 genes up-regulated with CAD likely reflect both innate immune activation (S100A8 and S100A12),23 and a cellular necrosis response (CLEC4E).24 S100A8 and S100A12 are up-regulated in chronic inflammatory conditions, perhaps reflecting a more general pathophysiological signal, consistent with increased CAD in disorders such as rheumatoid arthritis.25, 26 -
Term 2 is normalized in a gender specific manner. In males normalization to RPL28, which is strongly expressed in lymphocytes, reflects the neutrophil to lymphocyte ratio, which is prognostic for death or MI in a CAD population.8 In females normalization to AQP9 and NCF4, two CAD insensitive neutrophil genes, permits assessment of neutrophil up-regulation of the S100s and CLEC4E. -
Term 3 consists of 2 NK cell receptors, SLAMF7 and KLRC4, normalized to T-cell specific genes (TMC8 and CD3D). SLAMF7 may specifically activate NK cell function, while inhibiting B and T cells.27 KLRC4 is also likely involved in NK cell activation.28 NK cells have been associated with atherosclerosis in both mouse models and humans, and reduced lymphocyte counts associated with cardiac events.8, 29 -
Term 4 is a gene expression based measure of the B/T-cell ratio. The role of T cells is complex, whereas B cells have been shown in mouse models to be athero-protective.30, 31 In this study apparent up-regulation of B-cell specific genes is correlated with CAD, perhaps indicating an immunological response to disease. The last two terms, based on AF289562 (AF2) and TSPAN16 are genes of unknown function. - The estimated cross-validated algorithm AUC in ROC analysis in the PREDICT development set was 0.77 (95% CI 0.73 to 0.81); prospective validation in the independent PREDICT validation set of 526 patients (192 cases, 334 controls) yielded an AUC of 0.70 (95% CI = 0.65 to 0.75) (
Figure 6 ). - For algorithm development in Phases III and IV, we used a robust approach, which minimized the effect of any single gene, by using meta-genes as building blocks.14, 32 Penalized stepwise logistic regression (LASSO) selected significant meta-genes from a 640 patient data set which greatly exceeded the number of candidate variables (15 meta-genes), reducing the likelihood of over-fitting. Further, in order to minimize over-weighting of individual terms, meta-gene coefficients were penalized using Ridge regression.
- The cross-validated model AUC was 0.77 (95% CI 0.73 to 0.81), suggesting the algorithm score was a significant CAD predictor, and the validation cohort AUC was 0.70, with overlapping confidence intervals (95% CI = 0.65 to 0.75). This modest decrease may reflect an over-optimistic cross-validation estimate, as we did not re-select terms during each iteration.
- Thus, using a series of microarray and RT-PCR data sets, comprising more than 1,500 patients, we have derived and validated an algorithm, consisting of the expression levels of 23 genes, sex, and age, which assesses the likelihood of obstructive CAD in non-diabetic patients.
- This study presents the development and validation of a whole blood derived RT-PCR based gene-expression algorithm for assessment of obstructive CAD likelihood in non-diabetic patients, and includes several key findings. First, gene expression patterns that differentiate diabetic patients with and without CAD were very different from those for study patients without diabetes. In the initial Gene Discovery Cohort, 2438 genes were differentially expressed in cases versus controls. In the second, PREDICT gene discovery cohort in non-diabetic patients, 5935 genes were differentially expressed and 655 overlapped with the initial gene discovery genes. Based on overall correlations and biological significance, 113 of these 655 genes, were selected for RT-PCR analysis in the independent algorithm development cohort (Phase III), which also identified relationships between clinical factors, cell counts, and gene expression. The algorithm, including 23 gene expression levels, age, and sex, was derived from these data and locked. It was then prospectively shown to have significant diagnostic accuracy in Phase IV, the prospective PREDICT validation cohort, with an AUC of 0.70 (95% CI = 0.65 to 0.75; p=10-16).
- We consider our results robust, due to at least two factors. First, we used a carefully designed, serial, four-phase study comprising >1,500 patients, with initial microarray-based gene discovery confirmed by quantitative RT-PCR measurements in independent patients. Second, we used QCA to define CAD cases and controls, yielding a more accurate gold standard.
- In the following series of examples (7-47), we examined the sensitivity of the algorithm and the algorithm development process to differences in terms, markers, and statistical methods. Each example follows the same general procedure: 1) identify a plausible alternative model approach (e.g., fewer terms, alternate markers, etc.); 2) rebuild the algorithm based on that alternative approach, including re-weighting the terms and/or markers as appropriate; and 3) assess whether the new model retains significant predictive accuracy.
- The ability of the algorithm to determine the likelihood of CAD in the absence of one out of the seven terms was assessed. A single term was removed sequentially from the algorithm while maintaining the other terms and the clinical factors of age and gender. For example,
term 1 was removed from the algorithm while terms 2-7 and the clinical factors (age and gender) remained in the algorithm. The markers in terms 1-7 are shown in the table below. Two statistical methods were used for the assessment: logistic regression and ridge regression. For all analyses, the area under the ROC curve (AUC) was the primary accuracy metric used. AUC was computed using cross validation. For example, whenterm 1 was removed from the algorithm the altered algorithm was as follows: -
- 1) Define Norm1 = RPL28
- 2) Define Norm2 = (.5*HNRPF + .5*TFCP2)
- 3) Define NKup = (.5*SLAMF7 + .5*KLRC4)
- 4) Define Tcell = (.5*CD3D + .5*TMC8)
- 5) Define Bcell = (2/3 *CD79B + 1/3 * SPIB)
- 6) Define Neut = (.5*AQP9 + .5*NCF4)
- 7) Define Nup = (1/3 * CASP5 + 1/3*IL18RAP + 1/3*TNFAIP6)
- 8) Define Ndown = (.25*IL8RB + .25*TNFRSF10C + .25*TLR4 + .25*KCNE3)
- 9) Define SCA1 = (1/3*MMP9 + 1/3*CLEC4E + 1/3*S100A8)
- 10) Define AF2 = AF289562
- 11) Define SEX= 1 for Males, 0 for Females
- 12) Define Intercept
- a. For Males, INTERCEPT = 0.70 + 0.044*Age
- b. For Females, INTERCEPT = 0.38 + 0.126*(Age-60), if negative set to 0
- 13) Define Score = INTERCEPT - 0.39 *(Nup - Ndown) - 0.26*(NKup - Tcell) - 0.33 *SEX*(SCA1- Norm1- 0.06* (Bcell- Tcell)- 0.07 *(1-SEX)*(SCA1-Neut)- 0.26 *(AF2- Norm2)
- A similar algorithm development procedure was used for the sequential removal of the other terms in this example as well as examples below. Summary statistics for each of the calculations as well as the mean and standard deviation of the results are shown in Table 7. AUC's greater than the upper bound of the confidence interval for the AUC of Diamond Forrester (DF) were considered significantly better than the DF model. See Table 8. All six-term sets tested were significantly better than the DF model indicating that the algorithm remains predictive of the likelihood of CAD even after removal of one term.
Term Markers Term 1 AF161365, HNRPF, TFCP2 Term 2 AF289562, HNRPF, TFCP2 Term 3 CD79B, SPIB, CD3D, TMC8 Term 4 S100A12, CLEC4E, S100A8, RPL28 Term 5 S100A12, CLEC4E, S100A8, AQP9, NCF4 Term 6 CASP5, IL18RAP, TNFAIP6, IL8RB, TNFRSF10C, KCNE3, TLR4 Term 7 SLAMF7, KLRC4, CD3D, TMC8 - The ability of the algorithm to determine the likelihood of CAD in the absence of two out of the seven terms was assessed. Two distinct terms were removed from the algorithm while maintaining the other terms and the clinical factors of age and gender. For example, terms 6-7 were removed from the algorithm while terms 1-5 and the clinical factors remained in the algorithm. All possible five term combinations were assessed. Two statistical methods were used for the assessment: logistic regression and ridge regression. For all analyses, the area under the ROC curve (AUC) was the primary accuracy metric used. AUC was computed using cross validation. Summary statistics for each of the calculations as well as the mean and standard deviation of the results are shown in Table 9. AUC's greater than the upper bound of the confidence interval for the AUC of Diamond Forrester (DF) were considered significantly better than the DF model. See Table 8. All five-term sets tested were significantly better than the DF model indicating that the algorithm remains predictive of the likelihood of CAD even after removal of two terms.
- The ability of the algorithm to determine the likelihood of CAD in the absence of three out of the seven terms was assessed. Three distinct terms were removed from the algorithm while maintaining the other terms and the clinical factors of age and gender. For example, terms 5-7 were removed from the algorithm while terms 1-4 and the clinical factors remained in the algorithm. All possible four term combinations were assessed. Two statistical methods were used for the assessment: logistic regression and ridge regression. For all analyses, the area under the ROC curve (AUC) was the primary accuracy metric used. AUC was computed using cross validation. Summary statistics for each of the calculations as well as the mean and standard deviation of the results are shown in Table 10. AUC's greater than the upper bound of the confidence interval for the AUC of Diamond Forrester (DF) were considered significantly better than the DF model. See Table 8. All four-term sets tested were significantly better than the DF model indicating that the algorithm remains predictive of the likelihood of CAD even after removal of three terms.
- The ability of the algorithm to determine the likelihood of CAD in the absence of four out of the seven terms was assessed. Four distinct terms were removed from the algorithm while maintaining the other terms and the clinical factors of age and gender. For example, terms 4-7 were removed from the algorithm while terms 1-3 and the clinical factors remained in the algorithm. All possible three term combinations were assessed. Two statistical methods were used for the assessment: logistic regression and ridge regression. For all analyses, the area under the ROC curve (AUC) was the primary accuracy metric used. AUC was computed using cross validation. Summary statistics for each of the calculations as well as the mean and standard deviation of the results are shown in Table 11. AUC's greater than the upper bound of the confidence interval for the AUC of Diamond Forrester (DF) were considered significantly better than the DF model. See Table 8. All three-term sets tested were significantly better than the DF model indicating that the algorithm remains predictive of the likelihood of CAD even after removal of four terms.
- The ability of the algorithm to determine the likelihood of CAD in the absence of five out of the seven terms was assessed. Five distinct terms were removed from the algorithm while maintaining the other terms and the clinical factors of age and gender. For example, terms 3-7 were removed from the algorithm while terms 1-2 and the clinical factors remained in the algorithm. All possible two term combinations were assessed. Two statistical methods were used for the assessment: logistic regression and ridge regression. For all analyses, the area under the ROC curve (AUC) was the primary accuracy metric used. AUC was computed using cross validation. Summary statistics for each of the calculations as well as the mean and standard deviation of the results are shown in Table 12. AUC's greater than the upper bound of the confidence interval for the AUC of Diamond Forrester (DF) were considered significantly better than the DF model. See Table 8. All two-term sets tested were significantly better than the DF model indicating that the algorithm remains predictive of the likelihood of CAD even after removal of five terms.
- The ability of the algorithm to determine the likelihood of CAD in the absence of six out of the seven terms was assessed. Six distinct terms were removed from the algorithm while maintaining the other terms and the clinical factors of age and gender. For example, terms 2-7 were removed from the algorithm while
term 1 and the clinical factors remained in the algorithm. Two statistical methods were used for the assessment: logistic regression and ridge regression. For all analyses, the area under the ROC curve (AUC) was the primary accuracy metric used. AUC was computed using cross validation. Summary statistics for each of the calculations as well as the mean and standard deviation of the results are shown in Table 13. AUC's greater than the upper bound of the confidence interval for the AUC of Diamond Forrester (DF) were considered significantly better than the DF model. See Table 8. All one-term sets tested were significantly better than the DF model indicating that the algorithm remains predictive of the likelihood of CAD even after removal of six terms. - The ability of the algorithm to determine the likelihood of CAD in the absence of seven out of the seven marker expression terms was assessed. Seven distinct terms were removed from the algorithm while maintaining the clinical factors of age and gender. Two statistical methods were used for the assessment: logistic regression and ridge regression. For the analysis, the area under the ROC curve (AUC) was the primary accuracy metric used. AUC was computed using cross validation. Summary statistics for the calculations are shown in Table 14. AUC's greater than the upper bound of the confidence interval for the AUC of Diamond Forrester (DF) were considered significantly better than the DF model. See Table 8. The age plus gender plus zero-marker expression term set tested was significantly better than the DF model indicating that the algorithm remains predictive of the likelihood of CAD even after removal of all seven marker expression terms. This indicates that the algorithm weighting of gender and age is superior to the weighting of clinical factors in the DF model.
- For each algorithm marker, a highly correlated, non-algorithm substitute marker was identified from the Phase III PCR data set described above (See Table 1b and Table 2). For each marker, a Pearson correlation value between that marker and all other markers was computed and then we picked the substitute marker with maximal correlation to the algorithm marker of interest. This substitute was the marker with the highest correlation to the algorithm marker, subject to the restriction that a substitute marker was not used more than once in the terms of the algorithm. The correlation value for this particular replacement is shown in Table 15. Two statistical methods were used for the analysis: logistic regression and ridge regression. For the analysis, the area under the ROC curve (AUC) was the primary accuracy metric. AUC was computed using cross validation. Accuracy was computed for models that substituted one gene at a time. In this example, MMP9 was substituted for S100A12 in all relevant terms of the algorithm, here MMP9 was substituted for S100A12 in
terms -
- 1) Define Norm1 = RPL28
- 2) Define Norm2 = (.5*HNRPF + .5*TFCP2)
- 3) Define NKup = (.5*SLAMF7 + .5*KLRC4)
- 4) Define Tcell = (.5*CD3D + .5*TMC8)
- 5) Define Bcell = (2/3 *CD79B + 1/3 * SPIB)
- 6) Define Neut = (.5*AQP9 + .5*NCF4)
- 7) Define Nup = (1/3 * CASP5 + 1/3*IL18RAP + 1/3*TNFAIP6)
- 8) Define Ndown = (.25*IL8RB + .25*TNFRSF10C + .25*TLR4 + .25*KCNE3)
- 9) Define SCA1 = (1/3*MMP9 + 1/3*CLEC4E + 1/3*S100A8)
- 10) Define AF2 = AF289562
- 11) Define TSPAN = 1 if (AF161365-Norm2 > 6.27 or AF161365=NoCall), 0 otherwise
- 12) Define SEX= 1 for Males, 0 for Females
- 13) Define Intercept
- a. For Males, INTERCEPT = 5.28 + 0.047*Age
- b. For Females, INTERCEPT = 4.44 + 0.120*(Age-60), if negative set to 0
- 14) Define Score = INTERCEPT -1.05 *(Nup - Ndown) - 0.56*(NKup - Tcell) - 0.35 *SEX*(SCA1- Norm1)- 0.30* (Bcell- Tcell)- 0.89 *(1-SEX)*(SCA1-Neut)- 0.87 *SEX*(TSPAN)- 0.38 *(AF2- Norm2)
- A similar algorithm development procedure was used in examples below. Summary statistics for the calculations are shown in Table 15. AUC's greater than the upper bound of the confidence interval for the AUC of Diamond Forrester (DF) were considered significantly better than the DF model. See Table 16 for DF AUC. The algorithm with the substitute marker remained significantly better than the DF model indicating that the algorithm remains predictive of the likelihood of CAD even after replacement of the algorithm marker with the highly correlated substitute marker.
- For each algorithm marker, a highly correlated, non-algorithm substitute marker was identified from the Phase III PCR data set described above. For each marker, a Pearson correlation value between that marker and all other markers was computed and then we picked the substitute marker with maximal correlation to the algorithm marker of interest. This substitute was the marker with the highest correlation to the algorithm marker, subject to the restriction that a substitute marker was not used more than once in the terms of the algorithm. The correlation value for this particular replacement is shown in Table 15. Two statistical methods were used for the analysis: logistic regression and ridge regression. For the analysis, the area under the ROC curve (AUC) was the primary accuracy metric. AUC was computed using cross validation. Accuracy was computed for models that substituted one gene at a time. In this example, ALOX5AP was substituted for CLEC4E in all relevant terms of the algorithm. Summary statistics for the calculations are shown in Table 15. AUC's greater than the upper bound of the confidence interval for the AUC of Diamond Forrester (DF) were considered significantly better than the DF model. See Table 16 for DF AUC. The algorithm with the substitute marker remained significantly better than the DF model indicating that the algorithm remains predictive of the likelihood of CAD even after replacement of the algorithm marker with the highly correlated substitute marker.
- For each algorithm marker, a highly correlated, non-algorithm substitute marker was identified from the Phase III PCR data set described above. For each marker, a Pearson correlation value between that marker and all other markers was computed and then we picked the substitute marker with maximal correlation to the algorithm marker of interest. This substitute was the marker with the highest correlation to the algorithm marker, subject to the restriction that a substitute marker was not used more than once in the terms of the algorithm. The correlation value for this particular replacement is shown in Table 15. Two statistical methods were used for the analysis: logistic regression and ridge regression. For the analysis, the area under the ROC curve (AUC) was the primary accuracy metric. AUC was computed using cross validation. Accuracy was computed for models that substituted one gene at a time. In this example, NAMPT was substituted for S100A8 in all relevant terms of the algorithm. Summary statistics for the calculations are shown in Table 15. AUC's greater than the upper bound of the confidence interval for the AUC of Diamond Forrester (DF) were considered significantly better than the DF model. See Table 16 for DF AUC. The algorithm with the substitute marker remained significantly better than the DF model indicating that the algorithm remains predictive of the likelihood of CAD even after replacement of the algorithm marker with the highly correlated substitute marker.
- For each algorithm marker, a highly correlated, non-algorithm substitute marker was identified from the Phase III PCR data set described above. For each marker, a Pearson correlation value between that marker and all other markers was computed and then we picked the substitute marker with maximal correlation to the algorithm marker of interest. This substitute was the marker with the highest correlation to the algorithm marker, subject to the restriction that a substitute marker was not used more than once in the terms of the algorithm. The correlation value for this particular replacement is shown in Table 15. Two statistical methods were used for the analysis: logistic regression and ridge regression. For the analysis, the area under the ROC curve (AUC) was the primary accuracy metric. AUC was computed using cross validation. Accuracy was computed for models that substituted one gene at a time. In this example, H3F3B was substituted for CASP5 in all relevant terms of the algorithm. Summary statistics for the calculations are shown in Table 15. AUC's greater than the upper bound of the confidence interval for the AUC of Diamond Forrester (DF) were considered significantly better than the DF model. See Table 16 for DF AUC. The algorithm with the substitute marker remained significantly better than the DF model indicating that the algorithm remains predictive of the likelihood of CAD even after replacement of the algorithm marker with the highly correlated substitute marker.
- For each algorithm marker, a highly correlated, non-algorithm substitute marker was identified from the Phase III PCR data set described above. For each marker, a Pearson correlation value between that marker and all other markers was computed and then we picked the substitute marker with maximal correlation to the algorithm marker of interest. This substitute was the marker with the highest correlation to the algorithm marker, subject to the restriction that a substitute marker was not used more than once in the terms of the algorithm. The correlation value for this particular replacement is shown in Table 15. Two statistical methods were used for the analysis: logistic regression and ridge regression. For the analysis, the area under the ROC curve (AUC) was the primary accuracy metric. AUC was computed using cross validation. Accuracy was computed for models that substituted one gene at a time. In this example, TXN was substituted for IL18RAP in all relevant terms of the algorithm. Summary statistics for the calculations are shown in Table 15. AUC's greater than the upper bound of the confidence interval for the AUC of Diamond Forrester (DF) were considered significantly better than the DF model. See Table 16 for DF AUC. The algorithm with the substitute marker remained significantly better than the DF model indicating that the algorithm remains predictive of the likelihood of CAD even after replacement of the algorithm marker with the highly correlated substitute marker.
- For each algorithm marker, a highly correlated, non-algorithm substitute marker was identified from the Phase III PCR data set described above. For each marker, a Pearson correlation value between that marker and all other markers was computed and then we picked the substitute marker with maximal correlation to the algorithm marker of interest. This substitute was the marker with the highest correlation to the algorithm marker, subject to the restriction that a substitute marker was not used more than once in the terms of the algorithm. The correlation value for this particular replacement is shown in Table 15. Two statistical methods were used for the analysis: logistic regression and ridge regression. For the analysis, the area under the ROC curve (AUC) was the primary accuracy metric. AUC was computed using cross validation. Accuracy was computed for models that substituted one gene at a time. In this example, PLAUR was substituted for TNFAIP6 in all relevant terms of the algorithm. Summary statistics for the calculations are shown in Table 15. AUC's greater than the upper bound of the confidence interval for the AUC of Diamond Forrester (DF) were considered significantly better than the DF model. See Table 16 for DF AUC. The algorithm with the substitute marker remained significantly better than the DF model indicating that the algorithm remains predictive of the likelihood of CAD even after replacement of the algorithm marker with the highly correlated substitute marker.
- For each algorithm marker, a highly correlated, non-algorithm substitute marker was identified from the Phase III PCR data set described above. For each marker, a Pearson correlation value between that marker and all other markers was computed and then we picked the substitute marker with maximal correlation to the algorithm marker of interest. This substitute was the marker with the highest correlation to the algorithm marker, subject to the restriction that a substitute marker was not used more than once in the terms of the algorithm. The correlation value for this particular replacement is shown in Table 15. Two statistical methods were used for the analysis: logistic regression and ridge regression. For the analysis, the area under the ROC curve (AUC) was the primary accuracy metric. AUC was computed using cross validation. Accuracy was computed for models that substituted one gene at a time. In this example, GLT1D1 was substituted for AQP9 in all relevant terms of the algorithm. Summary statistics for the calculations are shown in Table 15. AUC's greater than the upper bound of the confidence interval for the AUC of Diamond Forrester (DF) were considered significantly better than the DF model. See Table 16 for DF AUC. The algorithm with the substitute marker remained significantly better than the DF model indicating that the algorithm remains predictive of the likelihood of CAD even after replacement of the algorithm marker with the highly correlated substitute marker.
- For each algorithm marker, a highly correlated, non-algorithm substitute marker was identified from the Phase III PCR data set described above. For each marker, a Pearson correlation value between that marker and all other markers was computed and then we picked the substitute marker with maximal correlation to the algorithm marker of interest. This substitute was the marker with the highest correlation to the algorithm marker, subject to the restriction that a substitute marker was not used more than once in the terms of the algorithm. The correlation value for this particular replacement is shown in Table 15. Two statistical methods were used for the analysis: logistic regression and ridge regression. For the analysis, the area under the ROC curve (AUC) was the primary accuracy metric. AUC was computed using cross validation. Accuracy was computed for models that substituted one gene at a time. In this example, NCF2 was substituted for NCF4 in all relevant terms of the algorithm. Summary statistics for the calculations are shown in Table 15. AUC's greater than the upper bound of the confidence interval for the AUC of Diamond Forrester (DF) were considered significantly better than the DF model. See Table 16 for DF AUC. The algorithm with the substitute marker remained significantly better than the DF model indicating that the algorithm remains predictive of the likelihood of CAD even after replacement of the algorithm marker with the highly correlated substitute marker.
- For each algorithm marker, a highly correlated, non-algorithm substitute marker was identified from the Phase III PCR data set described above. For each marker, a Pearson correlation value between that marker and all other markers was computed and then we picked the substitute marker with maximal correlation to the algorithm marker of interest. This substitute was the marker with the highest correlation to the algorithm marker, subject to the restriction that a substitute marker was not used more than once in the terms of the algorithm. The correlation value for this particular replacement is shown in Table 15. Two statistical methods were used for the analysis: logistic regression and ridge regression. For the analysis, the area under the ROC curve (AUC) was the primary accuracy metric. AUC was computed using cross validation. Accuracy was computed for models that substituted one gene at a time. In this example, LCK was substituted for CD3D in all relevant terms of the algorithm. Summary statistics for the calculations are shown in Table 15. AUC's greater than the upper bound of the confidence interval for the AUC of Diamond Forrester (DF) were considered significantly better than the DF model. See Table 16 for DF AUC. The algorithm with the substitute marker remained significantly better than the DF model indicating that the algorithm remains predictive of the likelihood of CAD even after replacement of the algorithm marker with the highly correlated substitute marker.
- For each algorithm marker, a highly correlated, non-algorithm substitute marker was identified from the Phase III PCR data set described above. For each marker, a Pearson correlation value between that marker and all other markers was computed and then we picked the substitute marker with maximal correlation to the algorithm marker of interest. This substitute was the marker with the highest correlation to the algorithm marker, subject to the restriction that a substitute marker was not used more than once in the terms of the algorithm. The correlation value for this particular replacement is shown in Table 15. Two statistical methods were used for the analysis: logistic regression and ridge regression. For the analysis, the area under the ROC curve (AUC) was the primary accuracy metric. AUC was computed using cross validation. Accuracy was computed for models that substituted one gene at a time. In this example, CCT2 was substituted for TMC8 in all relevant terms of the algorithm. Summary statistics for the calculations are shown in Table 15. AUC's greater than the upper bound of the confidence interval for the AUC of Diamond Forrester (DF) were considered significantly better than the DF model. See Table 16 for DF AUC. The algorithm with the substitute marker remained significantly better than the DF model indicating that the algorithm remains predictive of the likelihood of CAD even after replacement of the algorithm marker with the highly correlated substitute marker.
- For each algorithm marker, a highly correlated, non-algorithm substitute marker was identified from the Phase III PCR data set described above. For each marker, a Pearson correlation value between that marker and all other markers was computed and then we picked the substitute marker with maximal correlation to the algorithm marker of interest. This substitute was the marker with the highest correlation to the algorithm marker, subject to the restriction that a substitute marker was not used more than once in the terms of the algorithm. The correlation value for this particular replacement is shown in Table 15. Two statistical methods were used for the analysis: logistic regression and ridge regression. For the analysis, the area under the ROC curve (AUC) was the primary accuracy metric. AUC was computed using cross validation. Accuracy was computed for models that substituted one gene at a time. In this example, CD19 was substituted for CD79B in all relevant terms of the algorithm. Summary statistics for the calculations are shown in Table 15. AUC's greater than the upper bound of the confidence interval for the AUC of Diamond Forrester (DF) were considered significantly better than the DF model. See Table 16 for DF AUC. The algorithm with the substitute marker remained significantly better than the DF model indicating that the algorithm remains predictive of the likelihood of CAD even after replacement of the algorithm marker with the highly correlated substitute marker.
- For each algorithm marker, a highly correlated, non-algorithm substitute marker was identified from the Phase III PCR data set described above. For each marker, a Pearson correlation value between that marker and all other markers was computed and then we picked the substitute marker with maximal correlation to the algorithm marker of interest. This substitute was the marker with the highest correlation to the algorithm marker, subject to the restriction that a substitute marker was not used more than once in the terms of the algorithm. The correlation value for this particular replacement is shown in Table 15. Two statistical methods were used for the analysis: logistic regression and ridge regression. For the analysis, the area under the ROC curve (AUC) was the primary accuracy metric. AUC was computed using cross validation. Accuracy was computed for models that substituted one gene at a time. In this example, BLK was substituted for SPIB in all relevant terms of the algorithm. Summary statistics for the calculations are shown in Table 15. AUC's greater than the upper bound of the confidence interval for the AUC of Diamond Forrester (DF) were considered significantly better than the DF model. See Table 16 for DF AUC. The algorithm with the substitute marker remained significantly better than the DF model indicating that the algorithm remains predictive of the likelihood of CAD even after replacement of the algorithm marker with the highly correlated substitute marker.
- For each algorithm marker, a highly correlated, non-algorithm substitute marker was identified from the Phase III PCR data set described above. For each marker, a Pearson correlation value between that marker and all other markers was computed and then we picked the substitute marker with maximal correlation to the algorithm marker of interest. This substitute was the marker with the highest correlation to the algorithm marker, subject to the restriction that a substitute marker was not used more than once in the terms of the algorithm. The correlation value for this particular replacement is shown in Table 15. Two statistical methods were used for the analysis: logistic regression and ridge regression. For the analysis, the area under the ROC curve (AUC) was the primary accuracy metric. AUC was computed using cross validation. Accuracy was computed for models that substituted one gene at a time. In this example, ACBD5 was substituted for HNRPF in all relevant terms of the algorithm. Summary statistics for the calculations are shown in Table 15. AUC's greater than the upper bound of the confidence interval for the AUC of Diamond Forrester (DF) were considered significantly better than the DF model. See Table 16 for DF AUC. The algorithm with the substitute marker remained significantly better than the DF model indicating that the algorithm remains predictive of the likelihood of CAD even after replacement of the algorithm marker with the highly correlated substitute marker.
- For each algorithm marker, a highly correlated, non-algorithm substitute marker was identified from the Phase III PCR data set described above. For each marker, a Pearson correlation value between that marker and all other markers was computed and then we picked the substitute marker with maximal correlation to the algorithm marker of interest. This substitute was the marker with the highest correlation to the algorithm marker, subject to the restriction that a substitute marker was not used more than once in the terms of the algorithm. The correlation value for this particular replacement is shown in Table 15. Two statistical methods were used for the analysis: logistic regression and ridge regression. For the analysis, the area under the ROC curve (AUC) was the primary accuracy metric. AUC was computed using cross validation. Accuracy was computed for models that substituted one gene at a time. In this example, DDX18 was substituted for TFCP2 in all relevant terms of the algorithm. Summary statistics for the calculations are shown in Table 15. AUC's greater than the upper bound of the confidence interval for the AUC of Diamond Forrester (DF) were considered significantly better than the DF model. See Table 16 for DF AUC. The algorithm with the substitute marker remained significantly better than the DF model indicating that the algorithm remains predictive of the likelihood of CAD even after replacement of the algorithm marker with the highly correlated substitute marker.
- For each algorithm marker, a highly correlated, non-algorithm substitute marker was identified from the Phase III PCR data set described above. For each marker, a Pearson correlation value between that marker and all other markers was computed and then we picked the substitute marker with maximal correlation to the algorithm marker of interest. This substitute was the marker with the highest correlation to the algorithm marker, subject to the restriction that a substitute marker was not used more than once in the terms of the algorithm. The correlation value for this particular replacement is shown in Table 15. Two statistical methods were used for the analysis: logistic regression and ridge regression. For the analysis, the area under the ROC curve (AUC) was the primary accuracy metric. AUC was computed using cross validation. Accuracy was computed for models that substituted one gene at a time. In this example, SSRP1 was substituted for RPL28 in all relevant terms of the algorithm. Summary statistics for the calculations are shown in Table 15. AUC's greater than the upper bound of the confidence interval for the AUC of Diamond Forrester (DF) were considered significantly better than the DF model. See Table 16 for DF AUC. The algorithm with the substitute marker remained significantly better than the DF model indicating that the algorithm remains predictive of the likelihood of CAD even after replacement of the algorithm marker with the highly correlated substitute marker.
- For each algorithm marker, a highly correlated, non-algorithm substitute marker was identified from the Phase III PCR data set described above. For each marker, a Pearson correlation value between that marker and all other markers was computed and then we picked the substitute marker with maximal correlation to the algorithm marker of interest. This substitute was the marker with the highest correlation to the algorithm marker, subject to the restriction that a substitute marker was not used more than once in the terms of the algorithm. The correlation value for this particular replacement is shown in Table 15. Two statistical methods were used for the analysis: logistic regression and ridge regression. For the analysis, the area under the ROC curve (AUC) was the primary accuracy metric. AUC was computed using cross validation. Accuracy was computed for models that substituted one gene at a time. In this example, CD248 was substituted for AF289562 in all relevant terms of the algorithm. Summary statistics for the calculations are shown in Table 15. AUC's greater than the upper bound of the confidence interval for the AUC of Diamond Forrester (DF) were considered significantly better than the DF model. See Table 16 for DF AUC. The algorithm with the substitute marker remained significantly better than the DF model indicating that the algorithm remains predictive of the likelihood of CAD even after replacement of the algorithm marker with the highly correlated substitute marker.
- For each algorithm marker, a highly correlated, non-algorithm substitute marker was identified from the Phase III PCR data set described above. For each marker, a Pearson correlation value between that marker and all other markers was computed and then we picked the substitute marker with maximal correlation to the algorithm marker of interest. This substitute was the marker with the highest correlation to the algorithm marker, subject to the restriction that a substitute marker was not used more than once in the terms of the algorithm. The correlation value for this particular replacement is shown in Table 15. Two statistical methods were used for the analysis: logistic regression and ridge regression. For the analysis, the area under the ROC curve (AUC) was the primary accuracy metric. AUC was computed using cross validation. Accuracy was computed for models that substituted one gene at a time. In this example, CX3CR1 was substituted for SLAMF7 in all relevant terms of the algorithm. Summary statistics for the calculations are shown in Table 15. AUC's greater than the upper bound of the confidence interval for the AUC of Diamond Forrester (DF) were considered significantly better than the DF model. See Table 16 for DF AUC. The algorithm with the substitute marker remained significantly better than the DF model indicating that the algorithm remains predictive of the likelihood of CAD even after replacement of the algorithm marker with the highly correlated substitute marker.
- For each algorithm marker, a highly correlated, non-algorithm substitute marker was identified from the Phase III PCR data set described above. For each marker, a Pearson correlation value between that marker and all other markers was computed and then we picked the substitute marker with maximal correlation to the algorithm marker of interest. This substitute was the marker with the highest correlation to the algorithm marker, subject to the restriction that a substitute marker was not used more than once in the terms of the algorithm. The correlation value for this particular replacement is shown in Table 15. Two statistical methods were used for the analysis: logistic regression and ridge regression. For the analysis, the area under the ROC curve (AUC) was the primary accuracy metric. AUC was computed using cross validation. Accuracy was computed for models that substituted one gene at a time. In this example, CD8A was substituted for KLRC4 in all relevant terms of the algorithm. Summary statistics for the calculations are shown in Table 15. AUC's greater than the upper bound of the confidence interval for the AUC of Diamond Forrester (DF) were considered significantly better than the DF model. See Table 16 for DF AUC. The algorithm with the substitute marker remained significantly better than the DF model indicating that the algorithm remains predictive of the likelihood of CAD even after replacement of the algorithm marker with the highly correlated substitute marker.
- For each algorithm marker, a highly correlated, non-algorithm substitute marker was identified from the Phase III PCR data set described above. For each marker, a Pearson correlation value between that marker and all other markers was computed and then we picked the substitute marker with maximal correlation to the algorithm marker of interest. This substitute was the marker with the highest correlation to the algorithm marker, subject to the restriction that a substitute marker was not used more than once in the terms of the algorithm. The correlation value for this particular replacement is shown in Table 15. Two statistical methods were used for the analysis: logistic regression and ridge regression. For the analysis, the area under the ROC curve (AUC) was the primary accuracy metric. AUC was computed using cross validation. Accuracy was computed for models that substituted one gene at a time. In this example, BCL2A1 was substituted for IL8RB in all relevant terms of the algorithm. Summary statistics for the calculations are shown in Table 15. AUC's greater than the upper bound of the confidence interval for the AUC of Diamond Forrester (DF) were considered significantly better than the DF model. See Table 16 for DF AUC. The algorithm with the substitute marker remained significantly better than the DF model indicating that the algorithm remains predictive of the likelihood of CAD even after replacement of the algorithm marker with the highly correlated substitute marker.
- For each algorithm marker, a highly correlated, non-algorithm substitute marker was identified from the Phase III PCR data set described above. For each marker, a Pearson correlation value between that marker and all other markers was computed and then we picked the substitute marker with maximal correlation to the algorithm marker of interest. This substitute was the marker with the highest correlation to the algorithm marker, subject to the restriction that a substitute marker was not used more than once in the terms of the algorithm. The correlation value for this particular replacement is shown in Table 15. Two statistical methods were used for the analysis: logistic regression and ridge regression. For the analysis, the area under the ROC curve (AUC) was the primary accuracy metric. AUC was computed using cross validation. Accuracy was computed for models that substituted one gene at a time. In this example, PTAFR was substituted for TNFRSF10C in all relevant terms of the algorithm. Summary statistics for the calculations are shown in Table 15. AUC's greater than the upper bound of the confidence interval for the AUC of Diamond Forrester (DF) were considered significantly better than the DF model. See Table 16 for DF AUC. The algorithm with the substitute marker remained significantly better than the DF model indicating that the algorithm remains predictive of the likelihood of CAD even after replacement of the algorithm marker with the highly correlated substitute marker.
- For each algorithm marker, a highly correlated, non-algorithm substitute marker was identified from the Phase III PCR data set described above. For each marker, a Pearson correlation value between that marker and all other markers was computed and then we picked the substitute marker with maximal correlation to the algorithm marker of interest. This substitute was the marker with the highest correlation to the algorithm marker, subject to the restriction that a substitute marker was not used more than once in the terms of the algorithm. The correlation value for this particular replacement is shown in Table 15. Two statistical methods were used for the analysis: logistic regression and ridge regression. For the analysis, the area under the ROC curve (AUC) was the primary accuracy metric. AUC was computed using cross validation. Accuracy was computed for models that substituted one gene at a time. In this example, LAMP2 was substituted for KCNE3 in all relevant terms of the algorithm. Summary statistics for the calculations are shown in Table 15. AUC's greater than the upper bound of the confidence interval for the AUC of Diamond Forrester (DF) were considered significantly better than the DF model. See Table 16 for DF AUC. The algorithm with the substitute marker remained significantly better than the DF model indicating that the algorithm remains predictive of the likelihood of CAD even after replacement of the algorithm marker with the highly correlated substitute marker.
- For each algorithm marker, a highly correlated, non-algorithm substitute marker was identified from the Phase III PCR data set described above. For each marker, a Pearson correlation value between that marker and all other markers was computed and then we picked the substitute marker with maximal correlation to the algorithm marker of interest. This substitute was the marker with the highest correlation to the algorithm marker, subject to the restriction that a substitute marker was not used more than once in the terms of the algorithm. The correlation value for this particular replacement is shown in Table 15. Two statistical methods were used for the analysis: logistic regression and ridge regression. For the analysis, the area under the ROC curve (AUC) was the primary accuracy metric. AUC was computed using cross validation. Accuracy was computed for models that substituted one gene at a time. In this example, TYROBP was substituted for TLR4 in all relevant terms of the algorithm. Summary statistics for the calculations are shown in Table 15. AUC's greater than the upper bound of the confidence interval for the AUC of Diamond Forrester (DF) were considered significantly better than the DF model. See Table 16 for DF AUC. The algorithm with the substitute marker remained significantly better than the DF model indicating that the algorithm remains predictive of the likelihood of CAD even after replacement of the algorithm marker with the highly correlated substitute marker.
- For each algorithm marker, a highly correlated, non-algorithm substitute marker was identified from the Phase III PCR data set described above. For each marker, a Pearson correlation value between that marker and all other markers was computed and then we picked the substitute marker with maximal correlation to the algorithm marker of interest. This substitute was the marker with the highest correlation to the algorithm marker, subject to the restriction that a substitute marker was not used more than once in the terms of the algorithm. See Table 15 for the highly correlated substitute markers. Two statistical methods were used for the analysis: logistic regression and ridge regression. For the analysis, the area under the ROC curve (AUC) was the primary accuracy metric. AUC was computed using cross validation. Accuracy was computed for models that randomly substituted five highly correlated markers at a time for five distinct algorithm markers. For the random marker substitutions, 100 iterations each were run and the mean and the standard deviation were calculated. Summary statistics for the calculations are shown in Table 16. AUC's greater than the upper bound of the confidence interval for the AUC of Diamond Forrester (DF) are considered significantly better than the DF model. The algorithm with the substitute markers remained significantly better than the DF model indicating that the algorithm remains predictive of the likelihood of CAD even after replacement of five algorithm markers with five highly correlated substitute markers.
- For each algorithm marker, a highly correlated, non-algorithm substitute marker was identified from the Phase III PCR data set described above. For each marker, a Pearson correlation value between that marker and all other markers was computed and then we picked the substitute marker with maximal correlation to the algorithm marker of interest. This substitute was the marker with the highest correlation to the algorithm marker, subject to the restriction that a substitute marker was not used more than once in the terms of the algorithm. See Table 15 for the highly correlated substitute markers. Two statistical methods were used for the analysis: logistic regression and ridge regression. For the analysis, the area under the ROC curve (AUC) was the primary accuracy metric. AUC was computed using cross validation. Accuracy was computed for models that randomly substituted ten highly correlated markers at a time for ten distinct algorithm markers. For the random marker substitutions, 100 iterations each were run and the mean and the standard deviation were calculated. Summary statistics for the calculations are shown in Table 16. AUC's greater than the upper bound of the confidence interval for the AUC of Diamond Forrester (DF) are considered significantly better than the DF model. The algorithm with the substitute markers remained significantly better than the DF model indicating that the algorithm remains predictive of the likelihood of CAD even after replacement of ten algorithm markers with ten highly correlated substitute markers.
- For each algorithm marker, a highly correlated, non-algorithm substitute marker was identified from the Phase III PCR data set described above. For each marker, a Pearson correlation value between that marker and all other markers was computed and then we picked the substitute marker with maximal correlation to the algorithm marker of interest. This substitute was the marker with the highest correlation to the algorithm marker, subject to the restriction that a substitute marker was not used more than once in the terms of the algorithm. See Table 15 for the highly correlated substitute markers. Two statistical methods were used for the analysis: logistic regression and ridge regression. For the analysis, the area under the ROC curve (AUC) was the primary accuracy metric. AUC was computed using cross validation. Accuracy was computed for models that randomly substituted fifteen highly correlated markers at a time for fifteen distinct algorithm markers. For the random marker substitutions, 100 iterations each were run and the mean and the standard deviation were calculated. Summary statistics for the calculations are shown in Table 16. AUC's greater than the upper bound of the confidence interval for the AUC of Diamond Forrester (DF) are considered significantly better than the DF model. The algorithm with the substitute markers remained significantly better than the DF model indicating that the algorithm remains predictive of the likelihood of CAD even after replacement of fifteen algorithm markers with fifteen highly correlated substitute markers.
- For each algorithm marker, a highly correlated, non-algorithm substitute marker was identified from the Phase III PCR data set described above. For each marker, a Pearson correlation value between that marker and all other markers was computed and then we picked the substitute marker with maximal correlation to the algorithm marker of interest. This substitute was the marker with the highest correlation to the algorithm marker, subject to the restriction that a substitute marker was not used more than once in the terms of the algorithm. See Table 15 for the highly correlated substitute markers. Two statistical methods were used for the analysis: logistic regression and ridge regression. For the analysis, the area under the ROC curve (AUC) was the primary accuracy metric. AUC was computed using cross validation. Accuracy was computed for models that randomly substituted twenty highly correlated markers at a time for twenty distinct algorithm markers. For the random marker substitutions, 100 iterations each were run and the mean and the standard deviation were calculated. Summary statistics for the calculations are shown in Table 16. AUC's greater than the upper bound of the confidence interval for the AUC of Diamond Forrester (DF) are considered significantly better than the DF model. The algorithm with the substitute markers remained significantly better than the DF model indicating that the algorithm remains predictive of the likelihood of CAD even after replacement of twenty algorithm markers with twenty highly correlated substitute markers.
- For each algorithm marker, a highly correlated, non-algorithm substitute marker was identified from the Phase III PCR data set described above. For each marker, a Pearson correlation value between that marker and all other markers was computed and then we picked the substitute marker with maximal correlation to the algorithm marker of interest. This substitute was the marker with the highest correlation to the algorithm marker, subject to the restriction that a substitute marker was not used more than once in the terms of the algorithm. See Table 15 for the highly correlated substitute markers. Two statistical methods were used for the analysis: logistic regression and ridge regression. For the analysis, the area under the ROC curve (AUC) was the primary accuracy metric. AUC was computed using cross validation. Accuracy was computed for models that randomly substituted highly correlated markers at a time for all algorithm markers. For the random marker substitutions, 100 iterations each were run and the mean was calculated. Summary statistics for the calculations are shown in Table 16. AUC's greater than the upper bound of the confidence interval for the AUC of Diamond Forrester (DF) are considered significantly better than the DF model. The algorithm with the substitute markers remained significantly better than the DF model indicating that the algorithm remains predictive of the likelihood of CAD even after replacement of all algorithm markers with highly correlated substitute markers.
-
Term 1 algorithm and highly correlated substitute markers were sequentially removed from the algorithm to determine whether the algorithm would remain predictive of the likelihood of CAD in their absence. All other terms and their associated markers were removed from the algorithm, thus in this analysis each term was considered on its own. Each term on the model is a delta term, with n_i markers on the left side of the delta term and m_i markers on the right side of the delta term. We examined two marker 'reduced terms' where only one of the n_i left-hand side markers and one of the possible m_i right-hand side markers was used in the term. There were thus n_i*m_i possible two marker reduced terms. We also examined 'reduced terms' produced by the sequential removal of markers from the full term for both the algorithm markers as well as the substitute markers. - For each of the reduced terms, models were fit including gender, age, and the reduced term, and cross-validated AUC's were estimated. These cross validated AUC's were compared to the AUC's from a model that included gender, age, and the full term. For each reduced term, we tested whether there was still a statistically significant predictive effect of the term, i.e., whether the decrease in AUC was sufficient to render the marker reduced set not beneficial in prediction of CAD. The same process was repeated for all reduced marker sets where correlated replacement markers were used in place of original algorithm markers.
- We found that all reduced terms produced in this analysis remained predictive of CAD. See Table 17.
-
Term 2 algorithm and highly correlated substitute markers were sequentially removed from the algorithm to determine whether the algorithm would remain predictive of the likelihood of CAD in their absence. All other terms and their associated markers were removed from the algorithm, thus in this analysis each term was considered on its own. Each term on the model is a delta term, with n_i markers on the left side of the delta term and m_i markers on the right side of the delta term. We examined two marker 'reduced terms' where only one of the n_i left-hand side markers and one of the possible m_i right-hand side markers was used in the term. There were thus n_i*m_i possible two marker reduced terms. We also examined 'reduced terms' produced by the sequential removal of markers from the full term for both the algorithm markers as well as the substitute markers. - For each of the reduced terms, models were fit including gender, age, and the reduced term, and cross-validated AUC's were estimated. These cross validated AUC's were compared to the AUC's from a model that included gender, age, and the full term. For each reduced term, we tested whether there was still a statistically significant predictive effect of the term, i.e., whether the decrease in AUC was sufficient to render the marker reduced set not beneficial in prediction of CAD. The same process was repeated for all reduced marker sets where correlated replacement markers were used in place of original algorithm markers.
- We found that all reduced terms produced in this analysis remained predictive of CAD. See Table 18.
-
Term 3 algorithm and highly correlated substitute markers were sequentially removed from the algorithm to determine whether the algorithm would remain predictive of the likelihood of CAD in their absence. All other terms and their associated markers were removed from the algorithm, thus in this analysis each term was considered on its own. Each term on the model is a delta term, with n_i markers on the left side of the delta term and m_i markers on the right side of the delta term. We examined two marker 'reduced terms' where only one of the n_i left-hand side markers and one of the possible m_i right-hand side markers was used in the term. There were thus n_i*m_i possible two marker reduced terms. We also examined 'reduced terms' produced by the sequential removal of markers from the full term for both the algorithm markers as well as the substitute markers. - For each of the reduced terms, models were fit including gender, age, and the reduced term, and cross-validated AUC's were estimated. These cross validated AUC's were compared to the AUC's from a model that included gender, age, and the full term. For each reduced term, we tested whether there was still a statistically significant predictive effect of the term, i.e., whether the decrease in AUC was sufficient to render the marker reduced set not beneficial in prediction of CAD. The same process was repeated for all reduced marker sets where correlated replacement markers were used in place of original algorithm markers. In addition, for the two marker reduced sets, the same process was repeated again where one correlated replacement marker was used along with one original algorithm marker.
- We found that all reduced terms produced in this analysis remained predictive of CAD, except for: LCK/CCT2/CD19/BLK; LCK/CD19/BLK; CCT2/CD19/BLK; LCK/CCT2/CD 19; LCK/CD 19; CCT2/CD 19; CD3D/CD 19; LCK/CD 19; and CCT2/CD 19. See Table 19. TMC8/CD19 was predictive of CAD when AUC using Ridge regression was calculated, but not when AUC using Logistic Regression was calculated. See Table 19.
-
Term 4 algorithm and highly correlated substitute markers were sequentially removed from the algorithm to determine whether the algorithm would remain predictive of the likelihood of CAD in their absence. All other terms and their associated markers were removed from the algorithm, thus in this analysis each term was considered on its own. Each term on the model is a delta term, with n_i markers on the left side of the delta term and m_i markers on the right side of the delta term. We examined two marker 'reduced terms' where only one of the n_i left-hand side markers and one of the possible m_i right-hand side markers was used in the term. There were thus n_i*m_i possible two marker reduced terms. We also examined 'reduced terms' produced by the sequential removal of markers from the full term for both the algorithm markers as well as the substitute markers. - For each of the reduced terms, models were fit including gender, age, and the reduced term, and cross-validated AUC's were estimated. These cross validated AUC's were compared to the AUC's from a model that included gender, age, and the full term. For each reduced term, we tested whether there was still a statistically significant predictive effect of the term, i.e., whether the decrease in AUC was sufficient to render the marker reduced set not beneficial in prediction of CAD. The same process was repeated for all reduced marker sets where correlated replacement markers were used in place of original algorithm markers.
- We found that all reduced terms produced in this analysis remained predictive of CAD. See Table 20.
-
Term 5 algorithm and highly correlated substitute markers were sequentially removed from the algorithm to determine whether the algorithm would remain predictive of the likelihood of CAD in their absence. All other terms and their associated markers were removed from the algorithm, thus in this analysis each term was considered on its own. Each term on the model is a delta term, with n_i markers on the left side of the delta term and m_i markers on the right side of the delta term. We examined two marker 'reduced terms' where only one of the n_i left-hand side markers and one of the possible m_i right-hand side markers was used in the term. There were thus n_i*m_i possible two marker reduced terms. We also examined 'reduced terms' produced by the sequential removal of markers from the full term for both the algorithm markers as well as the substitute markers. - For each of the reduced terms, models were fit including gender, age, and the reduced term, and cross-validated AUC's were estimated. These cross validated AUC's were compared to the AUC's from a model that included gender, age, and the full term. For each reduced term, we tested whether there was still a statistically significant predictive effect of the term, i.e., whether the decrease in AUC was sufficient to render the marker reduced set not beneficial in prediction of CAD. The same process was repeated for all reduced marker sets where correlated replacement markers were used in place of original algorithm markers. In addition, for the two marker reduced sets, the same process was repeated again where one correlated replacement marker was used along with one original algorithm marker.
- We found that all reduced terms produced in this analysis remained predictive of CAD, except for: MMP9/ALOX5AP/GLT1D1/NCF2; MMP9/ALOX5AP/NAMPT/NCF2; MMP9/GLT1D1/NCF2; MMP9/ALOX5AP/NCF2; MMP9/NAMPT/NCF2; MMP9/GLT1D1; ALOX5AP/NCF2; MMP9/NCF2; ALOX5AP/AQP9; and ALOX5AP/NCF2. See Table 21. ALOX5AP/NCF4 was predictive of CAD when AUC using Ridge regression was calculated, but not when AUC using Logistic Regression was calculated. See Table 21.
-
Term 6 algorithm and highly correlated substitute markers were sequentially removed from the algorithm to determine whether the algorithm would remain predictive of the likelihood of CAD in their absence. All other terms and their associated markers were removed from the algorithm, thus in this analysis each term was considered on its own. Each term on the model is a delta term, with n_i markers on the left side of the delta term and m_i markers on the right side of the delta term. We examined two marker 'reduced terms' where only one of the n_i left-hand side markers and one of the possible m_i right-hand side markers was used in the term. There were thus n_i*m_i possible two marker reduced terms. We also examined 'reduced terms' produced by the sequential removal of markers from the full term for both the algorithm markers as well as the substitute markers. - For each of the reduced terms, models were fit including gender, age, and the reduced term, and cross-validated AUC's were estimated. These cross validated AUC's were compared to the AUC's from a model that included gender, age, and the full term. For each reduced term, we tested whether there was still a statistically significant predictive effect of the term, i.e., whether the decrease in AUC was sufficient to render the marker reduced set not beneficial in prediction of CAD. The same process was repeated for all reduced marker sets where correlated replacement markers were used in place of original algorithm markers. In addition, for the two marker reduced sets, the same process was repeated again where one correlated replacement marker was used along with one original algorithm marker.
- We found that all reduced terms produced in this analysis remained predictive of CAD, except for: H3F3B/TXN/BCL2A1/LAMP2/TYROBP; H3F3B/TXN/BCL2A1/LAMP2; H3F3B/TXN/BCL2A1/TYROBP; TXN/PLAURBCL2A1/TYROBP; H3F3B/TXN/PLAUR/BCL2A1; H3F3B/BCL2A1/TYROBP; TXN/BCL2A1/TYROBP; H3F3B/TXN/BCL2A1; H3F3B/TXN/TYROBP; TXN/PLAUR/BCL2A1; TXN/PLAUR/BCL2A1; H3F3B/BCL2A1; H3F3B/TYROBP; TXN/BCL2A1; TXN/TYROBP; TXN/IL8RB; and TXN/TNFRSF10C. See Table 22.
-
Term 7 algorithm and highly correlated substitute markers were sequentially removed from the algorithm to determine whether the algorithm would remain predictive of the likelihood of CAD in their absence. All other terms and their associated markers were removed from the algorithm, thus in this analysis each term was considered on its own. Each term on the model is a delta term, with n_i markers on the left side of the delta term and m_i markers on the right side of the delta term. We examined two marker 'reduced terms' where only one of the n_i left-hand side markers and one of the possible m_i right-hand side markers was used in the term. There were thus n_i*m_i possible two marker reduced terms. We also examined 'reduced terms' produced by the sequential removal of markers from the full term for both the algorithm markers as well as the substitute markers. - For each of the reduced terms, models were fit including gender, age, and the reduced term, and cross-validated AUC's were estimated. These cross validated AUC's were compared to the AUC's from a model that included gender, age, and the full term. For each reduced term, we tested whether there was still a statistically significant predictive effect of the term, i.e., whether the decrease in AUC was sufficient to render the marker reduced set not beneficial in prediction of CAD. The same process was repeated for all reduced marker sets where correlated replacement markers were used in place of original algorithm markers. In addition, for the two marker reduced sets, the same process was repeated again where one correlated replacement marker was used along with one original algorithm marker.
- We found that all reduced terms produced in this analysis remained predictive of CAD, except for: LCK/CCT2/CX3CR1/CD8A; LCK/CX3CR1/CD8A; CCT2/CX3CR1/CD8A; LCK/CCT2/CD8A; LCK/CD8A; CCT2/CD8A; TMC8/CD8A; and CD3D/CD8A. See Table 23.
- Herein we report initial prospective validation of a gene expression algorithm for the likelihood of obstructive CAD, defined as one or more coronary atherosclerotic lesions causing ≥50% luminal diameter stenosis, in non-diabetic patients with suspected CAD.
- Subjects were enrolled in PREDICT, a 39 center (US) prospective study, between July 2007 and April 2009. The study was approved at the institutional review board at all participating centers and all patients gave written informed consent. Subjects referred for diagnostic coronary angiography were eligible if they had a history of chest pain, suspected anginal-equivalent symptoms, or a high risk of CAD, and no known prior myocardial infarction (MI), revascularization, or obstructive CAD. Subjects were ineligible if at catheterization, they had acute MI, high risk unstable angina, severe non-coronary heart disease (congestive heart failure, cardiomyopathy or valve disease), systemic infectious or inflammatory conditions, or were taking immunosuppressive or chemotherapeutic agents.
- From 2418 enrolled subjects who met inclusion criteria, 606 diabetic patients were excluded, as this initial algorithm development and validation was focused on non-diabetics. Of the remaining 1812 patients, 237 had angiographic images unsuitable for QCA and 6 had unusable blood samples. For the remaining 1569 subjects, 226 were used in gene discovery (Elashoff MR, Wingrove JA, Beineke P, et al. Development of a Blood-based Gene Expression Algorithm for Assessment of Obstructive Coronary Artery Disease in Non-Diabetic Patients, submitted. Circulation: Cardiovascular Genetics. 2010); the remaining 1343 were divided into independent algorithm development and validation cohorts (
Figure 7 ) sequentially based on date of enrollment. - Pre-specified clinical data, including demographics, medications, clinical history and presentation, and MPI results were obtained by research study coordinators at study sites using standardized data collection methods and data were verified by independent study monitors.
- Coronary angiograms were analyzed by computer-assisted QCA. Specifically, clinically-indicated coronary angiograms performed according to site protocols were digitized, de-identified and analyzed with a validated quantitative protocol at Cardiovascular Research Foundation, New York, NY (Lansky AJ, Popma JJ. Qualitative and quantitative angiography Philadelphia, PA: Saunders; 1998 Text Book of Interventional Cardiology)). Trained technicians, blinded to clinical and gene expression data, visually identified all lesions >10% diameter stenosis (DS) in vessels with diameter >1.5mm. Using the CMS Medis system, (Medis, version 7.1, Leiden, the Netherlands), technicians traced the vessel lumen across the lesion between the nearest proximal and distal non-diseased locations. The minimal lumen diameter (MLD), reference lumen diameter (RLD = average diameter of normal segments proximal and distal of lesion) and %DS (%DS = (1 - MLD/RLD) x 100) were then calculated.
- The Diamond-Forrester (D-F) risk score, comprised of age, sex, and chest pain type, was prospectively chosen to evaluate the added value of the gene expression score to clinical factors (Diamond GA, Forrester JS. Analysis of probability as an aid in the clinical diagnosis of coronary-artery disease. N Engl J Med. 1979;300(24):1350-8). D-F classifications of chest pain type (typical angina, atypical angina and non-anginal chest pain) were assigned based on subject interviews (Diamond GA, Forrester JS. Analysis of probability as an aid in the clinical diagnosis of coronary-artery disease. N Engl J Med. 1979;300(24):1350-8), and D-F scores assigned (Chaitman BR, Bourassa MG, Davis K, et al. Angiographic prevalence of high-risk coronary artery disease in patient subsets (CASS). Circulation. 1981;64(2):360-7). Subjects without chest pain symptoms were classified as non-anginal chest pain. MPIs were performed as clinically indicated, according to local protocols, and interpreted by local readers with access to clinical data but not gene expression or catheterization data. MPIs were defined as positive if ≥1 reversible or fixed defect consistent with obstructive CAD was reported. Indeterminate or intermediate defects were considered negative.
- Patients with obstructive CAD (N=192) were defined prospectively as subjects with ≥1 atherosclerotic plaque in a major coronary artery (≥1.5mm lumen diameter) causing ≥50% luminal diameter stenosis by QCA; non-obstructive CAD (N=334) had no lesions >50%.
- Prior to coronary angiography, venous blood samples were collected in PAXgene® RNA-preservation tubes. Samples were treated according to manufacturer's instructions, then frozen at -20°C.
- Automated RNA purification from whole blood samples using the Agencourt RNAdvance system, cDNA synthesis, and RT-PCR were performed as described (Elashoff MR, Wingrove JA, Beineke P, et al. Development of a Blood-based Gene Expression Algorithm for Assessment of Obstructive Coronary Artery Disease in Non-Diabetic Patients, submitted. Circulation: Cardiovascular Genetics. 2010.). All PCR reactions were run in triplicate and median values used for analysis. Genomic DNA contamination was detected by comparison of expression values for splice-junction spanning and intronic ADORA3 assays normalized to expression values of TFCP2 and HNRPF. The RPS4Y1 assay was run as confirmation of sex for all patients; patients were excluded if there was an apparent mismatch with clinical data. Sample QC metrics and pass-fail criteria were pre-defined and applied prior to evaluation of results as described (Elashoff MR, Wingrove JA, Beineke P, et al. Development of a Blood-based Gene Expression Algorithm for Assessment of Obstructive Coronary Artery Disease in Non-Diabetic Patients, submitted. Circulation: Cardiovascular Genetics. 2010.).
- Analyses for Table 24 used SAS Version 9.1 (SAS Institute Inc, Cary, NC, USA). All other analysis was performed using R Version 2.7 (R Foundation for Statistical Computing, Vienna, Austria). Unless otherwise specified, univariate comparisons for continuous variables were done by t-test and categorical variables by Chi-square test. All reported p-values are two-sided.
- The algorithm was locked prior to the validation study. Raw algorithm scores were computed from median expression values for the 23 algorithm genes, age and sex as described and used in all statistical analyses; scores were linearly transformed to a 0-40 scale for ease of reporting.
- ROC curves were estimated for the a) gene expression algorithm score, b) the D-F risk score, c) a combined model of algorithm score and D-F risk score, d) MPI, and e) a combined model of algorithm score and MPI. Standard methods (Newson R. Confidence intervals for rank statistics: Somers' D and extensions. Stata Journal. 2006;6:309-334.) were used to estimate the empirical ROC curves and associated AUCs and AUC standard errors. The Z-test was used to test AUCs versus random (AUC = .50).
- Paired AUC comparisons: i) gene expression algorithm score plus D-F risk score vs D-F risk score, and ii) gene expression algorithm score plus MPI vs MPI; were performed by bootstrap. For each comparison, 10,000 bootstrap iterations were run, and the observed AUC difference computed. The median bootstrapped AUC difference was used to estimate the AUC difference, and the p-value estimated using the empirical distribution of bootstrapped AUC differences (i.e. the observed quantile for 0 AUC difference in the empirical distribution).
- A series of logistic regression models were fit with disease status as the binary dependent variable, and compared using a likelihood ratio test between nested models. Comparisons were: i) gene expression algorithm score plus D-F risk score versus D-F risk score alone; ii) gene expression algorithm score plus MPI versus MPI alone; iii) gene expression algorithm score versus the demographic component of the gene expression algorithm score.
- The correlation between algorithm score and percent maximum stenosis as continuous variables was assessed by linear regression. Stenosis values were grouped into five increasing categories (no measurable disease, 1-24%, 25-49% in ≥1 vessel, 1 vessel ≥50%, and >1 vessel ≥50%) and ANOVA was used to test for a linear trend in algorithm score across categories.
- Gene expression algorithm score and D-F risk scores were defined as low (0% to <20%), intermediate (≥20%,<50%), and high risk (≥50%) obstructive CAD likelihoods. MPI results were classified as negative (no defect/possible fixed or reversible defect) or positive (fixed or reversible defect). For the D-F risk score analysis, a reclassified subject was defined as i) D-F intermediate risk to low or high algorithm score, ii) D-F high risk to algorithm low risk, or iii) D-F low risk to algorithm high. For the MPI analysis, a reclassified subject included i) MPI positive to low risk based on algorithm score, or ii) MPI negative to high risk based on algorithm score. Net reclassification improvement (NRI) of the gene expression algorithm score (and associated p-value) compared to either the D-F risk score or MPI was computed as described in (Pencina MJ, D'Agostino RB, Sr., D'Agostino RB, Jr., Vasan RS. Evaluating the added predictive ability of a new marker: from area under the ROC curve to reclassification and beyond. Stat Med. 2008;27(2):157-72; discussion 207-12.). NRI is a measure of reclassification clinical benefit, and is sensitive to both the fraction and accuracy of reclassification.
- NRI considers as positive reclassifications those patients whose classification moves in the 'correct' direction (disease subjects moving to a higher risk classification and non-disease subjects moving to a lower risk classification). Similarly, NRI considers as negative reclassifications those patients whose classification moves in the incorrect direction (disease subjects moving to a lower risk classification and non-disease subjects moving to a higher risk classification). The NRI formula is then the difference between the fraction of positive reclassifications and the fraction of negative reclassifications.

- pup, events = # events moving up/# events
- pdown,events = # events moving down# events
- pup,nonevents = # nonevents moving up/# nonevents
- pdown,nonevents = #nonevents moving down/# nonevents
- for significance testing,
- ve=(pup, events+ pdown,events)/#events
- vne=(pup,nonevents+pdown,nonevents)/#nonevents
-
D-F risk score model Model Term Odds Ratio 95% CI p-value Model AIC D-F risk score 1.018 1.012 to 1.023 <.001 652.53 Gene expression algorithm score + D-F risk score Model Term Odds Ratio 95% CI p-value Model AIC D-F risk score 1.012 1.007 to 1.018 <.001 Gene expression algorithm score 1.64 1.37 to 1.96 <.001 622.3 MPI model Model Term Odds Ratio 95% CI p-value Model AIC MPI 1.52 0.88 to 2.67 .14 388.53 Gene expression algorithm score + MPI Model Term Odds Ratio 95% CI p-value Model AIC MPI 1.04 0.57 to 1.90 .90 Gene expression algorithm score 1.85 1.45 to 2.37 <.001 362.15 - Vickers {Vickers et al., 2008} defines the net benefit curve for a diagnostic as a function of pt, a threshold probability that represents the tradeoff between false positives and false negatives. The curve quantifies the net benefit to following the decision rule of score>pt = positive, over a range of possible value for pt. The reference lines reflect the net benefit of a) all subjects positive (lower curve in
Figure 8 ) or b) all subjects negative (line at net benefit = 0). The net benefit curve for the gene expression algorithm is the upper curve inFigure 8 , and is greater than either reference line over clinically relevant range for pt. - To further assess the added value of the gene expression algorithm a 'full' clinical factor model was developed that incorporated the 11 clinical factors that showed univariate significance (p<.05) between obstructive disease and no obstructive disease patients in the development set. The 11 factors were:
- sex
- age
- chest pain type
- race
- statin use
- aspirin use
- anti-platelet use
- ACE inhibitor use
- systolic blood pressure
- hypertension
- dyslipidemia
- A logistic regression model was then fit using disease status as the dependent variable and these 11 factors as predictor variables. A subject's 'full clinical model score' was the subject's predicted value from this model.
- Results are reported for the validation set. The AUC of the full clinical model was .732, and the AUC for the gene expression algorithm plus the full clinical model was .745 (p=.09). The nested logistic regression comparison of the gene expression algorithm plus the full clinical model versus the full clinical model alone gave a p-value of .014.
- The NRI of the gene expression algorithm plus the full clinical model versus the full clinical model alone was 10% (p=.02).
- The full clinical model evaluated here further supports the concept that the algorithm score adds to known or apparent clinical factors in the PREDICT population. This model suffers from the lack of independent validation, as has been done for the Diamond-Forrester formulation, hence it's role as primary comparator.
- Samples were classified as gene expression outliers based on the following criterion: ∑|gi-mi|>27, where gi is the expression value for the i'th gene, and mi is the median expression value for the i'th gene across the development set.
- A total of 1343 non-diabetic patients from the PREDICT trial, enrolled between July 2007 and April 2009, were sequentially allocated to independent development (N= 694) and validation (N= 649) sets. The limitation to non-diabetic patients was based on the significant differences observed in CAD classifier gene sets dependent on diabetic status (Elashoff MR, Wingrove JA, Beineke P, et al. Development of a Blood-based Gene Expression Algorithm for Assessment of Obstructive Coronary Artery Disease in Non-Diabetic Patients, submitted. Circulation: Cardiovascular Genetics. 2010.). The patient flow, set assignment, and exclusions are shown in
Figure 7 . The demographic and clinical characteristics of these sets by disease status, after exclusions, are summarized in Table 24. The clinical characteristics of the development and validation sets were similar. Overall, subjects were 57% male, 37% had obstructive CAD and 26% had no detectable CAD. Significant clinical or demographic variables that were associated with obstructive CAD in both cohorts were increased age, male sex, chest pain type, elevated systolic blood pressure (all p< 0.001), hypertension (p=0.001), and white ethnicity (p=0.015). - The gene expression algorithm was developed as described above, with obstructive CAD defined by QCA as ≥50% stenosis in ≥1 major coronary artery. This corresponds approximately to 65-70% stenosis based on clinical angiographic read. The 23 algorithm genes, grouped in the 6 terms, 4 sex-independent and 2 sex-specific, are shown schematically in the figures. The subsequent analyses are for the independent validation set only.
- The prospectively defined primary endpoint was the area under the ROC curve for algorithm score prediction of disease status. The AUC was 0.70 ±0.02, (p<0.001) with independently significant performance in male (0.66) and female subsets (0.65) (p <0.001 for each). As a clinical comparator, we used the Diamond-Forrester (D-F) risk score, which was developed to quantify likelihood of current CAD and validated in a large cohort (Diamond GA, Forrester JS. Analysis of probability as an aid in the clinical diagnosis of coronary-artery disease. N Engl J Med. 1979;300(24):1350-8.; Chaitman BR, Bourassa MG, Davis K, et al. Angiographic prevalence of high-risk coronary artery disease in patient subsets (CASS). Circulation. 1981;64(2):360-7.). ROC analysis showed a higher AUC for the combination of algorithm score and D-F risk score, compared to D-F risk score alone (AUC 0.72 versus 0.66, p=0.003,
Figure 9 ). - The most prevalent form of non-invasive imaging in PREDICT was MPI. In the validation set 310 patients had clinically-indicated MPIs performed, of which 72% were positive. Comparative ROC analysis showed an increased AUC for the combined algorithm score and MPI versus MPI alone (AUC 0.70 versus 0.54, p <0.001).
- Sensitivity and specificity were determined at an algorithm score threshold of 14.75, corresponding to a disease likelihood of 20%, with 33% of patients having scores below this value. At this threshold, the sensitivity was 85% with a specificity of 43%, corresponding to negative and positive predictive values of 83% and 46%, respectively.
- A series of nested logistic regression models (see methods) were used to assess the independent contribution of the algorithm score and other predictors. Algorithm score added to the D-F risk score (p<0.001), and to MPI (p<0.001), and the algorithm gene expression terms added (p=0.003) to the algorithm demographic terms (see methods).
- The algorithm score was correlated with maximum percent stenosis (R=0.34, p<0.001), and the average algorithm score increased monotonically with increasing percent maximum stenosis (p< 0.001,
Figure 10 ). The average scores for patients with and without obstructive CAD were 25 and 17, respectively. - Reclassification may be a more clinically relevant measure of a predictor's comparative performance than standard measures such as AUC (Cook NR, Ridker PM. Advances in measuring the effect of individual predictors of cardiovascular risk: the role of reclassification measures. Ann Intern Med. 2009;150(11):795-802.). Tables 25A and 25B show reclassification results for the gene expression algorithm compared to D-F risk score and MPI. In this study the net reclassification improvement for the gene expression algorithm score compared to the D-F risk score was 20% (p<0.001), and to MPI was 21% (p<0.001).
- In subjects with intermediate D-F risk scores, 78% (75/96) of patients were reclassified by the gene expression algorithm. Specifically, for the intermediate D-F group, 22% (21/96) were correctly and 8% (7/96) incorrectly reclassified as low risk; 27% (26/96) were correctly and 22% (21/96) incorrectly reclassified as high risk. An additional 38 D-F low risk subjects (15%) were reclassified as high risk (22 correctly, 16 incorrectly), and 28 D-F high risk subjects (16%) reclassified as low risk (22 correctly, 6 incorrectly). Overall, when reclassification errors occurred, they were to a higher risk category, consistent with the gene expression algorithm having a higher NPV than PPV.
- This study prospectively validates in non-diabetic patients a non-invasive test for obstructive CAD defined by QCA that is based on gene expression in circulating whole blood cells, age and gender. This study extends our previous work on correlation of gene expression changes in blood with CAD (Wingrove JA, Daniels SE, Sehnert AJ, et al. Correlation of Peripheral-Blood Gene Expression With the Extent of Coronary Artery Stenosis. Circulation: Cardiovascular Genetics. 2008;1(1):31-38.) to prospective validation of a classifier for non-diabetic patients with obstructive CAD by ROC analysis (Elashoff MR, Wingrove JA, Beineke P, et al. Development of a Blood-based Gene Expression Algorithm for Assessment of Obstructive Coronary Artery Disease in Non-Diabetic Patients, submitted. Circulation: Cardiovascular Genetics. 2010.). The test yields a numeric score (0-40) with higher scores corresponding to higher likelihood of obstructive CAD and higher maximum percent stenosis.
- It has been suggested that reclassification of patient clinical risk or status, as captured by the NRI, may be a more appropriate measure than comparative ROC analysis for evaluating potential biomarkers (Pencina MJ, D'Agostino RB, Sr., D'Agostino RB, Jr., Vasan RS. Evaluating the added predictive ability of a new marker: from area under the ROC curve to reclassification and beyond. Stat Med. 2008;27(2):157-72; discussion 207-12.; Cook NR, Ridker PM. Advances in measuring the effect of individual predictors of cardiovascular risk: the role of reclassification measures. Ann Intern Med. 2009;150(11):795-802.). The gene expression algorithm score improves the accuracy of clinical CAD assessment as shown by an NRI of 20% relative to the D-F score. For the most prevalent non-invasive test, MPI, the NRI was 21 %, although these results are likely confounded by the referral bias inherent in this angiographically referred population. Overall, independent of MPI result or D-F risk category, increasing gene expression score leads to monotonically increased risk of obstructive CAD (Table 25A,B).
- This gene-expression test could have clinical advantages over current non-invasive CAD diagnostic modalities since it requires only a standard venous blood draw, and no need for radiation, intravenous contrast, or physiologic and pharmacologic stressors. One potential clinical benefit of improving non-invasive assessment of CAD is to reduce invasive diagnostic coronary angiograms in patients without obstructive CAD. In the validation cohort, for example, only 37% of patients undergoing invasive angiography had obstructive CAD and the rate was particularly low in women (26%). A similar overall rate of obstructive CAD on angiography for patients without prior known CAD in a very large registry was recently reported, with little sensitivity to the exact definition of obstructive CAD (Patel MR, Peterson ED, Dai D, et al. Low diagnostic yield of elective coronary angiography. N Engl J Med. 2010;362(10):886-95.). The gene-expression test described here identified a low-likelihood (<20%) of obstructive CAD in 33% of patients referred for invasive angiography, although the majority of these patients were also at low risk by clinical factor analysis (Table 25A).
- We describe the prospective multi-center validation of a peripheral blood-based gene expression test to determine the likelihood of obstructive CAD in non-diabetic patients as defined by invasive angiography. This test provides additional information to clinical factors and non-invasive imaging as measured by patient CAD status classification. Clinical use of this test may reduce further testing of patients with suspected CAD.
-
- 1. Diamond GA, Forrester JS. Analysis of probability as an aid in the clinical diagnosis of coronary-artery disease. N Engl J Med. 1979;300(24):1350-1358.
- 2. Chaitman BR, Bourassa MG, Davis K, Rogers WJ, Tyras DH, Berger R, Kennedy JW, Fisher L, Judkins MP, Mock MB, Killip T. Angiographic prevalence of high-risk coronary artery disease in patient subsets (CASS). Circulation. 1981;64(2):360-367.
- 3. Ridker PM, Buring JE, Rifai N, Cook NR. Development and validation of improved algorithms for the assessment of global cardiovascular risk in women: the Reynolds Risk Score. Jama. 2007;297(6):611-619.
- 4. Hansson GK, Libby P, Schonbeck U, Yan ZQ. Innate and adaptive immunity in the pathogenesis of atherosclerosis. Circ Res. 2002;91(4):281-291.
- 5. Libby P, Ridker PM, Maseri A. Inflammation and atherosclerosis. Circulation. 2002;105(9):1135-1143.
- 6. Sinnaeve PR, Donahue MP, Grass P, Seo D, Vonderscher J, Chibout SD, Kraus WE, Sketch M, Jr., Nelson C, Ginsburg GS, Goldschmidt-Clermont PJ, Granger CB. Gene expression patterns in peripheral blood correlate with the extent of coronary artery disease. PLoS One. 2009;4(9):e7037.
- 7. Wingrove JA, Daniels SE, Sehnert AJ, Tingley W, Elashoff MR, Rosenberg S, Buellesfeld L, Grube E, Newby LK, Ginsburg GS, Kraus WE. Correlation of Peripheral-Blood Gene Expression With the Extent of Coronary Artery Stenosis. Circulation: Cardiovascular Genetics. 2008;1(1):31-38.
- 8. Home BD, Anderson JL, John JM, Weaver A, Bair TL, Jensen KR, Renlund DG, Muhlestein JB. Which white blood cell subtypes predict increased cardiovascular risk? J Am Coll Cardiol. 2005;45(10):1638-1643.
- 9. Gibbons RJ, Abrams J, Chatterjee K, Daley J, Deedwania PC, Douglas JS, Ferguson TB, Jr., Fihn SD, Fraker TD, Jr., Gardin JM, O'Rourke RA, Pasternak RC, Williams SV. ACC/AHA 2002 guideline update for the management of patients with chronic stable angina--summary article: a report of the American College of Cardiology/American Heart Association Task Force on practice guidelines (Committee on the Management of Patients With Chronic Stable angina). J Am Coll Cardiol. 2003;41(1):159-168.
- 10. Patel MR, Peterson ED, Dai D, Brennan JM, Redberg RF, Anderson HV, Brindis RG, Douglas PS. Low diagnostic yield of elective coronary angiography. N Engl J Med 2010;362(10):886-895.
- 11. Wang L, Hauser ER, Shah SH, Pericak-Vance MA, Haynes C, Crosslin D, Harris M, Nelson S, Hale AB, Granger CB, Haines JL, Jones CJ, Crossman D, Seo D, Gregory SG, Kraus WE, Goldschmidt-Clermont PJ, Vance JM. Peakwide mapping on chromosome 3q13 identifies the kalirin gene as a novel candidate gene for coronary artery disease. Am J Hum Genet. 2007;80(4):650-663.
- 12. Rosenberg S, Elashoff MR, Beineke P, Daniels SE, Wingrove JA, Tingley WG, Sager PT, Sehnert AJ, Yau Y, Kraus W, Newby L, Schwartz R, Voros S, Ellis S, Tahirkheli N, Waksman R, McPherson J, Lansky A, Schork N, Winn M, Topol E. Multi-Center Validation of the Diagnostic Accuracy of a Blood-based Gene Expression Test for Assessment of Obstructive Coronary Artery Disease in Non-Diabetic Patients. Submitted; 2010.
- 13. Zheng Q, Wang XJ. GOEAST: a web-based software toolkit for Gene Ontology enrichment analysis. Nucleic Acids Res. 2008;36(web Server issue):W358-363.
- 14. Brunet JP, Tamayo P, Golub TR, Mesirov JP. Metagenes and molecular pattern discovery using matrix factorization. Proc Natl Acad Sci U S A. 2004; 101(12):4164-4169.
- 15. Tibshirani R. Regression shrinkage and selection via the lasso. J. Royal Statistical Society B. 1996;58:267-288.
- 16. Brown PJ. Measurement, Regression, and Calibration. Oxford, UK: Oxford University Press; 1994.
- 17. Hamblin M, Chang L, Fan Y, Zhang J, Chen YE. PPARs and the cardiovascular system. Antioxid Redox Signal. 2009; 11(6):1415-1452.
- 18. Ellegren H, Parsch J. The evolution of sex-biased genes and sex-biased gene expression. Nat Rev Genet. 2007;8(9):689-698.
- 19. Hong MG, Myers AJ, Magnusson PK, Prince JA. Transcriptome-wide assessment of human brain and lymphocyte senescence. PLoS One. 2008;3(8):e3024.
- 20. Rana JS, Boekholdt SM, Ridker PM, Jukema JW, Luben R, Bingham SA, Day NE, Wareham NJ, Kastelein JJ, Khaw KT. Differential leucocyte count and the risk of future coronary artery disease in healthy men and women: the EPIC-Norfolk Prospective Population Study. J Intern Med. 2007;262(6):678-689.
- 21. Su AI, Wiltshire T, Batalov S, Lapp H, Ching KA, Block D, Zhang J, Soden R, Hayakawa M, Kreiman G, Cooke MP, Walker JR, Hogenesch JB. A gene atlas of the mouse and human protein-encoding transcriptomes. Proc Natl Acad Sci U S A. 2004;101(16):6062-6067.
- 22. Hasegawa H, Yamada Y, Harasawa H, Tsuji T, Murata K, Sugahara K, Tsuruda K, Masuda M, Takasu N, Kamihira S. Restricted expression of tumor necrosis factor-related apoptosis-inducing .
- 23. Lim SY, Raftery MJ, Goyette J, Hsu K, Geczy CL. Oxidative modifications of S100 proteins: functional regulation by redox. J Leukoc Biol. 2009.
- 24. Yamasaki S, Ishikawa E, Sakuma M, Hara H, Ogata K, Saito T. Mincle is an ITAM-coupled activating receptor that senses damaged cells. Nat Immunol. 2008;9(10): 1179-1188.
- 25. Teixeira VH, Olaso R, Martin-Magniette ML, Lasbleiz S, Jacq L, Oliveira CR, Hilliquin P, Gut I, Cornelis F, Petit-Teixeira E. Transcriptome analysis describing new immunity and defense genes in peripheral blood mononuclear cells of rheumatoid arthritis patients. PLoS One. 2009;4(8):e6803.
- 26. Chung CP, Oeser A, Raggi P, Gebretsadik T, Shintani AK, Sokka T, Pincus T, Avalos I, Stein CM. Increased coronary-artery atherosclerosis in rheumatoid arthritis: relationship to disease duration and cardiovascular risk factors. Arthritis Rheum. 2005;52(10):3045-3053.
- 27. Cruz-Munoz ME, Dong Z, Shi X, Zhang S, Veillette A. Influence of CRACC, a SLAM family receptor coupled to the adaptor EAT-2, on natural killer cell function. Nat Immunol. 2009;10(3):297-305.
- 28. Kim DK, Kabat J, Borrego F, Sanni TB, You CH, Coligan JE. Human NKG2F is expressed and can associate with DAP12. Mol Immunol. 2004;41(1):53-62.
- 29. Whitman SC, Rateri DL, Szilvassy SJ, Yokoyama W, Daugherty A. Depletion of natural killer cell function decreases atherosclerosis in low-density lipoprotein receptor null mice. Arterioscler Thromb Vase Biol. 2004;24(6):1049-1054.
- 30. Major AS, Fazio S, Linton MF. B-lymphocyte deficiency increases atherosclerosis in LDL receptor-null mice. Arterioscler Thromb Vasc Biol. 2002;22(11):1892-1898.
- 31. Robertson AK, Hansson GK. T cells in atherogenesis: for better or for worse? Arterioscler Thromb Vasc Biol. 2006;26(11):2421-2432.
- 32. Park MY, Hastie T, Tibshirani R. Averaged gene expressions for regression. Biostatistics. 2007;8(2):212-227.
-
Table 1a: Phase 1 and 11 Microarray Cohorts Phase I - CATHGEN Microarray Cohort Phase II - PREDICT Paired Microarray Cohort Variable Controls (N=108) Cases (N=87) p.value Controls (N=99) Cases (N=99) p.value Sex (%Male) 55 (50.9%) 58 (66.7%) 0.039 75 (75.8%) 75(75.8%) 0.868 Age (yrs) 55±11 63±10 <.001 55±12 62±11 <001 Caucasian 56 (51.9%) 60 (69%) 0.023 85 (85.9%) 92 (92.9%) 0.166 BMI 32±7 30±6 0.098 30±7 30±6 0.722 Current Smoker 41 (38%) 45 (51.7%) 0.075 14 (14.1%) 25 (25.3%) 0.074 Systolic BP 144±22 153±25 0.007 132±17 138±18 0.009 Diastolic BP 83±13 87±15 0.077 82±11 80±12 0.271 Hypertension 67 (62%) 65 (74.7%) 0.084 55 (55.6%) 65 (65.7%) 0.191 Dyslipidemia 55 (50.9%) 58 (66.7%) 0.039 50 (50.5%) 69 (69.7%) 0.009 Neutrophil Count 3.8±1.2 4±1.3 0.392 3.9±1.2 4.3±1.5 0.037 Lymphocyte Count 1.8±0.7 1.9±0.7 0.87 2±0.7 1.9±0.6 0.239 Table 1b: Phase III and IV Algorithm Development and Validation Cohorts Phase III - PREDICT Algorithm Development Cohort Phase IV - PREDICT Algorithm Validation Cohort Variable Controls (N=410) Cases (N=230) p.value Controls (N=334) Cases (N=192) p.value Sex (%Male) 193 (47.9%) 180 (78.3%) <.001 165 (49.4%) 134 (69.8%) <.001 Age (yrs) 57±12 64±11 <.001 57.7±11.7 64.7±9.8 <.001 Caucasian 347 (84.6%) 210 (91.3%) 0.022 293 (87.7%) 181 (94.3%) 0.015 BMI 31±8 30±6 0.348 31.3± 7.0 29.8 ± 5.5 0.010 Current Smoker 87 (21.2%) 45 (19.6%) 0.693 68 (20.4%) 38(19.8%) 0.703 Systolic BP 133±18 138±18 <.001 132(18.1) 140 (17.7) <.001 Diastolic BP 80±12 80±11 0.944 77.5 (10.9) 79.2 (11.3) 0.086 Hypertension 248 (60.5%) 167 (72.6%) 0.003 203 (60.8%) 142 (74.0%) 0.001 Dyslipidemia 225 (54.9%) 170 (73.9%) <.001 208 (62.3%) 133 (69.3%) 0.110 Neutrophil Count 4±1.2 4.3±1.4 0.054 4.0±1.2 4.1±1.3 0.171 Lymphocyte Count 2±0.6 1.9±0.6 0.007 1.9±0.6 1.9±0.6 0.411 Microarray cohorts omit subjects whose array data was excluded based on QC analysis (3 CATHGEN, 12 PREDICT) Table 2: Markers Evaluated by RT-PCR in the Algorithm Development Cohort Marker Symbol MicroArray Evidence1 Cell-Type2 Cluster Metagene Term Algorithm Term DDX18 3 1.1 SSRP1 3 1.2 CCT2 3 2 1.3 RPL28 N 2 1.4 Norm 2b XIST 2 1,4,5 1.5 RASSF7 3 1.6 PKD1 3 1.7 AGPAT5 3 2,7 1.8 GLS 3 1.9 TMC8 3 1.10 1 3b,4b RPS4Y1 2 3 1.11 KLF12 3 4 1.12 LCK 2,3 3,4,8 1.13 CD3D 2,3 3,4,8 1.14 3b,4b AES 3 1.15 ZAP70 3 3,4,8 1.16 CD81 3 7,8 1.17 QDPR 3 2,5 1.18 FXN 2 2 1.19 CORO2A 3 1.20 TCEA1 3 7 1.21 KMO 3 5,7 2.1 TLR7 3 5 2.2 RHOC 3 2.3 CX3CR1 3 6,8 2.4 IL11RA 1,2 3,4 3.1 IL7R 1,2,3 3,4,8 3.2 3 FAIM3 2,3 3,4,7 3.3 TCF7 2,3 3,4,8 3.4 3 CD79B 2,3 7 3.5 2 4a SPIB 2,3 2,5,7 3.6 2 4a CD19 3 5,7 3,7 BLK 3 5,7 3.8 PI16 2 3.9 LRRN3 3 3,4 3.10 4 HNRNPF N 4.1 Norm 5b,6b TFCP2 N 4.2 Norm 5b,6b ACBD5 3 4.3 DIAPH1 3 4.4 CD37 3 7 4.5 PLAGL2 3 1 4.6 SRA1 3 5.1 CD300A 2 8 5.2 ELMO2 3 5,8 5.3 CD33 2 1,6 6.1 CSPG2 1,2 6.2 CAT 2 2,5 6.3 NOD2 1,3 1,6 6.4 KCNMB1 2 6.5 5 TCF7L2 3 1,6,8 6.6 5 PDK4 3 6.7 5 TBC1D8 3 1,5,6 6.8 NR4A1 3 5 7.1 CDKN1C 3 6,8 7.2 C2 2 7.3 CLC 2 1,2 8.1 6 OLIG2 2 8.2 ADORA3 2 8.3 6 MMD 1,2,3 7 9.1 HIST1H2AE 1,3 4,7 9.2 7 AMFR 2 10.1 CD34 N 2 10.2 A_24_P128361 (AF289562) 3 11.1 8 5a CD248 2,3 4 11.2 KLRC4 2 4,8 12.1 9 3a TARP 2,3 4,8 12.2 CCR5 2 4,5 12.3 CD8A 1 3,4,8 12.4 SLAMF7 2 5,8 12.5 9 3a KLRC2 2 3,4,8 12.6 PRSS23 2 8 12.7 NCAM1 N 8 12.8 TNFRSF10C 3 13.1 11 1b IL8RB 1,3 1,6,8 13.2 11 1b TLR4 3 1,6 13.3 11 1b NAMPT 3 1,5,6 13.4 AQP9 3 1,6 13.5 10 2c S100A8 1,2,3 1,5,6 13.6 12 2a NCF4 2,3 1,6 13.7 10 2c GLT1D1 1,2,3 13.8 TXN 2,3 2,5 13.9 GABARAPL1 3 13.10 SIRPB2 1,3 13.11 TRPM6 3 13.12 CD93 1,2,3 1,5,6 13.13 ASPRV1 3 13.14 ALOX5AP 2,3 5 13.15 BCL2A1 1,2,3 1,6,8 13.16 F11 R 3 14.1 PTAFR 3 1,6 14.2 H3F3B 3 7 14.3 TYROBP 2,3 1,6,8 14.4 NCF2 3 1,5,6 14.5 KCNE3 2,3 1,6 14.6 11 1b LAMP2 2,3 1 14.7 PLAUR 3 1,6 14.8 CD14 1 1,5,6 14.9 HK3 1,2 1,6,8 14.10 IL18 1 14.11 RGS18 1,2 1,6 15.1 BMX 2,3 16.1 MMP9 2,3 16.2 S100A12 1,2,3 1,5,6 16.3 12 2a CLEC4E 2,3 16.4 12 2a CLEC4D 2,3 1,6 16.5 CASP5 2,3 16.6 13 1a TNFAIP6 2,3 1 16.7 13 1a IL18RAP 1,3 3,4,8 16.8 13 1a ARG1 2,3 17.1 14 HP 1 1,2 17.2 CBS 2,3 17.3 14 AF161365 3 17.4 15 6a ALAS2 N 18.1 1 Microarray Evidence: 1=Wingrove et al, 2=CATHGEN, 3=PREDICT, N=normalization Marker 2 Cell Type: 1=CD33+, 2=CD34+, 3=CD4+, 4=CD8+, 5=Dendritic, 6=CD14+, 7=CD19+, 8=CD56+ Table 3: Significance of Clinical Variables in CATHGEN Marker discovery set Clinical Varlable p-value Diabetes 0.000560741 Anti Hypertensive Use 0.012462227 HDL 0.088459908 Neutrophil Count 0.129686671 Antidiabetic Use 0.140870844 LDL 0.146873756 Total Cholesterol 0.172382024 WBC Count 0.189994635 Lipid Lowering Agent Use 0.200078333 Triglycerides 0.207728761 Diastolic BP 0.21703689 Chest Pain 0.219704278 Monocyte Count 0.23769698 Platelet Count 0.238534146 Smoker 0.257352165 Lymphocyte Count 0.261169567 Anticoagulant Use 0.321044006 Anti Inflammatory Use 0.332101624 Antiplatelet Use 0.336359859 Statin Use 0.390097042 Calcium Channel Blocker Use 0.401676568 Sex 0.409669446 Postmenopausal 0.418849343 Alcohol Use 0.495208348 NSAID Use 0.536650232 ACE Inhibitor Use 0.687539195 Vasodilator Use 0.715979777 Systolic BP 0.716766737 Antiarrhythmic Use 0.763504492 Salicylates 0.805576705 Beta Blocker Use 0.819779733 Hypertension 0.834786056 Black 0.847458733 Age 0.984504316 Table 4: RT-PCR Results on CATHGEN cohort Markers Marker Non-Diabetic p Diabetic p KLRG1 0.933635139 0.000313584 GZMK 0.176629393 0.002075813 CCR5 0.524551866 0.002796076 RPS4Y1 0.641924002 0.003924492 TUBB2A 0.905726045 0.012164059 TARP 0.855579011 0.013579949 IGHA1 0.427023322 0.015653596 CACNA2D2 0.579670417 0.029884775 ADRB2 0.14583996 0.035331896 DB097529 0.739638806 0.037474362 CB853344 0.924313185 0.042530621 RHOH 0.914493918 0.045421079 GPR114 0.113792718 0.0829264.42 RPS27A 0.127518837 0.085484803 CD3E 0.114159341 0.090230797 RELA 0.800147639 0.124184492 HDC 0.611947115 0.124749411 NR1D1 0.08855384 0.140309177 RRN3 0.883475152 0.14306721 MARCO 0.000742446 0.162858627 ARL17P1 0.009929764 0.163503477 POLR2L 0.110001621 0.169570816 RPL10A 0.372025559 0.176554229 TLR5 5.39034E-05 0.187801635 RPL34 0.047258313 0.194514225 CARKL 0.796426726 0.197876342 DPM3 0.100527185 0.210155758 C11orf2 0.279960963 0.21235462 LIF 0.319291 0.220377076 DHFR 0.005845519 0.227352382 BU540282 0.855833364 0.253041264 CDC42SE2 0.303933209 0.27279888 OLIG2 9.8531 E-05 0.291441723 DERL3 0.009989003 0.311630921 SLK 0.022499454 0.315243668 MBOAT2 7.53321E-07 0.32533079 ST3GAL1 0.555439718 0.329090787 FOLR3 0.293485861 0.330960224 NDUFS7 0.510992855 0.362739986 SLC29A1 0.000196258 0.370006714 TCF7 0.139201093 0.384656786 BQ130147 0.005433882 0.39124831 SPSB2 0.710554126 0.392430072 REEP3 0.003636115 0.39572088 CBS 8.54923E-05 0.414841711 GSTO1 0.000439166 0.421164955 VSIG4 0.03654483 0.436274059 OLIG1 0.000739337 0.438928192 RPL8 0.420798397 0.441110854 CR609588 0.829179104 0.44827808 ARG1 9.77852E-05 0.454989416 JAK2 6.14999E-05 0.462535965 CLC 8.43913E-05 0.478209075 PAPSS1 0.002660178 0.497255641 HSPB1 0.011649931 0.503891496 MPZL1 0.069994815 0.504344915 BC032451 0.015738039 0.505628786 BCL2A1 2.81815E-05 0.50979301 CKLF 8.76337E-06 0.515802792 S100A9 1.04727E-07 0.535038B MAPK8IP1 0.000267919 0.558711324 LOXL2 0.153997075 0.559866641 GSTP1 0.802223179 0.622441442 SLC22A1 0.000127897 0.626928629 HGF 0.001272015 0.63284641 EPOR 0.918974368 0.633466985 ETFB 0.143878666 0.645850919 SSNA1 0.103788889 0.6470392 IRF2 0.018278933 0.665824694 ASMTL 0.311592758 0.681691103 ST6GALNAC3 0.000812432 0.686396961 CSTA 3.1114E-06 0.707081235 SMN1 0.473451351 0.714837746 REEP5 0.000215833 0.733733395 FCGBP 0.074075812 0.796385743 S100A12 4.72256E-06 0.804439181 CAT 4.59232E-08 0.81384176 LOC644246 2.85943E-06 0.820487985 FRAT1 3.39803E-05 0.859050707 ATP11B 6.96563E-05 0.882770629 LGALS1 0.039299421 0.918250705 YWHAZ 0.023358903 0.927846666 MMD 0.153204886 0.941639541 CD33 0.101691174 0.950753885 CD248 0.186672242 0.973814259 ADORA3 0.000150846 0.975200559 TXN 3.22949E-08 0.99228328 LPGAT1 1.58563E-06 0.995574922 Table 5 Marker Symbol AA303143 AA601031 ABCC2 ABHD2 ABHD5 ABLIM1 ACO2 ACOX1 ACSL1 ACTB ACVR2B ADA ADNP AF034187 AF085968 AF161353 AF471454 AI276257 AIM1L AK021463 AK022268 AK023663 AK024956 AK056689 AK092942 AK098835 AK124192 ALOX12 ALOX5 ALOX5AP ALS2CR13 AMBN AMFR AMICA1 ANXA2 ANXA3 AOAH AP1S2 APBA2 APBB1 APEH APH1A APOBEC3G APRT AQP2 AQP8 ARG1 ARHGAP24 ARHGAP9 ARHGDIA ARID5B ARPC1B ASCL2 ATG3 ATP1B2 ATP5D ATP6V0B ATP7B AW076051 AW579245 AX721252 AY003763 AY062331 A_23_P158868 A_23_P335398 A_23_P348587 A_23_P44053 A_24_P101960 A_24_P144383 A_24_P221375 A_24_P238427 A_24_P384604 A_24_P417996 A_24_P418712 A_24_P745883 A_24_P84408 A_24_P916228 A_24_P929533 A_32_P28158 A_32_P62137 B2M B4GALT5 BACH2 BAGE BAZ1A BBS2 BC024289 BC031973 BC038432 BC043173 BC062739 BC073935 BCL2A1 BCL3 BCL6 BCL7A BG777521 BI024548 BI026064 BM703463 BMX BOP1 BQ365891 BRF1 BRI3 BST1 BTBD14A BTNL8 BU633383 BX110908 BYSL C10orf54 C11orf2 C12orf35 C14orf156 C15orf38 C16orf24 C16orf57 C1orf96 C20orf24 C20orf3 C20orf77 C2orf39 C6orf129 C6orf32 C7orf34 C8orf31 C9orf19 CALM3 CAMKK2 CAPNS1 CASP4 CASP5 CBS CCDC108 CCDC92 CCL3L3 CCPG1 CD200 CD248 CD302 CD3D CD3E CD5 CD58 CD6 CD7 CD79B CD93 CD96 CDKL5 CDKN1A CEACAM4 CEBPB CEBPD CFLAR CFP CHI3L2 CIB3 CKLF CLEC12A CLEC2D CLEC4D CLEC4E CLIC1 CMTM2 CNTNAP2 COL14A1 COMMD6 COP1 COX6B2 COX6C CPD CR2 CR593845 CR610181 CR613361 CR613944 CREB5 CRIP1 CRISPLD2 CSF2RA CSF2RB CSTA CTBP2 CYB5D2 CYP1A2 CYP4F2 CYP4F3 CYP4F8 DCXR DDX11 DDX3Y DEDD2 DEFA4 DEK DENND3 DHRS3 DHRS7B DHRSX DKFZP434B0335 DKFZp434F142 DKFZp547E087 DOCK10 DOCK8 DOK3 DPF3 DPPA5 DRAP1 DUOX2 DUSP13 DUSP3 DYNLT1 ECH1 ECHDC3 EEF2 EIF1AX EIF2AK2 EIF2C4 EIF4B EIF5A EMP3 EMR3 ENST00000337102 ENST00000360102 ENTPD1 ETS1 EXOC6 EXOSC6 F5 FAIM3 FAM108A1 FAM113B FAM26B FAM44A FAU FBXL5 FCAR FCER1A FGD4 FIBP FKBP5 FKBP9 FLJ22662 FLJ40092 FNDC3B FOS FOXJ1 FOXP1 FPR1 FRAT1 FRAT2 FRS2 FRS3 FTH1 FXYD5 FYB GADD45GIP1 GAMT GBP2 GCA GLRX GLT1D1 GLUL GMFG GNB1 GPA33 GPBAR1 GPC1 GPD1 GPR160 GPR172A GPR37L1 GRB10 GSTT1 GTF2I GYG1 H2AFZ H3F3A HAL HAP1 HDAC4 HDDC2 HDGFL1 HEBP2 HIST1H2AC HIST1H2AJ HIST1H2AM HIST1H2BC HIST2H2AC HLA-DRB5 HLA-E HLA-F HMGB2 HOMER3 HOXB7 HSBP1 HSDL2 HSPA1A HSPB1 HTATIP2 ID2 ID3 IFITM4P IGF2R IGHA1 IGHD IGHM IL13RA1 IL18R1 IL1R2 IL23A IL7R IMPA2 IMPDH1 INCA IRAK3 ISG20 ITM2C JDP2 KCNE3 KCNG1 KCNJ15 KIAA0319L KIAA1430 KIAA1833 KLF6 KLHL3 KLRC4 KSR1 LAG3 LAMP2 LAT2 LCK LHPP LILRA2 LILRB3 LILRP2 LIMS2 LIN7A LIN7B LOC137886 LOC149703 LOC150166 LOC153546 LOC220433 LOC389641 LOC401233 LOC401357 LOC439949 LOC440104 LOC440348 LOC440731 LOC497190 LOC644246 LOXL2 LPGAT1 LRRK2 LSM10 LSM7 LST1 LTBP2 LTBP3 LY96 MACF1 MAGED1 MAGED2 MAGEH1 MAK MAN1C1 MAN2A2 MAP1 LC3B MAP3K2 MAP3K3 MAP4K4 MAPK14 MAPK8IP1 MAX MBOAT2 MCL1 MEA1 MEGF10 METTL9 MGAM MGC14425 MLKL MLSTD2 MMD MME MMP9 MNDA MORC3 MOSC1 MOSPD2 MPZL1 MRLC2 MRPL42P5 MRPL53 MSRB2 MST150 MUC20 MUM1 MXD1 MYBPH MYC MYH14 MYL6 MYO15B MYO1F MYO1G NAPSA NAPSB NBPF11 NCF4 NDRG2 NDUFB3 NDUFS8 NFATC1 NFIL3 NGFRAP1 NIN NMI NMT2 NOVA1 NPIP NRBF2 NRIP3 NRP1 NRSN2 NUDT16 OLIG1 OR4C15 OR52B2 OSBPL2 OSBPL6 OSTF1 OXNAD1 PACSIN2 PADI4 PARP1 PDCD7 PDE9A PDK2 PDLIM7 PELI1 PFDN5 PFKFB3 PGD PHB PHC2 PHF5A PHGDH PIK3C2B PIM2 PISD PITPNA PLA2G4A PLA2G7 PLAG1 PLD3 PLEKHA1 PLEKHM1 PLXNC1 POLR2A PPP1R12B PPP4R2 PRAP1 PRKAR1A PRKAR1B PRKCA PRKCD PRKDC PRKY PRSS23 PSMB9 PSMD8 PTEN PTOV1 PTPRCAP PTPRK PTPRM PXK PYCARD PYGL QPCT QPRT RAB24 RAB27A RAB31 RAB32 RABGAP1L RABIF RAC1 RAC2 RAI1 RALB RALGDS RARA RASSF2 RBP7 RCC2 REEP5 REPS2 RFWD2 RGS16 RGS2 RHOG RHOH RIMS4 RIT1 RMND5A RNF130 RNF182 RNF24 ROCK2 ROPN1L RPL17 RPL18A RPL22 RPL31 RPL34 RPL36A RPL37 RPL39 RPS10 RPS15 RPS21 RPS27 RPS27A RPS28 RPS4X RPUSD2 RRN3 RTN3 S100A11 S100A12 S100A8 S100A9 S100P SAMSN1 SAP30 SCRN2 SDCBP SEC14L1 SEC22B SEPX1 SERINC1 SERPINB1 SERPINB8 SERPINE1 SF3B14 SFT2D1 SGCE SH2D5 SLA SLC16A3 SLC1A7 SLC22A15 SLC22A4 SLC25A37 SLC2A10 SLC2A14 SLC2AB SLC35B4 SLC37A3 SLC40A1 SLC45A2 SLC8A1 SLIT3 SMARCD3 SMC1A SMUG1 SOD2 SP100 SPIB SPRR2C SRM SRPK1 SSBP4 ST6GAL1 STAT5A STC1 STK17B STMN1 STX10 STX3 SULT1B1 SYNCRIP SYT15 TAF9B TALDO1 TANK TARP TAX1BP1 TBCD TBL1XR1 TCEAL1 TCF3 TCF7 THBD TLR2 TLR8 TM7SF2 TMEM102 TMEM48 TMEM49 TMEM68 TMEM86A TNFAIP6 TNFRSF10A TP53I11 TP53TG3 TPST1 TRA@ TRAPPC2L TREM1 TRIB1 TRIM7 TSEN34 TSPAN13 TSPAN16 TSPAN33 TUFM TXN TYROBP U2AF1 UBC UBE2D3 UBE2G2 UBL5 UBQLN1 UCP2 UPF3A URG4 USP11 USP53 USP6 VKORC1 VWCE WDFY3 WDR18 XKR8 XPR1 YOD1 YPEL4 ZBED1 ZCCHC6 ZNF135 ZNF234 ZNF346 ZNF438 ZNF550 ZNF618 Table 6 GOID Ontology Term Log odds ratio p value GO:0009987 bp cellular process 0.537 5.55E-19 GO:0002376 bp immune system process 1.728 9.64E-16 GO:0050896 bp response to stimulus 1.118 2.63E-15 GO:0006955 bp immune response 1.796 7.62E-12 GO:0008152 bp metabolic process 0.537 1.64E-09 GO:0065007 bp biological regulation 0.545 2.34E-09 GO:0006952 bp defense response 1.732 1.02E-08 GO:0050789 bp regulation of biological process 0.538 2.16E-08 GO:0043067 bp regulation of programmed cell death 1.508 1.52E-07 GO:0010941 bp regulation of cell death 1.507 1.55E-07 GO:0044238 bp primary metabolic process 0.515 2.05E-07 GO:0007165 bp signal transduction 0.784 2.09E-07 GO:0050794 bp regulation of cellular process 0.520 2.50E-07 GO:0042981 bp regulation of apoptosis 1.493 3.04E-07 GO:0006950 bp response to stress 1.096 3.47E-07 GO:0007154 bp cell communication 0.727 5.29E-07 GO:0045321 bp leukocyte activation 2.190 6.88E-07 GO:0046649 bp lymphocyte activation 2.307 8.27E-07 GO:0044237 bp cellular metabolic process 0.484 4.42E-06 GO:0006690 bp icosanoid metabolic process 3.260 9.29E-06 GO:0001775 bp cell activation 1.968 9.96E-06 GO:0043068 bp positive regulation of programmed cell death 1.746 1.47E-05 GO:0048519 bp negative regulation of biological process 0.976 1.64E-05 GO:0010942 bp positive regulation of cell death 1.737 1.64E-05 GO:0002684 bp positive regulation of immune system process 2.153 2.09E-05 GO:0033559 bp unsaturated fatty acid metabolic process 3.120 2.23E-05 GO:0019538 bp protein metabolic process 0.702 2.24E-05 GO:0002521 bp leukocyte differentiation 2.473 3.07E-05 GO:0006414 bp translational elongation 2.100 3.49E-05 GO:0043065 bp positive regulation of apoptosis 1.706 4.03E-05 GO:0009611 bp response to wounding 1.522 4.38E-05 GO:0009605 bp response to external stimulus 1.260 4.61 E-05 GO:0006954 bp inflammatory response 1.781 4.61 E-05 GO:0007242 bp intracellular signaling cascade 1.009 6.55E-05 GO:0006917 bp induction of apoptosis 1.843 7.07E-05 GO:0006691 bp leukotriene metabolic process 3.699 7.33E-05 GO:0012502 bp induction of programmed cell death 1.831 7.99E-05 GO:0030098 bp lymphocyte differentiation 2.586 8.30E-05 GO:0002682 bp regulation of immune system process 1.761 9.77E-05 GO:0043449 bp cellular alkene metabolic process 3.603 0.00012 GO:0044267 bp cellular protein metabolic process 0.697 0.00024 GO:0048523 bp negative regulation of cellular process 0.899 0.00046 GO:0042110 bp T cell activation 2.334 0.00051 GO:0050776 bp regulation of immune response 2.018 0.00057 GO:0055114 bp oxidation reduction 1.237 0.00057 GO:0042221 bp response to chemical stimulus 1.082 0.00068 GO:0043066 bp negative regulation d apoptosis 1.625 0.00069 GO:0030097 bp hemopoiesis 1.833 0.00078 GO:0043069 bp negative regulation of programmed cell death 1.608 0.00082 GO:0060548 bp negative regulation of cell death 1.608 0.00082 GO:0002694 bp regulation of leukocyte activation 2.148 0.00083 GO:0043170 bp macromolecule metabolic process 0.431 0.00101 GO:0050865 bp regulation of cell activation 2.114 0.00102 GO:0043412 bp macromolecule modification 0.804 0.00130 GO:0051249 bp regulation of lymphocyte activation 2.174 0.00139 GO:0048583 bp regulation of response to stimulus 1.526 0.00177 GO:0045619 bp regulation of lymphocyte differentiation 2.692 0.00245 GO:0051707 bp response to other organism 1.750 0.00252 GO:0048534 bp hemopoietic or lymphoid organ development 1.673 0.00284 GO:0048518 bp positive regulation of biological process 0.786 0.00285 GO:0002696 bp positive regulation of leukocyte activation 2.297 0.00301 GO:0050867 bp positive regulation of cell activation 2.297 0.00301 GO:0006793 bp phosphorus metabolic process 0.928 0.00377 GO:0006796 bp phosphate metabolic process 0.928 0.00377 GO:0019221 bp cytokine-mediated signaling pathway 2.387 0.00426 GO:0006464 bp protein modification process 0.767 0.00461 GO:0045621 bp positive regulation of lymphocyte differentiation 3.046 0.00499 GO:0002820 bp negative regulation of adaptive immune response 3.972 0.00499 GO:0002823 bp negative regulation of adaptive immune response based on somatic recombination of immune receptors built from immunoglobulin superfamily domains 3.972 0.00499 GO:0044260 bp cellular macromolecule metabolic process 0.413 0.00561 GO:0045580 bp regulation of T cell differentiation 2.724 0.00561 GO:0019370 bp leukotriene biosynthetic process 3.387 0.00561 GO:0043450 bp alkene biosynthetic process 3.387 0.00561 GO:0002520 bp immune system development 1.580 0.00565 GO:0009607 bp response to biotic stimulus 1.477 0.00577 GO:0031347 bp regulation of defense response 2.154 0.00638 GO:0043101 bp purine salvage 4.650 0.00644 GO:0008285 bp negative regulation of cell proliferation 1.413 0.00689 GO:0001817 bp regulation of cytokine production 1.908 0.00710 GO:0016310 bp phosphorylation 0.971 0.00713 GO:0043687 bp post-translational protein modification 0.840 0.00713 GO:0042113 bp B cell activation 2.272 0.00713 GO:0051251 bp positive regulation of lymphocyte activation 2.258 0.00764 GO:0006928 bp cellular component movement 1.253 0.00800 GO:0043433 bp negative regulation of transcription factor activity 2.902 0.00800 GO:0090048 bp negative regulation of transcription regulator activity 2.902 0.00800 GO:0030183 bp B cell differentiation 2.627 0.00807 GO:0002252 bp immune effector process 1.981 0.00816 GO:0050863 bp regulation of T cell activation 2.098 0.00821 GO:0070887 bp cellular response to chemical stimulus 1.562 0.00962 GO:0048522 bp positive regulation of cellular process 0.757 0.00972 GO:0006412 bp translation 1.220 0.01068 GO:0043299 bp leukocyte degranulation 3.650 0.01102 GO:0030091 bp protein repair 4.387 0.01112 GO:0006916 bp anti-apoptosis 1.656 0.01149 GO:0007264 bp small GTPase mediated signal transduction 1.344 0.01149 GO:0042127 bp regulation of cell proliferation 1.035 0.01275 GO:0007243 bp protein kinase cascade 1.332 0.01275 GO:0030217 bp T cell differentiation 2.491 0.01322 GO:0031349 bp positive regulation of defense response 2.491 0.01322 GO:0006468 bp protein amino acid phosphorylation 0.992 0.01363 GO:0002698 bp negative regulation of immune effector process 3.557 0.01363 GO:0043392 bp negative regulation of DNA binding 2.709 0.01508 GO:0043603 bp cellular amide metabolic process 2.449 0.01564 GO:0007166 bp cell surface receptor linked signal transduction 0.727 0.01692 GO:0008625 bp induction of apoptosis via death domain receptors 3.470 0.01716 GO:0009163 bp nucleoside biosynthetic process 4.165 0.01730 GO:0042451 bp purine nucleoside biosynthetic process 4.165 0.01730 GO:0042455 bp ribonucleoside biosynthetic process 4.165 0.01730 GO:0046129 bp purine ribonucleoside biosynthetic process 4.165 0.01730 GO:0033152 bp immunoglobulin V(D)J recombination 4.165 0.01730 GO:0051100 bp negative regulation of binding 2.650 0.01793 GO:0045582 bp positive regulation of T cell differentiation 2.972 0.01808 GO:0006959 bp humoral immune response 2.210 0.01808 GO:0042035 bp regulation of cytokine biosynthetic process 2.210 0.01808 GO:0007162 bp negative regulation of cell adhesion 2.539 0.02085 GO:0051591 bp response to cAMP 3.235 0.02085 GO:0042036 bp negative regulation of cytokine biosynthetic process 3.235 0.02085 GO:0045727 bp positive regulation of translation 3.235 0.02085 GO:0051098 bp regulation of binding 1.839 0.02085 GO:0051101 bp regulation of DNA binding 1.984 0.02085 GO:0032944 bp regulation of mononuclear cell proliferation 2.309 0.02085 GO:0050670 bp regulation of lymphocyte proliferation 2.309 0.02085 GO:0070663 bp regulation of leukocyte proliferation 2.309 0.02085 GO:0045581 bp negative regulation of T cell differentiation 3.972 0.02085 GO:0002703 bp regulation of leukocyte mediated immunity 2.513 0.02085 GO:0002706 bp regulation of lymphocyte mediated immunity 2.594 0.02085 GO:0018193 bp peptidyl-amino acid modification 1.779 0.02085 GO:0019321 bp pentose metabolic process 3.972 0.02085 GO:0045055 bp regulated secretory pathway 3.235 0.02085 GO:0010310 bp regulation of hydrogen peroxide metabolic process 3.972 0.02085 GO:0002822 bp regulation of adaptive immune response based on somatic recombination of immune receptors built from immunoglobulin superfamily domains 2.487 0.02155 GO:0019748 bp secondary metabolic process 2.079 0.02180 GO:0006631 bp fatty acid metabolic process 1.541 0.02416 GO:0046688 bp response to copper ion 3.802 0.02497 GO:0045628 bp regulation of T-helper 2 cell differentiation 3.802 0.02497 GO:0002704 bp negative regulation of leukocyte mediated immunity 3.802 0.02497 GO:0002707 bp negative regulation of lymphocyte mediated immunity 3.802 0.02497 GO:0046456 bp icosanoid biosynthetic process 2.724 0.02597 GO:0010033 bp response to organic substance 1.157 0.02601 GO:0080134 bp regulation of response to stress 1.524 0.02611 GO:0042180 bp cellular ketone metabolic process 1.016 0.02815 GO:0002712 bp regulation of B cell mediated immunity 3.098 0.02864 GO:0002889 bp regulation of immunoglobulin mediated immune response 3.098 0.02864 GO:0002819 bp regulation of adaptive immune response 2.387 0.02920 GO:0008624 bp induction of apoptosis by extracellular signals 2.387 0.02920 GO:0050778 bp positive regulation of immune response 1.864 0.02930 GO:0030031 bp cell projection assembly 1.998 0.02943 GO:0002443 bp leukocyte mediated immunity 1.998 0.02943 GO:0051250 bp negative regulation of lymphocyte activation 2.650 0.03116 GO:0000122 bp negative regulation of transcription from RNA polymerase II promoter 1.843 0.03194 GO:0043094 bp cellular metabolic compound salvage 3.650 0.03249 GO:0045749 bp negative regulation of S phase of mitotic cell cycle 3.650 0.03249 GO:0050777 bp negative regulation of immune response 3.034 0.03249 GO:0080010 bp regulation of oxygen and reactive oxygen species metabolic process 3.650 0.03249 GO:0006968 bp cellular defense response 2.131 0.03328 GO:0045087 bp innate immune response 1.716 0.03404 GO:0006739 bp NADP metabolic process 2.972 0.03786 GO:0045088 bp regulation of innate immune response 2.580 0.03789 GO:0002697 bp regulation of immune effector process 2.082 0.04021 GO:0009617 bp response to bacterium 1.783 0.04172 GO:0006636 bp unsaturated fatty acid biosynthetic process 2.546 0.04198 GO:0006101 bp citrate metabolic process 3.513 0.04231 GO:0002828 bp regulation of T-helper 2 type immune response 3.513 0.04231 GO:0046777 bp protein amino acid autophosphorylation 2.066 0.04231 GO:0060263 bp regulation of respiratory burst 3.513 0.04231 GO:0006082 bp organic acid metabolic process 0.971 0.04277 GO:0019752 bp carboxylic acid metabolic process 0.980 0.04277 GO:0043436 bp oxoacid metabolic process 0.980 0.04277 GO:0009058 bp biosynthetic process 0.423 0.04277 GO:0030155 bp regulation of cell adhesion 1.763 0.04277 GO:0050870 bp positive regulation of T cell activation 2.034 0.04277 GO:0050727 bp regulation of inflammatory response 2.228 0.04277 GO:0007265 bp Ras protein signal transduction 1.659 0.04277 GO:0010629 bp negative regulation of Marker expression 1.186 0.04277 GO:0042742 bp defense response to bacterium 2.018 0.04277 GO:0002695 bp negative regulation of leukocyte activation 2.481 0.04277 GO:0009146 bp purine nucleoside triphosphate catabolic process 3.387 0.04455 GO:0045620 bp negative regulation of lymphocyte differentiation 3.387 0.04455 GO:0050869 bp negative regulation of B cell activation 3.387 0.04455 GO:0050853 bp B cell receptor signaling pathway 3.387 0.04455 GO:0050864 bp regulation of B cell activation 2.449 0.04504 GO:0018212 bp peptidyl-tyrosine modification 2.449 0.04504 GO:0048584 bp positive regulation of response to stimulus 1.526 0.04534 GO:0019079 bp viral genome replication 2.802 0.04639 GO:0009892 bp negative regulation of metabolic process 0.997 0.04764 GO:0006357 bp regulation of transcription from RNA polymerase II promoter 0.950 0.04827 GO:0010605 bp negative regulation of macromolecule metabolic process 1.020 0.04827 GO:0010558 bp negative regulation of macromolecule biosynthetic process 1.106 0.04890 GO:0005623 cc cell 0.465 2.15E-24 GO:0044464 cc cell part 0.465 2.15E-24 GO:0005622 cc intracellular 0.434 1.13E-11 GO:0044424 cc intracellular part 0.430 1.26E-10 GO:0005737 cc cytoplasm 0.537 7.50E-10 GO:0016020 cc membrane 0.551 1.18E-08 GO:0005829 cc cytosol 1.207 2.30E-07 GO:0005886 cc plasma membrane 0.744 7.43E-07 GO:0043229 cc intracellular organelle 0.400 1.46E-06 GO:0043226 cc organelle 0.399 1.54E-06 GO:0016021 cc integral to membrane 0.583 4.13E-06 GO:0044444 cc cyboplasmic part 0.583 5.65E-06 GO:0031224 cc intrinsic to membrane 0.559 1.09E-05 GO:0044425 cc membrane part 0.516 1.44E-05 GO:0022626 cc cytosolic ribosome 2.173 0.00034 GO:0044445 cc cytosolic part 1.912 0.00040 GO:0043231 cc intracellular membrane-bounded organelle 0.339 0.00111 GO:0043227 cc membrane-bounded organelle 0.339 0.00116 GO:0033279 cc ribosomal subunit 1.837 0.00223 GO:0022627 cc cytosolic small ribosomal subunit 2.532 0.00501 GO:0044459 cc plasma membrane part 0.659 0.00975 GO:0043228 cc non-membrane-bounded organelle 0.588 0.00986 GO:0043232 cc intracellular non-membrane-bounded organelle 0.588 0.00986 GO:0044422 cc organelle part 0.435 0.01029 GO:0044446 cc intracellular organelle part 0.433 0.01149 GO:0005887 cc integral to plasma membrane 0.777 0.01842 GO:0031226 cc intrinsic to plasma membrane 0.751 0.02085 GO:0032991 cc macromolecular complex 0.516 0.02085 GO:0005840 cc ribosome 1.329 0.02085 GO:0005634 cc nucleus 0.348 0.02601 GO:0016461 cc unconventional myosin complex 3.650 0.03249 GO:0015935 cc small ribosomal subunit 1.960 0.03404 GO:0005488 mf binding 0.469 0.00000 GO:0005515 mf protein binding 0.601 0.00000 GO:0003824 mf catalytic activity 0.554 0.00000 GO:0003823 mf antigen binding 3.025 0.00051 GO:0046983 mf protein dimerization activity 1.350 0.00085 GO:0004871 mf signal transducer activity 0.738 0.00223 GO:0060089 mf molecular transducer activity 0.738 0.00223 GO:0004197 mf cysteine-type endopeptidase activity 2.223 0.00456 GO:0016491 mf oxidoreductase activity 1.060 0.00553 GO:0004872 mf receptor activity 0.763 0.00990 GO:0017070 mf U6 snRNA binding 4.387 0.01112 GO:0005536 mf glucose binding 4.387 0.01112 GO:0016208 mf AMP binding 3.018 0.01639 GO:0030234 mf enzyme regulator activity 0.895 0.01730 GO:0008113 mf peptide-methionine-(S)-S-oxide reductase activity 4.165 0.01730 GO:0043169 mf cation binding 0.420 0.01977 GO:0043167 mf ion binding 0.408 0.02085 GO:0046872 mf metal ion binding 0.419 0.02085 GO:0005529 mf sugar binding 1.586 0.02085 GO:0016165 mf lipoxygenase activity 3.972 0.02085 GO:0047485 mf protein N-terminus binding 2.291 0.02085 GO:0005509 mf calcium ion binding 0.845 0.02138 GO:0030528 mf transcription regulator activity 0.733 0.02364 GO:0001848 mf complement binding 3.802 0.02497 GO:0005527 mf macrolide binding 3.802 0.02497 GO:0005528 mf FK506 binding 3.802 0.02497 GO:0019838 mf growth factor binding 1.776 0.02637 GO:0003735 mf structural constituent of ribosome 1.348 0.02664 GO:0019210 mf kinase inhibitor activity 2.412 0.02732 GO:0005198 mf structural molecule activity 0.901 0.02868 GO:0019899 mf enzyme binding 1.176 0.02868 GO:0005351 mf sugar:hydrogen symporter activity 2.387 0.02920 GO:0005402 mf cation:sugar symporter activity 2.387 0.02920 GO:0004672 mf protein kinase activity 0.930 0.02979 GO:0004888 mf transmembrane receptor activity 0.813 0.02981 GO:0019207 mf kinase regulator activity 1.853 0.03047 GO:0015144 mf carbohydrate transmembrane transporter activity 2.317 0.03624 GO:0051119 mf sugar transmembrane transporter activity 2.317 0.03624 GO:0003700 mf transcription factor activity 0.928 0.04231 GO:0004859 mf phospholipase inhibitor activity 3.513 0.04231 GO:0019887 mf protein kinase regulator activity 1.885 0.04277 GO:0004896 mf cytokine receptor activity 2.050 0.04277 GO:0008603 mf cAMP-dependent protein kinase regulator activity 2.857 0.04277 GO:0015295 mf solute:hydrogen symporter activity 2.250 0.04277 GO:0055102 mf lipase inhibitor activity 3.387 0.04455 GO:0016840 mf carbon-nitrogen lyase activity 3.387 0.04455 GO:0016671 mf oxidoreductase activity, acting on sulfur group of donors, disulfide as acceptor 3.387 0.04455 GO:0000166 mf nucleotide binding 0.514 0.04639 GO:0016787 mf hydrolase activity 0.502 0.04653 Table 7 Term 1 Term 2 Term 3 Term 4 Term 5 Term 6 Term 7 Number of Terms AUC Ridge Regression AUC Logistic Regression AUC Ridge Regression AUC Logistic Regression TRUE TRUE TRUE TRUE TRUE TRUE TRUE 7 0.781188 0.785011 0.781188 0.785011 TRUE TRUE TRUE TRUE TRUE TRUE FALSE 6 0.775592 0.779372 Mean 0.775346 0.778701 TRUE TRUE TRUE TRUE TRUE FALSE TRUE 6 0.764453 0.768001 SD 0.00497 0.004876 TRUE TRUE TRUE TRUE FALSE TRUE TRUE 6 0.778834 0.781621 TRUE TRUE TRUE FALSE TRUE TRUE TRUE 6 0.777071 0.781157 TRUE TRUE FALSE TRUE TRUE TRUE TRUE 6 0.778887 0.782202 TRUE FALSE TRUE TRUE TRUE TRUE TRUE 6 0.776268 0.779626 FALSE TRUE TRUE TRUE TRUE TRUE TRUE 6 0.776321 0.778929 Table 8 Term AUC Ridge Regression AUC Logistic Regression 7 0.781188 0.785011 6 0.775346 0.778701 5 0.769504 0.772411 4 0.763641 0.766090 3 0.757567 0.759481 2 0.751191 0.752634 1 0.744420 0.745125 0 0.736732 0.736732 DF Model 0.677495 ± .042437 Table 9 Term 1 Term 2 Term 3 Term 4 Term 5 Term 6 Term 7 Number of Terms AUC Ridge Regression AUC Logistic Regression AUC Ridge Regression AUC Logistic Regression TRUE TRUE TRUE TRUE TRUE FALSE FALSE 5 0.756671 0.761212 Mean 0.769504 0.772411 TRUE TRUE TRUE TRUE FALSE TRUE FALSE 5 0.772815 0.774463 SD 0.006329 0.006033 TRUE TRUE TRUE FALSE TRUE TRUE FALSE 5 0.771306 0.775846 TRUE TRUE FALSE TRUE TRUE TRUE FALSE 5 0.774389 0.777155 TRUE FALSE TRUE TRUE TRUE TRUE FALSE 5 0.772889 0.775508 FALSE TRUE TRUE TRUE TRUE TRUE FALSE 5 0.770334 0.772668 TRUE TRUE TRUE TRUE FALSE FALSE TRUE 5 0.761507 0.763841 TRUE TRUE TRUE FALSE TRUE FALSE TRUE 5 0.759744 0.764443 TRUE TRUE FALSE TRUE TRUE FALSE TRUE 5 0.762542 0.765424 TRUE FALSE TRUE TRUE TRUE FALSE TRUE 5 0.760124 0.76345 FALSE TRUE TRUE TRUE TRUE FALSE TRUE 5 0.760684 0.763249 TRUE TRUE TRUE FALSE FALSE TRUE TRUE 5 0.7748 0.77819 TRUE TRUE FALSE TRUE FALSE TRUE TRUE 5 0.776659 0.779921 TRUE FALSE TRUE TRUE FALSE TRUE TRUE 5 0.773523 0.775466 FALSE TRUE TRUE TRUE FALSE TRUE TRUE 5 0.773766 0.775529 TRUE TRUE FALSE FALSE TRUE TRUE TRUE 5 0.775835 0.779731 TRUE FALSE TRUE FALSE TRUE TRUE TRUE 5 0.771633 0.775613 FALSE TRUE TRUE FALSE TRUE TRUE TRUE 5 0.771084 0.773702 TRUE FALSE FALSE TRUE TRUE TRUE TRUE 5 0.775191 0.776279 FALSE TRUE FALSE TRUE TRUE TRUE TRUE 5 0.773914 0.776289 FALSE FALSE TRUE TRUE TRUE TRUE TRUE 5 0.770165 0.772657 Table 10 Term 1 Term 2 Term 3 Term 4 Term 5 Term 6 Term 7 Number of Terms AUC Ridge Regression AUC Logistic Regression AUC Ridge Regression AUC Logistic Regression TRUE TRUE TRUE TRUE FALSE FALSE FALSE 4 0.753409 0.755542 Me an 0.763641 0.76609 TRUE TRUE TRUE FALSE TRUE FALSE FALSE 4 0.752269 0.757854 SD 0.007095 0.00666 TRUE TRUE FALSE TRUE TRUE FALSE FALSE 4 0.75475 0.759132 TRUE FALSE TRUE TRUE TRUE FALSE FALSE 4 0.754644 0.758973 FALSE TRUE TRUE TRUE TRUE FALSE FALSE 4 0.752923 0.755964 TRUE TRUE TRUE FALSE FALSE TRUE FALSE 4 0.769014 0.771379 TRUE TRUE FALSE TRUE FALSE TRUE FALSE 4 0.772245 0.772932 TRUE FALSE TRUE TRUE FALSE TRUE FALSE 4 0.769289 0.770514 FALSE TRUE TRUE TRUE FALSE TRUE FALSE 4 0.76742 0.768296 TRUE TRUE FALSE FALSE TRUE TRUE FALSE 4 0.770746 0.7748 TRUE FALSE TRUE FALSE TRUE TRUE FALSE 4 0.768423 0.771601 FALSE TRUE TRUE FALSE TRUE TRUE FALSE 4 0.765129 0.768434 TRUE FALSE FALSE TRUE TRUE TRUE FALSE 4 0.771042 0.773185 FALSE TRUE FALSE TRUE TRUE TRUE FALSE 4 0.769152 0.771116 FALSE FALSE TRUE TRUE TRUE TRUE FALSE 4 0.767262 0.768592 TRUE TRUE TRUE FALSE FALSE FALSE TRUE 4 0.75684 0.759332 TRUE TRUE FALSE TRUE FALSE FALSE TRUE 4 0.759744 0.762014 TRUE FALSE TRUE TRUE FALSE FALSE TRUE 4 0.75722 0.75872 FALSE TRUE TRUE TRUE FALSE FALSE TRUE 4 0.757622 0.759311 TRUE TRUE FALSE FALSE TRUE FALSE TRUE 4 0.758392 0.76194 TRUE FALSE TRUE FALSE TRUE FALSE TRUE 4 0.754232 0.757463 FALSE TRUE TRUE FALSE TRUE FALSE TRUE 4 0.754739 0.758625 TRUE FALSE FALSE TRUE TRUE FALSE TRUE 4 0.757696 0.76081 FALSE TRUE FALSE TRUE TRUE FALSE TRUE 4 0.759448 0.760821 FALSE FALSE TRUE TRUE TRUE FALSE TRUE 4 0.756228 0.757865 TRUE TRUE FALSE FALSE FALSE TRUE TRUE 4 0.773956 0.777345 TRUE FALSE TRUE FALSE FALSE TRUE TRUE 4 0.768824 0.771253 FALSE TRUE TRUE FALSE FALSE TRUE TRUE 4 0.768391 0.770482 TRUE FALSE FALSE TRUE FALSE TRUE TRUE 4 0.77252 0.773998 FALSE TRUE FALSE TRUE FALSE TRUE TRUE 4 0.772277 0.77365 FALSE FALSE TRUE TRUE FALSE TRUE TRUE 4 0.767536 0.769299 TRUE FALSE FALSE FALSE TRUE TRUE TRUE 4 0.770376 0.77328 FALSE TRUE FALSE FALSE TRUE TRUE TRUE 4 0.769743 0.77196 FALSE FALSE TRUE FALSE TRUE TRUE TRUE 4 0.764875 0.767167 FALSE FALSE FALSE TRUE TRUE TRUE TRUE 4 0.769057 0.769489 Table 11 Term 1 Term 2 Term 3 Term 4 Term 5 Term 6 Term 7 Number of Terms AUC Ridge Regression AUC Logistic Regression AUC Ridge Regression AUC Logistic Regression TRUE TRUE TRUE FALSE FALSE FALSE FALSE 3 0.749217 0.752026 Mean 0.757567 0.759481 TRUE TRUE FALSE TRUE FALSE FALSE FALSE 3 0.751783 0.754158 SD 0.007376 0.006937 TRUE FALSE TRUE TRUE FALSE FALSE FALSE 3 0.750474 0.752448 FALSE TRUE TRUE TRUE FALSE FALSE FALSE 3 0.749492 0.749734 TRUE TRUE FALSE FALSE TRUE FALSE FALSE 3 0.751223 0.755732 TRUE FALSE TRUE FALSE TRUE FALSE FALSE 3 0.748985 0.752913 FALSE TRUE TRUE FALSE TRUE FALSE FALSE 3 0.746725 0.750442 TRUE FALSE FALSE TRUE TRUE FALSE FALSE 3 0.751804 0.755362 FALSE TRUE FALSE TRUE TRUE FALSE FALSE 3 0.750864 0.753388 FALSE FALSE TRUE TRUE TRUE FALSE FALSE 3 0.74946 0.752047 TRUE TRUE FALSE FALSE FALSE TRUE FALSE 3 0.76856 0.770535 TRUE FALSE TRUE FALSE FALSE TRUE FALSE 3 0.765245 0.766628 FALSE TRUE TRUE FALSE FALSE TRUE FALSE 3 0.762711 0.764052 TRUE FALSE FALSE TRUE FALSE TRUE FALSE 3 0.767916 0.768687 FALSE TRUE FALSE TRUE FALSE TRUE FALSE 3 0.766618 0.766702 FALSE FALSE TRUE TRUE FALSE TRUE FALSE 3 0.763767 0.764432 TRUE FALSE FALSE FALSE TRUE TRUE FALSE 3 0.767388 0.770134 FALSE TRUE FALSE FALSE TRUE TRUE FALSE 3 0.76458 0.766734 FALSE FALSE TRUE FALSE TRUE TRUE FALSE 3 0.760884 0.762669 FALSE FALSE FALSE TRUE TRUE TRUE FALSE 3 0.766005 0.766618 TRUE TRUE FALSE FALSE FALSE FALSE TRUE 3 0.756133 0.758456 TRUE FALSE TRUE FALSE FALSE FALSE TRUE 3 0.751213 0.752891 FALSE TRUE TRUE FALSE FALSE FALSE TRUE 3 0.751899 0.753747 TRUE FALSE FALSE TRUE FALSE FALSE TRUE 3 0.755404 0.75702 FALSE TRUE FALSE TRUE FALSE FALSE TRUE 3 0.756904 0.758213 FALSE FALSE TRUE TRUE FALSE FALSE TRUE 3 0.753166 0.753082 TRUE FALSE FALSE FALSE TRUE FALSE TRUE 3 0.75268 0.756143 FALSE TRUE FALSE FALSE TRUE FALSE TRUE 3 0.753155 0.755996 FALSE FALSE TRUE FALSE TRUE FALSE TRUE 3 0.748932 0.750484 FALSE FALSE FALSE TRUE TRUE FALSE TRUE 3 0.753103 0.755119 TRUE FALSE FALSE FALSE FALSE TRUE TRUE 3 0.767969 0.77063 FALSE TRUE FALSE FALSE FALSE TRUE TRUE 3 0.767832 0.76969 FALSE FALSE TRUE FALSE FALSE TRUE TRUE 3 0.762099 0.763112 FALSE FALSE FALSE TRUE FALSE TRUE TRUE 3 0.766544 0.76723 FALSE FALSE FALSE FALSE TRUE TRUE TRUE 3 0.764105 0.76458 Table 12 Term 1 Term 2Term 3 Term 4 Term 5 Term 6 Term 7Number of Terms AUC Ridge Regression AUC Logistic Regression AUC Ridge Regression AUC Logistic Regression TRUE TRUE FALSE FALSE FALSE FALSE FALSE 2 0.748341 0.750526 Mean 0.751191 0.752634 TRUE FALSE TRUE FALSE FALSE FALSE FALSE 2 0.745247 0.747485 SD 0.007213 0.006971 FALSE TRUE TRUE FALSE FALSE FALSE FALSE 2 0.743589 0.744508 TRUE FALSE FALSE TRUE FALSE FALSE FALSE 2 0.747945 0.749254 FALSE TRUE FALSE TRUE FALSE FALSE FALSE 2 0.748203 0.748151 FALSE FALSE TRUE TRUE FALSE FALSE FALSE 2 0.745722 0.745268 TRUE FALSE FALSE FALSE TRUE FALSE FALSE 2 0.74682 0.75117 FALSE TRUE FALSE FALSE TRUE FALSE FALSE 2 0.745522 0.748225 FALSE FALSE TRUE FALSE TRUE FALSE FALSE 2 0.742333 0.74455 FALSE FALSE FALSE TRUE TRUE FALSE FALSE 2 0.746968 0.749618 TRUE FALSE FALSE FALSE FALSE TRUE FALSE 2 0.764516 0.765794 FALSE TRUE FALSE FALSE FALSE TRUE FALSE 2 0.762225 0.762563 FALSE FALSE TRUE FALSE FALSE TRUE FALSE 2 0.75759 0.758561 FALSE FALSE FALSE TRUE FALSE TRUE FALSE 2 0.762415 0.762985 FALSE FALSE FALSE FALSE TRUE TRUE FALSE 2 0.760145 0.761486 TRUE FALSE FALSE FALSE FALSE FALSE TRUE 2 0.750526 0.752057 FALSE TRUE FALSE FALSE FALSE FALSE TRUE 2 0.751012 0.752701 FALSE FALSE TRUE FALSE FALSE FALSE TRUE 2 0.74568 0.746092 FALSE FALSE FALSE TRUE FALSE FALSE TRUE 2 0.750811 0.751888 FALSE FALSE FALSE FALSE TRUE FALSE TRUE 2 0.747739 0.749608 FALSE FALSE FALSE FALSE FALSE TRUE TRUE 2 0.761655 0.762827 Table 13 Term 1Term 2Term 3Term 4Term 5Term 6 Term 7Number of Terms AUC Ridge Regression AUC Logistic Regression AUC Ridge Regression AUC Logistic Regression TRUE FALSE FALSE FALSE FALSE FALSE FALSE 1 0.742993 0.744978 Mean 0.74442 0.745125 FALSE TRUE FALSE FALSE FALSE FALSE FALSE 1 0.742555 0.743273 SD 0.006498 0.006455 FALSE FALSE TRUE FALSE FALSE FALSE FALSE 1 0.738732 0.738437 FALSE FALSE FALSE TRUE FALSE FALSE FALSE 1 0.743288 0.743288 FALSE FALSE FALSE FALSE TRUE FALSE FALSE 1 0.740939 0.742903 FALSE FALSE FALSE FALSE FALSE TRUE FALSE 1 0.757125 0.757442 FALSE FALSE FALSE FALSE FALSE FALSE TRUE 1 0.74531 0.745553 Table 14 Term 1Term 2Term 3Term 4Term 5Term 6Term 7Number of Terms AUC Ridge Regression AUC Logistic Regression AUC Ridge Regression AUC Logistic Regression FALSE FALSE FALSE FALSE FALSE FALSE FALSE 0 0.736732 0.736732 0.736732 0.736732 Table 15 Algorithm Marker Substitute Marker Correlation AUC Ridge Regression AUC Logistic egression RefSeq Algorithm Marker RefSeq Substitute Marker S100A12 MMP9 0.77 0.781 0.784 NM_005621 NM_004994 CLEC4E ALOX5AP 0.74 0.780 0.783 NM_014358 NM_001629 S100A8 NAMPT 0.90 0.781 0.786 NM_002964 NM_005746 CASP5 H3F3B 0.63 0.783 0.787 NM_001136112 NM_005324 IL18RAP TXN 0.52 0.774 0.778 NM_003853 NM_003329 TNFAIP6 PLAUR 0.66 0.779 0.783 NM_007115 NM_001005376 AQP9 GLT1D1 0.93 0.781 0.785 NM_020980 NM_144669 NCF4 NCF2 0.91 0.780 0.784 NM_000631 NM_000433 CD3D LCK 0.95 0.779 0.784 NM_000732 NM_001042771 TMC8 CCT2 0.85 0.781 0.785 NM_152468 NM_006431 CD79B CD19 0.95 0.796 0.809 NM_000626 NM_001770 SPIB BLK 0.89 0.780 0.784 NM_003121 NM_001715 HNRPF ACBD5 0.88 0.779 0.783 NM_001098204 NM_001042473 TFCP2 DDX18 0.88 0.781 0.786 NM_005653 NM_006773 RPL28 SSRP1 0.91 0.782 0.786 NM_000991 NM_003146 AF161365 AF161365 1.00 0.781 0.785 AF161365 AF161365 AF289562 CD248 0.53 0.779 0.783 AF289562 NM_020404 SLAMF7 CX3CR1 0.83 0.778 0.783 NM_021181 N_001171171 KLRC4 CD8A 0.79 0.794 0.805 NM_013431 NM_001145873 IL8RB BCL2A1 0.82 0.780 0.785 NM_001557 NM_001114735 TNFRSF10C PTAFR 0.84 0.781 0.785 NM_003841 NM_000952 KCNE3 LAMP2 0.90 0.781 0.784 NM_005472 NM_001122606 TLR4 TYROBP 0.84 0.780 0.783 NM_138554 NM_003332 Mean 0.82 0.781 0.786 SD 0.13 0.005 0.007 Markers are replaced with the most highly correlated non-algorithm marker in the PCR data set, while ensuring that the set of Substitute Markers has no duplicates. Table 16 Genomic Terms AUC Ridge Regression AUC Logistic Regression Full Model 0.781 0.785 1 Marker Replaced 0.781±.009 0.786±.014 5 Markers Replaced 0.781±.014 0.788±.021 10 Markers Replaced 0.778±.015 0.785±.020 15 Markers Replaced 0.779±.014 0.787±.020 20 Markers Replaced 0.771±.010 0.779±.013 All Markers Replaced 0.770 0.775 DF Model 0.677±.042 For the 5, 10, 15, 20 Markers replaced analyses, markers were selected at random 100 times for each of the analyses. Table 17 Markers Delta AUC Ridge Regression Delta AUC Logistic Regression Markers Term Type Predictive AF161365.HNRPF.TFCP2 0 0 3 1 Original Yes AF161365.TFCP2 0.003495 0.004097 2 1 Original Yes AF161365.HNRPF -0.00327 -0.00391 2 1 Original Yes AF161365.ACBD5.DDX18 0.00473 0.004762 3 1 Substitute Yes AF161365.DDX18 4.22E-05 0.000243 2 1 Substitute Yes AF161365.ACBD5 -0.00278 -0.0031 2 1 Substitute Yes Table 18 Markers Delta AUC Ridge Regression Delta AUC Logistic Regression Markers Term Type Predictive AF289562.HNRPF.TFCP2 0 0 3 2 Original Yes AF289562.TFCP2 -6.34E-05 -0.00073 2 2 Original Yes AF289562.HNRPF 0.000549 0.000306 2 2 Original Yes CD248.ACBD5.DDX18 -0.00505 -0.00625 3 2 Substitute Yes CD248.DDX18 -0.00535 -0.00654 2 2 Substitute Yes CD248.ACBD5 -0.00506 -0.00588 2 2 Substitute Yes Table 19 Markers Delta AUC Ridge Regression Delta AUC Logistic Regression Makers Term Predictive CD3D.TMC8.CD79B.SPIB 0 0 4 3 Yes CD3D.CD79B.SPIB -0.00039 -0.00056 3 3 Yes TMC8.CD79B.SPIB 0 9.50E-05 3 3 Yes CD3D.TMC8.CD79B 0.000612 0.000697 3 3 Yes CD3D.TMC8.SPIB -0.00053 -0.00041 3 3 Yes CD3D.CD79B -0.00016 8.45 E-05 2 3 Yes CD3D.SPIB -0.00058 -0.0008 2 3 Yes TMC8.CD79B 0.00038 0.000676 2 3 Yes TMC8.SPIB -0.00048 -0.00023 2 3 Yes LCK.CCT2.CD19.BLK -0.00846 -0.00441 4 3 No LCK.CD19.BLK -0.00838 -0.00536 3 3 No CCT2.CD19.BLK -0.00729 -0.00463 3 3 No LCK.CCT2.CD19 -0.00619 -0.00338 3 3 No LCK.CCT2.BLK -0.00043 -0.00016 3 3 Yes LCK.CD19 -0.00692 -0.00316 2 3 No LCK.BLK -0.00027 -8.45 E-05 2 3 Yes CCT2.CD19 -0.00605 -0.0017 2 3 No CCT2.BLK -0.00036 -0.00012 2 3 Yes CD3D.CD79B -0.00016 8.45 E-05 2 3 Yes CD3D.SPIB -0.00058 -0.0008 2 3 Yes CD3D.CD19 -0.00729 -0.00222 2 3 No CD3D.BLK -0.00058 -0.00034 2 3 Yes TMC8.CD79B 0.00038 0.000676 2 3 Yes TMC8.SPIB -0.00048 -0.00023 2 3 Yes TMC8.CD19 -0.00561 -0.00134 2 3 Mixed TMC8.BLK -0.00042 -0.0007 2 3 Yes LCK.CD79B -0.00073 -0.00045 2 3 Yes LCK.SPIB -0.00109 -0.00118 2 3 Yes LCK.CD19 -0.00692 -0.00316 2 3 No LCK.BLK -0.00027 -8.45 E-05 2 3 Yes CCT2.CD79B 0.000106 0.000116 2 3 Yes CCT2.SPIB -0.00057 -0.0007 2 3 Yes CCT2.CD19 -0.00605 -0.0017 2 3 No CCT2.BLK -0.00036 -0.00012 2 3 Yes Table 20 Markers Delta AUC Ridge Regression Delta AUC Logistic Regression Markers Term Type Predictive S100A12.CLEC4E. S100A8.RPL28 0 0 4 4 Original Yes S100A12.CLEC4E.RPL28 -0.00079 -0.00079 3 4 Original Yes S100A12.S100A8.RPL28 -0.00068 -0.00068 3 4 Original Yes CLEC4E.S100A8.RPL28 0.000528 0.000528 3 4 Original Yes S100A12.RPL28 -0.00166 -0.00166 2 4 Original Yes CLEC4E.RPL28 -0.00183 -0.00183 2 4 Original Yes S100A8.RPL28 0.000538 0.000538 2 4 Original Yes MMP9.ALOX5AP.NAMPT.SSRP1 -0.0003 -0.0003 4 4 Substitute Yes MMP9.ALOX5AP.SSRP1 -0.00082 -0.00082 3 4 Substitute Yes MMP9.NAMPT.SSRP1 -0.00052 -0.00052 3 4 Substitute Yes ALOX5AP.NAMPT.SSRP1 0.000169 0.000169 3 4 Substitute Yes MMP9.SSRP1 -0.00186 -0.00186 2 4 Substitute Yes ALOX5AP.SSRP1 -3.17E-05 -3.17 E-05 2 4 Substitute Yes NAMPT.SSRP1 -0.0002 -0.0002 2 4 Substitute Yes Table 21 Markers Delta AUC Ridge Regression Delta AUC Logistic Regression Markers Term Predictive S100A12.CLEC4E.S100AB.AQP9.NCF4 0 0 5 5 Yes S100A12.CLEC4E.AQP9.NCF4 -0.00021 0.000317 4 5 Yes S100A12.S100A8.AQP9.NCF4 -0.00173 -0.00269 4 5 Yes CLEC4E.S100A8.AQP9.NCF4 0.001014 0.001499 4 5 Yes S100A12.CLEC4E.S100A8.AQP9 -0.00091 -0.00105 4 5 Yes S100A12.CLEC4E.S100A8.NCF4 0.000348 -0.00013 4 5 Yes S100A12.AQP9.NCF4 -0.00249 -0.00298 3 5 Yes CLEC4E.AQP9.NCF4 -0.00016 -0.00042 3 5 Yes S100A12.CLEC4E.AQP9 -0.00103 -0.00073 3 5 Yes S100A12.CLEC4E.NCF4 0.000243 9.50E-05 3 5 Yes S100A8.AQP9.NCF4 -0.00108 -0.00207 3 5 Yes S100A12.S100A8.AQP9 -0.00226 -0.00336 3 5 Yes S100A12.S100A8.NCF4 -0.00141 -0.00262 3 5 Yes CLEC4E.S100A8.AQP9 3.17E-05 0.000338 3 5 Yes CLEC4E.S100A8.NCF4 0.000771 0.000813 3 5 Yes S100A12.AQP9 -0.0026 -0.00363 2 5 Yes S100A12.NCF4 -0.00227 -0.00284 2 5 Yes CLEC4E.AQP9 -0.00053 -0.0009 2 5 Yes CLEC4E.NCF4 -0.00024 -0.00076 2 5 Yes S100A8.AQP9 -0.00246 -0.00325 2 5 Yes S100A8.NCF4 -0.00091 -0.00302 2 5 Yes MMP9.ALOX5AP.NAMPT.GLT1D1.NCF2 -0.00325 -0.00535 5 5 Yes MMP9.ALOX5AP.GLT1D1.NCF2 -0.00498 -0.00693 4 5 No MMP9.NAMPT.GLT1D1.NCF2 -0.00311 -0.00518 4 5 Yes ALOX5AP.NAMPT.GLT1D1.NCF2 -0.00376 -0.0057 4 5 Yes MMP9.ALOX5AP.NAMPT.GLT1D1 -0.00339 -0.0054 4 5 Yes MMP9.ALOX5AP.NAMPT.NCF2 -0.00509 -0.00703 4 5 No MMP9.GLT1D1.NCF2 -0.00523 -0.0071 3 5 No ALOX5AP.GLT1D1.NCF2 -0.00402 -0.00594 3 5 Yes MMP9.ALOX5AP.GLT1D1 -0.00344 -0.00538 3 5 Yes MMP9.ALOX5AP.NCF2 -0.00488 -0.00691 3 5 No NAMPT.GLT1D1.NCF2 -0.00296 -0.00516 3 5 Yes MMP9.NAMPT.GLT1D1 -0.0033 -0.00529 3 5 Yes MMP9.NAMPT.NCF2 -0.00537 -0.00736 3 5 No ALOX5AP.NAMPT.GLT1D1 -0.00362 -0.00534 3 5 Yes ALOX5AP.NAMPT.NCF2 -0.0036 -0.0056 3 5 Yes MMP9.GLT1D1 -0.00518 -0.00711 2 5 No MMP9.NCF2 -0.00516 -0.00706 2 5 No ALOX5AP.GLT1D1 -0.00404 -0.00613 2 5 Yes ALOX5AP.NCF2 -0.00433 -0.00623 2 5 No NAMPT.GLT1D1 -0.00266 -0.00437 2 5 Yes NAMPT.NCF2 -0.00303 -0.00566 2 5 Yes S100A12.AQP9 -0.0026 -0.00363 2 5 Yes S100A12.NCF4 -0.00227 -0.00284 2 5 Yes S100A12.GLT1D1 -0.00245 -0.00356 2 5 Yes S100A12.NCF2 -0.00359 -0.00476 2 5 Yes CLEC4E.AQP9 -0.00053 -0.0009 2 5 Yes CLEC4E.NCF4 -0.00024 -0.00076 2 5 Yes CLEC4E.GLT1D1 -0.00023 -0.001 2 5 Yes CLEC4E.NCF2 -0.00113 -0.00249 2 5 Yes S100A8.AQP9 -0.00246 -0.00325 2 5 Yes S100A8.NCF4 -0.00091 -0.00302 2 5 Yes S100A8.GLT1D1 -0.00209 -0.00289 2 5 Yes S100A8.NCF2 -0.00297 -0.00497 2 5 Yes MMP9.AQP9 -0.00341 -0.00537 2 5 Yes MMP9.NCF4 -0.00317 -0.00544 2 5 Yes MMP9.GLT1D1 -0.00518 -0.00711 2 5 No MMP9.NCF2 -0.00516 -0.00706 2 5 No ALOX5AP.AQP9 -0.00481 -0.00669 2 5 No ALOX5AP.NCF4 -0.00386 -0.00645 2 5 Mixed ALOX5AP.GLT1D1 -0.00404 -0.00613 2 5 Yes ALOX5AP.NCF2 -0.00433 -0.00623 2 5 No NAMPT.AQP9 -0.00221 -0.00344 2 5 Yes NAMPT.NCF4 -0.00186 -0.00385 2 5 Yes NAMPT.GLT1D1 -0.00266 -0.00437 2 5 Yes NAMPT.NCF2 -0.00303 -0.00566 2 5 Yes Table 22 Markers Delta AUC Ridge Regression Delta AUC Logistic Regression Markers Term Predictive CASP5.IL18RAP.TNFAIP6.IL8RB.TNFRSF10C.KCNE3. TLR4 0 0 7 6 Yes CASP5.IL18RAP.IL8RB.TNFRSF10C.KCNE3.TLR4 -0.00726 -0.00732 6 6 Yes CASP5.TNFAIP6.IL8RB.TNFRSF10C.KCNE3.TLR4 -0.00772 -0.00773 6 6 Yes IL18RAP.TNFAIP6.IL8RB.TNFRSF10C.KCNE3.TLR4 0.00226 0.002999 6 6 Yes CASP5.IL18RAP.TNFAIP6.IL8RB.TNFRSF10C.KCNE3 -0.00147 -0.00101 6 6 Yes CASP5.IL18RAP.TNFAIP6.IL8RB.TNFRSF10C.TLR4 0.001077 0.001045 6 6 Yes CASP5.IL18RAP.TNFAIP6.IL8RB.KCNE3.TLR4 0.000644 0.000296 6 6 Yes CASP5.IL18RAP.TNFAIP6.TNFRSF10C.KCNE3.TLR4 -0.0012 -0.00038 6 6 Yes CASP5.IL8RB.TNFRSF10C.KCNE3.TLR4 -0.01475 -0.01514 5 6 Yes IL18RAP.IL8RB.TNFRSF10C.KCNE3.TLR4 -0.00966 -0.00894 5 6 Yes CASP5.IL18RAP.IL8RB.TNFRSF10C.KCNE3 -0.00788 -0.008 5 6 Yes CASP5.IL18RAP.IL8RB.TNFRSF10C.TLR4 -0.00707 -0.00668 5 6 Yes CASP5.IL18RAP.IL8RB.KCNE3.TLR4 -0.00706 -0.00693 5 6 Yes CASP5.IL18RAP.TNFRSF10C.KCNE3.TLR4 -0.00785 -0.00776 5 6 Yes TNFAIP6.IL8RB.TNFRSF10C.KCNE3.TLR4 -0.00696 -0.00669 5 6 Yes CASP5.TNFAIP6.IL8RB.TNFRSF10C.KCNE3 -0.00842 -0.0081 5 6 Yes CASP5.TNFAIP6.IL8RB.TNFRSF10C.TLR4 -0.00771 -0.00776 5 6 Yes CASP5.TNFAIP6.IL8RB.KCNE3.TLR4 -0.00722 -0.00741 5 6 Yes CASP5.TNFAIP6.TNFRSF10C.KCNE3.TLR4 -0.00815 -0.00809 5 6 Yes IL18RAP.TNFAIP6.IL8RB.TNFRSF10C.KCNE3 0.001066 0.00151 5 6 Yes IL18RAP.TNFAIP6.IL8RB.TNFRSF10C.TLR4 0.001795 0.003252 5 6 Yes IL18RAP.TNFAIP6.IL8RB.KCNE3.TLR4 0.002745 0.003822 5 6 Yes IL18RAP.TNFAIP6.TNFRSF10C.KCNE3.TLR4 0.001626 0.003305 5 6 Yes CASP5.IL18RAP.TNFAIP6.IL8RB.TNFRSF10C -0.00061 -0.00029 5 6 Yes CASP5.IL18RAP.TNFAIP6.IL8RB.KCNE3 -0.00103 1.06 E-05 5 6 Yes CASP5.IL18RAP.TNFAIP6.TNFRSF10C.KCNE3 -0.00291 -0.00322 5 6 Yes CASP5.IL18RAP.TNFAIP6.IL8RB.TLR4 0.002492 0.002714 5 6 Yes CASP5.IL18RAP.TNFAIP6.TNFRSF10C.TLR4 -0.0005 -0.00052 5 6 Yes CASP5.IL18RAP.TNFAIP6.KCNE3.TLR4 -0.00096 -0.0004 5 6 Yes CASP5.IL8RB.TNFRSF10C.KCNE3 -0.01477 -0.01564 4 6 Yes CASP5.IL8RB.TNFRSF10C.TLR4 -0.01456 -0.01506 4 6 Yes CASP5.IL8RB.KCNE3.TLR4 -0.01438 -0.01466 4 6 Yes CASP5.TNFRSF10C.KCNE3.TLR4 -0.01449 -0.01482 4 6 Yes IL18RAP.IL8RB.TNFRSF10C.KCNE3 -0.00979 -0.00959 4 6 Yes IL18RAP.IL8RB.TNFRSF10C.TLR4 -0.00982 -0.00881 4 6 Yes IL18RAP.IL8RB.KCNE3.TLR4 -0.00926 -0.00856 4 6 Yes IL18RAP.TNFRSF10C.KCNE3.TLR4 -0.00952 -0.00899 4 6 Yes CASP5.IL18RAP.IL8RB.TNFRSF10C -0.00777 -0.00745 4 6 Yes CASP5.IL18RAP.IL8RB.KCNE3 -0.00763 -0.00746 4 6 Yes CASP5.IL18RAP.TNFRSF10C.KCNE3 -0.00871 -0.00871 4 6 Yes CASP5.IL18RAP.IL8RB.TLR4 -0.00598 -0.00571 4 6 Yes CASP5.IL18RAP.TNFRSF10C.TLR4 -0.00733 -0.00724 4 6 Yes CASP5.IL18RAP.KCNE3.TLR4 -0.00755 -0.00775 4 6 Yes TNFAIP6.IL8RB.TNFRSF10C.KCNE3 -0.00715 -0.00729 4 6 Yes TNFAIP6.IL8RB.TNFRSF10C.TLR4 -0.00744 -0.00638 4 6 Yes TNFAIP6.IL8RB.KCNE3.TLR4 -0.00641 -0.00627 4 6 Yes TNFAIP6.TNFRSF10C.KCNE3.TLR4 -0.00668 -0.00641 4 6 Yes CASP5.TNFAIP6.IL8RB.TNFRSF10C -0.00867 -0.0087 4 6 Yes CASP5.TNFAIP6.IL8RB.KCNE3 -0.00781 -0.00814 4 6 Yes CASP5.TNFAIP6.TNFRSF10C.KCNE3 -0.00926 -0.00908 4 6 Yes CASP5.TNFAIP6.IL8RB.TLR4 -0.0068 -0.00666 4 6 Yes CASP5.TNFAIP6.TNFRSF10C.TLR4 -0.00852 -0.00834 4 6 Yes CASP5.TNFAIP6.KCNE3.TLR4 -0.00793 -0.00791 4 6 Yes IL18RAP.TNFAIP6.IL8RB.TNFRSF10C -6.34E-05 0.000813 4 6 Yes IL18RAP.TNFAIP6.IL8RB.KCNE3 0.001542 0.002175 4 6 Yes IL18RAP.TNFAIP6.TNFRSF10C.KCNE3 0.000285 0.00057 4 6 Yes IL18RAP.TNFAIP6.IL8RB.TLR4 0.003347 0.004878 4 6 Yes IL18RAP.TNFAIP6.TNFRSF10C.TLR4 0.001594 0.002502 4 6 Yes IL18RAP.TNFAIP6.KCNE3.TLR4 0.001795 0.002566 4 6 Yes CASP5.IL18RAP.TNFAIP6.IL8RB -0.00015 0.001193 4 6 Yes CASP5.IL18RAP.TNFAIP6.TNFRSF10C -0.00385 -0.00361 4 6 Yes CASP5.IL18RAP.TNFAIP6.KCNE3 -0.00364 -0.0031 4 6 Yes CASP5.IL18RAP.TNFAIP6.TLR4 -0.00058 -0.00041 4 6 Yes CASP5.IL8RB.TNFRSF10C -0.01523 -0.01583 3 6 Yes CASP5.IL8RB.KCNE3 -0.01468 -0.01507 3 6 Yes CASP5.TNFRSF10C.KCNE3 -0.01494 -0.01568 3 6 Yes CASP5.IL8RB.TLR4 -0.01426 -0.01487 3 6 Yes CASP5.TNFRSF10C.TLR4 -0.01482 -0.0152 3 6 Yes CASP5.KCNE3.TLR4 -0.01459 -0.01474 3 6 Yes IL18RAP.IL8RB.TNFRSF10C -0.01037 -0.00964 3 6 Yes IL18RAP.IL8RB.KCNE3 -0.01 -0.00946 3 6 Yes IL18RAP.TNFRSF10C.KCNE3 -0.01029 -0.00963 3 6 Yes IL18RAP.IL8RB.TLR4 -0.00926 -0.00805 3 6 Yes IL18RAP.TNFRSF10C.TLR4 -0.00991 -0.0089 3 6 Yes IL18RAP.KCNE3.TLR4 -0.0091 -0.00833 3 6 Yes CASP5.IL18RAP.IL8RB -0.00718 -0.00648 3 6 Yes CASP5.IL18RAP.TNFRSF10C -0.00915 -0.00916 3 6 Yes CASP5.IL18RAP.KCNE3 -0.00891 -0.00872 3 6 Yes CASP5.IL18RAP.TLR4 -0.00688 -0.00775 3 6 Yes TNFAIP6.IL8RB.TNFRSF10C -0.00786 -0.00752 3 6 Yes TNFAIP6.IL8RB.KCNE3 -0.00686 -0.00644 3 6 Yes TNFAIP6.TNFRSF10C.KCNE3 -0.00771 -0.00749 3 6 Yes TNFAIP6.IL8RB.TLR4 -0.00668 -0.0056 3 6 Yes TNFAIP6.TNFRSF10C.TLR4 -0.00765 -0.0068 3 6 Yes TNFAIP6.KCNE3.TLR4 -0.00623 -0.00608 3 6 Yes CASP5.TNFAIP6.IL8RB -0.0079 -0.00708 3 6 Yes CASP5.TNFAIP6.TNFRSF10C -0.00996 -0.00988 3 6 Yes CASP5.TNFAIP6.KCNE3 -0.00935 -0.00929 3 6 Yes CASP5.TNFAIP6.TLR4 -0.00745 -0.00787 3 6 Yes IL18RAP.TNFAIP6.IL8RB 0.000549 0.00189 3 6 Yes IL18RAP.TNFAIP6.TNFRSF10C -0.00174 -0.00122 3 6 Yes IL18RAP.TNFAIP6.KCNE3 -0.00038 0.00037 3 6 Yes IL18RAP.TNFAIP6.TLR4 0.001552 0.002249 3 6 Yes CASP5.IL8RB -0.01498 -0.01537 2 6 Yes CASP5.TNFRSF10C -0.01527 -0.01602 2 6 Yes CASP5.KCNE3 -0.01471 -0.0152 2 6 Yes CASP5.TLR4 -0.01426 -0.01449 2 6 Yes IL18RAP.IL8RB -0.00983 -0.00922 2 6 Yes IL18RAP.TNFRSF10C -0.01126 -0.01029 2 6 Yes IL18RAP.KCNE3 -0.0097 -0.01001 2 6 Yes IL18RAP.TLR4 -0.00878 -0.00829 2 6 Yes TNFAIP6.IL8RB -0.00724 -0.00667 2 6 Yes TNFAIP6.TNFRSF10C -0.00924 -0.00868 2 6 Yes TNFAIP6.KCNE3 -0.00752 -0.00694 2 6 Yes TNFAIP6.TLR4 -0.00663 -0.00632 2 6 Yes H3F3B.TXN.PLAUR.BCL2A1.PTAFR.LAMP2.TYROBP -0.01883 -0.01929 7 6 Yes H3F3B.TXN.BCL2A1.PTAFR.LAMP2.TYROBP -0.01979 -0.02006 6 6 Yes H3F3B.PLAUR.BCL2A1.PTAFR.LAMP2.TYROBP -0.01852 -0.01892 6 6 Yes TXN.PLAUR.BCL2A1.PTAFR.LAMP2.TYROBP -0.01845 -0.01856 6 6 Yes H3F3B.TXN.PLAUR.BCL2A1.PTAFR.LAMP2 -0.01891 -0.01913 6 6 Yes H3F3B.TXN.PLAUR.BCL2A1.PTAFR.TYROBP -0.01909 -0.01945 6 6 Yes H3F3B.TXN.PLAUR.BCL2A1.LAMP2.TYROBP -0.01989 -0.02008 6 6 Yes H3F3B.TXN.PLAUR.PTAFR.LAMP2.TYROBP -0.01823 -0.01798 6 6 Yes H3F3B.BCL2A1.PTAFR.LAMP2.TYROBP -0.01985 -0.01997 5 6 Yes TXN.BCL2A1.PTAFR.LAMP2.TYROBP -0.01978 -0.0199 5 6 Yes H3F3B.TXN.BCL2A1.PTAFR.LAMP2 -0.0195 -0.01968 5 6 Yes H3F3B.TXN.BCL2A1.PTAFR.TYROBP -0.02001 -0.02022 5 6 Yes H3F3B.TXN.BCL2A1.LAMP2.TYROBP -0.02077 -0.02088 5 6 No H3F3B.TXN.PTAFR.LAMP2.TYROBP -0.01929 -0.01949 5 6 Yes PLAUR.BCL2A1.PTAFR.LAMP2.TYROBP -0.0192 -0.0192 5 6 Yes H3F3B.PLAUR.BCL2A1.PTAFR.LAMP2 -0.01879 -0.01932 5 6 Yes H3F3B.PLAUR.BCL2A1.PTAFR.TYROBP -0.01904 -0.0194 5 6 Yes H3F3B.PLAUR.BCL2A1.LAMP2.TYROBP -0.01934 -0.01953 5 6 Yes H3F3B.PLAUR.PTAFR.LAMP2.TYROBP -0.01801 -0.01798 5 6 Yes TXN.PLAUR.BCL2A1.PTAFR.LAMP2 -0.01863 -0.01884 5 6 Yes TXN.PLAUR.BCL2A1.PTAFR.TYROBP -0.01971 -0.01955 5 6 Yes TXN.PLAUR.BCL2A1.LAMP2.TYROBP -0.01923 -0.01932 5 6 Yes TXN.PLAUR.PTAFR.LAMP2.TYROBP -0.01834 -0.01792 5 6 Yes H3F3B.TXN.PLAUR.BCL2A1.PTAFR -0.01945 -0.01958 5 6 Yes H3F3B.TXN.PLAUR.BCL2A1.LAMP2 -0.01999 -0.02012 5 6 Yes H3F3B.TXN.PLAUR.PTAFR.LAMP2 -0.01816 -0.01784 5 6 Yes H3F3B.TXN.PLAUR.BCL2A1.TYROBP -0.02038 -0.02064 5 6 Yes H3F3B.TXN.PLAUR.PTAFR.TYROBP -0.01949 -0.0195 5 6 Yes H3F3B.TXN.PLAUR.LAMP2.TYROBP -0.01904 -0.01909 5 6 Yes H3F3B.BCL2A1.PTAFR.LAMP2 -0.01974 -0.02007 4 6 Yes H3F3B.BCL2A1.PTAFR.TYROBP -0.01984 -0.02014 4 6 Yes H3F3B.BCL2A1.LAMP2.TYROBP -0.01983 -0.02014 4 6 Yes H3F3B.PTAFR.LAMP2.TYROBP -0.01896 -0.01932 4 6 Yes TXN.BCL2A1.PTAFR.LAMP2 -0.01948 -0.01943 4 6 Yes TXN.BCL2A1.PTAFR.TYROBP -0.02009 -0.02005 4 6 Yes TXN.BCL2A1.LAMP2.TYROBP -0.02014 -0.02012 4 6 Yes TXN.PTAFR.LAMP2.TYROBP -0.01931 -0.01992 4 6 Yes H3F3B.TXN.BCL2A1.PTAFR -0.02017 -0.02014 4 6 Yes H3F3B.TXN.BCL2A1.LAMP2 -0.02053 -0.02056 4 6 No H3F3B.TXN.PTAFR.LAMP2 -0.01819 -0.01867 4 6 Yes H3F3B.TXN.BCL2A1.TYROBP -0.02078 -0.02122 4 6 No H3F3B.TXN.PTAFR.TYROBP -0.02018 -0.02033 4 6 Yes H3F3B.TXN.LAMP2.TYROBP -0.01999 -0.02022 4 6 Yes PLAUR.BCL2A1.PTAFR.LAMP2 -0.0192 -0.01915 4 6 Yes PLAUR.BCL2A1.PTAFR.TYROBP -0.01966 -0.02001 4 6 Yes PLAUR.BCL2A1.LAMP2.TYROBP -0.01947 -0.01983 4 6 Yes PLAUR.PTAFR.LAMP2.TYROBP -0.01847 -0.01839 4 6 Yes H3F3B.PLAUR.BCL2A1.PTAFR -0.01925 -0.01924 4 6 Yes H3F3B.PLAUR.BCL2A1.LAMP2 -0.01962 -0.01999 4 6 Yes H3F3B.PLAUR.PTAFR.LAMP2 -0.01779 -0.01779 4 6 Yes H3F3B.PLAUR.BCL2A1.TYROBP -0.01978 -0.02003 4 6 Yes H3F3B.PLAUR.PTAFR.TYROBP -0.01903 -0.01932 4 6 Yes H3F3B.PLAUR.LAMP2.TYROBP -0.01835 -0.01842 4 6 Yes TXN.PLAUR.BCL2A1.PTAFR -0.01895 -0.0189 4 6 Yes TXN.PLAUR.BCL2A1.LAMP2 -0.01947 -0.01941 4 6 Yes TXN.PLAUR.PTAFR.LAMP2 -0.01748 -0.01746 4 6 Yes TXN.PLAUR.BCL2A1.TYRBP -0.02086 -0.02136 4 6 No TXN.PLAUR.PTAFR.TYROBP -0.01936 -0.01917 4 6 Yes TXN.PLAUR.LAMP2.TYROBP -0.01876 -0.01874 4 6 Yes H3F3B.TXN.PLAUR.BCL2A1 -0.02057 -0.02098 4 6 No H3F3B.TXN.PLAUR.PTAFR -0.0182 -0.01799 4 6 Yes H3F3B.TXN.PLAUR.LAMP2 -0.0185 -0.0186 4 6 Yes H3F3B.TXN.PLAUR.TYROBP -0.02026 -0.02086 4 6 Yes H3F3B.BCL2A1.PTAFR -0.0199 -0.02011 3 6 Yes H3F3B.BCL2A1.LAMP2 -0.02034 -0.02054 3 6 Yes H3F3B.PTAFR.LAMP2 -0.01899 -0.01887 3 6 Yes H3F3B.BCL2A1.TYROBP -0.02078 -0.02105 3 6 No H3F3B.PTAFR.TYROBP -0.02001 -0.02029 3 6 Yes H3F3B.LAMP2.TYROBP -0.01974 -0.02007 3 6 Yes TXN.BCL2A1.PTAFR -0.01986 -0.01992 3 6 Yes TXN.BCL2A1.LAMP2 -0.01978 -0.02016 3 6 Yes TXN.PTAFR.LAMP2 -0.01891 -0.01887 3 6 Yes TXN.BCL2A1.TYROBP -0.02107 -0.02132 3 6 No TXN.PTAFR.TYROBP -0.02 -0.02024 3 6 Yes TXN.LAMP2.TYROBP -0.01962 -0.02003 3 6 Yes H3F3B.TXN.BCL2A1 -0.0211 -0.02123 3 6 No H3F3B.TXN.PTAFR -0.01906 -0.01911 3 6 Yes H3F3B.TXN.LAMP2 -0.0193 -0.01958 3 6 Yes H3F3B.TXN.TYROBP -0.0212 -0.02144 3 6 No PLAUR.BCL2A1.PTAFR -0.01948 -0.01956 3 6 Yes PLAUR.BCL2A1.LAMP2 -0.01952 -0.0198 3 6 Yes PLAUR.PTAFR.LAMP2 -0.01797 -0.01784 3 6 Yes PLAUR.BCL2A1.TYROBP -0.02012 -0.02041 3 6 Yes PLAUR.PTAFR.TYROBP -0.01907 -0.01933 3 6 Yes PLAUR.LAMP2.TYROBP -0.01889 -0.01879 3 6 Yes H3F3B.PLAUR.BCL2A1 -0.02017 -0.02029 3 6 Yes H3F3B.PLAUR.PTAFR -0.01819 -0.01819 3 6 Yes H3F3B.PLAUR.LAMP2 -0.01851 -0.01851 3 6 Yes H3F3B.PLAUR.TYROBP -0.01981 -0.01982 3 6 Yes TXN.PLAUR.BCL2A1 -0.02091 -0.02139 3 6 No TXN.PLAUR.PTAFR -0.01811 -0.01817 3 6 Yes TXN.PLAUR.LAMP2 -0.01777 -0.01807 3 6 Yes TXN.PLAUR.TYROBP -0.02058 -0.02118 3 6 No H3F3B.BCL2A1 -0.02045 -0.02078 2 6 No H3F3B.PTAFR -0.01928 -0.0197 2 6 Yes H3F3B.LAMP2 -0.01952 -0.01982 2 6 Yes H3F3B.TYROBP -0.02049 -0.02082 2 6 No TXN.BCL2A1 -0.02134 -0.02159 2 6 No TXN.PTAFR -0.01891 -0.01933 2 6 Yes TXN.LAMP2 -0.01943 -0.0199 2 6 Yes TXN.TYROBP -0.02144 -0.02172 2 6 No PLAUR.BCL2A1 -0.0202 -0.02062 2 6 Yes PLAUR.PTAFR -0.01811 -0.01813 2 6 Yes PLAUR.LAMP2 -0.01833 -0.01797 2 6 Yes PLAUR.TYROBP -0.01995 -0.02038 2 6 Yes CASP5.IL8RB1 -0.01498 -0.01537 2 6 Yes CASP5.TNFRSF10C1 -0.01527 -0.01602 2 6 Yes CASP5.KCNE31 -0.01471 -0.0152 2 6 Yes CASP5.TLR41 -0.01426 -0.01449 2 6 Yes CASP5.BCL2A1 -0.01551 -0.016 2 6 Yes CASP5.PTAFR -0.01515 -0.01538 2 6 Yes CASP5.LAMP2 -0.0153 -0.01552 2 6 Yes CASP5.TYROBP -0.01642 -0.01626 2 6 Yes IL18RAP.IL8RB1 -0.00983 -0.00922 2 6 Yes IL18RAP.TNFRSF10C1 -0.01126 -0.01029 2 6 Yes IL18RAP.KCNE31 -0.0097 -0.01001 2 6 Yes IL18RAP.TLR41 -0.00878 -0.00829 2 6 Yes IL18RAP.BCL2A1 -0.01217 -0.01143 2 6 Yes IL18RAP.PTAFR -0.01153 -0.01101 2 6 Yes IL18RAP.LAMP2 -0.01012 -0.00998 2 6 Yes IL18RAP.TYROBP -0.01198 -0.01196 2 6 Yes TNFAIP6.IL8RB1 -0.00724 -0.00667 2 6 Yes TNFAIP6.TNFRSF10C1 -0.00924 -0.00868 2 6 Yes TNFAIP6.KCNE31 -0.00752 -0.00694 2 6 Yes TNFAIP6.TLR41 -0.00663 -0.00632 2 6 Yes TNFAIP6.BCL2A1 -0.0102 -0.0097 2 6 Yes TNFAIP6.PTAFR -0.00952 -0.00906 2 6 Yes TNFAIP6.LAMP2 -0.00845 -0.00774 2 6 Yes TNFAIP6.TYROBP -0.01093 -0.0105 2 6 Yes H3F3B.IL8RB -0.0199 -0.02009 2 6 Yes H3F3B.TNFRSF10C -0.01956 -0.01973 2 6 Yes H3F3B.KCNE3 -0.01699 -0.0169 2 6 Yes H3F3B.TLR4 -0.01707 -0.01722 2 6 Yes H3F3B.BCL2A1 -0.02045 -0.02078 2 6 No H3F3B.PTAFR -0.01928 -0.0197 2 6 Yes H3F3B.LAMP2 -0.01952 -0.01982 2 6 Yes H3F3B.TYROBP -0.02049 -0.02082 2 6 No TXN.IL8RB -0.02074 -0.02073 2 6 No TXN.TNFRSF10C -0.02084 -0.02143 2 6 No TXN.KCNE3 -0.01775 -0.01731 2 6 Yes TXN.TLR4 -0.01782 -0.01819 2 6 Yes TXN.BCL2A1 -0.02134 -0.02159 2 6 No TXN.PTAFR -0.01891 -0.01933 2 6 Yes TXN.LAMP2 -0.01943 -0.0199 2 6 Yes TXN.TYROBP -0.02144 -0.02172 2 6 No PLAUR.IL8RB -0.01926 -0.0191 2 6 Yes PLAUR.TNFRSF10C -0.01955 -0.01981 2 6 Yes PLAUR.KCNE3 -0.01482 -0.01437 2 6 Yes PLAUR.TLR4 -0.0171 -0.01682 2 6 Yes PLAUR.BCL2A1 -0.0202 -0.02062 2 6 Yes PLAUR.PTAFR -0.01811 -0.01813 2 6 Yes PLAUR.LAMP2 -0.01833 -0.01797 2 6 Yes PLAUR.TYROBP -0.01995 -0.02038 2 6 Yes Table 23 Markers Delta AUC Ridge Regression Delta AUC Logistic Regression Makers Term Predictive CD3D.TMC8.SLAMF7.KLRC4 0 0 4 7 Yes CD3D.SLAMF7.KLRC4 -6.34E-05 1.06 E-05 3 7 Yes TMC8.SLAMF7.KLRC4 -0.00094 -0.00103 3 7 Yes CD3D.TMC8.SLAMF7 0.003432 0.004065 3 7 Yes CD3D.TMC8.KLRC4 -0.00269 -0.00335 3 7 Yes CD3D.SLAMF7 0.00226 0.002766 2 7 Yes CD3D.KLRC4 -0.0027 -0.00332 2 7 Yes TMC8.SLAMF7 0.001594 0.001827 2 7 Yes TMC8.KLRC4 -0.00351 -0.00365 2 7 Yes LCK.CCT2.CX3CR1.CD8A -0.01192 -0.01099 4 7 No LCK.CX3CR1.CD8A -0.01192 -0.01143 3 7 No CCT2.CX3CR1.CD8A -0.01192 -0.01216 3 7 No LCK.CCT2.CX3CR1 -0.00644 -0.00646 3 7 Yes LCK.CCT2.CD8A -0.01323 -0.01304 3 7 No LCK.CX3CR1 -0.00687 -0.00729 2 7 Yes LCK.CD8A -0.01382 -0.01289 2 7 No CCT2.CX3CR1 -0.00646 -0.0061 2 7 Yes CCT2.CD8A -0.01287 -0.01253 2 7 No CD3D.SLAMF7 0.00226 0.002766 2 7 Yes CD3D.KLRC4 -0.0027 -0.00332 2 7 Yes CD3D.CX3CR1 -0.00589 -0.00615 2 7 Yes CD3D.CD8A -0.01374 -0.01231 2 7 No TMC8.SLAMF7 0.001594 0.001827 2 7 Yes TMC8.KLRC4 -0.00351 -0.00365 2 7 Yes TMC8.CX3CR1 -0.00572 -0.00602 2 7 Yes TMC8.CD8A -0.01199 -0.01121 2 7 No LCK.SLAMF7 0.000116 0.000285 2 7 Yes LCK.KLRC4 -0.00436 -0.0045 2 7 Yes LCK.CX3CR1 -0.00687 -0.00729 2 7 Yes LCK.CD8A -0.01382 -0.01289 2 7 No CCT2.SLAMF7 0.001795 0.002154 2 7 Yes CCT2.KLRC4 -0.00403 -0.00408 2 7 Yes CCT2.CX3CR1 -0.00646 -0.0061 2 7 Yes CCT2.CD8A -0.01287 -0.01253 2 7 No Table 24: Clinical and Demographic Characteristics of the Final Development and Validation Patient Sets1 Development Validation Characteristic Obstructive CAD2 (N=230) No Obstructive CAD (N=410) P-value Obstructive CAD (N=192) No Obstructive CAD (N=334) P-value Age, mean (SD), y 63.7 (11.1) 57.2 (11.8) <0.001 64.7 (9.8) 57.7 (11.7) <0.001 Men, No. (%) 180 (78.3%) 193 (47.1%) <0.001 134(69.8%) 165 (49.4%) <0.001 Chest pain type <0.001 <0.001 Typical 61 (26.5%) 66 (16.1%) 42 (21.9%) 41 (12.3%) Atypical 28 (12.2%) 56 (13.7%) 42 (21.9%) 49 (14.7%) Non-cardiac 47 (20.4%) 137 (33.4%) 50 (26.0%) 134 (40.1%) None 91 (39.6%) 143 (34.9%) 58 (30.2%) 109 (32.6%) Blood pressure, mean (SD), mm Hg Systolic 138 (17.7) 133 (18.3) <0.001 140 (17.7) 132(18.1) <0.001 Diastolic 79.7 (11.0) 79.6(11.7) 0.94 79.2(11.3) 77.5 (10.9) 0.09 Hypertension 163 (70.9%) 237 (57.8%) 0.002 142 (74.0%) 203 (60.8%) 0.001 Dyslipidemia 170 (73.9%) 225 (54.9%) <0.001 133 (69.3%) 208 (62.3%) 0.11 Curent smoking 53 (23.2%) 99 (24.3%) 0.75 38 (19.8%) 68 (20.4%) 0.70 BMI, mean (SD), kg/m2 30.5 (6.0) 31.0 (7.5) 0.35 29.8 (5.5) 31.3 (7.0) 0.01 Ethnicity, White not Hispanic 210 (91.3%) 347 (84.6%) 0.016 181 (94.3%) 293 (87.7%) 0.02 Clinical syndrome Stable angina 123 (53.5%) 214 (52.2%) 0.78 107 (55.7%) 176 (52.7%) 0.46 Unstable angina 35 (15.2%) 81 (19.8%) 0.15 31 (16.1%) 58 (17.4%) 0.74 Asymptomatic, high risk 72 (31.3%) 113(27.6%) 0.32 53 (27.6%) 100 (29.9%) 0.60 Medications Aspirin and salicylates 153 (66.5%) 232 (56.6%) 0.03 139 (72.4%) 205 (61.4%) 0.01 Statins 109 (47.4%) 142 (34.6%) 0.003 93 (48.4%) 127 (38.0%) 0.02 Beta blockers 82 (35.7%) 133 (32.4%) 0.52 85 (44.3%) 124 (37.1%) 0.11 ACE inhibitors 57 (24.8%) 67 (16.3%) 0.01 47 (24.5%) 64 (19.2%) 0.16 Angiotensin receptor blockers 29 (12.6%) 39 (9.5%) 0.26 18 (9.4%) 34 (10.2%) 0.76 Calcium channel blockers 33 (14.3%) 46 (11.2%) 0.29 26 (13.5%) 34 (10.2%) 0.25 Antiplatelet agents 27 (11.7%) 21 (5.1%) 0.003 16 (8.3%) 17 (5.1%) 0.14 Steroids, not systemic 23 (10.0%) 33 (8.0%) 0.45 19 (9.9%) 38(11.4%) 0.59 NSAIDS 47 (20.4%) 78 (19.0%) 0.76 30 (15.6%) 58 (17.4%) 0.60 1Characteristics of the 640 subjects in the Algorithm Development and 526 subjects in the Validation sets. P values were calculated by t-tests for continuous variables and using chi-square tests for discrete variables. Significant p values in both sets are bolded and underlined and are bolded if significant in single sets. 2Obstructive CAD is defined as >50% luminal stenosis in > 1 major vessel by QCA. Table 25A: Reclassification analysis of Gene Expression Algorithm with Diamond-Forrester Clinical Model With Gene Expression Algorithm Total Reclassified % Low Int. High Lower Higher Total D-F Low Risk Patients included 118 96 38 252 0.0 15.1 15.1 Disease pts 16 19 22 57 0.0 38.6 38.6 Non disease pts 102 77 16 195 0.0 8.2 8.2 Observed risk 14% 20% 58% 23% -- -- -- D-F Int Risk Patients included 28 21 47 96 29.2 49.0 78.1 Disease pts 7 11 26 44 15.9 59.1 75.0 Non disease pts 21 10 21 52 40.4 40.4 80.8 Observed risk 25% 52% 55% 46% -- -- -- D-F High Risk Patients included 28 60 89 177 15.8 0.0 15.8 Disease pts 6 29 56 91 6.6 0.0 6.6 Non disease pts 22 31 33 86 38.4 0.0 38.4 Observed risk 21% 48% 63% 51% -- -- -- Total Patients included 174 77 174 525 Disease pts 29 59 104 192 Non disease pts 145 118 70 333 Observed risk 17% 33% 60% 37% Risk categories: : Low = 0-<20%, Intermediate = ≥20-50%, High = ≥50%. Classification improved in 18.2% of disease patients and improved in 1.8% of non disease patients for a net reclassification improvement of 20.0% (p<.001) Table 25B: Reclassification analysis of Gene Expression Algorithm with MPI Results With Gene Expression Algorithm Total Reclassified % Low Int. High Lower Higher Total MPI Negative Patients included 41 31 15 87 0.0 17.4 17.4 Disease pts 7 8 7 22 0.0 31.8 31.8 Non disease pts 34 23 8 65 0.0 12.3 12.3 Observed risk 17% 26% 47% 25% -- -- -- MPI Positive Patients included 57 78 88 223 25.6 0.0 25.6 Disease pts 6 21 49 76 7.9 0.0 7.9 Non disease pts 51 57 39 147 34.7 0.0 34.7 Observed risk 11% 27% 56% 34% -- -- -- Total Patients induded 98 109 103 310 Disease pts 13 29 56 98 Non disease pts 85 80 47 212 Observed risk 13% 27% 54% 32% Risk categories: : Low = 0-<20%, Intermediate = ≥20-50%, High = ≥50%. Classification improved in 1.0% of disease patients and improved in 20.3% of non disease patients for a net reclassification improvement of 21.3% (p<.001) SEQUENCE LISTING Primers and Probes Assay ID Symbol Forward Primer Reverse Primer Probe CDXR072&SP1 AF289562 


CDXR0868-SP1 AQP9 


CDXR0830-SP1 CASP5 


CDXR0884-SP2 CD79B 
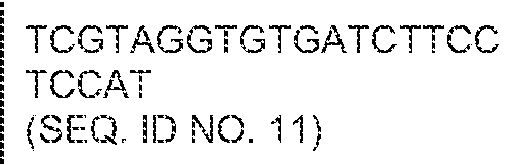

CDXR0863-SP1 CLEC4E 


CDXR0080-SP1 IL18RAP 


CDXR0832-SP1 IL8RB 


CDXR0888-SPO KCNE3 


CDXR0861-SP1 KLRC4 


CDXR082&SP1 NCF4 


CDXR0056P1-SP1 S100A12 


CDXR0069P1-SP1 S100A8 


CDXRO663-SP1 SLAMF7 


CDXR0840-SP1 SPIB GAGGCCCTCGTGGCT (SEQ. ID NO. 40) TGGTACAGGCGCAGCTT (SEQ. ID NO. 41) 
CDXR0672-SP1 TFCP2 


CDXR0891-SPO TLR4 
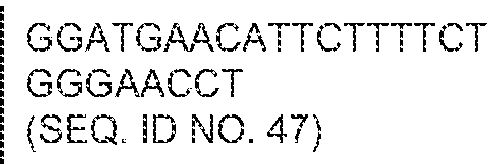

CDXR0876-SP1 TMC8 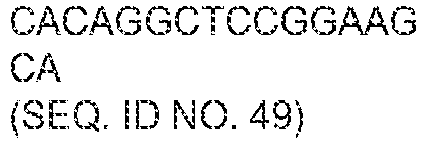
CGCGACAGGTCCTCCAC (SEQ. ID NO. 50) 
CDXR0857-SP1 TNFAIP6 


CDXR0844-SP1 TNFRSF10C 


CDXR0121-SP1 AF161365 


CDXR0703-SP1 HNRPF 


A23P208358-188 RPL28 


Claims (23)
- A computer-implemented method for predicting coronary artery disease (CAD) by scoring a sample obtained from a subject, comprising:obtaining a dataset associated with the sample, wherein the dataset comprises a quantitative expression level value for each marker in at least one term selected from the group consisting of term 1, term 2, term 3, term 4, term 5, term 6, and term 7;wherein term 1 comprises marker 1, marker 2, and marker 3, wherein marker 1 comprises GenBank accession number AF161365, wherein marker 2 comprises HNRPF or ACBD5, and wherein marker 3 comprises TFCP2 or DDX18;wherein term 2 comprises marker 4, marker 5, and marker 6, wherein marker 4 comprises AF289562 or CD248, wherein marker 5 comprises HNRPF or ACBD5, and wherein marker 6 comprises TFCP2 or DDX18;wherein term 3 comprises marker 7, marker 8, marker 9, and marker 10 wherein marker 7 comprises CD79B or CD19, wherein marker 8 comprises SPIB or BLK, wherein marker 9 comprises CD3D or LCK, and wherein marker 10 comprises TMC8 or CCT2;wherein term 4 comprises marker 11, marker 12, marker 13, and marker 14, wherein marker 11 comprises S100A12 or MMP9, wherein marker 12 comprises CLEC4E or ALOX5AP, wherein marker 13 comprises S100A8 or NAMPT, and wherein marker 14 comprises RPL28 or SSRP1;wherein term 5 comprises marker 15, marker 16, marker 17, marker 18, and marker 19, wherein marker 15 comprises S100A12 or MMP9, wherein marker 16 comprises CLEC4E or ALOX5AP, wherein marker 17 comprises S100A8 or NAMPT, wherein marker 18 comprises AQP9 or GLT1D1, and wherein marker 19 comprises NCF4 or NCF2;wherein term 6 comprises marker 20, marker 21, marker 22, marker 23, marker 24, marker 25, and marker 26, wherein marker 20 comprises CASP5 or H3F3B, wherein marker 21 comprises IL18RAP or TXN, wherein marker 22 comprises TNFAIP6 or PLAUR, wherein marker 23 comprises IL8RB or BCL2A1, wherein marker 24 comprises TNFRSF10C or PTAFR, wherein marker 25 comprises KCNE3 or LAMP2, and wherein marker 26 comprises TLR4 or TYROBP; andwherein term 7 comprises marker 27, marker 28, marker 29, and marker 30, wherein marker 27 comprises SLAMF7 or CX3CR1, wherein marker 28 comprises KLRC4 or CD8A, wherein marker 29 comprises CD3D or LCK, and wherein marker 30 comprises TMC8 or CCT2; anddetermining, by a computer processor, a score from the dataset using an interpretation function,wherein a higher score relative to a control having less than 50% stenosis in all major vessels indicates that the subject has a higher likelihood of CAD.
- The method of claim 1, wherein the dataset comprises a quantitative expression level value for each marker in term 1, term 2, term 3, term 4, term 5, term 6, and term 7.
- The method of claim 1, wherein the interpretation function is based on a predictive model.
- The method of claim 3, wherein the dataset further comprises at least one clinical factor, wherein the at least one clinical factor is optionally selected from the group consisting of: age, gender, chest pain type, neutrophil count, ethnicity, disease duration, diastolic blood pressure, systolic blood pressure, a family history parameter, a medical history parameter, a medical symptom parameter, height, weight, a body-mass index, resting heart rate, and smoker/non-smoker status.
- The method of claim 4, wherein the at least one clinical factor is age and gender.
- The method of claim 3, wherein the predictive model is selected from the group consisting of a partial least squares model, a logistic regression model, a linear regression model, a linear discriminant analysis model, a ridge regression model, and a tree-based recursive partitioning model.
- The method of claim 1, wherein obtaining the dataset associated with the sample comprises either:obtaining the sample and processing the sample to experimentally determine the dataset; orreceiving the dataset from a third party that has processed the sample to experimentally determine the dataset.
- The method of claim 1, wherein the sample comprises RNA extracted from peripheral blood cells.
- The method of claim 1, wherein the quantitative expression level values are derived from either hybridization data or polymerase chain reaction data.
- The method of claim 1, wherein the dataset is obtained stored on a storage memory.
- A computer-implemented method for scoring a sample obtained from a subject, comprising:obtaining a dataset associated with the sample, wherein the dataset comprises at least one clinical factor and quantitative expression level values for at least two markers selected from the group consisting of GenBank accession number AF161365, HNRPF, ACBD5, TFCP2, DDX18, GenBank accession number AF289562, CD248, CD79B, CD19, SPIB, BLK, CD3D, LCK, TMC8, CCT2, S100A12, MMP9, CLEC4E, ALOX5AP, S100A8, NAMPT, RPL28, SSRP1, AQP9, GLT1D1, NCF4, NCF2, CASP5, H3F3B, IL18RAP, TXN, TNFAIP6, PLAUR, IL8RB, BCL2A1, TNFRSF10C, PTAFR, KCNE3, LAMP2, TLR4, TYROBP, SLAMF7, CX3CR1, KLRC4, and CD8A; anddetermining, by a computer processor, the score from the dataset using an interpretation function, wherein the score is predictive of CAD in the subject and wherein a higher score relative to a control having less than 50% stenosis in all major vessels indicates that the subject has a higher likelihood of CAD.
- The method of claim 11, wherein the interpretation function is based on a predictive model.
- The method of claim 11, wherein the at least one clinical factor is age or gender.
- The method of claim 11, wherein the at least one clinical factor is age and gender.
- The method of claim 1 or 11, wherein the quantitative expression level values are derived from RT-PCR.
- The method of claim 1 or 11, wherein the dataset comprises quantitative expression level values for S100A12, CLEC4E, S100A8, CASP5, IL18RAP, TNFAIP6, AQP9, NCF4, CD3D, TMC8, CD79B, SPIB, HNRPF, TFCP2, RPL28, AF161365, AF289562, SLAMF7, KLRC4, IL8RB, TNFRSF10C, KCNE3, and TLR4.
- The method of claim 16, wherein the dataset comprises two clinical factors of age and gender.
- The method of claim 17, wherein the interpretation function for determining the score comprises:1) Define Norm1 = RPL282) Define Norm2 = (.5*HNRPF + .5*TFCP2)3) Define NKup = (.5*SLAMF7 + .5*KLRC4)4) Define Tcell = (.5*CD3D + .5*TMC88)5) Define Bcell = (2/3 *CD79B + 1/3 * SPIB)6) Define Neut = (.5*AQP9 + .5*NCF4)7) Define Nup = (1/3 * CASP5 + 1/3*IL18RAP + 1/3*TNFAIP6)8) Define Ndown = (.25*IL8RB + .25*TNFRSF10C + .25*TLR4 + .25*KCNE3)9) Define SCA1 = (1/3*S100A12 + 1/3*CLEC4E + 1/3*S100A8)10) Define AF2 = AF28956211) Define TSPAN = 1 if (AF161365-Norm2 > 6.27 or AF161365=NoCall), 0 otherwise12) Define SEX= 1 for Males, 0 for Females13) Define Intercepta. For Males, INTERCEPT = 2.672 + 0.0449*Ageb. For Females, INTERCEPT = 1.821 + 0.123*(Age-60), if negative set to 014) Define Score = INTERCEPT - 0.755 *(Nup - Ndown) - 0.406*(NKup - Tcell) - 0.308 *SEX*(SCA1- Norm1)- 0.137* (Bcell- Tcell)- 0.548 *(1-SEX)*(SCA1- Neut)- 0.482 *SEX*(TSPAN)- 0.246 *(AF2-Norm2).
- The method of claim 1 or 11, further comprising classifying the sample according to the score.
- The method of claim 1 or 11, further comprising rating CAD risk based on the score.
- A system for predicting CAD in a subject, the system comprising:a storage memory for storing a dataset associated with a sample obtained from the subject, wherein the dataset comprises a quantitative expression level value for each marker in at least one term selected from the group consisting of term 1, term 2, term 3, term 4, term 5, term 6, and term 7;wherein term 1 comprises marker 1, marker 2, and marker 3, wherein marker 1 comprises GenBank accession number AF161365, wherein marker 2 comprises HNRPF or ACBD5, and wherein marker 3 comprises TFCP2 or Dex18;wherein term 2 comprises marker 4, marker 5, and marker 6, wherein marker 4 comprises GenBank accession number AF289562 or CD248, wherein marker 5 comprises HNRPF or ACBD5, and wherein marker 6 comprises TFCP2 or DEX18;wherein term 3 comprises marker 7, marker 8, marker 9, and marker 10 wherein marker 7 comprises CD79B or CD19, wherein marker 8 comprises SPIB or BLK, wherein marker 9 comprises CD3D or LCK, and wherein marker 10 comprises TMC8 or CCT2;wherein term 4 comprises marker 11, marker 12, marker 13, and marker 14, wherein marker 11 comprises S100A12 or MMP9, wherein marker 12 comprises CLEC4E or ALOX5AP, wherein marker 13 comprises S100A8 or NAMPT, and wherein marker 14 comprises RPL28 or SSRP1;wherein term 5 comprises marker 15, marker 16, marker 17, marker 18, and marker 19, wherein marker 15 comprises S100A12 or MMP9, wherein marker 16 comprises CLEC4E or ALOX5AP, wherein marker 17 comprises S100A8 or NAMPT, wherein marker 18 comprises AQP9 or GLT1D1, and wherein marker 19 comprises NCF4 or NCF2;wherein term 6 comprises marker 20, marker 21, marker 22, marker 23, marker 24, marker 25, and marker 26, wherein marker 20 comprises CASP5 or H3F3B, wherein marker 21 comprises IL18RAP or TXN, wherein marker 22 comprises TNFAIP6 or PLAUR, wherein marker 23 comprises IL8RB or BCL2A1, wherein marker 24 comprises TNFRSF10C or PTAFR, wherein marker 25 comprises KCNE3 or LAMP2, and wherein marker 26 comprises TLR4 or TYROBP;and wherein term 7 comprises marker 27, marker 28, marker 29, and marker 30, wherein marker 27 comprises SLAMF7 or CX3CR1, wherein marker 28 comprises KLRC4 or CD8A, wherein marker 29 comprises CD3D or LCK, and wherein marker 30 comprises TMC8 or CCT2; anda processor communicatively coupled to the storage memory for determining a score with an interpretation function, wherein a higher score relative to a control having less than 50% stenosis in all major vessels indicates that the subject has a higher likelihood of CAD.
- The system of claim 21, wherein the dataset further comprises at least one clinical factor, wherein the at least one clinical factor is optionally selected from the group consisting of: age, gender, chest pain type, neutrophil count, ethnicity, disease duration, diastolic blood pressure, systolic blood pressure, a family history parameter, a medical history parameter, a medical symptom parameter, height, weight, a body-mass index, resting heart rate, and smoker/non-smoker status.
- A computer-readable storage medium storing computer-executable program code, the program code comprising:program code for storing a dataset associated with a sample obtained from the subject, wherein the dataset comprises a quantitative expression level value for each marker in at least one term selected from the group consisting of term 1, term 2, term 3, term 4, term 5, term 6, and term 7;wherein term 1 comprises marker 1, marker 2, and marker 3, wherein marker 1 comprises GenBank accession number AF161365, wherein marker 2 comprises HNRPF or ACBD5, and wherein marker 3 comprises TFCP2 or DDX18;wherein term 2 comprises marker 4, marker 5, and marker 6, wherein marker 4 comprises GenBank accession number AF289562 or CD248, wherein marker 5 comprises HNRPF or ACBD5, and wherein marker 6 comprises TFCP2 or DDX18;wherein term 3 comprises marker 7, marker 8, marker 9, and marker 10 wherein marker 7 comprises CD79B or CD 19, wherein marker 8 comprises SPIB or BLK, wherein marker 9 comprises CD3D or LCK, and wherein marker 10 comprises TMC8 or CCT2;wherein term 4 comprises marker 11, marker 12, marker 13, and marker 14, wherein marker 11 comprises S100A12 or MMP9, wherein marker 12 comprises CLEC4E or ALOX5AP, wherein marker 13 comprises S100A8 or NAMPT, and wherein marker 14 comprises RPL28 or SSRP1;wherein term 5 comprises marker 15, marker 16, marker 17, marker 18, and marker 19, wherein marker 15 comprises S100A12 or MMP9, wherein marker 16 comprises CLEC4E or ALOX5AP, wherein marker 17 comprises S100A8 or NAMPT, wherein marker 18 comprises AQP9 or GLT1D1, and wherein marker 19 comprises NCF4 or NCF2;wherein term 6 comprises marker 20, marker 21, marker 22, marker 23, marker 24, marker 25, and marker 26, wherein marker 20 comprises CASP5 or H3F3B, wherein marker 21 comprises IL18RAP or TXN, wherein marker 22 comprises TNFAIP6 or PLAUR, wherein marker 23 comprises IL8RB or BCL2A1, wherein marker 24 comprises TNFRSF10C or PTAFR, wherein marker 25 comprises KCNE3 or LAMP2, and wherein marker 26 comprises TLR4 or TYROBP; andwherein term 7 comprises marker 27, marker 28, marker 29, and marker 30, wherein marker 27 comprises SLAMF7 or CX3CR1, wherein marker 28 comprises KLRC4 or CD8A, wherein marker 29 comprises CD3D or LCK, and wherein marker 30 comprises TMC8 or CCT2; andprogram code for determining a score with an interpretation function, wherein a higher score relative to a control having less than 50% stenosis in all major vessels indicates that the subject has a higher likelihood of CAD.
Applications Claiming Priority (3)
| Application Number | Priority Date | Filing Date | Title |
|---|---|---|---|
| US18720309P | 2009-06-15 | 2009-06-15 | |
| US24519009P | 2009-09-23 | 2009-09-23 | |
| PCT/US2010/038712 WO2010148017A1 (en) | 2009-06-15 | 2010-06-15 | Determination of coronary artery disease risk. |
Publications (3)
| Publication Number | Publication Date |
|---|---|
| EP2443449A1 EP2443449A1 (en) | 2012-04-25 |
| EP2443449A4 EP2443449A4 (en) | 2012-12-26 |
| EP2443449B1 true EP2443449B1 (en) | 2017-04-12 |
Family
ID=43356727
Family Applications (1)
| Application Number | Title | Priority Date | Filing Date |
|---|---|---|---|
| EP10790073.0A Not-in-force EP2443449B1 (en) | 2009-06-15 | 2010-06-15 | Determination of coronary artery disease risk. |
Country Status (13)
| Country | Link |
|---|---|
| US (3) | US9122777B2 (en) |
| EP (1) | EP2443449B1 (en) |
| JP (1) | JP2012529914A (en) |
| KR (1) | KR20120046171A (en) |
| CN (1) | CN102803951A (en) |
| AU (1) | AU2010260152A1 (en) |
| BR (1) | BRPI1010693A2 (en) |
| CA (1) | CA2765145A1 (en) |
| DK (1) | DK2443449T3 (en) |
| EA (1) | EA201270020A1 (en) |
| IL (1) | IL216875A0 (en) |
| SG (2) | SG10201403152QA (en) |
| WO (1) | WO2010148017A1 (en) |
Families Citing this family (30)
| Publication number | Priority date | Publication date | Assignee | Title |
|---|---|---|---|---|
| US9122777B2 (en) | 2009-06-15 | 2015-09-01 | Cardiodx, Inc. | Method for determining coronary artery disease risk |
| MX2012014268A (en) | 2010-07-09 | 2013-02-12 | Somalogic Inc | Lung cancer biomarkers and uses thereof. |
| EP2603622A4 (en) | 2010-08-13 | 2015-04-22 | Somalogic Inc | BIOMARKERS OF PANCREATIC CANCER AND USES THEREOF |
| WO2012094366A1 (en) * | 2011-01-06 | 2012-07-12 | Cardiodx, Inc. | Circulating mirnas as biomarkers for coronary artery disease |
| SG10201607331WA (en) * | 2011-09-30 | 2016-11-29 | Somalogic Inc | Cardiovascular risk event prediction and uses thereof |
| CN104101715A (en) * | 2014-07-15 | 2014-10-15 | 重庆医科大学附属儿童医院 | Kit for detecting DOCK8 (dedicator of cytokinesis 8) protein and non-diagnostic DOCK8 protein detection method |
| WO2016076899A1 (en) * | 2014-11-14 | 2016-05-19 | Medidata Solutions, Inc. | System and method for determining subject conditions in mobile health clinical trials |
| AU2016303472B2 (en) | 2015-07-31 | 2020-08-27 | Immunewalk Therapeutics, Inc. | Motile sperm domain containing protein 2 and inflammation |
| EP3328401B1 (en) | 2015-07-31 | 2020-10-14 | Vascular Biogenics Ltd. | Motile sperm domain containing protein 2 and cancer |
| US20180356432A1 (en) * | 2015-09-01 | 2018-12-13 | Cardiodx, Inc. | Markers for coronary artery disease and uses thereof |
| US11056218B2 (en) | 2016-05-31 | 2021-07-06 | International Business Machines Corporation | Identifying personalized time-varying predictive patterns of risk factors |
| CN106327476A (en) * | 2016-08-25 | 2017-01-11 | 于洋 | CT image processing method and device |
| CN110225982A (en) | 2016-09-01 | 2019-09-10 | 乔治·华盛顿大学 | Blood RNA Biomarkers of Coronary Artery Disease |
| US10832815B2 (en) | 2017-05-18 | 2020-11-10 | International Business Machines Corporation | Medical side effects tracking |
| CN107238712B (en) * | 2017-06-05 | 2018-12-28 | 中国人民解放军沈阳军区总医院 | Application of the blood plasma S100A12 in ST sections of elevation myocardial infarction prognosis |
| CN107271681A (en) * | 2017-06-05 | 2017-10-20 | 中国人民解放军沈阳军区总医院 | Applications of the blood plasma S100A12 in ST sections of elevation myocardial infarction early diagnosis |
| CN107292128A (en) * | 2017-06-27 | 2017-10-24 | 湖南农业大学 | One kind pairing interacting genes detection method and forecast model |
| CN107937521B (en) * | 2017-11-19 | 2019-01-04 | 武汉迈特维尔生物科技有限公司 | For detecting the kit of adrenocortical carcinoma |
| US20210217485A1 (en) * | 2018-01-15 | 2021-07-15 | Chang Gung Memorial Hospital, Linkou | Method of establishing a coronary artery disease prediction model for screening coronary artery disease |
| CN111354464B (en) * | 2018-12-24 | 2024-05-17 | 深圳先进技术研究院 | CAD prediction model establishment method and device and electronic equipment |
| CN111789949A (en) * | 2019-04-08 | 2020-10-20 | 北京昱嘉科技集团有限公司 | Alzheimer disease treatment target based on specific chemokine receptor |
| US11564738B2 (en) * | 2019-05-06 | 2023-01-31 | Biosense Webster (Israel) Ltd. | Using pulmonary vein isolation for patients with atrial fibrillation |
| RU2740246C1 (en) * | 2020-03-20 | 2021-01-12 | Жанна Залкуфовна Отарова | Method for determining high risk of carotid atherosclerosis in rheumatoid arthritis |
| TW202201007A (en) * | 2020-05-19 | 2022-01-01 | 美商獵鷹生科有限責任公司 | Detection and treatment of conditions characterized by perfusion shortage |
| JP2023547026A (en) | 2020-09-10 | 2023-11-09 | バスキュラー バイオジェニックス リミテッド | Motile sperm domain-containing protein 2 antibody and its use |
| CN112835316B (en) * | 2021-01-06 | 2022-04-19 | 重庆医科大学 | Neonatal sepsis shock prediction system and monitoring equipment |
| CN113295874B (en) * | 2021-05-25 | 2022-03-04 | 广东源心再生医学有限公司 | Novel marker for auxiliary diagnosis of valvular heart disease and auxiliary diagnosis product |
| CN113667740B (en) * | 2021-08-27 | 2023-12-26 | 河北医科大学第二医院 | Application of molecular marker panels in the diagnosis of cardiovascular disease |
| CN113667739B (en) * | 2021-08-27 | 2023-12-26 | 河北医科大学第二医院 | Diagnostic marker combinations for coronary artery disease |
| CN120121843B (en) * | 2025-02-24 | 2026-02-10 | 梅州市人民医院(梅州市医学科学院) | Application of IFITM family proteins in the diagnosis of coronary atherosclerosis |
Family Cites Families (18)
| Publication number | Priority date | Publication date | Assignee | Title |
|---|---|---|---|---|
| US20020151479A1 (en) * | 2000-01-31 | 2002-10-17 | Rosen Craig A. | Nucleic acids, proteins, and antibodies |
| US7235358B2 (en) | 2001-06-08 | 2007-06-26 | Expression Diagnostics, Inc. | Methods and compositions for diagnosing and monitoring transplant rejection |
| US20030099958A1 (en) * | 2001-09-05 | 2003-05-29 | Vitivity, Inc. | Diagnosis and treatment of vascular disease |
| US20050032066A1 (en) | 2003-08-04 | 2005-02-10 | Heng Chew Kiat | Method for assessing risk of diseases with multiple contributing factors |
| US20070238124A1 (en) | 2003-10-16 | 2007-10-11 | Chibout Salah D | Differentially expressed genes related to coronary artery disease |
| US20070218513A1 (en) | 2003-10-16 | 2007-09-20 | Novartis Ag | Differentially Expressed Genes Related to Coronary Artery Disease |
| WO2005103720A1 (en) | 2004-03-29 | 2005-11-03 | Medstar Research Institute, Inc. | Methods of diagnosing cardiovascular disease |
| US20070105133A1 (en) * | 2005-06-13 | 2007-05-10 | The Regents Of The University Of Michigan | Compositions and methods for treating and diagnosing cancer |
| US20070015170A1 (en) * | 2005-07-12 | 2007-01-18 | Oy Jurilab Ltd | Method and kit for detecting a risk of coronary heart disease |
| US20100035963A1 (en) | 2005-09-09 | 2010-02-11 | Ayelet Chajut | Oligoribonucleotides and Methods of use Thereof for Treatment of Cardiovascular Disease |
| CA2659082A1 (en) * | 2006-06-07 | 2007-12-21 | Tethys Bioscience, Inc. | Markers associated with arteriovascular events and methods of use thereof |
| WO2008080126A2 (en) * | 2006-12-22 | 2008-07-03 | Aviir, Inc. | Two biomarkers for diagnosis and monitoring of atherosclerotic cardiovascular disease |
| KR101571523B1 (en) * | 2007-02-21 | 2015-11-24 | 디코드 제네틱스 이에이치에프 | Genetic susceptibility variants associated with cardiovascular disease |
| US7695916B2 (en) | 2007-03-22 | 2010-04-13 | Celera Corporation | Genetic polymorphisms associated with coronary events and drug response, methods of detection and uses thereof |
| DK2155907T3 (en) * | 2007-04-30 | 2015-08-31 | Decode Genetics Ehf | Genetic variants useful for risk assessment of coronary artery disease and myocardial infarction |
| US20110184712A1 (en) | 2007-10-11 | 2011-07-28 | Cardiodx, Inc. | Predictive models and methods for diagnosing and assessing coronary artery disease |
| WO2010038104A1 (en) * | 2008-10-03 | 2010-04-08 | INSERM (Institut National de la Santé et de la Recherche Médicale) | Combination of cardiovascular risk factors for the diagnosis/prognosis of a cardiovascular disease/event. |
| US9122777B2 (en) | 2009-06-15 | 2015-09-01 | Cardiodx, Inc. | Method for determining coronary artery disease risk |
-
2010
- 2010-06-15 US US12/816,232 patent/US9122777B2/en not_active Expired - Fee Related
- 2010-06-15 SG SG10201403152QA patent/SG10201403152QA/en unknown
- 2010-06-15 KR KR1020127001127A patent/KR20120046171A/en not_active Withdrawn
- 2010-06-15 EP EP10790073.0A patent/EP2443449B1/en not_active Not-in-force
- 2010-06-15 SG SG2011090107A patent/SG176692A1/en unknown
- 2010-06-15 EA EA201270020A patent/EA201270020A1/en unknown
- 2010-06-15 WO PCT/US2010/038712 patent/WO2010148017A1/en not_active Ceased
- 2010-06-15 JP JP2012516212A patent/JP2012529914A/en active Pending
- 2010-06-15 DK DK10790073.0T patent/DK2443449T3/en active
- 2010-06-15 AU AU2010260152A patent/AU2010260152A1/en not_active Abandoned
- 2010-06-15 CA CA2765145A patent/CA2765145A1/en not_active Abandoned
- 2010-06-15 CN CN201080036171XA patent/CN102803951A/en active Pending
- 2010-06-15 BR BRPI1010693A patent/BRPI1010693A2/en not_active IP Right Cessation
-
2011
- 2011-12-08 IL IL216875A patent/IL216875A0/en unknown
-
2014
- 2014-01-16 US US14/157,196 patent/US8914240B2/en not_active Expired - Fee Related
-
2015
- 2015-07-17 US US14/802,544 patent/US20150315652A1/en not_active Abandoned
Non-Patent Citations (1)
| Title |
|---|
| None * |
Also Published As
| Publication number | Publication date |
|---|---|
| WO2010148017A1 (en) | 2010-12-23 |
| CA2765145A1 (en) | 2010-12-23 |
| US20150315652A1 (en) | 2015-11-05 |
| SG176692A1 (en) | 2012-01-30 |
| SG10201403152QA (en) | 2014-08-28 |
| EP2443449A4 (en) | 2012-12-26 |
| EA201270020A1 (en) | 2012-07-30 |
| US8914240B2 (en) | 2014-12-16 |
| BRPI1010693A2 (en) | 2019-07-16 |
| CN102803951A (en) | 2012-11-28 |
| KR20120046171A (en) | 2012-05-09 |
| AU2010260152A1 (en) | 2012-02-02 |
| EP2443449A1 (en) | 2012-04-25 |
| IL216875A0 (en) | 2012-02-29 |
| US20110015865A1 (en) | 2011-01-20 |
| DK2443449T3 (en) | 2017-05-15 |
| US9122777B2 (en) | 2015-09-01 |
| US20140156198A1 (en) | 2014-06-05 |
| JP2012529914A (en) | 2012-11-29 |
Similar Documents
| Publication | Publication Date | Title |
|---|---|---|
| US8914240B2 (en) | Method for determining coronary artery disease risk | |
| JP7754815B2 (en) | Predicting and managing critical illness in individuals with sepsis | |
| US20200407791A1 (en) | Tissue molecular signatures of kidney transplant rejections | |
| Park et al. | Assessment and diagnostic relevance of novel serum biomarkers for early decision of ST-elevation myocardial infarction | |
| Wang et al. | Gene expression signature in peripheral blood detects thoracic aortic aneurysm | |
| JP5279505B2 (en) | Module level analysis of transcription profiles of peripheral blood leukocytes | |
| CN102439172B (en) | Biomarker Panel for Diagnosis and Prediction of Graft Rejection | |
| EP3931360A1 (en) | Systems and methods for using sequencing data for pathogen detection | |
| EP4121553A1 (en) | Systems and methods of detecting a risk of alzheimer's disease using a circulating-free mrna profiling assay | |
| EP3825417A2 (en) | Tissue molecular signatures of kidney transplant rejections | |
| Patil et al. | Bronchoalveolar lavage cell gene expression in acute lung rejection: development of a diagnostic classifier | |
| Sun et al. | Bioinformatics and machine learning methods identified MGST1 and QPCT as novel biomarkers for severe acute pancreatitis | |
| EP3790987A1 (en) | Genome-wide classifiers for detection of subacute transplant rejection and other transplant conditions | |
| EP2212441A2 (en) | Predictive models and methods for diagnosing and assessing coronary artery disease | |
| Faiz et al. | How can microarrays unlock asthma? | |
| US20240191301A1 (en) | Methods, Systems, and Compositions for Diagnosing Transplant Rejection | |
| Odia | Longitudinal transcriptomic profiling of whole blood during tuberculosis treatment | |
| Guo et al. | Integrated bioinformatics and machine learning, research on specific biomarkers for large-artery atherosclerosis stroke | |
| Care | Using “Omics” to Discover Predictive Biomarkers in Women at High Risk of Spontaneous Preterm Birth | |
| WO2024119057A2 (en) | Plasma cell-free rna signatures of tuberculosis | |
| EP4616003A1 (en) | Methods and systems for diagnosis and treatment of lupus based on expression of primary immunodeficiency genes | |
| CN108603870A (en) | Markers for coronary artery disease and their uses | |
| Mikhaylov | Integrating Biologic and Clinical Data towards Resolving Heterogeneity in Childhood Inflammatory Diseases | |
| Bonder15 et al. | Epigenome-wide association study of body mass index, and the adverse outcomes of adiposity | |
| Huang et al. | Blood-Based Molecular Endotyping of Fibrotic Hypersensitivity Pneumonitis Identifies Two Immune Subtypes with Divergent Prognosis and Corticosteroid Responses |
Legal Events
| Date | Code | Title | Description |
|---|---|---|---|
| PUAI | Public reference made under article 153(3) epc to a published international application that has entered the european phase |
Free format text: ORIGINAL CODE: 0009012 |
|
| 17P | Request for examination filed |
Effective date: 20120112 |
|
| AK | Designated contracting states |
Kind code of ref document: A1 Designated state(s): AL AT BE BG CH CY CZ DE DK EE ES FI FR GB GR HR HU IE IS IT LI LT LU LV MC MK MT NL NO PL PT RO SE SI SK SM TR |
|
| DAX | Request for extension of the european patent (deleted) | ||
| A4 | Supplementary search report drawn up and despatched |
Effective date: 20121123 |
|
| RIC1 | Information provided on ipc code assigned before grant |
Ipc: C12Q 1/68 20060101ALI20121119BHEP Ipc: G01N 33/00 20060101AFI20121119BHEP |
|
| 17Q | First examination report despatched |
Effective date: 20140722 |
|
| GRAP | Despatch of communication of intention to grant a patent |
Free format text: ORIGINAL CODE: EPIDOSNIGR1 |
|
| INTG | Intention to grant announced |
Effective date: 20161028 |
|
| GRAS | Grant fee paid |
Free format text: ORIGINAL CODE: EPIDOSNIGR3 |
|
| STAA | Information on the status of an ep patent application or granted ep patent |
Free format text: STATUS: GRANT OF PATENT IS INTENDED |
|
| GRAA | (expected) grant |
Free format text: ORIGINAL CODE: 0009210 |
|
| STAA | Information on the status of an ep patent application or granted ep patent |
Free format text: STATUS: THE PATENT HAS BEEN GRANTED |
|
| AK | Designated contracting states |
Kind code of ref document: B1 Designated state(s): AL AT BE BG CH CY CZ DE DK EE ES FI FR GB GR HR HU IE IS IT LI LT LU LV MC MK MT NL NO PL PT RO SE SI SK SM TR |
|
| REG | Reference to a national code |
Ref country code: GB Ref legal event code: FG4D |
|
| REG | Reference to a national code |
Ref country code: CH Ref legal event code: EP |
|
| REG | Reference to a national code |
Ref country code: FR Ref legal event code: PLFP Year of fee payment: 8 Ref country code: IE Ref legal event code: FG4D |
|
| REG | Reference to a national code |
Ref country code: DK Ref legal event code: T3 Effective date: 20170511 Ref country code: AT Ref legal event code: REF Ref document number: 884414 Country of ref document: AT Kind code of ref document: T Effective date: 20170515 Ref country code: CH Ref legal event code: NV Representative=s name: VENI GMBH, CH |
|
| REG | Reference to a national code |
Ref country code: SE Ref legal event code: TRGR |
|
| REG | Reference to a national code |
Ref country code: DE Ref legal event code: R096 Ref document number: 602010041517 Country of ref document: DE |
|
| REG | Reference to a national code |
Ref country code: NL Ref legal event code: FP |
|
| REG | Reference to a national code |
Ref country code: NO Ref legal event code: T2 Effective date: 20170412 |
|
| REG | Reference to a national code |
Ref country code: LT Ref legal event code: MG4D |
|
| REG | Reference to a national code |
Ref country code: AT Ref legal event code: MK05 Ref document number: 884414 Country of ref document: AT Kind code of ref document: T Effective date: 20170412 |
|
| PG25 | Lapsed in a contracting state [announced via postgrant information from national office to epo] |
Ref country code: AT Free format text: LAPSE BECAUSE OF FAILURE TO SUBMIT A TRANSLATION OF THE DESCRIPTION OR TO PAY THE FEE WITHIN THE PRESCRIBED TIME-LIMIT Effective date: 20170412 Ref country code: LT Free format text: LAPSE BECAUSE OF FAILURE TO SUBMIT A TRANSLATION OF THE DESCRIPTION OR TO PAY THE FEE WITHIN THE PRESCRIBED TIME-LIMIT Effective date: 20170412 Ref country code: ES Free format text: LAPSE BECAUSE OF FAILURE TO SUBMIT A TRANSLATION OF THE DESCRIPTION OR TO PAY THE FEE WITHIN THE PRESCRIBED TIME-LIMIT Effective date: 20170412 Ref country code: HR Free format text: LAPSE BECAUSE OF FAILURE TO SUBMIT A TRANSLATION OF THE DESCRIPTION OR TO PAY THE FEE WITHIN THE PRESCRIBED TIME-LIMIT Effective date: 20170412 Ref country code: GR Free format text: LAPSE BECAUSE OF FAILURE TO SUBMIT A TRANSLATION OF THE DESCRIPTION OR TO PAY THE FEE WITHIN THE PRESCRIBED TIME-LIMIT Effective date: 20170713 |
|
| PG25 | Lapsed in a contracting state [announced via postgrant information from national office to epo] |
Ref country code: LV Free format text: LAPSE BECAUSE OF FAILURE TO SUBMIT A TRANSLATION OF THE DESCRIPTION OR TO PAY THE FEE WITHIN THE PRESCRIBED TIME-LIMIT Effective date: 20170412 Ref country code: PL Free format text: LAPSE BECAUSE OF FAILURE TO SUBMIT A TRANSLATION OF THE DESCRIPTION OR TO PAY THE FEE WITHIN THE PRESCRIBED TIME-LIMIT Effective date: 20170412 Ref country code: BG Free format text: LAPSE BECAUSE OF FAILURE TO SUBMIT A TRANSLATION OF THE DESCRIPTION OR TO PAY THE FEE WITHIN THE PRESCRIBED TIME-LIMIT Effective date: 20170712 Ref country code: IS Free format text: LAPSE BECAUSE OF FAILURE TO SUBMIT A TRANSLATION OF THE DESCRIPTION OR TO PAY THE FEE WITHIN THE PRESCRIBED TIME-LIMIT Effective date: 20170812 |
|
| REG | Reference to a national code |
Ref country code: DE Ref legal event code: R097 Ref document number: 602010041517 Country of ref document: DE |
|
| PG25 | Lapsed in a contracting state [announced via postgrant information from national office to epo] |
Ref country code: RO Free format text: LAPSE BECAUSE OF FAILURE TO SUBMIT A TRANSLATION OF THE DESCRIPTION OR TO PAY THE FEE WITHIN THE PRESCRIBED TIME-LIMIT Effective date: 20170412 Ref country code: EE Free format text: LAPSE BECAUSE OF FAILURE TO SUBMIT A TRANSLATION OF THE DESCRIPTION OR TO PAY THE FEE WITHIN THE PRESCRIBED TIME-LIMIT Effective date: 20170412 Ref country code: CZ Free format text: LAPSE BECAUSE OF FAILURE TO SUBMIT A TRANSLATION OF THE DESCRIPTION OR TO PAY THE FEE WITHIN THE PRESCRIBED TIME-LIMIT Effective date: 20170412 Ref country code: SK Free format text: LAPSE BECAUSE OF FAILURE TO SUBMIT A TRANSLATION OF THE DESCRIPTION OR TO PAY THE FEE WITHIN THE PRESCRIBED TIME-LIMIT Effective date: 20170412 Ref country code: MC Free format text: LAPSE BECAUSE OF FAILURE TO SUBMIT A TRANSLATION OF THE DESCRIPTION OR TO PAY THE FEE WITHIN THE PRESCRIBED TIME-LIMIT Effective date: 20170412 |
|
| PLBE | No opposition filed within time limit |
Free format text: ORIGINAL CODE: 0009261 |
|
| STAA | Information on the status of an ep patent application or granted ep patent |
Free format text: STATUS: NO OPPOSITION FILED WITHIN TIME LIMIT |
|
| PG25 | Lapsed in a contracting state [announced via postgrant information from national office to epo] |
Ref country code: SM Free format text: LAPSE BECAUSE OF FAILURE TO SUBMIT A TRANSLATION OF THE DESCRIPTION OR TO PAY THE FEE WITHIN THE PRESCRIBED TIME-LIMIT Effective date: 20170412 Ref country code: IT Free format text: LAPSE BECAUSE OF FAILURE TO SUBMIT A TRANSLATION OF THE DESCRIPTION OR TO PAY THE FEE WITHIN THE PRESCRIBED TIME-LIMIT Effective date: 20170412 |
|
| 26N | No opposition filed |
Effective date: 20180115 |
|
| PG25 | Lapsed in a contracting state [announced via postgrant information from national office to epo] |
Ref country code: LU Free format text: LAPSE BECAUSE OF NON-PAYMENT OF DUE FEES Effective date: 20170615 |
|
| REG | Reference to a national code |
Ref country code: FR Ref legal event code: PLFP Year of fee payment: 9 |
|
| PG25 | Lapsed in a contracting state [announced via postgrant information from national office to epo] |
Ref country code: SI Free format text: LAPSE BECAUSE OF FAILURE TO SUBMIT A TRANSLATION OF THE DESCRIPTION OR TO PAY THE FEE WITHIN THE PRESCRIBED TIME-LIMIT Effective date: 20170412 |
|
| PGFP | Annual fee paid to national office [announced via postgrant information from national office to epo] |
Ref country code: NL Payment date: 20180613 Year of fee payment: 9 Ref country code: CH Payment date: 20180614 Year of fee payment: 9 Ref country code: IE Payment date: 20180612 Year of fee payment: 9 Ref country code: FI Payment date: 20180612 Year of fee payment: 9 Ref country code: NO Payment date: 20180611 Year of fee payment: 9 Ref country code: DE Payment date: 20180605 Year of fee payment: 9 Ref country code: DK Payment date: 20180612 Year of fee payment: 9 |
|
| PGFP | Annual fee paid to national office [announced via postgrant information from national office to epo] |
Ref country code: FR Payment date: 20180511 Year of fee payment: 9 Ref country code: BE Payment date: 20180417 Year of fee payment: 9 |
|
| PG25 | Lapsed in a contracting state [announced via postgrant information from national office to epo] |
Ref country code: MT Free format text: LAPSE BECAUSE OF NON-PAYMENT OF DUE FEES Effective date: 20170615 |
|
| PGFP | Annual fee paid to national office [announced via postgrant information from national office to epo] |
Ref country code: SE Payment date: 20180612 Year of fee payment: 9 |
|
| PGFP | Annual fee paid to national office [announced via postgrant information from national office to epo] |
Ref country code: GB Payment date: 20180403 Year of fee payment: 9 |
|
| PG25 | Lapsed in a contracting state [announced via postgrant information from national office to epo] |
Ref country code: HU Free format text: LAPSE BECAUSE OF FAILURE TO SUBMIT A TRANSLATION OF THE DESCRIPTION OR TO PAY THE FEE WITHIN THE PRESCRIBED TIME-LIMIT; INVALID AB INITIO Effective date: 20100615 |
|
| PG25 | Lapsed in a contracting state [announced via postgrant information from national office to epo] |
Ref country code: CY Free format text: LAPSE BECAUSE OF NON-PAYMENT OF DUE FEES Effective date: 20170412 |
|
| PG25 | Lapsed in a contracting state [announced via postgrant information from national office to epo] |
Ref country code: MK Free format text: LAPSE BECAUSE OF FAILURE TO SUBMIT A TRANSLATION OF THE DESCRIPTION OR TO PAY THE FEE WITHIN THE PRESCRIBED TIME-LIMIT Effective date: 20170412 |
|
| REG | Reference to a national code |
Ref country code: DE Ref legal event code: R119 Ref document number: 602010041517 Country of ref document: DE |
|
| REG | Reference to a national code |
Ref country code: FI Ref legal event code: MAE |
|
| REG | Reference to a national code |
Ref country code: DK Ref legal event code: EBP Effective date: 20190630 |
|
| REG | Reference to a national code |
Ref country code: NO Ref legal event code: MMEP |
|
| REG | Reference to a national code |
Ref country code: SE Ref legal event code: EUG |
|
| PG25 | Lapsed in a contracting state [announced via postgrant information from national office to epo] |
Ref country code: SE Free format text: LAPSE BECAUSE OF NON-PAYMENT OF DUE FEES Effective date: 20190616 Ref country code: FI Free format text: LAPSE BECAUSE OF NON-PAYMENT OF DUE FEES Effective date: 20190615 |
|
| REG | Reference to a national code |
Ref country code: CH Ref legal event code: PL |
|
| REG | Reference to a national code |
Ref country code: NL Ref legal event code: MM Effective date: 20190701 |
|
| GBPC | Gb: european patent ceased through non-payment of renewal fee |
Effective date: 20190615 |
|
| REG | Reference to a national code |
Ref country code: BE Ref legal event code: MM Effective date: 20190630 |
|
| PG25 | Lapsed in a contracting state [announced via postgrant information from national office to epo] |
Ref country code: TR Free format text: LAPSE BECAUSE OF FAILURE TO SUBMIT A TRANSLATION OF THE DESCRIPTION OR TO PAY THE FEE WITHIN THE PRESCRIBED TIME-LIMIT Effective date: 20170412 |
|
| PG25 | Lapsed in a contracting state [announced via postgrant information from national office to epo] |
Ref country code: IE Free format text: LAPSE BECAUSE OF NON-PAYMENT OF DUE FEES Effective date: 20190615 Ref country code: NO Free format text: LAPSE BECAUSE OF NON-PAYMENT OF DUE FEES Effective date: 20190630 Ref country code: NL Free format text: LAPSE BECAUSE OF NON-PAYMENT OF DUE FEES Effective date: 20190701 Ref country code: DE Free format text: LAPSE BECAUSE OF NON-PAYMENT OF DUE FEES Effective date: 20200101 Ref country code: GB Free format text: LAPSE BECAUSE OF NON-PAYMENT OF DUE FEES Effective date: 20190615 |
|
| PG25 | Lapsed in a contracting state [announced via postgrant information from national office to epo] |
Ref country code: CH Free format text: LAPSE BECAUSE OF NON-PAYMENT OF DUE FEES Effective date: 20190630 Ref country code: LI Free format text: LAPSE BECAUSE OF NON-PAYMENT OF DUE FEES Effective date: 20190630 Ref country code: PT Free format text: LAPSE BECAUSE OF FAILURE TO SUBMIT A TRANSLATION OF THE DESCRIPTION OR TO PAY THE FEE WITHIN THE PRESCRIBED TIME-LIMIT Effective date: 20170412 Ref country code: BE Free format text: LAPSE BECAUSE OF NON-PAYMENT OF DUE FEES Effective date: 20190630 |
|
| PG25 | Lapsed in a contracting state [announced via postgrant information from national office to epo] |
Ref country code: FR Free format text: LAPSE BECAUSE OF NON-PAYMENT OF DUE FEES Effective date: 20190630 |
|
| PG25 | Lapsed in a contracting state [announced via postgrant information from national office to epo] |
Ref country code: AL Free format text: LAPSE BECAUSE OF FAILURE TO SUBMIT A TRANSLATION OF THE DESCRIPTION OR TO PAY THE FEE WITHIN THE PRESCRIBED TIME-LIMIT Effective date: 20170412 Ref country code: DK Free format text: LAPSE BECAUSE OF NON-PAYMENT OF DUE FEES Effective date: 20190630 |