EP2439282A1 - Method for determining a biological pathway activity - Google Patents
Method for determining a biological pathway activity Download PDFInfo
- Publication number
- EP2439282A1 EP2439282A1 EP10306090A EP10306090A EP2439282A1 EP 2439282 A1 EP2439282 A1 EP 2439282A1 EP 10306090 A EP10306090 A EP 10306090A EP 10306090 A EP10306090 A EP 10306090A EP 2439282 A1 EP2439282 A1 EP 2439282A1
- Authority
- EP
- European Patent Office
- Prior art keywords
- level
- genes
- expression
- patient
- biological pathway
- Prior art date
- Legal status (The legal status is an assumption and is not a legal conclusion. Google has not performed a legal analysis and makes no representation as to the accuracy of the status listed.)
- Withdrawn
Links
- 230000008236 biological pathway Effects 0.000 title claims abstract description 83
- 238000000034 method Methods 0.000 title claims abstract description 54
- 230000000694 effects Effects 0.000 title claims abstract description 42
- 108090000623 proteins and genes Proteins 0.000 claims abstract description 177
- 230000014509 gene expression Effects 0.000 claims abstract description 147
- 239000000523 sample Substances 0.000 claims abstract description 52
- 230000007170 pathology Effects 0.000 claims abstract description 41
- 239000012472 biological sample Substances 0.000 claims abstract description 6
- 206010039073 rheumatoid arthritis Diseases 0.000 claims description 45
- 229940079593 drug Drugs 0.000 claims description 15
- 239000003814 drug Substances 0.000 claims description 15
- 201000000596 systemic lupus erythematosus Diseases 0.000 claims description 15
- 108091032973 (ribonucleotides)n+m Proteins 0.000 claims description 12
- 230000004071 biological effect Effects 0.000 claims description 8
- 210000004369 blood Anatomy 0.000 claims description 7
- 239000008280 blood Substances 0.000 claims description 7
- 230000037361 pathway Effects 0.000 claims description 6
- 230000004044 response Effects 0.000 claims description 6
- 108020004707 nucleic acids Proteins 0.000 claims description 5
- 102000039446 nucleic acids Human genes 0.000 claims description 5
- 150000007523 nucleic acids Chemical class 0.000 claims description 5
- 102000040650 (ribonucleotides)n+m Human genes 0.000 claims description 4
- 238000000338 in vitro Methods 0.000 claims description 4
- 102000002227 Interferon Type I Human genes 0.000 claims description 3
- 108010014726 Interferon Type I Proteins 0.000 claims description 3
- 108020004999 messenger RNA Proteins 0.000 claims description 3
- 210000001519 tissue Anatomy 0.000 claims description 3
- 108091032955 Bacterial small RNA Proteins 0.000 claims description 2
- 108020004635 Complementary DNA Proteins 0.000 claims description 2
- 108091005461 Nucleic proteins Proteins 0.000 claims description 2
- 210000001175 cerebrospinal fluid Anatomy 0.000 claims description 2
- 238000003745 diagnosis Methods 0.000 claims description 2
- 238000001647 drug administration Methods 0.000 claims description 2
- 239000012530 fluid Substances 0.000 claims description 2
- 108091070501 miRNA Proteins 0.000 claims description 2
- 239000002679 microRNA Substances 0.000 claims description 2
- 238000012544 monitoring process Methods 0.000 claims description 2
- 210000002381 plasma Anatomy 0.000 claims description 2
- 238000004393 prognosis Methods 0.000 claims description 2
- 102000004169 proteins and genes Human genes 0.000 claims description 2
- 210000002966 serum Anatomy 0.000 claims description 2
- 210000001179 synovial fluid Anatomy 0.000 claims description 2
- 210000002700 urine Anatomy 0.000 claims description 2
- 102000014150 Interferons Human genes 0.000 description 39
- 108010050904 Interferons Proteins 0.000 description 39
- 229940079322 interferon Drugs 0.000 description 39
- 238000004458 analytical method Methods 0.000 description 10
- 201000010099 disease Diseases 0.000 description 9
- 208000037265 diseases, disorders, signs and symptoms Diseases 0.000 description 9
- 230000004913 activation Effects 0.000 description 5
- 238000013459 approach Methods 0.000 description 5
- 238000007635 classification algorithm Methods 0.000 description 5
- FBOZXECLQNJBKD-ZDUSSCGKSA-N L-methotrexate Chemical compound C=1N=C2N=C(N)N=C(N)C2=NC=1CN(C)C1=CC=C(C(=O)N[C@@H](CCC(O)=O)C(O)=O)C=C1 FBOZXECLQNJBKD-ZDUSSCGKSA-N 0.000 description 4
- IAZDPXIOMUYVGZ-UHFFFAOYSA-N Dimethylsulphoxide Chemical compound CS(C)=O IAZDPXIOMUYVGZ-UHFFFAOYSA-N 0.000 description 3
- 238000004422 calculation algorithm Methods 0.000 description 3
- 238000012512 characterization method Methods 0.000 description 3
- 239000002299 complementary DNA Substances 0.000 description 3
- 230000009266 disease activity Effects 0.000 description 3
- 238000009396 hybridization Methods 0.000 description 3
- 238000002493 microarray Methods 0.000 description 3
- 201000006417 multiple sclerosis Diseases 0.000 description 3
- 238000013517 stratification Methods 0.000 description 3
- YBJHBAHKTGYVGT-ZKWXMUAHSA-N (+)-Biotin Chemical compound N1C(=O)N[C@@H]2[C@H](CCCCC(=O)O)SC[C@@H]21 YBJHBAHKTGYVGT-ZKWXMUAHSA-N 0.000 description 2
- 101150103227 IFN gene Proteins 0.000 description 2
- 241001362551 Samba Species 0.000 description 2
- 208000021386 Sjogren Syndrome Diseases 0.000 description 2
- 238000012740 TANGO algorithm Methods 0.000 description 2
- 206010067584 Type 1 diabetes mellitus Diseases 0.000 description 2
- 230000008827 biological function Effects 0.000 description 2
- 230000031018 biological processes and functions Effects 0.000 description 2
- 238000004364 calculation method Methods 0.000 description 2
- 230000001413 cellular effect Effects 0.000 description 2
- 201000001981 dermatomyositis Diseases 0.000 description 2
- 238000011161 development Methods 0.000 description 2
- 238000009826 distribution Methods 0.000 description 2
- 238000005516 engineering process Methods 0.000 description 2
- 238000011223 gene expression profiling Methods 0.000 description 2
- 230000028993 immune response Effects 0.000 description 2
- 230000005764 inhibitory process Effects 0.000 description 2
- 230000010468 interferon response Effects 0.000 description 2
- 230000007246 mechanism Effects 0.000 description 2
- 238000010208 microarray analysis Methods 0.000 description 2
- 238000012545 processing Methods 0.000 description 2
- 230000001105 regulatory effect Effects 0.000 description 2
- 230000008593 response to virus Effects 0.000 description 2
- 238000002560 therapeutic procedure Methods 0.000 description 2
- 101150066375 35 gene Proteins 0.000 description 1
- 208000023275 Autoimmune disease Diseases 0.000 description 1
- 230000003844 B-cell-activation Effects 0.000 description 1
- 206010057248 Cell death Diseases 0.000 description 1
- 108010008286 DNA nucleotidylexotransferase Proteins 0.000 description 1
- 102100029764 DNA-directed DNA/RNA polymerase mu Human genes 0.000 description 1
- 102000016911 Deoxyribonucleases Human genes 0.000 description 1
- 108010053770 Deoxyribonucleases Proteins 0.000 description 1
- 108010067770 Endopeptidase K Proteins 0.000 description 1
- 108010008165 Etanercept Proteins 0.000 description 1
- 238000002123 RNA extraction Methods 0.000 description 1
- 239000013614 RNA sample Substances 0.000 description 1
- 201000009594 Systemic Scleroderma Diseases 0.000 description 1
- 206010042953 Systemic sclerosis Diseases 0.000 description 1
- 238000001793 Wilcoxon signed-rank test Methods 0.000 description 1
- 229960002964 adalimumab Drugs 0.000 description 1
- 238000012152 algorithmic method Methods 0.000 description 1
- 238000003491 array Methods 0.000 description 1
- 230000008901 benefit Effects 0.000 description 1
- 230000015572 biosynthetic process Effects 0.000 description 1
- 229960002685 biotin Drugs 0.000 description 1
- 235000020958 biotin Nutrition 0.000 description 1
- 239000011616 biotin Substances 0.000 description 1
- 239000000872 buffer Substances 0.000 description 1
- 230000021164 cell adhesion Effects 0.000 description 1
- 230000023402 cell communication Effects 0.000 description 1
- 230000006037 cell lysis Effects 0.000 description 1
- 230000024856 cell surface receptor signaling pathway Effects 0.000 description 1
- 230000011552 cellular defense response Effects 0.000 description 1
- 230000007248 cellular mechanism Effects 0.000 description 1
- 230000004186 co-expression Effects 0.000 description 1
- 239000002131 composite material Substances 0.000 description 1
- 229940124301 concurrent medication Drugs 0.000 description 1
- 238000010276 construction Methods 0.000 description 1
- 230000009089 cytolysis Effects 0.000 description 1
- 238000007405 data analysis Methods 0.000 description 1
- 230000029087 digestion Effects 0.000 description 1
- 239000012149 elution buffer Substances 0.000 description 1
- 238000010201 enrichment analysis Methods 0.000 description 1
- 210000003743 erythrocyte Anatomy 0.000 description 1
- 229960000403 etanercept Drugs 0.000 description 1
- 238000001914 filtration Methods 0.000 description 1
- 230000006870 function Effects 0.000 description 1
- 230000023266 generation of precursor metabolites and energy Effects 0.000 description 1
- 230000036039 immunity Effects 0.000 description 1
- 230000001939 inductive effect Effects 0.000 description 1
- 229960000598 infliximab Drugs 0.000 description 1
- 230000003993 interaction Effects 0.000 description 1
- 230000001404 mediated effect Effects 0.000 description 1
- 229960000485 methotrexate Drugs 0.000 description 1
- 238000012775 microarray technology Methods 0.000 description 1
- 230000009456 molecular mechanism Effects 0.000 description 1
- 238000010606 normalization Methods 0.000 description 1
- 125000003729 nucleotide group Chemical group 0.000 description 1
- 230000010627 oxidative phosphorylation Effects 0.000 description 1
- 210000005259 peripheral blood Anatomy 0.000 description 1
- 239000011886 peripheral blood Substances 0.000 description 1
- 238000005498 polishing Methods 0.000 description 1
- 239000013641 positive control Substances 0.000 description 1
- 230000008569 process Effects 0.000 description 1
- 238000011160 research Methods 0.000 description 1
- 230000024428 response to biotic stimulus Effects 0.000 description 1
- 230000008399 response to wounding Effects 0.000 description 1
- 238000004062 sedimentation Methods 0.000 description 1
- 230000019491 signal transduction Effects 0.000 description 1
- 230000011664 signaling Effects 0.000 description 1
- 238000002626 targeted therapy Methods 0.000 description 1
- 238000005406 washing Methods 0.000 description 1
Images



Classifications
-
- C—CHEMISTRY; METALLURGY
- C12—BIOCHEMISTRY; BEER; SPIRITS; WINE; VINEGAR; MICROBIOLOGY; ENZYMOLOGY; MUTATION OR GENETIC ENGINEERING
- C12Q—MEASURING OR TESTING PROCESSES INVOLVING ENZYMES, NUCLEIC ACIDS OR MICROORGANISMS; COMPOSITIONS OR TEST PAPERS THEREFOR; PROCESSES OF PREPARING SUCH COMPOSITIONS; CONDITION-RESPONSIVE CONTROL IN MICROBIOLOGICAL OR ENZYMOLOGICAL PROCESSES
- C12Q1/00—Measuring or testing processes involving enzymes, nucleic acids or microorganisms; Compositions therefor; Processes of preparing such compositions
- C12Q1/68—Measuring or testing processes involving enzymes, nucleic acids or microorganisms; Compositions therefor; Processes of preparing such compositions involving nucleic acids
- C12Q1/6876—Nucleic acid products used in the analysis of nucleic acids, e.g. primers or probes
- C12Q1/6883—Nucleic acid products used in the analysis of nucleic acids, e.g. primers or probes for diseases caused by alterations of genetic material
-
- C—CHEMISTRY; METALLURGY
- C12—BIOCHEMISTRY; BEER; SPIRITS; WINE; VINEGAR; MICROBIOLOGY; ENZYMOLOGY; MUTATION OR GENETIC ENGINEERING
- C12Q—MEASURING OR TESTING PROCESSES INVOLVING ENZYMES, NUCLEIC ACIDS OR MICROORGANISMS; COMPOSITIONS OR TEST PAPERS THEREFOR; PROCESSES OF PREPARING SUCH COMPOSITIONS; CONDITION-RESPONSIVE CONTROL IN MICROBIOLOGICAL OR ENZYMOLOGICAL PROCESSES
- C12Q2600/00—Oligonucleotides characterized by their use
- C12Q2600/106—Pharmacogenomics, i.e. genetic variability in individual responses to drugs and drug metabolism
-
- C—CHEMISTRY; METALLURGY
- C12—BIOCHEMISTRY; BEER; SPIRITS; WINE; VINEGAR; MICROBIOLOGY; ENZYMOLOGY; MUTATION OR GENETIC ENGINEERING
- C12Q—MEASURING OR TESTING PROCESSES INVOLVING ENZYMES, NUCLEIC ACIDS OR MICROORGANISMS; COMPOSITIONS OR TEST PAPERS THEREFOR; PROCESSES OF PREPARING SUCH COMPOSITIONS; CONDITION-RESPONSIVE CONTROL IN MICROBIOLOGICAL OR ENZYMOLOGICAL PROCESSES
- C12Q2600/00—Oligonucleotides characterized by their use
- C12Q2600/158—Expression markers
Definitions
- the present invention pertains to a method for determining a biological pathway activity, said biological pathway being associated with a disease. More precisely, the method consists in evaluating the level of activity of said pathway in a patient suffering from said disease, based on gene expression profiling. The invention also concerns the application of such method to targeted therapies.
- genes show similar expression patterns (1) which may share biological functions under common regulatory control. Moreover, these co-expressed genes are frequently clustered according to their expression patterns in subsets of experimental conditions (2). Thus, gene co-expression instead of differential expression could be informative as well.
- the inventors have developed a method for determining a level of activity of a biological pathway of a patient suffering from a disease, providing a response indicative of the activity or non activity of said biological pathway, which avoids misclassifications.
- the method of the present invention permits to identify truly active biological networks associating only with high levels of correlation of biological signature components. Indeed, taking into account this new correlation aspect for the interpretation of biological networks should allow to capture the actually activated mechanisms at the cellular level.
- RA rheumatoid arthritis
- the invention is not restricted to RA, it extends to any pathology with which at least one biological pathway can be associated.
- said pathology may be systemic lupus erythematosus (SLE), multiple sclerosis (MS), Sjögren's syndrome, type I diabetes, dermatomyositis, etc....
- the method of the invention for determining a level of activity of a biological pathway from a biological sample of a patient suffering from a pathology comprises the following steps:
- control individual encompasses any individual wherein said pathology is not diagnosed, in particular it encompasses healthy individuals, patients suffering from any other pathology than said pathology, asymptomatic patients suffering from said pathology.
- the present invention also concerns a method for in vitro establishing a prognosis to develop a pathology for an healthy individual, by determining a level of activity of a biological pathway, said method comprising the steps of:
- the correlation score is lower to the predetermined threshold that is indicative of the non activity of the biological pathway, that means that the healthy individual could not develop the pathology
- the correlation score is upper or equal to the predetermined threshold that is indicative of the activity of the biological pathway, that means that the healthy individual could develop the pathology.
- the invention also relates to a method for in vitro establishing a diagnosis of a pathology for a patient, by determining a level of activity of a biological pathway, said method comprising the steps of:
- the correlation score is lower to the predetermined threshold that is indicative of the non activity of the biological pathway, that means that the patient does not suffer from the pathology associated with the activity of the biological pathway, and
- the correlation score is upper or equal to the predetermined threshold that is indicative of the activity of the biological pathway, that means that the patient suffers from the pathology associated with the activity of the biological pathway.
- the invention also pertains to the use of the above-described method for targeted/individualized therapies.
- the present invention also concerns a method for assessing whether a patient having a pathology is in need of a drug administration, said drug interacting directly or indirectly with a biological pathway, in which the biological activity of the biological pathway is determined and said biological activity is associated with said pathology, said method comprising the steps of:
- the correlation score is lower to the predetermined threshold that is indicative of the non activity of the biological pathway, that means that the patient needs administration of the drug .
- the correlation score is upper or equal to the predetermined threshold that is indicative of the activity of the biological pathway, that means that the patient does not need administration of the drug.
- a further subject of the invention is a method for monitoring the treatment response of a patient to the administration of a drug, said drug interacting directly or indirectly with a biological pathway, in which the biological activity of the biological pathway is determined and said biological activity is associated with a pathology, said method comprising the steps of:
- the correlation score is lower to the predetermined threshold that is indicative of the non activity of the biological pathway, that means that the patient is a bad responder to the drug
- the correlation score is upper or equal to the predetermined threshold that is indicative of the activity of the biological pathway, that means that the patient is a good responder to the drug.
- the level activity of said at least three genes is determined by analyzing the expression level of nucleic acids or proteins in said sample.
- Said nucleic acids comprise RNAs or cDNAs obtained from said RNAs including long and small RNAs such as mRNAs, miRNAs.
- a biological sample from the patient may be a tissue sample or a fluid sample, such as a sample of blood, plasma, serum, urine, synovial fluid and cerebrospinal fluid.
- the inventors selected the signature of interferon (IFN)-inducible genes as an example to study correlation levels between genes composing that signature.
- IFN interferon
- type I interferon type I interferon
- IFN regulated genes have been reported in different diseases like rheumatoid arthritis (RA), systemic lupus erythematosus (SLE) (4), systemic sclerosis (8), multiple sclerosis (9) and in tissues from patients with Sjögren's syndrome (10), type I diabetes (11-13) and dermatomyositis (12).
- RA rheumatoid arthritis
- SLE systemic lupus erythematosus
- 9 multiple sclerosis
- dermatomyositis (12)
- an IFN "score” is calculated from common methods, i.e, the IFN "score” is calculated for each patient and control based on the average expression of genes which composed the signature.
- this approach does not take into account the co-regulation of these IFN inducible genes. In fact, genes with similar functions usually are co-expressed under certain experimental conditions only.
- the following experimental part illustrates, by way of example and not by way of limitation, the development of a method of the invention wherein said biological pathway concerns the expression of a human type I interferon (IFN) and the pathology is rheumatoid arthritis (RA), said method involving 35 genes associated with said pathway.
- IFN human type I interferon
- RA rheumatoid arthritis
- RA patients fulfilling the revised American College of Rheumatology 1987 criteria for RA were enrolled. Their clinical characteristics are shown in Table 1.
- IFN high 10 systemic lupus erythematosus patients (SLE) fulfilling the American College of Rheumatology criteria for the SLE were studied.
- SLE systemic lupus erythematosus patients
- HC healthy control subjects
- the table 1 describes the demographic and clinical characteristics of the patients and healthy control subjects.
- RNA samples were collected in PAXgene TM Blood RNA tubes (PreAnalytix, Hilden, Germany) in order to stabilize mRNA (14). Blood samples were incubated at room temperature for 2 h, and then stored at -20°C until RNA extraction according to the manufacturer's instructions. Briefly, RNA was isolated using the PAXgene TM Blood RNA kit (PreAnalytix). Following cell lysis, nucleic acids were pelleted and treated with a buffer containing proteinase K.
- RNA was subsequently purified on PAXgene TM spin columns and eluted in 80 ⁇ l of elution buffer.
- RNA integrity was assessed using RNA 6000 nano chips and the Agilent 2100 Bioanalyzer (Agilent Technologies, Waldbronn, Germany) according to the manufacturer's instructions.
- the RNA integrity number (RIN) was obtained from the entire electrophoretic trace of the RNA sample.
- cDNA was synthesized from 50 ng of total RNA using the WT-Ovation TM System (NuGEN, San Carlos, CA, USA) powered by Ribo-SPIA TM technology.
- Fragmented cDNA was end labeled with a biotin-conjugated nucleotide analog (DLR-1a; Affymetrix, Santa Clara, CA, USA) using terminal transferase (Roche Diagnostics, Mannheim, Germany). Fragmented and labeled cDNA was hybridized for 18 h at 50°C in a hybridization solution containing 7% DMSO. Hybridization was performed using GeneChip ® Human Genome U133 Plus 2.0 arrays (Affymetrix), containing 54,675 probe sets corresponding to 38,500 identified genes. After washing, chips were stained with streptavidin-phycoerythrin according to Affymetrix EukGE-WS2v4 protocol using the Fluidic FS450 station.
- DLR-1a biotin-conjugated nucleotide analog
- the microarrays were read with the GeneChip ® Scanner 3000 (Affymetrix).
- Affymetrix GeneChip Operating Software version 1.4 (GCOS) was used to manage Affymetrix GeneChip array data and to automate the control of GeneChip fluidics stations and scanners.
- RMA Robust Multi-array Average
- the SAMBA algorithm (Statistical-Algorithmic Method for Bicluster Analysis) implemented in EXPANDER 4.0.3 (EXPression ANalyzer and DisplayER) was used for the biclustering (17).
- This algorithm uses probabilistic modeling of the data and theoretical graph techniques to identify such subsets of genes that behave similarly across a subset of patients (18).
- the TANGO algorithm (Tool for Analysis of GO enrichment), implemented in EXPANDER 4.0.3, was used to identify the biological significance of these biclusters (17).
- CABS Biological Signature
- a classification algorithm was developed to identify individuals with or without the type I IFN gene biological signature. Applied to the IFN-inducible genes, the CABS is divided into three steps.
- Step 1 Prototype construction: Two groups of RA patients (IFN high ; IFN low ) were identified from the hierarchical clustering representing the 35 IFN-inducible genes which characterized the IFN signature ( Figure 1 ). The prototype was defined from these two groups. Median expression values was calculated in the two groups. Prototype Pi was defined from group i ; the vector ( Gi 1 ,.., Gi M ) represents the expression of the prototype Pi , where i is high or low, Gij is the median expression of gene j in group i, M is the size of the IFN signature.
- Step 3 Decision making: The following rule was applied to classify the individuals. High IFN signature was assigned if D high_low ⁇ 1 . Inversely, low IFN signature was attributed if D high_low ⁇ 1 .
- the identified biclusters were represented by 15 functional biological processes (Table 2) TABLE 2: Ontological analysis of the 121 biclusters obtained from the 102 RA patients Biological process Corrected p-value immune response a 0.001 response to virus a 0.001 generation of precursor metabolites and energy 0.001 oxidative phosphorylation 0.001 cellular defense response 0.001 biosynthetic process 0.001 Cytolysis 0.001 response to biotic stimulus 0.001 signal transduction 0.001 response to wounding 0.001 cell surface receptor linked signal transduction 0.007 cell communication 0.013 B cell activation 0.037 cell adhesion 0.048 Processes with corrected p value ⁇ 0.05 were considered significant (17). a Biological terms composed of 95% IFN mediated immunity genes.
- the expression pattern of 35 IFN-response genes was defined as the "IFN signature".
- IFN signature The expression pattern of 35 IFN-response genes was defined as the "IFN signature".
- a classification algorithm was applied to obtain a better characterization of the IFN signature based on the correlation of the 35 gene expression levels. The results showed that the IFN signature presented a large variation between individuals ( Figure 3 ).
- the method of the present invention permits to identify truly active biological networks associating only with high levels of correlation of biological signature components. This new correlation aspect for the interpretation of biological networks allows capturing the actually activated mechanisms at the cellular level.
- Such correlation-based approach can be advantageously applied to investigate the dynamics of evolution of cellular mechanisms like response to treatment.
- the inventors have applied this method to monitor patients treated by anti-TNF therapy.
- the method illustrating the present invention and using CABS allows to pinpoint type I IFN signaling as a means to stratify RA patients even starting with whole blood transcriptomics analysis from samples collected in PAXgene tubes. Similar analyses can be performed for the other identified biclusters, highlighting the obvious advantage of whole blood transcriptomics.
- the use of correlations shows interest in the characterization of the genes sharing both an expression pattern and a biological function. The use of expression correlations is a better way to obtain a global picture of an activated signature in various disease conditions.
Landscapes
- Chemical & Material Sciences (AREA)
- Life Sciences & Earth Sciences (AREA)
- Proteomics, Peptides & Aminoacids (AREA)
- Health & Medical Sciences (AREA)
- Organic Chemistry (AREA)
- Wood Science & Technology (AREA)
- Analytical Chemistry (AREA)
- Zoology (AREA)
- Genetics & Genomics (AREA)
- Engineering & Computer Science (AREA)
- Pathology (AREA)
- Immunology (AREA)
- Microbiology (AREA)
- Molecular Biology (AREA)
- Biotechnology (AREA)
- Biophysics (AREA)
- Physics & Mathematics (AREA)
- Biochemistry (AREA)
- Bioinformatics & Cheminformatics (AREA)
- General Engineering & Computer Science (AREA)
- General Health & Medical Sciences (AREA)
- Measuring Or Testing Involving Enzymes Or Micro-Organisms (AREA)
Abstract
Method for determining a level of activity of a biological pathway from a biological sample of a patient suffering from a pathology, said method comprising the steps of:
measuring the level of expression of at least three genes from a group of individuals, control individuals or patients, for which the biological pathway is inactive, said at least three genes being associated to said biological pathway, for establishing a negative reference, and
measuring level of expression of said at least three genes from a group of individuals, control individuals or patients, for which the biological pathway is active, for establishing a positive reference, and
measuring the level of expression of said at least three genes of said patient in the sample, and
comparing the level of expression of said at least three genes in the sample of said patient with the level of expression of said at least three genes of the negative reference and determining a value C- which corresponds to a correlation level between the level of expression of said at least three genes of said negative reference and the level of expression of said at least three genes of said patient, and
comparing the level of expression of said at least three genes in the sample of said patient with the level of expression of said at least three genes of the positive reference and determining a value C+ which corresponds to a correlation level between the level of expression of said at least three genes of said positive reference and the level of expression of said at least three genes of said patient, and
establishing a ratio C+/C- which gives a correlation score, wherein
if the correlation score is lower to the predetermined threshold that is indicative of the non activity of the biological pathway, and
if the correlation score is upper or equal to the predetermined threshold that is indicative of the activity of the biological pathway.
measuring the level of expression of at least three genes from a group of individuals, control individuals or patients, for which the biological pathway is inactive, said at least three genes being associated to said biological pathway, for establishing a negative reference, and
measuring level of expression of said at least three genes from a group of individuals, control individuals or patients, for which the biological pathway is active, for establishing a positive reference, and
measuring the level of expression of said at least three genes of said patient in the sample, and
comparing the level of expression of said at least three genes in the sample of said patient with the level of expression of said at least three genes of the negative reference and determining a value C- which corresponds to a correlation level between the level of expression of said at least three genes of said negative reference and the level of expression of said at least three genes of said patient, and
comparing the level of expression of said at least three genes in the sample of said patient with the level of expression of said at least three genes of the positive reference and determining a value C+ which corresponds to a correlation level between the level of expression of said at least three genes of said positive reference and the level of expression of said at least three genes of said patient, and
establishing a ratio C+/C- which gives a correlation score, wherein
if the correlation score is lower to the predetermined threshold that is indicative of the non activity of the biological pathway, and
if the correlation score is upper or equal to the predetermined threshold that is indicative of the activity of the biological pathway.
Description
- The present invention pertains to a method for determining a biological pathway activity, said biological pathway being associated with a disease. More precisely, the method consists in evaluating the level of activity of said pathway in a patient suffering from said disease, based on gene expression profiling. The invention also concerns the application of such method to targeted therapies.
- A wide range of methods for microarray data analysis have evolved, ranging from simple fold-change approaches to many complex and computationally demanding techniques. Gene expression profiling by microarray technology has become a widely used strategy for investigating the molecular mechanisms underlying many complex diseases. However, the analysis is further complicated by the biological heterogeneity encountered in most of the diseases.
- A common observation in the analysis of gene expression is that many genes show similar expression patterns (1) which may share biological functions under common regulatory control. Moreover, these co-expressed genes are frequently clustered according to their expression patterns in subsets of experimental conditions (2). Thus, gene co-expression instead of differential expression could be informative as well.
- However, the method commonly used in the literature does not take into account the activation status of the biological signature, which can generate some misclassification (3-7).
- Thus, the inventors have developed a method for determining a level of activity of a biological pathway of a patient suffering from a disease, providing a response indicative of the activity or non activity of said biological pathway, which avoids misclassifications.
- The method of the present invention permits to identify truly active biological networks associating only with high levels of correlation of biological signature components. Indeed, taking into account this new correlation aspect for the interpretation of biological networks should allow to capture the actually activated mechanisms at the cellular level.
- The development, the interest and the illustration of a method of the invention is below exposed in relation with rheumatoid arthritis (RA). Of course, the invention is not restricted to RA, it extends to any pathology with which at least one biological pathway can be associated. As a further example, said pathology may be systemic lupus erythematosus (SLE), multiple sclerosis (MS), Sjögren's syndrome, type I diabetes, dermatomyositis, etc....
- The method of the invention for determining a level of activity of a biological pathway from a biological sample of a patient suffering from a pathology comprises the following steps:
- measuring the level of expression of at least three genes from a group of individuals, control individuals or patients suffering from the pathology, for which the biological pathway is inactive, said at least three genes being associated to said biological pathway, for establishing a negative reference, and
- measuring level of expression of said at least three genes from a group of individuals, control individuals or patients suffering from the pathology, for which the biological pathway is active, for establishing a positive reference, and
- measuring the level of expression of said at least three genes of said patient in the sample, and
- comparing the level of expression of said at least three genes in the sample of said patient with the level of expression of said at least three genes of the negative reference and determining a value C- which corresponds to a correlation level between the level of expression of said at least three genes of said negative reference and the level of expression of said at least three genes of said patient, and
- comparing the level of expression of said at least three genes in the sample of said patient with the level of expression of said at least three genes of the positive reference and determining a value C+ which corresponds to a correlation level between the level of expression of said at least three genes of said positive reference and the level of expression of said at least three genes of said patient, and
- establishing a ratio C+/C- which gives a correlation score, wherein
- if the correlation score is lower to the predetermined threshold that is indicative of the non activity of the biological pathway, and
- if the correlation score is upper or equal to the predetermined threshold that is indicative of the activity of the biological pathway.
- In accordance with the present invention, the phrase "control individual" encompasses any individual wherein said pathology is not diagnosed, in particular it encompasses healthy individuals, patients suffering from any other pathology than said pathology, asymptomatic patients suffering from said pathology.
- The present invention also concerns a method for in vitro establishing a prognosis to develop a pathology for an healthy individual, by determining a level of activity of a biological pathway, said method comprising the steps of:
- providing a sample from the healthy individual,
- measuring the level of expression of at least three genes from a group of individuals, control individuals or patients suffering from the pathology, for which the biological pathway is inactive, said at least three genes being associated to said biological pathway, for establishing a negative reference, and
- measuring level of expression of said at least three genes from a group of individuals, control individuals or patients suffering from the pathology, for which the biological pathway is active, for establishing a positive reference, and
- measuring the level of expression of said at least three genes of said healthy individual in the sample, and
- comparing the level of expression of said at least three genes in the sample of said healthy individual with the level of expression of said at least three genes of the negative reference and determining a value C- which corresponds to a correlation level between the level of expression of said at least three genes of said negative reference and the level of expression of said at least three genes of said control individual, and
- comparing the level of expression of said at least three genes in the sample of said healthy individual with the level of expression of said at least three genes of the positive reference and determining a value C+ which corresponds to a correlation level between the level of expression of said at least three genes of said positive reference and the level of expression of said at least three genes of said control individual, and
- establishing a ratio C+/C- which gives a correlation score, wherein
- if the correlation score is lower to the predetermined threshold that is indicative of the non activity of the biological pathway, that means that the healthy individual could not develop the pathology, and
- if the correlation score is upper or equal to the predetermined threshold that is indicative of the activity of the biological pathway, that means that the healthy individual could develop the pathology.
- In another embodiment, the invention also relates to a method for in vitro establishing a diagnosis of a pathology for a patient, by determining a level of activity of a biological pathway, said method comprising the steps of:
- providing a sample from the patient,
- measuring the level of expression of at least three genes from a group of individuals, control individuals or patients suffering from the pathology, for which the biological pathway is inactive, said at least three genes being associated to said biological pathway, for establishing a negative reference, and
- measuring level of expression of said at least three genes from a group of individuals, control individuals or patients suffering from the pathology, for which the biological pathway is active, for establishing a positive reference, and
- measuring the level of expression of said at least three genes of said patient in the sample, and
- comparing the level of expression of said at least three genes in the sample of said patient with the level of expression of said at least three genes of the negative reference and determining a value C- which corresponds to a correlation level between the level of expression of said at least three genes of said negative reference and the level of expression of said at least three genes of said patient, and
- comparing the level of expression of said at least three genes in the sample of said patient with the level of expression of said at least three genes of the positive reference and determining a value C+ which corresponds to a correlation level between the level of expression of said at least three genes of said positive reference and the level of expression of said at least three genes of said patient, and
- establishing a ratio C+/C- which gives a correlation score, wherein
- if the correlation score is lower to the predetermined threshold that is indicative of the non activity of the biological pathway, that means that the patient does not suffer from the pathology associated with the activity of the biological pathway, and
- if the correlation score is upper or equal to the predetermined threshold that is indicative of the activity of the biological pathway, that means that the patient suffers from the pathology associated with the activity of the biological pathway.
- As mentioned above, the invention also pertains to the use of the above-described method for targeted/individualized therapies.
- Hence, the present invention also concerns a method for assessing whether a patient having a pathology is in need of a drug administration, said drug interacting directly or indirectly with a biological pathway, in which the biological activity of the biological pathway is determined and said biological activity is associated with said pathology, said method comprising the steps of:
- providing a sample from the patient,
- measuring the level of expression of at least three genes from a group of individuals, control individuals or patients, for which the biological pathway is inactive, said at least three genes being associated to said biological pathway, for establishing a negative reference, and
- measuring level of expression of said at least three genes from a group of individuals, control individuals or patients, for which the biological pathway is active, for establishing a positive reference, and
- measuring the level of expression of said at least three genes of said patient in the sample, and
- comparing the level of expression of said at least three genes in the sample of said patient with the level of expression of said at least three genes of the negative reference and determining a value C- which corresponds to a correlation level between the level of expression of said at least three genes of said negative reference and the level of expression of said at least three genes of said patient, and
- comparing the level of expression of said at least three genes in the sample of said patient with the level of expression of said at least three genes of the positive reference and determining a value C+ which corresponds to a correlation level between the level of expression of said at least three genes of said positive reference and the level of expression of said at least three genes of said patient, and
- establishing a ratio C+/C- which gives a correlation score, wherein
- if the correlation score is lower to the predetermined threshold that is indicative of the non activity of the biological pathway, that means that the patient needs administration of the drug , and
- if the correlation score is upper or equal to the predetermined threshold that is indicative of the activity of the biological pathway, that means that the patient does not need administration of the drug.
- A further subject of the invention is a method for monitoring the treatment response of a patient to the administration of a drug, said drug interacting directly or indirectly with a biological pathway, in which the biological activity of the biological pathway is determined and said biological activity is associated with a pathology, said method comprising the steps of:
- providing a sample from the patient,
- measuring the level of expression of at least three genes from a group of individuals, control individuals or patients, for which the biological pathway is inactive, said at least three genes being associated to said biological pathway, for establishing a negative reference, and
- measuring level of expression of said at least three genes from a group of individuals, control individuals or patients, for which the biological pathway is active, for establishing a positive reference, and
- measuring the level of expression of said at least three genes of said patient in the sample, and
- comparing the level of expression of said at least three genes in the sample of said patient with the level of expression of said at least three genes of the negative reference and determining a value C- which corresponds to a correlation level between the level of expression of said at least three genes of said negative reference and the level of expression of said at least three genes of said patient, and
- comparing the level of expression of said at least three genes in the sample of said patient with the level of expression of said at least three genes of the positive reference and determining a value C+ which corresponds to a correlation level between the level of expression of said at least three genes of said positive reference and the level of expression of said at least three genes of said patient, and
- establishing a ratio C+/C- which gives a correlation score, wherein
- if the correlation score is lower to the predetermined threshold that is indicative of the non activity of the biological pathway, that means that the patient is a bad responder to the drug, and
- if the correlation score is upper or equal to the predetermined threshold that is indicative of the activity of the biological pathway, that means that the patient is a good responder to the drug.
- Preferred embodiments of the methods in accordance with the invention are below disclosed, said embodiments being taken alone or in combination.
- Hence, according to an preferred embodiment, the level activity of said at least three genes is determined by analyzing the expression level of nucleic acids or proteins in said sample. Said nucleic acids comprise RNAs or cDNAs obtained from said RNAs including long and small RNAs such as mRNAs, miRNAs.
- A biological sample from the patient may be a tissue sample or a fluid sample, such as a sample of blood, plasma, serum, urine, synovial fluid and cerebrospinal fluid.
- In their study, the inventors selected the signature of interferon (IFN)-inducible genes as an example to study correlation levels between genes composing that signature.
- Accordingly, preferred methods as described above involve a biological pathway of type I interferon (type I IFN).
- Indeed, the increase of IFN regulated genes has been reported in different diseases like rheumatoid arthritis (RA), systemic lupus erythematosus (SLE) (4), systemic sclerosis (8), multiple sclerosis (9) and in tissues from patients with Sjögren's syndrome (10), type I diabetes (11-13) and dermatomyositis (12). But, to characterize the IFN signature, an IFN "score" is calculated from common methods, i.e, the IFN "score" is calculated for each patient and control based on the average expression of genes which composed the signature. However, as explained above, this approach does not take into account the co-regulation of these IFN inducible genes. In fact, genes with similar functions usually are co-expressed under certain experimental conditions only.
- The following experimental part illustrates, by way of example and not by way of limitation, the development of a method of the invention wherein said biological pathway concerns the expression of a human type I interferon (IFN) and the pathology is rheumatoid arthritis (RA), said method involving 35 genes associated with said pathway.
-
-
Figure 1 . Genes expression profiles from the IFN signature.
Unsupervised hierarchical clustering of 35 IFN-inducible genes that distinguish rheumatoid arthritis (RA) patients IFNhigh (dendrogram①) from RA patients IFNlow (dendrogram ②). Each row represents a gene; each column shows the expression for 35 IFN-inducible genes expressed by each patients. Dark grey indicates genes that are expressed at higher levels and light grey indicates genes that are expressed at lower levels. -
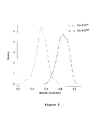
Figure 2 . Correlation profiles from sub-groups of rheumatoid arthritis (RA) patients.
A correlation index was defined for each gene of the IFN signature as the median of its correlations with the remaining genes. Thus, the correlation profiles for the different groups, RA IFNlow (dotted line) and RA IFNhigh (continuous line), are represented using the 35 calculated correlation indexes. The median values of the correlation indexes obtained from the different groups are 0.33 and 0.63, respectively. -
Figure 3 . Stratification of individuals according to the IFN signature. Each point represents a single individual with the decision variable calculated from the Classification Algorithm based on a Biological Signature (CABS). The shaded box indicates the normal range according to the rule of the CABS: If Dhigh_low ≥ 1 "high signature" and If Dhigh_low < 1 "low signature" knowing that Dhigh_low = CORhigh / CORlow. -
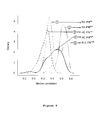
Figure 4 . Correlation profiles from the different groups. A correlation index was defined for each gene of the IFN signature as the median of its correlations with the remaining genes. Thus, the correlation profiles for the different groups: healthy controls (HC) IFNlow (③), HC IFNhigh (④), rheumatoid arthritis patients (RA) IFNlow (①) and RA IFNhigh (②) and systemic lupus erythematosus patients (SLE) IFNhigh (⑤), are represented using the 35 calculated correlation indexes from the IFN signature genes. The median values of the correlation indexes obtained from the different groups are0.27, 0.44, 0.33, 0.63 and 0.68, respectively. -
Figure 5 . Follow-up the IFN signature in patients with rheumatoid arthritis (RA) treated with anti-TNF.
Each point represents a single individual with the decision variable calculated from the Classification Algorithm based on a Biological Signature (CABS). The shaded box indicates the normal range according to the rule of the CABS: If Dhigh_low ≥ 1 "high signature" and If Dhigh_low < 1 "low signature" knowing that Dhigh_low = CORhigh / CORlow. The Wilcoxon signed rank test was used to evaluate the statistical significance between patients before and after anti-TNF treatment A) (*p = 0.0186) B) (**p = 0.002). The results show that a high IFN signature is conserved after anti-TNF treatment (Figure 5A ), while a significant increase was observed in RA IFNlow six months after treatment (Figure 5B ). - 102 RA patients fulfilling the revised American College of Rheumatology 1987 criteria for RA were enrolled. Their clinical characteristics are shown in Table 1. As an IFN positive control group (IFNhigh), 10 systemic lupus erythematosus patients (SLE) fulfilling the American College of Rheumatology criteria for the SLE were studied. In addition, 100 age- and sex-matched healthy control subjects (HC) without any familial history of RA, autoimmune disease and concomitant medication were also recruited. All subjects provided written informed consent and the study was approved by the local Ethical Committee for clinical research. The table 1 describes the demographic and clinical characteristics of the patients and healthy control subjects.
TABLE 1: Demographic and clinical characteristics of the patients and control subjects RA (n=102) SLE (n=10) C (n=100) Demographic data Agea 50(40,3-60) 37(34-44) 57(52-63) Sex: Female, Male 79F, 23M 10F 86F, 14M Disease characteristics ESRa 18 (8-44) NA NA Rheumatoid Factor pos.(%) 70 (68,6) NA NA Disease duration (years) a 5 (2-9) 4 (3-6) NA Disease activity 4,2 (3,3-5,2)b 13 (12-17.5)c NA Medication MTX (%) 87 (85,3) NA NA MTX dosea 15 (15-20) NA NA Median (Q1-Q3) b DAS28: Disease Activity Score
c SLEDAI: Systemic Lupus Erythematosus Disease Activity Index
ESR: Erythrocyte Sedimentation Rate; MTX: Methotrexate - Sample collection, processing and microarray hybridization Peripheral blood samples were collected in PAXgene™ Blood RNA tubes (PreAnalytix, Hilden, Germany) in order to stabilize mRNA (14). Blood samples were incubated at room temperature for 2 h, and then stored at -20°C until RNA extraction according to the manufacturer's instructions. Briefly, RNA was isolated using the PAXgene™ Blood RNA kit (PreAnalytix). Following cell lysis, nucleic acids were pelleted and treated with a buffer containing proteinase K. After digestion with a RNase-free DNase (Qiagen, Valencia, CA, USA), RNA was subsequently purified on PAXgene™ spin columns and eluted in 80 µl of elution buffer. RNA integrity was assessed using RNA 6000 nano chips and the Agilent 2100 Bioanalyzer (Agilent Technologies, Waldbronn, Germany) according to the manufacturer's instructions. The RNA integrity number (RIN) was obtained from the entire electrophoretic trace of the RNA sample. cDNA was synthesized from 50 ng of total RNA using the WT-Ovation™ System (NuGEN, San Carlos, CA, USA) powered by Ribo-SPIA™ technology. Fragmented cDNA was end labeled with a biotin-conjugated nucleotide analog (DLR-1a; Affymetrix, Santa Clara, CA, USA) using terminal transferase (Roche Diagnostics, Mannheim, Germany). Fragmented and labeled cDNA was hybridized for 18 h at 50°C in a hybridization solution containing 7% DMSO. Hybridization was performed using GeneChip® Human Genome U133 Plus 2.0 arrays (Affymetrix), containing 54,675 probe sets corresponding to 38,500 identified genes. After washing, chips were stained with streptavidin-phycoerythrin according to Affymetrix EukGE-WS2v4 protocol using the Fluidic FS450 station. The microarrays were read with the GeneChip® Scanner 3000 (Affymetrix). Affymetrix GeneChip Operating Software version 1.4 (GCOS) was used to manage Affymetrix GeneChip array data and to automate the control of GeneChip fluidics stations and scanners.
- Expression data were generated using the Robust Multi-array Average (RMA) method (15) implemented in the Affy package of the Bioconductor microarray analysis environment (http://www.bioconductor.org). The RMA method consists of three steps: background adjustment, quantile normalization (16) and probe set summary of the log-normalized data applying a median polishing procedure. Before subsequent patient stratification, non informative genes showing very low expression levels and low variability across microarrays were excluded.
- The SAMBA algorithm (Statistical-Algorithmic Method for Bicluster Analysis) implemented in EXPANDER 4.0.3 (EXPression ANalyzer and DisplayER) was used for the biclustering (17). This algorithm uses probabilistic modeling of the data and theoretical graph techniques to identify such subsets of genes that behave similarly across a subset of patients (18).
- The TANGO algorithm (Tool for Analysis of GO enrichment), implemented in EXPANDER 4.0.3, was used to identify the biological significance of these biclusters (17).
- A classification algorithm was developed to identify individuals with or without the type I IFN gene biological signature. Applied to the IFN-inducible genes, the CABS is divided into three steps.
-
Step 1 Prototype construction: Two groups of RA patients (IFNhigh; IFNlow) were identified from the hierarchical clustering representing the 35 IFN-inducible genes which characterized the IFN signature (Figure 1 ). The prototype was defined from these two groups. Median expression values was calculated in the two groups. Prototype Pi was defined from group i; the vector (Gi1 ,.., GiM ) represents the expression of the prototype Pi, where i is high or low, Gij is the median expression of gene j in group i, M is the size of the IFN signature. -
Step 2 Decision variable calculation: For a given individual, the IFN gene expression profiles corresponding to a vector with a size of 35 genes were extracted. Pearson correlation of genes related to the IFN signature was evaluated with both prototypes and denoted CORhigh and CORlow. The decision variable calculation was given by the ratio between these two correlations: Dhigh_low = CORhigh / CORlow -
Step 3 Decision making: The following rule was applied to classify the individuals. High IFN signature was assigned if Dhigh_low ≥ 1. Inversely, low IFN signature was attributed if Dhigh_low < 1. - The study of biological data heterogeneity was conducted with a biclustering approach. This method using the SAMBA algorithm performs clustering on genes and conditions simultaneously in order to identify subsets of genes that show similar expression patterns across specific subsets of patients and vice versa. After data filtering, 121 biclusters were identified from 9,856 selected probe sets. To draw a clear picture of these co-expressed gene groups, the TANGO algorithm was used for GO functional enrichment analysis. The identified biclusters were represented by 15 functional biological processes (Table 2)
TABLE 2: Ontological analysis of the 121 biclusters obtained from the 102 RA patients Biological process Corrected p-value immune response a 0.001 response to virus a 0.001 generation of precursor metabolites and energy 0.001 oxidative phosphorylation 0.001 cellular defense response 0.001 biosynthetic process 0.001 Cytolysis 0.001 response to biotic stimulus 0.001 signal transduction 0.001 response to wounding 0.001 cell surface receptor linked signal transduction 0.007 cell communication 0.013 B cell activation 0.037 cell adhesion 0.048 Processes with corrected p value < 0.05 were considered significant (17).
a Biological terms composed of 95% IFN mediated immunity genes. - To focus on the IFN signature, the "immune response" and "response to virus" ontology groups, which represent a broad composite family, were selected. Interestingly, within this subgroup, 95% of 37 genes were known to be induced by IFN. The list of these 35 genes is presented in the right column of
figure 1 . - To visualize the expression profiles of the 35 IFN-response genes among all RA patients and to investigate their interactions, a hierarchical clustering was performed with the Spotfire Decision Site 8.2.1. This clustering separated the samples into two main groups, one of patients with RA (n = 26/102, 25.5%) with high expression (
Figure 1 , dendrogram ①) of this set of IFN-inducible genes (IFNhigh) and another (n = 76/102, 74.5%) with lower expression (Figure 1 , dendrogram ②) (IFNlow). - The expression pattern of 35 IFN-response genes was defined as the "IFN signature". To go further in the description of the IFN-induced genes, the correlation levels between the co-expressed genes were assessed in the two groups. Interestingly, the analysis revealed disparities between correlation levels. The group associated with high IFN expression level showed a better correlation (Rmedian = 0.63) than the other one (Rmedian = 0.33), with a significant difference (p = 8.46E-13), suggesting a functional difference in the activated state of these genes (
Figure 2 ). A classification algorithm was applied to obtain a better characterization of the IFN signature based on the correlation of the 35 gene expression levels. The results showed that the IFN signature presented a large variation between individuals (Figure 3 ). 15/100 HC (15%), 22/102 RA patients (22%) and 10/10 SLE patients (100%) with a decision variable ≥1 for the high signature (IFNhigh) were identified, while the remainder of individuals, with a decision variable <1, were defined as IFNlow. From the sub-groups identified by the CABS, the comparison of the correlation profiles showed heterogeneous distributions (Figure 4 ). Similarities were observed, first between RA and SLE patients associated with a high IFN signature presenting a median correlation of 0.63 and 0.68 respectively; second between RA patients and HC IFNlow presenting a median correlation of 0.33 and 0.27 respectively. However, despite a similar level of correlation (Rmedian = 0.44), the shape of the distribution curve (Figure 4 , ④) is very different from that seen for the high RA or SLE patients and for the low RA or controls. This could suggest a very heterogeneous activation status of genes in this group of controls. - The functional relationship between TNF inhibition and possible changes in IFN pathway activation was studied. CABS was used to assess the correlation levels in RA patients before and after anti-TNFα treatment. Out of the subgroup of 43 RA patients treated with anti-TNF, 22 RA patients (11 RA IFNhigh and 11 RA IFNlow ; infliximab n = 6, etanercept n = 10 and adalimumab n = 6) were evaluated at 6 months for treatment response using the DAS28 criteria. Although the values appeared quite heterogeneous, a statistical significant decrease (p = 0.0186) of the correlation level was observed in patients associated with high IFN signature (
Figure 5A ). In contrast, a statistical significant increase (p = 0.002) of correlation levels was seen in RA patients with low IFN signature before treatment (Figure 5B ). Despite a significant increase, the majority of these RA patients IFNlow did not reach the threshold of positivity. No statistical association was observed between the molecular stratification of RA patients (IFNhigh / IFNlow) and the clinical characteristics presented in table 1 or the response to treatment at 6 months. - The method of the present invention permits to identify truly active biological networks associating only with high levels of correlation of biological signature components. This new correlation aspect for the interpretation of biological networks allows capturing the actually activated mechanisms at the cellular level.
- Such correlation-based approach can be advantageously applied to investigate the dynamics of evolution of cellular mechanisms like response to treatment. As an example, in the context of RA, the inventors have applied this method to monitor patients treated by anti-TNF therapy.
- Interestingly also, the method illustrating the present invention and using CABS allows to pinpoint type I IFN signaling as a means to stratify RA patients even starting with whole blood transcriptomics analysis from samples collected in PAXgene tubes. Similar analyses can be performed for the other identified biclusters, highlighting the obvious advantage of whole blood transcriptomics. Using the example of the IFN signature, the use of correlations shows interest in the characterization of the genes sharing both an expression pattern and a biological function. The use of expression correlations is a better way to obtain a global picture of an activated signature in various disease conditions.
-
- 1. Eisen MB, Spellman PT, Brown PO, Botstein D. Cluster analysis and display of genome-wide expression patterns. Proc Natl Acad Sci U S A. 1998;95(25):14863-8.
- 2. Ben-Dor A, Chor B, Karp R, Yakhini Z. Discovering local structure in gene expression data: the order-preserving submatrix problem. J Comput Biol. 2003;10(3-4):373-84.
- 3. van der Pouw Kraan TC, Wijbrandts CA, van Baarsen LG, Voskuyl AE, Rustenburg F, Baggen JM, et al. Rheumatoid arthritis subtypes identified by genomic profiling of peripheral blood cells: assignment of a type I interferon signature in a subpopulation of patients. Ann Rheum Dis. 2007 Aug;66(8):1008-14.
- 4. Baechler EC, Batliwalla FM, Karypis G, Gaffney PM, Ortmann WA, Espe KJ, et al. Interferon-inducible gene expression signature in peripheral blood cells of patients with severe lupus. Proc Natl Acad Sci U S A. 2003;100(5):2610-5.
- 5. Baechler EC, Bauer JW, Slattery CA, Ortmann WA, Espe KJ, Novitzke J, et al. An interferon signature in the peripheral blood of dermatomyositis patients is associated with disease activity. Mol Med. 2007;13(1-2):59-68.
- 6. Bauer JW, Baechler EC, Petri M, Batliwalla FM, Crawford D, Ortmann WA, et al. Elevated serum levels of interferon-regulated chemokines are biomarkers for active human systemic lupus erythematosus. PLoS Med. 2006;3(12):e491.
- 7. Kirou KA, Lee C, George S, Louca K, Papagiannis IG, Peterson MG, et al. Coordinate overexpression of interferon-alpha-induced genes in systemic lupus erythematosus. Arthritis Rheum. 2004;50(12):3958-67.
- 8. Tan FK, Zhou X, Mayes MD, Gourh P, Guo X, Marcum C, et al. Signatures of differentially regulated interferon gene expression and vasculotrophism in the peripheral blood cells of systemic sclerosis patients. Rheumatology (Oxford). 2006;45(6):694-702.
- 9. van Baarsen LG, van der Pouw Kraan TC, Kragt JJ, Baggen JM, Rustenburg F, Hooper T, et al. A subtype of multiple sclerosis defined by an activated immune defense program. Genes Immun. 2006;7(6):522-31.
- 10. Bave U, Nordmark G, Lövgren T, Rönnelid J, Cajander S, Eloranta ML, et al. Activation of the type I interferon system in primary Sjögren's syndrome: a possible etiopathogenic mechanism. Arthritis Rheum. 2005;52(4):1185-95.
- 11. Reynier F, Pachot A, Paye M, Xu Q, Turrel-Davin F, Petit F, et al. Specific gene expression signature associated with development of autoimmune type-I diabetes using whole-blood microarray analysis. Genes Immun. 2010;11(3):269-78.
- 12. Greenberg SA, Pinkus JL, Pinkus GS, Burleson T, Sanoudou D, Tawil R, et al. Interferon-alpha/beta-mediated innate immune mechanisms in dermatomyositis. Ann Neurol. 2005;57(5):664-78.
- 13. Huang X, Yuang J, Goddard A, Foulis A, James RF, Lernmark A, et al. Interferon expression in the pancreases of patients with type I diabetes. Diabetes. 1995;44(6):658-64.
- 14. Rainen L, Oelmueller U, Jurgensen S, Wyrich R, Ballas C, Schram J, et al. Stabilization of mRNA expression in whole blood samples. Clin Chem. 2002 Nov;48(11):1883-90.
- 15. Irizarry RA, Hobbs B, Collin F, Beazer-Barclay YD, Antonellis KJ, Scherf U, et al. Exploration, normalization, and summaries of high density oligonucleotide array probe level data. Biostatistics. 2003 Apr;4(2):249-64.
- 16. Bolstad BM, Irizarry RA, Astrand M, Speed TP. A comparison of normalization methods for high density oligonucleotide array data based on variance and bias. Bioinformatics. 2003 Jan 22;19(2):185-93.
- 17. Shamir R, Maron-Katz A, Tanay A, Linhart C, Steinfeld I, Sharan R, et al. EXPANDER: an integrative program suite for microarray data analysis. BMC Bioinformatics. 2005;21:6:232.
- 18. Tanay A, Sharan R, Shamir R. Discovering statistically significant biclusters in gene expression data. Bioinformatics. 2002;18 Suppl 1:S136-44.
Claims (10)
1. A method for determining a level of activity of a biological pathway from a biological sample of a patient suffering from a pathology, said method comprising the steps of:
measuring the level of expression of at least three genes from a group of individuals, control individuals or patients suffering from the pathology, for which the biological pathway is inactive, said at least three genes being associated to said biological pathway, for establishing a negative reference, and
measuring level of expression of said at least three genes from a group of individuals, control individuals or patients suffering from the pathology, for which the biological pathway is active, for establishing a positive reference, and
measuring the level of expression of said at least three genes of said patient in the sample, and
comparing the level of expression of said at least three genes in the sample of said patient with the level of expression of said at least three genes of the negative reference and determining a value C- which corresponds to a correlation level between the level of expression of said at least three genes of said negative reference and the level of expression of said at least three genes of said patient, and
comparing the level of expression of said at least three genes in the sample of said patient with the level of expression of said at least three genes of the positive reference and determining a value C+ which corresponds to a correlation level between the level of expression of said at least three genes of said positive reference and the level of expression of said at least three genes of said patient, and
establishing a ratio C+/C- which gives a correlation score, wherein
if the correlation score is lower to the predetermined threshold that is indicative of the non activity of the biological pathway, and
if the correlation score is upper or equal to the predetermined threshold that is indicative of the activity of the biological pathway.
if the correlation score is lower to the predetermined threshold that is indicative of the non activity of the biological pathway, and
if the correlation score is upper or equal to the predetermined threshold that is indicative of the activity of the biological pathway.
2. A method for in vitro establishing a prognosis to develop a pathology for an healthy individual, by determining a level of activity of a biological pathway, said method comprising the steps of:
providing a sample from the healthy individual,
measuring the level of expression of at least three genes from a group of individuals, control individuals or patients suffering from the pathology, for which the biological pathway is inactive, said at least three genes being associated to said biological pathway, for establishing a negative reference, and
measuring level of expression of said at least three genes from a group of individuals, control individuals or patients suffering from the pathology, for which the biological pathway is active, for establishing a positive reference, and
measuring the level of expression of said at least three genes of said healthy individual in the sample, and
comparing the level of expression of said at least three genes in the sample of said healthy individual with the level of expression of said at least three genes of the negative reference and determining a value C- which corresponds to a correlation level between the level of expression of said at least three genes of said negative reference and the level of expression of said at least three genes of said control individual, and
comparing the level of expression of said at least three genes in the sample of said healthy individual with the level of expression of said at least three genes of the positive reference and determining a value C+ which corresponds to a correlation level between the level of expression of said at least three genes of said positive reference and the level of expression of said at least three genes of said control individual, and
establishing a ratio C+/C- which gives a correlation score, wherein
if the correlation score is lower to the predetermined threshold that is indicative of the non activity of the biological pathway, that means that the healthy individual could not develop the pathology, and
if the correlation score is upper or equal to the predetermined threshold that is indicative of the activity of the biological pathway, that means that the healthy individual could develop the pathology.
if the correlation score is lower to the predetermined threshold that is indicative of the non activity of the biological pathway, that means that the healthy individual could not develop the pathology, and
if the correlation score is upper or equal to the predetermined threshold that is indicative of the activity of the biological pathway, that means that the healthy individual could develop the pathology.
3. A method for in vitro establishing a diagnosis of a pathology for a patient, by determining a level of activity of a biological pathway, said method comprising the steps of:
providing a sample from the patient,
measuring the level of expression of at least three genes from a group of individuals, control individuals or patients suffering from the pathology, for which the biological pathway is inactive, said at least three genes being associated to said biological pathway, for establishing a negative reference, and
measuring level of expression of said at least three genes from a group of individuals, control individuals or patients suffering from the pathology, for which the biological pathway is active, for establishing a positive reference, and
measuring the level of expression of said at least three genes of said patient in the sample, and
comparing the level of expression of said at least three genes in the sample of said patient with the level of expression of said at least three genes of the negative reference and determining a value C- which corresponds to a correlation level between the level of expression of said at least three genes of said negative reference and the level of expression of said at least three genes of said patient, and
comparing the level of expression of said at least three genes in the sample of said patient with the level of expression of said at least three genes of the positive reference and determining a value C+ which corresponds to a correlation level between the level of expression of said at least three genes of said positive reference and the level of expression of said at least three genes of said patient, and
establishing a ratio C+/C- which gives a correlation score, wherein
if the correlation score is lower to the predetermined threshold that is indicative of the non activity of the biological pathway, that means that the patient does not suffer from the pathology associated with the activity of the biological pathway, and
if the correlation score is upper or equal to the predetermined threshold that is indicative of the activity of the biological pathway, that means that the patient suffers from the pathology associated with the activity of the biological pathway.4. A method for assessing whether a patient having a pathology is in need of a drug administration, said drug interacting directly or indirectly with a biological pathway, in which the biological activity of the biological pathway is determined and said biological activity is associated with said pathology, said method comprising the steps of:
if the correlation score is lower to the predetermined threshold that is indicative of the non activity of the biological pathway, that means that the patient does not suffer from the pathology associated with the activity of the biological pathway, and
if the correlation score is upper or equal to the predetermined threshold that is indicative of the activity of the biological pathway, that means that the patient suffers from the pathology associated with the activity of the biological pathway.4. A method for assessing whether a patient having a pathology is in need of a drug administration, said drug interacting directly or indirectly with a biological pathway, in which the biological activity of the biological pathway is determined and said biological activity is associated with said pathology, said method comprising the steps of:
providing a sample from the patient,
measuring the level of expression of at least three genes from a group of individuals, control individuals or patients, for which the biological pathway is inactive, said at least three genes being associated to said biological pathway, for establishing a negative reference, and
measuring level of expression of said at least three genes from a group of individuals, control individuals or patients, for which the biological pathway is active, for establishing a positive reference, and
measuring the level of expression of said at least three genes of said patient in the sample, and
comparing the level of expression of said at least three genes in the sample of said patient with the level of expression of said at least three genes of the negative reference and determining a value C- which corresponds to a correlation level between the level of expression of said at least three genes of said negative reference and the level of expression of said at least three genes of said patient, and
comparing the level of expression of said at least three genes in the sample of said patient with the level of expression of said at least three genes of the positive reference and determining a value C+ which corresponds to a correlation level between the level of expression of said at least three genes of said positive reference and the level of expression of said at least three genes of said patient, and
establishing a ratio C+/C- which gives a correlation score, wherein
if the correlation score is lower to the predetermined threshold that is indicative of the non activity of the biological pathway, that means that the patient needs administration of the drug , and
if the correlation score is upper or equal to the predetermined threshold that is indicative of the activity of the biological pathway, that means that the patient does not need administration of the drug.
if the correlation score is lower to the predetermined threshold that is indicative of the non activity of the biological pathway, that means that the patient needs administration of the drug , and
if the correlation score is upper or equal to the predetermined threshold that is indicative of the activity of the biological pathway, that means that the patient does not need administration of the drug.
5. A method for monitoring the treatment response of a patient to the administration of a drug, said drug interacting directly or indirectly with a biological pathway, in which the biological activity of the biological pathway is determined and said biological activity is associated with a pathology, said method comprising the steps of:
providing a sample from the patient,
measuring the level of expression of at least three genes from a group of individuals, control individuals or patients, for which the biological pathway is inactive, said at least three genes being associated to said biological pathway, for establishing a negative reference, and
measuring level of expression of said at least three genes from a group of individuals, control individuals or patients, for which the biological pathway is active, for establishing a positive reference, and
measuring the level of expression of said at least three genes of said patient in the sample, and
comparing the level of expression of said at least three genes in the sample of said patient with the level of expression of said at least three genes of the negative reference and determining a value C- which corresponds to a correlation level between the level of expression of said at least three genes of said negative reference and the level of expression of said at least three genes of said patient, and
comparing the level of expression of said at least three genes in the sample of said patient with the level of expression of said at least three genes of the positive reference and determining a value C+ which corresponds to a correlation level between the level of expression of said at least three genes of said positive reference and the level of expression of said at least three genes of said patient, and
establishing a ratio C+/C- which gives a correlation score, wherein
measuring the level of expression of at least three genes from a group of individuals, control individuals or patients, for which the biological pathway is inactive, said at least three genes being associated to said biological pathway, for establishing a negative reference, and
measuring level of expression of said at least three genes from a group of individuals, control individuals or patients, for which the biological pathway is active, for establishing a positive reference, and
measuring the level of expression of said at least three genes of said patient in the sample, and
comparing the level of expression of said at least three genes in the sample of said patient with the level of expression of said at least three genes of the negative reference and determining a value C- which corresponds to a correlation level between the level of expression of said at least three genes of said negative reference and the level of expression of said at least three genes of said patient, and
comparing the level of expression of said at least three genes in the sample of said patient with the level of expression of said at least three genes of the positive reference and determining a value C+ which corresponds to a correlation level between the level of expression of said at least three genes of said positive reference and the level of expression of said at least three genes of said patient, and
establishing a ratio C+/C- which gives a correlation score, wherein
if the correlation score is lower to the predetermined threshold that is indicative of the non activity of the biological pathway, that means that the patient is a bad responder to the drug, and
if the correlation score is upper or equal to the predetermined threshold that is indicative of the activity of the biological pathway, that means that the patient is a good responder to the drug.
6. Method of anyone of claims 1 to 5, wherein the level activity of said at least three genes is determined by analyzing the expression level of nucleic acids or proteins in said sample.
7. Method of anyone of claims 1 to 5, wherein said nucleic acids comprises RNAs or cDNAs obtained from said RNAs including long and small RNAs such as mRNAs, miRNAs.
8. Method of anyone of claims 1 to 75, wherein said biological sample is a fluid sample or a tissue sample.
9. Method of claim 8, wherein the biological sample is selected from the group consisting of blood, plasma, serum, urine, synovial fluid and cerebrospinal fluid.
10. Method according to anyone of claims 1 to 9, wherein said biological pathway is the pathway of type I interferon.
11. Method according to anyone of claims 1 to 10, wherein said pathology is selected from the group consisting of rheumatoid arthritis and systemic lupus erythematosus.
Priority Applications (5)
| Application Number | Priority Date | Filing Date | Title |
|---|---|---|---|
| EP10306090A EP2439282A1 (en) | 2010-10-06 | 2010-10-06 | Method for determining a biological pathway activity |
| PCT/EP2011/066223 WO2012045568A1 (en) | 2010-10-06 | 2011-09-19 | Method for determining a biological pathway activity |
| CN201180048561.3A CN103180462A (en) | 2010-10-06 | 2011-09-19 | Method for determining biological pathway activity |
| EP11757349.3A EP2625283A1 (en) | 2010-10-06 | 2011-09-19 | Method for determining a biological pathway activity |
| US13/878,368 US20130210670A1 (en) | 2010-10-06 | 2011-09-19 | Method for determining a biological pathway activity |
Applications Claiming Priority (1)
| Application Number | Priority Date | Filing Date | Title |
|---|---|---|---|
| EP10306090A EP2439282A1 (en) | 2010-10-06 | 2010-10-06 | Method for determining a biological pathway activity |
Publications (1)
| Publication Number | Publication Date |
|---|---|
| EP2439282A1 true EP2439282A1 (en) | 2012-04-11 |
Family
ID=43618179
Family Applications (2)
| Application Number | Title | Priority Date | Filing Date |
|---|---|---|---|
| EP10306090A Withdrawn EP2439282A1 (en) | 2010-10-06 | 2010-10-06 | Method for determining a biological pathway activity |
| EP11757349.3A Ceased EP2625283A1 (en) | 2010-10-06 | 2011-09-19 | Method for determining a biological pathway activity |
Family Applications After (1)
| Application Number | Title | Priority Date | Filing Date |
|---|---|---|---|
| EP11757349.3A Ceased EP2625283A1 (en) | 2010-10-06 | 2011-09-19 | Method for determining a biological pathway activity |
Country Status (4)
| Country | Link |
|---|---|
| US (1) | US20130210670A1 (en) |
| EP (2) | EP2439282A1 (en) |
| CN (1) | CN103180462A (en) |
| WO (1) | WO2012045568A1 (en) |
Families Citing this family (7)
| Publication number | Priority date | Publication date | Assignee | Title |
|---|---|---|---|---|
| WO2015181812A2 (en) * | 2014-05-27 | 2015-12-03 | Pathway Pharmaceuticals Ltd | System, method and software for analysis of intracellular signaling pathway activation using transcriptomic data |
| KR101704737B1 (en) * | 2016-02-05 | 2017-02-08 | 연세대학교 산학협력단 | Apparatus and method for generating bicluster using selection pool |
| CN108763862B (en) * | 2018-05-04 | 2021-06-29 | 温州大学 | A method for deducing gene pathway activity |
| CN108763864B (en) * | 2018-05-04 | 2021-06-29 | 温州大学 | Method for evaluating state of biological pathway sample |
| WO2020124584A1 (en) * | 2018-12-21 | 2020-06-25 | 北京哲源科技有限责任公司 | Disease risk prediction method, electronic device and storage medium |
| CN109817337B (en) * | 2019-01-30 | 2020-09-08 | 中南大学 | Method for evaluating channel activation degree of single disease sample and method for distinguishing similar diseases |
| CN117253549B (en) * | 2023-11-15 | 2024-02-09 | 苏州元脑智能科技有限公司 | Determination method and device of path correlation, storage medium and electronic equipment |
Citations (5)
| Publication number | Priority date | Publication date | Assignee | Title |
|---|---|---|---|---|
| US20040033498A1 (en) * | 2002-08-16 | 2004-02-19 | Behrens Timothy W. | Systemic lupus erythematosus |
| WO2006124836A1 (en) * | 2005-05-13 | 2006-11-23 | Duke University | Gene expression signatures for oncogenic pathway deregulation |
| US20070134688A1 (en) * | 2005-09-09 | 2007-06-14 | The Board Of Regents Of The University Of Texas System | Calculated index of genomic expression of estrogen receptor (er) and er-related genes |
| US20090298060A1 (en) * | 2006-11-09 | 2009-12-03 | Xdx, Inc. | Methods for diagnosing and monitoring the status of systemic lupus erythematosus |
| WO2010031035A1 (en) * | 2008-09-15 | 2010-03-18 | The United States Of America, As Represented By The Secretary, Department Of Health And Human Services | Gene expression signature of genomic instability in breast cancer |
Family Cites Families (2)
| Publication number | Priority date | Publication date | Assignee | Title |
|---|---|---|---|---|
| US7504222B2 (en) * | 2001-10-31 | 2009-03-17 | Millennium Pharmaceuticals, Inc. | Compositions, kits, and methods for identification, assessment, prevention, and therapy of breast cancer |
| EP2265943A4 (en) * | 2008-03-22 | 2011-09-14 | Merck Sharp & Dohme | METHODS AND SIGNATURE OF GENE EXPRESSION FOR EVALUATING GROWTH FACTOR SIGNALING PATH REGULATORY STATUS |
-
2010
- 2010-10-06 EP EP10306090A patent/EP2439282A1/en not_active Withdrawn
-
2011
- 2011-09-19 US US13/878,368 patent/US20130210670A1/en not_active Abandoned
- 2011-09-19 EP EP11757349.3A patent/EP2625283A1/en not_active Ceased
- 2011-09-19 CN CN201180048561.3A patent/CN103180462A/en active Pending
- 2011-09-19 WO PCT/EP2011/066223 patent/WO2012045568A1/en not_active Ceased
Patent Citations (5)
| Publication number | Priority date | Publication date | Assignee | Title |
|---|---|---|---|---|
| US20040033498A1 (en) * | 2002-08-16 | 2004-02-19 | Behrens Timothy W. | Systemic lupus erythematosus |
| WO2006124836A1 (en) * | 2005-05-13 | 2006-11-23 | Duke University | Gene expression signatures for oncogenic pathway deregulation |
| US20070134688A1 (en) * | 2005-09-09 | 2007-06-14 | The Board Of Regents Of The University Of Texas System | Calculated index of genomic expression of estrogen receptor (er) and er-related genes |
| US20090298060A1 (en) * | 2006-11-09 | 2009-12-03 | Xdx, Inc. | Methods for diagnosing and monitoring the status of systemic lupus erythematosus |
| WO2010031035A1 (en) * | 2008-09-15 | 2010-03-18 | The United States Of America, As Represented By The Secretary, Department Of Health And Human Services | Gene expression signature of genomic instability in breast cancer |
Non-Patent Citations (18)
| Title |
|---|
| BAECHLER EC; BATLIWALLA FM; KARYPIS G; GAFFNEY PM; ORTMANN WA; ESPE KJ ET AL.: "Interferon-inducible gene expression signature in peripheral blood cells of patients with severe lupus", PROC NATL ACAD SCI U S A., vol. 100, no. 5, 2003, pages 2610 - 5 |
| BAECHLER EC; BAUER JW; SLATTERY CA; ORTMANN WA; ESPE KJ; NOVITZKE J ET AL.: "An interferon signature in the peripheral blood of dermatomyositis patients is associated with disease activity", MOL MED, vol. 13, no. 1-2, 2007, pages 59 - 68 |
| BAUER JW; BAECHLER EC; PETRI M; BATLIWALLA FM; CRAWFORD D; ORTMANN WA ET AL.: "Elevated serum levels of interferon- regulated chemokines are biomarkers for active human systemic lupus erythematosus", PLOS MED, vol. 3, no. 12, 2006, pages 491 |
| BAVE U; NORDMARK G; LOVGREN T; RONNELID J; CAJANDER S; ELORANTA ML ET AL.: "Activation of the type I interferon system in primary Sjogren's syndrome: a possible etiopathogenic mechanism", ARTHRITIS RHEUM., vol. 52, no. 4, 2005, pages 1185 - 95 |
| BEN-DOR A; CHOR B; KARP R; YAKHINI Z: "Discovering local structure in gene expression data: the order-preserving submatrix problem", J COMPUT BIOL, vol. 10, no. 3-4, 2003, pages 373 - 84 |
| BOLSTAD BM; IRIZARRY RA; ASTRAND M; SPEED TP: "A comparison of normalization methods for high density oligonucleotide array data based on variance and bias", BIOINFORMATICS, vol. 19, no. 2, 22 January 2003 (2003-01-22), pages 185 - 93 |
| EISEN MB; SPELLMAN PT; BROWN PO; BOTSTEIN D: "Cluster analysis and display of genome-wide expression patterns", PROC NATL ACAD SCI U S A., vol. 95, no. 25, 1998, pages 14863 - 8 |
| GREENBERG SA; PINKUS JL; PINKUS GS; BURLESON T; SANOUDOU D; TAWIL R ET AL.: "Interferon-alpha/beta-mediated innate immune mechanisms in dermatomyositis", ANN NEUROL., vol. 57, no. 5, 2005, pages 664 - 78 |
| HUANG X; YUANG J; GODDARD A; FOULIS A; JAMES RF; LERNMARK A ET AL.: "Interferon expression in the pancreases of patients with type I diabetes", DIABETES, vol. 44, no. 6, 1995, pages 658 - 64 |
| IRIZARRY RA; HOBBS B; COLLIN F; BEAZER-BARCLAY YD; ANTONELLIS KJ; SCHERF U ET AL.: "Exploration, normalization, and summaries of high density oligonucleotide array probe level data", BIOSTATISTICS, vol. 4, no. 2, April 2003 (2003-04-01), pages 249 - 64 |
| KIROU KA; LEE C; GEORGE S; LOUCA K; PAPAGIANNIS IG; PETERSON MG ET AL.: "Coordinate overexpression of interferon- alpha-induced genes in systemic lupus erythematosus", ARTHRITIS RHEUM., vol. 50, no. 12, 2004, pages 3958 - 67 |
| RAINEN L; OELMUELLER U; JURGENSEN S; WYRICH R; BALLAS C; SCHRAM J ET AL.: "Stabilization of mRNA expression in whole blood samples", CLIN CHEM., vol. 48, no. 11, November 2002 (2002-11-01), pages 1883 - 90 |
| REYNIER F; PACHOT A; PAYE M; XU Q; TURREL-DAVIN F; PETIT F ET AL.: "Specific gene expression signature associated with development of autoimmune type-I diabetes using whole-blood microarray analysis", GENES IMMUN., vol. 11, no. 3, 2010, pages 269 - 78 |
| SHAMIR R; MARON-KATZ A; TANAY A; LINHART C; STEINFELD I; SHARAN R ET AL.: "EXPANDER: an integrative program suite for microarray data analysis", BMC BIOINFORMATICS, vol. 21, no. 6, 2005, pages 232 |
| TAN FK; ZHOU X; MAYES MD; GOURH P; GUO X; MARCUM C ET AL.: "Signatures of differentially regulated interferon gene expression and vasculotrophism in the peripheral blood cells of systemic sclerosis patients", RHEUMATOLOGY, vol. 45, no. 6, 2006, pages 694 - 702 |
| TANAY A; SHARAN R; SHAMIR R: "Discovering statistically significant biclusters in gene expression data", BIOINFORMATICS, vol. 18, no. 1, 2002, pages 136 - 44 |
| VAN BAARSEN LG; VAN DER POUW KRAAN TC; KRAGT JJ; BAGGEN JM; RUSTENBURG F; HOOPER T ET AL.: "A subtype of multiple sclerosis defined by an activated immune defense program", GENES IMMUN., vol. 7, no. 6, 2006, pages 522 - 31 |
| VAN DER POUW KRAAN TC; WIJBRANDTS CA; VAN BAARSEN LG; VOSKUYL AE; RUSTENBURG F; BAGGEN JM ET AL.: "Rheumatoid arthritis subtypes identified by genomic profiling of peripheral blood cells: assignment of a type I interferon signature in a subpopulation of patients", ANN RHEUM DIS., vol. 66, no. 8, August 2007 (2007-08-01), pages 1008 - 14 |
Also Published As
| Publication number | Publication date |
|---|---|
| EP2625283A1 (en) | 2013-08-14 |
| US20130210670A1 (en) | 2013-08-15 |
| WO2012045568A1 (en) | 2012-04-12 |
| CN103180462A (en) | 2013-06-26 |
Similar Documents
| Publication | Publication Date | Title |
|---|---|---|
| Keermann et al. | Transcriptional landscape of psoriasis identifies the involvement of IL36 and IL36RN | |
| Pasquali et al. | Circulating micro RNA s in extracellular vesicles as potential biomarkers for psoriatic arthritis in patients with psoriasis | |
| Baechler et al. | An interferon signature in the peripheral blood of dermatomyositis patients is associated with disease activity | |
| Mesko et al. | Peripheral blood gene expression patterns discriminate among chronic inflammatory diseases and healthy controls and identify novel targets | |
| Landolt-Marticorena et al. | Lack of association between the interferon-α signature and longitudinal changes in disease activity in systemic lupus erythematosus | |
| EP2167687B1 (en) | Biomarkers for predicting anti-tnf responsiveness or non-responsiveness | |
| US20130210670A1 (en) | Method for determining a biological pathway activity | |
| Yamamoto et al. | Decreased miR-192 expression in peripheral blood of asthmatic individuals undergoing an allergen inhalation challenge | |
| US11591655B2 (en) | Diagnostic transcriptomic biomarkers in inflammatory cardiomyopathies | |
| Wang et al. | Plasma microRNA expression profiles in Chinese patients with rheumatoid arthritis | |
| EP2909340B1 (en) | Diagnostic method for predicting response to tnf alpha inhibitor | |
| Reynier et al. | Importance of correlation between gene expression levels: application to the type I interferon signature in rheumatoid arthritis | |
| Chen et al. | Altered miRNAs expression profiles and modulation of immune response genes and proteins during neonatal sepsis | |
| AU2006294477A1 (en) | Gene expression profiling for identification monitoring and treatment of rheumatoid arthritis | |
| US20190367984A1 (en) | Methods for predicting response to anti-tnf therapy | |
| JP2013526845A (en) | Genes and combinations of genes that predict an initial response or non-response of a subject suffering from an inflammatory disease to a cytokine targeted drug (CyTD) | |
| Palau et al. | Genome-wide transcriptional analysis of T cell activation reveals differential gene expression associated with psoriasis | |
| EP2333110A1 (en) | IN VITRO METHOD AND KIT FOR PROGNOSIS OR PREDICTION OF RESPONSE BY PATIENTS WITH RHEUMATOID ARTHRITIS TO TREATMENT WITH TNF-alpha FACTOR BLOCKING AGENTS | |
| Mandel et al. | Gene expression studies in systemic lupus erythematosus | |
| Kupfer et al. | Microarray characterization of gene expression changes in blood during acute ethanol exposure | |
| EP3105350B1 (en) | Transcriptomic biomarkers, method for determination thereof and use of transcriptomic biomarkers for individual risk assessment of developing post-infarction heart failure | |
| Garabet et al. | MicroRNA‐199a‐5p may be a diagnostic biomarker of primary ITP | |
| EP2675915B1 (en) | Cd4+ t-cell gene signature for rheumatoid arthritis (ra) | |
| US20160298198A1 (en) | Method for predicting development of melanoma brain metastasis | |
| Lu et al. | Identification of key genes and pathways in Rheumatoid Arthritis gene expression profile by bioinformatics. |
Legal Events
| Date | Code | Title | Description |
|---|---|---|---|
| AK | Designated contracting states |
Kind code of ref document: A1 Designated state(s): AL AT BE BG CH CY CZ DE DK EE ES FI FR GB GR HR HU IE IS IT LI LT LU LV MC MK MT NL NO PL PT RO RS SE SI SK SM TR |
|
| AX | Request for extension of the european patent |
Extension state: BA ME |
|
| PUAI | Public reference made under article 153(3) epc to a published international application that has entered the european phase |
Free format text: ORIGINAL CODE: 0009012 |
|
| STAA | Information on the status of an ep patent application or granted ep patent |
Free format text: STATUS: THE APPLICATION IS DEEMED TO BE WITHDRAWN |
|
| 18D | Application deemed to be withdrawn |
Effective date: 20121012 |