EP2434435A2 - Method and system for evaluation using probabilistic boosting trees - Google Patents
Method and system for evaluation using probabilistic boosting trees Download PDFInfo
- Publication number
- EP2434435A2 EP2434435A2 EP11182135A EP11182135A EP2434435A2 EP 2434435 A2 EP2434435 A2 EP 2434435A2 EP 11182135 A EP11182135 A EP 11182135A EP 11182135 A EP11182135 A EP 11182135A EP 2434435 A2 EP2434435 A2 EP 2434435A2
- Authority
- EP
- European Patent Office
- Prior art keywords
- node
- tree
- sub
- stack
- probabilistic boosting
- Prior art date
- Legal status (The legal status is an assumption and is not a legal conclusion. Google has not performed a legal analysis and makes no representation as to the accuracy of the status listed.)
- Granted
Links
Images





Classifications
-
- G—PHYSICS
- G06—COMPUTING OR CALCULATING; COUNTING
- G06V—IMAGE OR VIDEO RECOGNITION OR UNDERSTANDING
- G06V10/00—Arrangements for image or video recognition or understanding
- G06V10/94—Hardware or software architectures specially adapted for image or video understanding
- G06V10/955—Hardware or software architectures specially adapted for image or video understanding using specific electronic processors
-
- G—PHYSICS
- G06—COMPUTING OR CALCULATING; COUNTING
- G06F—ELECTRIC DIGITAL DATA PROCESSING
- G06F18/00—Pattern recognition
- G06F18/20—Analysing
- G06F18/21—Design or setup of recognition systems or techniques; Extraction of features in feature space; Blind source separation
- G06F18/214—Generating training patterns; Bootstrap methods, e.g. bagging or boosting
-
- G—PHYSICS
- G06—COMPUTING OR CALCULATING; COUNTING
- G06F—ELECTRIC DIGITAL DATA PROCESSING
- G06F18/00—Pattern recognition
- G06F18/20—Analysing
- G06F18/24—Classification techniques
- G06F18/243—Classification techniques relating to the number of classes
- G06F18/24323—Tree-organised classifiers
-
- G—PHYSICS
- G06—COMPUTING OR CALCULATING; COUNTING
- G06N—COMPUTING ARRANGEMENTS BASED ON SPECIFIC COMPUTATIONAL MODELS
- G06N20/00—Machine learning
- G06N20/20—Ensemble learning
-
- G—PHYSICS
- G06—COMPUTING OR CALCULATING; COUNTING
- G06N—COMPUTING ARRANGEMENTS BASED ON SPECIFIC COMPUTATIONAL MODELS
- G06N5/00—Computing arrangements using knowledge-based models
- G06N5/01—Dynamic search techniques; Heuristics; Dynamic trees; Branch-and-bound
-
- G—PHYSICS
- G06—COMPUTING OR CALCULATING; COUNTING
- G06V—IMAGE OR VIDEO RECOGNITION OR UNDERSTANDING
- G06V10/00—Arrangements for image or video recognition or understanding
- G06V10/40—Extraction of image or video features
- G06V10/44—Local feature extraction by analysis of parts of the pattern, e.g. by detecting edges, contours, loops, corners, strokes or intersections; Connectivity analysis, e.g. of connected components
- G06V10/443—Local feature extraction by analysis of parts of the pattern, e.g. by detecting edges, contours, loops, corners, strokes or intersections; Connectivity analysis, e.g. of connected components by matching or filtering
- G06V10/446—Local feature extraction by analysis of parts of the pattern, e.g. by detecting edges, contours, loops, corners, strokes or intersections; Connectivity analysis, e.g. of connected components by matching or filtering using Haar-like filters, e.g. using integral image techniques
-
- G—PHYSICS
- G06—COMPUTING OR CALCULATING; COUNTING
- G06V—IMAGE OR VIDEO RECOGNITION OR UNDERSTANDING
- G06V10/00—Arrangements for image or video recognition or understanding
- G06V10/70—Arrangements for image or video recognition or understanding using pattern recognition or machine learning
- G06V10/764—Arrangements for image or video recognition or understanding using pattern recognition or machine learning using classification, e.g. of video objects
-
- G—PHYSICS
- G06—COMPUTING OR CALCULATING; COUNTING
- G06V—IMAGE OR VIDEO RECOGNITION OR UNDERSTANDING
- G06V10/00—Arrangements for image or video recognition or understanding
- G06V10/70—Arrangements for image or video recognition or understanding using pattern recognition or machine learning
- G06V10/77—Processing image or video features in feature spaces; using data integration or data reduction, e.g. principal component analysis [PCA] or independent component analysis [ICA] or self-organising maps [SOM]; Blind source separation
- G06V10/774—Generating sets of training patterns; Bootstrap methods, e.g. bagging or boosting
Definitions
- the present invention relates to evaluation of data using probabilistic boosting trees.
- Discriminative classifiers are often a bottleneck in 3D pose detection routines.
- Tree-based classifiers such as Probabilistic Boosting Trees (PBT) and Random Forests, are discriminative models used for vision-based classification and object detection.
- the classifier is typically evaluated at every pixel in an image, which can be inefficient.
- the PBT is a general type of decision tree that uses strong classifiers to make fuzzy decisions at internal nodes. Generally, using PBT requires multiple recursive calls, which slows down object detection.
- Efficiency can be improved using hierarchical methods or cascades, but 3D medical applications and real-time applications require further efficiency improvements.
- the present invention provides a method and system for evaluation of probabilistic boosting trees.
- input data is received at a graphics processing unit.
- a weighted empirical distribution associated with each node of the probabilistic boosting tree is determined using a stack implementation.
- the weighted empirical distribution associated with each node is added to a total posterior distribution value.
- posterior distribution of a probabilistic boosting tree is determined by determining a weighted empirical distribution associated with each node of the probabilistic tree using a stack implementation, and adding the weighted empirical distribution associated with each node to a total posterior distribution value.
- a root node of the probabilistic boosting tree is pushed onto a stack and then is determined whether to descend thru a node in a left sub-tree or a node in a right sub-tree.
- a discriminative classifier of the root node is determined. Based on the discriminative classifier satisfying certain conditions, a left node, a right node, or both the left node and the right node of the root node are descended. Descending a node comprises determining a discriminative classifier of that node. If the discriminative classifier is a leaf node, the weighted empirical distribution of the node is added to the total posterior value. Otherwise, the node is pushed onto a stack and the left node, right node, or both the left and the right node of the node are descended.
- the probabilistic tree is evaluated using a parallel computing architecture.
- the parallel computing architecture may be Compute Unified Device Architecture (CUDA).
- CUDA Compute Unified Device Architecture
- the stack may be associated with one of a plurality of threads running in parallel.
- a method and system for evaluating a forest of probabilistic boosting trees is disclosed.
- Input data is received at a graphics processing unit.
- the plurality of probabilistic boosting trees is evaluated using a stack implementation.
- a combined posterior distribution based on a posterior distribution of each of the plurality of probabilistic boosting trees is generated.
- FIG. 1 illustrates a method for training a probabilistic boosting tree (PBT), in accordance with an embodiment of the present invention
- FIG. 2 shows pseudocode for determining the posterior value of a node of a PBT using recursion
- FIG. 3 shows pseudocode for determining the posterior value of a node of a PBT using a stack implementation according to an embodiment of the present invention
- FIG. 4 illustrates a method for determining the posterior distribution of a node of a probabilistic boosting tree, in accordance with an embodiment of the present invention
- FIG. 5 illustrates an exemplary PBT data structure that is arranged into a texture image
- FIG. 6 illustrates an exemplary Compute Unified Data Architecture (CUDA) stack-based implementation of evaluating a PBT, in accordance with an embodiment of the present invention
- FIG. 7 illustrates exemplary cubes showing Haar feature types, in accordance with an embodiment of the present invention
- FIG. 8 illustrates a histogram classifier and feature data packed into a single column of a texture image, in accordance with an embodiment of the present invention
- FIG. 9 shows an exemplary CUDA algorithm for implementing feature computation, in accordance with an embodiment of the present invention.
- FIG. 10 shows a table of specific steerable features used, in accordance with an embodiment of the present invention.
- FIG. 11 shows an algorithm for implementation in CUDA for steerable feature evaluation, in accordance with an embodiment of the present invention
- FIG. 12 shows a CUDA implementation integrated into an existing software library, in accordance with an embodiment of the present invention
- FIG. 13 illustrates a method for evaluating a forest of probabilistic boosting trees, in accordance with an embodiment of the present invention
- FIG. 14 illustrates a graph showing execution times when threads evaluate different classifiers and when thread-blocks evaluate different classifiers, in accordance with an embodiment of the present invention
- FIG. 15 illustrates total detection time, central processing unit (CPU) execution time, and wait time for a graphics processing unit (GPU), in accordance with an embodiment of the present invention
- FIG. 16 illustrates speedup comparisons for small volumes and medium volumes, in accordance with an embodiment of the present invention.
- FIG. 17 is a high level block diagram of a computer capable of implementing the present invention.
- the present invention is directed to a method and system for evaluation of probabilistic boosting trees. Embodiments of the present invention are described herein to give a visual understanding of the method for evaluation of probabilistic boosting trees.
- a digital image is often composed of digital representations of one or more objects (or shapes).
- the digital representation of an object is often described herein in terms of identifying and manipulating the objects. Such manipulations are virtual manipulations accomplished in the memory or other circuitry / hardware of a computer system. Accordingly, it is to be understood that embodiments of the present invention may be performed within a computer system using data stored within the computer system.
- Fig. 1 illustrates a method for training a probabilistic boosting tree (PBT), according to an embodiment of the present invention.
- Fig. 1 more specifically describes accelerated training of a probabilistic boosting tree using a graphics processing unit (GPU).
- GPU graphics processing unit
- training data is received.
- the training data may be annotated training data including images having annotations representing locations of landmarks of objects in the image.
- the training data may consist of images having annotations representing locations of landmarks of objects in the image.
- Training data can be medical image data such as computerized tomography (CT), magnetic resonance imaging (MRI), X-ray, or Ultrasound image data.
- a PBT models the posterior distribution of a data set.
- the aim is to enable the use of the PBT as a discriminative model for classification and detection of an object in image data.
- a PBT is a binary decision tree with a fuzzy decision taken at each internal node of the tree depending on the output of the node's strong classifiers.
- the posterior value of any given individual node is determined by combining the posterior values of its child nodes using a weighted distribution. Weights used in the determination are determined by evaluating a node's strong (learned) classifier, q ⁇ N ( y
- Each node N contains a strong classifier, q ⁇ ( y
- the strong classifier can be any classifier that uses a problem specific feature. For example, an AdaBoost classifier can be used, which combines several binary weak classifiers to produce a strong estimate.
- the training data is divided into a first data set and a second data set by a classifier.
- the classifier that divides the training data is a strong (learned) classifier associated with the top parent node of the PBT.
- a first sub-tree and a second sub-tree are trained.
- the first data set is used to train a first sub-tree of the parent node and the second data set is used to train a second sub-tree of the parent node.
- a classifier at each node of the PBT is trained using a feature matrix.
- the PBT is constructed using a set of positive and negative examples, which may originate from different 3D images.
- Each node of the PBT includes a strong classifier, such as the AdaBoost classifier, which may be trained for that particular node.
- a feature matrix is computed (e.g., every possible feature is evaluated for every input sample), and then each of the weak classifiers that constitute the strong classifier is trained using the feature matrix.
- the weak classifiers of the strong classifier may be trained sequentially by choosing each weak classifier using a greedy algorithm by considering how well each feature acts as a classifier.
- the algorithm for choosing the weak classifier during training includes three passes. First, feature bounds must be computed. Afterwards, a feature value is mapped to each sample within a histogram bin. Then, the histogram bins are incremented. Each sample may then be sampled with the trained classifier to compute an error. All of the aforementioned steps may be performed on a GPU.
- the operations for a classifier are independent, so each weak classifier can be trained by a different thread.
- the feature matrix column indexes the feature type, while the row indexes the sample. Each thread processes a single column.
- the feature matrix is stored as a single component floating-point texture.
- the feature data stays on the GPU for each of the weak training classifier passes. For each pass, the weights of the samples are updated.
- a trained posterior distribution model of the PBT is generated based on the feature matrices of each node.
- the posterior distribution model represents a set of classifications that may be used for object classification and object detection.
- the set of classifications from the posterior distribution model of the PBT may be used thereafter by a detector to perform detection on image data.
- the trained tree can be used to estimate the posterior probability of unseen data using a stack implementation on a GPU, as discussed in further detail in the following paragraphs.
- the data parallel nature of evaluation using the PBT means that it is advantageous to utilize the computation power of a GPU instead of a central processing unit (CPU).
- a GPU instead of a central processing unit (CPU).
- multiple recursive calls which are used in a traditional evaluation of a PBT may be replaced using a stack-based implementation.
- Cached texture memory is used to represent features and tree data structures. Since GPUs do not support recursive calls, the stack-based implementation is necessary to remove recursion.
- Fig. 2 shows pseudocode for determining the posterior value of a node of a PBT using recursion.
- Fig. 3 shows pseudocode for determining the posterior value of a node of a PBT using a stack implementation according to an embodiment of the present invention.
- the posterior probability of a node is recursively computed as a weighted combination of the posterior probabilities of the child nodes, referenced by reference numeral 204.
- the weight factor of this combination is determined by evaluating the node's strong classifier, referenced by reference numeral 202.
- the recursion terminates at leaf nodes of the tree (i.e., nodes with no child nodes), which simply return their empirical distribution q N (+1).
- the final result, or posterior distribution for each node is a sum of weighted empirical distributions of the child nodes, represented by a result referenced by reference numeral 206.
- the total weight given to any node's empirical distribution is the product of the weights associated with the path from the root to the node.
- a stack holds a list of to-be traversed nodes and their respective weights.
- the empirical distribution of that leaf node with its weight is added to a total empirical distribution of the root node, represented by reference numeral 302.
- the root node and corresponding weight is first pushed into a stack. Each node in the stack is then processed sequentially, represented by reference numeral 306. If the node is a leaf node, the empirical distribution of the node is weighted by the corresponding weight and accumulated into the total posterior of the tree, represented by reference numeral 302. If a particular node has child nodes, then either the left or right child nodes are placed into the stack with weights that are the product of the parent node's weight and a factor dependent on the value of the parent node's strong classifier, represented by reference numeral 312. The empirical distribution of child nodes that are not pushed on the stack is weighted and accumulated to the total posterior distribution of the tree. The weight is proportional to the weight of the parent node and the value of the strong classifier evaluated at the parent. The sum of all of these products represents the total posterior distribution model for the PBT, represented by reference numeral 310.
- Fig. 4 illustrates a method for determining the posterior distribution of a node of a probabilistic boosting tree using a GPU, in accordance with an embodiment of the present invention.
- Input data is received at a GPU.
- Input data may be a 2D image or a 3D volume received from an image acquisition device.
- the 3D volume can be a C-arm CT volume, computed tomography (CT) volume, magnetic resonance imaging (MRI) volume, etc.
- CT computed tomography
- MRI magnetic resonance imaging
- the 3D volume can be received from an image acquisition device, such as a C-arm image acquisition system, or can be a previously stored volume loaded from memory or storage of a computer system, or some other computer readable medium.
- a weighted empirical distribution associated with each node of the probabilistic boosting tree is determined using a stack implementation.
- x ) is determined using the principles described above with a stack implementation. Specifically, a root node of the probabilistic boosting tree is first pushed onto a stack. Then a determination is made whether to descend down the PBT thru a node in a left sub-tree or thru a node in a right sub-tree.
- a discriminative classifier of the root node is first determined. If the discriminative classifier of the root node satisfies a first condition signifying that a left node must be descended, then the method proceeds to descend down a left node in the left sub-tree. If the discriminative classifier of the root node satisfies a second condition signifying that a right node must be descended, then the method proceeds to descend down a right node in the left sub-tree. If the discriminative classifier of the root node satisfies a third condition, then the method descends down both the aforementioned left node and the aforementioned right node.
- the discriminative classifier of that node is determined. If the node is determined to be a leaf node, then the weighted empirical distribution of that node is added to a total posterior distribution value. If the node satisfies the first condition, then the node will be pushed onto the stack, and the left child node of the node will be descended. If the node satisfies the second condition, then the node will be pushed onto the stack, and the right child node of the node will be descended. If the node satisfies the third condition, then the node is pushed onto the stack, and both the left and right child nodes are descended.
- the weighted empirical distribution of each node of the probabilistic boosting tree is added to the total posterior distribution value.
- the total posterior distribution represents a posterior distribution model that can be used in the detection of objects or landmarks in 2D images or 3D volumes.
- the above described method for evaluating a PBT can be implemented using a Compute Unified Device Architecture (CUDA) programming model.
- CUDA Compute Unified Device Architecture
- a parallel problem is decomposed into a grid of treaded blocks, with each block containing many threads. Blocks are assigned to the GPU's streaming multi-processors, which breaks down the block and schedules it in groups of 32 threads.
- the grid of thread blocks will overly the input space (e.g., all pixels in the volume), and each thread will evaluate the classifier for a different pixel in the volume or a different orientation/scale hypothesis.
- the programming model exposes the memory architecture, which includes a 16kb low-latency shared memory (accessible from threads within the same block), high-latency local memory (per-thread), global memories (accessible by all threads), and cached global accesses through texture memory. Designing the algorithm to use these memory types appropriately is key to efficiency.
- the tree data structure may be packed into a texture image. Instead of node pointers, 2D location indices that reference the node's 2D region are placed inside the texture image.
- the node data may contain AdaBoost classifiers, which include several weak classifiers. Each node contains either a simple threshold classifier or a histogram classifier whose decision is made on the basis of a single feature.
- AdaBoost classifiers which include several weak classifiers. Each node contains either a simple threshold classifier or a histogram classifier whose decision is made on the basis of a single feature.
- the PBT node data that is placed inside the texture image must store the sum of alpha (or weighting) values, the number of weak classifiers, and the data for each of the classifiers.
- the weak classifiers are stored in adjacent columns of the texture image, and each column containing an associated weight ⁇ i .
- Fig. 5 illustrates an exemplary PBT data structure that is packed into a texture image. All weak classifiers are arranged along the columns 502a-502g, and each PBT node stores 2D texture coordinate indices to their child nodes, represented by 504a for node 0, 50
- Fig. 6 illustrates an exemplary CUDA stack-based implementation of evaluating a PBT using the algorithm shown in Fig. 3 .
- the CUDA PBT evaluation function shown in Fig. 6 is represented by feature_func , which allows new feature types to be added. Both 3D sample box information and 2D texture location of the feature data are passed to this feature evaluation function.
- Marginal space learning is an efficient method used to perform object localization.
- MSL a large 9-dimensional search space for a similarity transformation is decomposed into a series of smaller search spaces from translation to full similarity.
- a discriminative classifier is evaluated on pixels in the volume to determine a small set (e.g., 100-1000) of candidate positions.
- Orientation is detected by evaluation each of these candidate boxes with a series of hypothesis orientations and similarly for scale. The final list of candidates are aggregated to obtain a single pose estimate.
- a Hierarchical Detection Network to extend MSL to multiple structure detection may be used.
- the HDN decomposes a joint multi-object detection problem into sequential detections with spatial priors used for object prediction.
- the hierarchical detection of multiple structures is broken down into a network of nodes for detection position, orientation, and scale, for each structure. Spatial dependencies are also represented as arcs in this detection network.
- MSL is an efficient framework for detection
- the main computational burden comes from evaluating a discriminative classifier in each phase of the detection.
- position detection the classifier is either evaluated by looping over the 3D locations in the image (if the node has no ancestor) or by looping over a set of candidate locations provided by a preceding node.
- orientation and scale detection the classifier is evaluated over each of the input candidate locations using each of the possible orientation (or scale) hypothesis. The same classifier is evaluated on different data, which makes it an ideal detection algorithm for the data parallel power of a GPU. GPU accelerated implementations are possible, using a PBT as the classifier for MSL.
- a PBT tree is evaluated with the context surrounding a specific location (and pose).
- Features may be computed on the fly from an input image.
- position detection utilizes Haar features
- orientation and scale detection utilize efficient steerable features that sample the image intensity and gradient in a volume using the candidate pose of the box.
- Haar features are weighted combinations of the sums of cubic regions of an image. These sums are efficiently calculated using the integral image.
- the features use no more than four cubes.
- Fig. 7 illustrates exemplary cubes showing Haar feature types. Cubes 702 indicate negative weights.
- Fig. 8 illustrates a histogram classifier and feature data packed into a single column of a texture image.
- Column 802 shows a layout for Haar features with a histogram classifier, where each cube must be stored in the texture.
- the histogram contains 64-bins and are packed into two float components that are interpreted as integers.
- Column 804 shows a steerable feature with a threshold classifier requires only the threshold for the classifier and a single texel to store the feature information.
- Fig. 9 shows an exemplary CUDA algorithm for implementing the feature computation described above. To avoid conditionals for boundary testing, the boundary of the integral image is padded with extra planes filled with zeros.
- Parallel work efficient algorithms for computing the integral image in a 3D case on a GPU requires mimicking a typical CPU implementation of the 3D integral image computations that proceeds in 3 passes. While performing the padding of the integral images with zeros, as stated above, the accumulation of the image in the x-direction is also performed on the CPU. Once this padded image is transferred to the GPU, a grid of thread blocks on the x-z plane are used to accumulate in the y-direction. The same step is taken for the z direction, where the threads are on the x-y plane.
- Fig. 10 shows a table of specific steerable features used.
- I represents the image intensity
- ⁇ I ⁇ I x , I y , I z ⁇
- d is an input sample direction.
- the features are transformations on either a gray value, the gradient, or the projection of the gradient onto an input direction.
- the input direction comes from the x-axis of the box, and a discrete sampling of 3D locations is considered for these features within the detected box.
- Each of these features can be calculated on one of several image resolutions of an image pyramid. Therefore, each feature is completely described by its position in the 3D sampling pattern (3 integers), the type of feature (1 integer), and the discrete image scale it is computed at (1 integer).
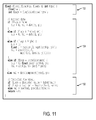
- Fig. 11 shows an algorithm for implementation in CUDA for steerable feature evaluation.
- the data extraction and storage of flags is represented by reference numeral 1104, and the pixel transformation is represented by reference numeral 1106.
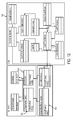
- Fig. 12 shows a CUDA implementation integrated into an existing software library.
- the GPU implementation is mostly isolated from the detection package, with the interface being exposed by deriving from the SrcObjectPositionDetector 1202 and SrcBoxDetector 1204.
- the detector may utilize a classifier, such as a PBT, or a random forest TM , which is discussed below.
- ScrCudaPositionDetector 1206 replaces the main classifier loop within the CPU position detector. This loop iterates either over entire 3D volumes or a set of previously generated position candidates. The evaluation of the posterior distribution from the underlying classifier is scheduled on the GPU over these locations. The results are then sorted on the GPU and only the required number of candidate locations are transferred back to main memory.
- the case is similar for orientation and scale detection which is handled by SrcBoxDetector 1204.
- a common interface is derived to replace routines responsible for detecting orientation and scale.
- the input is a set of m candidate box locations for which there are also a set of n hypothesis orientations (or scales).
- n hypothesis orientations or scales.
- the CUDA kernel for orientation detection represented by reference number 1208, uses m * n threads to evaluate the PBT for all possible candidate boxes using each of the potential orientations.
- the situation is similar for scale detection although the hypothesis scales are transferred to the GPU instead of the orientations.
- Fig. 13 illustrates a method for evaluating a forest of probabilistic boosting trees, in accordance with an embodiment of the present invention.
- Decision trees such as the probabilistic boosting tree may be used in a forest algorithm, such as the random forest algorithm. Evaluation of a forest algorithm is similar to that of the PBT.
- the forest may comprise a plurality of PBTs, and the posterior distribution output of the forest is a combination of the output of each PBT.
- input data is received at a GPU.
- a plurality of PBTs are evaluated using a stack implementation.
- the stack implementation may be the one described above with respect to the method of Fig. 4 .
- a combined posterior distribution model of each of the PBTs is generated.
- the posterior distribution model represents a set of classifications that may be used for object classification and object detection. The set of classifications from the posterior distribution model of the PBT may be used thereafter by a detector to perform detection on image data.
- the HDN network is built on 6 structures, including, e.g., the Corpus Callosum (CC) and Cerebellum (CER). The HDN network encodes spatial relationships between structures, and performs detection on volume resolutions of 4 mm, 2mm, and 1 mm.
- the HDN network consists of position detection for the hip and is performed on resolutions of 16 mm, 8mm, and 4mm.
- Table 1 shows speedups in the table comparing the GPU accelerated version to a multi-threaded OpenMP version. For each configuration, the right column shows a time when reading back an image is not required. The timings include the time to pad the image and transfer the results on the GPU. For a volume of 256 3 , a five-fold speedup is attained on both systems when the integral image does not need to be read back (as is the case during detection).
- Table 2 shows speedups gained throughout the evaluation process for both steerable and Haar features.
- the Feature row considers only evaluating the features. In these tests, the same feature was evaluated on all pixels in a volume. It is apparent that the steerable features give a better speedup, possibly because their implementation involves more computation, whereas the Haar features mostly involve texture lookups and only a few additions (e.g. bandwidth limited). As expected, these speedups propagate into the weak classifier evaluation, which only evaluates a single features and looks up a bit in a histogram bin. However, the strong classifier evaluates and combines the results of roughly 40 weak classifiers. In this case, the two feature types start to behave more similarly, where a 26x speedup is achieved with Config1.
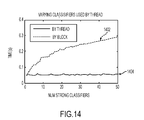
- Fig. 14 illustrates a graph showing execution times when threads evaluate different classifiers and when thread-blocks evaluate different classifiers. As nodes in a PBT are descended, threads in the same thread block will evaluate different nodes.
- the thread curve 1402 represents when threads evaluate different classifiers and the block curve 1404 represents when different thread-blocks evaluate the different classifiers. Thread curve 1402 shows that there is a longer execution time when evaluating different classifiers with threads.
- Fig. 14 also shows that evaluating the classifier by blocks do not affect the run-times. In contrast, when evaluating by threads, when the tree is deeper, the evaluation is 5x slower.
- Table 3 shows timings and speedups for the detection of 6 structures in the SI data set. These times were averaged over 201 volumes. Most of the execution is in orientation and scale detection (which uses steerable features).
- Config1 the overall speedup of 4.8x is slightly lower than the results from the steerable feature PBT evaluation shown in Table 2.
- the 9.73x speedup for hierarchical detection was slightly lower than the results from the steerable feature PBT evaluation in Table 2. This is due to hierarchical detection having regions that are inherently serial, which must be performed on the host CPU (e.g., results are read back, candidates are pruned, and detection results are written to files).
- Fig. 15 illustrates the total detection time, the CPU execution time, and the wait time for the GPU against varying proportions of work assigned to the GPU.
- the total amount of time for detection is represented by line 1502
- the total CPU time is represented by line 1504
- the GPU sync time (wait time for the GPU) is represented by line 1506.
- the GPU work is started asynchronously after the CPU work is initialized. A non-zero GPU sync time indicates that the GPU does not have enough work.
- the optimal ratio, from Fig. 15 for the detection line appears to be roughly 0.85.
- the optimal proportion is expected to be in accordance with speedups obtained in the PBT evaluation.
- the GPU was 7x faster than the dual core for PBT tree evaluation, so the optimal proportion of work on the GPU is expected to be around 0.875, as confirmed by Fig. 15 .
- a 10-15% improvement can be expected in the runtime by utilizing the CPU at the same time as the GPU.
- a second experiment compares the results on hierarchical position, orientation, and scale detection using the CER detection from the SI dataset.
- the classifier evaluation makes up a large portion of the total run-time.
- the PBT was trained to a maximum depth of 6, with 40 weak classifiers, and the forest implementation had a maximum depth of 10 with 50 trees.
- a descent through the forest implementation evaluates more weak classifiers (maximum of 500), whereas the PBT has at most 270 classifiers.
- the PBT uses histogram classifiers, while the forest implementation uses a threshold-based classifier. When testing on the training data, both models achieved similar accuracy.
- Table 5 illustrates the detection accuracy when testing on training data for the CER data structure on the SI hierarchical data set.
- Table 5 Classifier Center (mm) Line(mm) RF 1.82 2.87 RF(cuda) 2.00 3.09 PBT 1.81 2.83 PBT(cuda) 1.91 3.05
- the CUDA accelerated implementation of the forest implementation is more than 10x faster than the multi-core CPU implementation.
- the CPU version of the RF is 2x slower than the PBT with similar accuracy on Config 1.
- the forest implementation of CUDA achieves a better speed-up compared to the PBT, making the GPU version of the forest implementation 2% slower than the GPU-PBT on Config 1.
- Table 6 shows the timing results for the CER detection on the SI data for the two hardware configurations and the PBT and forest models that achieve similar accuracy.
- the forest implementation is slower on the CPU, but the GPU implementation achieves a greater speedup than the PBT.
- the GPU implementation on the forest is still slower than the GPU implementation of the PBT.
- the PDT data On the PDT data, a model was trained using 161 training samples and tested on 86 unseen cases.
- the PBT contained 4 tree levels with 40, 42, 44, and 48 weak classifiers on each level.
- the maximum depth was set to 8 and trained two sets of models with either 10 or 30 trees.
- the forest implementation with 10 trees performs better than the PBT, which has a similar number of weak classifiers.
- Table 7 shows the comparison of timings, speed-ups, and accuracy on the 16-8-4mm translation hierarchy.
- the CPU version of the forest implementation is slower; and because better speedups occur on the GPU, the two GPU implementations take the same amount of time.
- the forest implementation is superior in this example due to superior detection accuracy. Using 30 trees improves accuracy because the GPU accelerated portions occupy more time and better speed-ups can be seen.
- Table 7 Config1 Config2 Gpu(s) Cpu(s) S-up Gpu(s) Cpu(s) S-up Testing error PBT 0.31 2.25 7.36 0.20 0.98 4.92 10.07 Ranfor (10 trees) 0.31 2.56 8.34 0.21 1.20 5.61 7.47 Ranfor (30 trees) 0.60 6.44 10.7 0.27 2.88 10.6 4.93
- the training of AdaBoost classifiers for a PBT could be performed by computing a feature matrix for feature evaluation, and then training the weak classifiers in parallel on the GPU.
- a batch detection phase is performed.
- the newly trained classifier is used to perform detection on each input volume, and the results are then used by the later nodes in the network.
- the detection code can be immediately reused to speed-up the phases.
- Fig. 16 shows speedups for Config2 using small volumes in graph 1602 and speedups for Config2 using medium volumes on graph 1604.
- the Haar features line for graph 1602 is represented by line 1606 and the Steerable features line for graph 1602 is represented by line 1608.
- the Haar features line for graph 1604 is represented by line 1610 and the Steerable features line for graph 1604 is represented by line 1612. From Fig. 16 it is apparent that if only a few samples share the same volume, the speed-up will be low.
- the speed-up also depends on the size of the image (as the integral image is computed on the GPU).
- a hierarchical model was trained.
- the hierarchical model had 3 resolutions of data, each with translation, orientation, and scale detectors using 300 images from the SI data set.
- For each PBT trained there were roughly 2400 positive samples and 140K negative samples.
- Training of a node used a maximum of 2500 negative samples.
- Timing results were all computed on Config2.
- the results after including the CUDA enhancements (not including feature matrix computation) are shown by Table 8.
- Table 8 shows the total times for phases of the training on Config2.
- the weak classifier training was sped-up, and the overall computation time gives a 1.5x speedup overall.
- the 3.5x speed-up on weak classifier training gives a roughly 2.1x speed-up for training a strong classifier.
- Computer 1702 contains a processor 1704 which controls the overall operation of the computer 1702 by executing computer program instructions which define such operation.
- the computer program instructions may be stored in a storage device 1712, or other computer readable medium (e.g., magnetic disk, CD ROM, etc.) and loaded into memory 1710 when execution of the computer program instructions is desired.
- An image acquisition device 1720 can be connected to the computer 1702 to input images to the computer 1702.
- the image acquisition device 1720 may be a C-arm image acquisition system capable of inputting 3D C-arm CT images and 2D fluoroscopic images to the computer 1702. It is possible to implement the image acquisition device 1720 and the computer 1702 as one device. It is also possible that the image acquisition device 1720 and the computer 1702 communicate wirelessly through a network.
- the computer 1702 also includes one or more network interfaces 1706 for communicating with other devices via a network.
- the computer 1702 also includes other input/output devices 1708 that enable user interaction with the computer 1702 (e.g., display, keyboard, mouse, speakers, buttons, etc.).
- input/output devices 1708 that enable user interaction with the computer 1702 (e.g., display, keyboard, mouse, speakers, buttons, etc.).
- FIG. 17 is a high level representation of some of the components of such a computer for illustrative purposes.
Landscapes
- Engineering & Computer Science (AREA)
- Theoretical Computer Science (AREA)
- General Physics & Mathematics (AREA)
- Physics & Mathematics (AREA)
- Computer Vision & Pattern Recognition (AREA)
- Evolutionary Computation (AREA)
- Software Systems (AREA)
- Artificial Intelligence (AREA)
- Multimedia (AREA)
- Data Mining & Analysis (AREA)
- Computing Systems (AREA)
- General Engineering & Computer Science (AREA)
- Medical Informatics (AREA)
- Databases & Information Systems (AREA)
- Health & Medical Sciences (AREA)
- General Health & Medical Sciences (AREA)
- Life Sciences & Earth Sciences (AREA)
- Bioinformatics & Cheminformatics (AREA)
- Bioinformatics & Computational Biology (AREA)
- Evolutionary Biology (AREA)
- Mathematical Physics (AREA)
- Computational Linguistics (AREA)
- Image Analysis (AREA)
- Image Generation (AREA)
Abstract
Description
- This application claims the benefit of
U.S. Provisional Application No. 61/385,240, filed September 22, 2010 U.S. Provisional Application No. 61/424,715, filed December 20, 2010 U.S. Application Serial No. 12/180,696, filed July 28, 2008 April 20, 2010 as U.S. Patent No. 7,702,596 , andU.S. Application Serial No. 12/248,536, filed October 9, 2008 - The present invention relates to evaluation of data using probabilistic boosting trees.
- Discriminative classifiers are often a bottleneck in 3D pose detection routines. Tree-based classifiers, such as Probabilistic Boosting Trees (PBT) and Random Forests, are discriminative models used for vision-based classification and object detection. The classifier is typically evaluated at every pixel in an image, which can be inefficient. The PBT is a general type of decision tree that uses strong classifiers to make fuzzy decisions at internal nodes. Generally, using PBT requires multiple recursive calls, which slows down object detection.
- Efficiency can be improved using hierarchical methods or cascades, but 3D medical applications and real-time applications require further efficiency improvements.
- The present invention provides a method and system for evaluation of probabilistic boosting trees. In an embodiment, input data is received at a graphics processing unit. A weighted empirical distribution associated with each node of the probabilistic boosting tree is determined using a stack implementation. The weighted empirical distribution associated with each node is added to a total posterior distribution value.
- In an embodiment, posterior distribution of a probabilistic boosting tree is determined by determining a weighted empirical distribution associated with each node of the probabilistic tree using a stack implementation, and adding the weighted empirical distribution associated with each node to a total posterior distribution value. A root node of the probabilistic boosting tree is pushed onto a stack and then is determined whether to descend thru a node in a left sub-tree or a node in a right sub-tree.
- In an embodiment, a discriminative classifier of the root node is determined. Based on the discriminative classifier satisfying certain conditions, a left node, a right node, or both the left node and the right node of the root node are descended. Descending a node comprises determining a discriminative classifier of that node. If the discriminative classifier is a leaf node, the weighted empirical distribution of the node is added to the total posterior value. Otherwise, the node is pushed onto a stack and the left node, right node, or both the left and the right node of the node are descended.
- In an embodiment, the probabilistic tree is evaluated using a parallel computing architecture. The parallel computing architecture may be Compute Unified Device Architecture (CUDA). The stack may be associated with one of a plurality of threads running in parallel.
- In an embodiment, a method and system for evaluating a forest of probabilistic boosting trees is disclosed. Input data is received at a graphics processing unit. The plurality of probabilistic boosting trees is evaluated using a stack implementation. A combined posterior distribution based on a posterior distribution of each of the plurality of probabilistic boosting trees is generated.
- These and other advantages of the invention will be apparent to those of ordinary skill in the art by reference to the following detailed description and the accompanying drawings.
-
FIG. 1 illustrates a method for training a probabilistic boosting tree (PBT), in accordance with an embodiment of the present invention; -
FIG. 2 shows pseudocode for determining the posterior value of a node of a PBT using recursion; -
FIG. 3 shows pseudocode for determining the posterior value of a node of a PBT using a stack implementation according to an embodiment of the present invention; -
FIG. 4 illustrates a method for determining the posterior distribution of a node of a probabilistic boosting tree, in accordance with an embodiment of the present invention; -
FIG. 5 illustrates an exemplary PBT data structure that is arranged into a texture image; -
FIG. 6 illustrates an exemplary Compute Unified Data Architecture (CUDA) stack-based implementation of evaluating a PBT, in accordance with an embodiment of the present invention; -
FIG. 7 illustrates exemplary cubes showing Haar feature types, in accordance with an embodiment of the present invention; -
FIG. 8 illustrates a histogram classifier and feature data packed into a single column of a texture image, in accordance with an embodiment of the present invention; -
FIG. 9 shows an exemplary CUDA algorithm for implementing feature computation, in accordance with an embodiment of the present invention; -
FIG. 10 shows a table of specific steerable features used, in accordance with an embodiment of the present invention; -
FIG. 11 shows an algorithm for implementation in CUDA for steerable feature evaluation, in accordance with an embodiment of the present invention; -
FIG. 12 shows a CUDA implementation integrated into an existing software library, in accordance with an embodiment of the present invention; -
FIG. 13 illustrates a method for evaluating a forest of probabilistic boosting trees, in accordance with an embodiment of the present invention; -
FIG. 14 illustrates a graph showing execution times when threads evaluate different classifiers and when thread-blocks evaluate different classifiers, in accordance with an embodiment of the present invention; -
FIG. 15 illustrates total detection time, central processing unit (CPU) execution time, and wait time for a graphics processing unit (GPU), in accordance with an embodiment of the present invention; -
FIG. 16 illustrates speedup comparisons for small volumes and medium volumes, in accordance with an embodiment of the present invention; and -
FIG. 17 is a high level block diagram of a computer capable of implementing the present invention. - The present invention is directed to a method and system for evaluation of probabilistic boosting trees. Embodiments of the present invention are described herein to give a visual understanding of the method for evaluation of probabilistic boosting trees. A digital image is often composed of digital representations of one or more objects (or shapes). The digital representation of an object is often described herein in terms of identifying and manipulating the objects. Such manipulations are virtual manipulations accomplished in the memory or other circuitry / hardware of a computer system. Accordingly, it is to be understood that embodiments of the present invention may be performed within a computer system using data stored within the computer system.
-
Fig. 1 illustrates a method for training a probabilistic boosting tree (PBT), according to an embodiment of the present invention.Fig. 1 more specifically describes accelerated training of a probabilistic boosting tree using a graphics processing unit (GPU). - At
step 102, training data is received. The training data may be annotated training data including images having annotations representing locations of landmarks of objects in the image. The training data may consist of images having annotations representing locations of landmarks of objects in the image. Training data can be medical image data such as computerized tomography (CT), magnetic resonance imaging (MRI), X-ray, or Ultrasound image data. - A PBT models the posterior distribution of a data set. In training a PBT, the aim is to enable the use of the PBT as a discriminative model for classification and detection of an object in image data. A PBT is a binary decision tree with a fuzzy decision taken at each internal node of the tree depending on the output of the node's strong classifiers. The posterior value of any given individual node is determined by combining the posterior values of its child nodes using a weighted distribution. Weights used in the determination are determined by evaluating a node's strong (learned) classifier, q̂N (y|x) .
- Each node N contains a strong classifier, q̂(y|x), and the empirical distribution of its leaf nodes qN (y), where y ∈ {-1,+1}, and x is an input point. The strong classifier can be any classifier that uses a problem specific feature. For example, an AdaBoost classifier can be used, which combines several binary weak classifiers to produce a strong estimate.
- At
step 104, the training data is divided into a first data set and a second data set by a classifier. The classifier that divides the training data is a strong (learned) classifier associated with the top parent node of the PBT. - At
step 106, a first sub-tree and a second sub-tree are trained. The first data set is used to train a first sub-tree of the parent node and the second data set is used to train a second sub-tree of the parent node. A classifier at each node of the PBT is trained using a feature matrix. - During training of a PBT, the PBT is constructed using a set of positive and negative examples, which may originate from different 3D images. Each node of the PBT includes a strong classifier, such as the AdaBoost classifier, which may be trained for that particular node. A feature matrix is computed (e.g., every possible feature is evaluated for every input sample), and then each of the weak classifiers that constitute the strong classifier is trained using the feature matrix.
- Using the feature matrix, the weak classifiers of the strong classifier may be trained sequentially by choosing each weak classifier using a greedy algorithm by considering how well each feature acts as a classifier. The algorithm for choosing the weak classifier during training includes three passes. First, feature bounds must be computed. Afterwards, a feature value is mapped to each sample within a histogram bin. Then, the histogram bins are incremented. Each sample may then be sampled with the trained classifier to compute an error. All of the aforementioned steps may be performed on a GPU. The operations for a classifier are independent, so each weak classifier can be trained by a different thread. The feature matrix column indexes the feature type, while the row indexes the sample. Each thread processes a single column.
- The feature matrix is stored as a single component floating-point texture. The input is then split up into several textures of a maximum width and processed in chunks. Through CUDA texture limits, the restriction is a maximum width of 32768/sizeof(float)=8192. The feature data stays on the GPU for each of the weak training classifier passes. For each pass, the weights of the samples are updated.
- Returning to
Fig. 1 , atstep 108, a trained posterior distribution model of the PBT is generated based on the feature matrices of each node. The posterior distribution model represents a set of classifications that may be used for object classification and object detection. The set of classifications from the posterior distribution model of the PBT may be used thereafter by a detector to perform detection on image data. For example, the trained tree can be used to estimate the posterior probability of unseen data using a stack implementation on a GPU, as discussed in further detail in the following paragraphs. - The data parallel nature of evaluation using the PBT means that it is advantageous to utilize the computation power of a GPU instead of a central processing unit (CPU). Thus, in order to implement evaluation of a PBT on a GPU, multiple recursive calls, which are used in a traditional evaluation of a PBT may be replaced using a stack-based implementation. Cached texture memory is used to represent features and tree data structures. Since GPUs do not support recursive calls, the stack-based implementation is necessary to remove recursion.
- For comparison,
Fig. 2 shows pseudocode for determining the posterior value of a node of a PBT using recursion.Fig. 3 shows pseudocode for determining the posterior value of a node of a PBT using a stack implementation according to an embodiment of the present invention. - The posterior probability of a node, is recursively computed as a weighted combination of the posterior probabilities of the child nodes, referenced by
reference numeral 204. The weight factor of this combination is determined by evaluating the node's strong classifier, referenced byreference numeral 202. The recursion terminates at leaf nodes of the tree (i.e., nodes with no child nodes), which simply return their empirical distribution qN (+1). The final result, or posterior distribution for each node is a sum of weighted empirical distributions of the child nodes, represented by a result referenced byreference numeral 206. The total weight given to any node's empirical distribution is the product of the weights associated with the path from the root to the node. - The algorithm for using a stack implementation is shown in
Fig. 3 . As illustrated inFig. 3 , a stack holds a list of to-be traversed nodes and their respective weights. When a leaf node is visited, the empirical distribution of that leaf node with its weight is added to a total empirical distribution of the root node, represented byreference numeral 302. - The root node and corresponding weight is first pushed into a stack. Each node in the stack is then processed sequentially, represented by
reference numeral 306. If the node is a leaf node, the empirical distribution of the node is weighted by the corresponding weight and accumulated into the total posterior of the tree, represented byreference numeral 302. If a particular node has child nodes, then either the left or right child nodes are placed into the stack with weights that are the product of the parent node's weight and a factor dependent on the value of the parent node's strong classifier, represented byreference numeral 312. The empirical distribution of child nodes that are not pushed on the stack is weighted and accumulated to the total posterior distribution of the tree. The weight is proportional to the weight of the parent node and the value of the strong classifier evaluated at the parent. The sum of all of these products represents the total posterior distribution model for the PBT, represented byreference numeral 310. -
Fig. 4 illustrates a method for determining the posterior distribution of a node of a probabilistic boosting tree using a GPU, in accordance with an embodiment of the present invention. - At step 402, input data is received at a GPU. Input data may be a 2D image or a 3D volume received from an image acquisition device. The 3D volume can be a C-arm CT volume, computed tomography (CT) volume, magnetic resonance imaging (MRI) volume, etc. The 3D volume can be received from an image acquisition device, such as a C-arm image acquisition system, or can be a previously stored volume loaded from memory or storage of a computer system, or some other computer readable medium.
- At step 404, a weighted empirical distribution associated with each node of the probabilistic boosting tree is determined using a stack implementation. The posterior probability p̃(y|x) is determined using the principles described above with a stack implementation. Specifically, a root node of the probabilistic boosting tree is first pushed onto a stack. Then a determination is made whether to descend down the PBT thru a node in a left sub-tree or thru a node in a right sub-tree.
- In determining whether to descend down a node, a discriminative classifier of the root node is first determined. If the discriminative classifier of the root node satisfies a first condition signifying that a left node must be descended, then the method proceeds to descend down a left node in the left sub-tree. If the discriminative classifier of the root node satisfies a second condition signifying that a right node must be descended, then the method proceeds to descend down a right node in the left sub-tree. If the discriminative classifier of the root node satisfies a third condition, then the method descends down both the aforementioned left node and the aforementioned right node.
- After descending into a node, the discriminative classifier of that node is determined. If the node is determined to be a leaf node, then the weighted empirical distribution of that node is added to a total posterior distribution value. If the node satisfies the first condition, then the node will be pushed onto the stack, and the left child node of the node will be descended. If the node satisfies the second condition, then the node will be pushed onto the stack, and the right child node of the node will be descended. If the node satisfies the third condition, then the node is pushed onto the stack, and both the left and right child nodes are descended.
- At step 406, the weighted empirical distribution of each node of the probabilistic boosting tree is added to the total posterior distribution value. The total posterior distribution represents a posterior distribution model that can be used in the detection of objects or landmarks in 2D images or 3D volumes.
- In an advantageous embodiment, the above described method for evaluating a PBT can be implemented using a Compute Unified Device Architecture (CUDA) programming model. In the CUDA programming model, a parallel problem is decomposed into a grid of treaded blocks, with each block containing many threads. Blocks are assigned to the GPU's streaming multi-processors, which breaks down the block and schedules it in groups of 32 threads. In detection or classification, the grid of thread blocks will overly the input space (e.g., all pixels in the volume), and each thread will evaluate the classifier for a different pixel in the volume or a different orientation/scale hypothesis.
- The programming model exposes the memory architecture, which includes a 16kb low-latency shared memory (accessible from threads within the same block), high-latency local memory (per-thread), global memories (accessible by all threads), and cached global accesses through texture memory. Designing the algorithm to use these memory types appropriately is key to efficiency.
- On a GPU implementation of evaluating a probabilistic boosting tree, several threads will descend the tree in parallel. Thus, neighboring threads may access the tree data structure in different regions, so placing the tree structure in global memory may cause slow uncoalesced memory access. However, since the tree data structure is too large to fit entirely in a 16kb shared memory, the tree data structure may be packed into a texture image. Instead of node pointers, 2D location indices that reference the node's 2D region are placed inside the texture image.
- For example, the node data may contain AdaBoost classifiers, which include several weak classifiers. Each node contains either a simple threshold classifier or a histogram classifier whose decision is made on the basis of a single feature. Thus, the PBT node data that is placed inside the texture image must store the sum of alpha (or weighting) values, the number of weak classifiers, and the data for each of the classifiers. The weak classifiers are stored in adjacent columns of the texture image, and each column containing an associated weight α i .
Fig. 5 illustrates an exemplary PBT data structure that is packed into a texture image. All weak classifiers are arranged along thecolumns 502a-502g, and each PBT node stores 2D texture coordinate indices to their child nodes, represented by 504a fornode node node 3. -
Fig. 6 illustrates an exemplary CUDA stack-based implementation of evaluating a PBT using the algorithm shown inFig. 3 . - In order to introduce new feature types into a PBT evaluation, the CUDA PBT evaluation function shown in
Fig. 6 is represented by feature_func, which allows new feature types to be added. Both 3D sample box information and 2D texture location of the feature data are passed to this feature evaluation function. - Marginal space learning (MSL) is an efficient method used to perform object localization. In MSL, a large 9-dimensional search space for a similarity transformation is decomposed into a series of smaller search spaces from translation to full similarity. During detection, a discriminative classifier is evaluated on pixels in the volume to determine a small set (e.g., 100-1000) of candidate positions. Orientation is detected by evaluation each of these candidate boxes with a series of hypothesis orientations and similarly for scale. The final list of candidates are aggregated to obtain a single pose estimate.
- A Hierarchical Detection Network (HDN) to extend MSL to multiple structure detection may be used. The HDN decomposes a joint multi-object detection problem into sequential detections with spatial priors used for object prediction. The hierarchical detection of multiple structures is broken down into a network of nodes for detection position, orientation, and scale, for each structure. Spatial dependencies are also represented as arcs in this detection network.
- Although MSL is an efficient framework for detection, the main computational burden comes from evaluating a discriminative classifier in each phase of the detection. In position detection, the classifier is either evaluated by looping over the 3D locations in the image (if the node has no ancestor) or by looping over a set of candidate locations provided by a preceding node. For orientation and scale detection, the classifier is evaluated over each of the input candidate locations using each of the possible orientation (or scale) hypothesis. The same classifier is evaluated on different data, which makes it an ideal detection algorithm for the data parallel power of a GPU. GPU accelerated implementations are possible, using a PBT as the classifier for MSL.
- During detection, a PBT tree is evaluated with the context surrounding a specific location (and pose). Features may be computed on the fly from an input image. In MSL, position detection utilizes Haar features, and the subsequent orientation and scale detection utilize efficient steerable features that sample the image intensity and gradient in a volume using the candidate pose of the box.
- Haar features are weighted combinations of the sums of cubic regions of an image. These sums are efficiently calculated using the integral image. The features use no more than four cubes.
Fig. 7 illustrates exemplary cubes showing Haar feature types.Cubes 702 indicate negative weights. - The features possible for a given location consists of various translated and scaled versions of these boxes. Each possible feature can be described by the size, weights, and locations of these cubes (relative to a testing point).
Fig. 8 illustrates a histogram classifier and feature data packed into a single column of a texture image.Column 802 shows a layout for Haar features with a histogram classifier, where each cube must be stored in the texture. The histogram contains 64-bins and are packed into two float components that are interpreted as integers.Column 804 shows a steerable feature with a threshold classifier requires only the threshold for the classifier and a single texel to store the feature information. - Evaluation on the GPU then proceeds by looking up cubes for the feature, evaluating the integral image, and combining the results.
Fig. 9 shows an exemplary CUDA algorithm for implementing the feature computation described above. To avoid conditionals for boundary testing, the boundary of the integral image is padded with extra planes filled with zeros. - Parallel work efficient algorithms for computing the integral image in a 3D case on a GPU requires mimicking a typical CPU implementation of the 3D integral image computations that proceeds in 3 passes. While performing the padding of the integral images with zeros, as stated above, the accumulation of the image in the x-direction is also performed on the CPU. Once this padded image is transferred to the GPU, a grid of thread blocks on the x-z plane are used to accumulate in the y-direction. The same step is taken for the z direction, where the threads are on the x-y plane.
-
Fig. 10 shows a table of specific steerable features used. I represents the image intensity, ∇I = {Ix ,Iy ,Iz }, and d is an input sample direction. For a specific sample location, the features are transformations on either a gray value, the gradient, or the projection of the gradient onto an input direction. In the case of oriented box detection, the input direction comes from the x-axis of the box, and a discrete sampling of 3D locations is considered for these features within the detected box. Each of these features can be calculated on one of several image resolutions of an image pyramid. Therefore, each feature is completely described by its position in the 3D sampling pattern (3 integers), the type of feature (1 integer), and the discrete image scale it is computed at (1 integer). By packing the type and scale into a single value (e.g., scale*32 + type), this date can be packed into as few as 1 RGBA pixels of a texture image. - To avoid a large conditional or switch statement which treats all of the basic feature types as unique elements, a series of common extractions is extracted. Extraction takes place in two phases, data extraction, and modification. During data extraction, the initial datum to be extracted for modification is extracted. This requires a group of conditionals corresponding to those shown in
Fig. 10 . After data extraction, three modifiers can be applied: a power, an absolute value, or a logarithm. Both the type of data to be extracted and the subsequent modifier are stored as flags in a table of length 25. -
Fig. 11 shows an algorithm for implementation in CUDA for steerable feature evaluation. In the algorithm shown inFig. 11 , p = {I,Ix ,Iy ,Iz }, and input direction, d = {0,dx ,dy ,dz }, defined atreference number 1102. If threads in a block diverge, the path each thread takes from the others is short (and not the entire evaluation of the feature). The data extraction and storage of flags is represented byreference numeral 1104, and the pixel transformation is represented byreference numeral 1106. - As texture arrays cannot be dynamically indexed in CUDA, the multiple scales of the image are packed into a single texture. An offset table stores the lower left corner of each of the resolutions in this texture.
-
Fig. 12 shows a CUDA implementation integrated into an existing software library. The GPU implementation is mostly isolated from the detection package, with the interface being exposed by deriving from theSrcObjectPositionDetector 1202 andSrcBoxDetector 1204. The detector may utilize a classifier, such as a PBT, or a random forest™, which is discussed below. - In order to interface with CUDA, an object position detector, ScrCudaPositionDetector 1206 replaces the main classifier loop within the CPU position detector. This loop iterates either over entire 3D volumes or a set of previously generated position candidates. The evaluation of the posterior distribution from the underlying classifier is scheduled on the GPU over these locations. The results are then sorted on the GPU and only the required number of candidate locations are transferred back to main memory.
- The case is similar for orientation and scale detection which is handled by
SrcBoxDetector 1204. A common interface is derived to replace routines responsible for detecting orientation and scale. In these instances, the input is a set of m candidate box locations for which there are also a set of n hypothesis orientations (or scales). During orientation detection, the 3D axes corresponding to the hypothesis orientations are computed and transferred to the GPU as a texture. The CUDA kernel for orientation detection, represented byreference number 1208, uses m*n threads to evaluate the PBT for all possible candidate boxes using each of the potential orientations. The situation is similar for scale detection although the hypothesis scales are transferred to the GPU instead of the orientations. -
Fig. 13 illustrates a method for evaluating a forest of probabilistic boosting trees, in accordance with an embodiment of the present invention. Decision trees, such as the probabilistic boosting tree may be used in a forest algorithm, such as the random forest algorithm. Evaluation of a forest algorithm is similar to that of the PBT. For example, the forest may comprise a plurality of PBTs, and the posterior distribution output of the forest is a combination of the output of each PBT. Atstep 1302, input data is received at a GPU. - At
step 1304, a plurality of PBTs are evaluated using a stack implementation. The stack implementation may be the one described above with respect to the method ofFig. 4 . - At
step 1306, a combined posterior distribution model of each of the PBTs is generated. The posterior distribution model may be represented by
- Experiments using the methods described herein were performed. Specifically, the experiments were performed on two hardware setups: Config1) a 1 GB Nvidia 9800 GT with an Intel Core(2) Duo with 3.5 GB of RAM; and Config2) A 1.5GB Nvidia 480 GTX with an Intel Core Quad with 16GB of RAM. Results for evaluating PBT are presented, namely feature evaluation, weak classifier evaluation, strong classifier evaluation, and full classifier evaluation. The GPU-PBT implementation was compared to similar implementations of random forests in terms of accuracy and improvements in efficiency.
- Unless otherwise noted, all timing results compare the GPU version to an OpenMP implementation, where there are 2 threads for Config1 and 8 threads for Config2. In all examples, the following datasets were used:
- 1) A Semantic Indexing (SI) data set of ultrasound images of fetal heads used in a semantic indexing project. 990 volumes with 1 mm resolution and dimensions 143x90x110 to 231x161x208 were used for training. 215 were used for testing. The HDN network is built on 6 structures, including, e.g., the Corpus Callosum (CC) and Cerebellum (CER). The HDN network encodes spatial relationships between structures, and performs detection on volume resolutions of 4 mm, 2mm, and 1 mm.
- 2) A data set including CT scans of 247 hips with image dimensions ranging from 70x70x89 to 125x125x334. The HDN network consists of position detection for the hip and is performed on resolutions of 16 mm, 8mm, and 4mm.
- As discussed above, Haar features use the integral image, which can be calculated on the GPU. Table 1, shown below, summarizes the speedups that are possible with GPU accelerated integral image calculation. Table 1 shows speedups in the table comparing the GPU accelerated version to a multi-threaded OpenMP version. For each configuration, the right column shows a time when reading back an image is not required. The timings include the time to pad the image and transfer the results on the GPU. For a volume of 2563, a five-fold speedup is attained on both systems when the integral image does not need to be read back (as is the case during detection).
Table 1 Config1 Config2 size w/ read w/o read w/ read w/o read 643 0.79 1.58 1.49 2.49 1283 3.47 5.07 2.15 3.44 2563 4.04 5.57 3.11 5.20 4003 3.89 5.35 2.95 4.86 - Table 2, shown below, shows speedups gained throughout the evaluation process for both steerable and Haar features. The Feature row considers only evaluating the features. In these tests, the same feature was evaluated on all pixels in a volume. It is apparent that the steerable features give a better speedup, possibly because their implementation involves more computation, whereas the Haar features mostly involve texture lookups and only a few additions (e.g. bandwidth limited). As expected, these speedups propagate into the weak classifier evaluation, which only evaluates a single features and looks up a bit in a histogram bin. However, the strong classifier evaluates and combines the results of roughly 40 weak classifiers. In this case, the two feature types start to behave more similarly, where a 26x speedup is achieved with Config1. On Config2, a strong classifier with steerable features is still 1.5 times faster than the Haar features.
Table 2 Config1 Config2 Harr Steerable Harr Steerable Feature 3.2x 15x 4.9x 21.5x Weak 10.5x 25.7x 38.6x 112.4x Strong 26x 26x 22.3x 36.5x PBT 4.7x 7x 11.5x 12.18x - When it comes to evaluating an entire tree (the PBT row of Table 2), there is only a 4.7x speedup on
Config 1 and 12x onConfig 2. The speedup of the strong classifier limits the attainable speedup on the PBT tree. An explanation for the different speedup times may be due to cache consistency. When evaluating a single strong classifier on every pixel, each pixel will access the same relative location as its neighboring pixel. As the tree is descended, neighboring pixels may take different paths down the tree, meaning that they will be evaluating different strong classifiers, which in turn use different features. For both Haar features and steerable features, this means that neighboring pixels will sample from different relative locations in the texture, and different control points may be taken. -
Fig. 14 illustrates a graph showing execution times when threads evaluate different classifiers and when thread-blocks evaluate different classifiers. As nodes in a PBT are descended, threads in the same thread block will evaluate different nodes. Thethread curve 1402 represents when threads evaluate different classifiers and theblock curve 1404 represents when different thread-blocks evaluate the different classifiers.Thread curve 1402 shows that there is a longer execution time when evaluating different classifiers with threads.Fig. 14 also shows that evaluating the classifier by blocks do not affect the run-times. In contrast, when evaluating by threads, when the tree is deeper, the evaluation is 5x slower. - The results of experiments shown above illustrate the potential benefit of using GPU accelerated PBT evaluation. However, these experiments were carried out in ideal execution environments where there is enough work for the GPU and the same program is being run on all voxels in an image. In the following paragraphs, the PBT is evaluated in the context of the already optimized hierarchical detection system.
- Table 3 shows timings and speedups for the detection of 6 structures in the SI data set. These times were averaged over 201 volumes. Most of the execution is in orientation and scale detection (which uses steerable features). On Config1, the overall speedup of 4.8x is slightly lower than the results from the steerable feature PBT evaluation shown in Table 2. Similarly, with Config2, the 9.73x speedup for hierarchical detection was slightly lower than the results from the steerable feature PBT evaluation in Table 2. This is due to hierarchical detection having regions that are inherently serial, which must be performed on the host CPU (e.g., results are read back, candidates are pruned, and detection results are written to files). Furthermore, some of the phases of detection only need to evaluate the PBT on as few as 1000s of elements, meaning that the GPU cannot be fully utilized.
Table 3 Config1 Config2 CPU GPU S.up CPU GPU S.up I.V 13.9 2.63 5.28x 7.22 0.57 12.7x CC 1.42 0.33 4.21x 0.88 0.12 7.33x CP 2.90 0.63 4.60x 1.74 0.15 11.5x HC 1.11 6.32 3.46x 0.77 0.15 5.20x CER 6.48 1.83 3.52x 4.40 0.67 6.54x CSP 7.57 1.20 6.30x 3.44 0.24 14.6x Sum 33.4 6.96 4.80x 18.5 1.90 9.73x - While code is executing on the CPU, it is possible to concurrently execute some of the code on the CPU. This trade-off was also investigated via experiments on the orientation detector, which is the most time consuming component of hierarchical detection.
- In this experiment, a portion of the work was selected and scheduled on the GPU, and then the remaining work was given to the CPU. Once the CPU finished work, execution waited for the preceding GPU call to complete.
Fig. 15 illustrates the total detection time, the CPU execution time, and the wait time for the GPU against varying proportions of work assigned to the GPU. The total amount of time for detection is represented byline 1502, the total CPU time is represented byline 1504, and the GPU sync time (wait time for the GPU) is represented byline 1506. The GPU work is started asynchronously after the CPU work is initialized. A non-zero GPU sync time indicates that the GPU does not have enough work. The optimal ratio, fromFig. 15 , for the detection line appears to be roughly 0.85. - For Config1, the optimal proportion is expected to be in accordance with speedups obtained in the PBT evaluation. For steerable features, the GPU was 7x faster than the dual core for PBT tree evaluation, so the optimal proportion of work on the GPU is expected to be around 0.875, as confirmed by
Fig. 15 . In this case, a 10-15% improvement can be expected in the runtime by utilizing the CPU at the same time as the GPU. - Using
Config 2, the speedup for orientation evaluation was above 12x, meaning that utilizing the CPU at the same time gives about 5% improvement. - In a further set of experiments, the accuracy and speed-ups attained on the GPU PBT implementation vs. the random forest™ implementation was compared. A first experiment compares the speed-up of the GPU implementation over a single thread CPU implementation in a classification context. For this example, a random forest™ of 10 trees of a
depth 10 on every pixel of a 96x97x175 3D volume was evaluated. The speedup on Config1 is 26x and Config2 is 114x. Table 4 illustrates the comparison of timings and speed-ups for the GPU implementation of a random forest™.Table 4 CPU time [s] GPU time [s] Speed-up Config1 29.3 1.1 26.6x Config2 33.7 0.294 114x - A second experiment compares the results on hierarchical position, orientation, and scale detection using the CER detection from the SI dataset. In this case, the classifier evaluation makes up a large portion of the total run-time. The PBT was trained to a maximum depth of 6, with 40 weak classifiers, and the forest implementation had a maximum depth of 10 with 50 trees. In terms of total number of weak classifiers, a descent through the forest implementation evaluates more weak classifiers (maximum of 500), whereas the PBT has at most 270 classifiers. However, the PBT uses histogram classifiers, while the forest implementation uses a threshold-based classifier. When testing on the training data, both models achieved similar accuracy. Table 5 illustrates the detection accuracy when testing on training data for the CER data structure on the SI hierarchical data set.
Table 5 Classifier Center (mm) Line(mm) RF 1.82 2.87 RF(cuda) 2.00 3.09 PBT 1.81 2.83 PBT(cuda) 1.91 3.05 - Two measurements were used as shown in Table 5: the distance between box centers (Center(mm)), and the maximum distance between end-points of an axial line on the recovered box and the ground truth (Line(mm)). From Table 5, it is apparent that both models behave similarly, and that in each case, the CUDA implementation gives slightly worse results due to a different feature evaluation code.
- On both systems, the CUDA accelerated implementation of the forest implementation is more than 10x faster than the multi-core CPU implementation. However, the CPU version of the RF is 2x slower than the PBT with similar accuracy on
Config 1. The forest implementation of CUDA achieves a better speed-up compared to the PBT, making the GPU version of theforest implementation 2% slower than the GPU-PBT onConfig 1. - Table 6 shows the timing results for the CER detection on the SI data for the two hardware configurations and the PBT and forest models that achieve similar accuracy. The forest implementation is slower on the CPU, but the GPU implementation achieves a greater speedup than the PBT. However, the GPU implementation on the forest is still slower than the GPU implementation of the PBT.
Table 6 RF model ( depth 10, mm trees 50)Config1 Config2 Cpu(s) Cpu(s) S-up Cpu(s) Gpu(s) S-up 1mm 7.57 0.68 11.16 4.65 0.31 14.79 2mm 2.05 0.21 10.02 1.49 0.13 11.17 4mm 12.62 1.02 12.41 7.39 0.25 30.11 Total 22.25 1.90 11.70 13.53 0.69 19.52 PBT model (depth 6, mm weak 40) Config1 Config2 Cpu(s) Gpu(s) S-up Cpu(s) Gpu(s) S-up 1mm 4.02 0.78 5.12 1.63 0.29 5.55 2mm 1.62 0.36 4.49 0.81 0.14 5.9 4mm 2.98 0.71 4.20 1.39 0.17 8.15 Totals 8.62 1.85 4.65 3.83 0.60 6.37 - On the PDT data, a model was trained using 161 training samples and tested on 86 unseen cases. The PBT contained 4 tree levels with 40, 42, 44, and 48 weak classifiers on each level. For the forest implementation, the maximum depth was set to 8 and trained two sets of models with either 10 or 30 trees. The forest implementation with 10 trees performs better than the PBT, which has a similar number of weak classifiers.
- Table 7 shows the comparison of timings, speed-ups, and accuracy on the 16-8-4mm translation hierarchy. The CPU version of the forest implementation is slower; and because better speedups occur on the GPU, the two GPU implementations take the same amount of time. The forest implementation is superior in this example due to superior detection accuracy. Using 30 trees improves accuracy because the GPU accelerated portions occupy more time and better speed-ups can be seen.
Table 7 Config1 Config2 Gpu(s) Cpu(s) S-up Gpu(s) Cpu(s) S-up Testing error PBT 0.31 2.25 7.36 0.20 0.98 4.92 10.07 Ranfor (10 trees) 0.31 2.56 8.34 0.21 1.20 5.61 7.47 Ranfor (30 trees) 0.60 6.44 10.7 0.27 2.88 10.6 4.93 - The following paragraphs discuss the evaluation of improvements to the training procedure of the PBT. As discussed, the training of AdaBoost classifiers for a PBT could be performed by computing a feature matrix for feature evaluation, and then training the weak classifiers in parallel on the GPU. In the hierarchical network, after the classifier for a PBT is trained, a batch detection phase is performed. During batch detection, the newly trained classifier is used to perform detection on each input volume, and the results are then used by the later nodes in the network. The detection code can be immediately reused to speed-up the phases.
- When training a strong classifier, there are often too many positive and negative training samples to build a full feature matrix, so a number of input samples are chosen randomly to build the feature matrix (around 2500 positive and 2500 negative samples). The input samples come from different volumes, and there are often too many volumes to keep on the GPU at all times. Therefore, if the features are to be evaluated on the GPU, the total number of input volumes used by the samples would need to be transferred to the GPU.
- In order to evaluate the performance of the feature matrix computation during training, 3 volumes are used and the speed-up is measured in evaluating and reading back all features.
Fig. 16 shows speedups for Config2 using small volumes ingraph 1602 and speedups for Config2 using medium volumes ongraph 1604. The Haar features line forgraph 1602 is represented byline 1606 and the Steerable features line forgraph 1602 is represented byline 1608. The Haar features line forgraph 1604 is represented byline 1610 and the Steerable features line forgraph 1604 is represented byline 1612. FromFig. 16 it is apparent that if only a few samples share the same volume, the speed-up will be low. For Haar features, the speed-up also depends on the size of the image (as the integral image is computed on the GPU). - In a benchmark, a hierarchical model was trained. The hierarchical model had 3 resolutions of data, each with translation, orientation, and scale detectors using 300 images from the SI data set. For each PBT trained, there were roughly 2400 positive samples and 140K negative samples. Training of a node used a maximum of 2500 negative samples. Timing results were all computed on Config2. The results after including the CUDA enhancements (not including feature matrix computation) are shown by Table 8. Table 8 shows the total times for phases of the training on Config2. The weak classifier training was sped-up, and the overall computation time gives a 1.5x speedup overall. The 3.5x speed-up on weak classifier training gives a roughly 2.1x speed-up for training a strong classifier. The speed-up on the entire PBT training was 1.7x (which includes loading data, determining which samples to use, propagating samples down the tree, and creating the tree data structure).
Table 8 Component GPU (S) CPU (S) Speed-up •• Feature 1675.3 1623.4 1.0 •• Weak classifs 1346.6 4695.7 3.5 • Strong 3021.8 6319.1 2.1 All Train 4269.4 7243.3 1.7 Train Detect 277.9 398.7 1.4 Other 1552.7 1649.0 1.1 Total 6100.0 9291.0 1.5 - The above-described methods for evaluation of a probabilistic boosting tree using a stack implementation and for anatomical landmark, position estimation, and object segmentation in a 3D volume, may be implemented on a computer using well-known computer processors, memory units, storage devices, computer software, and other components. A high level block diagram of such a computer is illustrated in
FIG. 17 .Computer 1702 contains aprocessor 1704 which controls the overall operation of thecomputer 1702 by executing computer program instructions which define such operation. The computer program instructions may be stored in astorage device 1712, or other computer readable medium (e.g., magnetic disk, CD ROM, etc.) and loaded intomemory 1710 when execution of the computer program instructions is desired. Thus, the steps of the methods ofFIGS. 1 ,6 , and13 may be defined by the computer program instructions stored in thememory 1710 and/orstorage 1712 and controlled by theprocessor 1704 executing the computer program instructions. Animage acquisition device 1720 can be connected to thecomputer 1702 to input images to thecomputer 1702. For example theimage acquisition device 1720 may be a C-arm image acquisition system capable of inputting 3D C-arm CT images and 2D fluoroscopic images to thecomputer 1702. It is possible to implement theimage acquisition device 1720 and thecomputer 1702 as one device. It is also possible that theimage acquisition device 1720 and thecomputer 1702 communicate wirelessly through a network. Thecomputer 1702 also includes one ormore network interfaces 1706 for communicating with other devices via a network. Thecomputer 1702 also includes other input/output devices 1708 that enable user interaction with the computer 1702 (e.g., display, keyboard, mouse, speakers, buttons, etc.). One skilled in the art will recognize that an implementation of an actual computer could contain other components as well, and thatFIG. 17 is a high level representation of some of the components of such a computer for illustrative purposes. - The foregoing Detailed Description is to be understood as being in every respect illustrative and exemplary, but not restrictive, and the scope of the invention disclosed herein is not to be determined from the Detailed Description, but rather from the claims as interpreted according to the full breadth permitted by the patent laws. It is to be understood that the embodiments shown and described herein are only illustrative of the principles of the present invention and that various modifications may be implemented by those skilled in the art without departing from the scope and spirit of the invention. Those skilled in the art could implement various other feature combinations without departing from the scope and spirit of the invention.
Claims (36)
- A method for training a probabilistic boosting tree, comprising:receiving training data at a graphics processing unit (GPU);dividing the training data into a first dataset and a second dataset using a classifier;training a first sub-tree and a second sub-tree at the GPU, the first sub-tree using the first dataset and the second sub-tree using the second dataset;generating a posterior distribution model based on the trained first sub-tree and the trained second sub-tree.
- The method of claim 1, wherein training a first sub-tree and a second sub-tree at the GPU comprises:training a classifier at each node of the first sub-tree and the second sub-tree.
- The method of claim 2, wherein training a classifier at each node of the first sub-tree and the second sub-tree comprises:computing a feature matrix for each node.
- The method of claim 3, computing a feature matrix for each node comprises:computing feature bounds;mapping feature values to samples within a histogram bin based on the feature bounds; andcomputing an error associated with each classifier.
- The method of claim 1, further comprising:determining a set of classifications based on the posterior distribution model.
- The method of claim 1, wherein the method for evaluating a probabilistic boosting tree is implemented using a parallel computing architecture.
- The method of claim 7, wherein the parallel computing architecture is Compute Unified Device Architecture (CUDA).
- The method of claim 1, further comprising:detecting structures in a 3D volume using the trained probabilistic boosting tree.
- A method for determining the posterior distribution of a probabilistic boosting tree, comprising:receiving input data at a graphics processing unit (GPU)determining a weighted empirical distribution associated with each node of the probabilistic boosting tree using a stack implementation;adding the weighted empirical distribution associated with each node to a total posterior distribution value.
- The method of claim 9, wherein determining a weighted empirical distribution associated with each node of the probabilistic boosting tree using a stack implementation comprises:pushing a root node of the probabilistic boosting tree onto a stack;determining whether to descend down the probabilistic boosting tree thru a node in a left sub-tree or thru a node in a right sub-tree.
- The method of claim 10, wherein determining whether to descend down the probabilistic boosting tree thru a node in a left sub-tree or thru a node in a right sub-tree comprises:determining a discriminative classifier of the root node;if the discriminative classifier of the root node satisfies a first condition, descending a left node in the left sub-tree;if the discriminative classifier of the root node satisfies a second condition, descending a right node in the right sub-tree; andif the discriminative classifier of the root node satisfies a third condition, descending both the left node and the right node;wherein the first condition signifies that a left node must be descended, the second condition signifies that a right node must be descended, and the third condition signifies that both a left node and a right node must be descended.
- The method of claim 11, wherein descending to a left node in the left sub-tree comprises:determining a discriminative classifier of the left node;if the left node is a leaf node, adding a weighted empirical distribution of the left node to the total posterior distribution value;if the left node satisfies the first condition, pushing the left node onto the stack and descend a left child node of the left node;if the left node satisfies the second condition, pushing the left node onto the stack and descend a right child node of the left node;if the left node satisfies the third condition, pushing the left node onto the stack and descend both the left child node and the right child node.
- The method of claim 11, wherein descending to a right node in the right sub-tree comprises:determining a discriminative classifier of the right node;if the right node is a leaf node, adding a weighted empirical weighted distribution of the left node to the total posterior distribution value;if the right node satisfies the first condition, pushing the right node onto the stack and descend a left child node of the right node;if the right node satisfies the second condition, pushing the right node onto the stack and descend a right child node of the right node;if the right node satisfies the third condition, pushing the right node onto the stack and descend both the left child node and the right child node.
- The method of claim 9, wherein the method for evaluating a probabilistic boosting tree is implemented using a parallel computing architecture.
- The method of claim 9, wherein the parallel computing architecture is Compute Unified Device Architecture (CUDA).
- The method of claim 11, wherein the stack is associated with one of a plurality of threads running in parallel.
- A method for evaluating a forest of probabilistic boosting trees, comprising:receiving input data at a graphics processing unit (GPU);evaluating the plurality of probabilistic boosting trees using a stack implementation;generating a combined posterior distribution based on a posterior distribution of each of the plurality of probabilistic boosting trees.
- A system for training a probabilistic boosting tree, comprising:means for receiving training data at a graphics processing unit (GPU);means for dividing the training data into a first dataset and a second dataset using a classifier;means for training a first sub-tree and a second sub-tree at the GPU, the first sub-tree using the first dataset and the second sub-tree using the second dataset;means for generating a posterior distribution model based on the trained first sub-tree and the trained second sub-tree.
- The system of claim 18, wherein means for training a first sub-tree and a second sub-tree at the GPU comprises:means for training a classifier at each node of the first sub-tree and the second sub-tree.
- The system of claim 19, wherein means for training a classifier at each node of the first sub-tree and the second sub-tree comprises:means for computing a feature matrix for each node.
- The system of claim 20, wherein means for computing a feature matrix for each node comprises:means for computing feature bounds;means for mapping feature values to samples within a histogram bin based on the feature bounds; andmeans for computing an error associated with each classifier.
- The system of claim 18, further comprising:means for determining a set of classifications based on the posterior distribution model.
- The system of claim 18, further comprising:means for detecting structures in a 3D volume using the trained probabilistic boosting tree.
- A system for determining the posterior distribution of a probabilistic boosting tree, comprising:means for receiving input data at a graphics processing unit (GPU)means for determining a weighted empirical distribution associated with each node of the probabilistic boosting tree using a stack implementation;means for adding the weighted empirical distribution associated with each node to a total posterior distribution value.
- The system of claim 24, wherein means for determining a weighted empirical distribution associated with each node of the probabilistic boosting tree using a stack implementation comprises:means for pushing a root node of the probabilistic boosting tree onto a stack;means for determining whether to descend down the probabilistic boosting tree thru a node in a left sub-tree or thru a node in a right sub-tree.
- The system of claim 25, wherein means for determining whether to descend down the probabilistic boosting tree thru a node in a left sub-tree or thru a node in a right sub-tree comprises:means for determining a discriminative classifier of the root node;means for descending a left node in the left sub-tree if the discriminative classifier of the root node satisfies a first condition;means for descending a right node in the right sub-tree if the discriminative classifier of the root node satisfies a second condition; andmeans for descending both the left node and the right node if the discriminative classifier of the root node satisfies a third condition;wherein the first condition signifies that a left node must be descended, the second condition signifies that a right node must be descended, and the third condition signifies that both a left node and a right node must be descended.
- The system of claim 26, wherein means for descending to a left node in the left sub-tree comprises:means for determining the discriminative classifier of the left node;means for adding a weighted empirical weighted distribution of the left node to the total posterior distribution value if the left node is a leaf node;means for pushing the left node onto the stack and descend a left child node of the left node if the left node satisfies the first condition;means for pushing the left node onto the stack and descend a right child node of the left node if the left node satisfies the second condition;means for pushing the left node onto the stack and descend both the left child node and the right child node if the left node satisfies the third condition.
- The system of claim 26, wherein means for descending to a right node in the right sub-tree comprises:means for determining the discriminative classifier of the right node;means for adding a weighted empirical distribution of the left node to the total posterior distribution value if the right node is a leaf node;means for pushing the right node onto the stack and descend a left child node of the right node if the right node satisfies the first condition;means for pushing the right node onto the stack and descend a right child node of the right node if the right node satisfies the second condition;means for pushing the right node onto the stack and descend both the left child node and the right child node if the right node satisfies the third condition.
- The system of claim 18 or 24, wherein the system for evaluating a probabilistic boosting tree is implemented using a parallel computing architecture.
- The system of claim 29, wherein the parallel computing architecture is Compute Unified Device Architecture (CUDA).
- The system of claim 26, wherein the stack is associated with one of a plurality of threads running in parallel.
- A system for evaluating a forest of probabilistic boosting trees, comprising:means for receiving input data at a graphics processing unit (GPU);means for evaluating the plurality of probabilistic boosting trees using a stack implementation;means for generating a combined posterior distribution based on a posterior distribution of each of the plurality of probabilistic boosting trees.
- A non-transitory computer readable medium encoded with computer executable instructions for training a probabilistic boosting tree, the computer executable instructions defining steps of the method of any one of claims 1, 3 to 8.
- The computer readable medium of claim 33, wherein the computer executable instructions defining the step of training a first sub-tree and a second sub-tree at the GPU comprises computer executable instructions defining the step of:training a classifier at each node of the first sub-tree and the second sub-tree.computing an empirical distribution to determine the first dataset to send to the first sub-tree and to determine the second dataset to send to the second sub-tree.
- A non-transitory computer readable medium encoded with computer executable instructions for determining the posterior distribution of a probabilistic boosting tree, the computer executable instructions defining steps of the method of any one of claims 9 to 16.
- A non-transitory computer readable medium encoded with computer executable instructions for evaluating a forest of probabilistic boosting trees, the computer executable instructions defining steps comprising:receiving input data at a graphics processing unit (GPU);evaluating the plurality of probabilistic boosting trees using a stack implementation;generating a combined posterior distribution based on a posterior distribution of each of the plurality of probabilistic boosting trees.
Applications Claiming Priority (3)
| Application Number | Priority Date | Filing Date | Title |
|---|---|---|---|
| US38524010P | 2010-09-22 | 2010-09-22 | |
| US201061424715P | 2010-12-20 | 2010-12-20 | |
| US13/228,505 US8860715B2 (en) | 2010-09-22 | 2011-09-09 | Method and system for evaluation using probabilistic boosting trees |
Publications (3)
| Publication Number | Publication Date |
|---|---|
| EP2434435A2 true EP2434435A2 (en) | 2012-03-28 |
| EP2434435A3 EP2434435A3 (en) | 2013-07-10 |
| EP2434435B1 EP2434435B1 (en) | 2018-10-31 |
Family
ID=44799652
Family Applications (1)
| Application Number | Title | Priority Date | Filing Date |
|---|---|---|---|
| EP11182135.1A Active EP2434435B1 (en) | 2010-09-22 | 2011-09-21 | Method and system for evaluation using probabilistic boosting trees |
Country Status (3)
| Country | Link |
|---|---|
| US (1) | US8860715B2 (en) |
| EP (1) | EP2434435B1 (en) |
| CN (1) | CN102592133B (en) |
Families Citing this family (27)
| Publication number | Priority date | Publication date | Assignee | Title |
|---|---|---|---|---|
| US8290882B2 (en) * | 2008-10-09 | 2012-10-16 | Microsoft Corporation | Evaluating decision trees on a GPU |
| US8666477B2 (en) | 2011-03-07 | 2014-03-04 | Siemens Aktiengesellschaft | Method and system for tracking of a virtual electrode on a coronary sinus catheter in fluoroscopic images |
| US8306267B1 (en) * | 2011-05-09 | 2012-11-06 | Google Inc. | Object tracking |
| US9002436B2 (en) | 2011-09-19 | 2015-04-07 | Siemens Aktiengesellschaft | Method and system for ablation catheter and circumferential mapping catheter tracking in fluoroscopic images |
| US9220467B2 (en) | 2011-09-19 | 2015-12-29 | Siemens Aktiengesellschaft | Method and system for tracking catheters in 2D X-ray fluoroscopy using a graphics processing unit |
| US8699752B2 (en) * | 2011-09-29 | 2014-04-15 | Nec Laboratories America, Inc. | Adaptive cross partition for learning weak classifiers |
| US8874615B2 (en) * | 2012-01-13 | 2014-10-28 | Quova, Inc. | Method and apparatus for implementing a learning model for facilitating answering a query on a database |
| US8837771B2 (en) | 2012-02-28 | 2014-09-16 | Siemens Aktiengesellschaft | Method and system for joint multi-organ segmentation in medical image data using local and global context |
| CN103366177B (en) * | 2012-03-28 | 2016-12-07 | 佳能株式会社 | Object detection classifier generation method and equipment, image object detection method and equipment |
| US9747527B2 (en) * | 2013-03-15 | 2017-08-29 | Nvidia Corporation | Performing object detection operations via random forest classifier |
| CN103336970B (en) * | 2013-06-19 | 2016-12-28 | 电子科技大学 | Distributed images based on many subtrees training and search method |
| US9679224B2 (en) * | 2013-06-28 | 2017-06-13 | Cognex Corporation | Semi-supervised method for training multiple pattern recognition and registration tool models |
| US20150036942A1 (en) * | 2013-07-31 | 2015-02-05 | Lsi Corporation | Object recognition and tracking using a classifier comprising cascaded stages of multiple decision trees |
| CN104572786A (en) * | 2013-10-29 | 2015-04-29 | 华为技术有限公司 | Visualized optimization processing method and device for random forest classification model |
| CN105809175B (en) * | 2014-12-30 | 2020-08-21 | 深圳先进技术研究院 | Cerebral edema segmentation method and system based on support vector machine algorithm |
| CN106156786B (en) * | 2015-04-19 | 2019-12-27 | 北京典赞科技有限公司 | Random forest training method based on multiple GPUs |
| US9569736B1 (en) * | 2015-09-16 | 2017-02-14 | Siemens Healthcare Gmbh | Intelligent medical image landmark detection |
| WO2017108222A1 (en) * | 2015-12-23 | 2017-06-29 | Fotonation Limited | Image processing system |
| US9471836B1 (en) * | 2016-04-01 | 2016-10-18 | Stradvision Korea, Inc. | Method for learning rejector by forming classification tree in use of training images and detecting object in test images, and rejector using the same |
| JP6687894B2 (en) * | 2016-05-20 | 2020-04-28 | 富士ゼロックス株式会社 | Class estimation device and program |
| KR102574449B1 (en) * | 2016-11-17 | 2023-09-04 | 삼성전자 주식회사 | Metohd and apparatus for processing data |
| US10061939B1 (en) * | 2017-03-03 | 2018-08-28 | Microsoft Technology Licensing, Llc | Computing confidential data insight histograms and combining with smoothed posterior distribution based histograms |
| CN107590510A (en) * | 2017-08-29 | 2018-01-16 | 上海联影医疗科技有限公司 | A kind of image position method, device, computer and storage medium |
| EP3539455A1 (en) * | 2018-03-14 | 2019-09-18 | Sorbonne Université | Method for automatically determining image display quality in an endoscopic video capsule |
| CN112633378B (en) * | 2020-12-24 | 2022-06-28 | 电子科技大学 | Intelligent detection method and system for multi-modal image fetal corpus callosum |
| US20230229945A1 (en) * | 2022-01-20 | 2023-07-20 | Dell Products L.P. | Explainable response time prediction of storage arrays detection |
| CN119918042B (en) * | 2024-11-26 | 2025-09-12 | 中国人民解放军国防科技大学 | Password security assessment method and device based on probability inference model, electronic equipment and storage medium |
Citations (1)
| Publication number | Priority date | Publication date | Assignee | Title |
|---|---|---|---|---|
| US7702596B2 (en) | 2005-03-09 | 2010-04-20 | Siemens Medical Solutions Usa, Inc. | Probabilistic boosting tree framework for learning discriminative models |
Family Cites Families (11)
| Publication number | Priority date | Publication date | Assignee | Title |
|---|---|---|---|---|
| WO1999009469A1 (en) * | 1997-08-18 | 1999-02-25 | Koninklijke Philips Electronics N.V. | Stack oriented data processing device |
| DE10210646A1 (en) | 2002-03-11 | 2003-10-09 | Siemens Ag | Method for displaying a medical instrument brought into an examination area of a patient |
| US7945390B2 (en) | 2004-10-18 | 2011-05-17 | Siemens Medical Solutions Usa, Inc. | System and method for mild cognitive impairment class discovery using gene expression data |
| CN100354894C (en) * | 2005-11-10 | 2007-12-12 | 北京航空航天大学 | Particle system based on GPU |
| US20080071711A1 (en) | 2006-09-20 | 2008-03-20 | Siemens Corporate Research, Inc. | Method and System for Object Detection Using Probabilistic Boosting Cascade Tree |
| US7754096B2 (en) | 2007-02-01 | 2010-07-13 | E.I. Du Pont De Nemours And Company | Liquefied-gas aerosol dusting composition containing denatonium benzoate |
| US7995820B2 (en) | 2007-03-30 | 2011-08-09 | Siemens Medical Solutions Usa, Inc. | System and method for detection of fetal anatomies from ultrasound images using a constrained probabilistic boosting tree |
| US8073215B2 (en) | 2007-09-18 | 2011-12-06 | Siemens Medical Solutions Usa, Inc. | Automated detection of planes from three-dimensional echocardiographic data |
| US8570333B2 (en) * | 2008-12-11 | 2013-10-29 | Nvidia Corporation | Method and system for enabling managed code-based application program to access graphics processing unit |
| US8771189B2 (en) | 2009-03-18 | 2014-07-08 | Siemens Medical Solutions Usa, Inc. | Valve assessment from medical diagnostic imaging data |
| US8343053B2 (en) | 2009-07-21 | 2013-01-01 | Siemens Medical Solutions Usa, Inc. | Detection of structure in ultrasound M-mode imaging |
-
2011
- 2011-09-09 US US13/228,505 patent/US8860715B2/en active Active
- 2011-09-21 EP EP11182135.1A patent/EP2434435B1/en active Active
- 2011-09-22 CN CN201110372598.3A patent/CN102592133B/en active Active
Patent Citations (1)
| Publication number | Priority date | Publication date | Assignee | Title |
|---|---|---|---|---|
| US7702596B2 (en) | 2005-03-09 | 2010-04-20 | Siemens Medical Solutions Usa, Inc. | Probabilistic boosting tree framework for learning discriminative models |
Also Published As
| Publication number | Publication date |
|---|---|
| US20120069003A1 (en) | 2012-03-22 |
| US8860715B2 (en) | 2014-10-14 |
| CN102592133B (en) | 2016-05-04 |
| EP2434435A3 (en) | 2013-07-10 |
| EP2434435B1 (en) | 2018-10-31 |
| CN102592133A (en) | 2012-07-18 |
Similar Documents
| Publication | Publication Date | Title |
|---|---|---|
| EP2434435B1 (en) | Method and system for evaluation using probabilistic boosting trees | |
| US10867384B2 (en) | System and method for automatically detecting a target object from a 3D image | |
| Lee et al. | Fully automated deep learning system for bone age assessment | |
| CN109003267B (en) | Computer-implemented method and system for automatically detecting target object from 3D image | |
| Yoon et al. | Cache-oblivious mesh layouts | |
| Xu et al. | Texture-specific bag of visual words model and spatial cone matching-based method for the retrieval of focal liver lesions using multiphase contrast-enhanced CT images | |
| Tang et al. | Accelerating sparse matrix-vector multiplication on GPUs using bit-representation-optimized schemes | |
| US7756313B2 (en) | System and method for computer aided detection via asymmetric cascade of sparse linear classifiers | |
| Khumancha et al. | Lung cancer detection from computed tomography (CT) scans using convolutional neural network | |
| CN117036894B (en) | Multi-mode data classification method and device based on deep learning and computer equipment | |
| CN115100185B (en) | Image processing method, device, computer equipment and storage medium | |
| Goel et al. | ComputeCOVID19+: Accelerating COVID-19 diagnosis and monitoring via high-performance deep Learning on CT images | |
| Alksas et al. | A novel higher order appearance texture analysis to diagnose lung cancer based on a modified local ternary pattern | |
| Xu et al. | Clinical target volume segmentation for stomach cancer by stochastic width deep neural network | |
| Du et al. | Tdformer: top-down token generation for 3d medical image segmentation | |
| Wang et al. | Visual tracking based on group sparsity learning | |
| CN112562031B (en) | Nuclear magnetic resonance image clustering method based on sample distance reconstruction | |
| Albarrak et al. | Volumetric image classification using homogeneous decomposition and dictionary learning: a study using retinal optical coherence tomography for detecting age-related macular degeneration | |
| CN113298807A (en) | Computed tomography image processing method and device | |
| EP4425427A1 (en) | Method for automated processing of volumetric medical images | |
| Sisini et al. | Segmentation of aortic valve calcium lesions using FPGA accelerators | |
| Zhao et al. | Research on automatic detection algorithm of pulmonary nodules based on deep learning | |
| Prathibanandhi et al. | Evaluating the Performance of Densenet and Cocoholonet Models in PCOD Detection from Ultrasound Images | |
| CN116486184B (en) | Mammary gland pathology image identification and classification method, system, equipment and medium | |
| Sebastian-Aurelian | Methods of acceleration for feature extractions in medical imaging using GPU processing |
Legal Events
| Date | Code | Title | Description |
|---|---|---|---|
| PUAI | Public reference made under article 153(3) epc to a published international application that has entered the european phase |
Free format text: ORIGINAL CODE: 0009012 |
|
| AK | Designated contracting states |
Kind code of ref document: A2 Designated state(s): AL AT BE BG CH CY CZ DE DK EE ES FI FR GB GR HR HU IE IS IT LI LT LU LV MC MK MT NL NO PL PT RO RS SE SI SK SM TR |
|
| AX | Request for extension of the european patent |
Extension state: BA ME |
|
| PUAL | Search report despatched |
Free format text: ORIGINAL CODE: 0009013 |
|
| AK | Designated contracting states |
Kind code of ref document: A3 Designated state(s): AL AT BE BG CH CY CZ DE DK EE ES FI FR GB GR HR HU IE IS IT LI LT LU LV MC MK MT NL NO PL PT RO RS SE SI SK SM TR |
|
| AX | Request for extension of the european patent |
Extension state: BA ME |
|
| RIC1 | Information provided on ipc code assigned before grant |
Ipc: G06K 9/62 20060101AFI20130531BHEP |
|
| 17P | Request for examination filed |
Effective date: 20131223 |
|
| RBV | Designated contracting states (corrected) |
Designated state(s): AL AT BE BG CH CY CZ DE DK EE ES FI FR GB GR HR HU IE IS IT LI LT LU LV MC MK MT NL NO PL PT RO RS SE SI SK SM TR |
|
| STAA | Information on the status of an ep patent application or granted ep patent |
Free format text: STATUS: EXAMINATION IS IN PROGRESS |
|
| 17Q | First examination report despatched |
Effective date: 20170210 |
|
| GRAP | Despatch of communication of intention to grant a patent |
Free format text: ORIGINAL CODE: EPIDOSNIGR1 |
|
| STAA | Information on the status of an ep patent application or granted ep patent |
Free format text: STATUS: GRANT OF PATENT IS INTENDED |
|
| INTG | Intention to grant announced |
Effective date: 20180625 |
|
| GRAS | Grant fee paid |
Free format text: ORIGINAL CODE: EPIDOSNIGR3 |
|
| GRAA | (expected) grant |
Free format text: ORIGINAL CODE: 0009210 |
|
| STAA | Information on the status of an ep patent application or granted ep patent |
Free format text: STATUS: THE PATENT HAS BEEN GRANTED |
|
| AK | Designated contracting states |
Kind code of ref document: B1 Designated state(s): AL AT BE BG CH CY CZ DE DK EE ES FI FR GB GR HR HU IE IS IT LI LT LU LV MC MK MT NL NO PL PT RO RS SE SI SK SM TR |
|
| REG | Reference to a national code |
Ref country code: CH Ref legal event code: EP Ref country code: GB Ref legal event code: FG4D |
|
| REG | Reference to a national code |
Ref country code: AT Ref legal event code: REF Ref document number: 1060281 Country of ref document: AT Kind code of ref document: T Effective date: 20181115 |
|
| REG | Reference to a national code |
Ref country code: DE Ref legal event code: R096 Ref document number: 602011053373 Country of ref document: DE |
|
| REG | Reference to a national code |
Ref country code: IE Ref legal event code: FG4D |
|
| REG | Reference to a national code |
Ref country code: NL Ref legal event code: FP |
|
| REG | Reference to a national code |
Ref country code: LT Ref legal event code: MG4D |
|
| REG | Reference to a national code |
Ref country code: AT Ref legal event code: MK05 Ref document number: 1060281 Country of ref document: AT Kind code of ref document: T Effective date: 20181031 |
|
| PG25 | Lapsed in a contracting state [announced via postgrant information from national office to epo] |
Ref country code: FI Free format text: LAPSE BECAUSE OF FAILURE TO SUBMIT A TRANSLATION OF THE DESCRIPTION OR TO PAY THE FEE WITHIN THE PRESCRIBED TIME-LIMIT Effective date: 20181031 Ref country code: AT Free format text: LAPSE BECAUSE OF FAILURE TO SUBMIT A TRANSLATION OF THE DESCRIPTION OR TO PAY THE FEE WITHIN THE PRESCRIBED TIME-LIMIT Effective date: 20181031 Ref country code: LV Free format text: LAPSE BECAUSE OF FAILURE TO SUBMIT A TRANSLATION OF THE DESCRIPTION OR TO PAY THE FEE WITHIN THE PRESCRIBED TIME-LIMIT Effective date: 20181031 Ref country code: HR Free format text: LAPSE BECAUSE OF FAILURE TO SUBMIT A TRANSLATION OF THE DESCRIPTION OR TO PAY THE FEE WITHIN THE PRESCRIBED TIME-LIMIT Effective date: 20181031 Ref country code: IS Free format text: LAPSE BECAUSE OF FAILURE TO SUBMIT A TRANSLATION OF THE DESCRIPTION OR TO PAY THE FEE WITHIN THE PRESCRIBED TIME-LIMIT Effective date: 20190228 Ref country code: PL Free format text: LAPSE BECAUSE OF FAILURE TO SUBMIT A TRANSLATION OF THE DESCRIPTION OR TO PAY THE FEE WITHIN THE PRESCRIBED TIME-LIMIT Effective date: 20181031 Ref country code: BG Free format text: LAPSE BECAUSE OF FAILURE TO SUBMIT A TRANSLATION OF THE DESCRIPTION OR TO PAY THE FEE WITHIN THE PRESCRIBED TIME-LIMIT Effective date: 20190131 Ref country code: ES Free format text: LAPSE BECAUSE OF FAILURE TO SUBMIT A TRANSLATION OF THE DESCRIPTION OR TO PAY THE FEE WITHIN THE PRESCRIBED TIME-LIMIT Effective date: 20181031 Ref country code: LT Free format text: LAPSE BECAUSE OF FAILURE TO SUBMIT A TRANSLATION OF THE DESCRIPTION OR TO PAY THE FEE WITHIN THE PRESCRIBED TIME-LIMIT Effective date: 20181031 Ref country code: NO Free format text: LAPSE BECAUSE OF FAILURE TO SUBMIT A TRANSLATION OF THE DESCRIPTION OR TO PAY THE FEE WITHIN THE PRESCRIBED TIME-LIMIT Effective date: 20190131 |
|
| PG25 | Lapsed in a contracting state [announced via postgrant information from national office to epo] |
Ref country code: PT Free format text: LAPSE BECAUSE OF FAILURE TO SUBMIT A TRANSLATION OF THE DESCRIPTION OR TO PAY THE FEE WITHIN THE PRESCRIBED TIME-LIMIT Effective date: 20190301 Ref country code: RS Free format text: LAPSE BECAUSE OF FAILURE TO SUBMIT A TRANSLATION OF THE DESCRIPTION OR TO PAY THE FEE WITHIN THE PRESCRIBED TIME-LIMIT Effective date: 20181031 Ref country code: SE Free format text: LAPSE BECAUSE OF FAILURE TO SUBMIT A TRANSLATION OF THE DESCRIPTION OR TO PAY THE FEE WITHIN THE PRESCRIBED TIME-LIMIT Effective date: 20181031 Ref country code: AL Free format text: LAPSE BECAUSE OF FAILURE TO SUBMIT A TRANSLATION OF THE DESCRIPTION OR TO PAY THE FEE WITHIN THE PRESCRIBED TIME-LIMIT Effective date: 20181031 Ref country code: GR Free format text: LAPSE BECAUSE OF FAILURE TO SUBMIT A TRANSLATION OF THE DESCRIPTION OR TO PAY THE FEE WITHIN THE PRESCRIBED TIME-LIMIT Effective date: 20190201 |
|
| PG25 | Lapsed in a contracting state [announced via postgrant information from national office to epo] |
Ref country code: CZ Free format text: LAPSE BECAUSE OF FAILURE TO SUBMIT A TRANSLATION OF THE DESCRIPTION OR TO PAY THE FEE WITHIN THE PRESCRIBED TIME-LIMIT Effective date: 20181031 Ref country code: IT Free format text: LAPSE BECAUSE OF FAILURE TO SUBMIT A TRANSLATION OF THE DESCRIPTION OR TO PAY THE FEE WITHIN THE PRESCRIBED TIME-LIMIT Effective date: 20181031 Ref country code: DK Free format text: LAPSE BECAUSE OF FAILURE TO SUBMIT A TRANSLATION OF THE DESCRIPTION OR TO PAY THE FEE WITHIN THE PRESCRIBED TIME-LIMIT Effective date: 20181031 |
|
| REG | Reference to a national code |
Ref country code: DE Ref legal event code: R097 Ref document number: 602011053373 Country of ref document: DE |
|
| PG25 | Lapsed in a contracting state [announced via postgrant information from national office to epo] |
Ref country code: SM Free format text: LAPSE BECAUSE OF FAILURE TO SUBMIT A TRANSLATION OF THE DESCRIPTION OR TO PAY THE FEE WITHIN THE PRESCRIBED TIME-LIMIT Effective date: 20181031 Ref country code: EE Free format text: LAPSE BECAUSE OF FAILURE TO SUBMIT A TRANSLATION OF THE DESCRIPTION OR TO PAY THE FEE WITHIN THE PRESCRIBED TIME-LIMIT Effective date: 20181031 Ref country code: SK Free format text: LAPSE BECAUSE OF FAILURE TO SUBMIT A TRANSLATION OF THE DESCRIPTION OR TO PAY THE FEE WITHIN THE PRESCRIBED TIME-LIMIT Effective date: 20181031 Ref country code: RO Free format text: LAPSE BECAUSE OF FAILURE TO SUBMIT A TRANSLATION OF THE DESCRIPTION OR TO PAY THE FEE WITHIN THE PRESCRIBED TIME-LIMIT Effective date: 20181031 |
|
| PLBE | No opposition filed within time limit |
Free format text: ORIGINAL CODE: 0009261 |
|
| STAA | Information on the status of an ep patent application or granted ep patent |
Free format text: STATUS: NO OPPOSITION FILED WITHIN TIME LIMIT |
|
| 26N | No opposition filed |
Effective date: 20190801 |
|
| PG25 | Lapsed in a contracting state [announced via postgrant information from national office to epo] |
Ref country code: SI Free format text: LAPSE BECAUSE OF FAILURE TO SUBMIT A TRANSLATION OF THE DESCRIPTION OR TO PAY THE FEE WITHIN THE PRESCRIBED TIME-LIMIT Effective date: 20181031 |
|
| PG25 | Lapsed in a contracting state [announced via postgrant information from national office to epo] |
Ref country code: TR Free format text: LAPSE BECAUSE OF FAILURE TO SUBMIT A TRANSLATION OF THE DESCRIPTION OR TO PAY THE FEE WITHIN THE PRESCRIBED TIME-LIMIT Effective date: 20181031 |
|
| REG | Reference to a national code |
Ref country code: GB Ref legal event code: 732E Free format text: REGISTERED BETWEEN 20200326 AND 20200401 |
|
| REG | Reference to a national code |
Ref country code: DE Ref legal event code: R081 Ref document number: 602011053373 Country of ref document: DE Owner name: SIEMENS HEALTHINEERS AG, DE Free format text: FORMER OWNER: SIEMENS CORPORATION, ISELIN, N.J., US Ref country code: DE Ref legal event code: R082 Ref document number: 602011053373 Country of ref document: DE Ref country code: DE Ref legal event code: R081 Ref document number: 602011053373 Country of ref document: DE Owner name: SIEMENS HEALTHCARE GMBH, DE Free format text: FORMER OWNER: SIEMENS CORPORATION, ISELIN, N.J., US |
|
| REG | Reference to a national code |
Ref country code: GB Ref legal event code: 732E Free format text: REGISTERED BETWEEN 20200402 AND 20200408 |
|
| PG25 | Lapsed in a contracting state [announced via postgrant information from national office to epo] |
Ref country code: MC Free format text: LAPSE BECAUSE OF FAILURE TO SUBMIT A TRANSLATION OF THE DESCRIPTION OR TO PAY THE FEE WITHIN THE PRESCRIBED TIME-LIMIT Effective date: 20181031 |
|
| REG | Reference to a national code |
Ref country code: CH Ref legal event code: PL |
|
| PG25 | Lapsed in a contracting state [announced via postgrant information from national office to epo] |
Ref country code: CH Free format text: LAPSE BECAUSE OF NON-PAYMENT OF DUE FEES Effective date: 20190930 Ref country code: LU Free format text: LAPSE BECAUSE OF NON-PAYMENT OF DUE FEES Effective date: 20190921 Ref country code: LI Free format text: LAPSE BECAUSE OF NON-PAYMENT OF DUE FEES Effective date: 20190930 Ref country code: IE Free format text: LAPSE BECAUSE OF NON-PAYMENT OF DUE FEES Effective date: 20190921 |
|
| REG | Reference to a national code |
Ref country code: BE Ref legal event code: MM Effective date: 20190930 |
|
| PG25 | Lapsed in a contracting state [announced via postgrant information from national office to epo] |
Ref country code: BE Free format text: LAPSE BECAUSE OF NON-PAYMENT OF DUE FEES Effective date: 20190930 |
|
| REG | Reference to a national code |
Ref country code: NL Ref legal event code: PD Owner name: SIEMENS HEALTHCARE GMBH; DE Free format text: DETAILS ASSIGNMENT: CHANGE OF OWNER(S), ASSIGNMENT; FORMER OWNER NAME: SIEMENS CORPORATION Effective date: 20201201 |
|
| PG25 | Lapsed in a contracting state [announced via postgrant information from national office to epo] |
Ref country code: CY Free format text: LAPSE BECAUSE OF FAILURE TO SUBMIT A TRANSLATION OF THE DESCRIPTION OR TO PAY THE FEE WITHIN THE PRESCRIBED TIME-LIMIT Effective date: 20181031 |
|
| PG25 | Lapsed in a contracting state [announced via postgrant information from national office to epo] |
Ref country code: HU Free format text: LAPSE BECAUSE OF FAILURE TO SUBMIT A TRANSLATION OF THE DESCRIPTION OR TO PAY THE FEE WITHIN THE PRESCRIBED TIME-LIMIT; INVALID AB INITIO Effective date: 20110921 Ref country code: MT Free format text: LAPSE BECAUSE OF FAILURE TO SUBMIT A TRANSLATION OF THE DESCRIPTION OR TO PAY THE FEE WITHIN THE PRESCRIBED TIME-LIMIT Effective date: 20181031 |
|
| REG | Reference to a national code |
Ref country code: DE Ref legal event code: R079 Ref document number: 602011053373 Country of ref document: DE Free format text: PREVIOUS MAIN CLASS: G06K0009620000 Ipc: G06V0030190000 |
|
| PG25 | Lapsed in a contracting state [announced via postgrant information from national office to epo] |
Ref country code: MK Free format text: LAPSE BECAUSE OF FAILURE TO SUBMIT A TRANSLATION OF THE DESCRIPTION OR TO PAY THE FEE WITHIN THE PRESCRIBED TIME-LIMIT Effective date: 20181031 |
|
| REG | Reference to a national code |
Ref country code: DE Ref legal event code: R081 Ref document number: 602011053373 Country of ref document: DE Owner name: SIEMENS HEALTHINEERS AG, DE Free format text: FORMER OWNER: SIEMENS HEALTHCARE GMBH, MUENCHEN, DE |
|
| PGFP | Annual fee paid to national office [announced via postgrant information from national office to epo] |
Ref country code: NL Payment date: 20250902 Year of fee payment: 15 |
|
| PGFP | Annual fee paid to national office [announced via postgrant information from national office to epo] |
Ref country code: FR Payment date: 20250915 Year of fee payment: 15 |
|
| PGFP | Annual fee paid to national office [announced via postgrant information from national office to epo] |
Ref country code: DE Payment date: 20251120 Year of fee payment: 15 |
|
| PGFP | Annual fee paid to national office [announced via postgrant information from national office to epo] |
Ref country code: GB Payment date: 20251002 Year of fee payment: 15 |