EP2423686A1 - Method for detecting prozone phenomenon, analysis method, device for detecting prozone phenomenon and analyzer - Google Patents
Method for detecting prozone phenomenon, analysis method, device for detecting prozone phenomenon and analyzer Download PDFInfo
- Publication number
- EP2423686A1 EP2423686A1 EP10806326A EP10806326A EP2423686A1 EP 2423686 A1 EP2423686 A1 EP 2423686A1 EP 10806326 A EP10806326 A EP 10806326A EP 10806326 A EP10806326 A EP 10806326A EP 2423686 A1 EP2423686 A1 EP 2423686A1
- Authority
- EP
- European Patent Office
- Prior art keywords
- prozone phenomenon
- detection
- detecting
- target component
- detection portion
- Prior art date
- Legal status (The legal status is an assumption and is not a legal conclusion. Google has not performed a legal analysis and makes no representation as to the accuracy of the status listed.)
- Granted
Links
Images

Classifications
-
- G—PHYSICS
- G01—MEASURING; TESTING
- G01N—INVESTIGATING OR ANALYSING MATERIALS BY DETERMINING THEIR CHEMICAL OR PHYSICAL PROPERTIES
- G01N33/00—Investigating or analysing materials by specific methods not covered by groups G01N1/00 - G01N31/00
- G01N33/48—Biological material, e.g. blood, urine; Haemocytometers
- G01N33/50—Chemical analysis of biological material, e.g. blood, urine; Testing involving biospecific ligand binding methods; Immunological testing
- G01N33/53—Immunoassay; Biospecific binding assay; Materials therefor
-
- G—PHYSICS
- G01—MEASURING; TESTING
- G01N—INVESTIGATING OR ANALYSING MATERIALS BY DETERMINING THEIR CHEMICAL OR PHYSICAL PROPERTIES
- G01N33/00—Investigating or analysing materials by specific methods not covered by groups G01N1/00 - G01N31/00
- G01N33/48—Biological material, e.g. blood, urine; Haemocytometers
- G01N33/50—Chemical analysis of biological material, e.g. blood, urine; Testing involving biospecific ligand binding methods; Immunological testing
- G01N33/53—Immunoassay; Biospecific binding assay; Materials therefor
- G01N33/557—Immunoassay; Biospecific binding assay; Materials therefor using kinetic measurement, i.e. time rate of progress of an antigen-antibody interaction
-
- G—PHYSICS
- G01—MEASURING; TESTING
- G01N—INVESTIGATING OR ANALYSING MATERIALS BY DETERMINING THEIR CHEMICAL OR PHYSICAL PROPERTIES
- G01N33/00—Investigating or analysing materials by specific methods not covered by groups G01N1/00 - G01N31/00
- G01N33/48—Biological material, e.g. blood, urine; Haemocytometers
- G01N33/50—Chemical analysis of biological material, e.g. blood, urine; Testing involving biospecific ligand binding methods; Immunological testing
- G01N33/52—Use of compounds or compositions for colorimetric, spectrophotometric or fluorometric investigation, e.g. use of reagent paper and including single- and multilayer analytical elements
-
- G—PHYSICS
- G01—MEASURING; TESTING
- G01N—INVESTIGATING OR ANALYSING MATERIALS BY DETERMINING THEIR CHEMICAL OR PHYSICAL PROPERTIES
- G01N33/00—Investigating or analysing materials by specific methods not covered by groups G01N1/00 - G01N31/00
- G01N33/48—Biological material, e.g. blood, urine; Haemocytometers
- G01N33/50—Chemical analysis of biological material, e.g. blood, urine; Testing involving biospecific ligand binding methods; Immunological testing
- G01N33/53—Immunoassay; Biospecific binding assay; Materials therefor
- G01N33/5306—Improving reaction conditions, e.g. reduction of non-specific binding, promotion of specific binding
-
- G—PHYSICS
- G01—MEASURING; TESTING
- G01N—INVESTIGATING OR ANALYSING MATERIALS BY DETERMINING THEIR CHEMICAL OR PHYSICAL PROPERTIES
- G01N33/00—Investigating or analysing materials by specific methods not covered by groups G01N1/00 - G01N31/00
- G01N33/48—Biological material, e.g. blood, urine; Haemocytometers
- G01N33/50—Chemical analysis of biological material, e.g. blood, urine; Testing involving biospecific ligand binding methods; Immunological testing
- G01N33/53—Immunoassay; Biospecific binding assay; Materials therefor
- G01N33/536—Immunoassay; Biospecific binding assay; Materials therefor with immune complex formed in liquid phase
- G01N33/537—Immunoassay; Biospecific binding assay; Materials therefor with immune complex formed in liquid phase with separation of immune complex from unbound antigen or antibody
- G01N33/538—Immunoassay; Biospecific binding assay; Materials therefor with immune complex formed in liquid phase with separation of immune complex from unbound antigen or antibody by sorbent column, particles or resin strip, i.e. sorbent materials
-
- G—PHYSICS
- G01—MEASURING; TESTING
- G01N—INVESTIGATING OR ANALYSING MATERIALS BY DETERMINING THEIR CHEMICAL OR PHYSICAL PROPERTIES
- G01N33/00—Investigating or analysing materials by specific methods not covered by groups G01N1/00 - G01N31/00
- G01N33/48—Biological material, e.g. blood, urine; Haemocytometers
- G01N33/50—Chemical analysis of biological material, e.g. blood, urine; Testing involving biospecific ligand binding methods; Immunological testing
- G01N33/53—Immunoassay; Biospecific binding assay; Materials therefor
- G01N33/543—Immunoassay; Biospecific binding assay; Materials therefor with an insoluble carrier for immobilising immunochemicals
- G01N33/54366—Apparatus specially adapted for solid-phase testing
- G01N33/54386—Analytical elements
- G01N33/54387—Immunochromatographic test strips
- G01N33/54388—Immunochromatographic test strips based on lateral flow
Definitions
- the present invention it becomes possible to easily detect generation of a prozone phenomenon even when a conventional specimen analysis tool is used and becomes possible to efficiently perform examinations using an immunochromatography method and the like in which an analysis is performed using a specifically-binding substance.
- the present invention is very useful in an analysis field, a clinical field, and the like.
- Step S3 a chart in which detection results of the reflected light obtained in the detection portion are plotted along the sample moving direction (indicated by the arrow) (Step S3). Then, a valley-shaped peak apearing in the vicinity of coordinates of the detection portion for control (C) is detected. In the case where this valley-shaped peak is not detected, it is regarded that the sample and the labeled antibodies are not moving normally, so that it is determined that a measurement cannot be performed.
- Step S4-1 When it is determined that a prozone phenomenon is not generated by the detection of prozone phenomenon in the process A, previously-obtained detection results of reflected light indicating the presence or absence of the coloring and the degree of the same in the detection portion at the time point (t2) that is prior to the time point (t1) are plotted in the same manner as at the time point (t1) (Step S4-1). Then, a prozone phenomenon is detected on the basis of the amount of change between a reflectance at the time point (t2) and a reflectance at the time point (t1) in the second detection portion (L2), for example.
- the time from starting the detection to the time point (t1) is not particularly limited, and is, for example, in the range from 5 to 20 minutes, preferably from 5 to 15 minutes, and more preferably from 8 to 12 minutes.
- the difference in time (t1 - t2) between the time point (t1) and the time point (t2) also is not particularly limited, and is, for example, in the range from 2 to 8 minutes, preferably from 3 to 7 minutes, and more preferably from 4 to 6 minutes.
- the analysis device includes: an analysis section; and a prozone phenomenon detecting section.
- the analyzing section detects a target component by detecting a complex of the target component, a labeled substance, and an immobilized substance through detection of a label of the labeled substance in a detection portion of a specimen analysis tool, and the prozone phenomenon detecting section is the prozone phenomenon detecting device of the present invention.
- the analyzing section includes a central processing unit (CPU), a memory, an input terminal, and an output terminal.
- Examples of the input terminal include a keyboard and a touch panel.
- Examples of the output terminal include a display and a printer.
- the whole of the detecting section may be arranged in the main body of the analysis device, or the whole or a part of the detecting section may be arranged outside of the main body of the device.
- the analyzing section may be provided in a personal computer (PC).
- the target component detection results are output to the output terminal.
- the specimen analysis tool 20 includes an upper base plate (not shown), the lower base plate 21, the porous body for detection 22, the two porous bodies for sample 23 and 24, the porous body for labeled antibody 25, carrying blue latex-labeled anti-CRP antibodies, and the porous body for absorption 26, absorbing an excess amount of specimen.
- the porous body for detection 22 is laminated on the center of the lower base plate 21 in the longitudinal direction thereof.
- the porous body for labeled antibody 25, carrying blue latex-labeled anti-CRP antibodies is laminated on one end (on left side of FIG. 4B ) of the porous body for detection 22.
- the two layers of the porous bodies for sample 23 and 24 are laminated on the porous body for labeled antibody 25.
- the porous body for absorption 26 is laminated on the other end (on right side of FIG. 4B ) of the porous body for detection 22. Based on the sample moving direction, a side (the left side of FIG. 4B ) of the porous body for detection 22, on which porous bodies for sample 23 and 24 are laminated is taken as upstream, and a side (the right side of FIG. 4B ) of the same, on which the porous body for absorption 26 is laminated is taken as downstream.
- the porous body for detection 22 includes, from upstream in this order, the first detection portion (L1) and the second detection portion (L2), on which anti-CRP antibodies have been immobilized and the detection portion for control (C), on which anti-IgG antibodies has been immobilized.
- a region including the first detection portion (L1), the second detection portion (L2), and the detection portion for control (C) is a detection portion 27.
- the upper base plate (not shown) is arranged so as to cover the various porous bodies laminated on the lower base plate 21. Note here that the upper base plate is provided with a through hole at the portion corresponding to the sample supplying portion of the porous body for sample 24, and the portions of the upper base material, corresponding to the first detection portion (L1), the second detection portion (L2), and the detection portion for control (C), respectively, are exposed.
- the distance between the center of the through hole and that of the first detection portion (L1) is 30 mm.
- the distance between the center of the through hole and that of the second detection portion (L2) is 33.5 mm.
- the distance between the center of the through hole and that of the detection portion for control (C) is 38 mm.
- a reflectance after 5 minutes from the start of the detection a refletance after 10 mintes from the same, and a degree of increase between the reflectance after 5 minutes and the reflectances after 10 minutes were deteremined.
- a chart showing a relationship between the coordinates and the detection values, which is examplified in FIGs. 1A and 1B was provided, and then a valley-shaped peak (C) apearing in the vicinity of coordinates (Y80 to Y110) of the detection portion for control was detected.
Landscapes
- Health & Medical Sciences (AREA)
- Immunology (AREA)
- Life Sciences & Earth Sciences (AREA)
- Engineering & Computer Science (AREA)
- Chemical & Material Sciences (AREA)
- Hematology (AREA)
- Molecular Biology (AREA)
- Biomedical Technology (AREA)
- Urology & Nephrology (AREA)
- Biotechnology (AREA)
- Biochemistry (AREA)
- Cell Biology (AREA)
- Food Science & Technology (AREA)
- Medicinal Chemistry (AREA)
- Physics & Mathematics (AREA)
- Analytical Chemistry (AREA)
- Microbiology (AREA)
- General Health & Medical Sciences (AREA)
- General Physics & Mathematics (AREA)
- Pathology (AREA)
- Chemical Kinetics & Catalysis (AREA)
- Investigating Or Analysing Materials By The Use Of Chemical Reactions (AREA)
- Investigating Or Analysing Biological Materials (AREA)
Abstract

Description
- The present invention relates to a method for detecting a prozone phenomenon, an analysis method, a device for detecting a prozone phenomenon, and an analysis device.
- In recent years, in diagnoses in the medical field, specimen analysis tools for detecting pathogens such as bacteria and viruses or determining the presence or absence of pregnancies are in widespread use. Among these specimen analysis tools, a specimen analysis tool utilizing an immunochromatography method is used widely because it enables detections to be conducted easily and rapidly. The principle of detection by the immunochromatography method performed using the specimen analysis tool is as follows, for example. First, a specimen analysis tool formed of a porous base material in which immobilized antibodies are immobilized on a detection portion of the porous base material is provided. A sample (a specimen) and antibodies labeled with colored particles are added thereto. When antigens as a target component are present in the sample, the labeled antibodies and the immobilized antibodies form complexes via the antigens, whereby the detection portion on the porous base material is colored by the colored particles. The label may be, for example, in addition to the colored particles, a combination of an enzyme and a substrate that is colored by an enzyme reaction. The detection portion generally is in a line form. When coloring is observed, it is regarded that the target component is present in the sample, so that it is determined that the sample is positive. When no coloring is observed, it is regarded that no target component is present in the sample so that it is determined that the sample is negative. In the immunochromatography method, it has been attempted that plural detection portions are provided and a target component in a sample is semiquantitatively detected by observing stepwise coloring (see, for example,
JP H8-278305 A - In the detetion of a target component using an immunochromatography method, a prozone phenomenon is generated in the case where the concentration of the target component is high, which is a problem. The prozone phenomenon is a phenomenon in which although the actual concentration of the target component in a sample is high, it is apparently determined that the target component is not present or the concentration thereof is low.
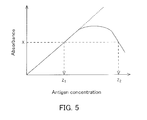
FIG. 5 is an illustration showing a relationship between the concentration of antigen and the absorbance (the degree of coloring) in a detection portion in an immunochromatography method. The absorbance is increased with an increase in the concentration of the antigen. However, when the concentration reaches a certain concentration or higher, a phenomenon in which an absorbance cannot be determined (coloring does not occur) is generated. Therefore, for example, when the concentration of antigen is Z1, an absorbance X is detected, and when the concentration of antigen is Z2 in a high concentration region, the same absorbance is also detected because a prozone phenomenon is generated. This phenomenon is caused by the fact that when the excess amount of the target component is present in a sample, the immobilized antibodies are blocked by the target component that has not reacted with labeled antibodies, so that the target component that has reacted with the labeled antibodies cannot be captured by the immobilized antibodies. Therefore, in an analysis, there is a case that a sample with a concentration in the high concentration region is apparently determined as negative (i.e., a false-negative), and it is difficult to distinguish a false-negative from an actual negative. When a false-negative caused by a prozone phenomenon is suspected, it has been required that a sample is diluted as appropriate and then re-examination is performed. On the other hand, it has been proposed to detect a prozone phenomenon that plural types of antibodies, which are different in affinity from one another are used as immobilized antibodies in a specimen analysis tool (see, for example,WO 2003/014740 ) and stepwise increased amounts of antibodies are applied to the plural detection portions (see, for example,JP No. 3644780 - In the above-mentioned methods, the specimen analysis tool needs to have a complicated structure. Further, there is a risk that the examination efficiency is reduced because the detection of the generation of a prozone phenomenon cannot be continued until the reaction is completed in a region on the most downstream side of the plural detection portions. These problems may occur not only in an immunoanalytical method utilizing an immunological reaction in which antibodies that specifically bind to antigens as a target component contained in a specimen are used, but also in analysis methods in general using a substance (e.g., a specifically-binding substance) that specifically binds to a target component contained in a specimen.
- Hence, the present invention is intended to provide a method for detecting a prozone phenomenon, an analysis method, a device for detecting a prozone phenomenon, and an analysis device, by which generation of a prozone phenomenon can be detected easily even when a conventional specimen analysis tool is used, and examinations using an immunochromatography method and the like can be performed efficiently. Means for Solving Problem
- In order to achieve the aforementioned object, the prozone phenomenon detecting method of the present invention is a method for detecting a prozone phenomenon using a specimen analysis tool containing substances that specifically bind to a target component contained in a sample. The specimen analysis tool includes: a porous base material; a sample supplying portion; a reagent portion; and at least one detection portion. The sample supplying portion, the reagent portion, and the detection portion are arranged on the porous base material from upstream to downstream in a sample moving direction in this order. The reagent portion contains a labeled substance that specifically binds to the target component. The detection portion contains an immobilized substance that specifically binds to the target component. The target component is detected by detecting a complex of the target component, the labeled substance, and the immobilized substance through detection of a label of the labeled substance in the detection portion. The prozone phenomenon detecting method includes at least one of the following processes A and B:
- the process A: a process in which detection results obtained in the detection portion are plotted along the sample moving direction, and generation of a prozone phenomenon is detected on the basis of a position of a peak in plots thus obtained; and
- the process B: a process in which the label is detected at two or more different time points in the detection portion, and generation of a prozone phenomenon is detected on the basis of a magnitude relationship between two or more detection results thus obtained.
- The analysis method of the present invention is an analysis method including: an analyzing step; and a prozone phenomenon detecting step. The analyzing step is performed using a specimen analysis tool, and the prozone phenomenon detecting step is performed by the prozone phenomenon detecting method of the present invention. The specimen analysis tool includes: a porous base material; a sample supplying portion; a reagent portion; and at least one detection portion. The sample supplying portion, the reagent portion, and the detection portion are arranged on the porous base material from upstream to downstream in a sample moving direction in this order. The reagent portion contains a labeled substance that specifically binds to the target component. The detection portion contains an immobilized substance that specifically binds to the target component. The target component is detected by detecting a complex of the target component, the labeled substance, and the immobilized substance through detection of a label of the labeled substance in the detection portion.
- The prozone phenomenon detecting device of the present invention is used in the prozone phenomenon detecting method of the present invention. The device includes: a section for obtaining detection results in the detection portion; and at least one of the following sections A and B:
- the section A: a section for detecting generation of a prozone phenomenon on the basis of a position of a peak in plots obtained by plotting the detection results along a sample moving direction; and
- the section B: a section for detecting a label at two or more different time points and detecting generation of a prozone phenomenon on the basis of a magnitude relationship between two or more detection results thus obtained.
- The analysis device of the present invention is used in the analysis method of the present invention. The analysis device includes: an analysis section; and a prozone phenomenon detecting section. The analysis section detects a target component by detecting a complex of the target component, a labeled substance, and an immobilized substance through detection of a label of the labeled substance in a detection portion of a specimen analysis tool. The prozone phenomenon detecting section is the prozone phenomenon detecting device of the present invention.
- According to the present invention, it becomes possible to easily detect generation of a prozone phenomenon even when a conventional specimen analysis tool is used and becomes possible to efficiently perform examinations using an immunochromatography method and the like in which an analysis is performed using a specifically-binding substance. Thus, it can be said that the present invention is very useful in an analysis field, a clinical field, and the like.
-
- [
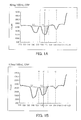
FIG. 1] FIGs. 1A and 1B are detection charts obtained by detecting light reflected of a sample of Example 1.FIG. 1A shows a result with respect to a sample having a CRP concentration of 60 mg/100 mL.FIG. 1B shows a result with respect to a sample having a CRP concentration of 6.5 mg/100 mL. - [
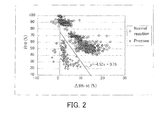
FIG. 2] FIG. 2 is a graph showing a relationship between the reflectance (R10) after 10 minutes and the difference in reflectance (ΔR5-10), in a region on the downstream side of the second detection portion in Example 1. - [
FIG. 3] FIG.3A is a plan view showing an example of a specimen analysis tool used in the present invention.FIG. 3B is a flowchart showing an example of a method for detecting a prozone phenomenon of the present invention. - [
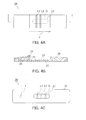
FIG. 4] FIG. 4A is a plan view showing another example of a specimen analysis tool used in the present invention.FIG. 4B is a sectional view taken along the line I-I of the specimen analysis tool shown inFIG. 4A. FIG. 4C is a plan view of a specimen analysis chip in which the specimen analysis tool is contained in a case body. - [
FIG. 5] FIG. 5 is an illustration explaining a prozone phenomenon. Best Mode for Carrying out the Invention - In the present invention, "a prozone phenomenon" means a phenomenon in which altough the actual concentration of the target component in a sample is high, it is apparently determined that no target component is present, or the concentration of the target component is low. The prozone phenomenon includes an antigen-antibody reaction and reactions in general such as those in a biochemical field other than an antigen-antibody reaction.
- In the prozone phenomenon detecting method including the above-described process B of the present invention, it is preferred that generation of a prozone phenomenon is detected with reference to a previously-provided determination criterion that associates the magnitude relationship between the two or more detection results with the generation of a prozone phenomenon.
- Further, it is preferred that the magnitude relationship between the detection results is at least one of a difference between the two or more detection results and a ratio between the two or more detection results.
- In the case where the prozone phenomenon detecting method and the analysis method of the present invention include the above-described process A, and the prozone phenomenon detecting device and the analysis device include the section A, when the peak in the plots is on a downstream side in the sample moving direction, it can be determined that a prozone phenomenon is generated.
- In the prozone phenomenon detecting method, the analysis method, the prozone phenomenon detecting device, and the analysis device of the present invention, when it is not determined in the process A that a prozone phenomenon is generated, it is preferred that the process B further is performed.
- In the prozone phenomenon detecting method, the analysis method, the prozone phenomenon detecting device, and the analysis device of the present invention, it is preferred that the at least one detection portion includes two or more detection portions arranged along the sample moving direction, and in the two or more detection portions, the detection portion on the upstream side in the sample moving direction is for detecting the target component, and the detection portion on the downstream side in the sample moving direction is for detecting a prozone phenomenon.
- In the prozone phenomenon detecting method, the analysis method, the prozone phenomenon detecting device, and the analysis device of the present invention, it is preferred that in the detection portion for detecting a prozone phenomenon, a prozone phenomenon is detected on the basis of detection results obtained in a region on the downstream side in the sample moving direction.
- In the prozone phenomenon detecting method, the analysis method, the prozone phenomenon detecting device, and the analysis device of the present invention, it is preferred that the detection results are optical signals.
- In the analysis method of the present invention, it is preferred that when generation of a prozone phenomenon is detected, the sample is determined as a false-negative.
- In the prozone phenomenon detecting method, the analysis method, and the analysis device of the present invention, when the target component are antigens, the labeled substance may be labeled antibodies, and the immobilized substance may be immobilized antibodies. On the other hand, when the target component are antibodies, the labeled subatance may be labeled antibodies, and the immobilized substance may be immobilized antigens. When the target component is antibodies, the antibodies as the target component are linked to the immobilized antigens, and the tip of Fab in the labeled antibodies is linked to the Fc region in the antibodies as the target component.
- Next, the present invention is described in detail with examples.
- In the present invention, the sample (a specimen) containing a target component is preferably liquid but is not limited thereto. In the present invention, when the sample is solid, it may be, for example, dissolved or dispersed in liquid such as a buffer solution so as to provide a solution. The buffer solution is not particularly limited, and examples thereof include a tris buffer solution, a phosphate buffer solution, an acetate buffer solution, and a borate buffer solution. In the present invention, the sample is not particularly limited, and examples thereof include: biological samples such as nasal aspirate, nasal lavage fluid, nasal swab, nasal secretion, throat swab, oral rinse, saliva, whole blood, serum, plasma, feces, urine, and cerebrospinal fluid; foods such as food substances like animals and plants and processed foods; and water collected from rivers in environmental inspection. In the present invention, when the target component is antigens or antibodies (hereinafter, also referred to as "antigens or the like"), a sample produced by extracting antigens or antibodies from the sample using an extraction fluid or the like may be used to analyze, for example. The extraction fluid is not particularly limited, and examples thereof include the above-mentioned buffer solutions. A surfactant, a stabilizing agent, an antibacterial agent, or the like may be added to the extraction fluid.
- In the present invention, the target component and the sample to be applied are not at all limited. It is preferred that the present invention is applied to, for example, detections of C-reactive protein (CRP), HbA1c, TSH, FT3, FT4, hCG, HBs antigens, HBc antibodies, HCV antibodies, TY antigens, anti-streptolysin O (ASO), IV-type collagen, matrix metallo proteinase (MMP-3), PIVAK-II, α1 microglobulin, β1 microglobulin, amyloid A (SAA), elastase 1, basic fetoprotein (BFP), candida antigens, granulocyte elastase in cervical mucus, digoxin, cystatin C, a factor XIII, transferrin in urine, syphilis, hyaluronic acid, fibrin monomer complexes (SFMC), a von Willebrand factor (factor VIII-related antigens), protein S, a rheumatoid factor (RF), IgD, α1 acid glycoprotein (α1AG), α1 antitrypsin (α1AT), α2 macroglobulin, albumin (Alb), ceruloplasmin (Cp), haptoglobin (Hp), prealbumin, retinol-binding protein (RBP), β1C/β1A globulin (C3), β1E globulin (C4), IgA, IgG, IgM, 6-lipoprotein (β-LP), apoprotein A-I, apoprotein A-II, apoprotein B, apoprotein C-II, apoprotein C-III, apoprotein E, transferrin (Tf), albumin in urine, plasminogen (PLG), and lipoprotein (a) (LP(a)), contained in blood.
- In the present invention, when the labeled antibodies are used as the labeled substance, the labeled antibodies are not particularly limited. The labeled antibodies may be, for example, antibodies to which colored insoluble carrier particles are bound or may be antibodies to which enzymes are bound.
- In the present invention, the colored insoluble carrier particles are not particularly limited, and examples thereof include colored latex particles, metal colloid particles, colored polymethyl methacrylate particles, colored polylactic acid particles, colored porous glass particles, colored silica particles, colored agarose particles, and colored dextran particles. The colored latex particles are not particularly limited, and examples thereof include blue latex particles and red latex particles. The metal colloid particles are not particularly limited, and examples thereof include gold colloid particles and platinum colloid particles. The average particle diameter of the colored insoluble carrier particles is not particularly limited. In the case of the colored latex particles, the average particle diameter is, for example, in the range from 0.05 to 5 µm, preferably from 0.1 to 1 µm. In the case of the metal colloid particles, the average particle diameter is, for example, in the range from 2 to 100 nm, preferably from 10 to 50 nm.
- In the present invention, as the enzymes, those cause substrates to be colored when they react with the substrates are used, for example, and examples thereof include peroxidase, alkaline phosphatase, and β-D-galactosidase.
- In the present invention, the substrates are not particularly limited as long as they are colored when they react with the enzymes. Examples thereof include 2,2'-azino-bis(3-ethylbenzothiazoline-6-sulfonic acid) (ABTS), 3,3',5,5'-tetramethylbenzidine (TMB), diaminobenzidine (DAB), 5-bromo-4-chloro-3-indolylphosphate (BCIP), 4-methylumbelliferyl-β-D-galactoside (4MUG), and 3-(2'-spiroadamantane)-4-methoxy-4-(3"-β-D-galactopyranosyl)phenyl-1,2-dioxetane (AMGPD).
- In the present invention, antibodies as the above-mentioned labeled antibodies are not particularly limited as long as they specifically bind to antigens as a target component or antibodies as the same. Examples thereof include antibodies to the above-mentioned various antigens. The antibodies may be antibodies derived from biological bodies or may be antibodies obtained by artificial synthesis. Examples of the antibodies derived from biological bodies include immune globulin (Ig), antibody fragments, and chimeric antibodies. Examples of the immune globulin include IgG, IgA, IgM, IgD, IgE, and IgY. Examples of the antibody fragments include Fab, Fab', and F(ab')2. The chimeric antibodies can be, for example, humanized antibodies. In the present invention, the antibodies are not particularly limited and may be produced from serum derived from a mouse, a rabbit, a goat, a sheep, a chicken or the like by a conventionally known method, or commercially available various antibodies may be used. Further, in the present invention, any of polyclonal antibodies and monoclonal antibodies may be used as the antibodies, and they can be selected as appropriate according to the antigens or the like. The antibodies obtained by artificial synthesis can be, for example, affibodies. The affibodies are a kind of artificial antibodies obtained through screening with a library so that the affibodies can bind specifically to a target substance. The affibodies are smaller in size than antibodies, and have resistances to heat, alkali, and the like. In the present invention, antibodies as the above-mentioned immobilized antibodies are antibodies specific to antigens as a target component, and may be, for example, antibodies that can bind to the same antigens as those to which the labeled antibodies bind. The type and preparing method of the immobilized antibodies are, for example, the same as those of the labeled antibodies.
- In the present invention, antigens as the above-mentioned immobilized antigens are not particularly limited and are antigens specific to antibodies as a target component. Examples thereof include the above-mentioned various antigens. In the present invention, a method for producing the immobilized antigens is not particularly limited, and can be, for example, a conventionally known method. Hereinafter the immobilized antibodies or the immobilized antigens are also referred to as "immobilized antibodies or the like".
- Next, the prozone phenomenon detecting method of the present invention is described using an immunoanalytical method as an example below. However, the prozone phenomenon detecting method of the present invention is not limited by the following examples.
- An example of the specimen analysis tool used in an immunoanalytical method is shown in the plan view of
FIG. 3A . As shown inFIG. 3A , in thisspecimen analysis tool 10, asample supplying portion 1, areagent portion 2, a first detection portion (L1), a second detection portion (L2), and a detection portion for control (C) are on theporous base material 11 from upstream to downstream in the sample moving direciton (indicated by the arrow) in this order. In thisspecimen analysis tool 10, a region including the first detection portion (L1), the second detection portion (L2), and the detection portion for control (C) is the detection portion. Thereagent portion 2 carries labeled antibodies (for example, blue latex-labeled anti-CRP antibodies). The first detection portion (L1) is for detecting antigens (for example, CRP) as a target component, and anti-CRP antibodies are immobilized thereon. The second detection portion (L2) is for detecting a prozone phenomenon, and anti-CRP antibodies are immobilized thereon. The same antibodies with the same amount thereof are immobilized on L1 and L2. The detection portion for control (C) is, for example, a detection portion for control, on which anti-IgG antibodies are immobilized. - In the present invention, the
porous base material 11 is not particularly limited as long as it has a porous structure with which a capillary action is exerted. Examples of theporous base material 11 include cellulose membranes, membranes formed of cellulose derivatives such as cellulose acetate and nitrocellulose, glass filters, and filter papers. In the present invention, the shape of the porous base material is not particularly limited, and can be, for example, rectangular or circular. In the present invention, the size of the porous base material is not particularly limited, and can be set as appropriate according to the standard of the analysis device and the like, for example. - In the specimen analysis tool of the present example, the detection portions are provided in the form of three lines extending in the width direction of the porous base material. However, the present invention is not limited thereto. The number of the detection portions can be set freely within the range from 1 to 10. Furthermore, the shape of the detection portions can be, for example, rectangular or circular, in addition to the line form.
- An example of a prozone phenomenon detecting method in an immunoanalytical method using the specimen analyzing tool of the present example is described with reference to
FIGs. 3A and 3B . - A serum (a sample) is collected (Step S1). Next, the sample is dropped on the sample supplying portion 1 (Step S2), so that the sample is supplied to the
reagent portion 2 and dissolves the labeled antibodies carried by thereagent portion 2. When the sample contains antigens as a target component, the labeled antibodies bind to the antigens through an antigen-antibody reaction, thereby forming antigen-labeled antibody conjugates. Then, the antigen-labeled antibody conjugates are developed in the porous base material and bind to the immobilized antibodies in the detection portion, thereby forming complexes. With the formation of the complexes, the first detection portion (L1), the second detection portion (L2), and the detection portion for control (C) are colored by the label. - Next, at the time point (t1), reflected light indicating the presence or absence of the coloring and the degree of the same in the detection portion is detected. Specifically, first, provided is a chart in which detection results of the reflected light obtained in the detection portion are plotted along the sample moving direction (indicated by the arrow) (Step S3). Then, a valley-shaped peak apearing in the vicinity of coordinates of the detection portion for control (C) is detected. In the case where this valley-shaped peak is not detected, it is regarded that the sample and the labeled antibodies are not moving normally, so that it is determined that a measurement cannot be performed. Thereafter, two valley-shaped peaks appearing in the vicinity of coordinates of the first detection portion (L1) and the second detection portion (L2), respectively, are detected. The mountain-shaped peak appearing at the border between the two valley-shaped peaks is taken as the border between the first detection portion (L1) and the second detection portion (L2). The coordinate at this border is taken as the coordinate at the end on the upstream side of the second detection portion (L2). On the other hand, the coordinate that is the predetermined value more than the coordinate at the border toward the downstream side is taken as the coordinate at the end on the downstream side of the second detection portion (L2). A plot of the detection value at the coordinate that is at the end on the upstream side is connected to a plot of the detection value at the coordinate that is at the end on the downstream side with a line segment. A region enclosed in the line segment and the plots forming a valley shape is taken as a peak area of the entire second detection portion (L2). In the present invention, generation of a prozone phenomenon is detected from a shape (a position of a peak) formed by plots of the detection portion. It is preferred that whether or not a prozone phenomenon is generated is determined on the basis of whether the peak is in the first half (on the upstream side) of the peak area of the entire second detection portion (L2) or in the latter half (on the downstream side) of the same. Specifically, first, it is determined whether or not the peak is in the latter half (on the downstream side) of the peak area of the entire second detection portion (L2) (Step S4). When the peak is not on the downstream side (No), generation of a prozone phenomenon is detected in the same manner as the detection of a prozone phenomenon in the process B described below. When the peak is on the downstream side (Yes), it is determined that a prozone phenomenon is generated (Step S5). For example, in the second detection portion (L2), the peak area is divided into two of "the first half" and "the latter half" by the standard line drawn through the center of the line segment. Next, in the respective areas, the minimum values (the first half: L2f - min, the latter half: L21- min) in plots of the detection values are determined. When the minimum values satisfy L2f - min ≥ L21 - min, it is determined that a prozone phenomenon is generated.
- Whether or not the peak is in the latter half (on the downstream side) of the peak area of the entire second detection portion (L2) is determined with dividing the peak area into two areas by the standard line drawn through the center of the line segment above. However, it is not limited to this. The standard line may be drawn through the point one third of the ling segment on the downstream side, and the upstream side and the downstream side may be defined by the standard line as a border. The position provided with the standard line can be decided according to, for example, detection properties of the target component, the size of the detection portion, the distance between the sample supplying portion and the detection portion, and the time required for the measurement.
- In the case where there are plural detection portions, it is possible that the peak height of the detection portion on the upstream side is compared with that of the detection portion on the downstream side, and when the peak height of the detection portion on the downstream side is higher, it is deteremind that a prozone phenomenon is generated.
- As a cause of a prozone phenomenon, it is considered that since antigens with an amount more than an amount capable of reacting with labeled antibodies carried by the reagent portion are present excessively in a sample, antigens that have not reacted with the labeled antibodies flow into the detection portion and react with antibodies immobilized on the detection portion. In this case, the antigens that have not reacted with the labeled antibodies mask the antibodies immobilized on the detection portion. Thus, antigens that have reacted with the labeled antibodies, which flow into the detection portion later cannot react with the antibodies immobilized on the detection portion, whereby a developed color becomes pale. This phenomenon is generated on the upstream side of the detection portion more apparent than on the downstream side thereof. Therefore, when a peak is present in the latter half of the detection portion, it can be determined that a prozone phenomenon is generated.
- An example in which a prozone phenomenon is detected in the second detection portion (L2) is shown above. However, a prozone phenomenon may be detected in the first detection portion (L1). When the specimen analysis tool includes three or more detection portions, the detection may be performed in any of them.
- When it is determined that a prozone phenomenon is not generated by the detection of prozone phenomenon in the process A, previously-obtained detection results of reflected light indicating the presence or absence of the coloring and the degree of the same in the detection portion at the time point (t2) that is prior to the time point (t1) are plotted in the same manner as at the time point (t1) (Step S4-1). Then, a prozone phenomenon is detected on the basis of the amount of change between a reflectance at the time point (t2) and a reflectance at the time point (t1) in the second detection portion (L2), for example. In the case, a prozone phenomenon may be detected on the basis of a peak area of the entire second detection portion (L2), and, for example, it is preferred that the peak area is divided into two at the coordinate drawn through the center of the line segment, and a prozone phenomenon is detected on the basis of a region on the downstream side of the second detection portion (L2). First, with respect to the detection results at the time (t1) in a region on the downstream side of the second detection portion (L2), count values are converted into ratios (%) of them to the line segment, respectively, and the ratios are integrated, so that a reflectance Rt1 (%) is determined. Similarly, reflected light at the time point (t2) in the detection portion is detected, and a reflectance Rt2 (%) is determined. The time from starting the detection to the time point (t1) is not particularly limited, and is, for example, in the range from 5 to 20 minutes, preferably from 5 to 15 minutes, and more preferably from 8 to 12 minutes. The difference in time (t1 - t2) between the time point (t1) and the time point (t2) also is not particularly limited, and is, for example, in the range from 2 to 8 minutes, preferably from 3 to 7 minutes, and more preferably from 4 to 6 minutes. Generation of a prozone phenomenon is detected on the basis of the difference between obtained two reflectances (ΔRt2-t1 (%) = Rt2- Rt1). The detections of reflected light and the determinations of reflectance are not limited to the detections and determinations at the time point (t1) and the time point (t2), and may be performed three or more times. Further, the detection of reflected light may be performed every one minute with time, and the average value of three detection results at the time point (t2) - 1 minute, at the time point (t2), and at the time point (t2) + 1 minute may be taken as a detection result at the time (t2).
- It is preferred that generation of a prozone phenomenon is detected with reference to a previously-provided determination criterion that associates the difference in reflectance with the generation of a prozone phenomenon. As the determination criterion, a standard line in a graph obtained by plotting the relationship between the difference in reflectance and the generation of a prozone phenomenon and a table showing the relationship between the same can be used. When the standard line in a graph obtained by plotting the relationship between the difference in reflectance and the generation of a prozone phenomenon is used, a border line may be provided by a least-squares method and is used as the standard line. Specifically, first, whether or not the difference in reflectance (ΔRt2-t1) is below the standard line is determined (Step S4-2). When it is below the standard line (Yes), it is determined that a prozone phenomenon is generated (Step S5). When it is not below the standard line (No), it is determined that a prozone phenomenon is not generated (Step S6).
- The detection of generation of a prozone phenomenon may be, in addition to or as substitute for the detection on the basis of the difference in reflectance, detection on the basis of the ratio between reflectances or detection on the basis of the magnitude relationship between the reflectances other than the difference in reflectance and the ratio between the reflectances. Further, in the present example, the detection of a label was performed using a reflectance that is an optical signal. However, the detection may be performed using a transmittance, an absorbance, or the like.
- When the target component can be oxidized, the detection of generation of a prozone phenomenon may be, in addition to or as substitue for the above-mentioned detection on the basis of the magnitude relationship between the reflectances according to the coloring of labeled antibodies, detection on the basis of the magnitude relationship between oxidization current values. In this case, as the labeled antibodies or the like, antibodies or antigens to which oxidoreductases have been bound are used, and an electron acceptor and an electrode (a cathode and an anode) are arranged in the detection portion. The oxidoreductases may be those can oxidize the target component. In the case of using such the oxidoreductases, generation of a prozone phenomenon can be detected as follows, for example. That is, in the second detection portion (L2), while the target component is oxidized by a catalyst reaction of the oxidoreductases, the electron acceptor is reduced.
The electron acceptor thus reduced is re-oxidized by an electrochemical technique. An oxidation current value obtained by this re-oxidization corresponds to the amount of the target component, whereby the target component can be indirectly subjected to a quantitative determination by measuring the current value. The electrode is not particularly limited, and examples thereof include a gold electrode, a carbon electrode, and a silver electrode. In the specimen analysis tool, the electrode is an optional component. The electrode may be, for example, arranged in the detection portion at the time of using the specimen analysis tool. - An embodiment in which when it is determined that a prozone phenomenon is not generated by the detection of a prozone phenomenon in the process A, the detection of a prozone phenomenon in the process B further is performed is described above. However, in the present invention, only the process A or the process B in the processes A and B can be employed to detect a prozone phenomenon.
- Next, the analysis method of the present invention is described. As mentioned above, the analysis method of the present invention includes an analyzing step and the prozone phenomenon detecting step. The analyzing step is performed using a specimen analysis tool. The specimen analysis tool is the same as the one used in the prozone phenomenon detecting method of the present invention. The prozone phenomenon detecting step is performed by the prozone phenomenon detecting method of the present invention.
- In the analyzing method of the present invention, it is preferred that when generation of a prozone phenomenon is detected in the prozone phenomenon detecting step, it is regarded that the analysis of the target component in the sample is not deteremined correctly, so that the sample is determined as a false-negative. With the determination as a false-negative, it is distinguished from a negative, whereby an analysis can be performed more accurately. Further, generation of a prozone phenomenon is detected, whereby there is no need to dilute a sample and re-perform an analysis.
- Next, the prozone phenomenon detecting device of the present invention is described. As mentioned above, the prozone phenomenon detecting device of the present invention is used in the prozone phenomenon detecting method of the present invention. The device includes: a section for obtaining detection results in the detection portion; and at least one of the following sections A and B. The section A is a section for detecting generation of a prozone phenomenon on the basis of a position of a peak in plots obtained by plotting the detection results along the sample moving direction. The section B is a section for detecting a label at two or more different time points and detecting generation of a prozone phenomenon on the basis of a magnitude relationship between two or more detection results thus obtained.
- In the case where reflected light is detected in the prozone phenomenon detecting method of the present invention as mentioned above, the obtaining section includes a light source portion and a light receiving portion. The light source portion emits light, so that in the
specimen analysis tool 10, the porous base material including the first detection portion (L1), the second detection portion (L2), and the detection portion for control (C) is irradiated with the light, and the light receiving portion detects reflected light. The light source portion includes, for example, a light emitting diode (LED), a semiconductor laser diode (LD), or the like. The light receiving portion includes, for example, a photodiode, a photomultiplier tube (photomul), a CCD (charge coupled device) image sensor, or the like. - When oxidation current values are detected in the prozone phenomenon detecting method of the present invention as mentioned above, the obtaining section includes, for example, an electric power supply and an ammeter. First, the electrode (cathode and anode) is connected to the electric power supply, and the ammeter is arranged between the electrode and the electric power supply. Then, a voltage is applied the electrode. After the sample reaches to the second detection portion (L2), the oxidation current values are detected. At the end, the target component is subjected to a quantitative determination based on the oxidization current values.
- The obtaining section may be a part of the prozone phenomenon detecting device of the present invention or may be external equipment.
- The detecting section includes a central processing unit (CPU), a memory, an input terminal, and an output terminal. Examples of the input terminal include a keyboard and a touch panel. Examples of the output terminal include a display and a printer. The whole of the detecting section may be arranged in the main body of the prozone phenomenon detecting device, or the whole or a part of the detecting section may be arranged outside of the main body of the device. For example, the detecting section may be provided in a personal computer (PC). The above-mentioned various determination criteria used in the detecting section may have been stored in a memory previously and referred to at the time of detection, or they may be entered into the CPU through the input terminal and referred to. The prozone phenomenon detection results are output to the output terminal.
- Next, the analysis device of the present invention is described. As mentioned above, the analysis device includes: an analysis section; and a prozone phenomenon detecting section. The analyzing section detects a target component by detecting a complex of the target component, a labeled substance, and an immobilized substance through detection of a label of the labeled substance in a detection portion of a specimen analysis tool, and the prozone phenomenon detecting section is the prozone phenomenon detecting device of the present invention.
- The analyzing section includes a central processing unit (CPU), a memory, an input terminal, and an output terminal. Examples of the input terminal include a keyboard and a touch panel. Examples of the output terminal include a display and a printer. The whole of the detecting section may be arranged in the main body of the analysis device, or the whole or a part of the detecting section may be arranged outside of the main body of the device. For example, the analyzing section may be provided in a personal computer (PC). The target component detection results are output to the output terminal.
- The present invention is descrbed in more detail using the examples below. However, the present invention is not limited thereto.
- Samples containing CRP at the various concentration are prepared, and specific examples of a detection of generation of a prozone phenomenon in an immunochramatography method using a specimen analysis tool and a determination criterion that can be used suitably in a detection of a prozone phenomenon including the method B are described below.
- Sera collected from plural subjects and healthy subjects were used as the respective samples. CRP concentrations of the respective sera were previously determined by a latex immunoturbidimetric method. On the basis of the CRP concentrations, the respective sera were classified into a sample in which a normal antigen-antibody reaction occurs and a sample in which a prozone phenomenon is generated. Specifically, samples at CRP concentrations of 0.6 mg/100 mL, 2.5 mg/100 mL, and 6.5 mg/100 mL, respectively, were classified as a sample in which a normal antigen-antibody reaction occurs. Samples at a CRP concentration of 25 mg/ 100mL or more were classified as a sample in which a prozone phenomenon is generated.
- As a specimen analysis tool for CRP measurement, "Spot Chem i-Line CRP" (product name) (manufactured by ARKRAY, Inc.) was used. An overview of this specimen analysis tool is shown in
FIGs. 4A to 4C. FIG. 4A is a plan view of thespecimen analysis tool 20.FIG. 4B is a sectional view taken along the line I-I ofFIG. 4A. FIG. 4C is a plan view of aspecimen analysis chip 30 in which thespecimen analysis tool 20 is contained in acase body 31. InFIGs. 4A to 4C , the portions identical to those inFIG. 3A are given the same numbers and symbols. Thespecimen analysis tool 20 includes an upper base plate (not shown), thelower base plate 21, the porous body fordetection 22, the two porous bodies forsample antibody 25, carrying blue latex-labeled anti-CRP antibodies, and the porous body forabsorption 26, absorbing an excess amount of specimen. The porous body fordetection 22 is laminated on the center of thelower base plate 21 in the longitudinal direction thereof. The porous body for labeledantibody 25, carrying blue latex-labeled anti-CRP antibodies is laminated on one end (on left side ofFIG. 4B ) of the porous body fordetection 22. The two layers of the porous bodies forsample antibody 25. The porous body forabsorption 26 is laminated on the other end (on right side ofFIG. 4B ) of the porous body fordetection 22. Based on the sample moving direction, a side (the left side ofFIG. 4B ) of the porous body fordetection 22, on which porous bodies forsample FIG. 4B ) of the same, on which the porous body forabsorption 26 is laminated is taken as downstream. The porous body fordetection 22 includes, from upstream in this order, the first detection portion (L1) and the second detection portion (L2), on which anti-CRP antibodies have been immobilized and the detection portion for control (C), on which anti-IgG antibodies has been immobilized. A region including the first detection portion (L1), the second detection portion (L2), and the detection portion for control (C) is adetection portion 27. The upper base plate (not shown) is arranged so as to cover the various porous bodies laminated on thelower base plate 21. Note here that the upper base plate is provided with a through hole at the portion corresponding to the sample supplying portion of the porous body forsample 24, and the portions of the upper base material, corresponding to the first detection portion (L1), the second detection portion (L2), and the detection portion for control (C), respectively, are exposed. The distance between the center of the through hole and that of the first detection portion (L1) is 30 mm. The distance between the center of the through hole and that of the second detection portion (L2) is 33.5 mm. The distance between the center of the through hole and that of the detection portion for control (C) is 38 mm. - 5 µL of each sample was added to the specimen analysis tool, and thereafter, within one minute from the addition, the specimen analysis tool was set in a reflected light measuring device (SPOTCHEM (registered trademark) IL, product name, manufactured by ARKRAY, Inc.). Then reflected light indicating the presence or absence of coloring and the degree of the same was detected. The reflected light was detected once every one minute with time, assuming that the time at which the specimen analysis tool was set in the device is a detection start time (0 second). The detection of reflected light was conducted with respect to the detecting
portion 27 in the sample moving direction. - With respect to a sample at the CRP concentration of 60 mg/100 mL and a sample at the CRP concentration of 6.5 mg/100 mL among the various samples, detection charts obtained through the detection of reflected light after 10 minutes from the detection start time are shown in
FIGs. 1A and 1B , respectively.FIG. 1A shows a result with respect to a sample at a CRP concentration of 60 mg/100 mL, andFIG. 1B shows a result with respect to a sample at a CRP concentration of 6.5 mg/100 mL. In both theFIGs. 1A and 1B , the X axis indicates a coordinate extending from upstream toward downstream in the detection portion of the specimen analysis tool, and one scale indicates about 0.167 mm. In both theFIGs. 1A and 1B , the Y axis indicates a value (unit: count) detected by the reflected light measuring device. The lower the value, the higher the degree of coloring, i.e., a reflectance is low. - In the detection chart of
FIG. 1A , the peak in plots is on the downstream side in the sample moving direction, so that it is deteremind that "a prozone phenomenon is generated" in the prozone phenomenon detection by the process A. In the detection chart ofFIG. 1B , the peak in plots is on the upstream side in the sample moving direction, so that it is not determined that "a prozone phenomenon is generated" in the prozone phenomenon detection by the process A. - Next, from detection results of the respective samples in the second detection portion, a reflectance after 5 minutes from the start of the detection, a refletance after 10 mintes from the same, and a degree of increase between the reflectance after 5 minutes and the reflectances after 10 minutes were deteremined. Specifically, with respect to each sample, a chart showing a relationship between the coordinates and the detection values, which is examplified in
FIGs. 1A and 1B was provided, and then a valley-shaped peak (C) apearing in the vicinity of coordinates (Y80 to Y110) of the detection portion for control was detected. In the case where this valley-shaped peak was not detected, it was regarded that the sample and blue latex-labeled anti-CRP antibodies were not moving normally, so that it was determined that a measurement cannot be performed and was excluded from the target to be evaluated. Thereafter, two valley-shaped peaks appearing in the vicinity of coordinates (Y30 to Y80) of the first detection portion (L1) and the second detection portion (L2) were detected. The mountain-shaped peak appearing at the border between the two valley-shaped peaks was decided as the border between the first detection portion (L1) and the second detection portion (L2). The coordinate at this border was decided as the coordinate (U) at the end on the upstream side of the second detection portion (L2). On the other hand, the coordinate that is Y20 more than the coordinate at the border toward the downstream side was decided as the coordinate (D) at the end on the downstream side of the second detection portion (L2). A plot of the detection value at the coordinate (U) that is at the end on the upstream side was connected to a plot of the detection value at the coordinate (D) that is at the end on the downstream side with a line segment. A region enclosed in the line segment and the plots forming a valley shape is a peak area of the entire second detection portion (L2). In the present example, the coordinate (M) drawn through the center of the line segment was decided, and results in a region (shadow area in bothFIGs. 1A and 1B ) on the downstream side of the second detection portion (L2) were used. With respect to the results in a region on the downstream side of the second detection portion (L2), count values were converted into ratios (%) of them to the line segment, respectively, and the ratios were integrated, so that a reflectance (%) was determined. Similarly, with respect to each sample, a reflectance (R5) after 5 minutes and a reflectance (R10) after 10 minutes in the region on the downstream side of the second detection portion (L2) were calculated, and further the difference (ΔR5 - 10) between the reflectance (R5) after 5 minutes and the reflectance (R10) after 10 minutes was calculated by the following formula:
- As "reflectance after 5 minutes", a value calculated from a detection value after 5 minutes from the start of the detection may be used, or "an average value calculated from the detection values after 4 minutes, 5 minutes, and 6 minutes, respectively" also can be used, for example.
- These results are shown in
FIG. 2. FIG. 2 is a graph showing a relationship between the reflectance (R10) after 10 minutes and the difference in reflectance (ΔR5-10). InFIG. 2 , the X axis indicates the difference in reflectance (ΔR5 - 10), while the Y axis indicates a reflectance (R10) after 10 minutes. ○ indicates the sample in which a normal antigen-antibody reaction can be performed. ◆ indicates a sample with the possibility of generating a prozone phenomenon. As shown inFIG. 2 , plots of the sample (◆) with possibility of generating a prozone phenomenon crowded on the lower left side of the graph, whereas plots of the sample (○) in which a normal antigen-antibody reaction can be performed crowded on the upper right side of the graph. An analysis was performed to divide both the groups of plots, so that the formula, Y = - 4.52x + 0.75, was obtained as shown inFIG. 2 . By the use of calibration curve based on this formula, even though a CRP concentration of a sample is unknown, the presence or absence of generation of a prozone phenomenon can be determined on the basis of the reflectance (R10) after 10 minutes and the difference in reflectance (ΔR5 - 10). - As above, according to the present invention, it becomes possible to easily detect generation of a prozone phenomenon even when a conventional specimen analysis tool is used and becomes possible to efficiently perform examinations using an immunochromatography method or the like. The prozone phenomenon detecting method, the analysis method, the prozone phenomenon detecting device, and the analysis device of the present invention are applicable to fields of clinical examinations, biochemical examinations, medical researches, and the like, uses thereof are not limited, and they are applicable to wide range of field.
-
- 1
- sample supplying portion
- 2
- reagent portion
- 10, 20
- specimen analysis tool
- 11
- porous base material
- 21
- lower base plate
- 22
- porous body for detection
- 23, 24
- porous body for sample
- 25
- porous body for labeled antibody
- 26
- porous body for absorption
- 27
- detection portion
- 30
- specimen analysis chip
- 31
- case body
- L1
- first detection portion
- L2
- second detection portion
- C
- detection portion for control
Claims (14)
- A method for detecting a prozone phenomenon using a specimen analysis tool containing substances that specifically bind to a target component contained in a sample,
the specimen analysis tool comprising:a porous base material;a sample supplying portion;a reagent portion; andat least one detection portion,the sample supplying portion, the reagent portion, and the detection portion being arranged on the porous base material from upstream to downstream in a sample moving direction in this order,wherein
the reagent portion contains a labeled substance that specifically binds to the target component,
the detection portion contains an immobilized substance that specifically binds to the target component, and
the target component is detected by detecting a complex of the target component, the labeled substance, and the immobilized substance through detection of a label of the labeled substance in the detection portion,
wherein the prozone phenomenon detecting method comprises at least one of the following processes A and B:the process A: a process in which detection results obtained in the detection portion are plotted along the sample moving direction, and generation of a prozone phenomenon is detected on the basis of a position of a peak in plots thus obtained; andthe process B: a process in which the label is detected at two or more different time points in the detection portion, and generation of a prozone phenomenon is detected on the basis of a magnitude relationship between two or more detection results thus obtained. - The prozone phenomenon detecting method according to claim 1, wherein
the prozone phenomenon detecting method comprises the process B, and
generation of a prozone phenomenon is detected with reference to a previously-provided determination criterion that associates the magnitude relationship between the two or more detection results with the generation of a prozone phenomenon. - The prozone phenomenon detecting method according to claim 1 or 2, wherein
the prozone phenomenon detecting method comprises the process B, and
the magnitude relationship between the detection results is at least one of a difference between the two or more detection results and a ratio between the two or more detection results. - The prozone phenomenon detecting method according to any one of claims 1 to 3, wherein
the prozone phenomenon detecting method comprises the process A, and
when the position of the peak in the plots is on a downstream side in the sample moving direction, it is determined that a prozone phenomenon is generated. - The prozone phenomenon detecting method according to claim 4, wherein
when it is not determined that a prozone phenomenon is generated, the process B further is performed. - The prozone phenomenon detecting method according to any one of claims 1 to 5, wherein
the at least one detection portion comprises two or more detection portions arranged along the sample moving direction, and
in the two or more detection portions, the detection portion on the upstream side in the sample moving direction is for detecting the target component, and the detection portion on the downstream side in the sample moving direction is for detecting a prozone phenomenon. - The prozone phenomenon detecting method according to claim 6, wherein
in the detection portion for detecting a prozone phenomenon, a prozone phenomenon is detected on the basis of detection results obtained in a region on the downstream side in the sample moving direction. - The prozone phenomenon detecting method according to any one of claims 1 to 7, wherein
the detection results are optical signals. - The prozone phenomenon detecting method according to any one of claims 1 to 8, wherein
the target component is an antigen,
the labeled substance is a labeled antibody, and
the immobilized substance is an immobilized antibody. - The prozone phenomenon detecting method according to any one of claims 1 to 8, wherein
the target component is an antibody,
the labeled substance is a labeled antibody, and
the immobilized substance is an immobilized antigen. - An analysis method comprising:an analyzing step; anda prozone phenomenon detecting step, whereinthe analyzing step is performed using a specimen analysis tool, andthe prozone phenomenon detecting step is performed by the prozone phenomenon detecting method according to any one of claims 1 to 10,the specimen analysis tool comprising:a porous base material;a sample supplying portion;a reagent portion; andat least one detection portion,the sample supplying portion, the reagent portion, and the detection portion being arranged on the porous base material from upstream to downstream in a sample moving direction in this order, whereinthe reagent portion contains a labeled substance that specifically binds to the target component,the detection portion contains an immobilized substance that specifically binds to the target component, andthe target component is detected by detecting a complex of the target component, the labeled substance, and the immobilized substance through detection of a label of the labeled substance in the detection portion.
- The analysis method according to claim 11, wherein
when generation of a prozone phenomenon is detected in the prozone phenomenon detecting step, the sample is determined as a false-negative. - A device for detecting a prozone phenomenon used in the prozone phenomenon detecting method according to any one of claims 1 to 10, the device comprising:a section for obtaining detection results in the detection portion; andat least one of the following sections A and B:the section A: a section for detecting generation of a prozone phenomenon on the basis of a position of a peak in plots obtained by plotting the detection results along a sample moving direction; andthe section B: a section for detecting a label at two or more different time points and detecting generation of a prozone phenomenon on the basis of a magnitude relationship between two or more detection results thus obtained.
- An analysis device used in the analysis method according to claim 11 or 12, the analysis device comprising:an analysis section; anda prozone phenomenon detecting section, whereinthe analyzing section detects a target component by detecting a complex of the target component, a labeled substance, and an immobilized substance through detection of a label of the labeled substance in a detection portion of a specimen analysis tool, andthe prozone phenomenon detecting section is the prozone phenomenon detecting device according to claim 13.
Applications Claiming Priority (2)
| Application Number | Priority Date | Filing Date | Title |
|---|---|---|---|
| JP2009185298 | 2009-08-07 | ||
| PCT/JP2010/062066 WO2011016326A1 (en) | 2009-08-07 | 2010-07-16 | Method for detecting prozone phenomenon, analysis method, device for detecting prozone phenomenon and analyzer |
Publications (3)
| Publication Number | Publication Date |
|---|---|
| EP2423686A1 true EP2423686A1 (en) | 2012-02-29 |
| EP2423686A4 EP2423686A4 (en) | 2013-01-02 |
| EP2423686B1 EP2423686B1 (en) | 2015-09-02 |
Family
ID=43544224
Family Applications (1)
| Application Number | Title | Priority Date | Filing Date |
|---|---|---|---|
| EP10806326.4A Active EP2423686B1 (en) | 2009-08-07 | 2010-07-16 | Method for detecting prozone phenomenon and analysis method |
Country Status (6)
| Country | Link |
|---|---|
| US (1) | US8993344B2 (en) |
| EP (1) | EP2423686B1 (en) |
| JP (1) | JP5714912B2 (en) |
| KR (1) | KR101280650B1 (en) |
| CN (1) | CN102341706B (en) |
| WO (1) | WO2011016326A1 (en) |
Families Citing this family (21)
| Publication number | Priority date | Publication date | Assignee | Title |
|---|---|---|---|---|
| US5154951A (en) | 1990-03-26 | 1992-10-13 | Eastman Kodak Company | Method and apparatus for use in bead coating a web with liquid composition |
| CN103376327A (en) * | 2012-04-28 | 2013-10-30 | 通用电气公司 | Method for detecting concentration of antibody or fusion protein |
| EP2880430B1 (en) | 2012-08-02 | 2018-10-10 | The Regents of The University of California | Integrated nanowire array devices for detecting and/or applying electrical signals to tissue |
| EP2939023B1 (en) * | 2012-12-28 | 2019-04-17 | Abbott Point of Care Inc. | System and method for identifying a hook effect and expanding the dynamic range in point of care immunoassays |
| JP6361037B2 (en) * | 2013-01-29 | 2018-07-25 | 国立大学法人三重大学 | Method for measuring plasma protein by immunochromatography |
| EP3004879A4 (en) * | 2013-06-04 | 2017-01-11 | Proteometech Inc. | A strip for rapid testing having a variable control line and a diagnosis kit using the same |
| CN104714008B (en) * | 2015-02-04 | 2016-08-17 | 上海交通大学 | A kind of immuno-chromatographic test paper strip and preparation method thereof and detection method |
| CN109470863B (en) * | 2016-11-22 | 2021-12-17 | 科美博阳诊断技术(上海)有限公司 | Immunoassay method, system and kit for identifying immunoassay |
| CN109470874B (en) * | 2016-11-22 | 2022-01-04 | 科美博阳诊断技术(上海)有限公司 | Immunoassay method, system and kit for identifying immunoassay |
| JP6980800B2 (en) * | 2016-11-22 | 2021-12-15 | ケムクリン・ダイアグノスティックス・カンパニー・リミテッド | Methods, systems, kits and equipment for identifying HD-HOOK effect samples and immunoassays |
| CN108204959B (en) * | 2016-11-22 | 2020-10-30 | 博阳生物科技(上海)有限公司 | Method for identifying HD-HOOK Effect sample and system for identifying HD-HOOK Effect in immunoassay |
| EP3557253A4 (en) * | 2016-12-15 | 2020-06-10 | Horiba, Ltd. | Method for assessing appropriateness of test substance concentration in concentration measurement using immunoagglutination reaction, and sample analysis device having processing unit for same |
| CN107102153A (en) * | 2017-05-18 | 2017-08-29 | 天津市宝坻区人民医院 | LP(a) priority double reagent assay method in serum |
| JP2019113425A (en) * | 2017-12-25 | 2019-07-11 | Blue Industries株式会社 | Inspection cartridge and inspection device for immunochromatography assay |
| CN110514647B (en) * | 2018-05-21 | 2023-01-20 | 科美博阳诊断技术(上海)有限公司 | Chemiluminescence analysis determination method, system and kit using same |
| CN110514651A (en) * | 2018-05-21 | 2019-11-29 | 博阳生物科技(上海)有限公司 | A kind of chemiluminscence immunoassay method and the system using this method, kit |
| JP7257506B2 (en) * | 2018-09-28 | 2023-04-13 | シーメンス・ヘルスケア・ダイアグノスティックス・インコーポレイテッド | Methods of detecting hook effects associated with analytes of interest during or resulting from diagnostic assays |
| CN110567900B (en) * | 2019-09-29 | 2022-07-05 | 迈克医疗电子有限公司 | Method and device for judging antigen excess in sample reaction and optical detection system |
| CN110542660A (en) * | 2019-09-29 | 2019-12-06 | 迈克医疗电子有限公司 | method, device and detection system for detecting prozone effect in sample reaction |
| US20240091771A1 (en) * | 2020-09-23 | 2024-03-21 | National Institute Of Advanced Industrial Science And Technology | Assay device and assay method |
| CN116298324A (en) * | 2023-05-25 | 2023-06-23 | 武汉大学人民医院(湖北省人民医院) | Detection method, device, equipment and readable storage medium of β2-microglobulin |
Family Cites Families (12)
| Publication number | Priority date | Publication date | Assignee | Title |
|---|---|---|---|---|
| JPH06250787A (en) | 1993-02-25 | 1994-09-09 | Toshiba Corp | Display device with coordinate input function |
| JPH08278305A (en) | 1995-04-03 | 1996-10-22 | Nippon Shoji Kk | Immunological measuring instrument |
| JP3644780B2 (en) | 1996-12-25 | 2005-05-11 | 湧永製薬株式会社 | Immunological quantification equipment |
| US6183972B1 (en) * | 1998-07-27 | 2001-02-06 | Bayer Corporation | Method for the determination of analyte concentration in a lateral flow sandwich immunoassay exhibiting high-dose hook effect |
| JP2002122599A (en) * | 2000-10-17 | 2002-04-26 | Nitto Denko Corp | Immunoassay |
| EP1347299B1 (en) | 2000-12-26 | 2006-03-08 | Matsushita Electric Industrial Co., Ltd. | Specific bonding analysis method and specific bonding analysis device using it |
| US7790439B2 (en) | 2001-08-09 | 2010-09-07 | Panasonic Corporation | Biosensor and measurement method |
| CN1576843A (en) * | 2003-07-07 | 2005-02-09 | 松下电器产业株式会社 | Immunoassay method and immunoassay system |
| JP4577052B2 (en) * | 2005-03-11 | 2010-11-10 | パナソニック株式会社 | Chromatography measuring device |
| US7439079B2 (en) * | 2005-04-29 | 2008-10-21 | Kimberly-Clark Worldwide, Inc. | Assay devices having detection capabilities within the hook effect region |
| EP1845373A1 (en) * | 2006-04-13 | 2007-10-17 | Olympus Life and Material Science Europa GmbH | An immunoassay method |
| US20100267049A1 (en) * | 2009-04-15 | 2010-10-21 | Rutter William J | Diagnostic devices and related methods |
-
2010
- 2010-07-16 WO PCT/JP2010/062066 patent/WO2011016326A1/en not_active Ceased
- 2010-07-16 JP JP2010547892A patent/JP5714912B2/en active Active
- 2010-07-16 US US13/258,374 patent/US8993344B2/en active Active
- 2010-07-16 EP EP10806326.4A patent/EP2423686B1/en active Active
- 2010-07-16 CN CN201080009898.9A patent/CN102341706B/en active Active
- 2010-07-16 KR KR1020117011009A patent/KR101280650B1/en active Active
Also Published As
| Publication number | Publication date |
|---|---|
| EP2423686B1 (en) | 2015-09-02 |
| WO2011016326A1 (en) | 2011-02-10 |
| US8993344B2 (en) | 2015-03-31 |
| US20120015450A1 (en) | 2012-01-19 |
| EP2423686A4 (en) | 2013-01-02 |
| CN102341706B (en) | 2014-06-11 |
| KR20110084253A (en) | 2011-07-21 |
| JP5714912B2 (en) | 2015-05-07 |
| CN102341706A (en) | 2012-02-01 |
| JPWO2011016326A1 (en) | 2013-01-10 |
| KR101280650B1 (en) | 2013-07-01 |
Similar Documents
| Publication | Publication Date | Title |
|---|---|---|
| EP2423686B1 (en) | Method for detecting prozone phenomenon and analysis method | |
| EP1416276B1 (en) | Biosensors and measurement method | |
| CN106872420B (en) | Kit and method for time-resolved fluorescence quantitative detection of microalbuminuria | |
| US20200300877A1 (en) | Automated liquid-phase immunoassay apparatus | |
| Lin et al. | Washing-free centrifugal microchip fluorescence immunoassay for rapid and point-of-care detection of protein | |
| Wang et al. | A paper-based device with an adjustable time controller for the rapid determination of tumor biomarkers | |
| US20210190771A1 (en) | Automated liquid immunoassay device and method therefor | |
| CN118112247B (en) | Chemiluminescence micro-fluidic chip and detection method thereof | |
| KR102791448B1 (en) | Quantitative Multi-strip Immunochromatographic Assay Kit By Using Competitive Immunoassay | |
| Shin et al. | Hook effect detection and detection-range-controllable one-step immunosensor for inflammation monitoring | |
| JP7736395B1 (en) | Immunoassay method, immunoassay reagent, immunoassay specimen pretreatment solution, immunoassay reagent kit, and nonspecific reaction inhibitor | |
| CN114814243B (en) | Quantitative detection kit and method applied to protein antigen | |
| CN113113079B (en) | Method for identifying hook effect in quantitative immunochromatography test | |
| US20180203008A1 (en) | Sensor for analyzing analyte and method of analyzing analyte | |
| KR102718533B1 (en) | Quantitative multi-strip chromatographic immunoassay methods and kits, as for an in-vitro diagnostic device, of measuring a concentration of human disease markers | |
| US12411129B2 (en) | Reduction of interferences in immunoassays | |
| US20240393331A1 (en) | Multiplexed electronic immunoassay using enzymaticall amplified metallization on nanostructured surfaces | |
| KR102352618B1 (en) | Test strip for immunoassay diagnosis using electric capacitance sensor | |
| US20160169884A1 (en) | Device and method for biological analyses | |
| Preininger | Critical role of the sample matrix in a point-of-care protein chip for sepsis | |
| KR20250085973A (en) | Method of Performing a Liquid Immunoassay Using an In Vitro Diagnostic Cartridge Equipped With a Magnetic Bead Well, a Reaction Well, a Washing Well, and a Measurement Well | |
| WO2025047641A1 (en) | Immunological measurement method, reagent for immunological measurement, specimen pretreatment liquid for immunological measurement, reagent kit for immunological measurement, and non-specific reaction inhibitor | |
| WO2025196336A1 (en) | Method for detection and quantification of sialylated ige and its use in diagnosis of allergy | |
| JP2000187034A (en) | Immunoassay |
Legal Events
| Date | Code | Title | Description |
|---|---|---|---|
| PUAI | Public reference made under article 153(3) epc to a published international application that has entered the european phase |
Free format text: ORIGINAL CODE: 0009012 |
|
| 17P | Request for examination filed |
Effective date: 20111124 |
|
| AK | Designated contracting states |
Kind code of ref document: A1 Designated state(s): AL AT BE BG CH CY CZ DE DK EE ES FI FR GB GR HR HU IE IS IT LI LT LU LV MC MK MT NL NO PL PT RO SE SI SK SM TR |
|
| DAX | Request for extension of the european patent (deleted) | ||
| REG | Reference to a national code |
Ref country code: DE Ref legal event code: R079 Ref document number: 602010027253 Country of ref document: DE Free format text: PREVIOUS MAIN CLASS: G01N0033543000 Ipc: G01N0033557000 |
|
| A4 | Supplementary search report drawn up and despatched |
Effective date: 20121203 |
|
| RIC1 | Information provided on ipc code assigned before grant |
Ipc: G01N 33/557 20060101AFI20121127BHEP Ipc: G01N 33/558 20060101ALI20121127BHEP |
|
| 17Q | First examination report despatched |
Effective date: 20130729 |
|
| GRAP | Despatch of communication of intention to grant a patent |
Free format text: ORIGINAL CODE: EPIDOSNIGR1 |
|
| INTG | Intention to grant announced |
Effective date: 20150310 |
|
| GRAS | Grant fee paid |
Free format text: ORIGINAL CODE: EPIDOSNIGR3 |
|
| GRAA | (expected) grant |
Free format text: ORIGINAL CODE: 0009210 |
|
| RAP1 | Party data changed (applicant data changed or rights of an application transferred) |
Owner name: ARKRAY, INC. |
|
| AK | Designated contracting states |
Kind code of ref document: B1 Designated state(s): AL AT BE BG CH CY CZ DE DK EE ES FI FR GB GR HR HU IE IS IT LI LT LU LV MC MK MT NL NO PL PT RO SE SI SK SM TR |
|
| REG | Reference to a national code |
Ref country code: GB Ref legal event code: FG4D |
|
| REG | Reference to a national code |
Ref country code: AT Ref legal event code: REF Ref document number: 746951 Country of ref document: AT Kind code of ref document: T Effective date: 20150915 Ref country code: CH Ref legal event code: EP |
|
| REG | Reference to a national code |
Ref country code: IE Ref legal event code: FG4D |
|
| REG | Reference to a national code |
Ref country code: DE Ref legal event code: R096 Ref document number: 602010027253 Country of ref document: DE |
|
| REG | Reference to a national code |
Ref country code: AT Ref legal event code: MK05 Ref document number: 746951 Country of ref document: AT Kind code of ref document: T Effective date: 20150902 |
|
| PG25 | Lapsed in a contracting state [announced via postgrant information from national office to epo] |
Ref country code: NO Free format text: LAPSE BECAUSE OF FAILURE TO SUBMIT A TRANSLATION OF THE DESCRIPTION OR TO PAY THE FEE WITHIN THE PRESCRIBED TIME-LIMIT Effective date: 20151202 Ref country code: GR Free format text: LAPSE BECAUSE OF FAILURE TO SUBMIT A TRANSLATION OF THE DESCRIPTION OR TO PAY THE FEE WITHIN THE PRESCRIBED TIME-LIMIT Effective date: 20151203 Ref country code: FI Free format text: LAPSE BECAUSE OF FAILURE TO SUBMIT A TRANSLATION OF THE DESCRIPTION OR TO PAY THE FEE WITHIN THE PRESCRIBED TIME-LIMIT Effective date: 20150902 Ref country code: LT Free format text: LAPSE BECAUSE OF FAILURE TO SUBMIT A TRANSLATION OF THE DESCRIPTION OR TO PAY THE FEE WITHIN THE PRESCRIBED TIME-LIMIT Effective date: 20150902 Ref country code: LV Free format text: LAPSE BECAUSE OF FAILURE TO SUBMIT A TRANSLATION OF THE DESCRIPTION OR TO PAY THE FEE WITHIN THE PRESCRIBED TIME-LIMIT Effective date: 20150902 |
|
| REG | Reference to a national code |
Ref country code: LT Ref legal event code: MG4D Ref country code: NL Ref legal event code: MP Effective date: 20150902 |
|
| PG25 | Lapsed in a contracting state [announced via postgrant information from national office to epo] |
Ref country code: ES Free format text: LAPSE BECAUSE OF FAILURE TO SUBMIT A TRANSLATION OF THE DESCRIPTION OR TO PAY THE FEE WITHIN THE PRESCRIBED TIME-LIMIT Effective date: 20150902 Ref country code: SE Free format text: LAPSE BECAUSE OF FAILURE TO SUBMIT A TRANSLATION OF THE DESCRIPTION OR TO PAY THE FEE WITHIN THE PRESCRIBED TIME-LIMIT Effective date: 20150902 Ref country code: PL Free format text: LAPSE BECAUSE OF FAILURE TO SUBMIT A TRANSLATION OF THE DESCRIPTION OR TO PAY THE FEE WITHIN THE PRESCRIBED TIME-LIMIT Effective date: 20150902 Ref country code: AT Free format text: LAPSE BECAUSE OF FAILURE TO SUBMIT A TRANSLATION OF THE DESCRIPTION OR TO PAY THE FEE WITHIN THE PRESCRIBED TIME-LIMIT Effective date: 20150902 |
|
| PG25 | Lapsed in a contracting state [announced via postgrant information from national office to epo] |
Ref country code: EE Free format text: LAPSE BECAUSE OF FAILURE TO SUBMIT A TRANSLATION OF THE DESCRIPTION OR TO PAY THE FEE WITHIN THE PRESCRIBED TIME-LIMIT Effective date: 20150902 Ref country code: SK Free format text: LAPSE BECAUSE OF FAILURE TO SUBMIT A TRANSLATION OF THE DESCRIPTION OR TO PAY THE FEE WITHIN THE PRESCRIBED TIME-LIMIT Effective date: 20150902 Ref country code: CZ Free format text: LAPSE BECAUSE OF FAILURE TO SUBMIT A TRANSLATION OF THE DESCRIPTION OR TO PAY THE FEE WITHIN THE PRESCRIBED TIME-LIMIT Effective date: 20150902 Ref country code: IS Free format text: LAPSE BECAUSE OF FAILURE TO SUBMIT A TRANSLATION OF THE DESCRIPTION OR TO PAY THE FEE WITHIN THE PRESCRIBED TIME-LIMIT Effective date: 20160102 Ref country code: NL Free format text: LAPSE BECAUSE OF FAILURE TO SUBMIT A TRANSLATION OF THE DESCRIPTION OR TO PAY THE FEE WITHIN THE PRESCRIBED TIME-LIMIT Effective date: 20150902 |
|
| PG25 | Lapsed in a contracting state [announced via postgrant information from national office to epo] |
Ref country code: PT Free format text: LAPSE BECAUSE OF FAILURE TO SUBMIT A TRANSLATION OF THE DESCRIPTION OR TO PAY THE FEE WITHIN THE PRESCRIBED TIME-LIMIT Effective date: 20160104 Ref country code: RO Free format text: LAPSE BECAUSE OF FAILURE TO SUBMIT A TRANSLATION OF THE DESCRIPTION OR TO PAY THE FEE WITHIN THE PRESCRIBED TIME-LIMIT Effective date: 20150902 |
|
| REG | Reference to a national code |
Ref country code: DE Ref legal event code: R097 Ref document number: 602010027253 Country of ref document: DE |
|
| PLBE | No opposition filed within time limit |
Free format text: ORIGINAL CODE: 0009261 |
|
| STAA | Information on the status of an ep patent application or granted ep patent |
Free format text: STATUS: NO OPPOSITION FILED WITHIN TIME LIMIT |
|
| REG | Reference to a national code |
Ref country code: FR Ref legal event code: PLFP Year of fee payment: 7 |
|
| 26N | No opposition filed |
Effective date: 20160603 |
|
| PG25 | Lapsed in a contracting state [announced via postgrant information from national office to epo] |
Ref country code: DK Free format text: LAPSE BECAUSE OF FAILURE TO SUBMIT A TRANSLATION OF THE DESCRIPTION OR TO PAY THE FEE WITHIN THE PRESCRIBED TIME-LIMIT Effective date: 20150902 Ref country code: SI Free format text: LAPSE BECAUSE OF FAILURE TO SUBMIT A TRANSLATION OF THE DESCRIPTION OR TO PAY THE FEE WITHIN THE PRESCRIBED TIME-LIMIT Effective date: 20150902 |
|
| PG25 | Lapsed in a contracting state [announced via postgrant information from national office to epo] |
Ref country code: BE Free format text: LAPSE BECAUSE OF FAILURE TO SUBMIT A TRANSLATION OF THE DESCRIPTION OR TO PAY THE FEE WITHIN THE PRESCRIBED TIME-LIMIT Effective date: 20150902 |
|
| REG | Reference to a national code |
Ref country code: CH Ref legal event code: PL |
|
| PG25 | Lapsed in a contracting state [announced via postgrant information from national office to epo] |
Ref country code: MC Free format text: LAPSE BECAUSE OF FAILURE TO SUBMIT A TRANSLATION OF THE DESCRIPTION OR TO PAY THE FEE WITHIN THE PRESCRIBED TIME-LIMIT Effective date: 20150902 |
|
| PG25 | Lapsed in a contracting state [announced via postgrant information from national office to epo] |
Ref country code: LI Free format text: LAPSE BECAUSE OF NON-PAYMENT OF DUE FEES Effective date: 20160731 Ref country code: CH Free format text: LAPSE BECAUSE OF NON-PAYMENT OF DUE FEES Effective date: 20160731 |
|
| REG | Reference to a national code |
Ref country code: IE Ref legal event code: MM4A |
|
| REG | Reference to a national code |
Ref country code: FR Ref legal event code: PLFP Year of fee payment: 8 |
|
| PG25 | Lapsed in a contracting state [announced via postgrant information from national office to epo] |
Ref country code: IE Free format text: LAPSE BECAUSE OF NON-PAYMENT OF DUE FEES Effective date: 20160716 |
|
| PG25 | Lapsed in a contracting state [announced via postgrant information from national office to epo] |
Ref country code: LU Free format text: LAPSE BECAUSE OF NON-PAYMENT OF DUE FEES Effective date: 20160716 |
|
| PG25 | Lapsed in a contracting state [announced via postgrant information from national office to epo] |
Ref country code: CY Free format text: LAPSE BECAUSE OF FAILURE TO SUBMIT A TRANSLATION OF THE DESCRIPTION OR TO PAY THE FEE WITHIN THE PRESCRIBED TIME-LIMIT Effective date: 20150902 Ref country code: HU Free format text: LAPSE BECAUSE OF FAILURE TO SUBMIT A TRANSLATION OF THE DESCRIPTION OR TO PAY THE FEE WITHIN THE PRESCRIBED TIME-LIMIT; INVALID AB INITIO Effective date: 20100716 Ref country code: SM Free format text: LAPSE BECAUSE OF FAILURE TO SUBMIT A TRANSLATION OF THE DESCRIPTION OR TO PAY THE FEE WITHIN THE PRESCRIBED TIME-LIMIT Effective date: 20150902 |
|
| PG25 | Lapsed in a contracting state [announced via postgrant information from national office to epo] |
Ref country code: MT Free format text: LAPSE BECAUSE OF NON-PAYMENT OF DUE FEES Effective date: 20160731 Ref country code: MK Free format text: LAPSE BECAUSE OF FAILURE TO SUBMIT A TRANSLATION OF THE DESCRIPTION OR TO PAY THE FEE WITHIN THE PRESCRIBED TIME-LIMIT Effective date: 20150902 Ref country code: TR Free format text: LAPSE BECAUSE OF FAILURE TO SUBMIT A TRANSLATION OF THE DESCRIPTION OR TO PAY THE FEE WITHIN THE PRESCRIBED TIME-LIMIT Effective date: 20150902 Ref country code: HR Free format text: LAPSE BECAUSE OF FAILURE TO SUBMIT A TRANSLATION OF THE DESCRIPTION OR TO PAY THE FEE WITHIN THE PRESCRIBED TIME-LIMIT Effective date: 20150902 |
|
| REG | Reference to a national code |
Ref country code: FR Ref legal event code: PLFP Year of fee payment: 9 |
|
| PG25 | Lapsed in a contracting state [announced via postgrant information from national office to epo] |
Ref country code: BG Free format text: LAPSE BECAUSE OF FAILURE TO SUBMIT A TRANSLATION OF THE DESCRIPTION OR TO PAY THE FEE WITHIN THE PRESCRIBED TIME-LIMIT Effective date: 20150902 |
|
| PG25 | Lapsed in a contracting state [announced via postgrant information from national office to epo] |
Ref country code: AL Free format text: LAPSE BECAUSE OF FAILURE TO SUBMIT A TRANSLATION OF THE DESCRIPTION OR TO PAY THE FEE WITHIN THE PRESCRIBED TIME-LIMIT Effective date: 20150902 |
|
| REG | Reference to a national code |
Ref country code: DE Ref legal event code: R082 Ref document number: 602010027253 Country of ref document: DE |
|
| PGFP | Annual fee paid to national office [announced via postgrant information from national office to epo] |
Ref country code: DE Payment date: 20250722 Year of fee payment: 16 |
|
| PGFP | Annual fee paid to national office [announced via postgrant information from national office to epo] |
Ref country code: IT Payment date: 20250724 Year of fee payment: 16 |
|
| PGFP | Annual fee paid to national office [announced via postgrant information from national office to epo] |
Ref country code: GB Payment date: 20250722 Year of fee payment: 16 |
|
| PGFP | Annual fee paid to national office [announced via postgrant information from national office to epo] |
Ref country code: FR Payment date: 20250725 Year of fee payment: 16 |