EP2406658B1 - Method of detecting and compensating for precipitation in sodar systems - Google Patents
Method of detecting and compensating for precipitation in sodar systems Download PDFInfo
- Publication number
- EP2406658B1 EP2406658B1 EP10751223.8A EP10751223A EP2406658B1 EP 2406658 B1 EP2406658 B1 EP 2406658B1 EP 10751223 A EP10751223 A EP 10751223A EP 2406658 B1 EP2406658 B1 EP 2406658B1
- Authority
- EP
- European Patent Office
- Prior art keywords
- spectrum
- peaks
- precipitation
- wind
- rain
- Prior art date
- Legal status (The legal status is an assumption and is not a legal conclusion. Google has not performed a legal analysis and makes no representation as to the accuracy of the status listed.)
- Not-in-force
Links
- 238000000034 method Methods 0.000 title claims description 66
- 238000001556 precipitation Methods 0.000 title claims description 57
- SDIXRDNYIMOKSG-UHFFFAOYSA-L disodium methyl arsenate Chemical compound [Na+].[Na+].C[As]([O-])([O-])=O SDIXRDNYIMOKSG-UHFFFAOYSA-L 0.000 title claims description 52
- 238000001228 spectrum Methods 0.000 claims description 68
- 238000002592 echocardiography Methods 0.000 claims description 17
- 238000012935 Averaging Methods 0.000 claims description 9
- 230000007423 decrease Effects 0.000 claims description 4
- 230000015556 catabolic process Effects 0.000 claims description 2
- 230000008859 change Effects 0.000 claims description 2
- 238000006731 degradation reaction Methods 0.000 claims description 2
- 230000000593 degrading effect Effects 0.000 claims description 2
- 230000003595 spectral effect Effects 0.000 description 30
- 238000012545 processing Methods 0.000 description 14
- 238000005259 measurement Methods 0.000 description 9
- 238000004458 analytical method Methods 0.000 description 8
- 230000004044 response Effects 0.000 description 8
- 238000000354 decomposition reaction Methods 0.000 description 6
- 238000001514 detection method Methods 0.000 description 6
- 238000006243 chemical reaction Methods 0.000 description 5
- 230000006870 function Effects 0.000 description 4
- 238000010420 art technique Methods 0.000 description 3
- 230000008901 benefit Effects 0.000 description 3
- 230000035945 sensitivity Effects 0.000 description 3
- 238000000926 separation method Methods 0.000 description 3
- 230000005540 biological transmission Effects 0.000 description 2
- 238000010586 diagram Methods 0.000 description 2
- 230000000694 effects Effects 0.000 description 2
- 230000014509 gene expression Effects 0.000 description 2
- 238000012986 modification Methods 0.000 description 2
- 230000004048 modification Effects 0.000 description 2
- 238000010606 normalization Methods 0.000 description 2
- 230000008569 process Effects 0.000 description 2
- 230000005236 sound signal Effects 0.000 description 2
- 238000007619 statistical method Methods 0.000 description 2
- 230000002411 adverse Effects 0.000 description 1
- 238000013459 approach Methods 0.000 description 1
- 230000001174 ascending effect Effects 0.000 description 1
- 230000003190 augmentative effect Effects 0.000 description 1
- 238000010276 construction Methods 0.000 description 1
- 239000006185 dispersion Substances 0.000 description 1
- 238000009434 installation Methods 0.000 description 1
- 238000002955 isolation Methods 0.000 description 1
- 238000012417 linear regression Methods 0.000 description 1
- 239000000463 material Substances 0.000 description 1
- 238000007620 mathematical function Methods 0.000 description 1
- 238000000691 measurement method Methods 0.000 description 1
- 238000002156 mixing Methods 0.000 description 1
- 238000003672 processing method Methods 0.000 description 1
- 238000004451 qualitative analysis Methods 0.000 description 1
- 238000004445 quantitative analysis Methods 0.000 description 1
- 238000009877 rendering Methods 0.000 description 1
- 238000011160 research Methods 0.000 description 1
- 238000012552 review Methods 0.000 description 1
- 239000007787 solid Substances 0.000 description 1
- 238000013517 stratification Methods 0.000 description 1
Images






Classifications
-
- G—PHYSICS
- G01—MEASURING; TESTING
- G01S—RADIO DIRECTION-FINDING; RADIO NAVIGATION; DETERMINING DISTANCE OR VELOCITY BY USE OF RADIO WAVES; LOCATING OR PRESENCE-DETECTING BY USE OF THE REFLECTION OR RERADIATION OF RADIO WAVES; ANALOGOUS ARRANGEMENTS USING OTHER WAVES
- G01S15/00—Systems using the reflection or reradiation of acoustic waves, e.g. sonar systems
- G01S15/88—Sonar systems specially adapted for specific applications
- G01S15/885—Meteorological systems
-
- G—PHYSICS
- G01—MEASURING; TESTING
- G01S—RADIO DIRECTION-FINDING; RADIO NAVIGATION; DETERMINING DISTANCE OR VELOCITY BY USE OF RADIO WAVES; LOCATING OR PRESENCE-DETECTING BY USE OF THE REFLECTION OR RERADIATION OF RADIO WAVES; ANALOGOUS ARRANGEMENTS USING OTHER WAVES
- G01S7/00—Details of systems according to groups G01S13/00, G01S15/00, G01S17/00
- G01S7/52—Details of systems according to groups G01S13/00, G01S15/00, G01S17/00 of systems according to group G01S15/00
- G01S7/539—Details of systems according to groups G01S13/00, G01S15/00, G01S17/00 of systems according to group G01S15/00 using analysis of echo signal for target characterisation; Target signature; Target cross-section
-
- G—PHYSICS
- G01—MEASURING; TESTING
- G01W—METEOROLOGY
- G01W1/00—Meteorology
- G01W1/14—Rainfall or precipitation gauges
Definitions
- the present invention relates to a system for remotely detecting atmospheric phenomena such as wind speed using directed sound waves.
- Sodar systems employ directed sound waves to detect atmospheric phenomena such as wind speed. By directing sound beams into the atmosphere in a number of directions, and measuring the Doppler shift and intensity of echoes returned from turbulence and discontinuities in the atmosphere, wind speed and other atmospheric phenomena can be accurately estimated.
- the predominant type of sodar in current use is the monostatic phased array sodar.
- Monostatic sodar systems emanate sound beams and listen for their reflections from a single location.
- Phased array monostatic sodars direct the beams in different directions, and are sensitive to echoes returned from these directions, by use of an array of sound transducers which transmit and receive in groups of differing phase so as to direct the transmitted sound beams and regions of sensitivity as desired.
- sodar systems have been used for research into a variety of atmospheric conditions aloft, including wind speed, turbulence, and thermal stratification and stability. Historically, considerable manual analysis and interpretation of sodar data was necessary to extract useful insight into atmospheric conditions.
- sodar systems Present day use of sodar systems is principally focused on the measurement of wind speed aloft, often for the purpose of assessing wind resources at candidate sites for the installation of wind turbines, but also for a variety of other purposes, for example, providing input data to weather prediction models and pollution dispersion studies.
- the Doppler shift of the returned echo is of principal interest.
- sodar systems rely heavily on automated detection of this Doppler shift and conversion of the Doppler shift information into radial, vertical and horizontal wind velocities.
- Prior art relies on relatively simple statistical methods for automatically determining a single Doppler shift in each of the several beam directions. At best, prior art methods identify periods of strong downward velocity indication as likely related to precipitation.
- standard practice when collecting sodar data is to omit data during times of precipitation. This approach is not ideal since a potentially large percentage of the data acquired could be lost.
- the simple statistical methods used in prior art fail to take full advantage of the spectral information available in the returned signals.
- the returned sound signals from the atmosphere are not simple signals with a single, clear, sharp response in the frequency domain.
- the response spectrum may contain multiple peaks: a peak associated with air velocity; a peak associated with fixed echoes; and a peak reflected off of rain and other precipitation. Distinguishing, separating and individually measuring these multiple peaks provides means of providing the sodar user with useful additional information as compared to prior art techniques.
- the invention comprises a method for automatically detecting the spectral peaks in a returned signal from the atmosphere in a phased array monostatic sodar device.
- a sodar system with which the invention may be used is disclosed in U.S. patent application US 2010/0195443 , filed Nov. 5, 2007 , entitled "Transducer Array Arrangement and Operation for Sodar Applications”.
- the inventive method accounts for the possibility that there may be two or more Doppler-shifted spectral peaks in the returned signal.
- One peak is expected reflected off of turbulence in the air itself, and associated with the velocity of the air itself.
- Another peak may be detected reflected off of any precipitation in the air mass, and associated with the velocity of this precipitation.
- the inventive method automatically detects when multiple peaks exist in a returned spectrum.
- the method separates the spectrum into a precipitation-related region of response frequencies and a wind velocity-related region of response frequencies. Individual estimations are made of the peak frequencies within each of these spectral regions. Characteristics of these peaks are used to estimate the presence and severity of precipitation, which can be used to more accurately estimate the wind velocity than would otherwise be possible in the presence of precipitation, and to estimate the degree to which precipitation has unavoidably degraded the accuracy of the wind estimate.
- This invention features a method of detecting precipitation with a sodar apparatus that transmits sound beams into the atmosphere, detects echoes returned from the atmosphere, from the echoes determines a Doppler-shifted spectrum comprising the relative strength of the echoes at various Doppler-shifted frequencies, and estimates wind speed and direction.
- the inventive method comprises automatically estimating the presence of precipitation based on the Doppler-shifted spectrum. Automatically estimating the presence of precipitation may comprise automatically distinguishing a frequency or frequency range in the Doppler-shifted spectrum that is associated with wind velocity from a frequency or frequency range in the Doppler-shifted spectrum that is associated with precipitation.
- the invention may further comprise using the estimated presence of precipitation to automatically improve the accuracy of the wind speed estimate made in the presence of the rain.
- This method may further comprise automatically estimating the severity of rain based on the Doppler-shifted spectrum. The rain severity estimates may be used to more accurately determine when the presence of rain has degraded the reliability of a wind estimate.
- Automatically distinguishing a frequency or frequency range in the Doppler-shifted spectrum that is associated with wind velocity from a frequency or frequency range in the Doppler-shifted spectrum that is associated with precipitation may be accomplished by automatically identifying two distinct peaks in the Doppler shifted spectrum, one such peak being associated with rain velocity and the other being associated with wind velocity.
- This method may further comprise automatically determining the predominant frequency of each peak individually, and may further comprise automatically determining when the peaks are not sufficiently distinct to accurately estimate wind speed as a determination of reliability.
- the spectra of a number of samples in an averaging period may be used to make the wind speed estimate and the determination of reliability.
- Identifying two distinct peaks may be accomplished by applying a curve fit to the averaged spectra.
- the curve fit may be a higher order polynomial curve fit of the logarithm of the spectrum; the higher order polynomial may be an octic, or eighth-order polynomial.
- Quadratic curves may be fit to the peaks of the higher order polynomial, and the quadratic curves may subsequently be used to generate two Gaussian curves, one representing the region of the spectrum associated with precipitation and the other representing the region of the spectrum associated with wind velocity.
- Automatically identifying two distinct peaks in the Doppler shifted spectrum may include finding an inflection point on the spectrum, and treating that as the second peak.
- Treating the inflection point as a second peak may comprise altering the spectrum by adding to the polynomial a term that increases or decreases with frequency, so as to change a local inflection point into a local maximum such that the resulting polynomial has two maxima
- Automatically identifying two distinct peaks in the Doppler-shifted spectrum may comprise automatically eliminating one or more excess peaks if there are more than two peaks. Automatically eliminating one or more excess peaks if there are more than two peaks may comprise discarding the lowest frequency peak if it has the lowest amplitude of the peaks, and/or discarding all peaks except the two with the greatest amplitudes.
- Properties of the two peaks may be used to estimate the severity of rain, to more accurately estimate the wind speed in the presence of precipitation by limiting the section of the spectrum analyzed to estimate wind speed to that part of the spectrum likely due to wind alone and not due to precipitation, and to estimate the degree to which precipitation is degrading the accuracy of the estimate of wind speed.
- a fuzzy logic technique may be used to make the estimates of the presence of precipitation, to limit the section of the spectrum analyzed and to estimate the degradation in wind speed accuracy.
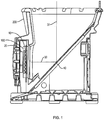
- the inventive method can be used with a sodar apparatus as shown in figure 1 .
- the phased array monostatic sodar apparatus shown in figure 1 consists of an array 100 of individual acoustic transducers 10.
- the transducers 10 are connected to an electronics and data processing system 20 which causes them to emit phased array beams of sound 30 in the generally horizontal direction as shown. These beams impinge upon a solid smooth surface, the 'sound mirror' or 'mirror' 40 which causes the sound beams to be reflected generally upwards as reflected beams 31.
- the reflected sound beams 31 impinge upon turbulence and density variations in the atmosphere above. Some of the sound energy from these beams is reflected back along the same paths as outbound beams 31 and 30, returning to the transducers 10 in phased array 100 where they are detected by receiving components of the electronics package 20. These components are mounted in housing 200 which supports the various components, and which may also serve to block stray sound transmission and reception from undesired directions.
- the transducers 10 in array 100 are driven in transmit mode, and returning sound is detected and evaluated in receive mode, by electronics equipment 20.
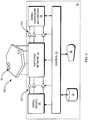
- Figure 2 shows one non-limiting example of electronic equipment 20 in greater detail in block diagram form. Operation of the system consists of a series of "shots.” Each shot consists of an initial period where the electronics are configured to transmit a sound signal into the air, and a second immediately following period during which the electronics are configured to receive, analyze, and record incoming signals, in particular the echoes of the transmitted signal reflected back from the environment.
- the inventive method comprises processing and analysis of the incoming signals during this second period of the shot.
- control component 21 will configure the switching network 24 so as to connect transducers 10 of array 100 to signal source 22 through transmit amplifiers 23.
- Signal source 22 will provide signals appropriately phased for each of the transducers 10 so as to cause array 100 to transmit a focused beam of sound 31 in a particular generally upward direction; this aspect is set forth in more detail in the application US 2010/0195443 .
- control component 21 will configure switching network 24 so as to connect the transducers 10 of array 100 to signal conversion and analysis component 26 through receive amplifiers 25. This receive mode configuration is set, using phased array techniques, to maximize sensitivity in the same direction as that in which beam 31 was transmitted.
- Conversion and analysis component 26 analyzes the spectral properties of the returned echoes in order to estimate atmospheric properties at various altitudes above the apparatus as will be further described below. This analysis process is involved in the invention. After the received data is analyzed, it may be stored using some storage element 27, transmitted, reported or displayed for the user using reporting means 28 or, most usefully, both.
- the sodar apparatus is only sensitive to air velocity in the radial direction of beam 31. There is no direct means of estimating horizontal wind velocity or direction from a single shot in a single direction. Accordingly controlling component 21 is configured so as to sequentially adjust the transmitted direction of beam 31 and the direction of maximized sensitivity to returned echoes. At least three beam directions are necessary to resolve horizontal wind speed, horizontal wind direction, and vertical wind speed. In the apparatus described in the application US 2010/0195443 to which the inventive technique has been applied, the apparatus transmits three beams inclined at approximately 11 degrees from vertical in three directions separated by 120 degrees of azimuth.
- the technique could be applied to other sodar apparatus that transmit beams in multiple directions, for example where a single beam is transmitted more exactly vertically, and the second and third beam directions are inclined (e.g., approximately 15 degrees) from the vertical and separated from each other by approximately 90 degrees in azimuth.
- vector analysis techniques can be applied to extract the horizontal speed and direction which is of greatest interest.
- the invention can also be applied to bistatic sodar systems, in which separate transmitters and receivers are used.
- sodar systems generally do not report near-instantaneous conditions based on a single group of three shots, which could be completed in roughly 6 seconds. Instead sodar systems typically estimate atmospheric conditions based on an average of a number of shots in each of the three directions. For example, data might be averaged over a 10 minute interval, consisting of approximately 100 shots in each of the three directions.
- FIG. 3 shows the typical prior-art overall processing technique 300 for a sodar system not using the inventive methodology in greater detail in flow chart form.
- Sodar data is processed in blocks of (for example) ten minutes. During this period shots are repeated in each of three beam directions.
- a directional acoustic pulse, or beam 31 is transmitted, step 302, and subsequently the apparatus is configured to record the echoes, or acoustic reflections, from the environtnent, step 304.
- Time of travel of the beam 31 to a particular altitude, and in turn the time of travel for any echo from that altitude to be returned to the apparatus, depends on the altitude and the speed of sound. Accordingly the returned signal can be broken up, or windowed, into segments associated with atmospheric conditions at different altitudes above the apparatus, steps 306-310, this being a useful characteristic of sodar apparatus known to those skilled in the art.
- a Fast Fourier Transform is applied to this windowed data, step 310, to convert the time-series signal into the frequency domain so that Doppler shifts of the returned signals can be measured.
- a Fast Fourier Transform is applied to this windowed data, step 310, to convert the time-series signal into the frequency domain so that Doppler shifts of the returned signals can be measured.
- the character of the resulting spectrum for an individual shot at a particular elevation can be summarized as a Doppler frequency shift, step 314, a signal level, and a signal-to-noise ratio (SNR), step 316, the methods for making this summary data being apparent to those skilled in the art.
- Techniques known to those skilled in the art can be used to eliminate the effect of zero-Doppler shift echoes returning from fixed objects, step 312.
- average spectra can be computed for each beam direction at each elevation, step 318.
- the individual frequency shifts for the individual shots used in a particular average may be weighted in the average based on signal strength, noise strength, and SNR using techniques apparent to those skilled in the art.
- the average frequency shifts can be used to compute horizontal wind speed, direction, and vertical wind speed using methods apparent to those skilled in the art, step 320.
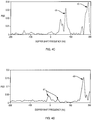
- Figure 4A shows a spectrum from an individual shot under conditions without precipitation.
- a clear spectral peak 40 Doppler shifted due to wind velocity is visible.
- the vertical velocity of the rain drops begins to affect the spectra.
- Figure 4B light rain
- a fairly clear wind related peak 41 is still visible.
- Light precipitation introduces additional small peaks 42 likely related to rain drop velocity.
- Peak 43 may be related to wind or may be precipitation, and affects confidence in, and perhaps accuracy of, any wind velocity estimate.
- Figure 4C moderate rain
- the group of peaks 44 are wind related, while the group of peaks 45 are rain-related.
- peak 44 clearly visible, the wind data is not lost from the spectrum, but standard signal processing techniques will likely choose peak 45 as the shifted spectrum for wind estimate, introducing significant error in the wind velocity estimate.
- peak 46 associated with rain dominates heavily, and it may not be possible to accurately estimate a wind speed from the group of peaks 47.
- sodars will report erroneous strong downward vertical velocities in the presence of rain. Operators skilled in the art of interpreting sodar data use such strong vertical downward velocities as indication that rain is present and that the horizontal velocity and direction reported by the sodar is likely inaccurate and should be discarded.
- Figure 5 illustrates and describes the basic steps involved in the preferred embodiment of the inventive method 400 of detecting and isolating the Doppler shifts related to rain.
- the inventive method discounts or discards (filters) spectrum samples which have Signal to Noise Ratios (SNR, calculated as the ratio of energy in spectral peaks to broadband energy) below some limit, step 406.
- SNR Signal to Noise Ratios
- the presumptively reliable of the remaining spectra are averaged into a preliminary average, step 408.
- a spectrum is regarded as unreliable if its peaks are at significantly different amplitude from the predominant peak amplitude of the data set as indicated by the preliminary average. If such an unreliable peak is significantly larger than the average, it might adversely affect the accuracy of rain detection. Accordingly, spectra with peaks significantly larger than the peak of the preliminary average are discarded. As a non-limiting example the method might discard raw spectra which have peak amplitudes greater than five times the amplitude of the rough average peak. After discarding these unreliable sample spectra, a final average is calculated using the remaining spectra. Curves 50, 51 and 52, shown as dotted lines in figures 8A , 8B and 8C respectively, are examples of these final average spectra.
- the one or two peaks can be identified as the point(s) where the octic curve's derivative with respect to frequency is zero and the second derivative is less than zero.
- the higher frequency peak is always associated with rain, since the rain drops are falling through the air mass and as a result have a greater up-frequency Doppler shift than the peaks associated with the velocity of the air itself.
- Vertical dash-dot lines 56, 57, and 58 in figures 8A , 8B and 8C respectively are associated with the wind speed peak
- vertical dash-dot lines 59, 60 and 61 in figures 8A , 8B and 8C respectively are associated with the rain peaks.
- the inventive method preferably includes an automatic means for selecting which two peaks to use if more than two peaks are present based on knowledge of the spectral properties of returned sodar signals.
- the following rules may be used: (a) if there are three peaks and the lowest frequency peak is also the lowest amplitude, then that peak is discarded; (b) if there are three peaks and the lowest frequency peak is not the largest and is significantly lower in frequency than the next higher frequency peak, then that peak is discarded; (c) if there are three or more peaks, and neither steps (a) or (b) eliminated a peak, then all but the largest two peaks are discarded.
- the spectrum can be "tilted" by adding to the octic polynomial a term that increases or decreases with frequency; in one non-limiting embodiment the increase or decrease can be linear. This term has the effect of changing a local inflection point into a local maximum, such that the resulting polynomial has two maxima for subsequent processing.
- the Gaussian curve is the exponential of a quadratic curve. It is possible to fit a quadratic curve to each of the two chosen peaks of the octic curve by calculating a quadratic whose value, first derivative, and second derivative matches those of the octic at the point of the peak.
- the Gaussian curves based on the lower frequency quadratic expressions corresponding to wind are shown as solid lines 62, 63 and 64 in Figures 8A-8C , respectively.
- the curves based on the higher frequency quadratic expressions corresponding to rain are shown as solid lines 65, 66 and 67 in Figures 8A-8C , respectively.
- Gaussian curves can be interpreted as Probability Density Functions (PDFs), step 412.
- PDFs Probability Density Functions
- the lower frequency PDF corresponds to wind, and the amplitude of that curve at any particular frequency corresponds to the probability that spectral energy at that frequency is associated with wind.
- the higher frequency PDF corresponds to rain, and the amplitude of that curve at any particular frequency corresponds to the probability that spectral energy at that frequency is associated with rain.
- the separation between the peaks of the two Gaussian curves, the ratio of the heights of these two curves, the width of each curve to the half-amplitude level, and the amplitude of the point at which these two curves intercept each other may be chosen as relevant and automatically calculable measures of the shape of Gaussian curves.
- a set of fuzzy logic rules may be applied to the measures of the Gaussian curves so as to compute wind and rain beam-radial velocity statistics, step 414.
- a spectral cutoff, or in other words modified spectral limits, for wind measurement, step 424; a confidence factor for the wind radial velocity; a measure of precipitation droplet speed, intensity and type; and a confidence factor for these measures of precipitation state may be computed.
- Fuzzy logic rules are an effective way to determine spectral cutoffs, but the inventive method can be accomplished without the use of fuzzy logic.
- fuzzy logic rules may be used to check that these results are reasonable, in other words to check that they pass a sanity check, step 416. Further, the information from the three radial directions can be combined to check that the calculated statistics for the three beams are consistent with one another, step 418. Temperature can be taken into account, as would be apparent to one skilled in the art, step 417.
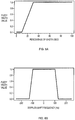
- a non-limiting example of appropriate fuzzy rules and their application is as follows. See figures 6A-6L .
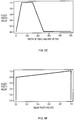
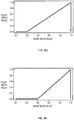
- the five rules shown in figures 6A-6E (rule for number of good shots, rule for frequency of main wind peak, rule for frequency of rain peak, rule for separation between peaks, and rule for width of peaks, respectively) are used on a per-beam, per-height basis, for example, for each of the A, B, C beams and at each of the 40m, 50m, and 60m heights.
- the fifth rule ( figure 6E ) is applied twice, once for the wind peak width, and once for the rain peak width. This rule is only applied if the peak being tested is at least 1/4 as big as the other peak, so if a peak is relatively small, the width rule is not used on it.
- the overall fuzzy truth value is found by taking the minimum of the truth values found from each of the rules. This is the fuzzy AND operation. Rule 1 must be true, AND rule 2 must be true, AND rule 3 must be true, etc.. Compute the truth value from each rule, take the minimum, and use that as a rating for the confidence in the present rain/wind decomposition.
- the RainWindRatio (at one height) is the weighted average of the RainWindRatios computed for the A, B, and C beams, where the A, B, C 'believability' rating is used as a weighting.
- the RainWindRatio is expressed in dB; for each beam it is: 10 * log (RainPeakHeight / WindPeakHeight).
- the combined weighted average is an average of dB's.
- RainConf (at one height) is the minimum of the two fuzzy rule values shown in figures 6I and 6J (rule #1 for rain confidence (combined truth value) and rule #2 for rain confidence (rain wind ratio), respectively), one of which ( figure 6I ) is evaluated on the combined rating of the A, B, C beams, and one ( figure 6J ) is evaluated on the combined RainWindRatio of the three beams.
- WindConf (at one height) is the minimum of the two fuzzy rule values shown in figures 6K and 6L (rule #1 for wind confidence (combined truth value) and rule #2 for wind confidence (rain wind ratio), respectively).
- This analysis provides the following set of numbers for each height, 40m, 50m, and 60m.
- the final step of combining the data from the three heights into a single set of numbers uses a weighted average.
- the rating (combined believability indicator) of each height is used as a weighting in each weighted average.
- the result is weighted averages for:
- FIG. 7 A preferred embodiment of the inventive method 500 for using a sodar apparatus to estimate wind speed in the presence of rain using the above information is shown in Figure 7 .
- the signal processing discussed above and shown in Figure 5 is the first step in Figure 7 , step 501.
- the only other difference between the inventive method 500 and the typical prior art method shown in Figure 3 is that the inventive method in step 514 applies modified spectral limits as calculated in step 501 to the shifted frequency peak detection.
- the results of the rain detection algorithm are applied only to the data taken in the time block or averaging period during which these results were calculated. This is preferable since there may be significant variations in precipitation from one averaging period to the next. In practice, it may be difficult to accomplish this, as the results of the rain detection algorithm will only be available when the full (for example 5 or 10 minute) averaging period has elapsed. Due to the size of the raw spectral data sets, and due to practical limits of hardware memory typically provided within the sodar apparatus' signal processing equipment, it may be impractical to preserve the raw data until the modified spectral bandwidth to be used with the data is available.
- the rain statistics and modified spectral bandwidth are calculated during one averaging period, and these values are used during the subsequent averaging period.
- the method works on a continuing basis where winds are estimated during each averaging period based on rain statistics and a modified spectral bandwidth from the immediately prior averaging period.
- the memory is available then it is better to practice the preferred embodiment.
- Figures 9A and 9B and 10A and 10B illustrate data determined using the preferred embodiment of the inventive method. These data illustrate that the invention is able to more accurately estimate wind speed in the presence of rain and to more reliably detect when accurate estimation of wind is not possible due to rain as compared to the prior art methods, for example the method illustrated in figure 3 .
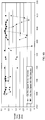
- Figure 9A is a time series of averages of horizontal wind speed measured at a 40 meter elevation above the apparatus over the course of about six hours.
- data processed in the conventional manner is shown as triangles connected by dashed lines, while data processed using the preferred embodiment of the invention is shown as squares connected by solid lines. It is apparent from figure 9A that the inventive method reports more data, and that data is more consistent than using the prior art technique.
- Figure 9B shows the vertical wind speed using the same symbols for the prior art and inventive methods, using the same data as with figure 9A .
- this chart the extreme and incorrect values of vertical wind velocity measured by the apparatus in the presence of rain are clearly visible, while the data as corrected by the inventive method shows reasonable values for vertical wind velocity.
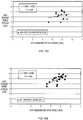
- Figures 10A and 10B are scatter plots and least squares linear fits for the data reported in figure 9A compared to data collected from a cup type anemometer mounted at a 40 meter elevation on a nearby tower.
- Figure 10A shows the data processed in the conventional (prior art) manner as illustrated in figure 3 .
- Figure 10B shows the same data compared to the same anemometer data, but in this case the data is processed using the preferred embodiment of the invention: the slope is 0.899, and the correlation coefficient is 0.688, both values being much closer to what would be expected if the two measures of wind speed agreed perfectly.
Landscapes
- Engineering & Computer Science (AREA)
- Remote Sensing (AREA)
- Radar, Positioning & Navigation (AREA)
- Physics & Mathematics (AREA)
- Computer Networks & Wireless Communication (AREA)
- Environmental & Geological Engineering (AREA)
- General Physics & Mathematics (AREA)
- Life Sciences & Earth Sciences (AREA)
- Hydrology & Water Resources (AREA)
- Acoustics & Sound (AREA)
- Atmospheric Sciences (AREA)
- Biodiversity & Conservation Biology (AREA)
- Environmental Sciences (AREA)
- Ecology (AREA)
- Measurement Of Velocity Or Position Using Acoustic Or Ultrasonic Waves (AREA)
- Radar Systems Or Details Thereof (AREA)
- Optical Radar Systems And Details Thereof (AREA)
- Investigating Or Analyzing Materials By The Use Of Ultrasonic Waves (AREA)
Description
- The present invention relates to a system for remotely detecting atmospheric phenomena such as wind speed using directed sound waves.
- Sodar systems employ directed sound waves to detect atmospheric phenomena such as wind speed. By directing sound beams into the atmosphere in a number of directions, and measuring the Doppler shift and intensity of echoes returned from turbulence and discontinuities in the atmosphere, wind speed and other atmospheric phenomena can be accurately estimated. The predominant type of sodar in current use is the monostatic phased array sodar. Monostatic sodar systems emanate sound beams and listen for their reflections from a single location. Phased array monostatic sodars direct the beams in different directions, and are sensitive to echoes returned from these directions, by use of an array of sound transducers which transmit and receive in groups of differing phase so as to direct the transmitted sound beams and regions of sensitivity as desired.
- Historically, sodar systems have been used for research into a variety of atmospheric conditions aloft, including wind speed, turbulence, and thermal stratification and stability. Historically, considerable manual analysis and interpretation of sodar data was necessary to extract useful insight into atmospheric conditions.
- Present day use of sodar systems is principally focused on the measurement of wind speed aloft, often for the purpose of assessing wind resources at candidate sites for the installation of wind turbines, but also for a variety of other purposes, for example, providing input data to weather prediction models and pollution dispersion studies. In this context the Doppler shift of the returned echo is of principal interest. Present day sodar systems rely heavily on automated detection of this Doppler shift and conversion of the Doppler shift information into radial, vertical and horizontal wind velocities. Prior art relies on relatively simple statistical methods for automatically determining a single Doppler shift in each of the several beam directions. At best, prior art methods identify periods of strong downward velocity indication as likely related to precipitation. In prior art, standard practice when collecting sodar data is to omit data during times of precipitation. This approach is not ideal since a potentially large percentage of the data acquired could be lost.
- The simple statistical methods used in prior art fail to take full advantage of the spectral information available in the returned signals. The returned sound signals from the atmosphere are not simple signals with a single, clear, sharp response in the frequency domain. The response spectrum may contain multiple peaks: a peak associated with air velocity; a peak associated with fixed echoes; and a peak reflected off of rain and other precipitation. Distinguishing, separating and individually measuring these multiple peaks provides means of providing the sodar user with useful additional information as compared to prior art techniques.
- Antoniou et al.: "On the Theory of SODAR Measurement Techniques (final reporting on WP1, EU WISE project NNES-2001-297)", April 2003 (2003-04), disclose, for example, a method of detecting precipitation with a sodar apparatus that transmits sound beams into the atmosphere, detects echoes returned from the atmosphere, determines from the echoes a Doppler-shifted spectrum comprising the relative strength of the echoes at various Doppler-shifted frequencies, and estimates wind speed and direction.
- Additionally, S. V. Shamanaev, L. V. Shamanaeva: "Reviews of acoustics methods of sounding of the atmospheric layer (1996-2006)", THIRTEENTH JOINT INTERNATIONAL SYMPOSIUM ON ATMOSPHERIC AND OCEAN OPTICS/ATMOSPHERIC PHYSICS, SPIE, vol. 6522, 31 December 2006 (2006-12-31, XP040233275 describes sodar methods of qualitative and quantitative analysis of the atmospheric boundary layer structure and results of sodar measurements of individual components and total wind velocity vector, mixing layer height, structure constants of wind velocity and temperature fields, and precipitation over the past 10 years (1996-2006).
- The invention comprises a method for automatically detecting the spectral peaks in a returned signal from the atmosphere in a phased array monostatic sodar device. A non-limiting example of a sodar system with which the invention may be used is disclosed in U.S. patent application
US 2010/0195443 , filed Nov. 5, 2007 , entitled "Transducer Array Arrangement and Operation for Sodar Applications". - Rather than assuming that the returned signal contains a single spectral peak, the inventive method accounts for the possibility that there may be two or more Doppler-shifted spectral peaks in the returned signal. One peak is expected reflected off of turbulence in the air itself, and associated with the velocity of the air itself. Another peak may be detected reflected off of any precipitation in the air mass, and associated with the velocity of this precipitation.
- The inventive method automatically detects when multiple peaks exist in a returned spectrum. When multiple peaks are detected, the method separates the spectrum into a precipitation-related region of response frequencies and a wind velocity-related region of response frequencies. Individual estimations are made of the peak frequencies within each of these spectral regions. Characteristics of these peaks are used to estimate the presence and severity of precipitation, which can be used to more accurately estimate the wind velocity than would otherwise be possible in the presence of precipitation, and to estimate the degree to which precipitation has unavoidably degraded the accuracy of the wind estimate. This invention features a method of detecting precipitation with a sodar apparatus that transmits sound beams into the atmosphere, detects echoes returned from the atmosphere, from
the echoes determines a Doppler-shifted spectrum comprising the relative strength of the echoes at various Doppler-shifted frequencies, and estimates wind speed and direction. In one embodiment the inventive method comprises automatically estimating the presence of precipitation based on the Doppler-shifted spectrum. Automatically estimating the presence of precipitation may comprise automatically distinguishing a frequency or frequency range in the Doppler-shifted spectrum that is associated with wind velocity from a frequency or frequency range in the Doppler-shifted spectrum that is associated with precipitation. - In one embodiment the invention may further comprise using the estimated presence of precipitation to automatically improve the accuracy of the wind speed estimate made in the presence of the rain. This method may further comprise automatically estimating the severity of rain based on the Doppler-shifted spectrum. The rain severity estimates may be used to more accurately determine when the presence of rain has degraded the reliability of a wind estimate.
- Automatically distinguishing a frequency or frequency range in the Doppler-shifted spectrum that is associated with wind velocity from a frequency or frequency range in the Doppler-shifted spectrum that is associated with precipitation may be accomplished by automatically identifying two distinct peaks in the Doppler shifted spectrum, one such peak being associated with rain velocity and the other being associated with wind velocity. This method may further comprise automatically determining the predominant frequency of each peak individually, and may further comprise automatically determining when the peaks are not sufficiently distinct to accurately estimate wind speed as a determination of reliability. The spectra of a number of samples in an averaging period may be used to make the wind speed estimate and the determination of reliability.
- Identifying two distinct peaks may be accomplished by applying a curve fit to the averaged spectra. The curve fit may be a higher order polynomial curve fit of the logarithm of the spectrum; the higher order polynomial may be an octic, or eighth-order polynomial. Quadratic curves may be fit to the peaks of the higher order polynomial, and the quadratic curves may subsequently be used to generate two Gaussian curves, one representing the region of the spectrum associated with precipitation and the other representing the region of the spectrum associated with wind velocity. Automatically identifying two distinct peaks in the Doppler shifted spectrum may include finding an inflection point on the spectrum, and treating that as the second peak. Treating the inflection point as a second peak may comprise altering the spectrum by adding to the polynomial a term that increases or decreases with frequency, so as to change a local inflection point into a local maximum such that the resulting polynomial has two maxima
- Automatically identifying two distinct peaks in the Doppler-shifted spectrum may comprise automatically eliminating one or more excess peaks if there are more than two peaks. Automatically eliminating one or more excess peaks if there are more than two peaks may comprise discarding the lowest frequency peak if it has the lowest amplitude of the peaks, and/or discarding all peaks except the two with the greatest amplitudes.
- Properties of the two peaks may be used to estimate the severity of rain, to more accurately estimate the wind speed in the presence of precipitation by limiting the section of the spectrum analyzed to estimate wind speed to that part of the spectrum likely due to wind alone and not due to precipitation, and to estimate the degree to which precipitation is degrading the accuracy of the estimate of wind speed. A fuzzy logic technique may be used to make the estimates of the presence of precipitation, to limit the section of the spectrum analyzed and to estimate the degradation in wind speed accuracy.
- Various other objects, features and advantages of the present invention will become fully appreciated as the invention becomes better understood when considered in conjunction with the accompanying drawings, in which like reference characters designate the same or similar parts throughout the several views, and wherein:
-
Figure 1 is a sectioned view of a sodar apparatus with which the invention can be used; -
Figure 2 is a block diagram of the principal signal processing components in a sodar apparatus with which the invention can be used. -
Figure 3 shows in general terms the principal steps involved in processing the data from a sodar apparatus using typical prior art techniques, without precipitation detection. -
Figure 4A shows a typical spectral response from a sodar apparatus without the presence of any precipitation. -
Figure 4B shows a typical spectral response from a sodar apparatus operating in the presence of light precipitation. -
Figure 4C shows a typical spectral response from a sodar apparatus operating in the presence of moderate precipitation. -
Figure 4D shows a typical spectral response from a sodar apparatus operating in the presence of heavy precipitation. -
Figure 5 shows certain steps of the preferred embodiment of the inventive method to detect the presence of precipitation and to isolate the portions of the spectrum related to precipitation and to wind. -
Figures 6A-6L illustrate examples of fuzzy rules that are used in an embodiment of the invention; -
Figure 7 shows certain steps of the preferred embodiment of the inventive method to estimate the wind velocity and the confidence in the wind velocity given information about the presence of precipitation and isolation of the precipitation-related portion of the spectra. -
Figures 8A ,8B , and8C show exemplary spectra from each of the three beams with the preferred embodiment of the inventive method applied. -
Figures 9A and9B show a time series of horizontal and vertical wind data, respectively, measured using a sodar apparatus comparing the prior art signal processing technique offigure 3 to the inventive signal processing method. -
Figure 10A is a scatterplot showing the correlation between conventional anemometer measurements and sodar wind velocities measured using prior art signal processing techniques during a period of precipitation. -
Figure 10B is a scatterplot of the same data using the preferred embodiment of the inventive method. - The inventive method can be used with a sodar apparatus as shown in
figure 1 . However, the method can also be used with other types of monostatic and bistatic sodar devices. The phased array monostatic sodar apparatus shown infigure 1 consists of anarray 100 of individualacoustic transducers 10. Thetransducers 10 are connected to an electronics anddata processing system 20 which causes them to emit phased array beams ofsound 30 in the generally horizontal direction as shown. These beams impinge upon a solid smooth surface, the 'sound mirror' or 'mirror' 40 which causes the sound beams to be reflected generally upwards as reflected beams 31. - The reflected sound beams 31 impinge upon turbulence and density variations in the atmosphere above. Some of the sound energy from these beams is reflected back along the same paths as
outbound beams transducers 10 in phasedarray 100 where they are detected by receiving components of theelectronics package 20. These components are mounted inhousing 200 which supports the various components, and which may also serve to block stray sound transmission and reception from undesired directions. - In order for a sodar apparatus to measure wind speed and direction in the presence of precipitation, it is obviously a necessary condition that the
array 100 oftransducers 10 be adequately protected from any precipitation which might permanently damage them or temporarily interfere with their operation. The method described above wherein thearray 100 is protected from the elements byhousing 200, and in which mirror 40 is used to reflect the sound beams from the generallyhorizontal path 30 along which they are emitted from the array into the generallyvertical path 31, is one non-limiting means of obtaining such protection, known in prior art. Other means of protecting thearray 100 from damage due to precipitation, and rendering it operable in the presence of precipitation may be possible, and the invention would be equally applicable to such other means. - The
transducers 10 inarray 100 are driven in transmit mode, and returning sound is detected and evaluated in receive mode, byelectronics equipment 20.Figure 2 shows one non-limiting example ofelectronic equipment 20 in greater detail in block diagram form. Operation of the system consists of a series of "shots." Each shot consists of an initial period where the electronics are configured to transmit a sound signal into the air, and a second immediately following period during which the electronics are configured to receive, analyze, and record incoming signals, in particular the echoes of the transmitted signal reflected back from the environment. The inventive method comprises processing and analysis of the incoming signals during this second period of the shot. - The components shown in
Figure 2 consist of hardware and software elements the function of which can be implemented in a variety of ways as would be apparent to one skilled in the art, each of which is within the scope of the invention. Despite this, most monostatic phased array sodar electronics systems will consist of the elements shown inFigure 2 , whether these elements are accomplished by physical electronic hardware, programs within control and signal processing computers, or, as is typical for modern sodar apparatus, a combination of the two. - In operation the
control component 21 will configure theswitching network 24 so as to connecttransducers 10 ofarray 100 to signalsource 22 through transmitamplifiers 23. Signalsource 22 will provide signals appropriately phased for each of thetransducers 10 so as to causearray 100 to transmit a focused beam ofsound 31 in a particular generally upward direction; this aspect is set forth in more detail in the applicationUS 2010/0195443 . Immediately following this transmission,control component 21 will configure switchingnetwork 24 so as to connect thetransducers 10 ofarray 100 to signal conversion andanalysis component 26 through receiveamplifiers 25. This receive mode configuration is set, using phased array techniques, to maximize sensitivity in the same direction as that in whichbeam 31 was transmitted. Conversion andanalysis component 26 analyzes the spectral properties of the returned echoes in order to estimate atmospheric properties at various altitudes above the apparatus as will be further described below. This analysis process is involved in the invention. After the received data is analyzed, it may be stored using somestorage element 27, transmitted, reported or displayed for the user using reporting means 28 or, most usefully, both. - The sodar apparatus is only sensitive to air velocity in the radial direction of
beam 31. There is no direct means of estimating horizontal wind velocity or direction from a single shot in a single direction. Accordingly controllingcomponent 21 is configured so as to sequentially adjust the transmitted direction ofbeam 31 and the direction of maximized sensitivity to returned echoes. At least three beam directions are necessary to resolve horizontal wind speed, horizontal wind direction, and vertical wind speed. In the apparatus described in the applicationUS 2010/0195443 to which the inventive technique has been applied, the apparatus transmits three beams inclined at approximately 11 degrees from vertical in three directions separated by 120 degrees of azimuth. Equivalently the technique could be applied to other sodar apparatus that transmit beams in multiple directions, for example where a single beam is transmitted more exactly vertically, and the second and third beam directions are inclined (e.g., approximately 15 degrees) from the vertical and separated from each other by approximately 90 degrees in azimuth. By transmitting beams in three different directions, and estimating radial velocities in three different directions, vector analysis techniques can be applied to extract the horizontal speed and direction which is of greatest interest. The invention can also be applied to bistatic sodar systems, in which separate transmitters and receivers are used. - The data from any individual shot is likely to be contaminated with noise. Also, at any particular altitude of interest there is no guarantee that the signal of interest will be of sufficient strength relative to the noise to be useful, or indeed to be detected at all. Accordingly, sodar systems generally do not report near-instantaneous conditions based on a single group of three shots, which could be completed in roughly 6 seconds. Instead sodar systems typically estimate atmospheric conditions based on an average of a number of shots in each of the three directions. For example, data might be averaged over a 10 minute interval, consisting of approximately 100 shots in each of the three directions.
-
Figure 3 shows the typical prior-artoverall processing technique 300 for a sodar system not using the inventive methodology in greater detail in flow chart form. Sodar data is processed in blocks of (for example) ten minutes. During this period shots are repeated in each of three beam directions. As described above, for each direction, a directional acoustic pulse, orbeam 31, is transmitted,step 302, and subsequently the apparatus is configured to record the echoes, or acoustic reflections, from the environtnent,step 304. - Time of travel of the
beam 31 to a particular altitude, and in turn the time of travel for any echo from that altitude to be returned to the apparatus, depends on the altitude and the speed of sound. Accordingly the returned signal can be broken up, or windowed, into segments associated with atmospheric conditions at different altitudes above the apparatus, steps 306-310, this being a useful characteristic of sodar apparatus known to those skilled in the art. - Subsequently, a Fast Fourier Transform is applied to this windowed data,
step 310, to convert the time-series signal into the frequency domain so that Doppler shifts of the returned signals can be measured. For reasons known to those skilled in the art of such conversions, more accurate frequency spectra without artifacts of the windowing process will be obtained if some form of gradual windowing, for example a Hamming Window, is applied to the data than would be the case if abrupt or "boxcar" windowing were applied to the data. For reasons known to those skilled in the art of such conversions, more points and more efficient computation are obtained of the frequency spectra if the windowed data is augmented with a series of zeros sufficient to make the total length to be transformed equal to a power of 2, such as 1024. - The character of the resulting spectrum for an individual shot at a particular elevation can be summarized as a Doppler frequency shift, step 314, a signal level, and a signal-to-noise ratio (SNR),
step 316, the methods for making this summary data being apparent to those skilled in the art. Techniques known to those skilled in the art can be used to eliminate the effect of zero-Doppler shift echoes returning from fixed objects,step 312. - Finally, after 10 minutes have elapsed, average spectra can be computed for each beam direction at each elevation,
step 318. The individual frequency shifts for the individual shots used in a particular average may be weighted in the average based on signal strength, noise strength, and SNR using techniques apparent to those skilled in the art. The average frequency shifts can be used to compute horizontal wind speed, direction, and vertical wind speed using methods apparent to those skilled in the art,step 320. - The above technique works well during periods of no precipitation.
Figure 4A shows a spectrum from an individual shot under conditions without precipitation. A clearspectral peak 40 Doppler shifted due to wind velocity is visible. At increasing levels of precipitation, the vertical velocity of the rain drops begins to affect the spectra. InFigure 4B (light rain) a fairly clear wind relatedpeak 41 is still visible. Light precipitation introduces additionalsmall peaks 42 likely related to rain drop velocity.Peak 43 may be related to wind or may be precipitation, and affects confidence in, and perhaps accuracy of, any wind velocity estimate. InFigure 4C (moderate rain), the group ofpeaks 44 are wind related, while the group ofpeaks 45 are rain-related. In this case, withpeak 44 clearly visible, the wind data is not lost from the spectrum, but standard signal processing techniques will likely choosepeak 45 as the shifted spectrum for wind estimate, introducing significant error in the wind velocity estimate. Infigure 4D (heavy rain), peak 46 associated with rain dominates heavily, and it may not be possible to accurately estimate a wind speed from the group ofpeaks 47. - Current state of the art sodars will report erroneous strong downward vertical velocities in the presence of rain. Operators skilled in the art of interpreting sodar data use such strong vertical downward velocities as indication that rain is present and that the horizontal velocity and direction reported by the sodar is likely inaccurate and should be discarded.
- From the foregoing it will be clear that a method of identifying precipitation-related Doppler shift peaks, distinguishing such peaks, and separating them from purely wind-related peaks, will provide a means of extracting wind data of useful accuracy in the presence of light and moderate rain, and an automated means of rejecting data when rain is so severe as to irreparably compromise the wind speed estimate will provide a means to discard erroneous wind data collected in heavy rain.
-
Figure 5 illustrates and describes the basic steps involved in the preferred embodiment of theinventive method 400 of detecting and isolating the Doppler shifts related to rain. - Over the 200 (more or less) meter range of altitudes under which modern phased array monostatic sodars typically operate, rain, if present, is likely generally uniform over the entire vertical column being measured. Accordingly it is sufficient to estimate rain fall at only one or a few altitudes, and use the estimate of rain at those altitudes as a proxy for rain at all altitudes. This is useful since it is easier to detect the rain-related spectral components and isolate them from wind-related components at lower altitudes, such as for example, 40, 50 and 60 meters, where the signals from wind and rain are stronger and less masked by random noise and the like than the signals returning from higher altitudes. Thus, shot
data 402 from only one or more of relatively low altitudes,step 404, is used in the preferred embodiment. - The inventive method discounts or discards (filters) spectrum samples which have Signal to Noise Ratios (SNR, calculated as the ratio of energy in spectral peaks to broadband energy) below some limit,
step 406. As one non-limiting example of this, the SNR is the average PSD in the vicinity of the main peak divided by the average PSD everywhere else. This is typically expressed in dB, by taking SNR = 10 * log (AveMain / (AveElsewhere / Normalization)) where the normalization = (Total Spectral Bandwidth - Width of Hamming Window) / Width of Hamming Window. It has been found that an appropriate SNR filter for the rain filter passes only shots with SNR > 7 dB. - For each beam direction (the steps are the same for each of the three beam directions and so will be described for only one direction) the presumptively reliable of the remaining spectra are averaged into a preliminary average,
step 408. A spectrum is regarded as unreliable if its peaks are at significantly different amplitude from the predominant peak amplitude of the data set as indicated by the preliminary average. If such an unreliable peak is significantly larger than the average, it might adversely affect the accuracy of rain detection. Accordingly, spectra with peaks significantly larger than the peak of the preliminary average are discarded. As a non-limiting example the method might discard raw spectra which have peak amplitudes greater than five times the amplitude of the rough average peak. After discarding these unreliable sample spectra, a final average is calculated using the remaining spectra.Curves figures 8A ,8B and8C respectively, are examples of these final average spectra. - To automatically identify the peak associated with wind, and the separate peak associated with rain (if present), it is computationally more convenient to approximate the spectrum, which represents a stochastic measurement of the real world, with a curve fit to some mathematical function,
step 410. However, the invention also contemplates peak identification directly from the averaged spectra. A non-limiting example curve fit which works well is to take the natural logarithm of the spectrum and fit this to an octic, or eighth order polynomial function. The use of the natural logarithm being useful for reasons discussed below.Curves figures 8A ,8B and8C , respectively are examples of such curve fits. - Once the curve fits are available the one or two peaks can be identified as the point(s) where the octic curve's derivative with respect to frequency is zero and the second derivative is less than zero. The higher frequency peak is always associated with rain, since the rain drops are falling through the air mass and as a result have a greater up-frequency Doppler shift than the peaks associated with the velocity of the air itself. Vertical dash-
dot lines figures 8A ,8B and8C , respectively are associated with the wind speed peak, while vertical dash-dot lines figures 8A ,8B and8C , respectively are associated with the rain peaks. - In unusual instances, there may be more than or fewer than two peaks. In the case of an octic curve fit, there may be one, three or four, instead of two peaks. Subsequent processing depends upon selecting which two peaks correspond with wind and rain. The inventive method preferably includes an automatic means for selecting which two peaks to use if more than two peaks are present based on knowledge of the spectral properties of returned sodar signals. For a non-limiting example, in one method of eliminating excessive peaks, the following rules may be used: (a) if there are three peaks and the lowest frequency peak is also the lowest amplitude, then that peak is discarded; (b) if there are three peaks and the lowest frequency peak is not the largest and is significantly lower in frequency than the next higher frequency peak, then that peak is discarded; (c) if there are three or more peaks, and neither steps (a) or (b) eliminated a peak, then all but the largest two peaks are discarded.
- It is also helpful to provide a means of automatically finding a point to serve as a second peak even if only one true maximum is found. For a non-limiting example, a means of finding the most prominent inflection point on the spectrum, and treating that as the second peak can be employed. For non-limiting example, the spectrum can be "tilted" by adding to the octic polynomial a term that increases or decreases with frequency; in one non-limiting embodiment the increase or decrease can be linear. This term has the effect of changing a local inflection point into a local maximum, such that the resulting polynomial has two maxima for subsequent processing.
- These individual peaks can be accurately modeled as Gaussian curves, using the following method which takes advantage of the use of fitting the octic curve to the logarithm of the spectrum as discussed above. The Gaussian curve is the exponential of a quadratic curve. It is possible to fit a quadratic curve to each of the two chosen peaks of the octic curve by calculating a quadratic whose value, first derivative, and second derivative matches those of the octic at the point of the peak. The Gaussian curves based on the lower frequency quadratic expressions corresponding to wind are shown as
solid lines Figures 8A-8C , respectively. The curves based on the higher frequency quadratic expressions corresponding to rain are shown assolid lines Figures 8A-8C , respectively. - These Gaussian curves can be interpreted as Probability Density Functions (PDFs),
step 412. The lower frequency PDF corresponds to wind, and the amplitude of that curve at any particular frequency corresponds to the probability that spectral energy at that frequency is associated with wind. Conversely, the higher frequency PDF corresponds to rain, and the amplitude of that curve at any particular frequency corresponds to the probability that spectral energy at that frequency is associated with rain. - From the shape of these Gaussian curves taken over an interval of time for the three beam directions, at one or more elevations, it is possible to determine the likelihood that rain is present, and the likely intensity of that rain. Additionally, and most importantly for the accurate estimation of wind speed which may be the primary use of the invention for a sodar apparatus, it is possible to establish boundaries surrounding the wind peak in the spectrum within which wind data is unlikely to be corrupted by the presence of rain, or in other words, to select a modified spectral bandwidth for estimation of the wind frequency peaks and also to provide a measure of confidence in the degree to which the wind speed is accurately estimated in spite of the possible presence of precipitation.
- As non-limiting examples, the separation between the peaks of the two Gaussian curves, the ratio of the heights of these two curves, the width of each curve to the half-amplitude level, and the amplitude of the point at which these two curves intercept each other may be chosen as relevant and automatically calculable measures of the shape of Gaussian curves.
- As would be apparent to one skilled in the art of signal processing, a set of fuzzy logic rules may be applied to the measures of the Gaussian curves so as to compute wind and rain beam-radial velocity statistics,
step 414. In particular, a spectral cutoff, or in other words modified spectral limits, for wind measurement,step 424; a confidence factor for the wind radial velocity; a measure of precipitation droplet speed, intensity and type; and a confidence factor for these measures of precipitation state may be computed. Fuzzy logic rules are an effective way to determine spectral cutoffs, but the inventive method can be accomplished without the use of fuzzy logic. - Further fuzzy logic rules may be used to check that these results are reasonable, in other words to check that they pass a sanity check,
step 416. Further, the information from the three radial directions can be combined to check that the calculated statistics for the three beams are consistent with one another,step 418. Temperature can be taken into account, as would be apparent to one skilled in the art,step 417. - A non-limiting example of appropriate fuzzy rules and their application is as follows. See
figures 6A-6L . The five rules shown infigures 6A-6E (rule for number of good shots, rule for frequency of main wind peak, rule for frequency of rain peak, rule for separation between peaks, and rule for width of peaks, respectively) are used on a per-beam, per-height basis, for example, for each of the A, B, C beams and at each of the 40m, 50m, and 60m heights. - Note that the fifth rule (
figure 6E ) is applied twice, once for the wind peak width, and once for the rain peak width. This rule is only applied if the peak being tested is at least 1/4 as big as the other peak, so if a peak is relatively small, the width rule is not used on it. - The overall fuzzy truth value is found by taking the minimum of the truth values found from each of the rules. This is the fuzzy AND operation.
Rule 1 must be true, ANDrule 2 must be true, ANDrule 3 must be true, etc.. Compute the truth value from each rule, take the minimum, and use that as a rating for the confidence in the present rain/wind decomposition. - As there are three beams and three heights in this example, this results in nine decompositions have nine different truth values.
- Next the A, B, and C beam decompositions at a single height are combined. A combined truth factor for the A, B, C set is formed, using more fuzzy rules.
- First, take the three truth values from the A, B, C beam decompositions, sort them from worst to best (ascending truth value) and apply the rules shown in
figures 6F ,6G and 6H (rule for worst beam rating, rule for second worst beam rating and rule for best beam rating, respectively). These three fuzzy rules provide truth values that are combined by taking the minimum (fuzzy AND operation), which gives the overall rating for the three beam decomposition at this one height. - The same analysis is done for the other two heights, so now the nine truth values have been reduced down to three, one each for 40m, 50m, and 60m heights. This provides a measure of the 'believability' for the decomposition. What is desired is some indication how hard it's raining (RainWindRatio), how certain it is that it's raining (RainConf), and how much the wind measurements can be trusted (WindConf). These are evaluated independently at each height.
- The RainWindRatio (at one height) is the weighted average of the RainWindRatios computed for the A, B, and C beams, where the A, B, C 'believability' rating is used as a weighting. The RainWindRatio is expressed in dB; for each beam it is: 10 * log (RainPeakHeight / WindPeakHeight). Thus the combined weighted average is an average of dB's.
- RainConf (at one height) is the minimum of the two fuzzy rule values shown in
figures 6I and 6J (rule # 1 for rain confidence (combined truth value) andrule # 2 for rain confidence (rain wind ratio), respectively), one of which (figure 6I ) is evaluated on the combined rating of the A, B, C beams, and one (figure 6J ) is evaluated on the combined RainWindRatio of the three beams. - WindConf (at one height) is the minimum of the two fuzzy rule values shown in
figures 6K and 6L (rule # 1 for wind confidence (combined truth value) andrule # 2 for wind confidence (rain wind ratio), respectively). - This analysis provides the following set of numbers for each height, 40m, 50m, and 60m.
- 1. Rating (combined believability indicator)
- 2. RainWindRatio (weighted average of each A, B, C beam)
- 3. RainConf (How certain are we that it's raining)
- 4. WindConf (How much can we trust the wind measurements)
- The final step of combining the data from the three heights into a single set of numbers uses a weighted average. The rating (combined believability indicator) of each height is used as a weighting in each weighted average. In the end, then, the result is weighted averages for:
- 1.
- RainWindRatio
- 2.
- RainConf
- 3.
- WindConf.
- 4.
- Beam A Spectral Cutoff
- 5.
- Beam B Spectral Cutoff
- 6.
- Beam C Spectral Cutoff
- A preferred embodiment of the
inventive method 500 for using a sodar apparatus to estimate wind speed in the presence of rain using the above information is shown inFigure 7 . The signal processing discussed above and shown inFigure 5 is the first step inFigure 7 ,step 501. The only other difference between theinventive method 500 and the typical prior art method shown inFigure 3 is that the inventive method instep 514 applies modified spectral limits as calculated instep 501 to the shifted frequency peak detection. - Preferably, the results of the rain detection algorithm are applied only to the data taken in the time block or averaging period during which these results were calculated. This is preferable since there may be significant variations in precipitation from one averaging period to the next. In practice, it may be difficult to accomplish this, as the results of the rain detection algorithm will only be available when the full (for example 5 or 10 minute) averaging period has elapsed. Due to the size of the raw spectral data sets, and due to practical limits of hardware memory typically provided within the sodar apparatus' signal processing equipment, it may be impractical to preserve the raw data until the modified spectral bandwidth to be used with the data is available. In this case, an alternative embodiment is possible where the rain statistics and modified spectral bandwidth are calculated during one averaging period, and these values are used during the subsequent averaging period. The method works on a continuing basis where winds are estimated during each averaging period based on rain statistics and a modified spectral bandwidth from the immediately prior averaging period. Of course, if the memory is available then it is better to practice the preferred embodiment.
-
Figures 9A and9B and10A and 10B illustrate data determined using the preferred embodiment of the inventive method. These data illustrate that the invention is able to more accurately estimate wind speed in the presence of rain and to more reliably detect when accurate estimation of wind is not possible due to rain as compared to the prior art methods, for example the method illustrated infigure 3 . -
Figure 9A is a time series of averages of horizontal wind speed measured at a 40 meter elevation above the apparatus over the course of about six hours. In this chart, data processed in the conventional manner is shown as triangles connected by dashed lines, while data processed using the preferred embodiment of the invention is shown as squares connected by solid lines. It is apparent fromfigure 9A that the inventive method reports more data, and that data is more consistent than using the prior art technique. -
Figure 9B shows the vertical wind speed using the same symbols for the prior art and inventive methods, using the same data as withfigure 9A . In this chart the extreme and incorrect values of vertical wind velocity measured by the apparatus in the presence of rain are clearly visible, while the data as corrected by the inventive method shows reasonable values for vertical wind velocity. -
Figures 10A and 10B are scatter plots and least squares linear fits for the data reported infigure 9A compared to data collected from a cup type anemometer mounted at a 40 meter elevation on a nearby tower.Figure 10A shows the data processed in the conventional (prior art) manner as illustrated infigure 3 . The correlation is poor, the slope of the linear regression, which would be 1.0 for perfect correlation, is 0.360 and the correlation coefficient R=0.220 is quite poor.Figure 10B shows the same data compared to the same anemometer data, but in this case the data is processed using the preferred embodiment of the invention: the slope is 0.899, and the correlation coefficient is 0.688, both values being much closer to what would be expected if the two measures of wind speed agreed perfectly. - With reference to the correlation shown in
figure 10B , it is important to note that perfect correlation, on an average block by average block basis, between cup anemometer and sodar apparatus is not to be expected for a number of reasons known to those skilled in the art. These reasons include the necessary physical separation between the sodar apparatus and the tower on which the anemometer is mounted, and the fact that the sodar apparatus measures velocity averaged over a significant volume of air, while the cup anemometer is making a near-point-source measurement. Further, any lack of correlation may in part be due to degraded performance of the cup anemometer itself in the presence of precipitation. - As to a further discussion of the manner of usage and operation of the present invention, the same should be apparent from the above description. Accordingly, no further discussion relating to the manner of usage and operation will be provided.
- With respect to the above description then, it is to be realized that the optimum dimensional relationships for the parts of the invention, to include variations in size, materials, shape, form, function and manner of operation, assembly and use, are deemed readily apparent to one skilled in the art, and all equivalent relationships to those illustrated in the drawings and described in the specification are intended to be encompassed by the present invention.
- Therefore, the foregoing is considered as illustrative only of the principles of the invention. Further, since numerous modifications and changes will readily occur to those skilled in the art, it is not desired to limit the invention to the exact construction and operation shown and described, and accordingly, all suitable modifications and equivalents may be resorted to, falling within the scope of the invention.
Claims (7)
- A method of detecting precipitation with a sodar apparatus that transmits sound beams (30, 31) into the atmosphere, detects echoes returned from the atmosphere, from the echoes determines a Doppler-shifted spectrum comprising the relative strength of the echoes at various Doppler-shifted frequencies, and estimates wind speed and direction, the method comprising:automatically distinguishing a first frequency or frequency range in the Doppler-shifted spectrum that is associated with wind velocity from a different, second frequency or frequency range in the Doppler-shifted spectrum that is associated with precipitation,characterized in that
the first frequency or frequency range is automatically distinguished by automatically identifying two distinct peaks (56, 57, 58; 59, 60, 61) in the Doppler shifted spectrum, one such peak (59, 60, 61) being associated with rain velocity and the other (56, 57, 58) being associated with wind velocity,
the two distinct peaks (56, 57, 58; 59, 60, 61) are identified by applying a curve fit (53, 54, 55) to the averaged spectra, where the curve fit (53, 54, 55) is a higher order polynomial curve fit of the logarithm of the spectrum, and where quadratic curves are fit to the peaks of the higher order polynomial, said quadratic curves being subsequently used to generate two Gaussian curves (62, 63, 64; 65, 66, 67), one representing the region of the spectrum associated with precipitation and the other representing the region of the spectrum associated with wind velocity, and
the presence of precipitation based on the second frequency or frequency range in the Doppler-shifted spectrum is automatically estimated. - The method according to claim 1 further comprising automatically determining the predominant frequency of each peak (56, 57, 58, 59, 60, 61) individually, and automatically determining when the peaks (56, 57, 58, 59, 60, 61) are not sufficiently distinct to accurately estimate wind speed, as a determination of reliability, where the spectra of a number of samples in an averaging period are used to make the wind speed estimate and the determination of reliability.
- The method according to any of claims 1 or 2 where properties of the two peaks (56, 57, 58; 59, 60, 61) are used to estimate the severity of rain, to more accurately estimate the wind speed in the presence of precipitation by limiting the section of the spectrum analyzed to estimate wind speed to that part of the spectrum likely due to wind alone and not due to precipitation, and to estimate the degree to which precipitation is degrading the accuracy of the estimate of wind speed.
- The method according to claim 3 where a fuzzy logic technique is used to make the estimates of the presence of precipitation, to limit the section of the spectrum analyzed and to estimate the degradation in wind speed accuracy.
- The method according to any of claims 1-4 in which automatically identifying two distinct peaks (56, 57, 58; 59, 60, 61) in the Doppler-shifted spectrum comprises automatically eliminating one or more excess peaks if there are more than two peaks by either discarding the lowest frequency peak if it has the lowest amplitude of the peaks, or if there are more than two peaks, discarding all peaks except the two with the greatest amplitudes.
- The method according to any of claims 1-5 in which automatically identifying two distinct peaks (56, 57, 58; 59, 60, 61) in the Doppler shifted spectrum comprises finding an inflection point on the spectrum, and treating that as the second peak, wherein treating the inflection point as a second peak comprises altering the spectrum by adding to the polynomial a term that increases or decreases with frequency, so as to change a local inflection point into a local maximum such that the resulting polynomial has two maxima.
- The method according to any preceding claim further comprising using the estimated presence of precipitation to automatically improve the accuracy of the wind speed estimate made in the presence of the rain, and automatically estimating the severity of rain based on the Doppler-shifted spectrum, wherein the rain severity estimates are used to more accurately determine when presence of rain has degraded the reliability of a wind estimate.
Applications Claiming Priority (2)
| Application Number | Priority Date | Filing Date | Title |
|---|---|---|---|
| US15858909P | 2009-03-09 | 2009-03-09 | |
| PCT/US2010/026472 WO2010104769A1 (en) | 2009-03-09 | 2010-03-08 | Method of detecting and compensating for precipitation in sodar systems |
Publications (3)
| Publication Number | Publication Date |
|---|---|
| EP2406658A1 EP2406658A1 (en) | 2012-01-18 |
| EP2406658A4 EP2406658A4 (en) | 2015-02-18 |
| EP2406658B1 true EP2406658B1 (en) | 2017-01-25 |
Family
ID=42678160
Family Applications (1)
| Application Number | Title | Priority Date | Filing Date |
|---|---|---|---|
| EP10751223.8A Not-in-force EP2406658B1 (en) | 2009-03-09 | 2010-03-08 | Method of detecting and compensating for precipitation in sodar systems |
Country Status (10)
| Country | Link |
|---|---|
| US (1) | US8264908B2 (en) |
| EP (1) | EP2406658B1 (en) |
| CN (1) | CN102405422B (en) |
| AU (1) | AU2010222857B2 (en) |
| BR (1) | BRPI1009524A2 (en) |
| CA (1) | CA2755091A1 (en) |
| MX (1) | MX2011009385A (en) |
| NZ (1) | NZ595043A (en) |
| WO (1) | WO2010104769A1 (en) |
| ZA (1) | ZA201106471B (en) |
Families Citing this family (9)
| Publication number | Priority date | Publication date | Assignee | Title |
|---|---|---|---|---|
| US8264908B2 (en) * | 2009-03-09 | 2012-09-11 | Second Wind Systems, Inc. | Method of detecting and compensating for precipitation in sodar systems |
| US20120267187A1 (en) * | 2011-04-21 | 2012-10-25 | Graber Curtis E | System for targeting directed acoustical energy |
| US20130100773A1 (en) * | 2011-10-21 | 2013-04-25 | Steven Robert Rogers | Wide-area wind velocity profiler |
| CN103439709B (en) * | 2013-09-17 | 2015-04-01 | 南京恩瑞特实业有限公司 | Doppler weather radar application system based on UDP (User Datagram Protocol) |
| AU2019364861B2 (en) * | 2018-10-25 | 2025-01-16 | Electro Magnetic Measurements Pty Ltd | Method for improving performance of a sodar system |
| US12031997B2 (en) | 2018-12-20 | 2024-07-09 | Electro Magnetic Measurements Pty Ltd | Method for improving performance of a SODAR system |
| US11520032B2 (en) * | 2019-02-28 | 2022-12-06 | Samsung Electronics Co., Ltd. | Methods and apparatuses for object presence detection and range estimation |
| CN113740935B (en) * | 2021-07-26 | 2023-09-19 | 东风汽车集团股份有限公司 | A rain detection system and detection method based on reversing radar system |
| CN119024362B (en) * | 2024-10-29 | 2025-03-04 | 青岛镭测创芯科技有限公司 | Meteorological element inversion method, device, equipment and medium |
Family Cites Families (37)
| Publication number | Priority date | Publication date | Assignee | Title |
|---|---|---|---|---|
| AU422241B2 (en) | 1968-12-23 | 1972-03-09 | The Commonwealth Of Australia | Method of and means for recording characteristics ofthe troposphere |
| AU523180B2 (en) | 1978-08-22 | 1982-07-15 | University Of Melbourne, The | Acoustic detection of wind speed and direction at various altitudes |
| SE435326B (en) | 1982-12-07 | 1984-09-17 | Mats Edvin Hurtig | DEVICE TO MEASURE WIND SPEED AND / OR DIRECTION |
| US4558594B1 (en) | 1984-06-25 | 1994-06-07 | Aerovironment, Inc. | Phased array acoustic antenna |
| US4641290A (en) | 1984-11-13 | 1987-02-03 | Fred M. Dellorfano, Jr. | Low frequency portable lightweight sonar systems and their method of deployment for greatly increasing the efficiency of submarine surveillance over large areas |
| US4833360A (en) | 1987-05-15 | 1989-05-23 | Board Of Regents The University Of Texas System | Sonar system using acoustically transparent continuous aperture transducers for multiple beam beamformation |
| US4914750A (en) | 1987-07-13 | 1990-04-03 | Avm Hess, Inc. | Sound transducer |
| US4831874A (en) | 1987-10-16 | 1989-05-23 | Daubin Systems Corporation | Paradac wind measurement system |
| JPH088920B2 (en) * | 1990-09-28 | 1996-01-31 | 富士通株式会社 | Blood scattering power calculator |
| FR2709556B1 (en) | 1993-08-30 | 1995-11-10 | Remtech | Method for the remote determination of the three-dimensional speed of a fluid such as air or water. |
| US5509304A (en) | 1994-08-10 | 1996-04-23 | Radian Corporation | Phased array acoustic antenna system |
| US5544525A (en) | 1994-08-10 | 1996-08-13 | Radian Corporation | Atmospheric remote sensing instrument system |
| US5591945A (en) | 1995-04-19 | 1997-01-07 | Elo Touchsystems, Inc. | Acoustic touch position sensor using higher order horizontally polarized shear wave propagation |
| FR2742876B1 (en) * | 1995-12-26 | 1998-02-06 | Thomson Csf | METHOD FOR DETERMINING THE PRECIPITATION RATE BY DUAL POLARIZATION RADAR AND METEOROLOGICAL RADAR USING THE SAME |
| US5940523A (en) | 1996-03-19 | 1999-08-17 | University Corporation For Atmospheric Research | Method of moment estimation and feature extraction for devices which measure spectra as a function of range or time |
| US5808967A (en) | 1996-10-07 | 1998-09-15 | Rowe-Deines Instruments Incorporated | Two-dimensional array transducer and beamformer |
| US6097669A (en) | 1999-07-01 | 2000-08-01 | Jordan; James R. | Wavelet filtering of sodar signals |
| US6427531B1 (en) | 1999-11-09 | 2002-08-06 | Prasan Chintawongvanich | Active acoustic phased array antenna system |
| US6384516B1 (en) | 2000-01-21 | 2002-05-07 | Atl Ultrasound, Inc. | Hex packed two dimensional ultrasonic transducer arrays |
| AUPQ615000A0 (en) | 2000-03-09 | 2000-03-30 | Tele-Ip Limited | Acoustic sounding |
| US6535158B2 (en) | 2000-03-15 | 2003-03-18 | Utah State University Research Foundation | Kinematic analysis of conically scanned environmental properties |
| US6608237B1 (en) | 2000-08-03 | 2003-08-19 | Kimberly-Clark Worldwide, Inc. | High-strength, stabilized absorbent article |
| US6644590B2 (en) | 2000-09-15 | 2003-11-11 | General Dynamics Advanced Information Systems, Inc. | Active system and method for vibration and noise reduction |
| US6437738B1 (en) | 2001-02-12 | 2002-08-20 | Us Commerce | Hexagonal-annulus phased array antenna for radar wind profiling on moving platforms |
| US6448923B1 (en) | 2001-03-29 | 2002-09-10 | Dusan S. Zrnic | Efficient estimation of spectral moments and the polarimetric variables on weather radars, sonars, sodars, acoustic flow meters, lidars, and similar active remote sensing instruments |
| EP1413169A1 (en) | 2001-08-01 | 2004-04-28 | Dashen Fan | Cardioid beam with a desired null based acoustic devices, systems and methods |
| US6856273B1 (en) | 2002-01-25 | 2005-02-15 | John A. Bognar | Miniature radio-acoustic sounding system for low altitude wind and precipitation measurements |
| CN2585244Y (en) * | 2002-08-15 | 2003-11-05 | 武汉佳盈科技开发有限公司 | Wind measuring radar |
| US6877279B2 (en) | 2002-08-16 | 2005-04-12 | Honda Motor Company, Ltd. | Sealing apparatus for a closure |
| JP3794361B2 (en) * | 2002-08-28 | 2006-07-05 | 三菱電機株式会社 | Radar signal processing apparatus and radar signal processing method |
| US7333620B2 (en) | 2003-04-09 | 2008-02-19 | Harman International Industries, Incorporated | Acoustic transducer with mechanical balancing |
| GB0316241D0 (en) | 2003-07-11 | 2003-08-13 | Qinetiq Ltd | Wind speed measurement apparatus and method |
| US7694779B2 (en) | 2003-08-25 | 2010-04-13 | Takayasu Co., Ltd. | Sound absorbing material |
| US20050165313A1 (en) | 2004-01-26 | 2005-07-28 | Byron Jacquelyn M. | Transducer assembly for ultrasound probes |
| US20060057351A1 (en) | 2004-09-10 | 2006-03-16 | Alain Yang | Method for curing a binder on insulation fibers |
| US7660461B2 (en) * | 2006-04-21 | 2010-02-09 | Sectra Ab | Automated histogram characterization of data sets for image visualization using alpha-histograms |
| US8264908B2 (en) * | 2009-03-09 | 2012-09-11 | Second Wind Systems, Inc. | Method of detecting and compensating for precipitation in sodar systems |
-
2010
- 2010-03-05 US US12/718,141 patent/US8264908B2/en not_active Expired - Fee Related
- 2010-03-08 CN CN201080017368.9A patent/CN102405422B/en not_active Expired - Fee Related
- 2010-03-08 MX MX2011009385A patent/MX2011009385A/en active IP Right Grant
- 2010-03-08 WO PCT/US2010/026472 patent/WO2010104769A1/en not_active Ceased
- 2010-03-08 NZ NZ595043A patent/NZ595043A/en not_active IP Right Cessation
- 2010-03-08 CA CA2755091A patent/CA2755091A1/en not_active Abandoned
- 2010-03-08 EP EP10751223.8A patent/EP2406658B1/en not_active Not-in-force
- 2010-03-08 AU AU2010222857A patent/AU2010222857B2/en not_active Ceased
- 2010-03-08 BR BRPI1009524A patent/BRPI1009524A2/en not_active IP Right Cessation
-
2011
- 2011-09-05 ZA ZA2011/06471A patent/ZA201106471B/en unknown
Non-Patent Citations (1)
| Title |
|---|
| None * |
Also Published As
| Publication number | Publication date |
|---|---|
| WO2010104769A1 (en) | 2010-09-16 |
| CA2755091A1 (en) | 2010-09-16 |
| BRPI1009524A2 (en) | 2016-03-15 |
| MX2011009385A (en) | 2012-02-21 |
| ZA201106471B (en) | 2012-05-30 |
| US8264908B2 (en) | 2012-09-11 |
| CN102405422A (en) | 2012-04-04 |
| CN102405422B (en) | 2014-08-20 |
| NZ595043A (en) | 2013-08-30 |
| EP2406658A4 (en) | 2015-02-18 |
| AU2010222857B2 (en) | 2015-06-04 |
| EP2406658A1 (en) | 2012-01-18 |
| US20100226208A1 (en) | 2010-09-09 |
| AU2010222857A1 (en) | 2011-09-29 |
Similar Documents
| Publication | Publication Date | Title |
|---|---|---|
| AU2010222857B2 (en) | Method of detecting and compensating for precipitation in sodar systems | |
| US6894638B2 (en) | Radar signal processing unit and radar signal processing method for abnormal signal extraction | |
| US9097805B2 (en) | Systems and methods for calibrating dual polarization radar systems | |
| US9261583B2 (en) | Systems and methods for calibrating dual polarization radar systems | |
| CN102608435B (en) | For determining method and the single antenna radar altimeter of radar altimeter antenna performance | |
| US5568151A (en) | Statistical averaging method for wind profiler doppler spectra | |
| Ivić et al. | Radial-based noise power estimation for weather radars | |
| US12196914B2 (en) | Rain sensor | |
| CN109521412A (en) | Radar network composite airspace object detection method based on local statistic fusion | |
| CN109521406A (en) | A kind of reflectance difference rate ZDR scaling method and device | |
| Keat et al. | High-precision measurements of the copolar correlation coefficient: Non-Gaussian errors and retrieval of the dispersion parameter μ in rainfall | |
| CN109143184A (en) | A kind of double threshold detection method of scanning radar | |
| Zhang et al. | Cross-correlation ratio method to estimate cross-beam wind and comparison with a full correlation analysis | |
| CN116125406A (en) | Method for evaluating performance of space-based surveillance radar based on SNR estimation and track-pointing track report | |
| EP3633415B1 (en) | A forward scatter sensor | |
| CN117390421A (en) | A differential feature screening method for target detection | |
| Allen et al. | An analysis of SeaWinds-based rain retrieval in severe weather events | |
| CN121207296B (en) | Municipal road ponding depth monitoring method and system | |
| CN113820674A (en) | Radar cross-sectional area real-time estimation algorithm | |
| Morales et al. | Evaluation of peak current polarity retrieved by the ZEUS long-range lightning monitoring system | |
| Ivić | On the radial-based estimation of colored noise power in weather radars | |
| Ahbar et al. | Performance Comparison Between S-Band And C-Band Radar In Quantitative Precipitation Estimation | |
| US12474457B2 (en) | Target distance estimation device, radio wave detection device, and target distance estimation method | |
| EP1083423A2 (en) | Pluviometric disdrometric apparatus with high sensitivity and response speed | |
| CN121522003A (en) | Online monitoring method and system for cast-in-place pile quality based on ultrasonic array |
Legal Events
| Date | Code | Title | Description |
|---|---|---|---|
| PUAI | Public reference made under article 153(3) epc to a published international application that has entered the european phase |
Free format text: ORIGINAL CODE: 0009012 |
|
| 17P | Request for examination filed |
Effective date: 20110906 |
|
| AK | Designated contracting states |
Kind code of ref document: A1 Designated state(s): AT BE BG CH CY CZ DE DK EE ES FI FR GB GR HR HU IE IS IT LI LT LU LV MC MK MT NL NO PL PT RO SE SI SK SM TR |
|
| DAX | Request for extension of the european patent (deleted) | ||
| RAP1 | Party data changed (applicant data changed or rights of an application transferred) |
Owner name: SECOND WIND SYSTEMS, INC. |
|
| RAP1 | Party data changed (applicant data changed or rights of an application transferred) |
Owner name: VAISALA INC. |
|
| A4 | Supplementary search report drawn up and despatched |
Effective date: 20150121 |
|
| RIC1 | Information provided on ipc code assigned before grant |
Ipc: G01S 13/00 20060101AFI20150115BHEP Ipc: G01S 7/539 20060101ALI20150115BHEP Ipc: G01W 1/14 20060101ALI20150115BHEP Ipc: G01S 15/88 20060101ALI20150115BHEP |
|
| GRAP | Despatch of communication of intention to grant a patent |
Free format text: ORIGINAL CODE: EPIDOSNIGR1 |
|
| INTG | Intention to grant announced |
Effective date: 20160902 |
|
| GRAS | Grant fee paid |
Free format text: ORIGINAL CODE: EPIDOSNIGR3 |
|
| GRAA | (expected) grant |
Free format text: ORIGINAL CODE: 0009210 |
|
| AK | Designated contracting states |
Kind code of ref document: B1 Designated state(s): AT BE BG CH CY CZ DE DK EE ES FI FR GB GR HR HU IE IS IT LI LT LU LV MC MK MT NL NO PL PT RO SE SI SK SM TR |
|
| REG | Reference to a national code |
Ref country code: GB Ref legal event code: FG4D |
|
| REG | Reference to a national code |
Ref country code: CH Ref legal event code: EP |
|
| REG | Reference to a national code |
Ref country code: AT Ref legal event code: REF Ref document number: 864451 Country of ref document: AT Kind code of ref document: T Effective date: 20170215 |
|
| REG | Reference to a national code |
Ref country code: IE Ref legal event code: FG4D |
|
| REG | Reference to a national code |
Ref country code: SE Ref legal event code: TRGR |
|
| REG | Reference to a national code |
Ref country code: DE Ref legal event code: R096 Ref document number: 602010039797 Country of ref document: DE |
|
| REG | Reference to a national code |
Ref country code: LT Ref legal event code: MG4D |
|
| REG | Reference to a national code |
Ref country code: NL Ref legal event code: MP Effective date: 20170125 |
|
| REG | Reference to a national code |
Ref country code: AT Ref legal event code: MK05 Ref document number: 864451 Country of ref document: AT Kind code of ref document: T Effective date: 20170125 |
|
| PG25 | Lapsed in a contracting state [announced via postgrant information from national office to epo] |
Ref country code: NL Free format text: LAPSE BECAUSE OF FAILURE TO SUBMIT A TRANSLATION OF THE DESCRIPTION OR TO PAY THE FEE WITHIN THE PRESCRIBED TIME-LIMIT Effective date: 20170125 |
|
| PG25 | Lapsed in a contracting state [announced via postgrant information from national office to epo] |
Ref country code: GR Free format text: LAPSE BECAUSE OF FAILURE TO SUBMIT A TRANSLATION OF THE DESCRIPTION OR TO PAY THE FEE WITHIN THE PRESCRIBED TIME-LIMIT Effective date: 20170426 Ref country code: IS Free format text: LAPSE BECAUSE OF FAILURE TO SUBMIT A TRANSLATION OF THE DESCRIPTION OR TO PAY THE FEE WITHIN THE PRESCRIBED TIME-LIMIT Effective date: 20170525 Ref country code: HR Free format text: LAPSE BECAUSE OF FAILURE TO SUBMIT A TRANSLATION OF THE DESCRIPTION OR TO PAY THE FEE WITHIN THE PRESCRIBED TIME-LIMIT Effective date: 20170125 Ref country code: FI Free format text: LAPSE BECAUSE OF FAILURE TO SUBMIT A TRANSLATION OF THE DESCRIPTION OR TO PAY THE FEE WITHIN THE PRESCRIBED TIME-LIMIT Effective date: 20170125 Ref country code: LT Free format text: LAPSE BECAUSE OF FAILURE TO SUBMIT A TRANSLATION OF THE DESCRIPTION OR TO PAY THE FEE WITHIN THE PRESCRIBED TIME-LIMIT Effective date: 20170125 Ref country code: NO Free format text: LAPSE BECAUSE OF FAILURE TO SUBMIT A TRANSLATION OF THE DESCRIPTION OR TO PAY THE FEE WITHIN THE PRESCRIBED TIME-LIMIT Effective date: 20170425 |
|
| PG25 | Lapsed in a contracting state [announced via postgrant information from national office to epo] |
Ref country code: LV Free format text: LAPSE BECAUSE OF FAILURE TO SUBMIT A TRANSLATION OF THE DESCRIPTION OR TO PAY THE FEE WITHIN THE PRESCRIBED TIME-LIMIT Effective date: 20170125 Ref country code: BG Free format text: LAPSE BECAUSE OF FAILURE TO SUBMIT A TRANSLATION OF THE DESCRIPTION OR TO PAY THE FEE WITHIN THE PRESCRIBED TIME-LIMIT Effective date: 20170425 Ref country code: PL Free format text: LAPSE BECAUSE OF FAILURE TO SUBMIT A TRANSLATION OF THE DESCRIPTION OR TO PAY THE FEE WITHIN THE PRESCRIBED TIME-LIMIT Effective date: 20170125 Ref country code: AT Free format text: LAPSE BECAUSE OF FAILURE TO SUBMIT A TRANSLATION OF THE DESCRIPTION OR TO PAY THE FEE WITHIN THE PRESCRIBED TIME-LIMIT Effective date: 20170125 Ref country code: PT Free format text: LAPSE BECAUSE OF FAILURE TO SUBMIT A TRANSLATION OF THE DESCRIPTION OR TO PAY THE FEE WITHIN THE PRESCRIBED TIME-LIMIT Effective date: 20170525 Ref country code: ES Free format text: LAPSE BECAUSE OF FAILURE TO SUBMIT A TRANSLATION OF THE DESCRIPTION OR TO PAY THE FEE WITHIN THE PRESCRIBED TIME-LIMIT Effective date: 20170125 |
|
| REG | Reference to a national code |
Ref country code: DE Ref legal event code: R097 Ref document number: 602010039797 Country of ref document: DE |
|
| PG25 | Lapsed in a contracting state [announced via postgrant information from national office to epo] |
Ref country code: CZ Free format text: LAPSE BECAUSE OF FAILURE TO SUBMIT A TRANSLATION OF THE DESCRIPTION OR TO PAY THE FEE WITHIN THE PRESCRIBED TIME-LIMIT Effective date: 20170125 Ref country code: IT Free format text: LAPSE BECAUSE OF FAILURE TO SUBMIT A TRANSLATION OF THE DESCRIPTION OR TO PAY THE FEE WITHIN THE PRESCRIBED TIME-LIMIT Effective date: 20170125 Ref country code: EE Free format text: LAPSE BECAUSE OF FAILURE TO SUBMIT A TRANSLATION OF THE DESCRIPTION OR TO PAY THE FEE WITHIN THE PRESCRIBED TIME-LIMIT Effective date: 20170125 Ref country code: SK Free format text: LAPSE BECAUSE OF FAILURE TO SUBMIT A TRANSLATION OF THE DESCRIPTION OR TO PAY THE FEE WITHIN THE PRESCRIBED TIME-LIMIT Effective date: 20170125 Ref country code: RO Free format text: LAPSE BECAUSE OF FAILURE TO SUBMIT A TRANSLATION OF THE DESCRIPTION OR TO PAY THE FEE WITHIN THE PRESCRIBED TIME-LIMIT Effective date: 20170125 |
|
| REG | Reference to a national code |
Ref country code: CH Ref legal event code: PL |
|
| PG25 | Lapsed in a contracting state [announced via postgrant information from national office to epo] |
Ref country code: SM Free format text: LAPSE BECAUSE OF FAILURE TO SUBMIT A TRANSLATION OF THE DESCRIPTION OR TO PAY THE FEE WITHIN THE PRESCRIBED TIME-LIMIT Effective date: 20170125 Ref country code: MC Free format text: LAPSE BECAUSE OF FAILURE TO SUBMIT A TRANSLATION OF THE DESCRIPTION OR TO PAY THE FEE WITHIN THE PRESCRIBED TIME-LIMIT Effective date: 20170125 Ref country code: DK Free format text: LAPSE BECAUSE OF FAILURE TO SUBMIT A TRANSLATION OF THE DESCRIPTION OR TO PAY THE FEE WITHIN THE PRESCRIBED TIME-LIMIT Effective date: 20170125 |
|
| PLBE | No opposition filed within time limit |
Free format text: ORIGINAL CODE: 0009261 |
|
| STAA | Information on the status of an ep patent application or granted ep patent |
Free format text: STATUS: NO OPPOSITION FILED WITHIN TIME LIMIT |
|
| GBPC | Gb: european patent ceased through non-payment of renewal fee |
Effective date: 20170425 |
|
| REG | Reference to a national code |
Ref country code: IE Ref legal event code: MM4A |
|
| REG | Reference to a national code |
Ref country code: FR Ref legal event code: ST Effective date: 20171130 |
|
| 26N | No opposition filed |
Effective date: 20171026 |
|
| PG25 | Lapsed in a contracting state [announced via postgrant information from national office to epo] |
Ref country code: FR Free format text: LAPSE BECAUSE OF NON-PAYMENT OF DUE FEES Effective date: 20170331 Ref country code: LU Free format text: LAPSE BECAUSE OF NON-PAYMENT OF DUE FEES Effective date: 20170308 |
|
| PG25 | Lapsed in a contracting state [announced via postgrant information from national office to epo] |
Ref country code: IE Free format text: LAPSE BECAUSE OF NON-PAYMENT OF DUE FEES Effective date: 20170308 Ref country code: CH Free format text: LAPSE BECAUSE OF NON-PAYMENT OF DUE FEES Effective date: 20170331 Ref country code: LI Free format text: LAPSE BECAUSE OF NON-PAYMENT OF DUE FEES Effective date: 20170331 Ref country code: GB Free format text: LAPSE BECAUSE OF NON-PAYMENT OF DUE FEES Effective date: 20170425 Ref country code: SI Free format text: LAPSE BECAUSE OF FAILURE TO SUBMIT A TRANSLATION OF THE DESCRIPTION OR TO PAY THE FEE WITHIN THE PRESCRIBED TIME-LIMIT Effective date: 20170125 |
|
| REG | Reference to a national code |
Ref country code: BE Ref legal event code: MM Effective date: 20170331 |
|
| PG25 | Lapsed in a contracting state [announced via postgrant information from national office to epo] |
Ref country code: BE Free format text: LAPSE BECAUSE OF NON-PAYMENT OF DUE FEES Effective date: 20170331 |
|
| PG25 | Lapsed in a contracting state [announced via postgrant information from national office to epo] |
Ref country code: MT Free format text: LAPSE BECAUSE OF NON-PAYMENT OF DUE FEES Effective date: 20170308 |
|
| PGFP | Annual fee paid to national office [announced via postgrant information from national office to epo] |
Ref country code: DE Payment date: 20190321 Year of fee payment: 10 |
|
| PGFP | Annual fee paid to national office [announced via postgrant information from national office to epo] |
Ref country code: SE Payment date: 20190320 Year of fee payment: 10 |
|
| PG25 | Lapsed in a contracting state [announced via postgrant information from national office to epo] |
Ref country code: HU Free format text: LAPSE BECAUSE OF FAILURE TO SUBMIT A TRANSLATION OF THE DESCRIPTION OR TO PAY THE FEE WITHIN THE PRESCRIBED TIME-LIMIT; INVALID AB INITIO Effective date: 20100308 |
|
| PG25 | Lapsed in a contracting state [announced via postgrant information from national office to epo] |
Ref country code: CY Free format text: LAPSE BECAUSE OF NON-PAYMENT OF DUE FEES Effective date: 20170125 |
|
| PG25 | Lapsed in a contracting state [announced via postgrant information from national office to epo] |
Ref country code: MK Free format text: LAPSE BECAUSE OF FAILURE TO SUBMIT A TRANSLATION OF THE DESCRIPTION OR TO PAY THE FEE WITHIN THE PRESCRIBED TIME-LIMIT Effective date: 20170125 |
|
| PG25 | Lapsed in a contracting state [announced via postgrant information from national office to epo] |
Ref country code: TR Free format text: LAPSE BECAUSE OF FAILURE TO SUBMIT A TRANSLATION OF THE DESCRIPTION OR TO PAY THE FEE WITHIN THE PRESCRIBED TIME-LIMIT Effective date: 20170125 |
|
| REG | Reference to a national code |
Ref country code: DE Ref legal event code: R119 Ref document number: 602010039797 Country of ref document: DE |
|
| PG25 | Lapsed in a contracting state [announced via postgrant information from national office to epo] |
Ref country code: DE Free format text: LAPSE BECAUSE OF NON-PAYMENT OF DUE FEES Effective date: 20201001 Ref country code: SE Free format text: LAPSE BECAUSE OF NON-PAYMENT OF DUE FEES Effective date: 20200309 |