EP2391887B1 - Image-based risk score-a prognostic predictor of survival and outcome from digital histopathology - Google Patents
Image-based risk score-a prognostic predictor of survival and outcome from digital histopathology Download PDFInfo
- Publication number
- EP2391887B1 EP2391887B1 EP10736572.8A EP10736572A EP2391887B1 EP 2391887 B1 EP2391887 B1 EP 2391887B1 EP 10736572 A EP10736572 A EP 10736572A EP 2391887 B1 EP2391887 B1 EP 2391887B1
- Authority
- EP
- European Patent Office
- Prior art keywords
- image
- nuclei
- cancer
- embedding
- histopathology
- Prior art date
- Legal status (The legal status is an assumption and is not a legal conclusion. Google has not performed a legal analysis and makes no representation as to the accuracy of the status listed.)
- Not-in-force
Links
Images




Classifications
-
- G—PHYSICS
- G06—COMPUTING OR CALCULATING; COUNTING
- G06T—IMAGE DATA PROCESSING OR GENERATION, IN GENERAL
- G06T7/00—Image analysis
- G06T7/0002—Inspection of images, e.g. flaw detection
- G06T7/0012—Biomedical image inspection
-
- G—PHYSICS
- G06—COMPUTING OR CALCULATING; COUNTING
- G06F—ELECTRIC DIGITAL DATA PROCESSING
- G06F18/00—Pattern recognition
- G06F18/20—Analysing
- G06F18/24—Classification techniques
- G06F18/241—Classification techniques relating to the classification model, e.g. parametric or non-parametric approaches
- G06F18/2415—Classification techniques relating to the classification model, e.g. parametric or non-parametric approaches based on parametric or probabilistic models, e.g. based on likelihood ratio or false acceptance rate versus a false rejection rate
-
- G—PHYSICS
- G06—COMPUTING OR CALCULATING; COUNTING
- G06V—IMAGE OR VIDEO RECOGNITION OR UNDERSTANDING
- G06V10/00—Arrangements for image or video recognition or understanding
- G06V10/70—Arrangements for image or video recognition or understanding using pattern recognition or machine learning
- G06V10/764—Arrangements for image or video recognition or understanding using pattern recognition or machine learning using classification, e.g. of video objects
-
- G—PHYSICS
- G06—COMPUTING OR CALCULATING; COUNTING
- G06V—IMAGE OR VIDEO RECOGNITION OR UNDERSTANDING
- G06V20/00—Scenes; Scene-specific elements
- G06V20/60—Type of objects
- G06V20/69—Microscopic objects, e.g. biological cells or cellular parts
- G06V20/698—Matching; Classification
-
- G—PHYSICS
- G06—COMPUTING OR CALCULATING; COUNTING
- G06T—IMAGE DATA PROCESSING OR GENERATION, IN GENERAL
- G06T2207/00—Indexing scheme for image analysis or image enhancement
- G06T2207/30—Subject of image; Context of image processing
- G06T2207/30004—Biomedical image processing
- G06T2207/30024—Cell structures in vitro; Tissue sections in vitro
-
- G—PHYSICS
- G06—COMPUTING OR CALCULATING; COUNTING
- G06T—IMAGE DATA PROCESSING OR GENERATION, IN GENERAL
- G06T2207/00—Indexing scheme for image analysis or image enhancement
- G06T2207/30—Subject of image; Context of image processing
- G06T2207/30004—Biomedical image processing
- G06T2207/30096—Tumor; Lesion
Definitions
- This invention concerns a computer-aided prognosis (CAP) system and method that employs quantitatively derived image information to predict pathological processes, disease outcome and patient survival. While digital pathology has made tissue specimens amenable to computer-aided diagnosis (CAD) for disease detection, the CAP system and method of the present invention predicts disease outcome and patient survival.
- CAP computer-aided prognosis
- the present invention details an automated, computerized system and method for analyzing histopathology imagery that will produce a quantitative and reproducible metric, i.e. Image-based Risk Score, for predicting disease outcome and patient survival.
- Image-based Risk Score a quantitative and reproducible metric
- BC Breast cancer
- One embodiment of the present invention involves a subset of BC that comprises cancer cells that have not spread to the lymph nodes and with overexpression of the estrogen receptor (LN-, ER+ BC).
- LN-, ER+ BC the estrogen receptor
- the Oncotype DX gene expression assay produces a Recurrence Score (RS) between 0-100 that is positively correlated to the likelihood for distant recurrence and the expected benefit from chemotherapy [1].
- RS Recurrence Score
- a second embodiment of the present invention involves a subset of invasive BC that includes the presence of lymphocytic infiltration (LI) and exhibits amplification of the HER2 gene (HER2+ BC).
- Most HER2+ BC is currently treated with agents that specifically target the HER2 protein.
- LI lymphocytic infiltration
- HER2+ BC is currently treated with agents that specifically target the HER2 protein.
- researchers have shown that the presence of LI in histopathology is a viable prognostic indicator for various cancers, including HER2+ BC [13]-[15].
- the function of LI as a potential antitumor mechanism in BC was first shown by Aaltomaa et al. [14]. More recently, Alexe et al. [15] demonstrated a correlation between the presence of high levels of LI and tumor recurrence in early stage HER2+ BC.
- Pathologists do not routinely report on the presence of LI, especially in HER2+ BC. A possible reason for this is that pathologists currently lack
- CADx computer-aided diagnosis
- ROI regions of interest
- the methods for both applications use image-based features to discriminate between 2 classes: either normal and benign regions or low and high grade ROIs.
- size and shape of cancer nuclei have been shown to distinguish low and high grade histology images [16], [9].
- Textural features and filter banks have also been employed [16]-[19], [21] to model the phenotypic appearance of BC histopathology.
- the present invention relates to an image-based computer-aided prognosis (CAP) system that predict disease outcome and patient survival from digitized histopathology imagery.
- CAP computer-aided prognosis
- the present invention details an automated, computerized system and method for analyzing histopathology imagery that will produce a quantitative and reproducible metric, i.e. Image-based Risk Score, for predicting disease outcome and patient survival.
- the present invention relates to an image-based computer-aided prognosis (CAP) system and method that seeks to replicate the prognostic power of molecular assays in histopathology and pathological processes, including but not limited to cancer.
- CAP computer-aided prognosis
- an image-based computer-aided prognosis (CAP) system and method that seeks to replicate the prognostic power of molecular assays in cancer histopathology is developed.
- the system and method of the present invention involves first semi-automatically detecting BC nuclei via an Expectation Maximization driven algorithm. Using the nuclear centroids, two graphs (Delaunay Triangulation and Minimum Spanning Tree) are constructed and a total of 12 features are extracted from each image.
- a non-linear dimensionality reduction system and method, Graph Embedding projects the image-derived features into a low-dimensional space, and a Support Vector Machine classifies the BC images in the reduced dimensional space.
- the image-based CAP system and method of the present invention aims to overcome many of the drawbacks associated with Oncotype DX, including the high cost associated with the assay; limited laboratory facilities with specialized equipment, and length of time between biopsy and prognostic prediction.
- the present invention involves key methodological contributions and the use of several state of the art machine learning system and methods, including, but not limited to: a robust, efficient method to automatically detect BC nuclei; image features to describe the architectural arrangement of BC nuclei and hence, quantitatively describe cancer grade, and the use of non-linear dimensionality reduction to classify and visualize the underlying biological data structure in a low-dimensional representation.
- EM Expectation Maximization
- the present invention derives architectural features to characterize the arrangement of BC nuclei and hence capture BC grade.
- a computerized system and method is disclosed to automatically detect and grade the extent of LI in digitized HER2+ BC histopathology.
- Lymphocytes are first automatically detected by a combination of region growing and Markov Random Field algorithms. Using the centers of individual detected lymphocytes as vertices, three graphs (Voronoi Diagram, Delaunay Triangulation, and Minimum Spanning Tree) are constructed and a total of 50 image-derived features describing the arrangement of the lymphocytes are extracted from each sample.
- a non-linear dimensionality reduction system and method, Graph Embedding is then used to project the high-dimensional feature vector into a reduced 3D embedding space.
- a Support Vector Machine classifier is used to discriminate samples with high and low LI in the reduced dimensional embedding space.
- An embodiment of the present invention relates to an image-based risk score predictor method for measuring cancer extent to evaluate disease outcome in cancer patients using digitized histopathology comprising: i. scanning stained histopathology slides into a computer using a high resolution whole slide scanner; ii. detecting cancer nuclei using an Expectation-Maximization based algorithm; iii. constructing the Delaunay Triangulation and Minimum Spanning Tree graphs using the centers of individual detected cancer nuclei as vertices; iv. extracting image-derived features describing the arrangement of the cancer nuclei from each image; v. projecting high-dimensional image derived feature vector into a reduced 3D embedding space via Graph Embedding; vi.
- An embodiment of the present invention relates to an image-based risk score predictor method for measuring extent of pathological processes to evaluate disease outcome in patients using digitized histopathology comprising:i. scanning stained histopathology slides into a computer using a high resolution whole slide scanner; ii. detecting pathological nuclei using an Expectation-Maximization based algorithm; iii. constructing the Delaunay Triangulation and Minimum Spanning Tree graphs using the centers of individual detected pathological nuclei as vertices; iv. extracting image-derived features describing the arrangement of the pathological nuclei from each image; v. projecting high-dimensional image derived feature vector into a reduced 3D embedding space via Graph Embedding; vi.
- An embodiment of the present invention relates to an image-based risk score predictor method for measuring cancer extent to evaluate disease outcome in node-negative, estrogen receptor-positive breast cancer patients using digitized histopathology comprising: i. scanning stained histopathology slides into a computer using a high resolution whole slide scanner; ii. detecting cancer nuclei using an Expectation-Maximization based algorithm; iii. constructing the Delaunay Triangulation and Minimum Spanning Tree graphs using the centers of individual detected cancer nuclei as vertices; iv. extracting image-derived features describing the arrangement of the cancer nuclei from each image; v. projecting high-dimensional image derived feature vector into a reduced 3D embedding space via Graph Embedding; vi.
- An embodiment of the present invention relates to a method for measuring extent of lymphocytic infiltration to evaluate disease outcome in breast cancer patients expressing the human epidermal growth factor receptor 2 (HER2) comprising: i. scanning stained histopathology slides into a computer using a high resolution whole slide scanner; ii. detecting lymphocyte nuclei using a combination of region-growing and Markov Random Field algorithms; iii. constructing a Voronoi Diagram, Delaunay Triangulation, and Minimum Spanning Tree using the centers of individual detected lymphocyte nuclei as vertices; iv. extracting image-derived features describing the arrangement of the lymphocyte nuclei from each image; v. projecting high-dimensional image derived feature vector into a reduced 3D embedding space via Graph Embedding.
- HER2 human epidermal growth factor receptor 2
- An image analysis system that can reproducibly and quantitatively characterize tissue architecture can be used to predict patient outcome.
- the present invention relates to an image-based computer-aided prognosis (CAP) system and method that seeks to replicate the prognostic power of molecular assays in histopathology and pathological processes, including but not limited to cancer.
- CAP computer-aided prognosis
- the present invention involves key methodological contributions and the use of several state of the art machine learning system and methods, including, but not limited to: a robust, efficient method to automatically detect BC nuclei; image features to describe the architectural arrangement of histological structures; and the use of non-linear dimensionality reduction to classify and visualize the underlying biological data structure in a low-dimensional representation.
- the present invention relates to a semi-automated nuclear detection system and method based on the Expectation Maximization (EM) algorithm.
- the present invention relates to a semi-automated nuclear detection system and method based on the Expectation Maximization (EM) algorithm. Additional information regarding Expectation Maximiation algorithm may be found in: Fatakdawala, H., Basavanhally, A., Xu, J., Ganesan, S., Feldman, M., Tomaszewski, J., Madabhushi, A., Expectation Maximization driven Geodesic Active Contour with Overlap Resolution (EMaGACOR): Application to Lymphocyte Segmentation on Breast Cancer Histopathology, IEEE Trans. on Biomedical Engineering, 2010 (in press)”.
- architectural features are derived to characterize the arrangement of cancer nuclei, including but not limited to breast cancer nuclei.
- Doyle et al. [9] different graphs were constructed using BC nuclei as vertices and the quantitative features derived from these graphs were used to successfully stratify BC grade.
- Graph Embedding (GE) a nonparametric type of non-linear dimensionality reduction [9] is employed to project the image-derived features from each BC tissue specimen onto a reduced 3D space, and subsequently, down to a 1D line.
- a Support Vector Machine (SVM) classifier [10] is employed to evaluate the discriminability of the architectural features with respect to BC grade in the reduced 3D space.
- SVM Support Vector Machine
- image-based risk scores analogous to the Oncotype DX RS, for poor, intermediate, and good outcome.
- This image-based risk score predictor could potentially supplant Oncotype DX to predict BC outcome and survival.
- a computerized system and method is disclosed to automatically detect and grade the extent of LI in digitized HER2+ BC histopathology.
- Lymphocytes are first automatically detected by a combination of region growing and Markov Random Field algorithms. Using the centers of individual detected lymphocytes as vertices, three graphs (Voronoi Diagram, Delaunay Triangulation, and Minimum Spanning Tree) are constructed and a total of 50 image-derived features describing the arrangement of the lymphocytes are extracted from each sample.
- a non-linear dimensionality reduction system and method, Graph Embedding is then used to project the high-dimensional feature vector into a reduced 3D embedding space.
- a Support Vector Machine classifier is used to discriminate samples with high and low LI in the reduced dimensional embedding space.
- An embodiment of the present invention relates to an image-based risk score predictor method for measuring cancer extent to evaluate disease outcome in cancer patients using digitized histopathology comprising: i. scanning stained histopathology slides into a computer using a high resolution whole slide scanner; ii. detecting cancer nuclei using an Expectation-Maximization based algorithm; iii. constructing the Delaunay Triangulation and Minimum Spanning Tree graphs using the centers of individual detected cancer nuclei as vertices; iv. extracting image-derived features describing the arrangement of the cancer nuclei from each image; v. projecting high-dimensional image derived feature vector into a reduced 3D embedding space via Graph Embedding; vi.
- An embodiment of the present invention relates to an image-based risk score predictor method for measuring extent of pathological processes to evaluate disease outcome in patients using digitized histopathology comprising:i. scanning stained histopathology slides into a computer using a high resolution whole slide scanner; ii. detecting pathological nuclei using an Expectation-Maximization based algorithm; iii. constructing the Delaunay Triangulation and Minimum Spanning Tree graphs using the centers of individual detected pathological nuclei as vertices; iv. extracting image-derived features describing the arrangement of the pathological nuclei from each image; v. projecting high-dimensional image derived feature vector into a reduced 3D embedding space via Graph Embedding; vi.
- An embodiment of the present invention relates to an image-based risk score predictor method for measuring cancer extent to evaluate disease outcome in node-negative, estrogen receptor-positive breast cancer patients using digitized histopathology comprising: i. scanning stained histopathology slides into a computer using a high resolution whole slide scanner; ii. detecting cancer nuclei using an Expectation-Maximization based algorithm; iii. constructing the Delaunay Triangulation and Minimum Spanning Tree graphs using the centers of individual detected cancer nuclei as vertices; iv. extracting image-derived features describing the arrangement of the cancer nuclei from each image; v. projecting high-dimensional image derived feature vector into a reduced 3D embedding space via Graph Embedding; vi.
- An embodiment of the present invention relates to a method for measuring extent of lymphocytic infiltration to evaluate disease outcome in breast cancer patients expressing the human epidermal growth factor receptor 2 (HER2) comprising: i. scanning stained histopathology slides into a computer using a high resolution whole slide scanner; ii. detecting lymphocyte nuclei using a combination of region-growing and Markov Random Field algorithms; iii. constructing a Voronoi Diagram, Delaunay Triangulation, and Minimum Spanning Tree using the centers of individual detected lymphocyte nuclei as vertices; iv. extracting image-derived features describing the arrangement of the lymphocyte nuclei from each image; v. projecting high-dimensional image derived feature vector into a reduced 3D embedding space via Graph Embedding.
- HER2 human epidermal growth factor receptor 2
- the present invention relates to an image-based computer-aided prognosis (CAP) system and method that seeks to replicate the prognostic power of molecular assays in BC histopathology, Using only the tissue slide samples, a mechanism for digital slide scanning, and a computer, our image-based CAP system and method aims to overcome many of the drawbacks associated with Oncotype DX, including the high cost associated with the assay; limited laboratory facilities with specialized equipment, and length of time between biopsy and prognostic prediction.
- CAP computer-aided prognosis
- H & E hematoxylin and eosin stained breast histopathology images were collected from a cohort of 17 patients and scanned into a computer using a high resolution whole slide scanner at 20x optical magnification.
- Each is associated with an architectural feature set F( ), an Oncotype DX RS L RS C ⁇ 1,2 , ... , 100 , and BC grade L GR C ⁇ LG MG HG , where LG , MG , and HG represent low-, medium-, and high-grade cancer, respectively.
- the 37 samples were also classified based on their RS, where L RS is binned into good (RS ⁇ 22), intermediate (23 ⁇ RS ⁇ 30), and poor (31 ⁇ RS ⁇ 100) prognosis categories.
- K ⁇ 1,2,..., K ⁇ .
- ⁇ i ⁇ ⁇ i , ⁇ ⁇ i , p ⁇ i : ⁇ ⁇ , comprising the mean ⁇ ⁇ , covariance ⁇ ⁇ , and a priori probability p ⁇ at iteration i .
- the mixture is initialized to ⁇ 0 via K -means clustering of RGB values over all c ⁇ C .
- the Expectation step calculates the posterior probability p i ⁇
- g c p ⁇ i N g c
- ⁇ ⁇ i , ⁇ ⁇ i ⁇ j 1 K p j i N g c
- a total of 12 architectural features are extracted for each image based on the Delaunay Triangulation and a Minimum Spanning Tree [9] ( Figure 2 ). Below we describe the construction of these 2 graphs.
- a Delaunay graph ( Figure 2(b) ) is a spanning subgraph of that is easily calculated from the Voronoi Diagram .
- Each pixel c ⁇ C is linked to the nearest v ⁇ V (via Euclidean distance) and added to the associated polygon P ( v ) ⁇ P.
- the Delaunay graph is simply the dual graph of and is constructed such that if P ( v a ), P ( v b ) ⁇ P share a side, their nuclear centroids v a , v b ⁇ V are connected by an edge ( v a , v b ) ⁇ E D .
- the mean, standard deviation, minimum/maximum (min/max) ratio, and disorder are calculated for the side length and area of all triangles in , providing a set of 8 features f D for each C ⁇ Z .
- a spanning tree refers to any spanning subgraph of .
- the total weight ⁇ S for each subgraph is calculated by summing all individual weights W ⁇ W S .
- the Minimum Spanning Tree ( Figure 2(c) ) ⁇ S is the subgraph with the lowest total weight.
- the mean, standard deviation, min/max ratio, and disorder of the branch lengths in provide a set of 4 features f MST for each C ⁇ Z .
- GE Graph Embedding
- a support vector machine (SVM) classifier [10] is trained using image-derived features to distinguish images with different grades using a k -fold cross-validation system and method.
- the SVM classifier projects F(Z tra ) onto a higher dimensional space using a linear kernel and the hyperplane that most accurately separates the two classes is determined.
- the classifier is evaluated by projecting F(Z tes ) and comparing all C ⁇ Z tes to the hyperplane.
- Image C is said to be correctly classified if its SVM-derived class matches the clinician's ground truth label.
- SVM training is performed via stratified, randomized k -fold cross-validation algorithm, whereby Z is divided randomly into k subsets.
- the samples from k - 1 subsets are pooled into Z tra and the remaining subset is used as Z tes .
- a different subset is used as Z tes while the remaining subsets are used for Z tra .
- the 3D GE manifold can be "unwrapped" into a 1D (linear) space simply by selecting the image C 1 at one end of the manifold as an anchor point and using the Euclidean distance metric to find the next image nearest to it on the 3D manifold. By using C a as the new anchor point, this process is repeated until all C ⁇ Z are included. Thus the geodesic distances between all scenes C embedded on the manifold are determined and GE is again employed to project the data down to a 1D line. By uncovering the grade (outcome) labels of the samples on this 1D projection and their relative locations, an image-based recurrence score can be determined to distinguish between low, intermediate, and high BC grades (and hence outcomes). For any new image C b projected onto this line, the relative distance of C b from poor, intermediate, and good outcome samples on the trained manifold will enable prediction of prognosis for C b .
- Figures 3(c), (d) represent the 1D projections of the 3D manifolds shown in Figures 3(a), (b) , respectively.
- the manifolds reveal a smooth, continuous progression from low to medium to high levels in terms of both RS and histological (grade) for all LN-, ER+ BC samples considered.
- the similarity between the 1D manifolds suggest that our image-based CAP system can be used to generate a prognostic assay to predict survival scores in much the same way as Oncotype DX.
- the present invention provides a computerized image analysis system and method that combines a region-growing algorithm with Maximum a Posteriori (MAP) estimation and Markov Random Field (MRF) theory [31].
- MAP Maximum a Posteriori
- MRF Markov Random Field
- MAP estimation improves detection specificity by incorporating size and luminance information from each detected object to temporarily label it as either a BC or lymphocyte nucleus (these being the 2 main classes of objects detected).
- MRF theory [31], [33] then allows us to improve lymphocyte detection specificity by modeling the infiltration phenomenon in terms of spatial proximity, whereby an object is more likely to be labeled as a lymphocyte nucleus if it is surrounded by other lymphocyte nuclei.
- the application of MRF is a unique step that exploits the spatial properties of LI to (1) distinguish nuclei that would be otherwise misclassified ( Figure 4(a) ) and ( 2 ) isolate infiltrating lymphocytes from the surrounding baseline level of lymphocytes.
- the present invention quantifies the extent of LI in HER2+ BC histopathology by extracting graph-based and nuclear features to characterize the architectural arrangement and morphological appearance of lymphocytes [9].
- Traditional textural signatures such as first order grey level features, second order Haralick statistics, and Gabor filter features were not considered in the present invention because they have been shown to be unsuitable for CADx applications in breast and prostate cancer that rely on spatial information [9], [35].
- a high-dimensional feature space also presents problems for data classification analysis.
- the curse of dimensionality [36] affects computational efficiency due to the exponential increase in data volume required for each additional feature.
- the present invention addresses both issues by utilizing Graph Embedding (GE) [9], [37], a nonparametric, non-linear dimensionality reduction system and method [38], to first project the image-derived features onto a reduced 3D space while simultaneously preserving object-class relationships.
- GE Graph Embedding
- SVM Support Vector Machine
- C C 1 , C 2 , ... , C M of images.
- CIE-Lab color space has the advantage of being more perceptually uniform and more robust to variations in staining and digitization than RGB space ( Figure 4 (a) ) [20], [40].
- N ⁇ n 1 , n 2 ,..., n N ⁇
- MAP Maximum a Posteriori
- MRF Markov Random Field
- lymphocyte nuclei in the luminance channel are identified as continuous, circular regions of low intensity circumscribed by sharp, well-defined boundaries ( Figure 4 ).
- the image scene C is convolved with a Gaussian (smoothing) kernel at multiple scales ⁇ G ⁇ ⁇ 6,7,8 ⁇ ⁇ m to account for variations in lymphocyte size. After convolution at each scale, valleys (i.e. the darkest pixels) are found on the smoothed image based on local differences in luminance.
- Gaussian smoothing
- Each n ⁇ N is grown into a corresponding region r ⁇ R using the 4-step procedure described below. Additional details on the region-growing system and method may be obtained from Reference [32].
- the initial lymphocyte detection is refined by incorporating domain knowledge regarding lymphocyte size, luminance, and spatial proximity.
- Each r ⁇ R has two associated random variables: X r ⁇ ⁇ ⁇ ⁇ ⁇ ⁇ b , ⁇ l ⁇ indicating its classification as either a breast cancer ( ⁇ b ) or lymphocyte ( ⁇ l ) nucleus and Y r ⁇ A r ⁇ r T ⁇ R + 2 denoting the two observed features
- is the cardinality of R , and g ⁇ 1 R ⁇ c ⁇ R g c is the average pixel intensity of R.
- y p x
- MAP Maximum a Posteriori
- Equation 3 1) Modeling Lymphocyte Features via Trained Probability Distributions:
- x) in Equation 3 is calculated from probability density functions (PDFs), where x is provided by manual delineation of lymphocytes in a training set. Under the assumption that y is independent and identically distributed, the likelihood term in Equation 3 can be simplified such that p y
- x ⁇ r ⁇ R p y r
- Each 2-dimensional probability density function is modeled as the product of two independent distributions: p ( y r
- x r ) F ( A r
- ⁇ b ) F ( A r
- ⁇ b ) F ( ⁇ r
- each region is classified as either a BC or lymphocyte nucleus ( Figures 8(d), (h) ).
- the regions labeled as BC nuclei are discarded, while centers of the L lymphocyte nuclei regions are computed and stored as
- the Delaunay graph ( Figures 10(c), (g) ) is a spanning subgraph of and the dual graph of [43]. It is constructed such that if P i , P j ⁇ P share a side, where i , j ⁇ ⁇ 1,2,..., L ⁇ , their nuclear centroids are connected by an edge o i o j ⁇ E D . The mean, standard deviation, min/max ratio, and disorder are calculated for the side length and area of all triangles in , yielding a set of 8 features (f D ) for each scene (Table II).
- a spanning tree refers to any spanning subgraph of [43].
- the total weight ⁇ S for each subgraph is determined by summing all individual weights W ⁇ W S .
- the Minimum Spanning Tree ( Figures 10(d), (h) ) is the spanning tree with the lowest total weight such that The mean, standard deviation, min/max ratio, and disorder of the branch lengths in yield a set of 4 features (f MST ) for each scene (Table II).
- the global density L C of lymphocyte nuclei is calculated for each scene , where L is the total number of detected lymphocytes and
- L is the total number of detected lymphocytes and
- For any nuclear centroid we define a corresponding nuclear neighborhood where ⁇ ⁇ ⁇ 10,20,...,50 ⁇ and
- 2 is the L2 norm.
- Graph Embedding is employed to non-linearly transform the high-dimensional set of image features into a low-dimensional embedding while preserving relative distances between images from the original feature space [9].
- the optimal embedding vector F' is obtained from the maximization of the following function, where is a diagonal matrix defined ⁇ a ⁇ 1,2 , ... , M as
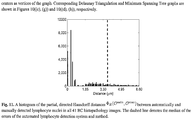
- the automated lymphocyte detection system and method is evaluated by the Hausdorff distance [44], a similarity measure used to compare the fidelity of automated detection against the "gold standard" obtained by manual inspection.
- Hausdorff distance a similarity measure used to compare the fidelity of automated detection against the "gold standard” obtained by manual inspection.
- image scene C lymphocyte centroids from the automated and manual detection system and methods are identified. The centroid locations in were estimated exhaustively by an expert pathologist who manually labeled the individual lymphocytes in each scene.
- the partial, directed Hausdorff distance is calculated for with respect to as,
- the SVM classifier [39] is employed to evaluate the ability of the image descriptors to discriminate between high and low levels of LI in HER2+ BC histopathology images.
- We construct the SVM classifier by using a Gaussian kernel function ⁇ to project training data Z tra ⁇ Z onto a higher-dimensional space. This high-dimensional representation allows the SVM to construct a hyperplane to separate the two classes (i.e. high and low LI).
- the classifier is then evaluated by projecting testing data Z tes ⁇ Z into the same space and recording the locations of the newly embedded samples with respect to the hyperplane.
- the general form of the SVM is given as, where ⁇ ⁇ ⁇ 1,2,..., ⁇ ⁇ represents the ⁇ marginal training samples (i.e. support vectors), b is the hyperplane bias estimated for Z tra , and ⁇ ⁇ is the model parameter determined by maximizing the objective function [38], [39].
- the true image label Y ( C b ) ⁇ ⁇ +1,-1 ⁇ represents a high or low level of LI as determined by an expert pathologist.
- Gaussian kernel has recently become popular for classification in a number of biomedical image processing applications [26], [45].
- Gaussian kernel is used instead of the traditional linear kernel [38] because its non-linear projection creates additional separation between the data points in the high-dimensional SVM space and hence, simplifies the classification task.
- One problem with the SVM classifier is that it is susceptible to bias from the arbitrary selection of training and testing samples [41].
- a k-fold cross-validation system and method [41] is used to mitigate this bias by selecting training samples in a randomized manner and running the SVM classifier multiple times.
- First Z is divided randomly into k subsets, while ensuring that images from each class Y ⁇ ⁇ +1,-1), are proportionally represented in each of the k subsets.
- binary classification is achieved by aggregating the samples labeled as medium LI with the low LI images. Hence the goal of the SVM classifier was to distinguish 22 high and 19 low LI samples.
- VZ Varma-Zisserman
- Table III shows the classification accuracies of the reduced feature set F'(Z) resulting from both automated and manual lymphocyte detection via the SVM classifier. Note that the classification accuracies and variances obtained from the automated detection (90.41% ⁇ 2,97%) and manual detection (94.59% ⁇ 1.72%) system and methods are comparable, reflecting the efficacy of our automated detection system and method. Table III also reveals that the unreduced architectural features F(Z) (via automated lymphocyte detection) achieve a classification accuracy of 89.71% ⁇ 2.83%, suggesting in turn that GE does not lead to any significant loss in class discriminatory information. Table 3.
- Figure 13 shows the reduced dimensional representation (3 dimensions) of the high dimensional architectural and VZ-texture feature spaces. Note that the 3 axes in each of Figures 13(a)-(d) reflect the principal Eigen vectors obtained embedding the data via GE. Reducing the architectural feature set to 3 dimensions via Graph Embedding reveals the progression from low to medium to high degrees of LI on a smooth, continuous manifold ( Figures 13(a), (b) ). Conversely, the VZ features ( Figures 13(c), (d) ) neither produce a continuous manifold, nor appear to stratify samples based on LI extent. The plots in Figure 13 further validate the quantitative classification results shown in Table III and reflect the efficacy of architectural image features in stratifying extent of LI.
- An embodiment of the present invention provides a quantitative CADx system for detecting and stratifying the extent of LI in digitized HER2+ BC histopathology images.
- a system and method is provided to automatically detect and grade the extent of LI using architectural features.
- non-linearly reducing the high-dimensional architectural image feature space reveals the presence of a smooth, continuous manifold on which BC samples with progressively increasing LI are arranged in a continuum.
- the region-growing algorithm and subsequent MRF-based refinement of the present invention provides for isolation of LI from the surrounding BC nuclei, stroma, and baseline level of lymphocytes.
- the ability of the image analysis algorithm of the present invention to stratify the extent of LI into low, medium, and high grades provides significant translational and prognostic significance, and could be developed into a prognostic test for predicting disease survival and patient outcome.
- the methods comprising the CADx system and method of the present invention may be employed to characterize LI extent in other tissues and diseases.
- the present invention relates to an image-based computer-aided prognosis (CAP) system and method that seeks to replicate the prognostic power of molecular assays in histopathology and pathological processes, including but not limited to cancer.
- CAP computer-aided prognosis
Landscapes
- Engineering & Computer Science (AREA)
- Theoretical Computer Science (AREA)
- Physics & Mathematics (AREA)
- General Physics & Mathematics (AREA)
- General Health & Medical Sciences (AREA)
- Health & Medical Sciences (AREA)
- Computer Vision & Pattern Recognition (AREA)
- Medical Informatics (AREA)
- Multimedia (AREA)
- Evolutionary Computation (AREA)
- Artificial Intelligence (AREA)
- Life Sciences & Earth Sciences (AREA)
- Nuclear Medicine, Radiotherapy & Molecular Imaging (AREA)
- Quality & Reliability (AREA)
- Radiology & Medical Imaging (AREA)
- Data Mining & Analysis (AREA)
- Molecular Biology (AREA)
- Software Systems (AREA)
- Databases & Information Systems (AREA)
- Computing Systems (AREA)
- Biomedical Technology (AREA)
- Bioinformatics & Computational Biology (AREA)
- Evolutionary Biology (AREA)
- General Engineering & Computer Science (AREA)
- Bioinformatics & Cheminformatics (AREA)
- Probability & Statistics with Applications (AREA)
- Investigating Or Analysing Biological Materials (AREA)
- Measuring Or Testing Involving Enzymes Or Micro-Organisms (AREA)
- Image Processing (AREA)
Description
- This application claims priority to
U.S. Provisional Patent Application No. 61/149,158 filed on February 2, 2009 - This invention concerns a computer-aided prognosis (CAP) system and method that employs quantitatively derived image information to predict pathological processes, disease outcome and patient survival. While digital pathology has made tissue specimens amenable to computer-aided diagnosis (CAD) for disease detection, the CAP system and method of the present invention predicts disease outcome and patient survival.
- The current gold standard in identifying many disease states is the subjective visual interpretation of microscopic histology of fixed tissue sections of the involved organ. Examples of this include the diagnosis of cancer as well as many inflammatory and degenerative diseases. Over the past decade, the increasing ability to assay genomic information led to improved classification of a variety of pathological processes using diagnostic, prognostic patterns of gene expression and/or genomic changes.
- Prior techniques are described in the following publications:
International patent applicationWO2007/059629 ; International patent applicationWO2007073220 ; US patent applicationUS2004/122790 ; and US patent applicationUS2006/098871 . - The present invention details an automated, computerized system and method for analyzing histopathology imagery that will produce a quantitative and reproducible metric, i.e. Image-based Risk Score, for predicting disease outcome and patient survival. Following are two specific embodiments of the present invention that use breast cancer as a model disease state where well-validated gene expression-based classifiers have led to significant clinical impact.
- Breast cancer (BC) is one of the leading causes of cancer-related deaths in women, with an estimated annual incidence greater than 192,000 in the United States in 2009 (source: American Cancer Society).
- One embodiment of the present invention involves a subset of BC that comprises cancer cells that have not spread to the lymph nodes and with overexpression of the estrogen receptor (LN-, ER+ BC). Although cases of LN-, ER+ BC are treated with a combination of chemotherapy and adjuvant hormone therapy, the specific prognosis and treatment is often determined by the Oncotype DX gene expression assay [1]. The Oncotype DX gene expression assay produces a Recurrence Score (RS) between 0-100 that is positively correlated to the likelihood for distant recurrence and the expected benefit from chemotherapy [1].
- The manual detection of BC nuclei in histopathology is a tedious and time-consuming process that is unfeasible in the clinical setting. Previous approaches to cell segmentation - thresholding [2], clustering [3], and active contour models [4] - are not very robust to the highly variable shapes and sizes of BC nuclei, as well as artifacts in the histological fixing, staining, and digitization processes.
- Previous work [1] has shown that the Oncotype DX RS is correlated with BC grade. Cancer grade reflects the architectural arrangement of the tissue and is correlated with survival (high grade implies poor outcome). Pathologists often disagree on the grade of a BC study. With the recent advent of digital pathology, researchers have begun to explore automated image analysis of BC histopathology. Wolberg et al. [6] used nuclear features from manually segmented BC nuclei to distinguish benign and malignant images. Bilgin et al. [7] explored the use of hierarchical graphs to model the architecture of BC histopathology. Textural features were used by Hall et al. [8] to examine variations in immunohistochemical staining.
- A second embodiment of the present invention involves a subset of invasive BC that includes the presence of lymphocytic infiltration (LI) and exhibits amplification of the HER2 gene (HER2+ BC). Most HER2+ BC is currently treated with agents that specifically target the HER2 protein. Researchers have shown that the presence of LI in histopathology is a viable prognostic indicator for various cancers, including HER2+ BC [13]-[15]. The function of LI as a potential antitumor mechanism in BC was first shown by Aaltomaa et al. [14]. More recently, Alexe et al. [15] demonstrated a correlation between the presence of high levels of LI and tumor recurrence in early stage HER2+ BC. Pathologists do not routinely report on the presence of LI, especially in HER2+ BC. A possible reason for this is that pathologists currently lack the automated image analysis tools to accurately, efficiently, and reproducibly quantify the presence and degree of LI in BC histopathology.
- While some researchers [9],[16]-[21] have recently begun to develop computer-aided diagnosis (CADx) system and methods for the analysis of digitized BC histopathology, they have mostly focused on either finding suspicious regions of interest (ROI) or have attempted to determine cancer grade from manually isolated ROIs. The methods for both applications use image-based features to discriminate between 2 classes: either normal and benign regions or low and high grade ROIs. Specifically, the size and shape of cancer nuclei have been shown to distinguish low and high grade histology images [16], [9]. Textural features and filter banks have also been employed [16]-[19], [21] to model the phenotypic appearance of BC histopathology.
- While several researchers have been developing algorithms for detection of nuclei [18], [23]-[29] in digitized histopathology, there have been no attempts to automatically detect or quantify extent of LI on BC histopathology. Some popular approaches to automated nuclear detection are based on adaptive thresholding [18], [23] and fuzzy c-means clustering [25], [27]. These techniques rely on differences in staining to distinguish nuclei from surrounding tissue. However, they are not appropriate for the task of LI detection due to the similarity in appearance between BC and lymphocyte nuclei (
Figure 4(a) ). Techniques such as active contours [24], [28], [29] have utilized gradient (edge) information to automatically isolate nuclei in histological images. These methods, however, might be limited in their ability to handle variations in the appearance of BC nuclei (Figures 4(b), (c) ) and image acquisition artifacts (Figures 4(e), (f) ). Some researchers have developed hybrid techniques in order to improve nuclear detection and segmentation results. For example, Glotsos et. al. [28] used Support Vector Machine clustering to improve initialization for active contour models. More recently, semi-automated probabilistic models have used pixel-wise intensity information to detect cancer [26] and lymphocyte nuclei [30] in digitized BC histopathology. Probabilistic models, however, are usually limited by the availability of expert-annotated training data. - Detection of lymphocytes alone, however, cannot completely characterize the abnormal LI phenotype because a baseline level of lymphocytes is present in all tissues. Gunduz et al. [20] explored automated cancer diagnosis by using hierarchical graphs to model tissue architecture, whereby a graph is defined as a set of vertices (nuclei) with corresponding edges connecting all nuclei.
- The present invention relates to an image-based computer-aided prognosis (CAP) system that predict disease outcome and patient survival from digitized histopathology imagery. The present invention details an automated, computerized system and method for analyzing histopathology imagery that will produce a quantitative and reproducible metric, i.e. Image-based Risk Score, for predicting disease outcome and patient survival.
- The present invention relates to an image-based computer-aided prognosis (CAP) system and method that seeks to replicate the prognostic power of molecular assays in histopathology and pathological processes, including but not limited to cancer.
- In an embodiment of the present invention, an image-based computer-aided prognosis (CAP) system and method that seeks to replicate the prognostic power of molecular assays in cancer histopathology is developed. The system and method of the present invention involves first semi-automatically detecting BC nuclei via an Expectation Maximization driven algorithm. Using the nuclear centroids, two graphs (Delaunay Triangulation and Minimum Spanning Tree) are constructed and a total of 12 features are extracted from each image. A non-linear dimensionality reduction system and method, Graph Embedding, projects the image-derived features into a low-dimensional space, and a Support Vector Machine classifies the BC images in the reduced dimensional space. Using only the tissue slide samples, a mechanism for digital slide scanning, and a computer, the image-based CAP system and method of the present invention aims to overcome many of the drawbacks associated with Oncotype DX, including the high cost associated with the assay; limited laboratory facilities with specialized equipment, and length of time between biopsy and prognostic prediction.
- The present invention involves key methodological contributions and the use of several state of the art machine learning system and methods, including, but not limited to: a robust, efficient method to automatically detect BC nuclei; image features to describe the architectural arrangement of BC nuclei and hence, quantitatively describe cancer grade, and the use of non-linear dimensionality reduction to classify and visualize the underlying biological data structure in a low-dimensional representation.
- It is an object of the present invention to provide a semi-automated nuclear detection system and method based on the Expectation Maximization (EM) algorithm.
- In accordance with the above object, the present invention derives architectural features to characterize the arrangement of BC nuclei and hence capture BC grade.
- In an embodiment of the present invention, a computerized system and method is disclosed to automatically detect and grade the extent of LI in digitized HER2+ BC histopathology. Lymphocytes are first automatically detected by a combination of region growing and Markov Random Field algorithms. Using the centers of individual detected lymphocytes as vertices, three graphs (Voronoi Diagram, Delaunay Triangulation, and Minimum Spanning Tree) are constructed and a total of 50 image-derived features describing the arrangement of the lymphocytes are extracted from each sample. A non-linear dimensionality reduction system and method, Graph Embedding, is then used to project the high-dimensional feature vector into a reduced 3D embedding space. A Support Vector Machine classifier is used to discriminate samples with high and low LI in the reduced dimensional embedding space.
- An embodiment of the present invention relates to an image-based risk score predictor method for measuring cancer extent to evaluate disease outcome in cancer patients using digitized histopathology comprising: i. scanning stained histopathology slides into a computer using a high resolution whole slide scanner; ii. detecting cancer nuclei using an Expectation-Maximization based algorithm; iii. constructing the Delaunay Triangulation and Minimum Spanning Tree graphs using the centers of individual detected cancer nuclei as vertices; iv. extracting image-derived features describing the arrangement of the cancer nuclei from each image; v. projecting high-dimensional image derived feature vector into a reduced 3D embedding space via Graph Embedding; vi. unwrapping the 3D embedding into a 1D scale to define image-based risk scores for poor, intermediate, and good outcome; vii. determining an image-based recurrence score to distinguish between low, intermediate, and high cancer grades by uncovering the grade labels of the samples on the 1D line and their relative locations to predict prognosis.
- An embodiment of the present invention relates to an image-based risk score predictor method for measuring extent of pathological processes to evaluate disease outcome in patients using digitized histopathology comprising:i. scanning stained histopathology slides into a computer using a high resolution whole slide scanner; ii. detecting pathological nuclei using an Expectation-Maximization based algorithm; iii. constructing the Delaunay Triangulation and Minimum Spanning Tree graphs using the centers of individual detected pathological nuclei as vertices; iv. extracting image-derived features describing the arrangement of the pathological nuclei from each image; v. projecting high-dimensional image derived feature vector into a reduced 3D embedding space via Graph Embedding; vi. unwrapping the 3D embedding into a 1D scale to define image-based risk scores for poor, intermediate, and good outcome; vii. determining an image-based recurrence score to distinguish between low, intermediate, and high cancer grades by uncovering the grade labels of the samples on the 1D line and their relative locations to predict prognosis.
- An embodiment of the present invention relates to an image-based risk score predictor method for measuring cancer extent to evaluate disease outcome in node-negative, estrogen receptor-positive breast cancer patients using digitized histopathology comprising: i. scanning stained histopathology slides into a computer using a high resolution whole slide scanner; ii. detecting cancer nuclei using an Expectation-Maximization based algorithm; iii. constructing the Delaunay Triangulation and Minimum Spanning Tree graphs using the centers of individual detected cancer nuclei as vertices; iv. extracting image-derived features describing the arrangement of the cancer nuclei from each image; v. projecting high-dimensional image derived feature vector into a reduced 3D embedding space via Graph Embedding; vi. unwrapping the 3D embedding into a 1D scale to define image-based risk scores for poor, intermediate, and good outcome; vii. determining an image-based recurrence score to distinguish between low, intermediate, and high cancer grades by uncovering the grade labels of the samples on the 1D line and their relative locations to predict prognosis.
- An embodiment of the present invention relates to a method for measuring extent of lymphocytic infiltration to evaluate disease outcome in breast cancer patients expressing the human epidermal growth factor receptor 2 (HER2) comprising: i. scanning stained histopathology slides into a computer using a high resolution whole slide scanner; ii. detecting lymphocyte nuclei using a combination of region-growing and Markov Random Field algorithms; iii. constructing a Voronoi Diagram, Delaunay Triangulation, and Minimum Spanning Tree using the centers of individual detected lymphocyte nuclei as vertices; iv. extracting image-derived features describing the arrangement of the lymphocyte nuclei from each image; v. projecting high-dimensional image derived feature vector into a reduced 3D embedding space via Graph Embedding.
-
-
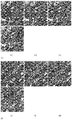
Fig. 1(a) depicts a LN-, ER+ BC histopathology image.Fig. 1 . (b) depicts a corresponding EM-based segmentation of BC nuclei. The segmentation inFig. 1(b) isFig. 1(c) smoothed to help detect individual nuclei.Fig. 1(d) depicts a final detected nuclear centroids (black dots) used for feature extraction. -
Fig. 2(a) and Fig. 2(d) depict low and high grade LN-, ER+ BC samples.Fig. 2(b) and Fig. 2(e) depict Delaunay Triangulation.Fig. 2(c) and Fig. 2(f) depict Minimum Spanning Tree graphs overlaid. -
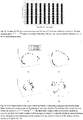
Fig. 3 depicts Graph Embedding plots of architectural features show clear separation of differentFig. 3. Fig 3(a) depicts BC grades.Fig. 3(b) depicts RS labels. The embeddings are projected into a 1D line, whereFig. 3(c) depicts BC grade andFig. 3(d) depicts RS defined by a single score. -
Fig. 4(a) depicts the similarity in appearance between a cancer cell nucleus and a lymphocyte nucleus. In general, lymphocyte nuclei are distinguished from cancer cell nuclei by their smaller size, more circular shape, and a darker, homogeneous staining. Additional challenges include variations in the appearance ofFig. 4(b), Fig. 4(c) depicts BC nuclei within a single histopathology slide,Fig. 4(d) depicts the presence of fat among cancerous tissue,Fig. 4(e) depicts histological fixing, andFig 4(f) depicts slide digitization artifacts. -
Fig. 5 depicts a flowchart illustrating the 4 main steps in the CADx system and method for LI-based stratification of HER2+ BC histopathology. Automated lymphocyte detection is followed by feature extraction of architectural and morphological features. The high-dimensional feature space is then non-linearly embedded into a reduced dimensional space via Graph Embedding, which allows for data visualization and subsequent evaluation via a SVM classifier. -
Fig. 6 depicts a flowchart illustrating the main steps in the automated lymphocyte detection system and method. -
Fig. 7 depicts a schematic illustrating the iterative growth of a region r. After initialization of the current region SCR (as depicted inFigure 7(a) ), current boundary S CB, and bounding box S BB, new pixels are added iteratively (as depicted inFigure 7(b) ). When a new pixel (outlined in white) is added to S CR, the boundaries S CB and S IB are adjusted accordingly as depicted inFigure 7(c) ). -
Fig. 8(a) and Fig. 8(e) depict luminance channels of two different HER2+ BC histopathology studies.Fig. 8(b) and Fig 8(f) depict corresponding initial region-growing based lymphocyte detection.Fig 8(c) and Fig. 8(g) depict preliminary Bayesian refinement showing detected BC nuclei (light circles) and detected lymphocyte nuclei (dark circles).Fig 8(d) and Fig 8(h) depict final lymphocyte detection result after the MRF pruning step. -
Fig. 9 depicts probability density functions (PDFs) estimated from empirical training data and modeled via weighted sum of gamma distributions forFig. 9 (a), Fig. 9 (c) ω ℓ andFig. 9 (b), Fig. 9 (d) ωb classes forFig. 9 (a), Fig. 9 (b) square root of area andFig. 9 (c), Fig. 9 (d) variance in luminance of each r ∈ R. In each distribution depicts inFigs. 9(a)-(d) , the estimated parametric model is overlaid. -
Fig. 10 depicts two different HER2+ breast cancer histopathology images withFig. 10 (a) high andFig. 10 (b) low levels of LI.Figures 10 ((b) andFig. 10 (f) ) show the corresponding Voronoi Diagrams constructed using the automatically detected lymphocyte centers as vertices of the graph. Corresponding Delaunay Triangulation and Minimum Spanning Tree graphs are shown inFigures 10 ((c), (g)) and 10((d), (h)), respectively. -
Fig. 11 depicts a histogram of the partial, directed Hausdorff distances
-
Fig. 12 depicts the mean (µ ACC) classification accuracy over 100 trials of 3-fold cross-validation is shown for different dimensionalities {2,3,...,10} obtained via Graph Embedding. The error bars represent standard deviation (σ ACC) of the classification accuracy. -
Fig. 13 depicts all 41 images plotted in the Graph Embedding reduced 3-dimensional Eigen space for the architectural feature set derived fromFig. 13(a) manual andFig. 13(b) automated lymphocyte detection. Embeddings of the Varma-Zisserman features are shown forFig. 13(c) K = 3 andFig. 13(d) K = 5. The labels denote samples with low LI (circles), medium LI, (squares), and high LI (triangles) as determined by an expert oncologist. Note that GE with the architectural features reveals the presence of an underlying manifold structure showing a smooth continuum of BC samples with low, medium, and high levels of LI. - An image analysis system that can reproducibly and quantitatively characterize tissue architecture can be used to predict patient outcome.
- The present invention relates to an image-based computer-aided prognosis (CAP) system and method that seeks to replicate the prognostic power of molecular assays in histopathology and pathological processes, including but not limited to cancer.
- The present invention involves key methodological contributions and the use of several state of the art machine learning system and methods, including, but not limited to: a robust, efficient method to automatically detect BC nuclei; image features to describe the architectural arrangement of histological structures; and the use of non-linear dimensionality reduction to classify and visualize the underlying biological data structure in a low-dimensional representation.
- The present invention relates to a semi-automated nuclear detection system and method based on the Expectation Maximization (EM) algorithm. The present invention relates to a semi-automated nuclear detection system and method based on the Expectation Maximization (EM) algorithm. Additional information regarding Expectation Maximiation algorithm may be found in: Fatakdawala, H., Basavanhally, A., Xu, J., Ganesan, S., Feldman, M., Tomaszewski, J., Madabhushi, A., Expectation Maximization driven Geodesic Active Contour with Overlap Resolution (EMaGACOR): Application to Lymphocyte Segmentation on Breast Cancer Histopathology, IEEE Trans. on Biomedical Engineering, 2010 (in press)".
- In the present invention, architectural features are derived to characterize the arrangement of cancer nuclei, including but not limited to breast cancer nuclei. In Doyle et al. [9], different graphs were constructed using BC nuclei as vertices and the quantitative features derived from these graphs were used to successfully stratify BC grade. In the present invention, Graph Embedding (GE), a nonparametric type of non-linear dimensionality reduction [9], is employed to project the image-derived features from each BC tissue specimen onto a reduced 3D space, and subsequently, down to a 1D line. A Support Vector Machine (SVM) classifier [10] is employed to evaluate the discriminability of the architectural features with respect to BC grade in the reduced 3D space. The further projection of the image data to a 1D line allows us to define image-based risk scores, analogous to the Oncotype DX RS, for poor, intermediate, and good outcome. This image-based risk score predictor could potentially supplant Oncotype DX to predict BC outcome and survival.
- In an embodiment of the present invention, a computerized system and method is disclosed to automatically detect and grade the extent of LI in digitized HER2+ BC histopathology. Lymphocytes are first automatically detected by a combination of region growing and Markov Random Field algorithms. Using the centers of individual detected lymphocytes as vertices, three graphs (Voronoi Diagram, Delaunay Triangulation, and Minimum Spanning Tree) are constructed and a total of 50 image-derived features describing the arrangement of the lymphocytes are extracted from each sample. A non-linear dimensionality reduction system and method, Graph Embedding, is then used to project the high-dimensional feature vector into a reduced 3D embedding space. A Support Vector Machine classifier is used to discriminate samples with high and low LI in the reduced dimensional embedding space.
- An embodiment of the present invention relates to an image-based risk score predictor method for measuring cancer extent to evaluate disease outcome in cancer patients using digitized histopathology comprising: i. scanning stained histopathology slides into a computer using a high resolution whole slide scanner; ii. detecting cancer nuclei using an Expectation-Maximization based algorithm; iii. constructing the Delaunay Triangulation and Minimum Spanning Tree graphs using the centers of individual detected cancer nuclei as vertices; iv. extracting image-derived features describing the arrangement of the cancer nuclei from each image; v. projecting high-dimensional image derived feature vector into a reduced 3D embedding space via Graph Embedding; vi. unwrapping the 3D embedding into a 1D scale to define image-based risk scores for poor, intermediate, and good outcome; vii. determining an image-based recurrence score to distinguish between low, intermediate, and high cancer grades by uncovering the grade labels of the samples on the 1D line and their relative locations to predict prognosis.
- An embodiment of the present invention relates to an image-based risk score predictor method for measuring extent of pathological processes to evaluate disease outcome in patients using digitized histopathology comprising:i. scanning stained histopathology slides into a computer using a high resolution whole slide scanner; ii. detecting pathological nuclei using an Expectation-Maximization based algorithm; iii. constructing the Delaunay Triangulation and Minimum Spanning Tree graphs using the centers of individual detected pathological nuclei as vertices; iv. extracting image-derived features describing the arrangement of the pathological nuclei from each image; v. projecting high-dimensional image derived feature vector into a reduced 3D embedding space via Graph Embedding; vi. unwrapping the 3D embedding into a 1D scale to define image-based risk scores for poor, intermediate, and good outcome; vii. determining an image-based recurrence score to distinguish between low, intermediate, and high cancer grades by uncovering the grade labels of the samples on the 1D line and their relative locations to predict prognosis.
- An embodiment of the present invention relates to an image-based risk score predictor method for measuring cancer extent to evaluate disease outcome in node-negative, estrogen receptor-positive breast cancer patients using digitized histopathology comprising: i. scanning stained histopathology slides into a computer using a high resolution whole slide scanner; ii. detecting cancer nuclei using an Expectation-Maximization based algorithm; iii. constructing the Delaunay Triangulation and Minimum Spanning Tree graphs using the centers of individual detected cancer nuclei as vertices; iv. extracting image-derived features describing the arrangement of the cancer nuclei from each image; v. projecting high-dimensional image derived feature vector into a reduced 3D embedding space via Graph Embedding; vi. unwrapping the 3D embedding into a 1D scale to define image-based risk scores for poor, intermediate, and good outcome; vii. determining an image-based recurrence score to distinguish between low, intermediate, and high cancer grades by uncovering the grade labels of the samples on the 1D line and their relative locations to predict prognosis.
- An embodiment of the present invention relates to a method for measuring extent of lymphocytic infiltration to evaluate disease outcome in breast cancer patients expressing the human epidermal growth factor receptor 2 (HER2) comprising: i. scanning stained histopathology slides into a computer using a high resolution whole slide scanner; ii. detecting lymphocyte nuclei using a combination of region-growing and Markov Random Field algorithms; iii. constructing a Voronoi Diagram, Delaunay Triangulation, and Minimum Spanning Tree using the centers of individual detected lymphocyte nuclei as vertices; iv. extracting image-derived features describing the arrangement of the lymphocyte nuclei from each image; v. projecting high-dimensional image derived feature vector into a reduced 3D embedding space via Graph Embedding.
- The present invention relates to an image-based computer-aided prognosis (CAP) system and method that seeks to replicate the prognostic power of molecular assays in BC histopathology, Using only the tissue slide samples, a mechanism for digital slide scanning, and a computer, our image-based CAP system and method aims to overcome many of the drawbacks associated with Oncotype DX, including the high cost associated with the assay; limited laboratory facilities with specialized equipment, and length of time between biopsy and prognostic prediction.
- A total of 37 hematoxylin and eosin (H & E) stained breast histopathology images were collected from a cohort of 17 patients and scanned into a computer using a high resolution whole slide scanner at 20x optical magnification. For all methods, we define the data set
 images, where an image

 is associated with an architectural feature set F(
 ), an Oncotype DX RS


- To segment BC nuclei, each image C is modeled as a Gaussian mixture of K = 5 components, where κ = {1,2,...,K}. We optimize the model parameter set

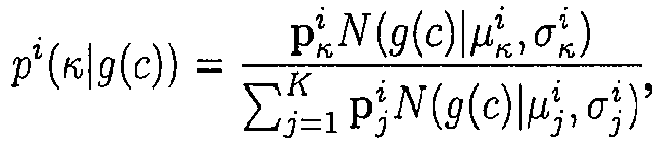
where N(g(c)|µκ , σκ ) represents the value of Gaussian component κ at intensity g(c). The Maximization step uses pi to calculate
 is the log likelihood of the Gaussian mixture model with parameters γi and ε = 10-5 is determined empirically. Based on posterior probability, a grayscale "scene" over all

Figure 1(b) ) is saved for each κ = {1,2,...,K}. - The scene that best represents BC nuclei (
Figure 1(b) ) is selected manually and smoothed (Figure 1(c) ) to reduce intra-nuclear intensity variations. Morphological and connected component operations are then applied to identify individual objects corresponding to BC nuclei and the corresponding set of n nuclear centroids V = {v 1,v 2,...,vn } is found for each C ∈ Z (Figure 1(d) ). - A complete, undirected graph

Figure 2 ). Below we describe the construction of these 2 graphs. - A Delaunay graph

Figure 2(b) ) is a spanning subgraph ofthat is easily calculated from the Voronoi Diagram . Each
 is defined by a set of polygons P = {P(v 1), P(v 2),..., P(vn )} surrounding all nuclear centroids V. Each pixel c ∈ C is linked to the nearest v ∈ V (via Euclidean distance) and added to the associated polygon P(v) ∈ P. The Delaunay graphis simply the dual graph of
 and is constructed such that if P(va ), P(vb ) ∈ P share a side, their nuclear centroids v a, v b ∈ V are connected by an edge (v a, v b) ∈ E D . The mean, standard deviation, minimum/maximum (min/max) ratio, and disorder are calculated for the side length and area of all triangles in, providing a set of 8 features f D for each
- A spanning tree
 . The total weight Ŵ S for each subgraph is calculated by summing all individual weights W ∈ W S . The Minimum Spanning Tree (
Figure 2(c) ) provide a set of 4 features fMST for each

- We use Graph Embedding (GE) to transform the architectural feature set into a low-dimensional embedding [9]. For each


- Reducing the high-dimensional feature space to a 3D Eigen subspace allows us to evaluate the discriminability of the image-derived features in distinguishing samples with different cancer grade patterns and hence different prognoses.
- A support vector machine (SVM) classifier [10] is trained using image-derived features to distinguish images with different grades using a k-fold cross-validation system and method. The data set Z is divided into training Ztra and testing Ztes subsets, where Ztra ∩ Ztes = 0̸. The SVM classifier projects F(Ztra) onto a higher dimensional space using a linear kernel and the hyperplane that most accurately separates the two classes is determined. The classifier is evaluated by projecting F(Ztes) and comparing all C ∈ Ztes to the hyperplane. Image C is said to be correctly classified if its SVM-derived class matches the clinician's ground truth label.
- SVM training is performed via stratified, randomized k-fold cross-validation algorithm, whereby Z is divided randomly into k subsets. The samples from k - 1 subsets are pooled into Ztra and the remaining subset is used as Ztes. For each of the k iterations, a different subset is used as Ztes while the remaining subsets are used for Ztra. Using a value of k = 3, the entire cross-validation algorithm is repeated for 100 trials and the resulting mean µ ACC and standard deviation σ ACC of the classification accuracy are determined.
- The 3D GE manifold can be "unwrapped" into a 1D (linear) space simply by selecting the image C 1 at one end of the manifold as an anchor point and using the Euclidean distance metric to find the next image nearest to it on the 3D manifold. By using Ca as the new anchor point, this process is repeated until all C ∈ Z are included. Thus the geodesic distances between all scenes C embedded on the manifold are determined and GE is again employed to project the data down to a 1D line. By uncovering the grade (outcome) labels of the samples on this 1D projection and their relative locations, an image-based recurrence score can be determined to distinguish between low, intermediate, and high BC grades (and hence outcomes). For any new image Cb projected onto this line, the relative distance of Cb from poor, intermediate, and good outcome samples on the trained manifold will enable prediction of prognosis for Cb .
- A SVM trained via 3-fold cross-validation on the unreduced F and reduced (3D) F' architectural feature sets was able to distinguish high and low grade BC histopathology images with classification accuracies of 74.82% ± 5.74% and 84.12% ± 5.42%, respectively, over 100 runs (Table 1). These results appear to confirm that GE has embedded the architectural feature set without any significant loss of information. The success of the architectural features is confirmed qualitatively by the clear separation between high and low BC grade on the 3D manifold (
Figure 3(a) ).Table 1. µ ACC and σ ACC over 100 trials of 3-fold cross-validation for both automatically and manually detected BC nuclei. Results are reported for the original F and low-dimensional F' feature sets using both the RS (L RS) and cancer grade (L GR) labels. Automated Detection Manual Detection RS (F') 84.15% ± 3.10% 71.92% ± 4,66% Grade (F') 84.12% ± 5.42% 85.71% ± 4.89% RS (F) 84.56% ± 2.69% 71.65% ± 5.88% Grade (F) 74.82% ± 5.74% 85.00% ± 4.51% - Replacing the grade labels with the RS labels, the SVM trained via 3-fold cross-validation on F' and F yielded classification accuracies of 84.15% ± 3.10% and 84.56% ± 2.69%, respectively (Table 1). This shows that a correlation exists between molecular prognostic assays such as Oncotype DX and the spatial arrangement of nuclei and histological structures in BC histopathology. The 3D manifolds in
Figures 3(a) ,(b) reveal a similar underlying biological stratification that exists in BC grade and Oncotype DX RS, in turn suggesting that the quantitative image information employed to characterize BC grade could recapitulate the prognostic capabilities of Oncotype DX. The curvilinear 3D manifold on which the different BC grades (low to high) reside in a smooth continuum may potentially offer insight into BC biology as well. -
Figures 3(c), (d) represent the 1D projections of the 3D manifolds shown inFigures 3(a), (b) , respectively. The manifolds reveal a smooth, continuous progression from low to medium to high levels in terms of both RS and histological (grade) for all LN-, ER+ BC samples considered. The similarity between the 1D manifolds (Figures 3(c), (d) ) suggest that our image-based CAP system can be used to generate a prognostic assay to predict survival scores in much the same way as Oncotype DX. - The ability to automatically detect LI would be invaluable to BC pathologists and oncologists, since manual detection of individual lymphocyte nuclei in BC histopathology is a tedious and time-consuming process that is not feasible in the clinical setting. The availability of a computerized image analysis system and method for automated quantification of LI extent in HER2+ BC will enable development of an inexpensive image-based system for predicting disease survival and outcome.
- An important prerequisite for extracting histopathological image attributes to model BC appearance is the ability to automatically detect and segment histological structures, including nuclei and glands. Consequently the ability of an image analysis system and method to grade the extent of LI in a BC histopathology image is dependent on the algorithm's ability to automatically detect lymphocytes. Automated lymphocyte detection, however, is a non-trivial task complicated by the intrinsic similarity in appearance of BC nuclei and lymphocyte nuclei on hematoxylin and eosin (H & E) stained breast biopsy samples (
Figure 4(a) ). In addition, even within a particular slide, the morphology of BC nuclei is highly heterogeneous due to variations in cancer grade and mitotic phase (Figures 4(b), (c) ) [22]. Biological differences such as the presence of fat deposits (Figure 4(d) ) can confound algorithms that rely on boundary detection alone. Preparation issues such as "cutting artifact" (Figure 4(e) ) and digitization misalignment (Figure 4(f) ) lead to similar problems, but are more difficult to predict and correct for since they are unrelated to the underlying biology. - To address some of the challenges in automated detection of lymphocytes (as illustrated in
Figure 4 ), the present invention provides a computerized image analysis system and method that combines a region-growing algorithm with Maximum a Posteriori (MAP) estimation and Markov Random Field (MRF) theory [31]. First, all candidate BC and lymphocyte nuclei are detected via a region-growing algorithm that uses contrast measures to find optimal boundaries [31], [32]. By growing outward from the center of each nucleus, this technique is robust to artifacts outside of the nuclei (Figures 4(d)-(f) ). The region-growing algorithm has high detection sensitivity, resulting in a large number of lymphocyte and non-lymphocyte nuclei being detected. MAP estimation improves detection specificity by incorporating size and luminance information from each detected object to temporarily label it as either a BC or lymphocyte nucleus (these being the 2 main classes of objects detected). MRF theory [31], [33] then allows us to improve lymphocyte detection specificity by modeling the infiltration phenomenon in terms of spatial proximity, whereby an object is more likely to be labeled as a lymphocyte nucleus if it is surrounded by other lymphocyte nuclei. The application of MRF is a unique step that exploits the spatial properties of LI to (1) distinguish nuclei that would be otherwise misclassified (Figure 4(a) ) and (2 ) isolate infiltrating lymphocytes from the surrounding baseline level of lymphocytes. We achieve MAP estimation by using the Iterated Conditional Modes algorithm, a fast and simple method for maximizing the posterior probability that a detected object is indeed a lymphocyte [31], [34]. - The importance of using graph algorithms to quantitatively describe the spatial arrangement of nuclei in distinguishing cancer grade in both prostate cancer and BC histopathology has been previously shown [9], [35]. In [9], quantitative features derived from graphs (Voronoi Diagram, Delaunay Triangulation, and Minimum Spanning Tree) constructed using BC nuclei as vertices were used to successfully stratify low, intermediate, and high BC grade on digitized histopathology.
- The present invention quantifies the extent of LI in HER2+ BC histopathology by extracting graph-based and nuclear features to characterize the architectural arrangement and morphological appearance of lymphocytes [9]. Traditional textural signatures such as first order grey level features, second order Haralick statistics, and Gabor filter features were not considered in the present invention because they have been shown to be unsuitable for CADx applications in breast and prostate cancer that rely on spatial information [9], [35].
- While a large set of descriptive features is certainly desirable for modeling biological processes such as LI, a high-dimensional feature space also presents problems for data classification analysis. First, the curse of dimensionality [36] affects computational efficiency due to the exponential increase in data volume required for each additional feature. Further, it is impossible to directly visualize the relationships between images in a high-dimensional space. The present invention addresses both issues by utilizing Graph Embedding (GE) [9], [37], a nonparametric, non-linear dimensionality reduction system and method [38], to first project the image-derived features onto a reduced 3D space while simultaneously preserving object-class relationships. Thus, 2 samples with low levels of LI would be projected relatively close to each other and relatively farther from a sample with a high level of LI.
- A Support Vector Machine (SVM) classifier [38], [39] is then employed in the reduced dimensional space to discriminate between images with high and low LI. We have previously shown the utility of SVM classifiers in conjunction with architectural and morphological image features to distinguish malignant and benign BC samples and also for distinguishing between different grades of BC [9] and prostate cancer [35]. SVM results for our architectural features are also compared against results from the popular, unsupervised Varma-Zisserman (VZ) texton-based system and method.
- The main components of the methodology for automated detection and stratification of LI on BC histopathology of the present invention is illustrated in the flowchart in
Figure 5 . - A total of 41 hematoxylin and eosin (H & E) stained breast biopsy samples from 12 patients at The Cancer Institute of New Jersey (CINJ) were obtained and scanned into a computer using a high resolution whole slide scanner at 20x optical magnification (0.33 µm spatial resolution). The size of each image falls within 600 ≤ UX ≤ 700 and 500 ≤ UY ≤ 600, where UX and UY are the width and height, respectively, in pixels. These images were separated into 3 classes by a BC oncologist based on the extent of LI. The dataset comprises 22 low, 10 medium, and 9 high LI samples. For the purpose of quantitative classification (as described in Section VI-B), the oncologist separated the images into two classes comprising 22 low LI and 19 high LI samples, respectively.
- We define a dataset
 images. An image scene
 is a 2D set of pixels
Figure 4 (a) ) [20], [40].
- Beginning with a set of N candidate lymphocyte nuclear centers N = {n 1,n 2,...,nN }, we attempt to identify a set of L finalized lymphocyte nuclei with centers given by


Figure 6 ). - We first attempt to identify candidate image locations that could represent centers of lymphocytic nuclei. The region-growing algorithm exploits the fact that lymphocyte nuclei in the luminance channel are identified as continuous, circular regions of low intensity circumscribed by sharp, well-defined boundaries (
Figure 4 ). The image scene C is convolved with a Gaussian (smoothing) kernel at multiple scales σG ∈ {6,7,8} µm to account for variations in lymphocyte size. After convolution at each scale, valleys (i.e. the darkest pixels) are found on the smoothed image based on local differences in luminance. These valleys define a set of seed points N = {n 1,n 2,...,nN } that represent candidate lymphocyte centers on the original scene C. Each n ∈ N is grown into a corresponding region r ∈ R using the 4-step procedure described below. Additional details on the region-growing system and method may be obtained from Reference [32]. - Step 1: A set of current pixels S CR = {n} is initialized as shown in
Figure 7(a) . The current boundary S CB is defined as the set of 8-connected pixels surrounding S CR. A square bounding box S BB containing all pixels within a 12σG × 12σG neighborhood around n is then constructed. - Step 2: The pixel c ∈ S CB with the lowest intensity in the current boundary is identified. Pixel c is removed from S CB and added to S CR. The current boundary S CB is updated to include every pixel d ∈ S BB that is an 8-connected neighbor of c and d ∉ S CR. A set of internal boundary pixels S IB ⊂ S CR (
Figures 7(b), (c) ) is defined as all pixels in S CR that are 8-connected to any pixel in S CB. - Step 3:
g IB andg CB are computed as the mean intensity of pixels in S IB and S CB, respectively. The boundary strength is computed at each iteration asg IB -g CB. - Step 4:
Steps 
g IB -g CB is maximum (Figures 8(b), (f) ). - Since the region-growing procedure is repeated with seed points from a variety of smoothing scales σG ∈ {6,7,8} µm, overlapping regions are resolved by discarding the region with the lower boundary strength. For the sake of convenience we will refer to

- The initial lymphocyte detection is refined by incorporating domain knowledge regarding lymphocyte size, luminance, and spatial proximity. Each r ∈ R has two associated random variables: Xr ∈ Λ ≡ {ωb ,ω ℓ} indicating its classification as either a breast cancer (ωb ) or lymphocyte (ωℓ ) nucleus and


where Ar is the square root of nuclear area (Equation 1), σr is the standard deviation of luminance in the nuclear region (Equation 2), |R| is the cardinality of R, and



- The labels X = x, given the feature vectors Y = y, are estimated using Maximum a Posteriori (MAP) estimation [42], which advocates finding the x that maximizes the posterior probability

where p(y|x) is the likelihood term and p(x), p(y) are prior distributions for x and y, respectively. Since maximization ofEquation 3 is only with respect to x, the prior distribution p(y) is ignored. - 1) Modeling Lymphocyte Features via Trained Probability Distributions: The likelihood term p(y|x) in
Equation 3 is calculated from probability density functions (PDFs), where x is provided by manual delineation of lymphocytes in a training set. Under the assumption that y is independent and identically distributed, the likelihood term inEquation 3 can be simplified such that
- Each 2-dimensional probability density function (PDF) is modeled as the product of two independent distributions: p(yr |xr ) = F(Ar |xr )F(σ r |xr). Thus we require four one-dimensional PDFs F(Ar |ωb ), F(Ar |ωℓ ), F(σr |ωb ), and F(σr |ω ℓ) as shown in
Figure 9 . To reduce local irregularities and create a smooth, continuous distribution, the one-dimensional PDFs are modeled by mixtures of Gamma distributions [42]

Equation 3 and assign a tentative class xr ∈ {ωb ,ωℓ } to each r ∈ R (Figures 8(c), (g) ). - 2) Modeling Lymphocyte Proximity via Markov Random Fields: The prior distribution p(x) (Equation 3) is defined by a Markov Random Field (MRF). The Markov property [33] states that

where the neighborhood ηr is empirically assumed to contain all regions within a 30 µm radius of r, x-r = {xs : s ∈ R, s ≠ r}, and x ηr = {xs : s ∈ ηr }. We use the Iterated Conditional Modes (ICM) algorithm [34], a deterministic relaxation procedure, to perform MAP estimation (Equation 3) and assign a hard label xr ∈ {ωb ,ωℓ } to each r ∈ R. Thus each region is classified as either a BC or lymphocyte nucleus (Figures 8(d), (h) ). The regions labeled as BC nuclei are discarded, while centers of the L lymphocyte nuclei regions are computed and stored as
- We define the complete, undirected graph


 , Delaunay Triangulation
 , and Minimum Spanning Tree(
Figure 10 ). In addition, statistics describing the number and density of nuclei are calculated directly from.
- The Voronoi graph

Figures 10(b), (f) ) is a spanning subgraph ofdefined as a set of polygons P = {P 1,P 2,...,PL } surrounding all nuclear centroids[43]. Each pixel

- The Delaunay graph

Figures 10(c), (g) ) is a spanning subgraph ofand the dual graph of[43]. It is constructed such that if Pi , Pj ∈ P share a side, where i,j ∈ {1,2,...,L}, their nuclear centroids
 , yielding a set of 8 features (f D ) for each scene(Table II).
 - A spanning tree
 [43]. The total weight Ŵ S for each subgraph is determined by summing all individual weights W ∈ W S . The Minimum Spanning Tree(
Figures 10(d), (h) ) is the spanning tree with the lowest total weight such that yield a set of 4 features (fMST) for each scene(Table II).
 - The global density
 , where L is the total number of detected lymphocytes and || represents the number of pixels (cardinality) in. For any nuclear centroidwe define a corresponding nuclear neighborhood


- Graph Embedding (GE) is employed to non-linearly transform the high-dimensional set of image features into a low-dimensional embedding while preserving relative distances between images from the original feature space [9]. For each scene C, a 50-dimensional image feature set is defined as the superset F = {f v ,f D ,fMST,fNF} containing all features derived from the Voronoi Diagram, Delaunay Triangulation, Minimum Spanning Tree, and nuclear statistics. Given histopathology images Ca and Cb with corresponding image feature sets F(Ca ) and F(Cb ), where
 is constructed. The optimal embedding vector F' is obtained from the maximization of the following function,
 is a diagonal matrix defined


- The automated lymphocyte detection system and method is evaluated by the Hausdorff distance [44], a similarity measure used to compare the fidelity of automated detection against the "gold standard" obtained by manual inspection. For each image scene C, lymphocyte centroids from the automated
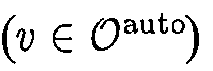
 were estimated exhaustively by an expert pathologist who manually labeled the individual lymphocytes in each scene. The partial, directed Hausdorff distance is calculated for
 with respect to
 as,
as,
- The SVM classifier [39] is employed to evaluate the ability of the image descriptors to discriminate between high and low levels of LI in HER2+ BC histopathology images. We construct the SVM classifier by using a Gaussian kernel function Π to project training data Ztra ⊂ Z onto a higher-dimensional space. This high-dimensional representation allows the SVM to construct a hyperplane to separate the two classes (i.e. high and low LI). The classifier is then evaluated by projecting testing data Ztes ⊂ Z into the same space and recording the locations of the newly embedded samples with respect to the hyperplane.
- Given BC histopathology images Ca , Cb ∈ Ztra with corresponding low-dimensional embedding vectors F'(Ca ) and F'(Cb ), a, b ∈ {1,2,...,M}, respectively, the Gaussian kernel Π(F'(Ca ),F'(Cb )) = exp(-ε(llF'(Ca - F'(Cb )||2)2), where ε is a scaling factor that normalizes F'(Ca ) and F'(Cb ), is used to project the data into the high-dimensional SVM space [27]. The general form of the SVM is given as,

- The Gaussian kernel has recently become popular for classification in a number of biomedical image processing applications [26], [45]. In an embodiment of the present invention, Gaussian kernel is used instead of the traditional linear kernel [38] because its non-linear projection creates additional separation between the data points in the high-dimensional SVM space and hence, simplifies the classification task.
- One problem with the SVM classifier is that it is susceptible to bias from the arbitrary selection of training and testing samples [41]. A k-fold cross-validation system and method [41] is used to mitigate this bias by selecting training samples in a randomized manner and running the SVM classifier multiple times. First Z is divided randomly into k subsets, while ensuring that images from each class Y ∈ {+1,-1), are proportionally represented in each of the k subsets. In an embodiment of the present invention, binary classification is achieved by aggregating the samples labeled as medium LI with the low LI images. Hence the goal of the SVM classifier was to distinguish 22 high and 19 low LI samples. All samples from k-1 subsets are pooled together to obtain Ztra and the remaining subset is used as Ztes. For each of the k iterations, an SVM classifier is trained with Ztra and evaluated on Ztes; a new Ztes and Ztra being chosen at each iteration so that all samples are evaluated. Using a value of k = 3, the entire cross-validation algorithm was repeated over 100 trials and the resulting mean (µ ACC) and standard deviation (σ ACC) of the classification accuracy obtained. Classification accuracy is defined as the ratio between the number of correctly classified images and the total number of images in the dataset.
- The performance of the architectural feature set was compared against the Varma-Zisserman (VZ) texton-based features [46] for distinguishing between the 41 low and high LI images in Z. Textons have previously been shown to be useful in applications related to content-based image retrieval [48] and computer-aided classification [49] for digitized cancer histopathology.
- Step 1: All


- Step 2: Feature vectors ftext of all


- Step 3: For each


- Step 4: For each novel image scene


 is identified based on

- The mean µ ACC and standard deviation σ ACC of the classification accuracy of the VZ-texton approach are calculated over 100 randomized 3-fold cross-validation trials (Table III). These experiments were repeated for K ∈ {2,3,5,10}.
- Over a total of


Figure 11 ). Considering an average lymphocyte diameter of approximately 7 µm, these results verify the ability of our detection system and method to accurately detect lymphocytic infiltration in HER2+ BC histopathology imagery. - Table III shows the classification accuracies of the reduced feature set F'(Z) resulting from both automated and manual lymphocyte detection via the SVM classifier. Note that the classification accuracies and variances obtained from the automated detection (90.41% ± 2,97%) and manual detection (94.59% ± 1.72%) system and methods are comparable, reflecting the efficacy of our automated detection system and method. Table III also reveals that the unreduced architectural features F(Z) (via automated lymphocyte detection) achieve a classification accuracy of 89.71% ± 2.83%, suggesting in turn that GE does not lead to any significant loss in class discriminatory information.
Table 3. Results of SVM classification accuracy (µ ACC, σ ACC) for 41 BC histopathology images using 100 3-fold cross-validation trials for automated and manual lymphocyte detection with the architectural (both reduced F' and unreduced F) and VZ image features. Feature Set Classification Accuracy (%) F'(Z) (automated detection) 90.41 ± 2.91 F'(Z) (manual detection) 94.59 ± 1.72 F(Z) (automated detection) 89.71 ± 2.83 F(Z) (manual detection) 99.59 ± 0.92 VZ (K = 2) 48.17 ± 6.08 VZ (K = 3) 60.20 ± 5.66 VZ (K = 5) 58.63 ± 7.11 VZ (K = 10) 56.17 ± 7.63 - In order to determine the optimal dimensionality for performing classification, the architectural feature set F(Z) was reduced to various dimensionalities {2,3,...,10} via Graph Embedding. For each dimensionality, the corresponding µ ACC and error bars (σ ACC) over 100 trials of randomized 3-fold cross-validation were calculated (
Figure 12). Figure 12 suggests that classification accuracy is stable at lower dimensionalities and drops off slightly at higher dimensionalities. - The classification results (Table III) show that the Varma-Zisserman (VZ) textural features did not perform as well as the architectural features in distinguishing between BC histopathology samples with high and low levels of LI, with a maximum classification accuracy of 60.20% ± 5.66%. This result suggests that texture descriptors are unable to quantitatively describe phenotypic changes due to variation in LI extent. Furthermore, both natural variations in histology and imperfections arising from slide preparation (
Figure 4 ) may have adversely affected the performance of textural features, since the dataset was not screened to exclude such samples. Conversely, architectural features remain unaffected by these issues because they exploit intrinsic properties such as lymphocyte size, shape, intensity, and arrangement to classify the BC histopathology images. - Apart from helping to deal with the curse of dimensionality problem for classification, another important application of GE is in its ability to help visualize the underlying structure of the data.
Figure 13 shows the reduced dimensional representation (3 dimensions) of the high dimensional architectural and VZ-texture feature spaces. Note that the 3 axes in each ofFigures 13(a)-(d) reflect the principal Eigen vectors obtained embedding the data via GE. Reducing the architectural feature set to 3 dimensions via Graph Embedding reveals the progression from low to medium to high degrees of LI on a smooth, continuous manifold (Figures 13(a), (b) ). Conversely, the VZ features (Figures 13(c), (d) ) neither produce a continuous manifold, nor appear to stratify samples based on LI extent. The plots inFigure 13 further validate the quantitative classification results shown in Table III and reflect the efficacy of architectural image features in stratifying extent of LI. - An embodiment of the present invention provides a quantitative CADx system for detecting and stratifying the extent of LI in digitized HER2+ BC histopathology images. In one embodiment of the present invention, a system and method is provided to automatically detect and grade the extent of LI using architectural features. In one embodiment of the present invention, non-linearly reducing the high-dimensional architectural image feature space reveals the presence of a smooth, continuous manifold on which BC samples with progressively increasing LI are arranged in a continuum. The region-growing algorithm and subsequent MRF-based refinement of the present invention provides for isolation of LI from the surrounding BC nuclei, stroma, and baseline level of lymphocytes. The architectural (graph-based and nuclear) features, which exploit differences in arrangement of LI, were found to be more successful than textural (VZ) features in distinguishing LI extent. While applying Graph Embedding to the high-dimensional feature space did not adversely affect the classification accuracy of the SVM classifier, in conjunction with the architectural and morphological features it did allow for the visualization of a smooth data manifold. A similar manifold was not reproducible with the VZ features, reflecting that the architectural and morphological features accurately captured class-discriminatory information regarding the spatial extent of LI. The LI classification results were comparable for automated and manual detection, reflecting the robustness of our detection algorithm. The ability of the image analysis algorithm of the present invention to stratify the extent of LI into low, medium, and high grades provides significant translational and prognostic significance, and could be developed into a prognostic test for predicting disease survival and patient outcome. Furthermore, the methods comprising the CADx system and method of the present invention may be employed to characterize LI extent in other tissues and diseases.
- The embodiments discussed above are exemplary and are not intended to limit the scope of the present invention. The present invention relates to an image-based computer-aided prognosis (CAP) system and method that seeks to replicate the prognostic power of molecular assays in histopathology and pathological processes, including but not limited to cancer.
-
- [01] M.B. Flanagan, D.J. Dabbs, et al., "Histopathologic variables predict oncotype dx recurrence score.," Mod Pathol, vol. 21, no. 10, pp. 1255-1261, Oct 2008.
- [02] V.R. Korde, H. Bartels, et al., "Automatic segmentation of cell nuclei in bladder and skin tissue for karyometric analysis," in Biophotonics. Proceedings of the SPIE,, 2007, vol. 6633.
- [03] L. Latson et al., "Automated cell nuclear segmentation in color images of hematoxylin and eosin-stained breast biopsy.," Anal Quant Cytol Histol, vol. 25, no. 6, pp. 321-331, Dec 2003.
- [04] X. Xie et al., "Mac: Magnetostatic active contour model," IEEE Trans on PAMI, vol. 30, no. 4, pp. 632-646, 2008.
- [05] A. Ramme, N. Devries, et al., "Semi-automated phalanx bone segmentation using the expectation maximization algorithm.," J Digit Imaging, Sep 2008.
- [06] W.H. Wolberg, W.N. Street, et al., "Computer-derived nuclear features distinguish malignant from benign breast cytology.," Hum Pathol, vol. 26, no. 7, pp. 792-796, Jul 1995.
- [07] C. Bilgin et al., "Cell-graph mining for breast tissue modeling and classification.," in IEEEEMBS, 2007, pp. 5311-5314.
- [08] B Hall, W Chen, et al., "A clinically motivated 2-fold framework for quantifying and classifying immunohistochemically stained specimens," in MICCAI, 2007, pp. 287-294.
- [09] S. Doyle, S. Agner, A. Madabhushi, M. Feldman, and J. Tomaszewski, "Automated grading of breast cancer histopathology using spectral clustering with textural and architectural image features," in Proc. 5th IEEE International Symposium on Biomedical Imaging: From Nano to Macro, 2008, pp. 496-499.
- [10] C. Cortes and V. Vapnik, "Support-vector networks," Machine Learning, vol. 20, no. 3, pp. 273-297, 1995.
- [11] Jemal, R. Siegel, E. Ward, Y. Hao, J. Xu, T. Murray, and M. J. Thun, "Cancer statistics, 2008." CA Cancer J Clin, vol. 58, no. 2, pp. 71-96, 2008.
- [12] F. Bertucci and D. Birnbaum, "Reasons for breast cancer heterogeneity." J Biol, vol. 7, no. 2, p. 6, 2008.
- [13] J. R. van Nagell, E. S. Donaldson, E. G. Wood, and J. C. Parker, "The significance of vascular invasion and lymphocytic infiltration in invasive cervical cancer." Cancer, vol. 41, no. 1, pp. 228-234, Jan 1978.
- [14] S. Aaltomaa, P. Lipponen, M. Eskelinen, V. M. Kosma, S. Marin, E. Alhava, and K. Syrjanen, "Lymphocyte infiltrates as a prognostic variable in female breast cancer." Eur J Cancer, vol. 28A, no. 4-5, pp. 859-864, 1992.
- [15] G. Alexe, G. S. Dalgin, D. Scanfeld, P. Tamayo, J. P. Mesirov, C. DeLisi, L. Harris, N. Barnard, M. Martel, A. J. Levine, S. Ganesan, and G. Bhanot, "High expression of lymphocyte-associated genes in node-negative her2+ breast cancers correlates with lower recurrence rates." Cancer Res, vol. 67, no. 22, pp. 10 669-10 676, Nov 2007.
- [16] W. H. Wolberg, W. N. Street, D. M. Heisey, and O. L. Mangasarian, "Computer-derived nuclear features distinguish malignant from benign breast cytology." Hum Pathol, vol. 26, no. 7, pp. 792-796,Jul 1995.
- [17] B. Weyn, G. van de Wouwer, A. van Daele, P. Scheunders, D. van Dyck, E. van Marck, and W. Jacob, "Automated breast tumor diagnosis and grading based on wavelet chromatin texture description." Cytometry, vol. 33, no. 1, pp. 32-40, Sep 1998.
- [18] S. Petushi, F. U. Garcia, M. M. Haber, C. Katsinis, and A. Tozeren, "Large-scale computations on histology images reveal grade-differentiating parameters for breast cancer." BMC Med Imaging, vol. 6, p. 14, 2006.
- [19] B. Karacali and A. Tozeren, "Automated detection of regions of interest for tissue microarray experiments: an image texture analysis." BMC Med Imaging, vol. 7, p. 2, 2007.
- [20] C. Gunduz, B. Yener, and S. H. Gultekin, "The cell graphs of cancer." Bioinformatics, vol. 20 .
- [21] B. H. Hall, M. Ianosi-Irimie, P. Javidian, W. Chen, S. Ganesan, and D. J. Foran, "Computer-assisted assessment of the human epidermal .
- [22] S. J. Shin, E. Hyjek, E. Early, and D. M, Knowles, "Intratumoral heterogeneity of her-2/neu in invasive mammary carcinomas using fluorescence in-situ hybridization and tissue microarray." Int J Surg Pathol, vol. 14, no. 4, pp. 279-284, Oct 2006.
- [23] F. Schnorrenberg, C. Pattichis, K. Kyriacou, and C. Schizas, "Computeraided detection of breast cancer nuclei," IEEE Trans. on Information Technology in Biomedicine, vol. 1, no. 2, pp. 128-140, 1997.
- [24] P. Bamford and B. Lovell, "Unsupervised cell nucleus segmentation with active contours," Signal Processing, vol. 71, no. 2, pp. 203-213, 1998.
- [25] L. Latson, B. Sebek, and K. A. Powell, "Automated cell nuclear segmentation in color images of hematoxylin and eosin-stained breast biopsy," Anal Quant Cytol Histol, vol. 25, no. 6, pp. 321-331, Dec 2003.
- [26] S. Naik, S. Doyle, S. Agner, A. Madabhushi, M. Feldman, and J. Tomaszewski, "Automated gland and nuclei segmentation for grading of prostate and breast cancer histopathology," in Proc. 5th IEEE International Symposium on Biomedical Imaging: From Nano to Macro ISBI2008, 2008, pp. 284-287.
- [27] W. H. Land, D. W. McKee, T. Zhukov, D. Song, and W. Qian, "A kernelised fuzzy-support vector machine cad system for the diagnosis of lung cancer from tissue images," International Journal of Functional Informatics and Personalised Medicine, vol. 1, pp. 26-52(27), 2008.
- [28] D. Glotsos, P. Spyridonos, D. Cavouras, P. Ravazoula, P.-A. Dadioti, and G. Nikiforidis, "Automated segmentation of routinely hematoxylin-eosin-stained microscopic images by combining support vector machine clustering and active contour models." Anal Quant Cytol Histol, vol. 26, no. 6, pp. 331-340, Dec 2004.
- [29] H. Fatakdawala, A. Basavanhally, J. Xu, G. Bhanot, S. Ganesan, M. Feldman, J. Tomaszewski, and A. Madabhushi, "Expectation maximization driven geodesic active contour: Application to lymphocyte segmentation on digitized breast cancer histopathology," in IEEE Conference on Bioinformatics and Bioengineering (BIBE), 2009.
- [30] Basavanhally, S. Agner, G. Alexe, G. Bhanot, S. Ganesan, and A. Madabhushi, "Manifold learning with graph-based features for identifying extent of lymphocytic infiltration from high grade, her2+ breast cancer histology," in Workshop on Microscopic Image Analysis with Applications in Biology (in conjunction with MICCAI), 2008. [Online]. Available: http://www.miaab.org/miaab-2008-papers/27-miaab-2008-paper-21.pdf
- [31] J. P. Monaco, J. E. Tomaszewski, M. D. Feldman, M. Moradi, P.Mousavi, A. Boag, C. Davidson, P. Abolmaesumi, and A. Madabhushi, "Detection of prostate cancer from whole-mount histology images using markov random fields," in Workshop on Microscopic Image Analysis with Applications in Biology (in conjunction with MICCAI), 2008. [Online]. Available: http://www.miaab.org/miaab-2008-papers/28-miaab-2008-paper-22.pdf
- [32] S. Hojjatoleslami and J. Kittler, "Region growing: a new approach," IEEE Trans. on Image Processing, vol. 7, no. 7, pp. 1079-1084, 1998.
- [33] S. Geman and D. Geman, "Stochastic relaxation, gibbs distributions and the bayesian restoration of images," IEEE Transactions on Pattern Analysis and Machine Intelligence, vol. 6, no. 6, pp. 721-741, November 1984.
- [34] J. Besag, "Statistical analysis of dirty pictures," Journal of Royal Statistic Society, vol. B, no. 68, pp. 259-302, 1986.
- [35] S. Doyle, M. Hwang, K. Shah, A. Madabhushi, M. Feldman, and J. Tomaszeweski, "Automated grading of prostate cancer using architectural and textural image features," in Proc. 4th IEEE International Symposium on Biomedical Imaging: From Nano to Macro, 2007, pp. 1284-1287.
- [36] R. E. Bellman, Adaptive Control Processes: A Guided Tour. Princeton University Press, 1961.
- [37] J. Shi and J. Malik, "Normalized cuts and image segmentation," IEEE Trans. on Pattern Analysis and Machine Intelligence, vol. 22, no. 8, pp. 888-905, Aug. 2000.
- [38] G. Lee, C. Rodriguez, and A. Madabhushi, "Investigating the efficacy of nonlinear dimensionality reduction system and methods in classifying gene and protein expression studies," IEEE/ACM Transactions on Computational Biology and Bioinformatics, vol. 5, no. 3, pp.368-384,2008.
- [39] C. Cortes and V. Vapnik, "Support-vector networks," Machine Learning, vol. 20, no. 3, pp. 273-297, 1995.
- [40] M. W. Schwarz, W. B. Cowan, and J. C. Beatty, "An experimental comparison of rgb, yiq, lab, hsv, and opponent color models," ACM Trans. on Graphics, vol. 6, no. 2, pp. 123-158, 1987.
- [41] R. Duda, P. Hart, and D. Stork, Pattern Classification. John Wiley & Sons, 2001.
- [42] Papoulis, Probability, Random Variables, and Stochastic Processes, None, Ed. McGraw Hill, Inc., 1965.
- [43] J. Sudbo, R. Marcelpoil, and A. Reith, "New algorithms based on the voronoi diagram applied in a pilot study on normal mucosa and carcinomas." Anal Cell Pathol, vol. 21, no. 2, pp. 71-86,2000.
- [44] D. Huttenlocher, G. Klanderman, and W. Rucklidge, "Comparing images using the hausdorff distance," IEEE Trans. on Pattern Analysis and Machine Intelligence, vol. 15, no. 9, pp. 850-863, 1993.
- [45] El-Naqa, Y. Yang, M. N. Wernick, N. P. Galatsanos, and R. M. Nishikawa, "A support vector machine approach for detection of microcalcifications." IEEE Trans Med Imaging, vol. 21, no. 12, pp. 1552-1563, Dec 2002. [Online]. Available: http://dx.doi.org/10.1109/TMI.2002.806569
- [46] M. Varma and A. Zisserman, "A statistical approach to texture classification from single images," Int J Comput Vision, vol. 62, no. 1-2, pp. 61-81, 2005.
- [47] F. Schnorrenberg, C. S. Pattichis, C. N. Schizas, and K. Kyriacou, "Content-based retrieval of breast cancer biopsy slides." Technol Health Care, vol. 8, no. 5, pp. 291-297, 2000.
- [48] O. Tuzel, L. Yang, P. Meer, and D. J. Foran, "Classification of hematologic malignancies using texton signatures," Pattern Analysis & Applications, vol. 10, no. 4, pp. 277-290, 2007.
- [49] J. Naik, S. Doyle, A. Basavanhally, S. Ganesan, M. Feldman, J. Tomaszewski, and A. Madabhushi, "A boosted distance metric: Application to content based image retrieval and classification of digitized histopathology," in SPIE Medical Imaging, vol. 7260, 2009. [Online]. Available: http://dx.doi.0rg/10.1117/12.813931
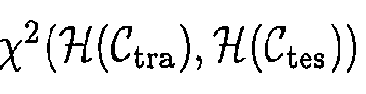


Claims (4)
- An image-based risk score predictor method for measuring cancer extent to evaluate disease outcome in cancer patients using digitized histopathology comprising:i. scanning a stained histopathology slide into a computer using a high resolution 5 whole slide scanner to obtain an image;ii. detecting cancer nuclei using an Expectation-Maximization based algorithm;iii. constructing Delaunay Triangulation and Minimum Spanning Tree graphs using the centers of individual detected cancer nuclei as vertices;iv. extracting image-derived features describing the arrangement of the cancer 10 nuclei from each image based on the Delaunay Triangulation and Minimum Spanning Tree graphs;v. projecting a high-dimensional feature vector derived from the extracted image-derived features into a reduced 3D embedding space via Graph Embedding;vi. projecting the data in the 3D embedding into a 1D scale to define image-based 15 risk scores for poor, intermediate, and good outcome;vii. determining an image-based recurrence score to distinguish between low, intermediate, and high cancer grades by uncovering the grade labels of the samples on the 1D line and their relative locations to predict prognosis.
- An image-based risk score predictor method for measuring extent of pathological processes to evaluate disease outcome in patients using digitized histopathology comprising:i. scanning a stained histopathology slide into a computer using a high resolution whole slide scanner to obtain an image;ii. detecting pathological nuclei using an Expectation-Maximization based algorithm;iii. constructing Delaunay Triangulation and Minimum Spanning Tree graphs using the centers of individual detected pathological nuclei as vertices;iv. extracting image-derived features describing the arrangement of the 30 pathological nuclei from each image based on the Delaunay Triangulation and Minimum Spanning Tree graphs;v. projecting a high-dimensional feature vector derived from the extracted image-derived features into a reduced 3D embedding space via Graph Embedding;vi. projecting the data in the 3D embedding into a 1D scale to define image-based 35 risk scores for poor, intermediate, and good outcome;vii. determining an image-based recurrence score to distinguish between low, intermediate, and high cancer grades by uncovering the grade labels of the samples on the 1D line and their relative locations to predict prognosis.
- An image-based risk score predictor method for measuring cancer extent to evaluate disease outcome in node-negative, estrogen receptor-positive breast cancer patients using digitized histopathology comprising:i. scanning a stained histopathology slide into a computer using a high resolution whole slide scanner to obtain an image;ii. detecting cancer nuclei using an Expectation-Maximization based algorithm;iii. constructing Delaunay Triangulation and Minimum Spanning Tree graphs using the centers of individual detected cancer nuclei as vertices;iv. extracting image-derived features describing the arrangement of the cancer nuclei from each image based on the Delaunay Triangulation and Minimum Spanning 15 Tree graphs;v. projecting a high-dimensional feature vector derived from the extracted image-derived features into a reduced 3D embedding space via Graph Embedding;vi. projecting the data in the 3D embedding into a 1D scale to define image-based risk scores for poor, intermediate, and good outcome;vii. determining an image-based recurrence score to distinguish between low, intermediate, and high cancer grades by uncovering the grade labels of the samples on the 1D line and their relative locations to predict prognosis.
- A method for measuring extent of lymphocytic infiltration to evaluate disease 25 outcome in breast cancer patients expressing the human epidermal growth factor receptor 2 "HER2" comprising:i. scanning a stained histopathology slide into a computer using a high resolution whole slide scanner to obtain an image;ii. detecting lymphocyte nuclei using a combination of region-growing and Markov 30 Random Field algorithms;iii. constructing a Voronoi Diagram, Delaunay Triangulation, and Minimum Spanning Tree using the centers of individual detected lymphocyte nuclei as vertices;iv. extracting image-derived features describing the arrangement of the lymphocyte nuclei from each image based on the Voronoi Diagram, Delaunay 35 Triangulation and Minimum Spanning Tree graphs;v. projecting a high-dimensional feature vector derived from the extracted image-derived features into a reduced 3D embedding space via Graph Embedding;vi. determining whether samples have high or low lymphocytic infiltration in the reduced 3D dimensional embedding space using a Support Vector Machine classifier.
Applications Claiming Priority (2)
| Application Number | Priority Date | Filing Date | Title |
|---|---|---|---|
| US14915809P | 2009-02-02 | 2009-02-02 | |
| PCT/US2010/022891 WO2010088672A1 (en) | 2009-02-02 | 2010-02-02 | Image-based risk score-a prognostic predictor of survival and outcome from digital histopathology |
Publications (3)
| Publication Number | Publication Date |
|---|---|
| EP2391887A1 EP2391887A1 (en) | 2011-12-07 |
| EP2391887A4 EP2391887A4 (en) | 2018-04-04 |
| EP2391887B1 true EP2391887B1 (en) | 2020-06-17 |
Family
ID=42396082
Family Applications (1)
| Application Number | Title | Priority Date | Filing Date |
|---|---|---|---|
| EP10736572.8A Not-in-force EP2391887B1 (en) | 2009-02-02 | 2010-02-02 | Image-based risk score-a prognostic predictor of survival and outcome from digital histopathology |
Country Status (5)
| Country | Link |
|---|---|
| US (1) | US9002092B2 (en) |
| EP (1) | EP2391887B1 (en) |
| CN (2) | CN104376147B (en) |
| HK (1) | HK1207703A1 (en) |
| WO (1) | WO2010088672A1 (en) |
Families Citing this family (28)
| Publication number | Priority date | Publication date | Assignee | Title |
|---|---|---|---|---|
| PT2779089T (en) | 2010-07-30 | 2019-02-19 | Fund D Anna Sommer Champalimaud E Dr Carlos Montez Champalimaud | Systems and methods for segmentation and processing of tissue images and feature extraction from same for treating, diagnosing, or predicting medical conditions |
| WO2012096992A1 (en) * | 2011-01-10 | 2012-07-19 | Rutgers, The State University Of New Jersey | Boosted consensus classifier for large images using fields of view of various sizes |
| WO2012096882A1 (en) * | 2011-01-11 | 2012-07-19 | Rutgers, The State University Of New Jersey | Method and apparatus for segmentation and registration of longitudinal images |
| US9286672B2 (en) | 2012-01-10 | 2016-03-15 | Rutgers, The State University Of New Jersey | Integrated multivariate image-based method for disease outcome predicition |
| US9760760B2 (en) | 2012-01-19 | 2017-09-12 | H. Lee Moffitt Cancer Center And Research Institute, Inc. | Histology recognition to automatically score and quantify cancer grades and individual user digital whole histological imaging device |
| US10521644B2 (en) | 2012-02-01 | 2019-12-31 | Ventana Medical Systems, Inc. | Lab color space silver and red in situ hybridization based techniques for detecting genes in tissue samples |
| CN102622737B (en) * | 2012-02-29 | 2014-08-27 | 宁波大学 | Microscopic image fusion method based on region growth |
| US9047660B2 (en) * | 2012-03-01 | 2015-06-02 | Siemens Corporation | Network cycle features in relative neighborhood graphs |
| US9869739B2 (en) * | 2012-10-15 | 2018-01-16 | Case Wetern Reserve University | Heteronuclear nuclear magnetic resonance fingerprinting |
| CN103020956B (en) * | 2012-11-20 | 2015-05-20 | 华中科技大学 | Image matching method for judging Hausdorff distance based on decision |
| US9996919B2 (en) * | 2013-08-01 | 2018-06-12 | Seoul National University R&Db Foundation | Method for extracting airways and pulmonary lobes and apparatus therefor |
| US9558394B2 (en) * | 2014-03-10 | 2017-01-31 | Case Western Reserve University | Histogram of hosoya index (HoH) features for quantitative histomorphometry |
| US10614285B2 (en) * | 2015-03-18 | 2020-04-07 | Proscia Inc. | Computing technologies for image operations |
| CN106202988A (en) * | 2016-10-11 | 2016-12-07 | 哈尔滨工业大学深圳研究生院 | The Stepwise multiple-regression model of a kind of predictive disease life cycle and application |
| CN106622415A (en) * | 2017-02-06 | 2017-05-10 | 厦门大学 | concentration gradient micro-fluidic chip of three-dimensional internet structure |
| US11263782B2 (en) * | 2017-10-11 | 2022-03-01 | Qualcomm Incorporated | Image signal processor for processing images |
| CN115684569B (en) * | 2018-02-15 | 2026-02-13 | 国立大学法人新潟大学 | Detection systems, procedures and methods for hypermutant cancer |
| US11574404B2 (en) * | 2018-02-21 | 2023-02-07 | Case Western Reserve University | Predicting recurrence and overall survival using radiomic features correlated with PD-L1 expression in early stage non-small cell lung cancer (ES-NSCLC) |
| US11925446B2 (en) * | 2018-02-22 | 2024-03-12 | Vayyar Imaging Ltd. | Radar-based classification of vehicle occupants |
| CN108629761B (en) * | 2018-03-12 | 2020-11-03 | 中山大学 | Breast cancer image identification method and device and user terminal |
| US11048977B1 (en) * | 2018-09-27 | 2021-06-29 | Apple Inc. | Method and device for pixel-level object segmentation |
| US11995838B2 (en) * | 2019-03-18 | 2024-05-28 | Medtronic Navigation, Inc. | System and method for imaging |
| JP7805648B2 (en) * | 2020-07-09 | 2026-01-26 | ユニバーシティ オブ ピッツバーグ-オブ ザ コモンウェルス システム オブ ハイヤー エデュケーション | Parametric modeling and estimation of diagnostically relevant histological patterns in digital tissue images |
| US11664130B2 (en) * | 2020-09-01 | 2023-05-30 | International Business Machines Corporation | Predicting infection risk using heterogeneous temporal graphs |
| JP7761919B2 (en) | 2021-03-31 | 2025-10-29 | 国立大学法人東北大学 | Prognosis prediction device, prognosis prediction method and program |
| CN113177616B (en) * | 2021-06-29 | 2021-09-17 | 腾讯科技(深圳)有限公司 | Image classification method, device, equipment and storage medium |
| CN115938592B (en) * | 2023-03-09 | 2023-05-05 | 成都信息工程大学 | Cancer prognosis prediction method based on local enhancement graph convolution network |
| CN121729710A (en) * | 2023-08-18 | 2026-03-24 | 文塔纳医疗系统公司 | Attention-based multimodal fusion for patient survival prediction |
Family Cites Families (9)
| Publication number | Priority date | Publication date | Assignee | Title |
|---|---|---|---|---|
| US6519355B2 (en) | 2001-03-28 | 2003-02-11 | Alan C. Nelson | Optical projection imaging system and method for automatically detecting cells having nuclear and cytoplasmic densitometric features associated with disease |
| WO2003078965A2 (en) | 2002-03-13 | 2003-09-25 | Q3Dm, Llc | System and method for measurement of a response of localized cellular compartments |
| US7490085B2 (en) * | 2002-12-18 | 2009-02-10 | Ge Medical Systems Global Technology Company, Llc | Computer-assisted data processing system and method incorporating automated learning |
| US20040122787A1 (en) * | 2002-12-18 | 2004-06-24 | Avinash Gopal B. | Enhanced computer-assisted medical data processing system and method |
| EP1789923A1 (en) * | 2004-08-11 | 2007-05-30 | Aureon Laboratories, Inc. | Systems and methods for automated diagnosis and grading of tissue images |
| US7512273B2 (en) * | 2004-10-21 | 2009-03-31 | Microsoft Corporation | Digital ink labeling |
| EP1960757A1 (en) * | 2005-11-25 | 2008-08-27 | British Columbia Cancer Agency Branch | Apparatus and methods for automated assessment of tissue pathology |
| NZ544432A (en) * | 2005-12-23 | 2009-07-31 | Pacific Edge Biotechnology Ltd | Prognosis prediction for colorectal cancer using a prognositc signature comprising markers ME2 and FAS |
| US8488863B2 (en) * | 2008-11-06 | 2013-07-16 | Los Alamos National Security, Llc | Combinational pixel-by-pixel and object-level classifying, segmenting, and agglomerating in performing quantitative image analysis that distinguishes between healthy non-cancerous and cancerous cell nuclei and delineates nuclear, cytoplasm, and stromal material objects from stained biological tissue materials |
-
2010
- 2010-02-02 WO PCT/US2010/022891 patent/WO2010088672A1/en not_active Ceased
- 2010-02-02 CN CN201410558768.0A patent/CN104376147B/en active Active
- 2010-02-02 CN CN201080012959.7A patent/CN102388305B/en active Active
- 2010-02-02 EP EP10736572.8A patent/EP2391887B1/en not_active Not-in-force
- 2010-02-02 US US13/147,537 patent/US9002092B2/en active Active
-
2015
- 2015-08-21 HK HK15108132.5A patent/HK1207703A1/en unknown
Non-Patent Citations (1)
| Title |
|---|
| None * |
Also Published As
| Publication number | Publication date |
|---|---|
| US9002092B2 (en) | 2015-04-07 |
| CN104376147B (en) | 2018-07-17 |
| EP2391887A1 (en) | 2011-12-07 |
| CN102388305B (en) | 2014-11-19 |
| EP2391887A4 (en) | 2018-04-04 |
| CN104376147A (en) | 2015-02-25 |
| CN102388305A (en) | 2012-03-21 |
| HK1207703A1 (en) | 2016-02-05 |
| US20120106821A1 (en) | 2012-05-03 |
| WO2010088672A1 (en) | 2010-08-05 |
Similar Documents
| Publication | Publication Date | Title |
|---|---|---|
| US9002092B2 (en) | Image-based risk score—A prognostic predictor of survival and outcome from digital histopathology | |
| Basavanhally et al. | Computerized image-based detection and grading of lymphocytic infiltration in HER2+ breast cancer histopathology | |
| Wan et al. | Automated grading of breast cancer histopathology using cascaded ensemble with combination of multi-level image features | |
| Fondón et al. | Automatic classification of tissue malignancy for breast carcinoma diagnosis | |
| US8488863B2 (en) | Combinational pixel-by-pixel and object-level classifying, segmenting, and agglomerating in performing quantitative image analysis that distinguishes between healthy non-cancerous and cancerous cell nuclei and delineates nuclear, cytoplasm, and stromal material objects from stained biological tissue materials | |
| US8718340B2 (en) | System and method for accurate and rapid identification of diseased regions on biological images with applications to disease diagnosis and prognosis | |
| George et al. | Remote computer-aided breast cancer detection and diagnosis system based on cytological images | |
| Roullier et al. | Multi-resolution graph-based analysis of histopathological whole slide images: Application to mitotic cell extraction and visualization | |
| US8280132B2 (en) | Malignancy diagnosis using content-based image retreival of tissue histopathology | |
| US8139831B2 (en) | System and method for unsupervised detection and gleason grading of prostate cancer whole mounts using NIR fluorscence | |
| US8712142B2 (en) | Method and apparatus for analysis of histopathology images and its application to cancer diagnosis and grading | |
| Huang et al. | Time-efficient sparse analysis of histopathological whole slide images | |
| EP2174263A1 (en) | Malignancy diagnosis using content-based image retreival of tissue histopathology | |
| Xu et al. | Using transfer learning on whole slide images to predict tumor mutational burden in bladder cancer patients | |
| Lopez et al. | Exploration of efficacy of gland morphology and architectural features in prostate cancer gleason grading | |
| Basavanhally et al. | Computer-aided prognosis of ER+ breast cancer histopathology and correlating survival outcome with oncotype DX assay | |
| WO2014006421A1 (en) | Identification of mitotic cells within a tumor region | |
| Shirazi et al. | Automated pathology image analysis | |
| Naik et al. | A boosted distance metric: application to content based image retrieval and classification of digitized histopathology | |
| Fernandez et al. | Artificial intelligence methods for predictive image-based grading of human cancers | |
| He et al. | Local and global Gaussian mixture models for hematoxylin and eosin stained histology image segmentation | |
| Prasath et al. | Segmentation of breast cancer tissue microarrays for computer-aided diagnosis in pathology | |
| Basavanhally | Automated Image-based Detection and grading of lymphocytic infiltration in breast cancer histopathology | |
| Sertel | Image analysis for computer-aided histopathology | |
| Roullier et al. | Mitosis extraction in breast-cancer histopathological whole slide images |
Legal Events
| Date | Code | Title | Description |
|---|---|---|---|
| PUAI | Public reference made under article 153(3) epc to a published international application that has entered the european phase |
Free format text: ORIGINAL CODE: 0009012 |
|
| 17P | Request for examination filed |
Effective date: 20110902 |
|
| AK | Designated contracting states |
Kind code of ref document: A1 Designated state(s): AT BE BG CH CY CZ DE DK EE ES FI FR GB GR HR HU IE IS IT LI LT LU LV MC MK MT NL NO PL PT RO SE SI SK SM TR |
|
| DAX | Request for extension of the european patent (deleted) | ||
| RA4 | Supplementary search report drawn up and despatched (corrected) |
Effective date: 20180305 |
|
| RIC1 | Information provided on ipc code assigned before grant |
Ipc: G06T 7/00 20060101ALI20180227BHEP Ipc: G01N 33/48 20060101AFI20180227BHEP Ipc: G06K 9/62 20060101ALI20180227BHEP Ipc: G01N 21/84 20060101ALI20180227BHEP Ipc: G06F 17/10 20060101ALI20180227BHEP Ipc: G06K 9/00 20060101ALI20180227BHEP |
|
| STAA | Information on the status of an ep patent application or granted ep patent |
Free format text: STATUS: EXAMINATION IS IN PROGRESS |
|
| 17Q | First examination report despatched |
Effective date: 20181219 |
|
| GRAP | Despatch of communication of intention to grant a patent |
Free format text: ORIGINAL CODE: EPIDOSNIGR1 |
|
| STAA | Information on the status of an ep patent application or granted ep patent |
Free format text: STATUS: GRANT OF PATENT IS INTENDED |
|
| INTG | Intention to grant announced |
Effective date: 20200121 |
|
| GRAS | Grant fee paid |
Free format text: ORIGINAL CODE: EPIDOSNIGR3 |
|
| GRAA | (expected) grant |
Free format text: ORIGINAL CODE: 0009210 |
|
| STAA | Information on the status of an ep patent application or granted ep patent |
Free format text: STATUS: THE PATENT HAS BEEN GRANTED |
|
| AK | Designated contracting states |
Kind code of ref document: B1 Designated state(s): AT BE BG CH CY CZ DE DK EE ES FI FR GB GR HR HU IE IS IT LI LT LU LV MC MK MT NL NO PL PT RO SE SI SK SM TR |
|
| REG | Reference to a national code |
Ref country code: GB Ref legal event code: FG4D |
|
| REG | Reference to a national code |
Ref country code: CH Ref legal event code: EP |
|
| REG | Reference to a national code |
Ref country code: DE Ref legal event code: R096 Ref document number: 602010064635 Country of ref document: DE |
|
| REG | Reference to a national code |
Ref country code: IE Ref legal event code: FG4D |
|
| REG | Reference to a national code |
Ref country code: AT Ref legal event code: REF Ref document number: 1281951 Country of ref document: AT Kind code of ref document: T Effective date: 20200715 |
|
| REG | Reference to a national code |
Ref country code: NL Ref legal event code: FP |
|
| PG25 | Lapsed in a contracting state [announced via postgrant information from national office to epo] |
Ref country code: FI Free format text: LAPSE BECAUSE OF FAILURE TO SUBMIT A TRANSLATION OF THE DESCRIPTION OR TO PAY THE FEE WITHIN THE PRESCRIBED TIME-LIMIT Effective date: 20200617 Ref country code: LT Free format text: LAPSE BECAUSE OF FAILURE TO SUBMIT A TRANSLATION OF THE DESCRIPTION OR TO PAY THE FEE WITHIN THE PRESCRIBED TIME-LIMIT Effective date: 20200617 Ref country code: NO Free format text: LAPSE BECAUSE OF FAILURE TO SUBMIT A TRANSLATION OF THE DESCRIPTION OR TO PAY THE FEE WITHIN THE PRESCRIBED TIME-LIMIT Effective date: 20200917 Ref country code: GR Free format text: LAPSE BECAUSE OF FAILURE TO SUBMIT A TRANSLATION OF THE DESCRIPTION OR TO PAY THE FEE WITHIN THE PRESCRIBED TIME-LIMIT Effective date: 20200918 Ref country code: SE Free format text: LAPSE BECAUSE OF FAILURE TO SUBMIT A TRANSLATION OF THE DESCRIPTION OR TO PAY THE FEE WITHIN THE PRESCRIBED TIME-LIMIT Effective date: 20200617 |
|
| REG | Reference to a national code |
Ref country code: LT Ref legal event code: MG4D |
|
| PG25 | Lapsed in a contracting state [announced via postgrant information from national office to epo] |
Ref country code: BG Free format text: LAPSE BECAUSE OF FAILURE TO SUBMIT A TRANSLATION OF THE DESCRIPTION OR TO PAY THE FEE WITHIN THE PRESCRIBED TIME-LIMIT Effective date: 20200917 Ref country code: HR Free format text: LAPSE BECAUSE OF FAILURE TO SUBMIT A TRANSLATION OF THE DESCRIPTION OR TO PAY THE FEE WITHIN THE PRESCRIBED TIME-LIMIT Effective date: 20200617 Ref country code: LV Free format text: LAPSE BECAUSE OF FAILURE TO SUBMIT A TRANSLATION OF THE DESCRIPTION OR TO PAY THE FEE WITHIN THE PRESCRIBED TIME-LIMIT Effective date: 20200617 |
|
| REG | Reference to a national code |
Ref country code: AT Ref legal event code: MK05 Ref document number: 1281951 Country of ref document: AT Kind code of ref document: T Effective date: 20200617 |
|
| PG25 | Lapsed in a contracting state [announced via postgrant information from national office to epo] |
Ref country code: RO Free format text: LAPSE BECAUSE OF FAILURE TO SUBMIT A TRANSLATION OF THE DESCRIPTION OR TO PAY THE FEE WITHIN THE PRESCRIBED TIME-LIMIT Effective date: 20200617 Ref country code: AT Free format text: LAPSE BECAUSE OF FAILURE TO SUBMIT A TRANSLATION OF THE DESCRIPTION OR TO PAY THE FEE WITHIN THE PRESCRIBED TIME-LIMIT Effective date: 20200617 Ref country code: CZ Free format text: LAPSE BECAUSE OF FAILURE TO SUBMIT A TRANSLATION OF THE DESCRIPTION OR TO PAY THE FEE WITHIN THE PRESCRIBED TIME-LIMIT Effective date: 20200617 Ref country code: ES Free format text: LAPSE BECAUSE OF FAILURE TO SUBMIT A TRANSLATION OF THE DESCRIPTION OR TO PAY THE FEE WITHIN THE PRESCRIBED TIME-LIMIT Effective date: 20200617 Ref country code: PT Free format text: LAPSE BECAUSE OF FAILURE TO SUBMIT A TRANSLATION OF THE DESCRIPTION OR TO PAY THE FEE WITHIN THE PRESCRIBED TIME-LIMIT Effective date: 20201019 Ref country code: IT Free format text: LAPSE BECAUSE OF FAILURE TO SUBMIT A TRANSLATION OF THE DESCRIPTION OR TO PAY THE FEE WITHIN THE PRESCRIBED TIME-LIMIT Effective date: 20200617 Ref country code: EE Free format text: LAPSE BECAUSE OF FAILURE TO SUBMIT A TRANSLATION OF THE DESCRIPTION OR TO PAY THE FEE WITHIN THE PRESCRIBED TIME-LIMIT Effective date: 20200617 Ref country code: SM Free format text: LAPSE BECAUSE OF FAILURE TO SUBMIT A TRANSLATION OF THE DESCRIPTION OR TO PAY THE FEE WITHIN THE PRESCRIBED TIME-LIMIT Effective date: 20200617 |
|
| PG25 | Lapsed in a contracting state [announced via postgrant information from national office to epo] |
Ref country code: IS Free format text: LAPSE BECAUSE OF FAILURE TO SUBMIT A TRANSLATION OF THE DESCRIPTION OR TO PAY THE FEE WITHIN THE PRESCRIBED TIME-LIMIT Effective date: 20201017 Ref country code: SK Free format text: LAPSE BECAUSE OF FAILURE TO SUBMIT A TRANSLATION OF THE DESCRIPTION OR TO PAY THE FEE WITHIN THE PRESCRIBED TIME-LIMIT Effective date: 20200617 Ref country code: PL Free format text: LAPSE BECAUSE OF FAILURE TO SUBMIT A TRANSLATION OF THE DESCRIPTION OR TO PAY THE FEE WITHIN THE PRESCRIBED TIME-LIMIT Effective date: 20200617 |
|
| REG | Reference to a national code |
Ref country code: DE Ref legal event code: R097 Ref document number: 602010064635 Country of ref document: DE |
|
| PLBE | No opposition filed within time limit |
Free format text: ORIGINAL CODE: 0009261 |
|
| STAA | Information on the status of an ep patent application or granted ep patent |
Free format text: STATUS: NO OPPOSITION FILED WITHIN TIME LIMIT |
|
| PG25 | Lapsed in a contracting state [announced via postgrant information from national office to epo] |
Ref country code: DK Free format text: LAPSE BECAUSE OF FAILURE TO SUBMIT A TRANSLATION OF THE DESCRIPTION OR TO PAY THE FEE WITHIN THE PRESCRIBED TIME-LIMIT Effective date: 20200617 |
|
| 26N | No opposition filed |
Effective date: 20210318 |
|
| PG25 | Lapsed in a contracting state [announced via postgrant information from national office to epo] |
Ref country code: SI Free format text: LAPSE BECAUSE OF FAILURE TO SUBMIT A TRANSLATION OF THE DESCRIPTION OR TO PAY THE FEE WITHIN THE PRESCRIBED TIME-LIMIT Effective date: 20200617 |
|
| REG | Reference to a national code |
Ref country code: DE Ref legal event code: R119 Ref document number: 602010064635 Country of ref document: DE |
|
| PG25 | Lapsed in a contracting state [announced via postgrant information from national office to epo] |
Ref country code: MC Free format text: LAPSE BECAUSE OF FAILURE TO SUBMIT A TRANSLATION OF THE DESCRIPTION OR TO PAY THE FEE WITHIN THE PRESCRIBED TIME-LIMIT Effective date: 20200617 |
|
| GBPC | Gb: european patent ceased through non-payment of renewal fee |
Effective date: 20210202 |
|
| REG | Reference to a national code |
Ref country code: BE Ref legal event code: MM Effective date: 20210228 |
|
| PG25 | Lapsed in a contracting state [announced via postgrant information from national office to epo] |
Ref country code: LU Free format text: LAPSE BECAUSE OF NON-PAYMENT OF DUE FEES Effective date: 20210202 Ref country code: LI Free format text: LAPSE BECAUSE OF NON-PAYMENT OF DUE FEES Effective date: 20210228 Ref country code: CH Free format text: LAPSE BECAUSE OF NON-PAYMENT OF DUE FEES Effective date: 20210228 |
|
| REG | Reference to a national code |
Ref country code: NL Ref legal event code: MM Effective date: 20210301 |
|
| PG25 | Lapsed in a contracting state [announced via postgrant information from national office to epo] |
Ref country code: NL Free format text: LAPSE BECAUSE OF NON-PAYMENT OF DUE FEES Effective date: 20210301 |
|
| PG25 | Lapsed in a contracting state [announced via postgrant information from national office to epo] |
Ref country code: DE Free format text: LAPSE BECAUSE OF NON-PAYMENT OF DUE FEES Effective date: 20210901 Ref country code: IE Free format text: LAPSE BECAUSE OF NON-PAYMENT OF DUE FEES Effective date: 20210202 Ref country code: FR Free format text: LAPSE BECAUSE OF NON-PAYMENT OF DUE FEES Effective date: 20210228 Ref country code: GB Free format text: LAPSE BECAUSE OF NON-PAYMENT OF DUE FEES Effective date: 20210202 |
|
| PG25 | Lapsed in a contracting state [announced via postgrant information from national office to epo] |
Ref country code: BE Free format text: LAPSE BECAUSE OF NON-PAYMENT OF DUE FEES Effective date: 20210228 |
|
| PG25 | Lapsed in a contracting state [announced via postgrant information from national office to epo] |
Ref country code: HU Free format text: LAPSE BECAUSE OF FAILURE TO SUBMIT A TRANSLATION OF THE DESCRIPTION OR TO PAY THE FEE WITHIN THE PRESCRIBED TIME-LIMIT; INVALID AB INITIO Effective date: 20100202 Ref country code: CY Free format text: LAPSE BECAUSE OF FAILURE TO SUBMIT A TRANSLATION OF THE DESCRIPTION OR TO PAY THE FEE WITHIN THE PRESCRIBED TIME-LIMIT Effective date: 20200617 |
|
| PG25 | Lapsed in a contracting state [announced via postgrant information from national office to epo] |
Ref country code: MK Free format text: LAPSE BECAUSE OF FAILURE TO SUBMIT A TRANSLATION OF THE DESCRIPTION OR TO PAY THE FEE WITHIN THE PRESCRIBED TIME-LIMIT Effective date: 20200617 |
|
| PG25 | Lapsed in a contracting state [announced via postgrant information from national office to epo] |
Ref country code: TR Free format text: LAPSE BECAUSE OF FAILURE TO SUBMIT A TRANSLATION OF THE DESCRIPTION OR TO PAY THE FEE WITHIN THE PRESCRIBED TIME-LIMIT Effective date: 20200617 |
|
| PG25 | Lapsed in a contracting state [announced via postgrant information from national office to epo] |
Ref country code: MT Free format text: LAPSE BECAUSE OF FAILURE TO SUBMIT A TRANSLATION OF THE DESCRIPTION OR TO PAY THE FEE WITHIN THE PRESCRIBED TIME-LIMIT Effective date: 20200617 |