EP2373049A1 - Video quality measurement - Google Patents
Video quality measurement Download PDFInfo
- Publication number
- EP2373049A1 EP2373049A1 EP10250691A EP10250691A EP2373049A1 EP 2373049 A1 EP2373049 A1 EP 2373049A1 EP 10250691 A EP10250691 A EP 10250691A EP 10250691 A EP10250691 A EP 10250691A EP 2373049 A1 EP2373049 A1 EP 2373049A1
- Authority
- EP
- European Patent Office
- Prior art keywords
- measure
- picture
- predetermined relationship
- masking
- dependant
- Prior art date
- Legal status (The legal status is an assumption and is not a legal conclusion. Google has not performed a legal analysis and makes no representation as to the accuracy of the status listed.)
- Ceased
Links
Images


Classifications
-
- H—ELECTRICITY
- H04—ELECTRIC COMMUNICATION TECHNIQUE
- H04N—PICTORIAL COMMUNICATION, e.g. TELEVISION
- H04N19/00—Methods or arrangements for coding, decoding, compressing or decompressing digital video signals
- H04N19/10—Methods or arrangements for coding, decoding, compressing or decompressing digital video signals using adaptive coding
- H04N19/102—Methods or arrangements for coding, decoding, compressing or decompressing digital video signals using adaptive coding characterised by the element, parameter or selection affected or controlled by the adaptive coding
- H04N19/117—Filters, e.g. for pre-processing or post-processing
-
- H—ELECTRICITY
- H04—ELECTRIC COMMUNICATION TECHNIQUE
- H04N—PICTORIAL COMMUNICATION, e.g. TELEVISION
- H04N17/00—Diagnosis, testing or measuring for television systems or their details
- H04N17/004—Diagnosis, testing or measuring for television systems or their details for digital television systems
-
- H—ELECTRICITY
- H04—ELECTRIC COMMUNICATION TECHNIQUE
- H04N—PICTORIAL COMMUNICATION, e.g. TELEVISION
- H04N19/00—Methods or arrangements for coding, decoding, compressing or decompressing digital video signals
- H04N19/10—Methods or arrangements for coding, decoding, compressing or decompressing digital video signals using adaptive coding
- H04N19/134—Methods or arrangements for coding, decoding, compressing or decompressing digital video signals using adaptive coding characterised by the element, parameter or criterion affecting or controlling the adaptive coding
- H04N19/154—Measured or subjectively estimated visual quality after decoding, e.g. measurement of distortion
-
- H—ELECTRICITY
- H04—ELECTRIC COMMUNICATION TECHNIQUE
- H04N—PICTORIAL COMMUNICATION, e.g. TELEVISION
- H04N19/00—Methods or arrangements for coding, decoding, compressing or decompressing digital video signals
- H04N19/10—Methods or arrangements for coding, decoding, compressing or decompressing digital video signals using adaptive coding
- H04N19/169—Methods or arrangements for coding, decoding, compressing or decompressing digital video signals using adaptive coding characterised by the coding unit, i.e. the structural portion or semantic portion of the video signal being the object or the subject of the adaptive coding
- H04N19/17—Methods or arrangements for coding, decoding, compressing or decompressing digital video signals using adaptive coding characterised by the coding unit, i.e. the structural portion or semantic portion of the video signal being the object or the subject of the adaptive coding the unit being an image region, e.g. an object
-
- H—ELECTRICITY
- H04—ELECTRIC COMMUNICATION TECHNIQUE
- H04N—PICTORIAL COMMUNICATION, e.g. TELEVISION
- H04N19/00—Methods or arrangements for coding, decoding, compressing or decompressing digital video signals
- H04N19/44—Decoders specially adapted therefor, e.g. video decoders which are asymmetric with respect to the encoder
-
- H—ELECTRICITY
- H04—ELECTRIC COMMUNICATION TECHNIQUE
- H04N—PICTORIAL COMMUNICATION, e.g. TELEVISION
- H04N19/00—Methods or arrangements for coding, decoding, compressing or decompressing digital video signals
- H04N19/85—Methods or arrangements for coding, decoding, compressing or decompressing digital video signals using pre-processing or post-processing specially adapted for video compression
- H04N19/86—Methods or arrangements for coding, decoding, compressing or decompressing digital video signals using pre-processing or post-processing specially adapted for video compression involving reduction of coding artifacts, e.g. of blockiness
-
- H—ELECTRICITY
- H04—ELECTRIC COMMUNICATION TECHNIQUE
- H04N—PICTORIAL COMMUNICATION, e.g. TELEVISION
- H04N19/00—Methods or arrangements for coding, decoding, compressing or decompressing digital video signals
- H04N19/60—Methods or arrangements for coding, decoding, compressing or decompressing digital video signals using transform coding
- H04N19/61—Methods or arrangements for coding, decoding, compressing or decompressing digital video signals using transform coding in combination with predictive coding
Definitions
- This invention is concerned with a video quality measure, in particular in situations where a video signal has been encoded using a compression algorithm.
- a video signal When a video signal is to be transmitted from one location to another, it is known to encode or compress the signal using an encoding algorithm, such that the encoded signal can be transmitted using a lower bandwidth than would be needed without encoding.
- the encoded signal Upon reception, the encoded signal is decoded to retrieve the original signal.
- a two dimensional cosines transform is performed, resulting in a series of transform coefficients, whose magnitude is quantized. So that the bandwidth can be allocated efficiently, the granularity of the quantisation, that is, the step size, is allowed to vary.
- the process of encoding and decoding the video sequence can introduce distortion or otherwise reduce the quality of the signal.
- One way of measuring the level of distortion involves noting the opinion of viewers as to the level of perceptible distortion in a distorted video sequence, and averaging the results so as to obtain a Mean Opinion Score (MOS).
- MOS Mean Opinion Score
- this can be a time consuming process.
- it can be desirable to predict the loss of quality that a viewer will perceive in a video sequence.
- the degradation in the video quality as a result of encoding/decoding and the transmission process can be obtained by reference to the original sequence, such an approach is often inconvenient.
- the difference between the actual signal and the predicted one, known as the "prediction residual" may be transmitted. More usually, a quantised version of it is transmitted.
- a method of generating a measure of quality for a video signal representative of a plurality of frames the video signal having: an original form; an encoded form in which the video signal has been encoded using a compression algorithm utilising a variable quantiser step size such that the encoded signal has a quantiser step size parameter associable therewith; and, a decoded form in which the encoded video signal has been at least in part reconverted to the original form, the method comprising the steps of: a) generating a first quality measure which is a function of said quantiser step size parameter; b) generating a second quality measure which is a function of the spatial complexity of at least part of the frames represented by the video signal in the decoded form; and, c) combining the first and second measures.
- the difference between the actual signal and the predicted one, known as the "prediction residual" may be transmitted. More usually, a quantised version of it is transmitted.
- WO 2010004238 there is provided a method of generating a measure of quality for a video signal representative of a plurality of frames, the video signal having: an original form; an encoded form in which the video signal has been encoded using a compression algorithm utilising a variable quantiser step size such that the encoded signal has a quantiser step size parameter associated therewith and utilising differential coding such that the encoded signal contains representations of the prediction residual of the signal; and a decoded form in which the encoded video signal has been at least in part reconverted to the original form, the method comprising: a) generating a first quality measure which is dependant on said quantiser step size parameter according to a predetermined relationship; b) generating a masking measure, the masking measure being dependant on the spatial complexity of at least part of the frames represented by the video signal in the decoded form according to a predetermined relationship; and c) generating a combined measure, the combined measure being dependant upon both the first measure and the masking measure according
- the above techniques predict a picture quality measure using measures based on quantizer step-size and average contrast.
- Full-reference video quality measurement tools utilising both source and degraded video sequences in analysis are known to be able to provide highly accurate predictions of video quality for broadcast video.
- no-reference techniques with no access to the pre-impaired "reference" sequence such as those of the embodiments of the invention is more challenging.
- Known no-reference analysis techniques require access to the encoded bit-stream, either within a decoder or elsewhere in the network.
- Such "bit-stream” analysis has the advantage of having ready access to coding parameters, such as quantizer step-size, motion vectors and block statistics, which are unavailable to a frame buffer analysis.
- Bit-stream analysis can range from computationally light analysis of decoded parameters, with no inverse transforms or motion predicted macroblock reconstruction, through to full decoding of the video sequence. When placed in a full video decoder, the bit-stream analysis may be used in conjunction with frame buffer techniques.
- a spatially sensitive measure of noise masking CWS is introduced as an improvement to the picture-averaged measure CS.
- the CWS measure is calculated over a region K4 that includes the highest activity and highest contrast areas of a picture.
- High activity is assigned to areas of each picture with the highest proportion of non-zero quantized transform coefficients and such areas are assumed to be difficult to predict with a high degree of detail.
- the high activity and high contrast areas of the picture that make up the region K4 attract visual attention and are important in the perception of quality. These areas are therefore used to calculate the noise masking measure CWS.
- the invention seeks to improve the estimation of the quality of encoded broadcast video sequences within a video decoder which such known techniques provide.
- a method is provided in which a non-linearly weighted masking function is applied to high and low activity picture regions.
- the use of the regional measure CWS may be further improved by considering the area, location and contrast of the active region K4 along with the area and contrast of the "background” region nK4.
- the "active" and “background” measures are combined using a non-linear weighting function CWSN that increasingly weights towards the "background” measure for sequences that have a low proportion of active areas.
- Figure 1 of the accompanying drawings shows a simplistic set of three consecutive frames 1a,1b,1c in a video sequence.
- Each picture shows a background region of low activity and low background detail 2 (shown as white/blank in Figs 1a,b,c ), a region of high activity 4 (which from frame to frame in Figs. 1a,b,c is shown by the movement of the smiley face), and an area of not much high activity but of high detail 6 (shown as the "brick" hatched area in Figures 1a,1b, and 1c ).
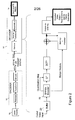
- FIG. 2 of the accompanying drawings shows schematically a typical video encoding/decoding system comprising a video compressor or encoder 12 arranged to convert a video sequence from data source 10 into a compressed form which occupies less bits by removing redundant data.
- the encoder 12 uses a suitable video compression techniques to compact a digital video sequence into a smaller number of bits to enable more efficient storage and transport.
- the electronic signal output from the encoder can be either stored on a fixed storage medium or, assuming it is suitable encoded for transmission, transmitted over a communications network either as a file or bit-stream.
- a decoder 14 decompresses the compressed video sequence into a format suitable for playback on a suitable device (not shown).
- the encoder 12 comprises functional blocks which include predication, transforming and encoding received data and the decoder comprises functional blocks which decode received data, perform an inverse transform, and finally reconstruct the video frame sequence.
- the reconstructed video frame sequence will, when viewed, be considered by most viewers to have a particular picture/sound etc quality.
- Motion results in pixel movements between frames and a set of temporal model parameters (for example, motion vectors to represent how the motion between frames was compensated for by the temporal model) which is sent to an entropy encoder.
- Various techniques are known to estimate motion and compensate for this including block based techniques which are based on "blocks" of pixels within a frame.
- a small block-size involves more complexity (to determine what pixels will form a "block") but usually results in a residual which has less energy (i.e., as the motion prediction for the block is more accurate), but a frame then requires a larger set of motion vectors.
- the H.264 video coding standard uses an adaptive motion compensation block size, which basically adapts the block size to the picture characteristics so that typically large blocks are used for flat, homogenous regions of a frame whereas small blocks are provided in areas of high detail and complex motion.
- the video decoder comprises a buffer 20, an entropy decoder 20 which reconstructs a video frame from a compressed bit stream by first decoding the coded spatial and temporal model parameters (the coded residual coefficients and motion vector parameters). The spatial model is then decoded to enable a version of the residual frame to be reconstructed. The decoder then uses the temporal model parameters together with one or more previously decoded frames to create a prediction of the current frame, and the actual current frame is reconstructed by adding the residual frame to the prediction.
- the coded spatial and temporal model parameters the coded residual coefficients and motion vector parameters
- a video sequence is usually encoded for playback by a plurality of decoders which may have different decoding characteristics or which are arranged to decode differently depending on the display characteristics they are providing output to.
- the video sequence is encoded in a format which supports its display at various levels of perceived video quality and each device must determine how best to decode the received video sequence according to its display characteristics.
- the decompressed picture quality will differ from the quality prior to compression and the perceived quality of the decompressed picture may differ as the human eye responds differently to light at different wavelengths of the visible electromagnetic spectrum.
- the photopic response of the eye (its ability to distinguish between different frequencies of light, i.e, our colour vision) generally varies differently to the scotopic response (the eye's ability to distinguish the intensity of light, i.e., how bright or dim a particular frequency (colour)) is as a function of wavelength.
- determining the most appropriate technique for de-coding a video sequence depends to some extent on the type of image sequence the video contains.
- the human eye response is sensitive to the contrast between different parts of a image and to the level of motion in the background and foreground parts of the image.
- Reference frames are provided to enable video quality to be measured and full-reference video quality measurement tools, utilising both source and degraded video sequences in analysis, have been shown to be capable of highly accurate predictions of video quality for broadcast video (see for example the Final report from the Video Quality Experts Group on the Validation of Objective Models of Video Quality Assessment, Phase 2, available to down load from www.vqeg.org , and ITU-T, J.144, "Objective perceptual video quality measurement techniques for digital cable television in the presence of a full reference".
- No-reference video quality prediction technique which operate within a H.264/AVC decoder and combine a measure of average quantizer step-size ("AvQP") from the encoded parameters with a pixel-difference noise masking measure "CS" taken from the decoded image sequence, which measures pixel contrast, are known in the art.
- CS the pixel-difference noise masking measure provides a picture quality prediction which is picture-averaged and the prediction can be improved by using a spatially sensitive measure of noise masking "CWS” which is calculated over a region that includes both the highest activity and highest contrast areas of a picture.
- the CWS measure is based on determining which areas of a picture have the highest proportion of non-zero quantized transform coefficients ("high activity"). Although high activity areas can be difficult to predict with a high degree of detail by combining these areas with the areas of high contrast in a picture, the regions of the picture which are visually attractive and important in the perception of the video quality can be determined.
- the embodiments of the invention described hereinbelow relate to a no-reference, decoder-based video quality assessment tool.
- An algorithm for the tool can operate inside a video decoder, using the quantiser step-size parameter (normally a variable included in the incoming encoded video stream) for each decoded macroblock and the pixel intensity values from each decoded picture to make an estimate of the subjective quality of the decoded video.
- a sliding-window average pixel intensity difference (pixel contrast measure) calculation is performed on the decoded pixels for each frame and the resulting average (CWS) is used as a measure of the noise masking properties of the video.
- the quality estimate is then made as a function of the CWS parameter and an average of the step-size parameter.
- the function is predetermined by multiple regression analysis on a training data base of characteristic decoded sequences and previously obtained subjective scores for the sequences.
- the use of the combination of, on the one hand the step-size and, on the other hand, a sliding-window average pixel intensity difference measure to estimate the complexity provides a good estimate of subjective quality.
- the measurement process used is applicable generally to video signals that have been encoded using compression techniques using transform coding and having a variable quantiser step size.
- the versions to be described are designed for use with signals encoded in accordance with the H.262 and H.264 standards. (Although it also applies to the other DCT based standard codecs, such as H.261, H.263, MPEG-2 (frame based) etc.)
- a measurement method according to the invention is of the non-intrusive or "no-reference" type - that is, it does not need to have access to a copy of the original signal.
- the method is designed for use within an appropriate decoder, as it requires access to both the parameters from the encoded bitstream and the decoded video pictures.
- Distortion masking is an important factor affecting the perception of distortion within coded video sequences. Such masking occurs because of the inability of the human perceptual mechanism to distinguish between signal and noise components within the same spectral, temporal or spatial locality. As efficient allocate of bits is important for encoding, the pixel-difference noise masking measure "CS is of great use.
- Figures 4 and 5 illustrate how the contrast measure is calculated for pixels p(x,y) at position (x,y) within a picture of size X pixels in the horizontal direction and Y pixels in the vertical direction respectively.
- a contrast measure is calculated in respect of pixel p(x,y), shown by the shaded region. Adjacent areas of equivalent size are selected (one of which includes the shaded pixel) Each area is formed from a set of (preferably consecutive) pixels from the row in which the shaded pixel is located. The pixel intensity in each area is averaged, and the absolute difference in the averages is then calculated according to equation (2) below, the contrast measure being the value of this difference.
- the vertical contrast measure is calculated in a similar fashion, as shown in Figure 5 .
- an upper set of pixels and a lower set of pixels are select.
- Each of the selected pixels lies on the same column, the shaded pixel next to the border between the upper and lower sets.
- the intensity of the pixels in the upper and lower sets is averaged, and the difference in the average intensity of each set is then evaluated, the absolute value of this difference being the vertical contrast measure as set out in equation (3) below, that is, a measure of the contrast in the vertical direction.
- the shaded pixel is included in the lower set.
- the position of the pixel with which the contrast measure is associated is arbitrary, provided that it is in the vicinity of the boundary shared by the pixels sets being compared.
- the contrast measure is associated with a pixel whose position is local to the common boundary of, on the one hand, the row portions and on the other hand the column portions.
- the so-calculated horizontal contrast measure and vertical contrast measure are then compared, and the greater of the two values (termed the horizontal-vertical measure as set out in equation (4)) is associated with the shaded pixel, and stored in memory.
- This procedure is repeated for each pixel in the picture (within vertical distance V1, V2 and horizontal distances H1, H2 from the vertical and horizontal edges of the picture respectively), thereby providing a sliding window analysis on the pixels, with a window size of H1, H2, V1 or V2.
- the horizontal-vertical measure for each pixel in the picture (frame) is then averaged and this overall measure associated with each picture is then averaged over a plurality of pictures to obtain a sequence-averaged measure.
- the number of pictures over which the overall measure is averaged will depend on the nature of the video sequence, and the time between scene changes, and may be as long as a few seconds. Only part of a picture need be analysed in this way, as will be described in more detail below.
- ⁇ X - H ⁇ 2 - 1 y 0..
- ⁇ X - 1 y V ⁇ 1 - 1.. ⁇ Y - V ⁇ 2 - 1
- H1 and H2 are the window lengths for horizontal pixel analysis and V1 and V2 are the window lengths for vertical pixel analysis.
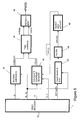
- Figure 6 shows functionally how WO2007/066066 used these contrast measures to provide a perceived mean-opinion-score quality measure (PMOS).
- Figures 6 corresponds to Figure 1 of WO2007/066066 , the contents of which are hereby incorporated by reference, and provides a functional block diagram of decoder components which provide a PMOS derived from contrast measures calculated for areas of high activity.
- the incoming signal is received at an input 30 and passes to a video decoder 32 which decodes and outputs the following parameters for each picture: Decoded picture (D). Horizontal decoded picture size in pixels (X) Vertical decoded picture size in pixels (Y) Horizontal decoded picture in macroblocks (M x ) Vertical decoded picture size in macroblocks (M y ) Set of quantiser step-size parameters (Q) DCT coefficients (R).
- Process block 34 serves to calculate the picture-averaged quantiser step-size signal AvQstep(n) (process block 34) and the picture-averaged contrast measure CW(n) (process block 36).
- Process block 38 time averages of signals AvQstep(n) and CW(n) to give signals AvQstep and CWS respectively.
- process block 40 uses this signal to give an estimate PMOS of the subjective quality for the decoded video sequence D.
- Process blocks 34 to 40 could be implemented by individual hardware elements but a more convenient implementation is to perform all those stages using a suitably programmed processor. Also shown in Figure 6 are process blocks 42, 44, and 46 which collectively enable an area of high activity to be selected from the filtered inverse transform coefficients (DCT coeffs) output by the video decoder 32.
- DCT coeffs filtered inverse transform coefficients
- one or more embodiments of the invention determine the PMOS by taking into account a measure of the luminous intensity of a video sequence.
- the results obtained using this technique indicate this can enable a better prediction of the quality of video perceivable by a human viewer when they view video sequence to be made.
- some video encoding standards such as MPEG4 encode a limited luminance range
- other video encoding methods are known in which a highly dynamic range video encoding techniques is used which can take into account the full range of luminance (although for practical purposes this is limited to a range which the human eye can perceive).
- the video database used to train and test the technique consisted of eighteen different 8-second sequences, all of 625-line broadcast format. Six of the sequences were from the VQEG Phase I database [9] and the remaining sourced from elsewhere. As the quality parameters were to be based on averages over the duration of each sequence, it was important to select content with consistent properties of motion and detail. Details of the sequences are shown in Table 1. Table 1 Training and test sequences. Training Sequenc e Characteristics Test Sequenc e Characteristics Presenter Local detail and motion. Athletics Fast pan and local motion Dance Fast zoom, high motion, low detail. Football1 Fast zoom and pan, local detail and motion Football2 Fast pan, local detail and motion. News Slow zoom, local detail and motion. Ship Slow pan, water, detail.
- All of the training and test sequences were encoded using a H.264 encoder with the same encoder options set for each.
- a frame pattern of I,P,B,P,B,P was used with rate Control disabled and quantisation parameter QP fixed.
- the quantizer step-size parameters were then incremented between tests for each source file.
- Formal single-stimulus subjective tests were performed using 12 subjects for both training and testing sets. Subjective scores were obtained using a 5-grade ACR rating scale. Averaged mean opinion scores results MMOS are shown in Table 2 (training set) and Table 3 (test set). Table 2 Subjective scores for training sequences.
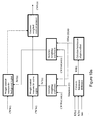
- processing blocks retain the numbering scheme used in Figure 6 for the processing performed by video decoder 32, and an additional processing block 48 is shown relating to the selection of a background area.
- the quantiser parameter QP defines the spacing, QSTEP, of the linear quantiser used for encoding the transform coefficients.
- QP indexes a table of predefined spacings, in which QSTEP doubles in size for every increment of 6 in QP [5,10].
- an average step-size measure AvQP(n) may be calculated by analysing quantizer values for each macroblock QP(n,k) according to (1).
- AvQP n 1 Ktot ⁇ k ⁇ K n QP n ⁇ k n ⁇ N K(n) defines the set of macroblocks in frame n overwhich the analysis is to be performed and Ktot equals the number of macroblocks within this set.
- a sequence-averaged measure of average quantizer parameter may be calculated according to (2).
- AvQP 1 Ntot ⁇ n ⁇ N
- AvQP n Ntot equals the number of frame within the set of frames N .
- QP was fixed at one value of 14 to 42 for P and I macroblocks and 2 greater for B macroblocks.
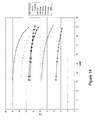
- FIG. 12 the AvQP against measured mean-opinion score MMOS is shown for each of the above 9 training sequences.
- Figure 13 shows the same for the 9 test sequences.
- Figures 12 and 13 illustrate that AvQP is a good basic predictor of subjective score MMOS and that there is quite a consistent separation of the curves by content type.
- Distortion masking is an important factor affecting the perception of distortion within coded video sequences. Such masking occurs because of the inability of the human perceptual mechanism to distinguish between signal and noise components within the same spectral, temporal or spatial locality. Such considerations are of great significance in the design of video encoders, where the efficient allocation of bits is essential. Research in this field has been performed in both the transform and pixel domains [11, 12, 13], but for CS only the pixel domain is considered.
- ⁇ X - H - 1 , y 0..
- H is the window length for horizontal pixel analysis and V is the window length for vertical pixel analysis.
- X and Y are the horizontal and vertical picture analysis dimensions respectively.
- the sequence-averaged contrast measure CS utilizes a whole-image average CF of horizontal and vertical pixel-difference measures. Such a measure can have difficulties with images which contain large areas of well coded plain areas, as such areas would potentially have little visual impact but significantly effect the magnitude of CF and in turn CS.
- Typical hybrid video coding algorithms such as H.262, H.263 and H.264, include functions for the prediction of pixel blocks, transformation of the resulting difference blocks, quantization of the transformed coefficients and entropy coding of these quantized symbols.
- the encoding of broadcast format video sequences at bit rates ⁇ 10 Mbit/s will typically result in the majority of the transform coefficients being quantized to zero.
- a high proportion of non-zero quantized coefficients will tend to indicate a region that is difficult to predict and with a high degree of detail. These regions are potentially useful for regional analysis as they tend to attract visual attention and are subjected to higher quantization effects.
- M(n,k) defines a set of macroblocks centred on macroblock k over which a sum is to be performed.
- K ( n ) defines the set of macroblocks to be considered in frame n N defines the set of frames in the sequence to be considered.
- a region of maximum activity K1(n) may be defined by applying a threshold to the activity array Act1 according to (9).
- K ⁇ 1 n k ⁇ 1 : Act ⁇ 1 n , k ⁇ 1 > Thresh ⁇ 1 n ⁇ k 1 ⁇ K n n ⁇ N
- the masking properties of the region of maximum activity K1 are estimated by calculating an average contrast function according to (11)
- C ⁇ 1 n 1 K ⁇ 1 ⁇ tot n ⁇ k ⁇ 1 ⁇ K ⁇ 1 n C ⁇ 0 k ⁇ 1 n ⁇ N
- K1tot(n) equals the number of members of the set K1(n)
- C0(k1) is a measure of contrast for the pixel area covered by M(n,k1).
- K ⁇ 2 n k ⁇ 2 : k 2 ⁇ K n ⁇ k 2 ⁇ K ⁇ 1 n
- region K2 Whilst region K2 is assumed to have less visible distortion than region K1, its contrast properties can have an important effect on the perception of the overall distortion. Region K2 may have high contrast areas that have been well predicted and therefore not included in region K1. However, such areas might draw visual attention and provide general masking of distortions in K1.
- a threshold of COThresh equal to the average of contrast measure over the region of maximum activity K1 was found to be suitable for the sequences tested.
- the high activity region K1 and the region K3 that has low-activity but significant contrast may be combined to make region K4 according to (16).
- K ⁇ 4 k ⁇ 4 : k ⁇ 4 ⁇ K ⁇ 1 ⁇ K ⁇ 3
- K4tot(n) the number of members of the set K4 for frame n.
- a sequence-averaged regionally weighted contrast measure CWS may be calculated according to (18).
- CWS 1 Ntot ⁇ n ⁇ N CW n
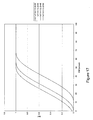
- the sequence-averaged measure CWS was calculated for each of the decoded training sequences and the results, plotted against average quantizer step size, are shown in Figure 15 .
- the CWS results in Figure 15 show encouraging differences to the corresponding CS results in Figure 14 .
- the two sequences "Harp” and "View”, which have similar properties of low-motion and plain backgrounds, have moved to be top ranked by CWS rather than upper-middle ranked by CS. This shows excellent alignment with MMOS ranking in Fig. 12 .
- sequence "Barcelona” moves from CS top-ranked to CWS mid-ranked, which more closely aligns with its MMOS mid-ranking in Fig. 12 .
- Regional measure CWS is designed to focus the analysis on parts of the image that have higher degrees of motion and detail. However, when the "active" area of a picture is small, then it is beneficial to include consideration of the remaining "background” portion of the image, such as is determined by process block 48 in Figure 8 .
- a contrast measure CW5(n) for the "background" region of picture n may be defined according to (19).
- CW ⁇ 5 n 1 K ⁇ 5 ⁇ tot n ⁇ k ⁇ K ⁇ 5 n C ⁇ 0 k n ⁇ N
- Region K5(n) covers all macroblocks that are within a focus of attention region K6(n) but not members of "active" region K4(n), as defined by (20).
- K5tot(n) gives the number of elements in K5(n).
- K ⁇ 5 n k ⁇ 5 : k ⁇ 5 ⁇ K ⁇ 6 n ⁇ k 5 ⁇ K ⁇ 4 n
- the focus of attention region K6(n) is a sub-set of the overall analysis region K(n) and here is chosen to be a result of 25% cropping (left,righ,top,bottom) of the image.
- K ⁇ 6 n k ⁇ 6 : k 6 ⁇ K n the image .
- Region K7(n) covers all macroblocks that are within the focus of attention region K6(n) and also members of "active" region K4(n), as defined by (24).
- K ⁇ 7 n k ⁇ 7 : k ⁇ 7 ⁇ K ⁇ 6 n ⁇ k ⁇ 7 ⁇ K ⁇ 4 n
- Figure 9A shows how a weighted combination CWN(n) of the "active" K7(n) and "background” K5( n ) regions of frame n may be calculated according to (25) utilizing weighting functions fw5 and fw7 .
- Figure 9B comprises the same elements as Figure 9A and shows how the various equations are combined to calculate CWN(n).
- CWN n fw ⁇ 5 n * CW ⁇ 5 n + fw ⁇ 7 n * CW ⁇ 7 n n ⁇ N
- Figure 16 illustrates the effects that these factors have on the function fw7.
- Increasing the factor t1 from 1.0 has the effect of moving the ⁇ 1 saturation points of fw7 up from 0% and down from 100%.
- Increasing the factor t2 from 0.0 shifts the whole fw7 curve to the left, therefore lowering the CW7percent values for fw7 saturation.
- the fw5 weighting (27) is calculated to make a combined fw5 and fw7 weighting of 1.
- t2 defines a threshold of strength-of-activity in the region K6 under which background properties will be considered.
- the strength is measured by the area of active region K7 as a percentage CW7percent of the area of K6.
- Threshold t2 may be adjusted to take into account other properties of the active and background areas according to (28).
- Figures 10A shows how a measure of average luminance difference (29) can be included in the calculation of CWN(n).
- the measure of the average luminance difference has the effect of emphasising active regions that have higher luminance than background regions.
- lum(k) equals the average luminance over element k.
- Luminance difference Idif may be used to adapt threshold t2(n) according to (30).
- t ⁇ 2 n t ⁇ 2 ⁇ min + t ⁇ 2 ⁇ range * max l ⁇ 1 , min l ⁇ 2 , ldif n - l ⁇ 1 / l ⁇ 2 - l ⁇ 1
- Figure 6 illustrates the effect that adapting t2 according to (30) has on the weighting function fw7.
- a sequence-averaged weighted contrast measure CWSN may be calculated according to (31).
- MMOS dependent variable
- AvQP independent variable
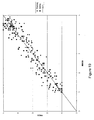
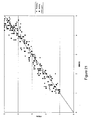
- Results show that the AvQP,CWS,CWSN model gives the highest performance (correlation and MSE) for both training and test data sets.
- the individual training and test results for the AvQP, AvQP / CS , AvQP / CWS and AvQP / CWSN models are shown in the form of a scatter plots in Figs. 18 , 19 , 20 and 21 respectively.
- the invention enables a video quality measure to be determined using measures based on quantizer step-size AvQP, average contrast CS and regionally weighted contrast CWS and a non-linearly weighted combination of "active" and "background” contrast measures.
- One or more embodiments of the invention enable improved accuracy of quality estimation overknown techniques by determining the area, location and contrast of an "active" region of the highest motion and detail along with the area and contrast of the corresponding "background” region.
- the "active" and “background” measures are combined using a non-linear weighting function CWSN with adaptive thresholding that increasingly weights towards the "background” measure for sequences that have a low proportion of active areas.
- CWSN has the effect of ignoring any "background” contribution when a significant proportion of the image is deemed to be active and of adding particular weight to background areas for images with low activity.
- a perceived mean opinion score quality measure can be automatically calculated using a method of generating a measure of quality according to the invention.
- the quality measure could also be used to control the way a decoder applies post-filtering by functioning as a feedback loop, as Figures 11a and 11b of the accompanying drawings.
- Figures 11a and 11b show an encoding/decoding system of the type shown in Figure 2 and retains the numbering scheme of Figure 2 of the accompanying drawings.
- the post-filtered output from the decoder is used to generate a PMOS calculated using a method of determining a quality measure according to an embodiment of the invention.
- the resulting PMOS values can then be suitably fed back into the post-filter system and a new post-filtered signal output.
- a PMOS for one or more segments of a video sequence is calculated using a method of determining a quality measure according to an embodiment of the invention prior to post-filtering and the PMOS values are then used to adjust the post-filtering the decoder performs.
- references to “one embodiment,” “an embodiment,” “example embodiment,” “various embodiments,” etc. indicate that the embodiment(s) of the invention so described include a particular feature, structure, or characteristic. However, it is not necessary for every embodiment to comprise that particular feature, structure, or characteristic. Where the phrase “in one embodiment,” or “in an exemplary embodiment,” is referred to herein above it may or may not refer to the same embodiment as would be apparent to one of ordinary skill in the art.
- computing platform comprises one or more data processors, where a data “processor” refers to any device or portion of a device that processes electronic data from registers and/or memory to transform that electronic data into other electronic data that is capable of being stored in registers and/or memory.
- One or more embodiments of the invention include apparatuses for performing the operations herein.
- An apparatus may be specially constructed for the desired purposes, or it may comprise a general purpose device selectively activated or reconfigured by a program stored in the device.
- a feature described herein in an embodiment of the invention may be implemented in one or a combination of hardware, firmware, and software.
- a feature is implemented as instructions stored on a machine-readable medium, such instructions may be read and executed by a computing platform to perform one or more or all of the operations and/or method steps described herein.
- machine-readable medium comprises any mechanism for storing or transmitting information in a form readable by a machine (e.g., a computer).
- machine-readable mediums include, but are not limited to : read only memory (ROM), random access memory (RAM), magnetic disk storage media, optical storage media, flash memory devices, and propagated electrical, optical, acoustical or other suitable digital and/or analogue signals (for example, carrier waves, infrared signals, digital signals, etc).
- references to the term "computer program” and/or “computer control logic” include as appropriate references to machine code and/or executable code and/or source code which when compiled results in execution on a computing platform of the computer program.
- a computer program may be provided in an electronically downloadable format or in a format which is stored in the main memory and/or secondary memory of a computing platform and/or data storage means capable of being attached and removed from a computing platform.
- a computer program is stored in one or more data storage means it comprises a computer program product.
- Such computer programs when executed, are arranged to enable the computer platform or system to perform the features of the present invention as discussed herein.
- the computer programs, when executed, are arranged to enable a processor to implement one or more steps in a method according to an embodiment of the invention. Accordingly, such computer programs may represent data controllers of the computer system.
- a computer program product comprising a computer readable medium having control logic (computer software) stored therein may be provided to distribute the invention or cause, when the product is loaded and running on one or more computer platforms, a method according to an embodiment of the invention to be performed.
- the control logic when executed by one or more processors, causes the one or more processors to perform one or more of the functions of a method according to an embodiment of the invention as described herein.
- the computer program product software may be loaded into a computer system using any appropriate means, including appropriate data storage reading means and/or via a network communications interface card.
- Software implementing control logic executed by a data processor causes the processor to perform the functions of an embodiment of the invention as described herein.
- the computer program product software may run as a standalone software application program running in an operating system. Alternatively, it may be integrated into an operating system of the computing platform.
- ASICs application specific integrated circuits
- FPGAs field programmable gateways
- state machines any appropriate implementation of the hardware state machine so as to perform the functions described herein may be used as is apparent to a person or persons skilled in the relevant art(s).
Abstract
A method of generating a measure of quality for a video signal representative of a plurality of frames, the video signal having: an original form; an encoded form in which the video signal has been encoded using a compression algorithm utilising a variable quantiser step size such that the encoded signal has a quantiser step size parameter associated therewith and utilising differential coding such that the encoded signal contains representations of the prediction residual of the signal; and a decoded form in which the encoded video signal has been at least in part reconverted to the original form, the method comprising: a) generating a first quality measure which is dependant on said quantiser step size parameter according to a predetermined relationship; b) generating a masking measure, the masking measure being dependant on the spatial complexity of at least part of the frames represented by the video signal in the decoded form according to a first predetermined relationship; and c) generating a combined measure, the combined measure being dependant upon both the first measure and the masking measure according to a predetermined relationship, wherein, the method also includes: generating an first measure which is dependant on the prediction residual of the signal according to a first predetermined relationship; and identifying one or more regions of the picture for which the first measure exceeds a threshold, wherein the masking measure is dependant on the spatial complexity of the identified region(s) according to a predetermined relationship; and further comprises: generating a background measure which is dependant on the prediction residual of the signal according to a second predetermined relationship; and identifying one or more other regions of the picture for which the background measure is below a threshold, wherein the masking measure is dependent on the spatial complexity of the identified other region(s) according to a predetermined relationship.
Description
- This invention is concerned with a video quality measure, in particular in situations where a video signal has been encoded using a compression algorithm.
- When a video signal is to be transmitted from one location to another, it is known to encode or compress the signal using an encoding algorithm, such that the encoded signal can be transmitted using a lower bandwidth than would be needed without encoding. Upon reception, the encoded signal is decoded to retrieve the original signal. In many encoding techniques, a two dimensional cosines transform is performed, resulting in a series of transform coefficients, whose magnitude is quantized. So that the bandwidth can be allocated efficiently, the granularity of the quantisation, that is, the step size, is allowed to vary.
- The process of encoding and decoding the video sequence can introduce distortion or otherwise reduce the quality of the signal. One way of measuring the level of distortion involves noting the opinion of viewers as to the level of perceptible distortion in a distorted video sequence, and averaging the results so as to obtain a Mean Opinion Score (MOS). However, this can be a time consuming process. As a result, it can be desirable to predict the loss of quality that a viewer will perceive in a video sequence. Although the degradation in the video quality as a result of encoding/decoding and the transmission process can be obtained by reference to the original sequence, such an approach is often inconvenient.
- In predictive coding, the difference between the actual signal and the predicted one, known as the "prediction residual" may be transmitted. More usually, a quantised version of it is transmitted.
- According to international patent application
WO2007/066066 , there is provided a method of generating a measure of quality for a video signal representative of a plurality of frames, the video signal having: an original form; an encoded form in which the video signal has been encoded using a compression algorithm utilising a variable quantiser step size such that the encoded signal has a quantiser step size parameter associable therewith; and, a decoded form in which the encoded video signal has been at least in part reconverted to the original form, the method comprising the steps of: a) generating a first quality measure which is a function of said quantiser step size parameter; b) generating a second quality measure which is a function of the spatial complexity of at least part of the frames represented by the video signal in the decoded form; and, c) combining the first and second measures. - In predictive coding, the difference between the actual signal and the predicted one, known as the "prediction residual" may be transmitted. More usually, a quantised version of it is transmitted.
- According to international patent application,
WO 2010004238 , there is provided a method of generating a measure of quality for a video signal representative of a plurality of frames, the video signal having: an original form; an encoded form in which the video signal has been encoded using a compression algorithm utilising a variable quantiser step size such that the encoded signal has a quantiser step size parameter associated therewith and utilising differential coding such that the encoded signal contains representations of the prediction residual of the signal; and a decoded form in which the encoded video signal has been at least in part reconverted to the original form, the method comprising: a) generating a first quality measure which is dependant on said quantiser step size parameter according to a predetermined relationship; b) generating a masking measure, the masking measure being dependant on the spatial complexity of at least part of the frames represented by the video signal in the decoded form according to a predetermined relationship; and c) generating a combined measure, the combined measure being dependant upon both the first measure and the masking measure according to a predetermined relationship; wherein the method also includes: generating a second measure which is dependant on the prediction residual of the signal according to a predetermined relationship; identifying one or more regions of the picture for which the second measure exceeds a threshold; and wherein the masking measure is dependant on the spatial complexity of the identified region(s) according to a predetermined relationship. - The above techniques predict a picture quality measure using measures based on quantizer step-size and average contrast.
- Full-reference video quality measurement tools, utilising both source and degraded video sequences in analysis are known to be able to provide highly accurate predictions of video quality for broadcast video.
- The design of no-reference techniques with no access to the pre-impaired "reference" sequence such as those of the embodiments of the invention is more challenging. Known no-reference analysis techniques require access to the encoded bit-stream, either within a decoder or elsewhere in the network. Such "bit-stream" analysis has the advantage of having ready access to coding parameters, such as quantizer step-size, motion vectors and block statistics, which are unavailable to a frame buffer analysis. Bit-stream analysis can range from computationally light analysis of decoded parameters, with no inverse transforms or motion predicted macroblock reconstruction, through to full decoding of the video sequence. When placed in a full video decoder, the bit-stream analysis may be used in conjunction with frame buffer techniques.
- Earlier work [1,2,3] presented a no-reference video quality prediction technique operating within a H.264/AVC decoder that outperformed the full-reference PSNR measure in predicting subjective video quality. This technique combines a measure of average quantizer step-size AvQP from the encoded parameters with a pixel-difference noise masking measure CS taken from the decoded image sequence. The resulting decoder-based "hybrid" no-reference model is shown to achieve a high correlation between measured and estimated subjective scores when tested over a variety of H.264 encoded sequences.
- In [4], a spatially sensitive measure of noise masking CWS is introduced as an improvement to the picture-averaged measure CS. The CWS measure is calculated over a region K4 that includes the highest activity and highest contrast areas of a picture. High activity is assigned to areas of each picture with the highest proportion of non-zero quantized transform coefficients and such areas are assumed to be difficult to predict with a high degree of detail. The high activity and high contrast areas of the picture that make up the region K4 attract visual attention and are important in the perception of quality. These areas are therefore used to calculate the noise masking measure CWS.
- The invention seeks to improve the estimation of the quality of encoded broadcast video sequences within a video decoder which such known techniques provide. A method is provided in which a non-linearly weighted masking function is applied to high and low activity picture regions.
- It is shown that the use of the regional measure CWS may be further improved by considering the area, location and contrast of the active region K4 along with the area and contrast of the "background" region nK4. The "active" and "background" measures are combined using a non-linear weighting function CWSN that increasingly weights towards the "background" measure for sequences that have a low proportion of active areas.
- Consideration is first given to the use of average quantizer step-size AvQP to estimate subjective quality. Secondly, the noise masking measures CS and CWS are reviewed. Then, the non-linear weighting function CWSN for the "active" and "background" regions is described. Finally, quality prediction results are presented for models designed around the parameters AvQP, CS, CWS and CWSN for H.264 encoded broadcast format sequences.
- The aspects and embodiments of the invention are as set out below and in the accompanying claims and may be combined with each other in any suitable manner apparent to one of ordinary skill in the art. References herein to one or an embodiment do not necessarily refer to the same embodiment.
- Embodiments of the invention will now be described with reference to the accompanying drawings which are by way of example only and in which:
-
Figure 1 shows a series of three frames indicating regions of temporal activity, detailed and non-detailed background; -
Figure 2 shows a basic encoding/decoding system for which a PMOS can be calculated according to an embodiment of the invention; -
Figure 3 shows how a horizontal contrast measure is calculated for a pixel in a picture; -
Figure 3 shows how a vertical contrast measure is calculated for a pixel in a picture; -
Figure 5 shows in process block form an apparatus known in the art for estimating the quality of a video sequence; -
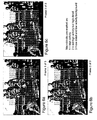
Figures 6a,6b, 6c show a sequence of frames, in which on each frame of the sequence macroblocks indicating areas of high activity, not high activity but high detail, and low activity and low activity background are shown. -
Figures 7a ,b ,c are enlarged versions ofFigures 6a,6b, 6c ; -
Figure 8 shows a block diagram of an apparatus according to an embodiment of the invention in which a background area is selected in order to include K5(n) when determining the contrast measure of picture region. -
Figures 9A and9B show schematically (and respectively without and with the relevant equations) in block function form how the weighting coefficient fw7(n) is generated and applied to the contrast weighting CW7(n) to generate the weight contrast measure for the active region selected in the embodiment of the inveniton shown inFigure 8 and how the weighting coefficient fw5(n) is generated and applied to the contrast weighting CW5(n) to generate the weighted contrast measure for the background region selected inFigure 8 and how the two weighted contrasts measures for the active and background regions are combined to generate the overall weighted contrast measure CWN(n). -
Figures 10A and10B show schematically (and respectively with and without the relevant equations in block function form how the luminance-adapted offset can be used to generate CWN(n); -
Figures 11 a and 11 b show embodiments of the invention in which the PMOS calculated is used to control the post-filtering provided by a decoder according to the invention; and -
Figures 12 to 21 show various results for measures obtained from methods of calculating a video quality measure according to embodiments of the invention. - The best mode of the invention will now be described with reference to the accompanying drawings. In the following description of the preferred embodiments of the invention, those of ordinary skill in the art will be aware of modifications and functional equivalents to those features of the invention which are described herein below and that certain features of the invention may be omitted from the description for the sake of brevity and clarity where their inclusion and function as part of the invention is apparent and known to those of ordinary skill in the art.
-
Figure 1 of the accompanying drawings shows a simplistic set of threeconsecutive frames Figs 1a,b,c ), a region of high activity 4 (which from frame to frame inFigs. 1a,b,c is shown by the movement of the smiley face), and an area of not much high activity but of high detail 6 (shown as the "brick" hatched area inFigures 1a,1b, and 1c ). -
Figure 2 of the accompanying drawings shows schematically a typical video encoding/decoding system comprising a video compressor orencoder 12 arranged to convert a video sequence fromdata source 10 into a compressed form which occupies less bits by removing redundant data. Theencoder 12 uses a suitable video compression techniques to compact a digital video sequence into a smaller number of bits to enable more efficient storage and transport. The electronic signal output from the encoder can be either stored on a fixed storage medium or, assuming it is suitable encoded for transmission, transmitted over a communications network either as a file or bit-stream. Adecoder 14 decompresses the compressed video sequence into a format suitable for playback on a suitable device (not shown). - As shown schematically in
Figure 2 , theencoder 12 comprises functional blocks which include predication, transforming and encoding received data and the decoder comprises functional blocks which decode received data, perform an inverse transform, and finally reconstruct the video frame sequence. The reconstructed video frame sequence will, when viewed, be considered by most viewers to have a particular picture/sound etc quality. - Changes between video frames result from both object motion, camera motion, uncovered objects, and lighting changes. Motion results in pixel movements between frames and a set of temporal model parameters (for example, motion vectors to represent how the motion between frames was compensated for by the temporal model) which is sent to an entropy encoder. Various techniques are known to estimate motion and compensate for this including block based techniques which are based on "blocks" of pixels within a frame. A small block-size involves more complexity (to determine what pixels will form a "block") but usually results in a residual which has less energy (i.e., as the motion prediction for the block is more accurate), but a frame then requires a larger set of motion vectors. The H.264 video coding standard for example, uses an adaptive motion compensation block size, which basically adapts the block size to the picture characteristics so that typically large blocks are used for flat, homogenous regions of a frame whereas small blocks are provided in areas of high detail and complex motion.
- As shown in
Figure 2 , the video decoder comprises abuffer 20, anentropy decoder 20 which reconstructs a video frame from a compressed bit stream by first decoding the coded spatial and temporal model parameters (the coded residual coefficients and motion vector parameters). The spatial model is then decoded to enable a version of the residual frame to be reconstructed. The decoder then uses the temporal model parameters together with one or more previously decoded frames to create a prediction of the current frame, and the actual current frame is reconstructed by adding the residual frame to the prediction. - In broadcast systems, a video sequence is usually encoded for playback by a plurality of decoders which may have different decoding characteristics or which are arranged to decode differently depending on the display characteristics they are providing output to. The video sequence is encoded in a format which supports its display at various levels of perceived video quality and each device must determine how best to decode the received video sequence according to its display characteristics.
- As all high video compression techniques are lossy, the decompressed picture quality will differ from the quality prior to compression and the perceived quality of the decompressed picture may differ as the human eye responds differently to light at different wavelengths of the visible electromagnetic spectrum. For example, for many people the photopic response of the eye (its ability to distinguish between different frequencies of light, i.e, our colour vision) generally varies differently to the scotopic response (the eye's ability to distinguish the intensity of light, i.e., how bright or dim a particular frequency (colour)) is as a function of wavelength. In general, determining the most appropriate technique for de-coding a video sequence depends to some extent on the type of image sequence the video contains. For example, the human eye response is sensitive to the contrast between different parts of a image and to the level of motion in the background and foreground parts of the image.
- One way of enabling a decoder to determine the quality of a received video sequence is to provide reference frames in the video sequence. Reference frames are provided to enable video quality to be measured and full-reference video quality measurement tools, utilising both source and degraded video sequences in analysis, have been shown to be capable of highly accurate predictions of video quality for broadcast video (see for example the Final report from the Video Quality Experts Group on the Validation of Objective Models of Video Quality Assessment,
Phase 2, available to down load from www.vqeg.org, and ITU-T, J.144, "Objective perceptual video quality measurement techniques for digital cable television in the presence of a full reference". - No-reference video quality prediction technique which operate within a H.264/AVC decoder and combine a measure of average quantizer step-size ("AvQP") from the encoded parameters with a pixel-difference noise masking measure "CS" taken from the decoded image sequence, which measures pixel contrast, are known in the art. CS, the pixel-difference noise masking measure provides a picture quality prediction which is picture-averaged and the prediction can be improved by using a spatially sensitive measure of noise masking "CWS" which is calculated over a region that includes both the highest activity and highest contrast areas of a picture. The CWS measure is based on determining which areas of a picture have the highest proportion of non-zero quantized transform coefficients ("high activity"). Although high activity areas can be difficult to predict with a high degree of detail by combining these areas with the areas of high contrast in a picture, the regions of the picture which are visually attractive and important in the perception of the video quality can be determined.
- The embodiments of the invention described hereinbelow relate to a no-reference, decoder-based video quality assessment tool. An algorithm for the tool can operate inside a video decoder, using the quantiser step-size parameter (normally a variable included in the incoming encoded video stream) for each decoded macroblock and the pixel intensity values from each decoded picture to make an estimate of the subjective quality of the decoded video. A sliding-window average pixel intensity difference (pixel contrast measure) calculation is performed on the decoded pixels for each frame and the resulting average (CWS) is used as a measure of the noise masking properties of the video. The quality estimate is then made as a function of the CWS parameter and an average of the step-size parameter. The function is predetermined by multiple regression analysis on a training data base of characteristic decoded sequences and previously obtained subjective scores for the sequences. The use of the combination of, on the one hand the step-size and, on the other hand, a sliding-window average pixel intensity difference measure to estimate the complexity provides a good estimate of subjective quality.
- In principle the measurement process used is applicable generally to video signals that have been encoded using compression techniques using transform coding and having a variable quantiser step size. The versions to be described however are designed for use with signals encoded in accordance with the H.262 and H.264 standards. (Although it also applies to the other DCT based standard codecs, such as H.261, H.263, MPEG-2 (frame based) etc.)
- A measurement method according to the invention is of the non-intrusive or "no-reference" type - that is, it does not need to have access to a copy of the original signal. The method is designed for use within an appropriate decoder, as it requires access to both the parameters from the encoded bitstream and the decoded video pictures.
- Distortion masking is an important factor affecting the perception of distortion within coded video sequences. Such masking occurs because of the inability of the human perceptual mechanism to distinguish between signal and noise components within the same spectral, temporal or spatial locality. As efficient allocate of bits is important for encoding, the pixel-difference noise masking measure "CS is of great use.
-
Figures 4 and5 illustrate how the contrast measure is calculated for pixels p(x,y) at position (x,y) within a picture of size X pixels in the horizontal direction and Y pixels in the vertical direction respectively. As shown inFigure 4 , a contrast measure is calculated in respect of pixel p(x,y), shown by the shaded region. Adjacent areas of equivalent size are selected (one of which includes the shaded pixel) Each area is formed from a set of (preferably consecutive) pixels from the row in which the shaded pixel is located. The pixel intensity in each area is averaged, and the absolute difference in the averages is then calculated according to equation (2) below, the contrast measure being the value of this difference. - The vertical contrast measure is calculated in a similar fashion, as shown in
Figure 5 . Here, an upper set of pixels and a lower set of pixels are select. Each of the selected pixels lies on the same column, the shaded pixel next to the border between the upper and lower sets. The intensity of the pixels in the upper and lower sets is averaged, and the difference in the average intensity of each set is then evaluated, the absolute value of this difference being the vertical contrast measure as set out in equation (3) below, that is, a measure of the contrast in the vertical direction. In the present example, the shaded pixel is included in the lower set. However, the position of the pixel with which the contrast measure is associated is arbitrary, provided that it is in the vicinity of the boundary shared by the pixels sets being compared. - Thus, to obtain the horizontal contrast measure, row portions of length H1 and H2 are compared, whereas to obtain the vertical contrast measure, column portions of length V1 and V2 are compared (the length H1, H2 and V1, V2 may but need not be the same). The contrast measure is associated with a pixel whose position is local to the common boundary of, on the one hand, the row portions and on the other hand the column portions.
- The so-calculated horizontal contrast measure and vertical contrast measure are then compared, and the greater of the two values (termed the horizontal-vertical measure as set out in equation (4)) is associated with the shaded pixel, and stored in memory.
- This procedure is repeated for each pixel in the picture (within vertical distance V1, V2 and horizontal distances H1, H2 from the vertical and horizontal edges of the picture respectively), thereby providing a sliding window analysis on the pixels, with a window size of H1, H2, V1 or V2. The horizontal-vertical measure for each pixel in the picture (frame) is then averaged and this overall measure associated with each picture is then averaged over a plurality of pictures to obtain a sequence-averaged measure. The number of pictures over which the overall measure is averaged will depend on the nature of the video sequence, and the time between scene changes, and may be as long as a few seconds. Only part of a picture need be analysed in this way, as will be described in more detail below.
- By measuring the contrast at different locations in the picture and taking the average, a simple measure of the complexity of the picture is obtained. Because complexity in a picture can mask distortion, and thereby cause an observer to believe that a picture is of a better quality for a given distortion, the degree of complexity in a picture can be used in part to predict the subjective degree of quality a viewer will associate with a video signal.
- The width or height of the respective areas about the shaded pixel is related to the level of detail at which an observer will notice complexity. Thus, if an image is to be viewed from afar, these will be chosen so as to be larger than in situations where it is envisaged that the viewer will be closer to the picture. Since in general, the distance from a picture at which the viewer will be comfortable depends on the size of the picture, the size will also depend on the pixel size and the pixel dimensions (larger displays typically have larger pixels rather than more pixels, although for a given pixel density, the display size could also be a factor). Typically, it is expected that H1, H2 and V1, V2 will each be between 0.5% and 2% of the respective picture dimensions. For example, the horizontal values could be 4*100/720=0.56%, where there are 720 pixels horizontally and each set for average contains 4 pixels, and in the vertical direction, 4*100/576=0.69% where there are 576 pixels in the vertical direction.
- Accordingly, as shown in
Figures 4 and5 , the pixel difference contrast measures Ch and Cv are calculated according to
where d(n,x,y) is the pixel intensity value (0..255) within the n'th frame of N from decoded sequence d of dimension of X horizontal (x=0..X-1) and Y vertical (y=0..Y-1) pixels.
where H1 and H2 are the window lengths for horizontal pixel analysis and V1 and V2 are the window lengths for vertical pixel analysis. - Ch and Cv may then be combined to give a horizontal-vertical measure Chv,

-
Figure 6 shows functionally howWO2007/066066 used these contrast measures to provide a perceived mean-opinion-score quality measure (PMOS).Figures 6 corresponds toFigure 1 ofWO2007/066066 , the contents of which are hereby incorporated by reference, and provides a functional block diagram of decoder components which provide a PMOS derived from contrast measures calculated for areas of high activity. - In the apparatus shown in
Figure 6 , the incoming signal is received at aninput 30 and passes to avideo decoder 32 which decodes and outputs the following parameters for each picture: Decoded picture (D).
Horizontal decoded picture size in pixels (X)
Vertical decoded picture size in pixels (Y)
Horizontal decoded picture in macroblocks (Mx)
Vertical decoded picture size in macroblocks (My)
Set of quantiser step-size parameters (Q)
DCT coefficients (R). - There are two processing paths shown in the apparatus of
Figure 6 , which serve to calculate the picture-averaged quantiser step-size signal AvQstep(n) (process block 34) and the picture-averaged contrast measure CW(n) (process block 36).Process block 38 time averages of signals AvQstep(n) and CW(n) to give signals AvQstep and CWS respectively. Finally, these signals are combined inprocess block 40 to give an estimate PMOS of the subjective quality for the decoded video sequence D. - Process blocks 34 to 40 could be implemented by individual hardware elements but a more convenient implementation is to perform all those stages using a suitably programmed processor. Also shown in
Figure 6 are process blocks 42, 44, and 46 which collectively enable an area of high activity to be selected from the filtered inverse transform coefficients (DCT coeffs) output by thevideo decoder 32. - In contrast to
Figure 6 , one or more embodiments of the invention determine the PMOS by taking into account a measure of the luminous intensity of a video sequence. The results obtained using this technique indicate this can enable a better prediction of the quality of video perceivable by a human viewer when they view video sequence to be made. Whilst some video encoding standards such as MPEG4 encode a limited luminance range other video encoding methods are known in which a highly dynamic range video encoding techniques is used which can take into account the full range of luminance ( although for practical purposes this is limited to a range which the human eye can perceive). - The level of background detail as well as the level of activity in a video sequence was analysed. Examples of a video sequence showing macroblocks of high activity (marked as 1), macroblocks with no high-activity but high detail (marked as 2), and with low detail and low activity background (marked as 3) are shown in
Figures 6a to 6c , and also, in an enlarged format inFigures 7a to 7c . A macroblock which has been marked with a 2 shows K3 intersecting with K2 (described in more detail hereinbelow), and a macroblock marked with a 3 shows k5 (also described in more detail hereinbelow). - The video database used to train and test the technique consisted of eighteen different 8-second sequences, all of 625-line broadcast format. Six of the sequences were from the VQEG Phase I database [9] and the remaining sourced from elsewhere. As the quality parameters were to be based on averages over the duration of each sequence, it was important to select content with consistent properties of motion and detail. Details of the sequences are shown in Table 1.
Table 1 Training and test sequences. Training Sequenc e Characteristics Test Sequenc e Characteristics Presenter Local detail and motion. Athletics Fast pan and local motion Dance Fast zoom, high motion, low detail. Football1 Fast zoom and pan, local detail and motion Football2 Fast pan, local detail and motion. News Slow zoom, local detail and motion. Ship Slow pan, water, detail. Weather Low motion, high texture. Soap Slow pan, high contrast, motion. Fries Fast pan, film. Barcelona Saturated colour, slow zoom. Rocks Movement, contrast variations. Canoe Water movement, pan, detail. Sport Thin detail, movement. Harp Slow zoom, thin detail. Calendar High detail, slow pan. View Slow movement, detail. Rugby Movement, fast pan. - All of the training and test sequences were encoded using a H.264 encoder with the same encoder options set for each. A frame pattern of I,P,B,P,B,P was used with rate Control disabled and quantisation parameter QP fixed. The quantizer step-size parameters were then incremented between tests for each source file.
- Formal single-stimulus subjective tests were performed using 12 subjects for both training and testing sets. Subjective scores were obtained using a 5-grade ACR rating scale. Averaged mean opinion scores results MMOS are shown in Table 2 (training set) and Table 3 (test set).
Table 2 Subjective scores for training sequences. Sequence QP-P, QP-B 14 16 24 26 30 32 34 36 38 40 42 44 Presenter 4.5 8 4.8 3 4.5 0 4.3 3 3.8 3 3.3 3 3.0 8 2.5 0 2.0 8 2.0 0 1.2 5 1.1 7 Dance 4.5 0 4.0 0 4.0 8 4.1 7 3.8 3 4.0 0 3.2 5 2.7 5 2.4 2 2.1 7 1.6 7 1.5 0 Football2 4.2 5 4.0 8 4.0 0 3.7 5 2.9 2 2.2 5 2.1 7 1.5 0 1.1 7 1.0 0 1.0 0 1.0 8 Ship 4.5 8 4.5 0 4.6 7 4.3 3 3.6 7 3.4 2 2.8 3 2.1 7 2.0 8 1.9 2 2.0 0 1.1 7 Soap 4.4 2 4.4 2 4.5 0 3.8 3 2.9 2 2.8 3 2.2 5 1.9 2 1.3 3 1.3 3 1.0 8 1.0 8 Barcelona 4.5 0 4.5 0 4.7 5 4.3 3 3.9 2 3.9 2 3.0 8 3.0 0 2.2 5 1.8 3 1.4 2 1.1 7 Canoe 4.5 0 4.9 2 4.3 3 4.3 3 3.9 2 3.3 3 3.0 0 2.5 8 2.1 7 1.8 3 1.2 5 1.1 7 Harp 4.8 3 4.5 0 4.6 7 4.4 2 4.4 2 3.6 7 3.6 7 2.3 3 2.2 5 2.0 8 1.8 3 1.4 2 View 4.5 8 4.7 5 4.7 5 4.7 5 4.5 8 4.5 8 4.0 0 3.0 8 2.9 2 2.8 3 2.0 0 1.6 7 Table 3 Subjective scores for test sequences. Sequence QP-P, QP- B 14 16 24 26 30 32 34 36 38 40 42 44 Athletics 4.5 0 4.3 3 4.5 8 4.0 8 3.6 7 3.5 8 2.7 5 2.4 2 2.0 0 1.2 5 1.0 8 1.0 0 Football1 4.7 8 4.5 0 3.9 2 3.2 5 2.8 3 2.5 8 2.0 0 1.7 5 1.5 8 1.2 5 1.0 8 1.0 8 News 4.0 8 4.2 5 4.2 5 4.0 0 3.9 2 3.3 3 3.1 7 2.6 7 2.4 2 2.0 0 1.7 5 1.1 7 Weather 4.2 5 4.3 3 3.8 3 3.7 5 3.3 3 3.1 7 2.8 3 2.6 7 1.9 2 1.8 3 1.4 2 1.4 4 Fries 4.4 2 4.4 2 4.4 2 4.3 3 3.6 7 3.5 0 3.0 0 2.2 5 2.0 0 1.8 3 1.3 3 1.1 7 Rocks 4.2 4.5 4.5 4.5 4.2 4.0 4.1 3.6 2.9 2.1 1.7 1.4 5 0 8 8 5 8 7 7 2 7 5 2 Sport 4.5 8 4.7 5 4.4 2 4.4 2 3.9 2 3.1 7 2.6 7 2.6 7 2.2 5 1.3 3 1.4 2 1.1 7 Calendar 4.4 2 4.8 3 4.6 7 4.3 3 4.2 5 3.8 3 3.5 8 3.1 7 2.5 0 2.0 8 1.4 2 1.3 3 Rugby 4.4 2 4.5 0 4.5 8 4.3 3 3.7 5 4.4 2 3.7 5 3.3 3 2.8 3 2.5 0 2.1 7 1.8 3 - It has been shown in [1,2,3] that for H.264 encoding accurate prediction of subjective quality may be made from the combination of a measure of average quantizer step-size AvQP and a pixel-difference noise masking measure CS. In [4], prediction accuracy is improved through use of an "active" region contrast measure CWS. Here, further refinement is presented by use of non-linear weighting of "active" and "background" regions. In this section, the measures AvQP, CS and CWS are reviewed and the implementation and function of the new non-linear weighting function CWSN described.
- Referring now to
Figure 8 of the accompanying drawings, processing blocks retain the numbering scheme used inFigure 6 for the processing performed byvideo decoder 32, and anadditional processing block 48 is shown relating to the selection of a background area. - For H.264, the quantiser parameter QP defines the spacing, QSTEP, of the linear quantiser used for encoding the transform coefficients. QP indexes a table of predefined spacings, in which QSTEP doubles in size for every increment of 6 in QP [5,10].
- For frame n from a set of N frames in a sequence, an average step-size measure AvQP(n) may be calculated by analysing quantizer values for each macroblock QP(n,k) according to (1).

K(n) defines the set of macroblocks in frame n overwhich the analysis is to be performed and Ktot equals the number of macroblocks within this set. - A sequence-averaged measure of average quantizer parameter may be calculated according to (2).

Ntot equals the number of frame within the set of frames N. - For each test on the training set, QP was fixed at one value of 14 to 42 for P and I macroblocks and 2 greater for B macroblocks.
- Referring now to
Figure 12 , the AvQP against measured mean-opinion score MMOS is shown for each of the above 9 training sequences.Figure 13 shows the same for the 9 test sequences.Figures 12 and13 illustrate that AvQP is a good basic predictor of subjective score MMOS and that there is quite a consistent separation of the curves by content type. - Distortion masking is an important factor affecting the perception of distortion within coded video sequences. Such masking occurs because of the inability of the human perceptual mechanism to distinguish between signal and noise components within the same spectral, temporal or spatial locality. Such considerations are of great significance in the design of video encoders, where the efficient allocation of bits is essential. Research in this field has been performed in both the transform and pixel domains [11, 12, 13], but for CS only the pixel domain is considered.
- In [1] pixel difference contrast measures Ch and Cv are calculated for frame n according to


- H is the window length for horizontal pixel analysis and V is the window length for vertical pixel analysis. X and Y are the horizontal and vertical picture analysis dimensions respectively. Ch and Cv may then be combined to give a horizontal-vertical measure Chv,

- Chv may then used to calculate an overall pixel difference measure, CF, for a frame according to

and in turn a sequence-averaged measure CS,
- The sequence-averaged measure CS was calculated for each of the decoded training sequences using H=4 and V=2 and the results, plotted against AvQP, are shown in
Figure 14 . - Results from [1] show the measure CS to be related to the noise masking properties of the sequences. High CS suggests high masking and therefore higher MMOS for a given quantizer step-size. The potential use of the CS measure in no-reference quality estimation was tested by its inclusion in the multiple regression analysis described below.
- The sequence-averaged contrast measure CS utilizes a whole-image average CF of horizontal and vertical pixel-difference measures. Such a measure can have difficulties with images which contain large areas of well coded plain areas, as such areas would potentially have little visual impact but significantly effect the magnitude of CF and in turn CS.
- Typical hybrid video coding algorithms, such as H.262, H.263 and H.264, include functions for the prediction of pixel blocks, transformation of the resulting difference blocks, quantization of the transformed coefficients and entropy coding of these quantized symbols. The encoding of broadcast format video sequences at bit rates <10 Mbit/s will typically result in the majority of the transform coefficients being quantized to zero. A high proportion of non-zero quantized coefficients will tend to indicate a region that is difficult to predict and with a high degree of detail. These regions are potentially useful for regional analysis as they tend to attract visual attention and are subjected to higher quantization effects.
- It is convenient to base the regional analysis about the regular macroblock structures found in these encoders. For frame number n, a measure of DCT activity Act1 may be calculated for a macroblock k according to

Tsum(m) represents the sum of non-zero quantized transform coefficients within macroblock m. M(n,k) defines a set of macroblocks centred on macroblock k over which a sum is to be performed.
K(n) defines the set of macroblocks to be considered in frame n
N defines the set of frames in the sequence to be considered. - For frame n, a region of maximum activity K1(n) may be defined by applying a threshold to the activity array Act1 according to (9).

- Thresh1 may be defined as a function of the maximum activity within a picture according to (10).

- Firstly the masking properties of the region of maximum activity K1 are estimated by calculating an average contrast function according to (11)

where K1tot(n) equals the number of members of the set K1(n) and C0(k1) is a measure of contrast for the pixel area covered by M(n,k1). - If CFK (k1) is defined as the pixel contrast measure CF from equations (3) to (6) applied to the pixel area covered by M(n,k1) then

- The area of the picture that is within the initial analysis region K(n) but not included in the region of maximum activity K1(n) is also important. This region may be defined as K2(n) whose members k2 obey (13).

- Whilst region K2 is assumed to have less visible distortion than region K1, its contrast properties can have an important effect on the perception of the overall distortion. Region K2 may have high contrast areas that have been well predicted and therefore not included in region K1. However, such areas might draw visual attention and provide general masking of distortions in K1. Areas of picture within K2 that have contrast properties comparable with those in K1 are included in the analysis of the cropped picture K by using a threshold COThresh(n) to define a set K3(n) according to (14)


- A threshold of COThresh equal to the average of contrast measure over the region of maximum activity K1 was found to be suitable for the sequences tested. The high activity region K1 and the region K3 that has low-activity but significant contrast may be combined to make region K4 according to (16).

- A weighted contrast measure CWfor each frame may now be defined according to (17)

- K4tot(n) equals the number of members of the set K4 for frame n. In turn, a sequence-averaged regionally weighted contrast measure CWS may be calculated according to (18).

- The sequence-averaged measure CWS was calculated for each of the decoded training sequences and the results, plotted against average quantizer step size, are shown in
Figure 15 . The CWS results inFigure 15 show encouraging differences to the corresponding CS results inFigure 14 . The two sequences "Harp" and "View", which have similar properties of low-motion and plain backgrounds, have moved to be top ranked by CWS rather than upper-middle ranked by CS. This shows excellent alignment with MMOS ranking inFig. 12 . Similarly, sequence "Barcelona" moves from CS top-ranked to CWS mid-ranked, which more closely aligns with its MMOS mid-ranking inFig. 12 . - Regional measure CWS is designed to focus the analysis on parts of the image that have higher degrees of motion and detail. However, when the "active" area of a picture is small, then it is beneficial to include consideration of the remaining "background" portion of the image, such as is determined by
process block 48 inFigure 8 . - A contrast measure CW5(n) for the "background" region of picture n may be defined according to (19).

- Region K5(n) covers all macroblocks that are within a focus of attention region K6(n) but not members of "active" region K4(n), as defined by (20). K5tot(n) gives the number of elements in K5(n).

- The focus of attention region K6(n) is a sub-set of the overall analysis region K(n) and here is chosen to be a result of 25% cropping (left,righ,top,bottom) of the image.

- A weighted contrast measure CW7 for the active portion of focus of attention region K6(n) of frame n may now be defined according to (22)

- A measure of the active proportion of the focus of attention region is given by (23)

- Region K7(n) covers all macroblocks that are within the focus of attention region K6(n) and also members of "active" region K4(n), as defined by (24).

-
Figure 9A shows how a weighted combination CWN(n) of the "active" K7(n) and "background" K5(n) regions of frame n may be calculated according to (25) utilizing weighting functions fw5 and fw7.Figure 9B comprises the same elements asFigure 9A and shows how the various equations are combined to calculate CWN(n).
- Experiments showed a non-linear weighting function of the form shown in (26) and (27) to perform particularly well.


Factors t1 and t2 are the saturation and offset factors respectively shown inFigures 9a ,9b (and10a and10b ). -
Figure 16 illustrates the effects that these factors have on the function fw7. For t1=1.0 and t2=0.0, fw7(0..100) has a raised sine response that is symmetrical about CW7percent =50% with a value of 1.0 at 100% and 0 at 0%. Increasing the factor t1 from 1.0 has the effect of moving the ±1 saturation points of fw7 up from 0% and down from 100%. Increasing the factor t2 from 0.0 shifts the whole fw7 curve to the left, therefore lowering the CW7percent values for fw7 saturation. The fw5 weighting (27) is calculated to make a combined fw5 and fw7 weighting of 1. - Values t1=1.8 and t2=30 were found to be suited to the application, having a number of desirable properties. The upper saturation point of 60% gives a strong weighting towards the contrast of the "active" region K7. Correspondingly, full weighting towards the "background" region K5 only occurs below the lower saturation point of 7%. The raised sine function gives a smooth transition between these points.
- In (26), t2 defines a threshold of strength-of-activity in the region K6 under which background properties will be considered. Here, the strength is measured by the area of active region K7 as a percentage CW7percent of the area of K6. Threshold t2 may be adjusted to take into account other properties of the active and background areas according to (28).

-
Figures 10A (and10B which includes the equations contributing to CWN(n)) shows how a measure of average luminance difference (29) can be included in the calculation of CWN(n). The measure of the average luminance difference has the effect of emphasising active regions that have higher luminance than background regions.
- Here, lum(k) equals the average luminance over element k. Luminance difference Idif may be used to adapt threshold t2(n) according to (30).

Values l1=20 and /2=80 were found to be practical for a luminance range of 16..255. Values of t2min=20 and t2range=30 then give a range of t2(n) from 20 to 50.Figure 6 illustrates the effect that adapting t2 according to (30) has on the weighting function fw7. - A sequence-averaged weighted contrast measure CWSN may be calculated according to (31).

- Firstly, MMOS (dependent variable) for the training set was modelled by AvQP (independent variable) using standard linear and polynomial/logarithmic regression analysis as available in many commercial statistical software packages. The resulting model was then used on the test sequences. This was then repeated using CS, CWS and CWSN as additional independent variables. Table 5 gives the resulting weighting parameters for each model and shows that CWSN is currently acting as a refinement factor to the existing CWS parameter.
Table 5 Model weighting parameters. AvQP AvQP,CS AvQP,CWS AvQP,CWS,CWSN Const -12.518 -12.5938 -11.968 -12.1489 AvQP -0.4201 -0.407498 -0.378 -0.3829 Log(AvQP) 19.686 19.132 17.56 17.805 CS 0 0.04817 0 0 CWS 0 0 0.0338 0.024 CWSN 0 0 0 1.2094 - For each model the squared correlation between estimated and measured mean opinion scores (PMOS and MMOS) and mean square error MS residuals are shown in table 6.
Table 6 Correlation and MSE between MMOS and PMOS. Correlation2 (MSE) Sequence set AvQP AvQP, CS AvQP, CWS AvQP, Training 0.879(0.190) 0.906(0.148) 0.929(0.112) 0.943(0.092) Test sequences 0.88(0.179) 0.927(0.155) 0.936(0.109) 0.943(0.102) - Results show that the AvQP,CWS,CWSN model gives the highest performance (correlation and MSE) for both training and test data sets. The individual training and test results for the AvQP, AvQP/CS , AvQP/CWS and AvQP/CWSN models are shown in the form of a scatter plots in
Figs. 18 ,19 ,20 and21 respectively. - The invention enables a video quality measure to be determined using measures based on quantizer step-size AvQP, average contrast CS and regionally weighted contrast CWS and a non-linearly weighted combination of "active" and "background" contrast measures. One or more embodiments of the invention enable improved accuracy of quality estimation overknown techniques by determining the area, location and contrast of an "active" region of the highest motion and detail along with the area and contrast of the corresponding "background" region. The "active" and "background" measures are combined using a non-linear weighting function CWSN with adaptive thresholding that increasingly weights towards the "background" measure for sequences that have a low proportion of active areas. CWSN has the effect of ignoring any "background" contribution when a significant proportion of the image is deemed to be active and of adding particular weight to background areas for images with low activity.
- In this way, a perceived mean opinion score quality measure can be automatically calculated using a method of generating a measure of quality according to the invention. The quality measure could also be used to control the way a decoder applies post-filtering by functioning as a feedback loop, as
Figures 11a and11b of the accompanying drawings.Figures 11a and11b show an encoding/decoding system of the type shown inFigure 2 and retains the numbering scheme ofFigure 2 of the accompanying drawings. - In
Figure 11a , the post-filtered output from the decoder is used to generate a PMOS calculated using a method of determining a quality measure according to an embodiment of the invention. The resulting PMOS values can then be suitably fed back into the post-filter system and a new post-filtered signal output. - In
Figure 11b , a PMOS for one or more segments of a video sequence is calculated using a method of determining a quality measure according to an embodiment of the invention prior to post-filtering and the PMOS values are then used to adjust the post-filtering the decoder performs. - Exemplary embodiments of the invention are described in detail herein above and pictorially in the accompanying drawings, however, the invention is not intended to be limited to such exemplary embodiments and includes various obvious modifications and equivalent arrangements which fall within the scope of the appended claims. Features referred to explicitly herein and in the claims may be replaced with alternative features providing functional equivalents where such functional equivalents would be known to those of ordinary skill in the art.
- In the above description, references to "one embodiment," "an embodiment," "example embodiment," "various embodiments," etc., indicate that the embodiment(s) of the invention so described include a particular feature, structure, or characteristic. However, it is not necessary for every embodiment to comprise that particular feature, structure, or characteristic. Where the phrase "in one embodiment," or "in an exemplary embodiment," is referred to herein above it may or may not refer to the same embodiment as would be apparent to one of ordinary skill in the art.
- Terms referring to features such as, for example, "processing," "computing," "calculating," "determining," or the like refer to an action and/or process(es) undertaken by a computer or computing system, or similar electronic computing device, that manipulate and/or transform data represented as physical, such as electronic, quantities within the computing system's registers and/or memories into other data similarly represented as physical quantities within the computing system's memories, registers or other such information storage, transmission or display devices.
- The term "computing platform" comprises one or more data processors, where a data "processor" refers to any device or portion of a device that processes electronic data from registers and/or memory to transform that electronic data into other electronic data that is capable of being stored in registers and/or memory.
- One or more embodiments of the invention include apparatuses for performing the operations herein. An apparatus may be specially constructed for the desired purposes, or it may comprise a general purpose device selectively activated or reconfigured by a program stored in the device.
- Where appropriate, a feature described herein in an embodiment of the invention may be implemented in one or a combination of hardware, firmware, and software. Where a feature is implemented as instructions stored on a machine-readable medium, such instructions may be read and executed by a computing platform to perform one or more or all of the operations and/or method steps described herein.
- The term "machine-readable medium" comprises any mechanism for storing or transmitting information in a form readable by a machine (e.g., a computer). Examples of machine-readable mediums include, but are not limited to : read only memory (ROM), random access memory (RAM), magnetic disk storage media, optical storage media, flash memory devices, and propagated electrical, optical, acoustical or other suitable digital and/or analogue signals (for example, carrier waves, infrared signals, digital signals, etc).
- References to the term "computer program" and/or "computer control logic" include as appropriate references to machine code and/or executable code and/or source code which when compiled results in execution on a computing platform of the computer program.
- A computer program may be provided in an electronically downloadable format or in a format which is stored in the main memory and/or secondary memory of a computing platform and/or data storage means capable of being attached and removed from a computing platform. Where a computer program is stored in one or more data storage means it comprises a computer program product. Such computer programs, when executed, are arranged to enable the computer platform or system to perform the features of the present invention as discussed herein. In particular, the computer programs, when executed, are arranged to enable a processor to implement one or more steps in a method according to an embodiment of the invention. Accordingly, such computer programs may represent data controllers of the computer system.
- A computer program product comprising a computer readable medium having control logic (computer software) stored therein may be provided to distribute the invention or cause, when the product is loaded and running on one or more computer platforms, a method according to an embodiment of the invention to be performed. The control logic, when executed by one or more processors, causes the one or more processors to perform one or more of the functions of a method according to an embodiment of the invention as described herein. The computer program product software may be loaded into a computer system using any appropriate means, including appropriate data storage reading means and/or via a network communications interface card. Software implementing control logic executed by a data processor causes the processor to perform the functions of an embodiment of the invention as described herein. The computer program product software may run as a standalone software application program running in an operating system. Alternatively, it may be integrated into an operating system of the computing platform.
- Features implemented primarily in hardware may comprise, but are not limited to, hardware components such as application specific integrated circuits (ASICs), field programmable gateways (FPGAs) or one or more state machines, etc. Any appropriate implementation of the hardware state machine so as to perform the functions described herein may be used as is apparent to a person or persons skilled in the relevant art(s).
- The embodiments and examples discussed herein are non-limiting. The embodiments of the invention described in detail herein above form exemplary embodiments only and it will be apparent to those skilled in the art that changes and modifications may be made without departing from the spirit and scope of the invention, for example, in its broader aspects. The embodiments of the invention as defined in the claims are intended to cover all such changes and modifications as fall within the true spirit of the invention.
- The text of the abstract is repeated below to form part of the description:
- A method of generating a measure of quality for a video signal representative of a plurality of frames, the video signal having: an original form; an encoded form in which the video signal has been encoded using a compression algorithm utilising a variable quantiser step size such that the encoded signal has a quantiser step size parameter associated therewith and utilising differential coding such that the encoded signal contains representations of the prediction residual of the signal; and a decoded form in which the encoded video signal has been at least in part reconverted to the original form, the method comprising: a) generating a first quality measure which is dependant on said quantiser step size parameter according to a predetermined relationship; b) generating a masking measure, the masking measure being dependant on the spatial complexity of at least part of the frames represented by the video signal in the decoded form according to a first predetermined relationship; and c) generating a combined measure, the combined measure being dependant upon both the first measure and the masking measure according to a predetermined relationship, wherein, the method also includes: generating an first measure which is dependant on the prediction residual of the signal according to a first predetermined relationship; and identifying one or more regions of the picture for which the first measure exceeds a threshold, wherein the masking measure is dependant on the spatial complexity of the identified region(s) according to a predetermined relationship; and further comprises: generating a background measure which is dependant on the prediction residual of the signal according to a second predetermined relationship; and identifying one or more other regions of the picture for which the background measure is below a threshold, wherein the masking measure is dependent on the spatial complexity of the identified other region(s) according to a predetermined relationship.
-
- [1] A. G. Davis, D. Bayart, D. S. Hands, "Hybrid No-reference Video Quality Prediction," BMSB 2009, 13-15 May 2009.
- [2], [3]
WO 2007/066066 - [4]
WO2010/004238 - [5] ISO/IEC 14496-10 and ITU-T Rec. H.264, Advanced Video Coding, 2003.
- [6] Final report from the Video Quality Experts Group on the Validation of Objective Models of Video Quality Assessment,
Phase 2, www.vqeg.org. - [7] ITU-T, J.144, "Objective perceptual video quality measurement techniques for digital cable television in the presence of a full reference".
- [8] ITU-T, J.143, "User Requirements for Objective Perceptual Video Quality Measurements in Digital Cable Television".
- [9] VQEG1 sequence database,address: ftp://ftp.crc.ca/crc/vqeg/TestSequences/ALL_625/
- [10] lain E. G. Richardson, H.264 and MPEG-4 Video Compression, Wiley 2003.
- [11] W. Osberger, S. Hammond and N. Bergmann, "An MPEG Encoder Incorporating Perceptually Based Quantisation," IEEE TENCON - Speech and Image Technologies for Computing and Telecommunications, pp. 731-733, 1997.
- [12] Atul Puri and R. Aravind, "Motion-Compensated Video Coding with Adaptive Perceptual Quantization," IEEE Transactions On Circuits and Systems for Video Technology, Vol. 1, No. 4, pp 351-361, Dec. 1991.
- [13] Bo Tao, Bradley W. Dickinson and Heidi A. Peterson," Adaptive Model-Driven Bit Allocation for MPEG Video Coding," IEEE Transactions on Circuits and Systems for Video Technology, Vol. 10, No. 1, pp 147-157, Feb. 2000.
Claims (16)
1. A method of generating a measure of quality for a video signal representative of a plurality of frames, the video signal having: an original form; an encoded form in which the video signal has been encoded using a compression algorithm utilising a variable quantiser step size such that the encoded signal has a quantiser step size parameter associated therewith and utilising differential coding such that the encoded signal contains representations of the prediction residual of the signal; and a decoded form in which the encoded video signal has been at least in part reconverted to the original form, the method comprising:
a) generating a first quality measure which is dependant on said quantiser step size parameter according to a predetermined relationship;
b) generating a masking measure, the masking measure being dependant on the spatial complexity of at least part of the frames represented by the video signal in the decoded form according to a first predetermined relationship; and
c) generating a combined measure, the combined measure being dependant upon both the first quality measure and the masking measure according to a predetermined relationship wherein, the method also includes:
generating a first measure which is dependant on the prediction residual of the signal according to a first predetermined relationship; and
identifying one or more active regions of the picture for which the first measure meets a condition,
and further comprises:
generating a second measure which is dependant on the prediction residual of the signal according to a second predetermined relationship; and
identifying one or more background regions of the picture for which the second measure meets a condition,
wherein the masking measure is dependant on the spatial complexity of the identified active region(s) according to a predetermined relationship and wherein the masking measure is also dependent on the spatial complexity of the identified background region(s) according to a predetermined relationship.
2. A method as claimed in claim 1, wherein a said measure includes a temporally determined component, and wherein said regions of the picture for which the first measure meets a condition are determined from temporal changes to said picture regions.
3. A method as claimed in any preceding claim, wherein at least one of said one or more background regions of the picture identified by said second measure meeting said condition comprise a higher area in a said picture than at least one of said one or more regions of the picture for which the first measure meets said respective condition.
4. A method as claimed in any preceding claim, wherein the representations of the prediction residual are the coefficients of a two-dimensional transform of the pixel-domain prediction residual, and one or both of the first and second measure is a calculated from said coefficients.
5. A method as claimed in claim 4, wherein the transform is the discrete cosine transform.
6. A method as claimed in claim 4 or 5, wherein a said measure is a count of the number of nonzero transform coefficients.
7. A method as claimed in claim 4 or 5, wherein a said measure is dependent on the amplitudes of the transform coefficients.
8. A method as claimed in claim 7, wherein a said measure is a function of the sum of the energies of the decoded coefficients.
9. A method as claimed in any one of the preceding claims in which said condition which the the first measure is to meet comprises the first measure exceeding a threshold value, and wherein the masking measure includes a function of the spatial complexity of
(a) the identified region(s) of the picture for which the first measure exceeds a threshold and
(b) a region or regions of the picture in which the first measure does not exceed the threshold but in which the spatial complexity exceeds a second threshold,
10. A method according to claim 9 in which the second threshold is dynamically varied, being a function of the spatial complexity calculated for the identified region(s).
11. A method according to claim 10, in which the second threshold is equal to the average value of the spatial complexity calculated for the identified region(s).
12. A method as claimed in any one of the preceding claims in which the first quality measure is derived only from those parts of the picture from which the masking measure is derived.
13. A method as claimed in any one of the preceding claims, wherein the spatial complexity is measured by determining a local contrast measure at a plurality of positions in a frame.
12. A method as claimed in claim 13, wherein each frame includes plurality of pikels, and wherein for at least some of the pixels of a given frame, the comparison function is performed on neighbouring regions in the vicinity of a pixel; so as to obtain a comparison value in respect of that pixel.
14. A method as claimed in any one of the preceding claims, wherein the quality and/or first and/or second measure is averaged over a plurality of frames.
15. Apparatus comprising a decoder for a video sequence and further comprising means arranged to perform one or more steps according to the method described in any preceding claim.
Priority Applications (5)
| Application Number | Priority Date | Filing Date | Title |
|---|---|---|---|
| EP10250691A EP2373049A1 (en) | 2010-03-31 | 2010-03-31 | Video quality measurement |
| CN201180026222.5A CN102918862B (en) | 2010-03-31 | 2011-03-31 | Produce the method and apparatus of quality measured values |
| US13/638,827 US8947538B2 (en) | 2010-03-31 | 2011-03-31 | System for video quality prediction and related aspects |
| PCT/GB2011/000504 WO2011121311A1 (en) | 2010-03-31 | 2011-03-31 | Video quality measurement |
| EP11714375.0A EP2553935B1 (en) | 2010-03-31 | 2011-03-31 | Video quality measurement |
Applications Claiming Priority (1)
| Application Number | Priority Date | Filing Date | Title |
|---|---|---|---|
| EP10250691A EP2373049A1 (en) | 2010-03-31 | 2010-03-31 | Video quality measurement |
Publications (1)
| Publication Number | Publication Date |
|---|---|
| EP2373049A1 true EP2373049A1 (en) | 2011-10-05 |
Family
ID=43538901
Family Applications (2)
| Application Number | Title | Priority Date | Filing Date |
|---|---|---|---|
| EP10250691A Ceased EP2373049A1 (en) | 2010-03-31 | 2010-03-31 | Video quality measurement |
| EP11714375.0A Active EP2553935B1 (en) | 2010-03-31 | 2011-03-31 | Video quality measurement |
Family Applications After (1)
| Application Number | Title | Priority Date | Filing Date |
|---|---|---|---|
| EP11714375.0A Active EP2553935B1 (en) | 2010-03-31 | 2011-03-31 | Video quality measurement |
Country Status (4)
| Country | Link |
|---|---|
| US (1) | US8947538B2 (en) |
| EP (2) | EP2373049A1 (en) |
| CN (1) | CN102918862B (en) |
| WO (1) | WO2011121311A1 (en) |
Cited By (9)
| Publication number | Priority date | Publication date | Assignee | Title |
|---|---|---|---|---|
| WO2013083199A1 (en) * | 2011-12-09 | 2013-06-13 | Telefonaktiebolaget L M Ericsson (Publ) | Method and apparatus for detecting quality defects in a video bitstream |
| WO2014032463A1 (en) * | 2012-08-27 | 2014-03-06 | Thomson Licensing | Method and apparatus for estimating content complexity for video quality assessment |
| EP2791897A4 (en) * | 2011-12-09 | 2015-08-19 | Intel Corp | Control of video processing algorithms based on measured perceptual quality characteristics |
| CN104885452A (en) * | 2012-08-27 | 2015-09-02 | 汤姆逊许可公司 | Method and apparatus for estimating content complexity for video quality assessment |
| WO2015154222A1 (en) * | 2014-04-08 | 2015-10-15 | Mediatek Singapore Pte. Ltd. | Improved methods for background residual prediction |
| US20180012369A1 (en) * | 2016-07-05 | 2018-01-11 | Intel Corporation | Video overlay modification for enhanced readability |
| US20210289206A1 (en) * | 2018-11-27 | 2021-09-16 | Op Solutions, Llc | Block-based spatial activity measures for pictures |
| US11438594B2 (en) | 2018-11-27 | 2022-09-06 | Op Solutions, Llc | Block-based picture fusion for contextual segmentation and processing |
| CN115174919A (en) * | 2022-09-05 | 2022-10-11 | 腾讯科技(深圳)有限公司 | Video processing method, device, equipment and medium |
Families Citing this family (8)
| Publication number | Priority date | Publication date | Assignee | Title |
|---|---|---|---|---|
| WO2013086654A1 (en) * | 2011-12-15 | 2013-06-20 | Thomson Licensing | Method and apparatus for video quality measurement |
| CN103945214B (en) * | 2013-01-23 | 2016-03-30 | 中兴通讯股份有限公司 | End side time-domain method for evaluating video quality and device |
| US9159114B2 (en) * | 2013-11-08 | 2015-10-13 | Qualcomm Incorporated | Texture decompression for graphics processors |
| EP2919458A1 (en) * | 2014-03-11 | 2015-09-16 | Axis AB | Method and system for playback of motion video |
| US9712860B1 (en) * | 2014-12-12 | 2017-07-18 | Amazon Technologies, Inc. | Delivering media content to achieve a consistent user experience |
| CN106716868A (en) * | 2015-03-20 | 2017-05-24 | 华为技术有限公司 | Receiving device and signal receiving processing method |
| CN106713901B (en) * | 2015-11-18 | 2018-10-19 | 华为技术有限公司 | A kind of method for evaluating video quality and device |
| US10085015B1 (en) * | 2017-02-14 | 2018-09-25 | Zpeg, Inc. | Method and system for measuring visual quality of a video sequence |
Citations (2)
| Publication number | Priority date | Publication date | Assignee | Title |
|---|---|---|---|---|
| WO2007066066A2 (en) | 2005-12-05 | 2007-06-14 | British Telecommunications Public Limited Company | Non-intrusive video quality measurement |
| WO2010004238A1 (en) | 2008-07-07 | 2010-01-14 | British Telecommunications Public Limited Company | Video quality measurement |
Family Cites Families (4)
| Publication number | Priority date | Publication date | Assignee | Title |
|---|---|---|---|---|
| US5745178A (en) * | 1996-01-22 | 1998-04-28 | Lucent Technologies Inc. | Global rate control for model-assisted coding of low bit rate video |
| GB0228556D0 (en) * | 2002-12-06 | 2003-01-15 | British Telecomm | Video quality measurement |
| WO2008081185A2 (en) * | 2007-01-04 | 2008-07-10 | British Telecommunications Public Limited Company | Video signal encoding with iterated re-encoding |
| EP2472868A1 (en) * | 2010-12-29 | 2012-07-04 | British Telecommunications Public Limited Company | Video coding |
-
2010
- 2010-03-31 EP EP10250691A patent/EP2373049A1/en not_active Ceased
-
2011
- 2011-03-31 WO PCT/GB2011/000504 patent/WO2011121311A1/en active Application Filing
- 2011-03-31 CN CN201180026222.5A patent/CN102918862B/en active Active
- 2011-03-31 EP EP11714375.0A patent/EP2553935B1/en active Active
- 2011-03-31 US US13/638,827 patent/US8947538B2/en active Active
Patent Citations (2)
| Publication number | Priority date | Publication date | Assignee | Title |
|---|---|---|---|---|
| WO2007066066A2 (en) | 2005-12-05 | 2007-06-14 | British Telecommunications Public Limited Company | Non-intrusive video quality measurement |
| WO2010004238A1 (en) | 2008-07-07 | 2010-01-14 | British Telecommunications Public Limited Company | Video quality measurement |
Non-Patent Citations (6)
| Title |
|---|
| A. G. DAVIS; D. BAYART; D. S. HANDS, HYBRID NO-REFERENCE VIDEO QUALITY PREDICTION, 13 May 2009 (2009-05-13) |
| ANMIN LIU ET AL: "Modeling the masking effect of the human visual system with visual attention model", INFORMATION, COMMUNICATIONS AND SIGNAL PROCESSING, 2009. ICICS 2009. 7TH INTERNATIONAL CONFERENCE ON, IEEE, PISCATAWAY, NJ, USA, 8 December 2009 (2009-12-08), pages 1 - 5, XP031618177, ISBN: 978-1-4244-4656-8 * |
| ATUL PURI; R. ARAVIND: "Motion-Compensated Video Coding with Adaptive Perceptual Quantization", IEEE TRANSACTIONS ON CIRCUITS AND SYSTEMS FOR VIDEO TECHNOLOGY, vol. 1, no. 4, December 1991 (1991-12-01), pages 351 - 361 |
| BO TAO; BRADLEY W. DICKINSON; HEIDI A. PETERSON: "Adaptive Model-Driven Bit Allocation for MPEG Video Coding", IEEE TRANSACTIONS ON CIRCUITS AND SYSTEMS FOR VIDEO TECHNOLOGY, vol. 10, no. 1, February 2000 (2000-02-01), pages 147 - 157 |
| ISO/IEC 14496-10 AND ITU-T REC. H.264, ADVANCED VIDEO CODING, 2003 |
| W. OSBERGER; S. HAMMOND; N. BERGMANN: "An MPEG Encoder Incorporating Perceptually Based Quantisation", IEEE TENCON - SPEECH AND IMAGE TECHNOLOGIES FOR COMPUTING AND TELECOMMUNICATIONS, 1997, pages 731 - 733 |
Cited By (16)
| Publication number | Priority date | Publication date | Assignee | Title |
|---|---|---|---|---|
| US10356441B2 (en) | 2011-12-09 | 2019-07-16 | Telefonaktiebolaget Lm Ericsson (Publ) | Method and apparatus for detecting quality defects in a video bitstream |
| CN104145480A (en) * | 2011-12-09 | 2014-11-12 | 瑞典爱立信有限公司 | Method and apparatus for detecting quality defects in a video bitstream |
| EP2791897A4 (en) * | 2011-12-09 | 2015-08-19 | Intel Corp | Control of video processing algorithms based on measured perceptual quality characteristics |
| US9686515B2 (en) | 2011-12-09 | 2017-06-20 | Telefonaktiebolaget Lm Ericsson (Publ) | Method and apparatus for detecting quality defects in a video bitstream |
| WO2013083199A1 (en) * | 2011-12-09 | 2013-06-13 | Telefonaktiebolaget L M Ericsson (Publ) | Method and apparatus for detecting quality defects in a video bitstream |
| WO2014032463A1 (en) * | 2012-08-27 | 2014-03-06 | Thomson Licensing | Method and apparatus for estimating content complexity for video quality assessment |
| CN104885452A (en) * | 2012-08-27 | 2015-09-02 | 汤姆逊许可公司 | Method and apparatus for estimating content complexity for video quality assessment |
| US10536703B2 (en) | 2012-08-27 | 2020-01-14 | Interdigital Ce Patent Holdings | Method and apparatus for video quality assessment based on content complexity |
| WO2015154222A1 (en) * | 2014-04-08 | 2015-10-15 | Mediatek Singapore Pte. Ltd. | Improved methods for background residual prediction |
| US10290110B2 (en) * | 2016-07-05 | 2019-05-14 | Intel Corporation | Video overlay modification for enhanced readability |
| US20180012369A1 (en) * | 2016-07-05 | 2018-01-11 | Intel Corporation | Video overlay modification for enhanced readability |
| US20210289206A1 (en) * | 2018-11-27 | 2021-09-16 | Op Solutions, Llc | Block-based spatial activity measures for pictures |
| US11438594B2 (en) | 2018-11-27 | 2022-09-06 | Op Solutions, Llc | Block-based picture fusion for contextual segmentation and processing |
| US11546597B2 (en) * | 2018-11-27 | 2023-01-03 | Op Solutions, Llc | Block-based spatial activity measures for pictures |
| CN115174919A (en) * | 2022-09-05 | 2022-10-11 | 腾讯科技(深圳)有限公司 | Video processing method, device, equipment and medium |
| CN115174919B (en) * | 2022-09-05 | 2022-11-22 | 腾讯科技(深圳)有限公司 | Video processing method, device, equipment and medium |
Also Published As
| Publication number | Publication date |
|---|---|
| US20130016224A1 (en) | 2013-01-17 |
| EP2553935A1 (en) | 2013-02-06 |
| CN102918862A (en) | 2013-02-06 |
| CN102918862B (en) | 2016-01-06 |
| US8947538B2 (en) | 2015-02-03 |
| EP2553935B1 (en) | 2017-01-18 |
| WO2011121311A1 (en) | 2011-10-06 |
Similar Documents
| Publication | Publication Date | Title |
|---|---|---|
| EP2553935B1 (en) | Video quality measurement | |
| EP2294829B1 (en) | Video quality measurement | |
| EP1958454B1 (en) | Non-intrusive video quality measurement | |
| US9756326B2 (en) | Video coding method using at least evaluated visual quality and related video coding apparatus | |
| US9900599B2 (en) | High frequency emphasis in decoding of encoded signals | |
| US8391622B2 (en) | Enhanced image/video quality through artifact evaluation | |
| US8559511B2 (en) | Method and apparatus for video coding by ABT-based just noticeable difference model | |
| EP2207358A1 (en) | Video decoding method and video encoding method | |
| US20150312575A1 (en) | Advanced video coding method, system, apparatus, and storage medium | |
| US11064211B2 (en) | Advanced video coding method, system, apparatus, and storage medium | |
| US8594189B1 (en) | Apparatus and method for coding video using consistent regions and resolution scaling | |
| US8781004B1 (en) | System and method for encoding video using variable loop filter | |
| US20140376621A1 (en) | Picture coding device, picture coding method, and picture coding program, and picture decoding device, picture decoding method, and picture decoding program | |
| US9344729B1 (en) | Selective prediction signal filtering | |
| US9432694B2 (en) | Signal shaping techniques for video data that is susceptible to banding artifacts | |
| Naccari et al. | Intensity dependent spatial quantization with application in HEVC | |
| US20120207212A1 (en) | Visually masked metric for pixel block similarity | |
| Naccari et al. | Perceptually optimized video compression | |
| Jo et al. | Perceptual intra-frame coding for HEVC still picture profile based on invisible signal suppression | |
| Chodisetti et al. | H. 264 video coding artifacts: measurement and reduction of flickering | |
| Yuan et al. | A mixed scheme to improve subjective quality in low bitrate video | |
| Wei et al. | A Perceptual Rate-Distortion Based Quantization Level Adjustment Algorithm |
Legal Events
| Date | Code | Title | Description |
|---|---|---|---|
| PUAI | Public reference made under article 153(3) epc to a published international application that has entered the european phase |
Free format text: ORIGINAL CODE: 0009012 |
|
| AK | Designated contracting states |
Kind code of ref document: A1 Designated state(s): AT BE BG CH CY CZ DE DK EE ES FI FR GB GR HR HU IE IS IT LI LT LU LV MC MK MT NL NO PL PT RO SE SI SK SM TR |
|
| AX | Request for extension of the european patent |
Extension state: AL BA ME RS |
|
| STAA | Information on the status of an ep patent application or granted ep patent |
Free format text: STATUS: THE APPLICATION HAS BEEN REFUSED |
|
| 18R | Application refused |
Effective date: 20111017 |