EP2368106B1 - Method for determining permeability of rock formation using computer tomographic images thereof - Google Patents
Method for determining permeability of rock formation using computer tomographic images thereof Download PDFInfo
- Publication number
- EP2368106B1 EP2368106B1 EP09799447.9A EP09799447A EP2368106B1 EP 2368106 B1 EP2368106 B1 EP 2368106B1 EP 09799447 A EP09799447 A EP 09799447A EP 2368106 B1 EP2368106 B1 EP 2368106B1
- Authority
- EP
- European Patent Office
- Prior art keywords
- image
- permeability
- rock
- pixels
- gray scale
- Prior art date
- Legal status (The legal status is an assumption and is not a legal conclusion. Google has not performed a legal analysis and makes no representation as to the accuracy of the status listed.)
- Active
Links
Images


Classifications
-
- G—PHYSICS
- G01—MEASURING; TESTING
- G01N—INVESTIGATING OR ANALYSING MATERIALS BY DETERMINING THEIR CHEMICAL OR PHYSICAL PROPERTIES
- G01N23/00—Investigating or analysing materials by the use of wave or particle radiation, e.g. X-rays or neutrons, not covered by groups G01N3/00 – G01N17/00, G01N21/00 or G01N22/00
- G01N23/02—Investigating or analysing materials by the use of wave or particle radiation, e.g. X-rays or neutrons, not covered by groups G01N3/00 – G01N17/00, G01N21/00 or G01N22/00 by transmitting the radiation through the material
- G01N23/04—Investigating or analysing materials by the use of wave or particle radiation, e.g. X-rays or neutrons, not covered by groups G01N3/00 – G01N17/00, G01N21/00 or G01N22/00 by transmitting the radiation through the material and forming images of the material
- G01N23/046—Investigating or analysing materials by the use of wave or particle radiation, e.g. X-rays or neutrons, not covered by groups G01N3/00 – G01N17/00, G01N21/00 or G01N22/00 by transmitting the radiation through the material and forming images of the material using tomography, e.g. computed tomography [CT]
-
- G—PHYSICS
- G01—MEASURING; TESTING
- G01N—INVESTIGATING OR ANALYSING MATERIALS BY DETERMINING THEIR CHEMICAL OR PHYSICAL PROPERTIES
- G01N2223/00—Investigating materials by wave or particle radiation
- G01N2223/40—Imaging
- G01N2223/419—Imaging computed tomograph
-
- G—PHYSICS
- G01—MEASURING; TESTING
- G01N—INVESTIGATING OR ANALYSING MATERIALS BY DETERMINING THEIR CHEMICAL OR PHYSICAL PROPERTIES
- G01N2223/00—Investigating materials by wave or particle radiation
- G01N2223/60—Specific applications or type of materials
- G01N2223/616—Specific applications or type of materials earth materials
-
- G—PHYSICS
- G01—MEASURING; TESTING
- G01N—INVESTIGATING OR ANALYSING MATERIALS BY DETERMINING THEIR CHEMICAL OR PHYSICAL PROPERTIES
- G01N2223/00—Investigating materials by wave or particle radiation
- G01N2223/60—Specific applications or type of materials
- G01N2223/649—Specific applications or type of materials porosity
Definitions
- the invention relates generally to the field of estimating material properties of porous media. More specifically, the invention relates to methods for estimating such properties using computer tomographic (CT) images of porous media such as subsurface rock formation.
- CT computer tomographic
- the method described in the Nur patent includes preparing a "thin section" from a specimen of rock formation.
- the preparation typically includes filling the pore spaces with a dyed epoxy resin.
- a color micrograph of the section is digitized and converted to an n-ary index image, for example a binary index image.
- Statistical functions are derived from the two-dimensional image and such functions are used to generate three-dimensional representations of the rock formation. Boundaries can be unconditional or conditioned to the two-dimensional n -ary index image. Desired physical property values are estimated by performing numerical simulations on the three-dimensional representations.
- permeability is estimated by using a Lattice-Boltzmann flow simulation.
- multiple, equiprobable three-dimensional representations are generated for each n-ary index image, and the multiple estimated physical property values are averaged to provide a result.
- CT image generating devices typically produce three-dimensional gray scale images of the samples analyzed in the scanner.
- gray scale images can be used, for example, essentially contemporaneously as drill cuttings are generated during the drilling of a wellbore through subsurface rock formations.
- a rock physics transform is a mathematical formula that relates one property of a rock formation to another.
- Such transforms can be based on an idealized mathematical model of rock, such as the differential effective medium that models rock as a solid with ideal-shape inclusions or the Hertz-Mindlin model that models rock as a composite made of perfect elastic spheres.
- Such transforms can also be based on a sufficient number of experimental data (e.g., well log measurements or laboratory measurements) using a statistically fit expression that approximates such data.
- An example of the latter is the Raymer transform between porosity ⁇ and the compressional wave (P-wave) velocity of the rock ( V p ).
- V p (1- ⁇ ) 2 V ps + ⁇ V pf
- V ps is the P-wave velocity in the mineral (matrix or solid) phase of the rock (e.g., quartz)
- V pf is the P-wave velocity in the pore fluid (e.g., water).
- the foregoing moduli can be obtained by laboratory measurement, and can also be obtained by calculations made from an image of a rock sample.
- k d 2 ⁇ 3 /[72 ⁇ 2 (1- ⁇ ) 2 ]
- ⁇ is the pore tortuosity (typically represented by a number between 1 and 5).
- the parameters that enter these two equations can be obtained by laboratory measurement and also by calculations based on an image of a rock sample.
- permeability ( k ) and formation factor ( F ) equation examples one may conduct a large number of laboratory tests on samples that represent the formation under examination.
- such data can be obtained by digital calculations on a digitally imaged rock sample.
- JONES ET AL "Non-destructive quantitative 3D analysis for the optimisation of tissue scaffolds", BIOMATERIALS, ELSEVIER SCIENCE PUBLISHERS BV., vol. 28, no. 7, pages 1404 - 1413 , discloses methods for obtaining pore size distributions for both the macropores and their interconnects.
- the invention provides a method according to claim 1. Preferred embodiments are listed in the dependent claims.
- drill cuttings obtained during the drilling of a wellbore through subsurface formations. It should be clearly understood that drill cuttings is only one example of samples of rock formation that may be used with the present invention. Any other source of a rock formation sample, e.g., whole cores, sidewall cores, outcrop quarrying, etc. may provide suitable samples for analysis using methods according to the invention. Consequently, the invention is not limited in scope to analysis of drill cuttings.
- a drilling unit or "rig" 10 is disposed at the Earth's surface.
- the rig 10 includes lifting equipment (not shown separately) for raising and lowering one of several types of device used to rotate a drill string 14.
- the device, shown at 18 in the present example may be a top drive, although the use of a tope drive is not a limit on the scope of the invention.
- the drill string 14 is assembled by threadedly coupling segments of drill pipe end to end.
- a drill bit 16 is disposed at the lower end of the drill string 14 and cuts through subsurface rock formations 11 to form a wellbore 12.
- the rig 10 is operated to cause some of the axial load (weight) of the drill string 14 to be applied to the drill bit 16.
- the top drive 18 rotates the drill string 14 and the drill bit 16 at the lower end thereof. The combination of axial load and rotation causes the drill bit 16 to cut through the formations 11.
- the rig 10 includes a tank or pit 22 having drilling fluid ("mud") 20 stored therein.
- a pump 24 lifts the mud 20 and discharges it through suitable flow lines 26 so that the mud 20 passes through an internal passage in the drill string 14, whereupon it is discharged through suitable orifices or courses in the drill bit 16.
- the discharged mud 20 cools and lubricates the drill bit 16 and lifts the cuttings generated by the bit 16 to the Earth's surface.
- the cuttings and mud thus lifted enter separation and cleaning devices, shown generally at 28 and including, for example, devices known as "degassers” and “shale shakers” to remove the cuttings and contamination from the mud 20.
- the mud after such cleaning is returned to the pit 22 for subsequent use in drilling the wellbore 12.
- the cuttings removed from the separation and cleaning device 28 may be transported to a computer tomographic ("CT") scanner 30, which may use x-rays for analysis of internal structure of the cuttings, for generation of three dimensional (3D) images of the cuttings.
- CT computer tomographic
- the images so generated may be in numerical form and their content will be further explained below.
- the cuttings may be saved for further analysis or may be suitably discarded.
- An example of a suitable CT scanner for making images usable with methods according to the invention is sold under model designation MicroXCT Series 3D tomographic x-ray transmission microscope by Xradia, Inc., 5052 Commercial Circle, Concord, CA 94520.
- an analysis of the cuttings from the CT scan images may provide, substantially in real time during the drilling of the wellbore, an estimate of certain properties of the subsurface formations being drilled, for example fluid mobility of one or more constituent fluids in the pore spaces of the rock formations 11.
- images generated by the CT scanner 30 may be transferred to a computer 32 having program instructions for carrying out image analysis and subsequent formation property modeling as described below.
- drill cuttings are only one type of rock sample that may be analyzed according to the invention.
- the drill bit 16 may be an annular type configured to drill whole cores of the rock formations 11.
- percussion sidewall core samples may be obtained during drilling or when the drill string 14 is withdrawn from the wellbore 12 such as for "wireline" well evaluation techniques. Accordingly, the scope of the invention is not limited to analysis of drill cuttings. As explained above, the invention is also not limited to use with rock samples obtained from a wellbore drilled through subsurface rock formations.
- CT scan imaging of a porous material sample is used in the invention to produce a numerical object that represents the material sample digitally stored in the computer 32 for subsequent numerical simulations of various physical processes, such as viscous fluid flow (for permeability estimation); stress loading (for the effective elastic moduli); electrical current flow (for resistivity); and pore size distribution for nuclear magnetic resonance relaxation time properties, including distribution of relaxation time.
- various physical processes such as viscous fluid flow (for permeability estimation); stress loading (for the effective elastic moduli); electrical current flow (for resistivity); and pore size distribution for nuclear magnetic resonance relaxation time properties, including distribution of relaxation time.
- such analysis can be performed while drilling operations are underway, substantially in real time.
- the CT scan image produced by the CT scanner 30 may be a 3D numerical object consisting of a plurality of 2D sections of the imaged sample.
- Each 2D section consists of a grid of values each corresponding to a small region of space defined within the plane of the grid. Each such small region of space is referred to as a "pixel" and has assigned thereto a number representing the image darkness (or for example the density of the material) determined by the CT scan procedure.
- the value ascribed to each pixel of the 2D sections is typically an integer that may vary between zero and 255 where 0 is, e.g., pure white, and 255 is pure black. Such integer is typically referred to as a "gray scale" value.
- 0 to 255 is associated with eight digital bits in a digital word representing the gray scale value in each pixel.
- Other gray scale ranges may be associated with longer or shorter digital words in other implementations, and the range of 0 to 255 is not intended to limit the scope of the invention.
- the numerical object is preferably processed so that all the pixels allocated to the void space in the rock formation (pore space) are represented by a common numerical value, e.g., by only 255s, and all the pixels associated with the rock matrix (or rock grains) are represented by a different numerical value, for example, zeroes.
- image segmentation is called image segmentation.
- the resulting numerical object can be normalized so that the pore spaces are represented by, for example, ones and the rock grains are represented by zeroes.
- the foregoing may be described as converting the image into a binary index.
- the image may be converted into an index having any selected number, n, of indices. It has been determined that sufficiently accurate modeling of rock properties may be obtained using a binary index, in which one value represents pore space and another single value represents rock grains.
- a technique known in the art for segmenting a gray-scale object is called "thresholding", where all pixels having a gray scale value below a selected threshold value (e.g., a gray scale value of 150 on a scale of 0 to 255) are identified as grains, while all other pixels are identified as pore space.
- a selected threshold value e.g., a gray scale value of 150 on a scale of 0 to 255
- pore space e.g., a gray scale value of 150 on a scale of 0 to 255
- each seed consists of one or more pixels having a similar pixel gray scale level, e.g., 250 ⁇ 5
- All pixels within a seed are assigned the same gray scale level which may be an average (e.g., arithmetic) of the gray levels of all the pixels within the seed.
- the seeds in the image frame do not overlap spatially.
- two or more adjacent seeds are merged and are identified as a "region” if the gray scale levels of the adjacent seeds have gray scale values within a selected difference threshold of each other.
- Each identified region is assigned a uniform (fixed) gray level, which can be a weighted average of the gray scale values of all the seeds that have been merged into the identified region.
- the foregoing process continues for all regions thus formed in the image frame.
- the unprocessed CT image is transformed into internally uniform regions plus unclassified pixels that were not be assigned to any of the identified regions (because such pixels included gray scale values outside the allocation threshold criteria).
- Each of such unclassified pixels can be assigned to an adjacent region with the closest gray scale level. If the resulting number of regions is greater than two, however, the foregoing method simply fails to allocate the CT image correctly into grains and pores.
- all pixels having a gray scale value below a selected initial limit for the gray scale level of rock grains are classified as rock grains; and all pixels in which the gray scale level is larger than a selected initial limit for pore spaces (e.g., 130) are classified as pore space.
- a selected initial limit for the gray scale level of rock grains e.g. 60
- all pixels in which the gray scale level is larger than a selected initial limit for pore spaces e.g., 130
- One simple way of specifying these initial limits is by selecting the gray scale levels corresponding to the peaks of a gray level histogram. In many subsurface formations, such a histogram will be bimodal, wherein one mode value will correspond to the gray scale level of pores, and another mode value will correspond to the gray scale level of rock grains.
- the next element in image classification according to the invention is to grow each of the two initially formed seeds by allocating to such seeds all adjacent pixels having gray scale levels within a selected tolerance, e.g., 130 - 5 for pore spaces and 60 + 5 for rock grains.
- a selected tolerance e.g. 130 - 5 for pore spaces and 60 + 5 for rock grains.
- the foregoing process can continue by incrementally increasing the gray scale lower limit for rock grains and incrementally reducing the gray scale upper limit for pore spaces until the two limits meet.
- the result is that all pixels will be allocated to either pore space or to rock grains, thus providing a fully segmented image.
- a possible advantage of the foregoing procedure is that instead of forming multiple regions, the foregoing technique grows only two distinctive regions from start to end, thus avoiding the situation where multiple distinctive regions appear and then have to be reclassified into either pores or grains. If the resulting segmented image appears noisy (cluttered), it can be smoothed by any of conventional filters.
- a schematic outline of the foregoing procedure follows. First is to preprocess the original image using the median or 2D Gaussian kernel filter.
- the size of the filter is provided by the user and should depend on, among other factors, the quality of the image (level of noise). It should be noted that the image segmenting procedure that follows has been demonstrated to be sufficiently noise resistant as to make the preprocessing frequently unnecessary.
- two user-selected thresholds t 1 and t 2 are selected to determine initial regions for pore space and rock grains, respectively.
- the initial thresholds may be selected, for example, by analysis of a histogram of the gray scale values in the CT image. For every pixel p i having a gray scale level represented by B(p i ) :
- contiguous pixels may be referred to as "clusters.” All of the pixels allocated as explained above then become the image seeds from which region growing proceeds.
- each pixel classified as a pore its eight neighbors (spatially contiguous pixels) in the 2D image plane are interrogated. If any of the interrogated neighbor pixels is not already identified as pore or rock grain, and the gray scale level of such pixel is within a preselected tolerance level of (or initially selected different between) the gray scale level assigned to the "pore" seed (as in Step 2 above), the interrogated neighbor pixel is then classified as a pore and is allocated to the "pore" cluster.
- contiguous pixel interrogation is also performed for pixels classified as rock grain.
- Contiguous, previously unallocated pixels having gray scale level within a preselected tolerance of the gray scale level of the rock grain seed are allocated to the rock grain cluster.
- the foregoing cluster allocation and region growing process continues for both pore space and rock grain until all the pixels in the 2D image frame are interrogated. If any of the pixels is not classified as pore space or rock grain, the foregoing tolerance value for each of the pore space and the rock grain may be increased by a selected increment (for example five gray scale numbers), and the contiguous pixel interrogation and classification may be repeated. The foregoing tolerance increase and repeated adjacent pixel interrogation may be repeated until all or substantially all the pixels in the 2D image frame are allocated to either rock grain or pore space.
- the foregoing region growing procedure is then repeated for each 2D image frame in the 3D CT scan image.
- the result is a three dimensional characterization of the pore structure of the rock samples on which CT imaging has been performed.
- FIG. 2 An example implementation of the above process for image segmentation is shown in a flow chart in FIG. 2 .
- a 2D image frame of a CT scan image is selected.
- the image frame may be subjected to histogram analysis, at 42 to determine possible mode values of gray scale for pore spaces and for rock grains.
- the possible modes of the histogram may be used to set initial values for the image segmentation thresholds t 1 and t 2 .
- all pixels in the image frame are interrogated may be are allocated to pore space or to rock grains, depending on whether the gray scale value in each pixel exceeds the respective segmentation threshold.
- the allocated pixels are then segmented into seeds where two or more contiguous pixels are allocated to either pore space or rock grain.
- pixels adjacent to the each of the seeds are interrogated.
- Previously unallocated pixels having a gray scale value falling within an initially selected threshold difference (or tolerance) of the adjacent cluster pixel gray scale value are allocated to the seed at 50.
- the image frame is interrogated to determine if all or substantially all the image frame pixels have been allocated to either pore space or rock grain.
- the number of allocated pixels is counted and at 60 if all or substantially all the pixels in the image frame have been allocated, a new 2D image frame can be selected, at 58, and the above process repeated.
- the next 2D image frame will be adjacent to the most recently analyzed 2D image frame. The above process can be repeated until all available 2D image frames have been analyzed. If all pixels in the image frame have not been allocated, at 52, the tolerance or difference threshold values used at 50 may be increased and the interrogation of pixels adjacent to the existing seeds can be repeated, at 48, and the remainder of the process can be repeated.
- the result of the foregoing procedure is a segmented 3D image of the rock sample including image elements for rock grain and for pore space.
- image can be stored or displayed in a computer and can be used as input to one or more rock property characterization models.
- the image should be segmented to allocate image portions to the rock matrix and the pore space.
- Image segmentation may be performed as explained above with reference to FIG. 2 .
- an estimate of the porosity ⁇ may be obtained, at 66.
- a simulation of a physical experiment may be conducted on the sample image.
- the Lattice-Boltzmann method can be used to numerically solve Navier-Stokes equations for flow simulation for permeability modeling. Such solution may be used to calculate permeability of simulated 3D volumes.
- the Lattice-Boltzmann method is a robust tool for flow simulation, particularly in media with complex pore geometry. See, for example, Ladd, Numerical Simulations of Particulate Suspensions via a discretized Boltzmann Equation, Part 1: Theoretical Foundation, J. Fluid Mech., v271, 1994, pp.
- the Lattice-Boltzmann method simulates fluid motion as collisions of imaginary particles, which are much larger than actual fluid molecules, but wherein such particles show almost the same behavior at a macroscopic scale.
- the algorithm used in the Lattice-Boltzmann method repeats collisions of these imaginary particles until steady state is reached, and provides a distribution of local mass flux.
- the Lattice-Boltzmann method is applied successfully for many pore structures, including cylindrical tubes, random densely packed spheres, and 3D rock samples digitized by CT scanning as explained above. See, for example, U.S. Patent No. 6,516,080 issued to Nur.
- a permeability tensor k One method to quantify permeability anisotropy is through use of a permeability tensor k .
- V is measured in three directions:
- V x a ⁇ 1 ⁇ k x x ⁇ P ⁇ x
- V y a ⁇ 1 ⁇ k y x ⁇ P ⁇ x
- V z a ⁇ 1 ⁇ k z x ⁇ P ⁇ y
- V x b ⁇ 1 ⁇ k x y ⁇ P ⁇ x
- V y b ⁇ 1 ⁇ k y y ⁇ P ⁇ y
- V z b ⁇ 1 ⁇ k z y ⁇ P ⁇ y
- V x c ⁇ 1 ⁇ k x z ⁇ P ⁇ x
- V y c ⁇ 1 ⁇ k y c ⁇ P ⁇ z
- V z c ⁇ 1 ⁇ k z z ⁇ P ⁇ x
- V may be measured either physically through the use of a permeameter or may be simulated, e.g., numerically through the use of a flow simulation technique such as the LBM model described above.
- the components of the permeability tensor k are determined by digitally or numerically subdividing the original segmented image at different angles in 10 the Cartesian coordinate system to obtain subsamples of different orientation and performing fluid transport simulations on those subsamples.
- the direction of the pressure gradient can be represented by unit vector n 100, whose components are cos ⁇ 102, cos ⁇ 104, and cos ⁇ 106.
- Directional axes are depicted in FIG. 4 as x-axis 108, y-axis 110 and z-axis 112.
- k n k x x + k x y + k x z cos 2 ⁇ + k y z + k y y + k y z cos 2 ⁇ + k z x + k z y + k z z cos 2 ⁇ .
- k n 4 k x x + k y y + k x z + k y z / 2 + k x y .
- k n 5 k x x + k z z + k x y + k y z / 2 + k x z .
- k n 6 k y y + k z z + k x y + k x z / 2 + k y z .
- One non-limiting example of conducting such simulations is to render the original segmented sample image to create a new rectangular digital sample image out of the original sample image.
- the new rectangular digital sample image may be oriented at a desired angle, such as for instance, 45° with respect to the selected direction of the previous sample image.
- the elements of the original digital sample image may be related to the elements to the new digital sample image as shown in FIG. 5 .
- Such elements may be any elements necessary or useful to define the digital sample image.
- FIG. 5 depicts elements i 120, j 122 and k 124 of the original sample image, corresponding to elements in the x, y and z directions respectively. These may be related to elements I 130, J 132, and K 134 of the new digital sample image.
- FIG. 6 An example of such re-indexing operation is shown in FIG 6 .
- original sample image 150 rendered to new sample image 160.
- New sample image 160 is selected from within original sample 150 and is oriented at a 45° degree angle from the original sample.
- the elements (I 130, J 132, and K 134) of the new digital sample may be determined. Based on these determinations, it is then possible to run the six digital experiments referenced above.
- the permeability tensor is symmetrical, there are three principal permeability directions in a rectangular coordinate system attached to a porous material: the direction of maximum permeability; the direction of minimum permeability; and, normal to both of these directions, the direction of intermediate permeability. Principal permeability values correspond to these three principal directions.
- the principal permeability values and directions may be obtained as the eigenvalues and directions of matrix k .
- the eigenvalues i.e., principal permeability values.
- One method of determining the principal permeability values is by calculating the three roots, k 1 , k 2 , and k 3 , of the cubic equation:
- 0.
- the roots k 1 , k 2 , and k 3 correspond to the principal permeability values.
- the permeability values and permeability directions may be stored or displayed on a computer.
- Methods according to the invention may enable determining fluid transport properties of anisotropic rock formations using tomographic images of samples of the rock formations without the need for expensive and time consuming laboratory experiments on physical samples of the formations.
Landscapes
- Health & Medical Sciences (AREA)
- Engineering & Computer Science (AREA)
- Nuclear Medicine, Radiotherapy & Molecular Imaging (AREA)
- Pulmonology (AREA)
- Radiology & Medical Imaging (AREA)
- Theoretical Computer Science (AREA)
- Physics & Mathematics (AREA)
- Life Sciences & Earth Sciences (AREA)
- Chemical & Material Sciences (AREA)
- Analytical Chemistry (AREA)
- Biochemistry (AREA)
- General Health & Medical Sciences (AREA)
- General Physics & Mathematics (AREA)
- Immunology (AREA)
- Pathology (AREA)
- Analysing Materials By The Use Of Radiation (AREA)
Description
- The invention relates generally to the field of estimating material properties of porous media. More specifically, the invention relates to methods for estimating such properties using computer tomographic (CT) images of porous media such as subsurface rock formation.
- Estimating material properties such as effective elastic and shear moduli, electrical resistivity and fluid transport properties of porous media, for example, mobility of hydrocarbon in subsurface rock formations, has substantial economic significance. Methods known in the art for identifying the existence of subsurface hydrocarbon reservoirs, including seismic surveying and well log analysis, need to be supplemented with reliable methods for estimating how fluids disposed in the pore spaces of reservoir rock formations will flow over time in order to characterize the economic value of such reservoir rock formations.
- One method known in the art for estimating fluid transport properties is described in
U.S. Patent No. 6,516,080 issued to Nur. The method described in the Nur patent includes preparing a "thin section" from a specimen of rock formation. The preparation typically includes filling the pore spaces with a dyed epoxy resin. A color micrograph of the section is digitized and converted to an n-ary index image, for example a binary index image. Statistical functions are derived from the two-dimensional image and such functions are used to generate three-dimensional representations of the rock formation. Boundaries can be unconditional or conditioned to the two-dimensional n-ary index image. Desired physical property values are estimated by performing numerical simulations on the three-dimensional representations. For example, permeability is estimated by using a Lattice-Boltzmann flow simulation. Typically, multiple, equiprobable three-dimensional representations are generated for each n-ary index image, and the multiple estimated physical property values are averaged to provide a result. - In performing the method described in the Nur patent, it is necessary to obtain samples of the rock formation and to prepare, as explained above, a section to digitize as a color image. Economic considerations make it desirable to obtain input to fluid transport analysis more quickly than can be obtained using prepared sections. Recently, devices for generating CT images of samples such as drill cuttings have become available. Such CT image generating devices (CT scanners) typically produce three-dimensional gray scale images of the samples analyzed in the scanner. Such gray scale images can be used, for example, essentially contemporaneously as drill cuttings are generated during the drilling of a wellbore through subsurface rock formations.
- Using images of samples of rock formations, it is possible to obtain estimates of petrophysical parameters of the imaged rock sample, for example, porosity, permeability, shear and bulk moduli, and formation resistivity factor. The foregoing parameters are typically distributed within ranges in each rock formation, and there may be determinable relationships between such parameters such that determining one parameter value can enable determining one or more of the other parameters. One way to establish such relationship is to determine one or more rock physics transforms. A rock physics transform is a mathematical formula that relates one property of a rock formation to another. Such transforms can be based on an idealized mathematical model of rock, such as the differential effective medium that models rock as a solid with ideal-shape inclusions or the Hertz-Mindlin model that models rock as a composite made of perfect elastic spheres. Such transforms can also be based on a sufficient number of experimental data (e.g., well log measurements or laboratory measurements) using a statistically fit expression that approximates such data. An example of the latter is the Raymer transform between porosity φ and the compressional wave (P-wave) velocity of the rock (Vp ). The transform is the expression Vp = (1-φ)2 Vps + φVpf , where Vps is the P-wave velocity in the mineral (matrix or solid) phase of the rock (e.g., quartz) and Vpf is the P-wave velocity in the pore fluid (e.g., water). The elastic (compressional) wave velocity is directly related to the bulk K and shear G moduli by the expression

F = a/Φm , where a and m are constants that are determined experimentally. As in the P-wave velocity example, the parameters that enter these two equations, one for permeability and the other for the formation factor, can be obtained by laboratory measurement and also by calculations based on an image of a rock sample. Instead of using the permeability (k) and formation factor (F) equation examples above, one may conduct a large number of laboratory tests on samples that represent the formation under examination. Alternatively, such data can be obtained by digital calculations on a digitally imaged rock sample. - Obtaining and calibrating permeability measurements using physical samples and using measurements made on actual rock samples require extensive laboratory and/or well measurements. There exists a need to use images such as the foregoing CT scan images to determine permeability characteristics without the need for extensive laboratory or well measurements.
- From MASAD ET AL, "Computations of permeability tensor coefficients and anisotropy of asphalt concrete based on microstructure simulation of fluid flow", COMPUTATIONAL MATERIALS SCIENCE, ELSEVIER, vol. 40, no. 4, pages 449 - 459, computations of permeability tensor coefficients and anisotropy of asphalt concrete based on microstructure simulation of fluid flow is known.
- JONES ET AL, "Non-destructive quantitative 3D analysis for the optimisation of tissue scaffolds", BIOMATERIALS, ELSEVIER SCIENCE PUBLISHERS BV., vol. 28, no. 7, pages 1404 - 1413, discloses methods for obtaining pore size distributions for both the macropores and their interconnects.
- In LASCHET ET AL, "Microstructure based model for permeability predictions of open-cell metallic foams via homogenization", MATERIALS SCIENCE AND ENGINEERING A: STRUCTURAL MATERIALS:PROPERTIES, MICROSTRUCTURE & PROCESSING, vol. 472, no. 1-2, pages 214 - 226, a multi-scale approach based on the homogenization method is applied to predict effective permeabilities of open-cell foams, produced by a SlipReactionFoamSintering (SRFS)-process.
- In SINGH R ET AL, "Characterization of the structure and permeability of titanium foams for spinal fusion devices", ACTA BIOMATERIALIA, ELSEVIER, vol. 5, no. 1, pages 477 - 487, microcomputed tomography (µCT) was used to obtain the three-dimensional structure of Ti foams.
- The invention provides a method according to
claim 1. Preferred embodiments are listed in the dependent claims. - Other aspects and advantages of the invention will be apparent from the following description and the appended claims.
-
-
FIG. 1 shows an example of obtaining cuttings during drilling of a wellbore and analysis thereof during the drilling. -
FIG. 2 shows a flow chart of an example process for CT image segmentation. -
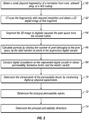
FIG. 3 shows a flow chart of an example analysis procedure according to one embodiment of the invention. -
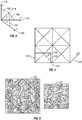
FIG. 4 shows directional axes and the relationship between those axes. -
FIG. 5 shows a graphical representation of a re-imaging technique of one example of the present invention. -
FIG. 6 shows a simplified image of a re-imaging technique of one example of the present invention. - The description of this invention is made with reference to using drill cuttings obtained during the drilling of a wellbore through subsurface formations. It should be clearly understood that drill cuttings is only one example of samples of rock formation that may be used with the present invention. Any other source of a rock formation sample, e.g., whole cores, sidewall cores, outcrop quarrying, etc. may provide suitable samples for analysis using methods according to the invention. Consequently, the invention is not limited in scope to analysis of drill cuttings.
- An example of drilling a wellbore to obtain samples of rock formations for evaluation by examples of a method according to the invention will be explained with reference to
FIG. 1 . A drilling unit or "rig" 10 is disposed at the Earth's surface. Therig 10 includes lifting equipment (not shown separately) for raising and lowering one of several types of device used to rotate adrill string 14. The device, shown at 18 in the present example may be a top drive, although the use of a tope drive is not a limit on the scope of the invention. Thedrill string 14 is assembled by threadedly coupling segments of drill pipe end to end. Adrill bit 16 is disposed at the lower end of thedrill string 14 and cuts throughsubsurface rock formations 11 to form awellbore 12. During the drilling of thewellbore 12, therig 10 is operated to cause some of the axial load (weight) of thedrill string 14 to be applied to thedrill bit 16. Thetop drive 18 rotates thedrill string 14 and thedrill bit 16 at the lower end thereof. The combination of axial load and rotation causes thedrill bit 16 to cut through theformations 11. - The
rig 10 includes a tank orpit 22 having drilling fluid ("mud") 20 stored therein. Apump 24 lifts themud 20 and discharges it through suitable flow lines 26 so that themud 20 passes through an internal passage in thedrill string 14, whereupon it is discharged through suitable orifices or courses in thedrill bit 16. The dischargedmud 20 cools and lubricates thedrill bit 16 and lifts the cuttings generated by thebit 16 to the Earth's surface. The cuttings and mud thus lifted enter separation and cleaning devices, shown generally at 28 and including, for example, devices known as "degassers" and "shale shakers" to remove the cuttings and contamination from themud 20. The mud after such cleaning is returned to thepit 22 for subsequent use in drilling thewellbore 12. - In the present example, the cuttings removed from the separation and
cleaning device 28 may be transported to a computer tomographic ("CT")scanner 30, which may use x-rays for analysis of internal structure of the cuttings, for generation of three dimensional (3D) images of the cuttings. The images so generated may be in numerical form and their content will be further explained below. After CT scanning, the cuttings may be saved for further analysis or may be suitably discarded. An example of a suitable CT scanner for making images usable with methods according to the invention is sold under modeldesignation MicroXCT Series 3D tomographic x-ray transmission microscope by Xradia, Inc., 5052 Commercial Circle, Concord, CA 94520. - In some examples, an analysis of the cuttings from the CT scan images may provide, substantially in real time during the drilling of the wellbore, an estimate of certain properties of the subsurface formations being drilled, for example fluid mobility of one or more constituent fluids in the pore spaces of the
rock formations 11. In the present example, images generated by theCT scanner 30 may be transferred to acomputer 32 having program instructions for carrying out image analysis and subsequent formation property modeling as described below. - It should also be understood that drill cuttings are only one type of rock sample that may be analyzed according to the invention. In other examples, the
drill bit 16 may be an annular type configured to drill whole cores of therock formations 11. In other examples, percussion sidewall core samples may be obtained during drilling or when thedrill string 14 is withdrawn from thewellbore 12 such as for "wireline" well evaluation techniques. Accordingly, the scope of the invention is not limited to analysis of drill cuttings. As explained above, the invention is also not limited to use with rock samples obtained from a wellbore drilled through subsurface rock formations. - CT scan imaging of a porous material sample (e.g., a sample of rock formation) is used in the invention to produce a numerical object that represents the material sample digitally stored in the
computer 32 for subsequent numerical simulations of various physical processes, such as viscous fluid flow (for permeability estimation); stress loading (for the effective elastic moduli); electrical current flow (for resistivity); and pore size distribution for nuclear magnetic resonance relaxation time properties, including distribution of relaxation time. In some examples, such analysis can be performed while drilling operations are underway, substantially in real time. - The CT scan image produced by the
CT scanner 30 may be a 3D numerical object consisting of a plurality of 2D sections of the imaged sample. Each 2D section consists of a grid of values each corresponding to a small region of space defined within the plane of the grid. Each such small region of space is referred to as a "pixel" and has assigned thereto a number representing the image darkness (or for example the density of the material) determined by the CT scan procedure. The value ascribed to each pixel of the 2D sections is typically an integer that may vary between zero and 255 where 0 is, e.g., pure white, and 255 is pure black. Such integer is typically referred to as a "gray scale" value. 0 to 255 is associated with eight digital bits in a digital word representing the gray scale value in each pixel. Other gray scale ranges may be associated with longer or shorter digital words in other implementations, and the range of 0 to 255 is not intended to limit the scope of the invention. For the purpose of simulating a physical process using such a numerical object (the gray scale), however, the numerical object is preferably processed so that all the pixels allocated to the void space in the rock formation (pore space) are represented by a common numerical value, e.g., by only 255s, and all the pixels associated with the rock matrix (or rock grains) are represented by a different numerical value, for example, zeroes. The foregoing process is called image segmentation. Subsequently, the resulting numerical object can be normalized so that the pore spaces are represented by, for example, ones and the rock grains are represented by zeroes. The foregoing may be described as converting the image into a binary index. In other examples, the image may be converted into an index having any selected number, n, of indices. It has been determined that sufficiently accurate modeling of rock properties may be obtained using a binary index, in which one value represents pore space and another single value represents rock grains. - A technique known in the art for segmenting a gray-scale object is called "thresholding", where all pixels having a gray scale value below a selected threshold value (e.g., a gray scale value of 150 on a scale of 0 to 255) are identified as grains, while all other pixels are identified as pore space. The foregoing approach is often not satisfactory, however, because, due to numerical clutter in an unprocessed CT scan image, some pixels physically located inside a grain may have the gray level of the pore space and vice versa. In one embodiment of the invention, a type of image segmentation known as "region growing" can be used. Region growing may be described as follows. Consider a 2D section of a CT scan image made of a porous rock formation such as sandstone, which has primarily quartz rock grains. A substantial number of "seeds" (each seed consists of one or more pixels having a similar pixel gray scale level, e.g., 250±5) is placed within the image. All pixels within a seed are assigned the same gray scale level which may be an average (e.g., arithmetic) of the gray levels of all the pixels within the seed. The seeds in the image frame do not overlap spatially. Next, two or more adjacent seeds are merged and are identified as a "region" if the gray scale levels of the adjacent seeds have gray scale values within a selected difference threshold of each other. Each identified region is assigned a uniform (fixed) gray level, which can be a weighted average of the gray scale values of all the seeds that have been merged into the identified region. The foregoing process continues for all regions thus formed in the image frame. As a result, the unprocessed CT image is transformed into internally uniform regions plus unclassified pixels that were not be assigned to any of the identified regions (because such pixels included gray scale values outside the allocation threshold criteria). Each of such unclassified pixels can be assigned to an adjacent region with the closest gray scale level. If the resulting number of regions is greater than two, however, the foregoing method simply fails to allocate the CT image correctly into grains and pores.
- To address the foregoing problem with extending ("growing") seeds into regions, in the invention, instead of using seeds having different gray scale values, only two classes of seeds are used: all pixels having a gray scale value below a selected initial limit for the gray scale level of rock grains (e.g., 60) are classified as rock grains; and all pixels in which the gray scale level is larger than a selected initial limit for pore spaces (e.g., 130) are classified as pore space. One simple way of specifying these initial limits is by selecting the gray scale levels corresponding to the peaks of a gray level histogram. In many subsurface formations, such a histogram will be bimodal, wherein one mode value will correspond to the gray scale level of pores, and another mode value will correspond to the gray scale level of rock grains.
- The next element in image classification according to the invention is to grow each of the two initially formed seeds by allocating to such seeds all adjacent pixels having gray scale levels within a selected tolerance, e.g., 130 - 5 for pore spaces and 60 + 5 for rock grains. The foregoing process can continue by incrementally increasing the gray scale lower limit for rock grains and incrementally reducing the gray scale upper limit for pore spaces until the two limits meet. The result is that all pixels will be allocated to either pore space or to rock grains, thus providing a fully segmented image.
- A possible advantage of the foregoing procedure is that instead of forming multiple regions, the foregoing technique grows only two distinctive regions from start to end, thus avoiding the situation where multiple distinctive regions appear and then have to be reclassified into either pores or grains. If the resulting segmented image appears noisy (cluttered), it can be smoothed by any of conventional filters.
- A schematic outline of the foregoing procedure follows. First is to preprocess the original image using the median or 2D Gaussian kernel filter. The size of the filter is provided by the user and should depend on, among other factors, the quality of the image (level of noise). It should be noted that the image segmenting procedure that follows has been demonstrated to be sufficiently noise resistant as to make the preprocessing frequently unnecessary.
- Next, two user-selected thresholds, t1 and t2 , are selected to determine initial regions for pore space and rock grains, respectively. The initial thresholds may be selected, for example, by analysis of a histogram of the gray scale values in the CT image. For every pixel pi having a gray scale level represented by B(pi):
- if B(pi) > t1 then pi is identified as pore space; and
- if B(pi) < t2 then pi is identified as rock grain.
- If there are two or more contiguous pixels in any subset of the image frame that are classified according to the threshold procedure above, such contiguous pixels may be referred to as "clusters." All of the pixels allocated as explained above then become the image seeds from which region growing proceeds.
- Finally, for each pixel classified as a pore, its eight neighbors (spatially contiguous pixels) in the 2D image plane are interrogated. If any of the interrogated neighbor pixels is not already identified as pore or rock grain, and the gray scale level of such pixel is within a preselected tolerance level of (or initially selected different between) the gray scale level assigned to the "pore" seed (as in
Step 2 above), the interrogated neighbor pixel is then classified as a pore and is allocated to the "pore" cluster. - The foregoing contiguous pixel interrogation is also performed for pixels classified as rock grain. Contiguous, previously unallocated pixels having gray scale level within a preselected tolerance of the gray scale level of the rock grain seed are allocated to the rock grain cluster.
- The foregoing cluster allocation and region growing process continues for both pore space and rock grain until all the pixels in the 2D image frame are interrogated. If any of the pixels is not classified as pore space or rock grain, the foregoing tolerance value for each of the pore space and the rock grain may be increased by a selected increment (for example five gray scale numbers), and the contiguous pixel interrogation and classification may be repeated. The foregoing tolerance increase and repeated adjacent pixel interrogation may be repeated until all or substantially all the pixels in the 2D image frame are allocated to either rock grain or pore space.
- The foregoing region growing procedure is then repeated for each 2D image frame in the 3D CT scan image. The result is a three dimensional characterization of the pore structure of the rock samples on which CT imaging has been performed.
- An example implementation of the above process for image segmentation is shown in a flow chart in
FIG. 2 . At 40, a 2D image frame of a CT scan image is selected. The image frame may be subjected to histogram analysis, at 42 to determine possible mode values of gray scale for pore spaces and for rock grains. At 44, the possible modes of the histogram may be used to set initial values for the image segmentation thresholds t1 and t2. At 46, using the initial segmentation thresholds, all pixels in the image frame are interrogated may be are allocated to pore space or to rock grains, depending on whether the gray scale value in each pixel exceeds the respective segmentation threshold. The allocated pixels are then segmented into seeds where two or more contiguous pixels are allocated to either pore space or rock grain. At 48, pixels adjacent to the each of the seeds are interrogated. Previously unallocated pixels having a gray scale value falling within an initially selected threshold difference (or tolerance) of the adjacent cluster pixel gray scale value are allocated to the seed at 50. At 54, the image frame is interrogated to determine if all or substantially all the image frame pixels have been allocated to either pore space or rock grain. At 54, the number of allocated pixels is counted and at 60 if all or substantially all the pixels in the image frame have been allocated, a new 2D image frame can be selected, at 58, and the above process repeated. Typically the next 2D image frame will be adjacent to the most recently analyzed 2D image frame. The above process can be repeated until all available 2D image frames have been analyzed. If all pixels in the image frame have not been allocated, at 52, the tolerance or difference threshold values used at 50 may be increased and the interrogation of pixels adjacent to the existing seeds can be repeated, at 48, and the remainder of the process can be repeated. - The result of the foregoing procedure is a segmented 3D image of the rock sample including image elements for rock grain and for pore space. Such image can be stored or displayed in a computer and can be used as input to one or more rock property characterization models.
- The foregoing implementation of image segmentation may prove advantageous when implementing analysis techniques according to the invention, which require a segmented image as input for further analysis. Such techniques may be explained as follows. In many cases, a relatively large range for each input parameter (e.g., porosity) can be obtained from a single sample of rock formation, for example drill cuttings (
FIG. 1 ), sidewall cores, outcrop quarry or whole drill cores. Referring toFIG. 3 , the sample of rock formation, obtained at 60, should be imaged, such as by CT-scanning, to obtain a high-resolution 3D image of the pore space and rock grains (matrix). The foregoing is shown at 62. Next, at 64, the image should be segmented to allocate image portions to the rock matrix and the pore space. Image segmentation may be performed as explained above with reference toFIG. 2 . By counting the pixels in the segmented image that are allocated to the pore space and dividing their number by the total number of pixels in the image, an estimate of the porosity φ may be obtained, at 66. - Once porosity is obtained, it is possible to model permeability. At 68, a simulation of a physical experiment may be conducted on the sample image. In the present example, the Lattice-Boltzmann method can be used to numerically solve Navier-Stokes equations for flow simulation for permeability modeling. Such solution may be used to calculate permeability of simulated 3D volumes. The Lattice-Boltzmann method is a robust tool for flow simulation, particularly in media with complex pore geometry. See, for example, Ladd, Numerical Simulations of Particulate Suspensions via a discretized Boltzmann Equation, Part 1: Theoretical Foundation, J. Fluid Mech., v271, 1994, pp. 285-309; Gunstensen et al., "Lattice Boltzmann Model of Immiscible Fluids, Phys. Rev. A., v.43, no. 8, Apr. 15, 1991, pp. 4320-4327; Olsen et al., Two-fluid Flow in Sedimentary Rock: Simulation, Transport and Complexity, J. Fluid Mechanics, Vol.341, 1997, pp. 343-370; and Gustensen et al., Lattice-Boltzmann Studies of Immiscible Two-Phase Flow Through Porous Media," J. of Geophysical Research, V. 98, No. B4, Apr. 10, 1993, pp. 6431-6441).
- The Lattice-Boltzmann method simulates fluid motion as collisions of imaginary particles, which are much larger than actual fluid molecules, but wherein such particles show almost the same behavior at a macroscopic scale. The algorithm used in the Lattice-Boltzmann method repeats collisions of these imaginary particles until steady state is reached, and provides a distribution of local mass flux. In accordance with the present example, the Lattice-Boltzmann method is applied successfully for many pore structures, including cylindrical tubes, random densely packed spheres, and 3D rock samples digitized by CT scanning as explained above. See, for example,
U.S. Patent No. 6,516,080 issued to Nur. - Because of the naturally layered nature of many rock formations, their permeability is anisotropic. This means that a particular pressure gradient will drive a smaller flux of fluid in the direction of smaller permeability, compared to the direction of larger permeability.
- One method to quantify permeability anisotropy is through use of a permeability tensor
k . In 70, the permeability tensor is determined. The permeability tensork can be represented by:


- By measuring the flux components along the x, y, and z directions for a fixed orientation of pressure gradient (in one of these directions), it is possible to determine the components of the permeability tensor
k . - One method of determining the permeability tensor
k is to conduct three experiments with the following conditions - Experiment 1 - ∂P/∂x ≠ 0, ∂P/∂y = ∂P/∂z = 0;
- Experiments 2 - ∂P/∂x = 0, ∂P/∂y = 0, ∂P/∂z = 0; and
- Experiment 3 - ∂P/∂x = ∂P/∂y = 0, ∂P/∂z = 0.
- In each of the foregoing experiments, V is measured in three directions:
- Experiment 1 - Vxa , Vya , and Vza ,
- Experiment 2 - Vxb , Vyb , and Vzb ; and
- Experiment 3 - Vxc , Vyc , and Vzc.
- The combination of the three experiments yields the components of the permeability tensor
k from the following volumetric flux equations:
- V may be measured either physically through the use of a permeameter or may be simulated, e.g., numerically through the use of a flow simulation technique such as the LBM model described above.
- The components of the permeability tensor k are determined by digitally or numerically subdividing the original segmented image at different angles in 10 the Cartesian coordinate system to obtain subsamples of different orientation and performing fluid transport simulations on those subsamples. As shown in
FIG. 4 , the direction of the pressure gradient can be represented by unit vector n 100, whose components are cosα 102,cosβ 104, andcosγ 106. Directional axes are depicted inFIG. 4 asx-axis 108, y-axis 110 and z-axis 112. Permeability kn is measured along the 15 same direction as the unit vector n 100 and is related to the permeability tensork by the expression:
- Therefore,

- It will be appreciated by those skilled in the art that if
k is symmetrical, six independent experiments or simulations may be used to determine the six components ofk . These simulations or experiments may be defined by the following equations:
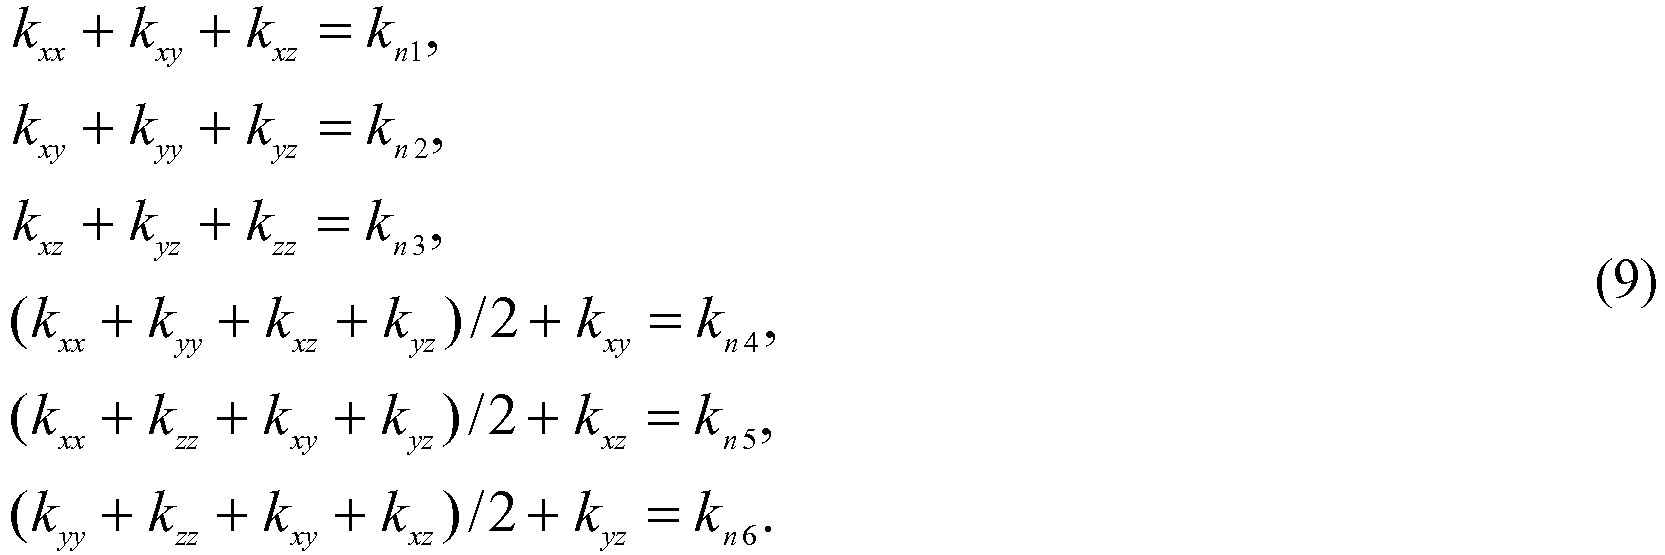
- In one example of the present invention, six numerical permeability simulations may be conducted to determine the six permeability values kni (i = 1 to 6). One non-limiting example of conducting such simulations is to render the original segmented sample image to create a new rectangular digital sample image out of the original sample image. For instance, as shown in
FIGS. 5 and 6 , the new rectangular digital sample image may be oriented at a desired angle, such as for instance, 45° with respect to the selected direction of the previous sample image. - Typically, in order to conduct a digital simulation on the new digital sample image, it may be required to re-index the original sample image. When re-indexing the image, the elements of the original digital sample image may be related to the elements to the new digital sample image as shown in
FIG. 5 . Such elements may be any elements necessary or useful to define the digital sample image.FIG. 5 depicts elements i 120, j 122 and k 124 of the original sample image, corresponding to elements in the x, y and z directions respectively. These may be related to elements I 130,J 132, andK 134 of the new digital sample image. For example, where the new rectangular sample is oriented at 45° to the original sample, I 130 = i 120 and:
- An example of such re-indexing operation is shown in
FIG 6 . As shown inFIG. 6 ,original sample image 150 rendered tonew sample image 160.New sample image 160 is selected from withinoriginal sample 150 and is oriented at a 45° degree angle from the original sample. During re-imaging, the elements (I 130,J 132, and K 134) of the new digital sample may be determined. Based on these determinations, it is then possible to run the six digital experiments referenced above. - Once the sample has been re-imaged and the digital experiments run, the resulting kni (i = 1 to 6) values may be used to resolve the linear system of the following equations:
- One of ordinary skill in the art will recognize that if the permeability tensor is symmetrical, there are three principal permeability directions in a rectangular coordinate system attached to a porous material: the direction of maximum permeability; the direction of minimum permeability; and, normal to both of these directions, the direction of intermediate permeability. Principal permeability values correspond to these three principal directions.
- The principal permeability values and directions may be obtained as the eigenvalues and directions of matrix
k . - In 72, the eigenvalues, i.e., principal permeability values, are determined. One method of determining the principal permeability values is by calculating the three roots, k1 , k2 , and k3 , of the cubic equation:

- The roots k1 , k2 , and k 3 correspond to the principal permeability values.
- In addition to the values of the principal permeabilities, it is also possible to determine their direction. In 76, these directions are determined. One method of determining the eigenvector or directional vector corresponding to, for instance, the eigenvalue ki is the (xi yi zi ) vector, which is the solution of matrix equation:

- This may be repeated for the other two roots. Thus it is possible to determine all three principal permeability values and their corresponding directions.
- The permeability values and permeability directions may be stored or displayed on a computer.
- Methods according to the invention may enable determining fluid transport properties of anisotropic rock formations using tomographic images of samples of the rock formations without the need for expensive and time consuming laboratory experiments on physical samples of the formations.
- While the invention has been described with respect to a limited number of embodiments, those skilled in the art, having benefit of this disclosure, will appreciate that other embodiments can be devised which do not depart from the scope of the invention as disclosed herein. Accordingly, the scope of the invention should be limited only by the attached claims.
Claims (9)
- A method for estimating permeability properties of a porous material from a sample thereof, comprising:making a three dimensional tomographic image (62) of the sample of the material;segmenting the image (64) into pixels each representing pore space or rock grain to form a segmented image;determining components of a permeability tensor (70) through use of the segmented image;calculating principal permeability values (72) using the components of the permeability tensor;calculating permeability directions (74) using the components of the permeability tensor; andat least one of storing and displaying the permeability values and permeability directions, characterized in that the step of determining components of a permeability tensor comprises digitally or numerically subdividing the original segmented image at different angles to obtain subsamples of different orientation, and performing fluid transport simulations on the subsamples.
- The method of claim 1 wherein the tomographic image comprises a value of gray scale allocated to each of a plurality of pixels in the image.
- The method of claim 2 wherein the segmenting comprises:(a) determining an initial gray scale threshold (44) for each of pore space and rock grain;(b) allocating each pixel in the image to pore space or rock grain (46) for each pixel meeting threshold criteria for each of the pore space and rock grain thresholds, respectively;(c) interrogating pixels adjacent to each seed (48);(d) allocating the interrogated adjacent pixels (50) previously not allocated to a seed to the pore space seed or the rock grain seed based on threshold criteria; and(e) repeating (c) and (d) until substantially all pixels in the image are allocated to the rock grain or the pore space.
- The method of claim 3 wherein the determining initial gray scale thresholds comprises histogram analysis of the tomographic image (42).
- The method of claim 3 wherein the allocating interrogated adjacent pixels comprises determining a difference between a gray scale value and a gray scale value of the adjacent pixel in the seed, and allocating the interrogated pixel to the seed if the difference falls below a selected threshold.
- The method of claim 5 further comprising:determining whether unallocated pixel exist (54) in the image;increasing the selected difference threshold (52); andrepeating the interrogating adjacent and allocating the interrogate pixels having gray scale values wherein the difference is below the increased difference threshold.
- The method of claim 1 wherein the porous material comprises a rock formation.
- The method of claim 1 wherein the step of determining components of a permeability tensor further comprises evaluating the results of the numerical simulation using a volumetric flux equation.
- The method of claim 1 wherein the step of determining components of a permeability tensor further comprises re-indexing the sample image.
Applications Claiming Priority (2)
| Application Number | Priority Date | Filing Date | Title |
|---|---|---|---|
| US12/325,151 US8081802B2 (en) | 2008-11-29 | 2008-11-29 | Method for determining permeability of rock formation using computer tomograpic images thereof |
| PCT/US2009/065431 WO2010062839A1 (en) | 2008-11-29 | 2009-11-22 | Method for determining permeability of rock formation using computer tomographic images thereof |
Publications (2)
| Publication Number | Publication Date |
|---|---|
| EP2368106A1 EP2368106A1 (en) | 2011-09-28 |
| EP2368106B1 true EP2368106B1 (en) | 2018-09-19 |
Family
ID=41667487
Family Applications (1)
| Application Number | Title | Priority Date | Filing Date |
|---|---|---|---|
| EP09799447.9A Active EP2368106B1 (en) | 2008-11-29 | 2009-11-22 | Method for determining permeability of rock formation using computer tomographic images thereof |
Country Status (6)
| Country | Link |
|---|---|
| US (1) | US8081802B2 (en) |
| EP (1) | EP2368106B1 (en) |
| AU (1) | AU2009319885B2 (en) |
| ES (1) | ES2701906T3 (en) |
| SA (1) | SA109300700B1 (en) |
| WO (1) | WO2010062839A1 (en) |
Families Citing this family (68)
| Publication number | Priority date | Publication date | Assignee | Title |
|---|---|---|---|---|
| FI120164B2 (en) * | 2008-02-15 | 2012-07-13 | Mine On Line Service Oy | Procedure and equipment to make ore exploration more efficient |
| US8331626B2 (en) * | 2008-05-21 | 2012-12-11 | Ingrain, Inc. | Method for estimating material properties of porous media using computer tomographic images thereof |
| US8499856B2 (en) * | 2010-07-19 | 2013-08-06 | Baker Hughes Incorporated | Small core generation and analysis at-bit as LWD tool |
| CN102141502B (en) * | 2010-12-30 | 2012-10-10 | 泸州品创科技有限公司 | Method for measuring porosity of fermented grains |
| US8507868B2 (en) * | 2011-03-04 | 2013-08-13 | Landmark Graphics Corporation | Systems and methods for determining fluid mobility in rock samples |
| US9016399B2 (en) * | 2011-03-23 | 2015-04-28 | Halliburton Energy Services, Inc. | Apparatus and methods for lithology and mineralogy determinations |
| US9507047B1 (en) | 2011-05-10 | 2016-11-29 | Ingrain, Inc. | Method and system for integrating logging tool data and digital rock physics to estimate rock formation properties |
| US9557280B2 (en) | 2011-06-01 | 2017-01-31 | Total Sa | X-ray tomography device |
| US9222350B2 (en) | 2011-06-21 | 2015-12-29 | Diamond Innovations, Inc. | Cutter tool insert having sensing device |
| WO2013009512A2 (en) | 2011-07-12 | 2013-01-17 | Ingrain, Inc. | Method for simulating fractional multi-phase/multi-component flow through porous media |
| EP2769207A4 (en) * | 2011-10-18 | 2015-05-20 | Schlumberger Holdings | METHOD FOR 3D MAPPING MINERALS OF A ROCK SAMPLE |
| EP2781086B1 (en) * | 2011-12-13 | 2020-03-11 | Halliburton Energy Services Inc. | Down hole cuttings analysis |
| US20130262028A1 (en) * | 2012-03-30 | 2013-10-03 | Ingrain, Inc. | Efficient Method For Selecting Representative Elementary Volume In Digital Representations Of Porous Media |
| WO2013169973A1 (en) * | 2012-05-11 | 2013-11-14 | Ingrain, Inc. | A method and system for multi-energy computer tomographic cuttings analysis |
| RU2014151234A (en) * | 2012-05-18 | 2016-07-10 | Ингрейн, Инк. | METHOD AND SYSTEM FOR EVALUATING ROCK PROPERTIES BASED ON ROCK SAMPLES USING DIGITAL VISUALIZATION OF ROCK PHYSICAL PROPERTIES |
| US9599551B2 (en) | 2012-06-09 | 2017-03-21 | Schlumberger Technology Corporation | Method for estimating porosity of a rock sample |
| US9080946B2 (en) * | 2012-06-15 | 2015-07-14 | Ingrain, Inc. | Digital rock analysis systems and methods with multiphase flow REV determination |
| US9285301B2 (en) * | 2012-07-13 | 2016-03-15 | Ingrain, Inc. | Digital rock analysis systems and methods with reliable multiphase permeability determination |
| US9047513B2 (en) | 2012-08-10 | 2015-06-02 | Ingrain, Inc. | Method for improving the accuracy of rock property values derived from digital images |
| US10514372B2 (en) * | 2012-08-23 | 2019-12-24 | Halliburton Energy Services, Inc. | Digital rock analysis systems and methods that reliably predict a porosity-permeability trend |
| AU2013323422B2 (en) | 2012-09-27 | 2018-07-05 | Ingrain, Inc. | Computed tomography (CT) systems and methods analyzing rock property changes resulting from a treatment |
| BR112015009770A2 (en) | 2012-11-01 | 2017-07-11 | Ingrain Inc | rock and other sample characterization by process and system for sample preparation using refractory mounting materials |
| AU2014201420A1 (en) * | 2013-03-22 | 2014-10-09 | Cgg Services Sa | Method and device for attenuating random noise in seismic data |
| US9791431B2 (en) * | 2013-07-19 | 2017-10-17 | Ingrain, Inc. | Cuttings-based well logging |
| EA031381B1 (en) | 2013-08-06 | 2018-12-28 | Бипи Корпорейшн Норт Америка Инк. | Image-based direct numerical simulation of petrophysical properties under simulated stress and strain conditions |
| US10247852B2 (en) | 2013-08-08 | 2019-04-02 | Halliburton Energy Services, Inc. | Conditioning of expanded porosity |
| US10197696B2 (en) * | 2013-11-15 | 2019-02-05 | Baker Hughes, A Ge Company, Llc | NMR logging interpretation of solid invasion |
| WO2015084533A1 (en) * | 2013-12-05 | 2015-06-11 | Schlumberger Canada Limited | Digital core model construction |
| CN104727811A (en) * | 2013-12-23 | 2015-06-24 | 中国石油化工股份有限公司 | Productivity prediction method of fishbone horizontal well segmented coupling |
| US9183656B2 (en) * | 2014-03-11 | 2015-11-10 | Fei Company | Blend modes for mineralogy images |
| US10001446B2 (en) | 2014-11-07 | 2018-06-19 | Ge Energy Oilfield Technology, Inc. | Core sample analysis |
| US9970888B2 (en) * | 2014-11-07 | 2018-05-15 | Ge Energy Oilfield Technology, Inc. | System and method for wellsite core sample analysis |
| US10261204B2 (en) | 2014-12-31 | 2019-04-16 | Ge Energy Oilfield Technology, Inc. | Methods and systems for scan analysis of a core sample |
| US10031148B2 (en) | 2014-12-31 | 2018-07-24 | Ge Energy Oilfield Technology, Inc. | System for handling a core sample |
| CN107250828A (en) * | 2015-01-16 | 2017-10-13 | 因格瑞恩股份有限公司 | Cutting Analysis for Improved Downhole NMR Characterization |
| WO2016171650A1 (en) * | 2015-04-20 | 2016-10-27 | Halliburton Energy Services, Inc. | Shaker control and optimization |
| US10302814B2 (en) | 2015-08-20 | 2019-05-28 | Baker Hughes, A Ge Company, Llc | Mechanisms-based fracture model for geomaterials |
| US10546072B2 (en) | 2016-03-28 | 2020-01-28 | Baker Huges, A Ge Company, Llc | Obtaining micro- and macro-rock properties with a calibrated rock deformation simulation |
| US10102311B2 (en) * | 2016-03-28 | 2018-10-16 | Baker Hughes, A Ge Company, Llc | Obtaining micro- and macro-rock properties with a calibrated rock deformation simulation |
| US10621292B2 (en) | 2016-04-18 | 2020-04-14 | International Business Machines Corporation | Method, apparatus and computer program product providing simulator for enhanced oil recovery based on micron and submicron scale fluid-solid interactions |
| CN106202695B (en) * | 2016-07-07 | 2018-04-20 | 清能艾科(深圳)能源技术有限公司 | It is a kind of that the method for calculating core permeability is simulated using digital cores |
| WO2018081261A1 (en) | 2016-10-31 | 2018-05-03 | Bp Corporation North America Inc. | Direct numerical simulation of petrophysical properties of rocks with two or more immicible phases |
| US10648292B2 (en) | 2017-03-01 | 2020-05-12 | International Business Machines Corporation | Cognitive enhanced oil recovery advisor system based on digital rock simulator |
| US10691846B2 (en) | 2017-03-01 | 2020-06-23 | International Business Machines Corporation | Capillary network simulations based on a low-dimensional representation of porous media |
| CN107219154B (en) * | 2017-05-24 | 2020-07-07 | 中国石油大学(华东) | Laser particle analyzer for online analysis of underground rock debris particle size |
| BR112020009026A2 (en) | 2017-11-06 | 2020-10-27 | Khalifa University of Science and Technology | method and system for determining the permeability of a porous medium |
| GB2583843B (en) | 2018-02-05 | 2022-05-25 | Halliburton Energy Services Inc | Volume, size, and shape analysis of downhole particles |
| WO2019236272A1 (en) | 2018-06-04 | 2019-12-12 | Halliburton Energy Services, Inc. | Velocity measurement of drilled cuttings on a shaker |
| US11009497B2 (en) | 2018-06-22 | 2021-05-18 | Bp Corporation North America Inc. | Systems and methods for estimating mechanical properties of rocks using grain contact models |
| US11047228B2 (en) * | 2018-10-19 | 2021-06-29 | Saudi Arabian Oil Company | Predicting carbonate porosity based on petrographic data |
| US11492541B2 (en) | 2019-07-24 | 2022-11-08 | Saudi Arabian Oil Company | Organic salts of oxidizing anions as energetic materials |
| US11319478B2 (en) | 2019-07-24 | 2022-05-03 | Saudi Arabian Oil Company | Oxidizing gasses for carbon dioxide-based fracturing fluids |
| CN110222368B (en) * | 2019-08-02 | 2021-09-17 | 中国石油大学(华东) | Method for calculating three-dimensional porosity and permeability of rock core by using two-dimensional slice |
| US11352548B2 (en) | 2019-12-31 | 2022-06-07 | Saudi Arabian Oil Company | Viscoelastic-surfactant treatment fluids having oxidizer |
| WO2021138355A1 (en) | 2019-12-31 | 2021-07-08 | Saudi Arabian Oil Company | Viscoelastic-surfactant fracturing fluids having oxidizer |
| US11846183B2 (en) | 2020-02-11 | 2023-12-19 | Halliburton Energy Services, Inc. | Determination of perforation crush zone permeability |
| US11542815B2 (en) | 2020-11-30 | 2023-01-03 | Saudi Arabian Oil Company | Determining effect of oxidative hydraulic fracturing |
| US11649702B2 (en) | 2020-12-03 | 2023-05-16 | Saudi Arabian Oil Company | Wellbore shaped perforation assembly |
| US12071814B2 (en) | 2020-12-07 | 2024-08-27 | Saudi Arabian Oil Company | Wellbore notching assembly |
| CN112525799A (en) * | 2020-12-14 | 2021-03-19 | 中国石油大学(华东) | Method for determining porous medium permeability change in gas hydrate decomposition process |
| US12071589B2 (en) | 2021-10-07 | 2024-08-27 | Saudi Arabian Oil Company | Water-soluble graphene oxide nanosheet assisted high temperature fracturing fluid |
| US12025589B2 (en) | 2021-12-06 | 2024-07-02 | Saudi Arabian Oil Company | Indentation method to measure multiple rock properties |
| US11619127B1 (en) | 2021-12-06 | 2023-04-04 | Saudi Arabian Oil Company | Wellhead acoustic insulation to monitor hydraulic fracturing |
| US12012550B2 (en) | 2021-12-13 | 2024-06-18 | Saudi Arabian Oil Company | Attenuated acid formulations for acid stimulation |
| US11746623B2 (en) | 2022-01-27 | 2023-09-05 | Halliburton Energy Services, Inc. | System and method to calibrate digital rock wettability |
| CN115063354B (en) * | 2022-05-25 | 2025-09-09 | 清能艾科(深圳)能源技术有限公司 | Cross-scale permeability calculation method and device of core, equipment and medium |
| CN114998246B (en) * | 2022-05-27 | 2025-01-21 | 安徽理工大学 | A method for calculating absolute permeability of porous media based on image layering processing technology |
| US12385394B1 (en) | 2024-07-25 | 2025-08-12 | Saudi Arabian Oil Company | Hydrocarbon exploration and production using porosity variation prediction based on carbonate texture |
Family Cites Families (8)
| Publication number | Priority date | Publication date | Assignee | Title |
|---|---|---|---|---|
| US5877995A (en) * | 1991-05-06 | 1999-03-02 | Exxon Production Research Company | Geophysical prospecting |
| US6516080B1 (en) * | 2000-04-05 | 2003-02-04 | The Board Of Trustees Of The Leland Stanford Junior University | Numerical method of estimating physical properties of three-dimensional porous media |
| US6807487B2 (en) * | 2001-05-11 | 2004-10-19 | Nonlinear Seismic Imaging, Inc. | Mapping permeable reservoir formations by measuring the elastic nonlinear interactions of a seismic wave as it propagates through the reservoir rock matrix and its pore fluids |
| CA2449302C (en) * | 2001-06-18 | 2010-03-02 | Richard S. Polizzotti | Hydrothermal drilling method and system |
| US6933719B2 (en) * | 2003-07-03 | 2005-08-23 | Exxonmobil Research And Engineering Co. | Fluid flow properties from acoustically stimulated NMR |
| WO2005104002A1 (en) * | 2004-03-31 | 2005-11-03 | Exxonmobil Upstream Research Company | Method for simulating and estimating sandstone properties |
| GB2414072B (en) | 2004-05-12 | 2006-07-26 | Schlumberger Holdings | Classification method for sedimentary rocks |
| US20090105955A1 (en) * | 2007-09-25 | 2009-04-23 | Baker Hughes Incorporated | Sensors For Estimating Properties Of A Core |
-
2008
- 2008-11-29 US US12/325,151 patent/US8081802B2/en active Active
-
2009
- 2009-11-18 SA SA109300700A patent/SA109300700B1/en unknown
- 2009-11-22 EP EP09799447.9A patent/EP2368106B1/en active Active
- 2009-11-22 ES ES09799447T patent/ES2701906T3/en active Active
- 2009-11-22 AU AU2009319885A patent/AU2009319885B2/en not_active Ceased
- 2009-11-22 WO PCT/US2009/065431 patent/WO2010062839A1/en not_active Ceased
Non-Patent Citations (1)
| Title |
|---|
| None * |
Also Published As
| Publication number | Publication date |
|---|---|
| US8081802B2 (en) | 2011-12-20 |
| SA109300700B1 (en) | 2013-10-01 |
| AU2009319885B2 (en) | 2015-01-22 |
| AU2009319885A1 (en) | 2010-06-03 |
| US20100135536A1 (en) | 2010-06-03 |
| WO2010062839A1 (en) | 2010-06-03 |
| ES2701906T3 (en) | 2019-02-26 |
| EP2368106A1 (en) | 2011-09-28 |
Similar Documents
| Publication | Publication Date | Title |
|---|---|---|
| US8081802B2 (en) | Method for determining permeability of rock formation using computer tomograpic images thereof | |
| EP2359334B1 (en) | Method for determining rock physics relationships using computer tomographic images thereof | |
| US8081796B2 (en) | Method for determining properties of fractured rock formations using computer tomograpic images thereof | |
| EP2124042B1 (en) | Method for estimating fluid transport properties in porous media using computer tomographic images thereof | |
| US8170799B2 (en) | Method for determining in-situ relationships between physical properties of a porous medium from a sample thereof | |
| EP2359311B1 (en) | Method for determining elastic-wave attenuation of rock formations using computer tomograpic images thereof | |
| AU2011258594B2 (en) | Method for obtaining consistent and integrated physical properties of porous media | |
| US9046509B2 (en) | Method and system for estimating rock properties from rock samples using digital rock physics imaging | |
| Al-Marzouqi | Digital rock physics: Using CT scans to compute rock properties | |
| Njiekak et al. | Pore systems in carbonate formations, Weyburn field, Saskatchewan, Canada: Micro-tomography, helium porosimetry and mercury intrusion porosimetry characterization | |
| Khimulia | Digital examination of pore space characteristics and structural properties of a gas condensate field reservoir on the basis of μCT images | |
| Rahim et al. | Coal Adsorption: Comparison Between the 3D Imaging of Gas Sorption Isotherms by X-rays Computed Tomography–A Review | |
| Deshenenkov et al. | Enhancement of Well Log Data Interpretation with Digital Rock Technology | |
| Abid | Digital formation evaluation via X-ray micro-computed tomography |
Legal Events
| Date | Code | Title | Description |
|---|---|---|---|
| PUAI | Public reference made under article 153(3) epc to a published international application that has entered the european phase |
Free format text: ORIGINAL CODE: 0009012 |
|
| 17P | Request for examination filed |
Effective date: 20110620 |
|
| AK | Designated contracting states |
Kind code of ref document: A1 Designated state(s): AT BE BG CH CY CZ DE DK EE ES FI FR GB GR HR HU IE IS IT LI LT LU LV MC MK MT NL NO PL PT RO SE SI SK SM TR |
|
| DAX | Request for extension of the european patent (deleted) | ||
| STAA | Information on the status of an ep patent application or granted ep patent |
Free format text: STATUS: EXAMINATION IS IN PROGRESS |
|
| 17Q | First examination report despatched |
Effective date: 20170208 |
|
| GRAP | Despatch of communication of intention to grant a patent |
Free format text: ORIGINAL CODE: EPIDOSNIGR1 |
|
| STAA | Information on the status of an ep patent application or granted ep patent |
Free format text: STATUS: GRANT OF PATENT IS INTENDED |
|
| RIC1 | Information provided on ipc code assigned before grant |
Ipc: G01N 23/046 20180101ALI20180413BHEP Ipc: G01N 23/04 20060101AFI20180413BHEP |
|
| INTG | Intention to grant announced |
Effective date: 20180514 |
|
| GRAS | Grant fee paid |
Free format text: ORIGINAL CODE: EPIDOSNIGR3 |
|
| GRAA | (expected) grant |
Free format text: ORIGINAL CODE: 0009210 |
|
| STAA | Information on the status of an ep patent application or granted ep patent |
Free format text: STATUS: THE PATENT HAS BEEN GRANTED |
|
| AK | Designated contracting states |
Kind code of ref document: B1 Designated state(s): AT BE BG CH CY CZ DE DK EE ES FI FR GB GR HR HU IE IS IT LI LT LU LV MC MK MT NL NO PL PT RO SE SI SK SM TR |
|
| REG | Reference to a national code |
Ref country code: GB Ref legal event code: FG4D |
|
| REG | Reference to a national code |
Ref country code: CH Ref legal event code: EP Ref country code: FR Ref legal event code: PLFP Year of fee payment: 10 |
|
| REG | Reference to a national code |
Ref country code: AT Ref legal event code: REF Ref document number: 1043825 Country of ref document: AT Kind code of ref document: T Effective date: 20181015 |
|
| REG | Reference to a national code |
Ref country code: IE Ref legal event code: FG4D |
|
| REG | Reference to a national code |
Ref country code: DE Ref legal event code: R096 Ref document number: 602009054651 Country of ref document: DE |
|
| RAP2 | Party data changed (patent owner data changed or rights of a patent transferred) |
Owner name: HALLIBURTON ENERGY SERVICES, INC. |
|
| REG | Reference to a national code |
Ref country code: NL Ref legal event code: FP |
|
| REG | Reference to a national code |
Ref country code: NO Ref legal event code: T2 Effective date: 20180919 |
|
| PG25 | Lapsed in a contracting state [announced via postgrant information from national office to epo] |
Ref country code: BG Free format text: LAPSE BECAUSE OF FAILURE TO SUBMIT A TRANSLATION OF THE DESCRIPTION OR TO PAY THE FEE WITHIN THE PRESCRIBED TIME-LIMIT Effective date: 20181219 Ref country code: SE Free format text: LAPSE BECAUSE OF FAILURE TO SUBMIT A TRANSLATION OF THE DESCRIPTION OR TO PAY THE FEE WITHIN THE PRESCRIBED TIME-LIMIT Effective date: 20180919 Ref country code: LT Free format text: LAPSE BECAUSE OF FAILURE TO SUBMIT A TRANSLATION OF THE DESCRIPTION OR TO PAY THE FEE WITHIN THE PRESCRIBED TIME-LIMIT Effective date: 20180919 Ref country code: GR Free format text: LAPSE BECAUSE OF FAILURE TO SUBMIT A TRANSLATION OF THE DESCRIPTION OR TO PAY THE FEE WITHIN THE PRESCRIBED TIME-LIMIT Effective date: 20181220 Ref country code: FI Free format text: LAPSE BECAUSE OF FAILURE TO SUBMIT A TRANSLATION OF THE DESCRIPTION OR TO PAY THE FEE WITHIN THE PRESCRIBED TIME-LIMIT Effective date: 20180919 |
|
| REG | Reference to a national code |
Ref country code: LT Ref legal event code: MG4D |
|
| REG | Reference to a national code |
Ref country code: ES Ref legal event code: FG2A Ref document number: 2701906 Country of ref document: ES Kind code of ref document: T3 Effective date: 20190226 |
|
| PG25 | Lapsed in a contracting state [announced via postgrant information from national office to epo] |
Ref country code: LV Free format text: LAPSE BECAUSE OF FAILURE TO SUBMIT A TRANSLATION OF THE DESCRIPTION OR TO PAY THE FEE WITHIN THE PRESCRIBED TIME-LIMIT Effective date: 20180919 Ref country code: HR Free format text: LAPSE BECAUSE OF FAILURE TO SUBMIT A TRANSLATION OF THE DESCRIPTION OR TO PAY THE FEE WITHIN THE PRESCRIBED TIME-LIMIT Effective date: 20180919 |
|
| REG | Reference to a national code |
Ref country code: AT Ref legal event code: MK05 Ref document number: 1043825 Country of ref document: AT Kind code of ref document: T Effective date: 20180919 |
|
| REG | Reference to a national code |
Ref country code: DE Ref legal event code: R082 Ref document number: 602009054651 Country of ref document: DE Representative=s name: WITHERS & ROGERS LLP, DE |
|
| PG25 | Lapsed in a contracting state [announced via postgrant information from national office to epo] |
Ref country code: PL Free format text: LAPSE BECAUSE OF FAILURE TO SUBMIT A TRANSLATION OF THE DESCRIPTION OR TO PAY THE FEE WITHIN THE PRESCRIBED TIME-LIMIT Effective date: 20180919 Ref country code: IS Free format text: LAPSE BECAUSE OF FAILURE TO SUBMIT A TRANSLATION OF THE DESCRIPTION OR TO PAY THE FEE WITHIN THE PRESCRIBED TIME-LIMIT Effective date: 20190119 Ref country code: CZ Free format text: LAPSE BECAUSE OF FAILURE TO SUBMIT A TRANSLATION OF THE DESCRIPTION OR TO PAY THE FEE WITHIN THE PRESCRIBED TIME-LIMIT Effective date: 20180919 Ref country code: AT Free format text: LAPSE BECAUSE OF FAILURE TO SUBMIT A TRANSLATION OF THE DESCRIPTION OR TO PAY THE FEE WITHIN THE PRESCRIBED TIME-LIMIT Effective date: 20180919 Ref country code: RO Free format text: LAPSE BECAUSE OF FAILURE TO SUBMIT A TRANSLATION OF THE DESCRIPTION OR TO PAY THE FEE WITHIN THE PRESCRIBED TIME-LIMIT Effective date: 20180919 Ref country code: EE Free format text: LAPSE BECAUSE OF FAILURE TO SUBMIT A TRANSLATION OF THE DESCRIPTION OR TO PAY THE FEE WITHIN THE PRESCRIBED TIME-LIMIT Effective date: 20180919 |
|
| PG25 | Lapsed in a contracting state [announced via postgrant information from national office to epo] |
Ref country code: SM Free format text: LAPSE BECAUSE OF FAILURE TO SUBMIT A TRANSLATION OF THE DESCRIPTION OR TO PAY THE FEE WITHIN THE PRESCRIBED TIME-LIMIT Effective date: 20180919 Ref country code: PT Free format text: LAPSE BECAUSE OF FAILURE TO SUBMIT A TRANSLATION OF THE DESCRIPTION OR TO PAY THE FEE WITHIN THE PRESCRIBED TIME-LIMIT Effective date: 20190119 Ref country code: SK Free format text: LAPSE BECAUSE OF FAILURE TO SUBMIT A TRANSLATION OF THE DESCRIPTION OR TO PAY THE FEE WITHIN THE PRESCRIBED TIME-LIMIT Effective date: 20180919 |
|
| REG | Reference to a national code |
Ref country code: DE Ref legal event code: R097 Ref document number: 602009054651 Country of ref document: DE |
|
| REG | Reference to a national code |
Ref country code: CH Ref legal event code: PL |
|
| PLBE | No opposition filed within time limit |
Free format text: ORIGINAL CODE: 0009261 |
|
| STAA | Information on the status of an ep patent application or granted ep patent |
Free format text: STATUS: NO OPPOSITION FILED WITHIN TIME LIMIT |
|
| PG25 | Lapsed in a contracting state [announced via postgrant information from national office to epo] |
Ref country code: DK Free format text: LAPSE BECAUSE OF FAILURE TO SUBMIT A TRANSLATION OF THE DESCRIPTION OR TO PAY THE FEE WITHIN THE PRESCRIBED TIME-LIMIT Effective date: 20180919 Ref country code: LU Free format text: LAPSE BECAUSE OF NON-PAYMENT OF DUE FEES Effective date: 20181122 Ref country code: MC Free format text: LAPSE BECAUSE OF FAILURE TO SUBMIT A TRANSLATION OF THE DESCRIPTION OR TO PAY THE FEE WITHIN THE PRESCRIBED TIME-LIMIT Effective date: 20180919 |
|
| REG | Reference to a national code |
Ref country code: BE Ref legal event code: MM Effective date: 20181130 |
|
| REG | Reference to a national code |
Ref country code: IE Ref legal event code: MM4A |
|
| 26N | No opposition filed |
Effective date: 20190620 |
|
| PG25 | Lapsed in a contracting state [announced via postgrant information from national office to epo] |
Ref country code: CH Free format text: LAPSE BECAUSE OF NON-PAYMENT OF DUE FEES Effective date: 20181130 Ref country code: LI Free format text: LAPSE BECAUSE OF NON-PAYMENT OF DUE FEES Effective date: 20181130 |
|
| PG25 | Lapsed in a contracting state [announced via postgrant information from national office to epo] |
Ref country code: IE Free format text: LAPSE BECAUSE OF NON-PAYMENT OF DUE FEES Effective date: 20181122 Ref country code: SI Free format text: LAPSE BECAUSE OF FAILURE TO SUBMIT A TRANSLATION OF THE DESCRIPTION OR TO PAY THE FEE WITHIN THE PRESCRIBED TIME-LIMIT Effective date: 20180919 |
|
| PG25 | Lapsed in a contracting state [announced via postgrant information from national office to epo] |
Ref country code: BE Free format text: LAPSE BECAUSE OF NON-PAYMENT OF DUE FEES Effective date: 20181130 |
|
| PG25 | Lapsed in a contracting state [announced via postgrant information from national office to epo] |
Ref country code: MT Free format text: LAPSE BECAUSE OF NON-PAYMENT OF DUE FEES Effective date: 20181122 |
|
| PG25 | Lapsed in a contracting state [announced via postgrant information from national office to epo] |
Ref country code: TR Free format text: LAPSE BECAUSE OF FAILURE TO SUBMIT A TRANSLATION OF THE DESCRIPTION OR TO PAY THE FEE WITHIN THE PRESCRIBED TIME-LIMIT Effective date: 20180919 |
|
| PG25 | Lapsed in a contracting state [announced via postgrant information from national office to epo] |
Ref country code: CY Free format text: LAPSE BECAUSE OF FAILURE TO SUBMIT A TRANSLATION OF THE DESCRIPTION OR TO PAY THE FEE WITHIN THE PRESCRIBED TIME-LIMIT Effective date: 20180919 Ref country code: MK Free format text: LAPSE BECAUSE OF NON-PAYMENT OF DUE FEES Effective date: 20180919 Ref country code: HU Free format text: LAPSE BECAUSE OF FAILURE TO SUBMIT A TRANSLATION OF THE DESCRIPTION OR TO PAY THE FEE WITHIN THE PRESCRIBED TIME-LIMIT; INVALID AB INITIO Effective date: 20091122 |
|
| P01 | Opt-out of the competence of the unified patent court (upc) registered |
Effective date: 20230530 |
|
| REG | Reference to a national code |
Ref country code: GB Ref legal event code: 732E Free format text: REGISTERED BETWEEN 20230727 AND 20230802 |
|
| PGFP | Annual fee paid to national office [announced via postgrant information from national office to epo] |
Ref country code: NL Payment date: 20251022 Year of fee payment: 17 |
|
| PGFP | Annual fee paid to national office [announced via postgrant information from national office to epo] |
Ref country code: DE Payment date: 20251022 Year of fee payment: 17 |
|
| PGFP | Annual fee paid to national office [announced via postgrant information from national office to epo] |
Ref country code: GB Payment date: 20251001 Year of fee payment: 17 |
|
| PGFP | Annual fee paid to national office [announced via postgrant information from national office to epo] |
Ref country code: NO Payment date: 20251024 Year of fee payment: 17 |
|
| PGFP | Annual fee paid to national office [announced via postgrant information from national office to epo] |
Ref country code: IT Payment date: 20251022 Year of fee payment: 17 |
|
| PGFP | Annual fee paid to national office [announced via postgrant information from national office to epo] |
Ref country code: FR Payment date: 20251023 Year of fee payment: 17 |
|
| PGFP | Annual fee paid to national office [announced via postgrant information from national office to epo] |
Ref country code: ES Payment date: 20251201 Year of fee payment: 17 |