EP2350628B1 - Method and apparatus for on-line estimation and forecasting of species concentration during a reaction - Google Patents
Method and apparatus for on-line estimation and forecasting of species concentration during a reaction Download PDFInfo
- Publication number
- EP2350628B1 EP2350628B1 EP09795805.2A EP09795805A EP2350628B1 EP 2350628 B1 EP2350628 B1 EP 2350628B1 EP 09795805 A EP09795805 A EP 09795805A EP 2350628 B1 EP2350628 B1 EP 2350628B1
- Authority
- EP
- European Patent Office
- Prior art keywords
- function
- reaction
- deviation
- conductivity
- concentration
- Prior art date
- Legal status (The legal status is an assumption and is not a legal conclusion. Google has not performed a legal analysis and makes no representation as to the accuracy of the status listed.)
- Not-in-force
Links
- 238000006243 chemical reaction Methods 0.000 title claims description 48
- 238000000034 method Methods 0.000 title claims description 48
- 239000013598 vector Substances 0.000 claims description 12
- 238000011156 evaluation Methods 0.000 claims description 9
- 239000000203 mixture Substances 0.000 claims description 9
- 238000013528 artificial neural network Methods 0.000 claims description 7
- 238000005312 nonlinear dynamic Methods 0.000 claims description 3
- 238000003909 pattern recognition Methods 0.000 claims description 2
- 230000003542 behavioural effect Effects 0.000 claims 1
- 230000007613 environmental effect Effects 0.000 claims 1
- 238000005259 measurement Methods 0.000 description 18
- 239000003225 biodiesel Substances 0.000 description 17
- 230000008569 process Effects 0.000 description 13
- 238000012545 processing Methods 0.000 description 12
- 241000894007 species Species 0.000 description 11
- 238000004458 analytical method Methods 0.000 description 8
- 238000005070 sampling Methods 0.000 description 7
- 230000004913 activation Effects 0.000 description 6
- 238000004891 communication Methods 0.000 description 6
- 238000004519 manufacturing process Methods 0.000 description 5
- 238000007620 mathematical function Methods 0.000 description 5
- 238000003860 storage Methods 0.000 description 5
- 238000012549 training Methods 0.000 description 5
- 230000003750 conditioning effect Effects 0.000 description 4
- LFQSCWFLJHTTHZ-UHFFFAOYSA-N Ethanol Chemical compound CCO LFQSCWFLJHTTHZ-UHFFFAOYSA-N 0.000 description 3
- OKKJLVBELUTLKV-UHFFFAOYSA-N Methanol Chemical compound OC OKKJLVBELUTLKV-UHFFFAOYSA-N 0.000 description 3
- 238000005516 engineering process Methods 0.000 description 3
- 238000005457 optimization Methods 0.000 description 3
- 239000000047 product Substances 0.000 description 3
- 238000004088 simulation Methods 0.000 description 3
- 238000004611 spectroscopical analysis Methods 0.000 description 3
- 238000012360 testing method Methods 0.000 description 3
- 238000004497 NIR spectroscopy Methods 0.000 description 2
- 238000013459 approach Methods 0.000 description 2
- 238000004422 calculation algorithm Methods 0.000 description 2
- 238000004587 chromatography analysis Methods 0.000 description 2
- 238000010586 diagram Methods 0.000 description 2
- 238000002474 experimental method Methods 0.000 description 2
- JVTAAEKCZFNVCJ-UHFFFAOYSA-N lactic acid Chemical compound CC(O)C(O)=O JVTAAEKCZFNVCJ-UHFFFAOYSA-N 0.000 description 2
- 239000011159 matrix material Substances 0.000 description 2
- 238000012544 monitoring process Methods 0.000 description 2
- 239000000126 substance Substances 0.000 description 2
- 230000000007 visual effect Effects 0.000 description 2
- OWNRRUFOJXFKCU-UHFFFAOYSA-N Bromadiolone Chemical compound C=1C=C(C=2C=CC(Br)=CC=2)C=CC=1C(O)CC(C=1C(OC2=CC=CC=C2C=1O)=O)C1=CC=CC=C1 OWNRRUFOJXFKCU-UHFFFAOYSA-N 0.000 description 1
- 230000003044 adaptive effect Effects 0.000 description 1
- 238000010923 batch production Methods 0.000 description 1
- 238000004364 calculation method Methods 0.000 description 1
- 239000007795 chemical reaction product Substances 0.000 description 1
- 230000001934 delay Effects 0.000 description 1
- 238000001514 detection method Methods 0.000 description 1
- 238000003745 diagnosis Methods 0.000 description 1
- 238000009826 distribution Methods 0.000 description 1
- 125000004494 ethyl ester group Chemical group 0.000 description 1
- 238000000855 fermentation Methods 0.000 description 1
- 230000004151 fermentation Effects 0.000 description 1
- 239000012530 fluid Substances 0.000 description 1
- 238000007429 general method Methods 0.000 description 1
- 238000004128 high performance liquid chromatography Methods 0.000 description 1
- 229930195733 hydrocarbon Natural products 0.000 description 1
- 150000002430 hydrocarbons Chemical class 0.000 description 1
- 238000011065 in-situ storage Methods 0.000 description 1
- 230000010354 integration Effects 0.000 description 1
- 235000014655 lactic acid Nutrition 0.000 description 1
- 239000004310 lactic acid Substances 0.000 description 1
- 239000007788 liquid Substances 0.000 description 1
- 238000002156 mixing Methods 0.000 description 1
- 238000012986 modification Methods 0.000 description 1
- 230000004048 modification Effects 0.000 description 1
- 230000002250 progressing effect Effects 0.000 description 1
- 238000003908 quality control method Methods 0.000 description 1
- 230000004044 response Effects 0.000 description 1
- 238000007127 saponification reaction Methods 0.000 description 1
- 238000007619 statistical method Methods 0.000 description 1
- 238000003325 tomography Methods 0.000 description 1
- 238000005809 transesterification reaction Methods 0.000 description 1
Images
Classifications
-
- G—PHYSICS
- G01—MEASURING; TESTING
- G01N—INVESTIGATING OR ANALYSING MATERIALS BY DETERMINING THEIR CHEMICAL OR PHYSICAL PROPERTIES
- G01N27/00—Investigating or analysing materials by the use of electric, electrochemical, or magnetic means
- G01N27/02—Investigating or analysing materials by the use of electric, electrochemical, or magnetic means by investigating impedance
- G01N27/04—Investigating or analysing materials by the use of electric, electrochemical, or magnetic means by investigating impedance by investigating resistance
- G01N27/06—Investigating or analysing materials by the use of electric, electrochemical, or magnetic means by investigating impedance by investigating resistance of a liquid
- G01N27/08—Investigating or analysing materials by the use of electric, electrochemical, or magnetic means by investigating impedance by investigating resistance of a liquid which is flowing continuously
- G01N27/10—Investigation or analysis specially adapted for controlling or monitoring operations or for signalling
-
- Y—GENERAL TAGGING OF NEW TECHNOLOGICAL DEVELOPMENTS; GENERAL TAGGING OF CROSS-SECTIONAL TECHNOLOGIES SPANNING OVER SEVERAL SECTIONS OF THE IPC; TECHNICAL SUBJECTS COVERED BY FORMER USPC CROSS-REFERENCE ART COLLECTIONS [XRACs] AND DIGESTS
- Y10—TECHNICAL SUBJECTS COVERED BY FORMER USPC
- Y10T—TECHNICAL SUBJECTS COVERED BY FORMER US CLASSIFICATION
- Y10T137/00—Fluid handling
- Y10T137/0318—Processes
- Y10T137/0324—With control of flow by a condition or characteristic of a fluid
- Y10T137/0329—Mixing of plural fluids of diverse characteristics or conditions
Definitions
- Measuring concentration is not an easy task in engineering and process practice. Most concentration (or analysis) sensors are designed specifically for certain type of species. Other general methods, such as chromatography and spectroscopy, require sampling and laboratory analysis hence are not suitable for on-line measurement of the concentration.
- numbers 2 and 5 use conductivity, however in a non-dynamic way, and based on a direct data-driven inference, which makes them radically different from the approach taken in this invention.
- Maki and Loparo suggest the use of neural network for the monitoring reactor in their article "A Neuronal-Network approach to fault detection and diagnosis in industrial processes", IEEE transections on Control Systems technology, 5(6), p-529(1997 ).
- An unfulfilled need addressed by the present invention is to provide an automated method and a non-moving apparatus to measure species concentration in the reaction vessel based on a variable measurement easily understood by the process operators and technicians.
- the present invention provides a method and apparatus for on-line measurement and forecasting of a species concentration while a reaction is taking place, based on the measurement of the electrical conductivity of the reacting volume, and using such measurement to evaluate a first mathematical function relating such value to the concentration of the species in the reacting volume.
- the evaluation of the first mathematical function requires as inputs: electrical conductivity trajectory, time elapsed, and other significant process variables; it generates as outputs the estimated actual species concentration and at least one forecasted concentration value.
- This method and apparatus also provides an alarm based on the electrical conductivity measurement and a second mathematical function to indicate that the reaction is deviating from the desired behavior to another reaction pattern.
- the present invention allows engineers in production processes to measure the concentration of reacting species in a simpler, faster, and easier to implement way. This is because electrical conductivity measurement requires no moving parts and is easier to implement than analytical techniques such as NIR. In addition, the invention allows manufacturers to improve quality control of the process by means of the warning signal generated by the deviation function.
- the apparatus conceived in this invention may contain any combination of electrical conductivity sensor, display, keyboard, communication interface, other analog/digital inputs, other analog/digital outputs, processing unit, storage unit, or power supply.
- the present invention relates to:
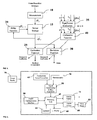
- FIG 1 The diagram describing the methods integration is presented in FIG 1 .
- the electrical conductivity measures by the measurement block (10) are collected using a sensor that gives the conductivity at each sample time.
- the second step is to store a vector of electrical conductivity in the storage block (15), building the conductivity trajectory, in order to feed it into the estimation function and the deviation function.
- This trajectory has n electrical conductivity samples and it is updated by the delay function (20) every sample time.
- the estimation function (25) is determined by means of the following steps:
- the deviation function (30) is determined by means of the following steps:
- the apparatus conceived in this invention consists at least of the following elements: a processing unit board, signal conditioning and data acquisition module board with for inputs and outputs, an electrical conductivity sensor, a communication interface, and a power supply.
- a computer or PLC may be used for processing and process/operator interface.
- the processing unit board executes the significance evaluation, calibration, estimation and deviation functions, and performs the steps required to calculate both functions, also called calibration. It may have routines to allow the user input the data for the calibration steps.
- the invention was embodied and tested for a transesterification reaction to obtain ethyl ester (biodiesel), and biodiesel concentration was measured and forecasted using the methods and apparatus described in this invention.
- the diagram describing this method is presented in FIG 1 .
- the electrical conductivity measures by the measurement block (10) are collected using a sensor that gives the conductivity at each sample time.
- the second step is to store a vector of electrical conductivity in the storage block (15), in order to feed these values into the estimation function and the deviation function.
- This vector has n samples from the conductivity and its actualized trough the delay function each sample time.
- the delay function block (20) delays the input electrical conductivity vector for the uses in the vector storage function.
- the estimation function block (25) is determined using a standard feed-forward neural network with an input layer, one hidden layer and one output layer.
- the activation function used in the hidden layer is a sigmoid like function while in the other two layers a linear activation function is used. This function has as input the conductivity vector. This function estimates the biodiesel concentration in the reaction using the inputted information.
- the deviation function block (30) is determined using a time based function that generates a warning of the undesired behavior from the reaction.
- This function has a model from the conductivity used to estimate the time in which the reaction has stopped or is leading to saponification reactions.
- the Significance evaluation function is used in the start-up operation for the analysis of variables. This function determines which variables besides the conductivity, are useful in the identification of biodiesel concentration variations in the reaction phase. As result of this function, significant variables are selected, which are the ones explain better the process variations.
- the Calibration function is used in order to modify the evaluation and deviation function, using the significant variables obtained with the significance evaluation function. This modification adjusts the functions weights and structure, to adapt them to the particular biodiesel production process.
- the method used in the estimation and deviation function requires a calibration or start up procedure in order to adjust the parameters and find the structure of each one of these functions.
- the necessary steps for the start-up procedure can be summarized as follows:
- the conductivity data collected trough the batch production tests are used to construct a model from the conductivity.
- the conductivity is approximated using an Adaptive Neuro-Fuzzy Inference System (ANFIS) trained using back-propagation based algorithm.
- AFIS Adaptive Neuro-Fuzzy Inference System
- This model is a time series. Statistical analysis can be performed in order to get the best fit for the data.
- the estimation function was approximated using a standard feed-forward neural network with an input layer, one hidden layer and one output layer.
- the activation function used in the hidden layer is a sigmoid like function while in the other two layers a linear activation function were used.
- a is the maximum input of the activation function used
- xi is the training data for an input
- Ni is the number of inputs
- N(0,1) is a normal random number generator with mean equal to zero and variance equal to one.
- X is the input training data
- f is the activation function
- V b is equal to V except that one column with ones is added to express output bias b o
- Y is the output training data.
- the optimization of neural network architecture was carried out using a greedy search modified for a multiobjective optimization procedure.
- a deviation function is determined in order to warn about the undesired behavior of the reaction.
- This deviation function calculates the maximum time before a specific pattern of conductivity behavior must occur at the normal process reaction. In the case this pattern does not occur, an alarm is set trough a binary state, indicating one as undesired process reaction and zero as normal process reaction.
- the present invention requires off-line laboratory calibration procedure to adjust the regression models (estimation function and deviation function).
- Data required for calibration consists of a set of samples with electrical conductivity, biodiesel concentration, and other common process variables such as temperature, pressure, level, and flow. Electrical conductivity and temperature can be measured with the apparatus described in this invention. Pressure, flow, and level can be determined by means of appropriate sensors for Biodiesel production.
- Off-line analytical methods such as chromatography or spectroscopy may be used to measure biodiesel concentration to comply with this start-up requirement. This information shall be used by the apparatus to automatically, or with human assistance, incorporate statistically significant variables into the mathematical functions, and estimate the correlation structure, weights, and coefficients.
- the preferred embodiment of the apparatus conceived in this invention, presented in FIG 2 . consists of the following elements: (45) a processing unit board, (50) signal conditioning and data acquisition module board with for inputs, (55) a keyboard, (60) a display, (65) a toroidal electrical conductivity sensor, with a transmitter that uses a 4-20mA output, (70) a thermocouple, (75) an analog output board of 4-20 mA, (80) a digital output board, (85) a visual signal, (90) a serial RS-232 communication interface, and (95) a power supply.
- the signal conditioning and data acquisition board are used to receive the signal coming from the thermocouple and electrical conductivity transmitter and passing in a digital form to the processing unit.
- the analog output board communicates with the processing unit, trough digital format to convert this digital signal to an analog signal of 4-20mA proportional to biodiesel concentration.
- the digital output board receives a signal coming from the processing unit that is the output from the alarm function. This signal is conditioning in the digital output board to be transmitted in a safe way using differential voltage.
- the visual signal uses the signal from the digital output board to show the alarm status on-site.
- the RS-232 Interface provides communication with a PC, modem, or another apparatus to transmit the current value of the biodiesel concentration and alarm signal.
- FIG 3 may consists of the following elements: (100) a Programmable Logic Controller (PLC) processor unit, (105) 4-20mA analog inputs module for PLC, (110) thermocouple inputs module for PLC, (115) RS-232 serial communication module for PLC, (120) 4-20mA analog outputs module for PLC, (125) a 24 volts digital outputs module for PLC, (130) a toroidal electrical conductivity sensor, with a transmitter that uses a 4-20mA output, (135) a thermocouple, and (140) power supply.
- PLC Programmable Logic Controller
- the PLC processing unit executes the significance, calibration, estimation, delay, storage and alarm functions. Also have routines to allow the user to input the data for start-up operations in an easy way with a computer interface.
- the function may be executed also in an external PLC or PC that communicates with processing unit.
- the analog input module receives the signal from the conductivity transmitter and communicates with the processor unit.
- the analog output module communicates with the processing unit, giving a 4-20mA analog signal proportional to biodiesel concentration.
- the digital output module communicates with the processing unit giving a signal proportional to the alarm function output.
- the RS-232 Interface provides communication with a PC, modem, or another apparatus to access the programming interface from PLC, and eventually transmit the real time data from biodiesel concentration measurement.
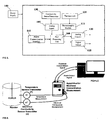
- FIG 4 A typical configuration for biodiesel concentration measurement using the invention described above is presented in FIG 4 . This information could be used to feed a control algorithm that controls the reaction process or a monitoring process to assure quality of the reaction.
Landscapes
- Chemical & Material Sciences (AREA)
- Chemical Kinetics & Catalysis (AREA)
- Electrochemistry (AREA)
- Physics & Mathematics (AREA)
- Health & Medical Sciences (AREA)
- Life Sciences & Earth Sciences (AREA)
- Analytical Chemistry (AREA)
- Biochemistry (AREA)
- General Health & Medical Sciences (AREA)
- General Physics & Mathematics (AREA)
- Immunology (AREA)
- Pathology (AREA)
- Investigating Or Analyzing Materials By The Use Of Electric Means (AREA)
Description
- None.
- Measuring concentration is not an easy task in engineering and process practice. Most concentration (or analysis) sensors are designed specifically for certain type of species. Other general methods, such as chromatography and spectroscopy, require sampling and laboratory analysis hence are not suitable for on-line measurement of the concentration.
- Some works that measure concentration using indirect measurement variables can be listed as follows:
- 1. Concentration distribution in a fluid by electric impedance tomography [Ijaz et.al., 2007]
- 2. Lactic acid concentration estimation in fermentation broth by conductivity measurement, [Payot et.al., 1997]
- 3. Method for determining component concentration in three-component mixture, [Sota et.al., 2002],
US Patent No 6,350,426 . - 4. Method and apparatus for analyzing chemical composition, [Markant et.al., 1970],
US Patent 3,537,820 - 5. Arrangement for determining concentration of measurement liquid with neural network based on conductivity, [Schwulera and Riegel, 2000], German Patent Office,
DE 198 35 137 .A 1 - Out of the previous methods, numbers 2 and 5 use conductivity, however in a non-dynamic way, and based on a direct data-driven inference, which makes them radically different from the approach taken in this invention.
- When the task of measuring concentration is focused in a chemical reactor, it becomes even more challenging, since concentration exhibits a dynamic behavior that most sensors are not capable of taking into account.
- So far, common production practices and technology call for off-line sample analysis from the product stream, and the reacting volume is monitored for operational variables such as temperature and pressure, but not for product quality purposes. Product stream analysis is performed by sampling every often and taking those samples to a laboratory.
- Lately, some estimation methods have been developed to monitor a progressing reaction based on the use of in-situ viscometer [Elli, et.al., 2007] and fiber-optic near-infrared (NIR) spectroscopy [Knothe, 2000]. Later, the NIR method by Knothe was used to measure biodiesel content in a hydrocarbons mixture, useful in blending applications, as presented on
US Patent 7,404,411 . Using a viscometer requires adding a moving element into the reaction vessel. NIR spectroscopy is a very expensive technology, not always suitable for the plant floor, and it also requires a well trained operator. Also, the methods presented in the literature, do not explicitly take into account dynamic behavior. - Maki and Loparo suggest the use of neural network for the monitoring reactor in their article "A Neuronal-Network approach to fault detection and diagnosis in industrial processes", IEEE transections on Control Systems technology, 5(6), p-529(1997).
- An unfulfilled need addressed by the present invention is to provide an automated method and a non-moving apparatus to measure species concentration in the reaction vessel based on a variable measurement easily understood by the process operators and technicians.
- The present invention provides a method and apparatus for on-line measurement and forecasting of a species concentration while a reaction is taking place, based on the measurement of the electrical conductivity of the reacting volume, and using such measurement to evaluate a first mathematical function relating such value to the concentration of the species in the reacting volume. The evaluation of the first mathematical function requires as inputs: electrical conductivity trajectory, time elapsed, and other significant process variables; it generates as outputs the estimated actual species concentration and at least one forecasted concentration value.
- This method and apparatus also provides an alarm based on the electrical conductivity measurement and a second mathematical function to indicate that the reaction is deviating from the desired behavior to another reaction pattern.
- The present invention allows engineers in production processes to measure the concentration of reacting species in a simpler, faster, and easier to implement way. This is because electrical conductivity measurement requires no moving parts and is easier to implement than analytical techniques such as NIR. In addition, the invention allows manufacturers to improve quality control of the process by means of the warning signal generated by the deviation function.
- The apparatus conceived in this invention may contain any combination of electrical conductivity sensor, display, keyboard, communication interface, other analog/digital inputs, other analog/digital outputs, processing unit, storage unit, or power supply.
- For a fuller understanding of the invention, reference should be made to the following detailed description, taken in connection with the accompanying drawings, in wich:
-
FIG 1 . Is an Illustration of the method for biodiesel concentration measurement. -
FIG 2 . Is an Illustration of the apparatus in the preferred embodiment. -
FIG 3 . Is an Illustration of other configuration using PLC in the preferred embodiment. -
FIG 4 . Is an Illustration of typical configuration for biodiesel concentration measurement using the apparatus. - The present invention relates to:
- A method to relate dynamic conductivity behavior to dynamic species concentration behavior, such that a first mathematical dynamic function, the estimation function, can be obtained where the conductivity trajectory, time elapsed, and other significant process variable trajectory are used to estimate the present value of the species concentration and its forecasted behavior.
- A method to relate dynamic conductivity behavior to dynamic species concentration behavior, such that a second mathematical dynamic function, the deviation function, can be obtained where the conductivity trajectory, time elapsed, and other significant process variable trajectory are used to provide an alarm indicating that significant deviation from the desired reaction pattern is been observed.
- A system and apparatus that by using the first, second, or both mathematical functions, on-line conductivity measurement, and other significant variables measurement, estimates and forecasts species concentration in a reacting volume and generates an alarm condition of deviation from a desired reaction pattern.
- The diagram describing the methods integration is presented in
FIG 1 . - The electrical conductivity measures by the measurement block (10) are collected using a sensor that gives the conductivity at each sample time.
- The second step is to store a vector of electrical conductivity in the storage block (15), building the conductivity trajectory, in order to feed it into the estimation function and the deviation function. This trajectory has n electrical conductivity samples and it is updated by the delay function (20) every sample time.
- The estimation function (25) is determined by means of the following steps:
- ○ Perform batch reactions tests
- ○ Measure concentration, conductivity, and other significant variables in samples from the batch reactions at any possible sampling rate, generating at least 5 data points for every variable.
- ○ Fit the reaction model kinetics coefficients that best describe the reaction.
- ○ Fit a dynamic conductivity model.
- ○ Simulate the dynamic models and sample from the simulation at a uniform sampling rate.
- ○ Generate a nonlinear dynamic function relating time elapsed, t, conductivity trajectory, and other significant process variables trajectory, with species concentration at time t, and the forecasted concentration at time t+T, t+2T, ..., t+kT, where T is the sampling period and k is the maximum forecasting lag, a number equal or larger than 1.
- The deviation function (30) is determined by means of the following steps:
- ○ Perform batch reactions tests
- ○ Measure concentration, conductivity, and other significant variables in samples from the batch reactions at any possible sampling rate, generating at least 5 data points for every variable.
- ○ Fit the reaction model kinetics coefficients that best describe the reaction.
- ○ Fit a dynamic conductivity model.
- ○ Simulate the dynamic models and sample from the simulation at a uniform sampling rate.
- ○ Generate a minimum and maximum stagnation time indicator based on simulated dynamic data and variance measures from batch experiments.
- ○ Generate a pattern of dynamic reaction behavior using pattern recognition techniques.
- ○ Generate a nonlinear dynamic hybrid function that will activate a binary state whether the stagnation time limits or the reaction pattern indicate reaction shift to an undesired trajectory.
- The apparatus conceived in this invention consists at least of the following elements: a processing unit board, signal conditioning and data acquisition module board with for inputs and outputs, an electrical conductivity sensor, a communication interface, and a power supply. A computer or PLC may be used for processing and process/operator interface.
- The processing unit board executes the significance evaluation, calibration, estimation and deviation functions, and performs the steps required to calculate both functions, also called calibration. It may have routines to allow the user input the data for the calibration steps.
- The invention was embodied and tested for a transesterification reaction to obtain ethyl ester (biodiesel), and biodiesel concentration was measured and forecasted using the methods and apparatus described in this invention. The diagram describing this method is presented in
FIG 1 . The electrical conductivity measures by the measurement block (10) are collected using a sensor that gives the conductivity at each sample time. - The second step is to store a vector of electrical conductivity in the storage block (15), in order to feed these values into the estimation function and the deviation function. This vector has n samples from the conductivity and its actualized trough the delay function each sample time. The delay function block (20) delays the input electrical conductivity vector for the uses in the vector storage function.
- The estimation function block (25) is determined using a standard feed-forward neural network with an input layer, one hidden layer and one output layer. The activation function used in the hidden layer is a sigmoid like function while in the other two layers a linear activation function is used. This function has as input the conductivity vector. This function estimates the biodiesel concentration in the reaction using the inputted information.
- The deviation function block (30) is determined using a time based function that generates a warning of the undesired behavior from the reaction. This function has a model from the conductivity used to estimate the time in which the reaction has stopped or is leading to saponification reactions.
- The Significance evaluation function is used in the start-up operation for the analysis of variables. This function determines which variables besides the conductivity, are useful in the identification of biodiesel concentration variations in the reaction phase. As result of this function, significant variables are selected, which are the ones explain better the process variations.
- The Calibration function is used in order to modify the evaluation and deviation function, using the significant variables obtained with the significance evaluation function. This modification adjusts the functions weights and structure, to adapt them to the particular biodiesel production process.
- The application of the method is described as follows:
- Calibration or start-up
- The method used in the estimation and deviation function requires a calibration or start up procedure in order to adjust the parameters and find the structure of each one of these functions. The necessary steps for the start-up procedure can be summarized as follows:
- ○ Batch reactions experiments
- ○ Concentration and conductivity measures in batch reactions.
- ○ Determine the Kinetics coefficients for the reaction model.
- ○ Determine the conductivity model.
- In order to determine kinetic parameters, an experimental stage has to be developed. At different temperatures, a batch reactor set up shall be run, using initial concentrations of oil (vegetal, animal or wasted) and alcohol (ethanol or methanol usually). From the time the reaction starts, until equilibrium is reached samples shall be taken and their time recorded. Every sample can be taken to a HPLC or a Spectroscopy for analysis, and concentrations of reaction products recorded..Once the time path for the reaction is obtained for reacting components, a matrix of those is used to obtain the reaction constants for the kinetic model at every temperature. Reaction constant values are obtained by developing a dynamic model of the batch scenario and using non-linear optimization functions to minimize the error during the dynamic response.
- The conductivity data collected trough the batch production tests are used to construct a model from the conductivity. The conductivity is approximated using an Adaptive Neuro-Fuzzy Inference System (ANFIS) trained using back-propagation based algorithm. This model is a time series. Statistical analysis can be performed in order to get the best fit for the data.
- Trough the simulation of the reaction and conductivity at the same time using the models determined before, the following matrix data can be obtained:
Table 1. Data structure for Estimation Function calculation Biodiesel Concentration Electrical Conductivity (σ) σ1 C 1 . . . . . . σ n Cn - Using this input training data the estimation function was approximated using a standard feed-forward neural network with an input layer, one hidden layer and one output layer. The activation function used in the hidden layer is a sigmoid like function while in the other two layers a linear activation function were used.
- The hidden layer weights were calculated using normal random numbers regularized, using the following regularization equation:

- Where, a is the maximum input of the activation function used, xi is the training data for an input, Ni is the number of inputs, and N(0,1) is a normal random number generator with mean equal to zero and variance equal to one. The output weights (Wo) are calculated using standard least squares problem solution:



- Where, X is the input training data, f is the activation function, Vb is equal to V except that one column with ones is added to express output bias bo, and Y is the output training data.
- The optimization of neural network architecture was carried out using a greedy search modified for a multiobjective optimization procedure.
- Using the same input training data and the same conductivity model obtained before, a deviation function is determined in order to warn about the undesired behavior of the reaction. This deviation function calculates the maximum time before a specific pattern of conductivity behavior must occur at the normal process reaction. In the case this pattern does not occur, an alarm is set trough a binary state, indicating one as undesired process reaction and zero as normal process reaction.
- The present invention requires off-line laboratory calibration procedure to adjust the regression models (estimation function and deviation function). Data required for calibration consists of a set of samples with electrical conductivity, biodiesel concentration, and other common process variables such as temperature, pressure, level, and flow. Electrical conductivity and temperature can be measured with the apparatus described in this invention. Pressure, flow, and level can be determined by means of appropriate sensors for Biodiesel production. Off-line analytical methods such as chromatography or spectroscopy may be used to measure biodiesel concentration to comply with this start-up requirement. This information shall be used by the apparatus to automatically, or with human assistance, incorporate statistically significant variables into the mathematical functions, and estimate the correlation structure, weights, and coefficients.
- The preferred embodiment of the apparatus conceived in this invention, presented in
FIG 2 ., consists of the following elements: (45) a processing unit board, (50) signal conditioning and data acquisition module board with for inputs, (55) a keyboard, (60) a display, (65) a toroidal electrical conductivity sensor, with a transmitter that uses a 4-20mA output, (70) a thermocouple, (75) an analog output board of 4-20 mA, (80) a digital output board, (85) a visual signal, (90) a serial RS-232 communication interface, and (95) a power supply. - In the preferred embodiment of the apparatus, the signal conditioning and data acquisition board are used to receive the signal coming from the thermocouple and electrical conductivity transmitter and passing in a digital form to the processing unit.
- The analog output board communicates with the processing unit, trough digital format to convert this digital signal to an analog signal of 4-20mA proportional to biodiesel concentration.
- The digital output board receives a signal coming from the processing unit that is the output from the alarm function. This signal is conditioning in the digital output board to be transmitted in a safe way using differential voltage.
- The visual signal uses the signal from the digital output board to show the alarm status on-site.
- The RS-232 Interface provides communication with a PC, modem, or another apparatus to transmit the current value of the biodiesel concentration and alarm signal.
- Another possible embodiment of the apparatus, is presented in
FIG 3 ., may consists of the following elements: (100) a Programmable Logic Controller (PLC) processor unit, (105) 4-20mA analog inputs module for PLC, (110) thermocouple inputs module for PLC, (115) RS-232 serial communication module for PLC, (120) 4-20mA analog outputs module for PLC, (125) a 24 volts digital outputs module for PLC, (130) a toroidal electrical conductivity sensor, with a transmitter that uses a 4-20mA output, (135) a thermocouple, and (140) power supply. - The PLC processing unit executes the significance, calibration, estimation, delay, storage and alarm functions. Also have routines to allow the user to input the data for start-up operations in an easy way with a computer interface. The function may be executed also in an external PLC or PC that communicates with processing unit.
- The analog input module receives the signal from the conductivity transmitter and communicates with the processor unit. The analog output module communicates with the processing unit, giving a 4-20mA analog signal proportional to biodiesel concentration.
- The digital output module communicates with the processing unit giving a signal proportional to the alarm function output.
- The RS-232 Interface provides communication with a PC, modem, or another apparatus to access the programming interface from PLC, and eventually transmit the real time data from biodiesel concentration measurement.
- A typical configuration for biodiesel concentration measurement using the invention described above is presented in
FIG 4 . This information could be used to feed a control algorithm that controls the reaction process or a monitoring process to assure quality of the reaction.
Claims (11)
- A method of measuring and forecasting concentration of species during the reaction of a reacting mixture, comprising:a first calibration or start-up step comprising:determining of significance variables by means of a significance evaluation function (35), other than conductivity, useful in the identification of concentration variations in the reaction, these variables being the ones which better explain the reaction variations, andconstructing a model of conductivity of the reacting mixture by means of a calibration function (40) using the significance variables obtained with the significance evaluation function (35), to adjust the parameters and find the structure of an estimation function (25) and a deviation function (30),the method further comprising the steps of:measuring (10) an electrical conductivity of species during the reaction of the reacting mixture;storing (15) a vector value of the electrical conductivity function;inputting the stored vector values into the estimation function (25) and the deviation function (30);solving the estimation function (25) to determine and forecast the value of the species concentration;solving the deviation function (30) to set off an alarm.
- The method of Claim 1, further comprising measuring environmental variables an building trajectory vectors that are input to the estimation (25) and deviation (30) functions.
- The method of Claim 2, wherein at least five data points are generated for every measured variable.
- The method of Claim 3, further comprising delaying (20) the input of the measured variables for use in the step of storing (15) the vector value.
- The method of Claim 1, wherein the estimation function (25) is a feed-forward neural network.
- The method of Claim 5, wherein the standard feed-forward neural network has at least: an input layer, a hidden layer and an output layer.
- The method of Claim 1, wherein the deviation function (30) is a time based function with a model based on the measured variable trajectories that identifies a behavioral or a reaction behavior using pattern recognition techniques.
- The method of Claim 7, wherein the deviation function (30) generates a nonlinear dynamic hybrid function that activates an alarm through a binary state based on the deviation from a desired reaction pattern.
- The method of Claim 1, where the parameters of the estimation function (25) and deviation function (30) are estimated based on kinetic parameters determined experimentally.
- The method of Claim 1, where the parameters of the estimation function (25) and deviation function (30) are estimated based on a experimental dynamic conductivity model.
- A system of measuring and forecasting concentration of species during the reaction of a reacting mixture comprising
means adapted for performing a first calibration or start-up step comprising:determining of significance variables by means of a significance evaluation function (35), other than conductivity, useful in the identification of concentration variations in the reaction, these variables being the ones which better explain the reaction variations, andconstructing a model of conductivity of the reacting mixture by means of a calibration function (40) using the significance variables obtained with the significance evaluation function (35), to adjust the parameters and find the structure of an estimation function (25) and a deviation function (30),and means adapted for performing the steps of:measuring (10) an electrical conductivity of species during the reaction of the reacting mixture;storing (15) a vector value of the electrical conductivity function;inputting the stored vector values into the estimation function (25) and the deviation function (30);solving the estimation function (25) to determine and forecast the value of the species concentration;solving the deviation function (30) to set off an alarm.
Applications Claiming Priority (2)
| Application Number | Priority Date | Filing Date | Title |
|---|---|---|---|
| US10990908P | 2008-10-30 | 2008-10-30 | |
| PCT/IB2009/007398 WO2010049810A2 (en) | 2008-10-30 | 2009-10-29 | Method and apparatus for on-line estimation and forecasting of species concentration during a reaction |
Publications (2)
| Publication Number | Publication Date |
|---|---|
| EP2350628A2 EP2350628A2 (en) | 2011-08-03 |
| EP2350628B1 true EP2350628B1 (en) | 2013-07-17 |
Family
ID=42091678
Family Applications (1)
| Application Number | Title | Priority Date | Filing Date |
|---|---|---|---|
| EP09795805.2A Not-in-force EP2350628B1 (en) | 2008-10-30 | 2009-10-29 | Method and apparatus for on-line estimation and forecasting of species concentration during a reaction |
Country Status (3)
| Country | Link |
|---|---|
| US (1) | US8390446B2 (en) |
| EP (1) | EP2350628B1 (en) |
| WO (1) | WO2010049810A2 (en) |
Families Citing this family (3)
| Publication number | Priority date | Publication date | Assignee | Title |
|---|---|---|---|---|
| CN108549351A (en) * | 2018-05-23 | 2018-09-18 | 江苏大学 | A kind of fuzzy neural network inverse hard measurement system and method for lysine fermentation process key variables |
| CN116417090A (en) * | 2021-12-31 | 2023-07-11 | 中国石油天然气股份有限公司 | A method and system for predicting the yield of polyalphaolefin synthetic oil products |
| CN119223939B (en) * | 2024-11-28 | 2025-04-01 | 合肥金星智控科技股份有限公司 | Self-adaptive calibration method and device for material detection model based on LIBS |
Family Cites Families (8)
| Publication number | Priority date | Publication date | Assignee | Title |
|---|---|---|---|---|
| US3537820A (en) | 1966-09-14 | 1970-11-03 | Babcock & Wilcox Co | Method of and apparatus for analyzing a chemical composition |
| DE3535029A1 (en) * | 1984-10-03 | 1986-04-03 | Xertex Corp., Santa Clara, Calif. | METHOD AND DEVICE FOR CONTINUOUSLY MONITORING AN AQUEOUS SAMPLE FLOW FOR ORGANIC COMPONENTS |
| DE4006689A1 (en) | 1990-01-31 | 1991-08-01 | Rudolph Karl Ulrich Prof Dr Dr | Determining the quality of waste waters - where characteristics of water are continuously measured in non-invasive manner and computer compares measured values with pre-set limits |
| DE4227727C2 (en) * | 1992-08-21 | 1994-09-15 | Buna Gmbh | Method for status detection of gaseous and liquid media using multi-sensor systems |
| JP3564575B2 (en) | 1996-03-19 | 2004-09-15 | ダイキン工業株式会社 | Method for determining component concentration in ternary mixture and method for continuous production of hydrogen fluoride using the same |
| DE19835137C2 (en) | 1998-08-04 | 2003-04-24 | Conducta Endress & Hauser | Device for determining the concentration of a measuring liquid |
| AU2001284729A1 (en) | 2000-08-07 | 2002-02-18 | Sievers Instruments, Inc. | Low-level boron detection and measurement |
| US7404411B2 (en) | 2005-03-23 | 2008-07-29 | Marathon Ashland Petroleum Llc | Method and apparatus for analysis of relative levels of biodiesel in fuels by near-infrared spectroscopy |
-
2009
- 2009-10-29 US US12/608,180 patent/US8390446B2/en not_active Expired - Fee Related
- 2009-10-29 WO PCT/IB2009/007398 patent/WO2010049810A2/en not_active Ceased
- 2009-10-29 EP EP09795805.2A patent/EP2350628B1/en not_active Not-in-force
Non-Patent Citations (1)
| Title |
|---|
| MAKI Y ET AL: "A NEURAL-NETWORK APPROACH TO FAULT DETECTION AND DIAGNOSIS IN INDUSTRIAL PROCESSES", IEEE TRANSACTIONS ON CONTROL SYSTEMS TECHNOLOGY, IEEE SERVICE CENTER, NEW YORK, NY, US, vol. 5, no. 6, 1 November 1997 (1997-11-01), pages 529 - 541, XP000750942, ISSN: 1063-6536, DOI: 10.1109/87.641399 * |
Also Published As
| Publication number | Publication date |
|---|---|
| EP2350628A2 (en) | 2011-08-03 |
| WO2010049810A3 (en) | 2010-10-28 |
| WO2010049810A2 (en) | 2010-05-06 |
| US20100109893A1 (en) | 2010-05-06 |
| WO2010049810A4 (en) | 2011-02-03 |
| US8390446B2 (en) | 2013-03-05 |
Similar Documents
| Publication | Publication Date | Title |
|---|---|---|
| Kulkarni et al. | Modeling and monitoring of batch processes using principal component analysis (PCA) assisted generalized regression neural networks (GRNN) | |
| Lee et al. | Enhanced process monitoring of fed-batch penicillin cultivation using time-varying and multivariate statistical analysis | |
| US20200150601A1 (en) | Solution for controlling a target system | |
| Hosen et al. | Prediction interval-based neural network modelling of polystyrene polymerization reactor–A new perspective of data-based modelling | |
| Lamrini et al. | A new method for dynamic modelling of bread dough kneading based on artificial neural network | |
| Zhang et al. | Dynamical process monitoring using dynamical hierarchical kernel partial least squares | |
| JP5077831B2 (en) | Plant control system and plant control method | |
| US8390446B2 (en) | Method and apparatus for on-line estimation and forecasting of species concentration during a reaction by measuring electrical conductivity | |
| Krause et al. | Online monitoring of bioprocesses via multivariate sensor prediction within swarm intelligence decision making | |
| Tian et al. | Optimal control of a fed-batch bioreactor based upon an augmented recurrent neural network model | |
| Chetouani | Fault detection by using the innovation signal: application to an exothermic reaction | |
| Padmavathi et al. | Neural modelling of Mooney viscosity of polybutadiene rubber | |
| JP5239686B2 (en) | Process estimation system and process estimation method | |
| Van den Berg et al. | Selection of optimal process analyzers for plant-wide monitoring | |
| Vanlaer et al. | Quality assessment of a variance estimator for Partial Least Squares prediction of batch-end quality | |
| Kurtanjek | Principal component ANN for modelling and control of baker’s yeast production | |
| O'Connor et al. | Integration of fuzzy logic based control procedures in brewing | |
| Zhang | Software sensors and their applications in bioprocess | |
| JPH0628009A (en) | Method for polymerizing process | |
| Facco et al. | Transfer of process monitoring models between plants: Batch systems | |
| Iacono et al. | Improvement of manufacturing technologies through a modelling approach: an air-steam sterilization case-study | |
| Abonyi et al. | Data-driven development and maintenance of soft-sensors | |
| Zenteno-Catemaxca et al. | Monitoring a chemical reaction using pH measurements: An approach based on multiscale fractal analysis | |
| Guo et al. | Modelling for multi-phase batch processes using steady state identification and deep recurrent neural network | |
| Niharika et al. | Design and implementation of Fuzzy Logic controller for boiler temperature control using LabView |
Legal Events
| Date | Code | Title | Description |
|---|---|---|---|
| PUAI | Public reference made under article 153(3) epc to a published international application that has entered the european phase |
Free format text: ORIGINAL CODE: 0009012 |
|
| 17P | Request for examination filed |
Effective date: 20110519 |
|
| AK | Designated contracting states |
Kind code of ref document: A2 Designated state(s): AT BE BG CH CY CZ DE DK EE ES FI FR GB GR HR HU IE IS IT LI LT LU LV MC MK MT NL NO PL PT RO SE SI SK SM TR |
|
| DAX | Request for extension of the european patent (deleted) | ||
| 17Q | First examination report despatched |
Effective date: 20120301 |
|
| GRAP | Despatch of communication of intention to grant a patent |
Free format text: ORIGINAL CODE: EPIDOSNIGR1 |
|
| RIN1 | Information on inventor provided before grant (corrected) |
Inventor name: SANJUAN, MARCO E. Inventor name: POSADA, JOSE D. Inventor name: VILLALBA, PEDRO J. Inventor name: GARCIA, JAIME R. |
|
| GRAS | Grant fee paid |
Free format text: ORIGINAL CODE: EPIDOSNIGR3 |
|
| GRAA | (expected) grant |
Free format text: ORIGINAL CODE: 0009210 |
|
| AK | Designated contracting states |
Kind code of ref document: B1 Designated state(s): AT BE BG CH CY CZ DE DK EE ES FI FR GB GR HR HU IE IS IT LI LT LU LV MC MK MT NL NO PL PT RO SE SI SK SM TR |
|
| REG | Reference to a national code |
Ref country code: GB Ref legal event code: FG4D |
|
| REG | Reference to a national code |
Ref country code: CH Ref legal event code: EP |
|
| REG | Reference to a national code |
Ref country code: IE Ref legal event code: FG4D |
|
| REG | Reference to a national code |
Ref country code: AT Ref legal event code: REF Ref document number: 622498 Country of ref document: AT Kind code of ref document: T Effective date: 20130815 |
|
| REG | Reference to a national code |
Ref country code: DE Ref legal event code: R096 Ref document number: 602009017286 Country of ref document: DE Effective date: 20130912 |
|
| REG | Reference to a national code |
Ref country code: AT Ref legal event code: MK05 Ref document number: 622498 Country of ref document: AT Kind code of ref document: T Effective date: 20130717 |
|
| REG | Reference to a national code |
Ref country code: NL Ref legal event code: VDEP Effective date: 20130717 |
|
| REG | Reference to a national code |
Ref country code: LT Ref legal event code: MG4D |
|
| PG25 | Lapsed in a contracting state [announced via postgrant information from national office to epo] |
Ref country code: AT Free format text: LAPSE BECAUSE OF FAILURE TO SUBMIT A TRANSLATION OF THE DESCRIPTION OR TO PAY THE FEE WITHIN THE PRESCRIBED TIME-LIMIT Effective date: 20130717 Ref country code: HR Free format text: LAPSE BECAUSE OF FAILURE TO SUBMIT A TRANSLATION OF THE DESCRIPTION OR TO PAY THE FEE WITHIN THE PRESCRIBED TIME-LIMIT Effective date: 20130717 Ref country code: IS Free format text: LAPSE BECAUSE OF FAILURE TO SUBMIT A TRANSLATION OF THE DESCRIPTION OR TO PAY THE FEE WITHIN THE PRESCRIBED TIME-LIMIT Effective date: 20131117 Ref country code: CY Free format text: LAPSE BECAUSE OF FAILURE TO SUBMIT A TRANSLATION OF THE DESCRIPTION OR TO PAY THE FEE WITHIN THE PRESCRIBED TIME-LIMIT Effective date: 20130626 Ref country code: LT Free format text: LAPSE BECAUSE OF FAILURE TO SUBMIT A TRANSLATION OF THE DESCRIPTION OR TO PAY THE FEE WITHIN THE PRESCRIBED TIME-LIMIT Effective date: 20130717 Ref country code: SE Free format text: LAPSE BECAUSE OF FAILURE TO SUBMIT A TRANSLATION OF THE DESCRIPTION OR TO PAY THE FEE WITHIN THE PRESCRIBED TIME-LIMIT Effective date: 20130717 Ref country code: BE Free format text: LAPSE BECAUSE OF FAILURE TO SUBMIT A TRANSLATION OF THE DESCRIPTION OR TO PAY THE FEE WITHIN THE PRESCRIBED TIME-LIMIT Effective date: 20130717 Ref country code: PT Free format text: LAPSE BECAUSE OF FAILURE TO SUBMIT A TRANSLATION OF THE DESCRIPTION OR TO PAY THE FEE WITHIN THE PRESCRIBED TIME-LIMIT Effective date: 20131118 Ref country code: NO Free format text: LAPSE BECAUSE OF FAILURE TO SUBMIT A TRANSLATION OF THE DESCRIPTION OR TO PAY THE FEE WITHIN THE PRESCRIBED TIME-LIMIT Effective date: 20131017 |
|
| PGFP | Annual fee paid to national office [announced via postgrant information from national office to epo] |
Ref country code: FR Payment date: 20131118 Year of fee payment: 5 Ref country code: GB Payment date: 20131028 Year of fee payment: 5 |
|
| PG25 | Lapsed in a contracting state [announced via postgrant information from national office to epo] |
Ref country code: GR Free format text: LAPSE BECAUSE OF FAILURE TO SUBMIT A TRANSLATION OF THE DESCRIPTION OR TO PAY THE FEE WITHIN THE PRESCRIBED TIME-LIMIT Effective date: 20131018 Ref country code: SI Free format text: LAPSE BECAUSE OF FAILURE TO SUBMIT A TRANSLATION OF THE DESCRIPTION OR TO PAY THE FEE WITHIN THE PRESCRIBED TIME-LIMIT Effective date: 20130717 Ref country code: ES Free format text: LAPSE BECAUSE OF FAILURE TO SUBMIT A TRANSLATION OF THE DESCRIPTION OR TO PAY THE FEE WITHIN THE PRESCRIBED TIME-LIMIT Effective date: 20131028 Ref country code: LV Free format text: LAPSE BECAUSE OF FAILURE TO SUBMIT A TRANSLATION OF THE DESCRIPTION OR TO PAY THE FEE WITHIN THE PRESCRIBED TIME-LIMIT Effective date: 20130717 Ref country code: FI Free format text: LAPSE BECAUSE OF FAILURE TO SUBMIT A TRANSLATION OF THE DESCRIPTION OR TO PAY THE FEE WITHIN THE PRESCRIBED TIME-LIMIT Effective date: 20130717 Ref country code: NL Free format text: LAPSE BECAUSE OF FAILURE TO SUBMIT A TRANSLATION OF THE DESCRIPTION OR TO PAY THE FEE WITHIN THE PRESCRIBED TIME-LIMIT Effective date: 20130717 Ref country code: PL Free format text: LAPSE BECAUSE OF FAILURE TO SUBMIT A TRANSLATION OF THE DESCRIPTION OR TO PAY THE FEE WITHIN THE PRESCRIBED TIME-LIMIT Effective date: 20130717 |
|
| PG25 | Lapsed in a contracting state [announced via postgrant information from national office to epo] |
Ref country code: CY Free format text: LAPSE BECAUSE OF FAILURE TO SUBMIT A TRANSLATION OF THE DESCRIPTION OR TO PAY THE FEE WITHIN THE PRESCRIBED TIME-LIMIT Effective date: 20130717 |
|
| PG25 | Lapsed in a contracting state [announced via postgrant information from national office to epo] |
Ref country code: EE Free format text: LAPSE BECAUSE OF FAILURE TO SUBMIT A TRANSLATION OF THE DESCRIPTION OR TO PAY THE FEE WITHIN THE PRESCRIBED TIME-LIMIT Effective date: 20130717 Ref country code: SK Free format text: LAPSE BECAUSE OF FAILURE TO SUBMIT A TRANSLATION OF THE DESCRIPTION OR TO PAY THE FEE WITHIN THE PRESCRIBED TIME-LIMIT Effective date: 20130717 Ref country code: RO Free format text: LAPSE BECAUSE OF FAILURE TO SUBMIT A TRANSLATION OF THE DESCRIPTION OR TO PAY THE FEE WITHIN THE PRESCRIBED TIME-LIMIT Effective date: 20130717 Ref country code: DK Free format text: LAPSE BECAUSE OF FAILURE TO SUBMIT A TRANSLATION OF THE DESCRIPTION OR TO PAY THE FEE WITHIN THE PRESCRIBED TIME-LIMIT Effective date: 20130717 Ref country code: CZ Free format text: LAPSE BECAUSE OF FAILURE TO SUBMIT A TRANSLATION OF THE DESCRIPTION OR TO PAY THE FEE WITHIN THE PRESCRIBED TIME-LIMIT Effective date: 20130717 |
|
| PLBE | No opposition filed within time limit |
Free format text: ORIGINAL CODE: 0009261 |
|
| STAA | Information on the status of an ep patent application or granted ep patent |
Free format text: STATUS: NO OPPOSITION FILED WITHIN TIME LIMIT |
|
| PG25 | Lapsed in a contracting state [announced via postgrant information from national office to epo] |
Ref country code: MC Free format text: LAPSE BECAUSE OF FAILURE TO SUBMIT A TRANSLATION OF THE DESCRIPTION OR TO PAY THE FEE WITHIN THE PRESCRIBED TIME-LIMIT Effective date: 20130717 Ref country code: IT Free format text: LAPSE BECAUSE OF FAILURE TO SUBMIT A TRANSLATION OF THE DESCRIPTION OR TO PAY THE FEE WITHIN THE PRESCRIBED TIME-LIMIT Effective date: 20130717 |
|
| REG | Reference to a national code |
Ref country code: CH Ref legal event code: PL |
|
| 26N | No opposition filed |
Effective date: 20140422 |
|
| REG | Reference to a national code |
Ref country code: IE Ref legal event code: MM4A |
|
| PG25 | Lapsed in a contracting state [announced via postgrant information from national office to epo] |
Ref country code: LI Free format text: LAPSE BECAUSE OF NON-PAYMENT OF DUE FEES Effective date: 20131031 Ref country code: CH Free format text: LAPSE BECAUSE OF NON-PAYMENT OF DUE FEES Effective date: 20131031 |
|
| REG | Reference to a national code |
Ref country code: DE Ref legal event code: R097 Ref document number: 602009017286 Country of ref document: DE Effective date: 20140422 |
|
| PGFP | Annual fee paid to national office [announced via postgrant information from national office to epo] |
Ref country code: DE Payment date: 20131029 Year of fee payment: 5 |
|
| PG25 | Lapsed in a contracting state [announced via postgrant information from national office to epo] |
Ref country code: IE Free format text: LAPSE BECAUSE OF NON-PAYMENT OF DUE FEES Effective date: 20131029 |
|
| REG | Reference to a national code |
Ref country code: DE Ref legal event code: R119 Ref document number: 602009017286 Country of ref document: DE |
|
| PG25 | Lapsed in a contracting state [announced via postgrant information from national office to epo] |
Ref country code: SM Free format text: LAPSE BECAUSE OF FAILURE TO SUBMIT A TRANSLATION OF THE DESCRIPTION OR TO PAY THE FEE WITHIN THE PRESCRIBED TIME-LIMIT Effective date: 20130717 |
|
| GBPC | Gb: european patent ceased through non-payment of renewal fee |
Effective date: 20141029 |
|
| PG25 | Lapsed in a contracting state [announced via postgrant information from national office to epo] |
Ref country code: TR Free format text: LAPSE BECAUSE OF FAILURE TO SUBMIT A TRANSLATION OF THE DESCRIPTION OR TO PAY THE FEE WITHIN THE PRESCRIBED TIME-LIMIT Effective date: 20130717 |
|
| PG25 | Lapsed in a contracting state [announced via postgrant information from national office to epo] |
Ref country code: DE Free format text: LAPSE BECAUSE OF NON-PAYMENT OF DUE FEES Effective date: 20150501 Ref country code: LU Free format text: LAPSE BECAUSE OF NON-PAYMENT OF DUE FEES Effective date: 20131029 Ref country code: GB Free format text: LAPSE BECAUSE OF NON-PAYMENT OF DUE FEES Effective date: 20141029 Ref country code: BG Free format text: LAPSE BECAUSE OF FAILURE TO SUBMIT A TRANSLATION OF THE DESCRIPTION OR TO PAY THE FEE WITHIN THE PRESCRIBED TIME-LIMIT Effective date: 20130717 Ref country code: MK Free format text: LAPSE BECAUSE OF FAILURE TO SUBMIT A TRANSLATION OF THE DESCRIPTION OR TO PAY THE FEE WITHIN THE PRESCRIBED TIME-LIMIT Effective date: 20130717 Ref country code: HU Free format text: LAPSE BECAUSE OF FAILURE TO SUBMIT A TRANSLATION OF THE DESCRIPTION OR TO PAY THE FEE WITHIN THE PRESCRIBED TIME-LIMIT; INVALID AB INITIO Effective date: 20091029 |
|
| REG | Reference to a national code |
Ref country code: FR Ref legal event code: ST Effective date: 20150630 |
|
| PG25 | Lapsed in a contracting state [announced via postgrant information from national office to epo] |
Ref country code: FR Free format text: LAPSE BECAUSE OF NON-PAYMENT OF DUE FEES Effective date: 20141031 Ref country code: MT Free format text: LAPSE BECAUSE OF FAILURE TO SUBMIT A TRANSLATION OF THE DESCRIPTION OR TO PAY THE FEE WITHIN THE PRESCRIBED TIME-LIMIT Effective date: 20130717 |