EP2348484A1 - Method for extracting a carious lesion area - Google Patents
Method for extracting a carious lesion area Download PDFInfo
- Publication number
- EP2348484A1 EP2348484A1 EP10013637A EP10013637A EP2348484A1 EP 2348484 A1 EP2348484 A1 EP 2348484A1 EP 10013637 A EP10013637 A EP 10013637A EP 10013637 A EP10013637 A EP 10013637A EP 2348484 A1 EP2348484 A1 EP 2348484A1
- Authority
- EP
- European Patent Office
- Prior art keywords
- tooth
- image
- regions
- fluorescence
- digital image
- Prior art date
- Legal status (The legal status is an assumption and is not a legal conclusion. Google has not performed a legal analysis and makes no representation as to the accuracy of the status listed.)
- Withdrawn
Links
Images




Classifications
-
- A—HUMAN NECESSITIES
- A61—MEDICAL OR VETERINARY SCIENCE; HYGIENE
- A61C—DENTISTRY; APPARATUS OR METHODS FOR ORAL OR DENTAL HYGIENE
- A61C19/00—Dental auxiliary appliances
- A61C19/04—Measuring instruments specially adapted for dentistry
-
- G—PHYSICS
- G06—COMPUTING OR CALCULATING; COUNTING
- G06T—IMAGE DATA PROCESSING OR GENERATION, IN GENERAL
- G06T7/00—Image analysis
- G06T7/10—Segmentation; Edge detection
- G06T7/11—Region-based segmentation
-
- A—HUMAN NECESSITIES
- A61—MEDICAL OR VETERINARY SCIENCE; HYGIENE
- A61B—DIAGNOSIS; SURGERY; IDENTIFICATION
- A61B6/00—Apparatus or devices for radiation diagnosis; Apparatus or devices for radiation diagnosis combined with radiation therapy equipment
- A61B6/50—Apparatus or devices for radiation diagnosis; Apparatus or devices for radiation diagnosis combined with radiation therapy equipment specially adapted for specific body parts; specially adapted for specific clinical applications
- A61B6/51—Apparatus or devices for radiation diagnosis; Apparatus or devices for radiation diagnosis combined with radiation therapy equipment specially adapted for specific body parts; specially adapted for specific clinical applications for dentistry
-
- G—PHYSICS
- G01—MEASURING; TESTING
- G01N—INVESTIGATING OR ANALYSING MATERIALS BY DETERMINING THEIR CHEMICAL OR PHYSICAL PROPERTIES
- G01N21/00—Investigating or analysing materials by the use of optical means, i.e. using sub-millimetre waves, infrared, visible or ultraviolet light
- G01N21/62—Systems in which the material investigated is excited whereby it emits light or causes a change in wavelength of the incident light
- G01N21/63—Systems in which the material investigated is excited whereby it emits light or causes a change in wavelength of the incident light optically excited
- G01N21/64—Fluorescence; Phosphorescence
-
- G—PHYSICS
- G06—COMPUTING OR CALCULATING; COUNTING
- G06T—IMAGE DATA PROCESSING OR GENERATION, IN GENERAL
- G06T7/00—Image analysis
- G06T7/10—Segmentation; Edge detection
- G06T7/155—Segmentation; Edge detection involving morphological operators
-
- G—PHYSICS
- G06—COMPUTING OR CALCULATING; COUNTING
- G06T—IMAGE DATA PROCESSING OR GENERATION, IN GENERAL
- G06T7/00—Image analysis
- G06T7/10—Segmentation; Edge detection
- G06T7/174—Segmentation; Edge detection involving the use of two or more images
-
- G—PHYSICS
- G06—COMPUTING OR CALCULATING; COUNTING
- G06T—IMAGE DATA PROCESSING OR GENERATION, IN GENERAL
- G06T2207/00—Indexing scheme for image analysis or image enhancement
- G06T2207/10—Image acquisition modality
- G06T2207/10064—Fluorescence image
-
- G—PHYSICS
- G06—COMPUTING OR CALCULATING; COUNTING
- G06T—IMAGE DATA PROCESSING OR GENERATION, IN GENERAL
- G06T2207/00—Indexing scheme for image analysis or image enhancement
- G06T2207/20—Special algorithmic details
- G06T2207/20112—Image segmentation details
- G06T2207/20152—Watershed segmentation
-
- G—PHYSICS
- G06—COMPUTING OR CALCULATING; COUNTING
- G06T—IMAGE DATA PROCESSING OR GENERATION, IN GENERAL
- G06T2207/00—Indexing scheme for image analysis or image enhancement
- G06T2207/20—Special algorithmic details
- G06T2207/20212—Image combination
- G06T2207/20221—Image fusion; Image merging
-
- G—PHYSICS
- G06—COMPUTING OR CALCULATING; COUNTING
- G06T—IMAGE DATA PROCESSING OR GENERATION, IN GENERAL
- G06T2207/00—Indexing scheme for image analysis or image enhancement
- G06T2207/30—Subject of image; Context of image processing
- G06T2207/30004—Biomedical image processing
- G06T2207/30036—Dental; Teeth
Definitions
- the invention relates generally to the field of dental imaging, and in particular to a method for early detection of caries. More specifically, the invention relates to a method for extracting a carious lesion area in a tooth image captured using fluorescence and back-scattering of light.
- a method and apparatus that employs both the reflectance and fluorescence images of the tooth is used to detect caries. It employs observed back-scattering, or reflectance, for incipient caries and in combination with fluorescence effects, to provide an improved dental imaging technique to detect caries.
- the technique referred to as Fluorescence Imaging with Reflectance Enhancement (FIRE), helps to increase the contrast of images over that of earlier approaches, and also makes it possible to detect incipient caries at stages when preventive measures are likely to take effect.
- FIRE detection can be accurate at an earlier stage of caries infection than has been exhibited using existing fluorescence approaches that measure fluorescence alone.
- the application describes a downshifting method to generate the FIRE image.
- Quantification of caries based on a digital image of a tooth such as a fluorescence image provides numerical information on the severity of lesion regions and can help dentists make and carry out treatment plans. It can be a useful tool in the longitudinal monitoring of caries for dentists to observe the evolution of each lesion area over time.
- U.S. Patent Application Publication No. 2004/0240716 has disclosed some methods for quantification of caries; however, the disclosed methods generally require manual extraction of lesion regions from sound tooth areas of the image by the user, and they are based on fluorescence-only images. Manual extraction of lesion regions from the image presents two problems. Firstly, the extraction process is slow, requiring the user to make many mouse clicks or to draw lines on the images to indicate the boundary of a lesion region.
- An object of the present invention is to provide a method for extracting a carious lesion area in a digital image of a tooth.
- Another object of the present invention is to provide a method for extracting a carious lesion area based a FIRE image of a tooth.
- a feature of the present invention is that carious lesions are automatically extracted from a FIRE image, the high contrast in the FIRE image providing improved sensitivity and accuracy for the identification of caries.
- An advantage of the present invention is that carious lesions in tooth images are extracted and quantified automatically without user intervention, thus providing an efficient workflow in caries identification and monitoring.
- a method for extracting a lesion area from sound regions of a tooth executed at least in part on data processing hardware, the method comprising generating a digital image of the tooth, identifying tooth regions, extracting a suspicious lesion area by using a marker-controlled watershed algorithm or by using a morphological bottom-hat based method along with a multi-resolution surface reconstruction method, and removing false positives.
- a method for extracting a lesion area from sound regions of a tooth executed at least in part on data processing hardware, the method comprising generating a digital image of the tooth comprising obtaining a fluorescence image of the tooth, obtaining a reflectance image of the tooth, and combining image data for the fluorescence and reflectance images; identifying tooth regions; extracting suspicious lesion areas; and removing false positives.
- This invention includes calculation steps. Those skilled in the art will recognize that these calculation steps may be performed by data processing hardware that is provided with instructions for image data processing. Because such image manipulation systems are well known, the present description is directed more particularly to algorithms and systems that execute the method of the present invention. Other aspects of such algorithms and systems, and data processing hardware and/or software for producing and otherwise processing the image signals may be selected from such systems, algorithms, components and elements known in the art. Given the description as set forth in the following specification, software implementation lies within the ordinary skill of those versed in the programming arts.
- the stored instructions of such a software program may be stored in a computer readable storage medium, which may comprise, for example: magnetic storage media such as a magnetic disk or magnetic tape; optical storage media such as an optical disc, optical tape, or machine readable bar code; solid state electronic storage devices such as random access memory (RAM), or read only memory (ROM); or any other physical device or medium employed to store a computer program.
- a computer readable storage medium which may comprise, for example: magnetic storage media such as a magnetic disk or magnetic tape; optical storage media such as an optical disc, optical tape, or machine readable bar code; solid state electronic storage devices such as random access memory (RAM), or read only memory (ROM); or any other physical device or medium employed to store a computer program.
- RAM random access memory
- ROM read only memory
- the present invention can be utilized on a data processing hardware apparatus, such as a computer system or personal computer, or on an embedded system that employs a dedicated data processing component, such as a digital signal digital signal processing chip.
- the word "intensity” is used to refer to light level, and is also broadly used to refer to the value of a pixel in a digital image.
- water basin as used herein is a term of art used to describe a structure that is identified and used in executing a marker-controlled watershed transformation in the imaging arts.
- the term “catchment basin” is sometimes used in the same way. References in this disclosure to “water basin” refer to this imaging arts construct.
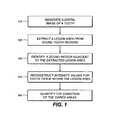
- a method for quantifying caries executed at least in part on data processing hardware such as computer hardware, comprises a step 110 of generating a digital image of a tooth, the image comprising actual intensity values for a region of pixels corresponding to the tooth, gum, and background; a step 120 of extracting a lesion area from sound tooth regions by identifying tooth regions, extracting suspicious lesion areas, and removing false positives; a step 130 of identifying a sound region that is adjacent to the extracted lesion area; a step 140 of reconstructing intensity values for tooth tissue within the lesion area according to values in the adjacent sound region; and a step 150 of quantifying the condition of the caries using the reconstructed intensity values and intensity values from the lesion area.
- extracting a lesion area means identifying at least one lesion area in a digital tooth image.
- FIGS. 2A, 2B, and 2C show illustratively a typical reflectance image 167, a fluorescence image 168, and a FIRE image 169, respectively, of a tooth surface including a sound tooth area 164 and an early lesion area (or caries region) 162.
- a reflectance image such as a white light reflectance image
- the intensity of early caries regions is higher than that of their surrounding sound areas.
- a fluorescence image such as one obtained under blue excitation light
- the intensity of caries regions is lower than that of their surrounding sound areas because of the fluorescence loss in caries regions.
- a FIRE image is obtained through subtracting regional maxima and dome regions of the reflectance image from the fluorescence image.
- the FIRE image has a similar appearance as a fluorescence image because both have lower intensity values in a lesion area than in a surrounding sound area.
- the FIRE image has higher contrast than a fluorescence image, making it potentially more sensitive in detecting caries. It should be noted that other images that are generated by combining image data for the fluorescence and reflectance images can also be used for substituting the FIRE image.
- FIG. 2D corresponds to FIG. 5 of commonly-assigned copending U.S. Patent Application Publication No. 2008/0056551 (Wong et al. ), entitled METHOD FOR DETECTION OF CARIES.
- This figure shows that a FIRE image 169 is formed by combining the fluorescence image 168 with the reflectance image 167 through a processing apparatus 180.
- steps for quantifying caries are described in reference to FIGs. 3A through 5E .
- the methods for extracting a carious lesion according to the present invention, essential in steps for quantifying caries, are also described.
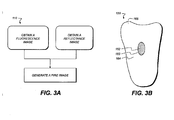
- FIG. 3A shows one embodiment of step 110 of generating a digital image of a tooth, comprising steps of obtaining a fluorescence image, obtaining a reflectance image, and combining image data for the fluorescence and reflectance images to generate an image such as a FIRE image. Details of how the fluorescence and reflectance images are obtained are described in U.S. Patent Application Publication No. 2008/0063998, published Mar. 13, 2008 , entitled APPARATUS FOR CARIES DETECTION, by Liang et al.
- the digital image of the tooth is a FIRE image 169, which is formed by combining the fluorescence image 168 with the reflectance image 167 through a processing apparatus 180 as shown in FIG. 2D .
- step 110 of generating a digital image of a tooth comprises a step of obtaining a fluorescence image.
- the fluorescence image is the digital image used for subsequent image processing steps.
- a digital image of a tooth can be classified into three groups of regions: 1) gum, 2) tooth, and 3) other background. Caries detection only needs to be performed inside tooth regions 165.
- a lesion area 162 inside the tooth region 165 is a lesion area 162, a surrounding sound tooth area 164, and segmentation border 163 that separates the two areas.
- FIG. 3C shows an embodiment of step 120 for extracting a lesion area 162 from tooth regions 165 in a digital image of a tooth according to the present invention.
- Step 120 is performed automatically without a need for a user input.
- step 120 includes sub-steps of identifying the tooth regions 165, extracting one or more suspicious lesion areas, and removing false positives. These sub-steps include details specific to tooth images, as discussed below.
- Iwred, Iwgreen, Iwblue, Ibred, Ibgreen, Ibblue, Ifred, Ifgreen, and Ifblue are used to represent the intensity values of the pixels in the red, green, and blue channels of the reflectance, fluorescence, and FIRE images, respectively.
- intensity values of both reflectance and fluorescence images are adjusted to a range between 0 and 150, where 0 and 150 correspond to minimum and maximum intensity values.
- the FIRE image has higher green intensity values inside normal/sound tooth areas than in caries and other background areas. Consequently, an adapted threshold technique is preferably used on a fluorescence or FIRE image to separate the tooth region, which contains both normal/sound tooth areas and caries areas, from the gum and other background.
- tooth regions 165 are identified from the digital tooth image as follows.
- grayscale versions of both the fluorescence and reflectance images are used, the grayscale images being generated from one channel of their respective color images, such as the green channel, or from a mixing of the three channels using methods well known in the image processing art.
- the embodiment is described below using the green channels of the fluorescence and reflectance images, Ibgreen and Iwgreen, respectively.
- Threshold images are generated from Ibgreen and Iwgreen by selecting intensity values higher than some predetermined threshold values c1 and c2, for example, 10 and 30, respectively.
- the intersection regions of the two threshold images are taken as the preliminary tooth regions image Iroi0.
- a reference binary image Irefroi is obtained by thresholding the image Ibgreen with a threshold value c3 higher than the one used in generating Iroi0, such as 30.
- a refined tooth regions 165 image, Iroi is generated by choosing the regions that are in Iroi0 and connected to the objects in Irefroi. The above four steps increase the accuracy of selecting tooth regions 165 as compared to thresholding just the FIRE or fluorescence image.
- the refined tooth regions 165 image is then used in the following sub-steps of extracting suspicious lesion areas and removing false positives.
- thresholding technique is applied to the fluorescence or FIRE image to determine tooth regions 165. This embodiment helps provide simpler and faster processing.
- a marker-controlled watershed based method is adapted to detect and segment the suspicious caries areas.
- the key to this method is to determine internal and external markers for the target objects.
- the internal markers are determined with the morphological grayscale reconstruction technique. The same technique has also been used for generating a FIRE image as discussed above.
- the regional basins Ihbasin are first detected; they correspond to the target regions of caries because they have lower intensity than surrounding sound areas. Then, the internal markers are obtained by thresholding Ihbasin with a fixed value, for example, 50. Note that the fixed value can be adjusted according to detection sensitivity requirement.
- the internal markers are the regions inside which the intensities of Ihbasin are higher than the given threshold value.
- a binary image is first formed from the internal markers, wherein the pixel value of the binary image is 1 for a pixel inside internal markers and is 0 otherwise. Then a distance transformation (DT), mapping each image pixel onto its shortest distance to the target objects, is applied to the binary image to generate a DT image (see “ Sequential operations in digital picture processing", J. ACM. 13, 1966, by Rosenfeld, A. and Pfaltz, J. and " 2D Euclidean distance transform algorithms: a comparative survey", ACM computing surveys 40, 2008, by Ricardo Fabbri, Luciano Da F. Costa, Julio C. Torelli and Odemir M. Bruno ). The ridge lines that are composed of the pixels with local maximal values in the DT image and located between the internal markers are taken as the external markers.
- DT distance transformation
- the Sobel operator is an image processing function well known to those skilled in the image processing/pattern recognition art; a description of it can be found in Pattern Classification and Scene Analysis, Duda, R. and Hart, P., John Wiley and Sons, 1973, pp.271-272 .
- marker-controlled watershed transformation is then applied to generate a contour of the target regions of caries 162 directly.
- a description of the marker-controlled watershed transformation can be found in " Morphological grayscale reconstruction in image analysis: applications and efficient algorithms", IEEE Transaction on Image Processing, Vol.2, pp.176-201, 1993, by Luc Vincent .
- a method based on morphological bottom-hat operation along with a multi-resolution surface reconstruction method is adapted to detect and segment the suspicious caries areas.
- a bottom-hat operation is first applied to Ifgreen to produce an original bottom-hat image with an intensity value of Ibothat.
- a multi-resolution strategy is adapted to enable detection of caries with different sizes.
- the original bottom-hat image is down-sampled to form one or more reduced-resolution or down-sampled bottom-hat images, such as a 2x-down sampled image and a 4x-down sampled image.
- the morphological bottom hat process is then applied to the images with different resolutions (that is, to the original bottom-hat image, to the 2x-down sampled bottom-hat image, to the 4x-down sampled bottom-hat image, etc.).
- the 2-dimensional structure element can take other shapes.
- the size of the structure element, for example, the radius of the disk can be adjusted according to the image resolution or according to the size of the target objects.
- the initial suspicious caries areas are usually not the optimal results.
- the target caries areas can be included inside the initial suspicious caries areas with high confidence.
- the weighting parameter w has values 1.0, 0.5, and 0 for the original, 2x-down sampled, and 4x-down sampled images, respectively. This weighting parameter w can be suitably adjusted according to practical requirements.
- the normal intensity values (i.e., intensity values of the areas before the development of caries) inside the initial suspicious caries areas can be further estimated according to those outside the initial suspicious caries areas.
- the intensity estimation is a surface reconstruction processing, generating Ireconstructed, where intensity is taken as a topological surface. Subtracting the original image Ifgreen from the reconstructed image Ireconstructed, a difference image Idiff is obtained. Because the intensity values inside the caries areas are lower than those of the normal/sound tooth areas, and the change between parts inside the normal or sound tooth areas is not as much as that between the caries and the normal/sound tooth areas, the regions with larger change in intensity values (for example, 7, which can be adjusted according to the required detection sensitivity) are taken as the refined suspicious caries areas.
- the morphological grayscale reconstruction technique could also be used to detect regional maxima-dome of a certain height or regional minima-basin of a certain depth in a grayscale image, it is not as suitable as the embodiments discussed above to extract caries lesion in a tooth image. This is because different caries areas have different contrast characteristics with respect to their surrounding areas. Thus, different regional extrema heights or depths are needed to suit different images or different caries infections. After all, the height or depth is still a global parameter. Additionally, the morphological grayscale reconstruction is more difficult to be implemented and is slower than the morphological bottom-hat method of the present invention.
- top/bottom hat method might also be considered for use to detect regional maxima dome or minima basin regions
- the method also is unsuitable for extracting a caries lesion because it is difficult to determine the size of the structure element.
- This is unlike the morphological bottom-hat method of the present invention, which when used along with multi-resolution surface reconstruction, successfully overcomes the problem of determining the size of the structure element.
- interproximal regions areas having low contrast (typically lower than 7, though it can be adjusted according to the practical application) compared to the surrounding areas, and (2) areas between the proximal surfaces of adjacent teeth (hereafter referred to as interproximal regions).
- the low contrast false positives are removed by calculating the intensity contrast between suspicious area and its surrounding area.
- the interproximal false positives are removed according to the morphological features of the suspicious caries located inside or connected to the interproximal regions. To do this, the interproximal region is first identified.
- the interproximal regions contain spaces that are part of the background.
- This first kind of interproximal region having clear demarcation of the adjacent teeth is located as follows. Firstly, a distance transformation is applied to the binary image of tooth regions, and the pixel with the largest distance measured from the boundaries of the identified tooth regions in the binary image is located. Note that "largest distance" can be easily determined using any of a number of known algorithms. In the described embodiment, the pixel lying within a tooth region that has the largest distance to the boundary of the tooth region is most preferably chosen.
- any pixel with distance substantially close to the largest distance may also be used, as empirically determined to yield satisfactory results. Accordingly, throughout this application, "the pixel with the largest distance” can be construed as "the pixel with distance substantially close to the largest distance” in the manner just described.
- the identified tooth region that is connected to the located pixel is assigned as one object, and the other identified tooth regions are assigned as another object.
- the pixels in the background having substantially the same distance to each of the two objects are then defined to be the interproximal regions.
- the same distance in this application means that for two pixels, their respective distances to the same feature differ by no more than a small number of pixels, preferably by no more than from 1 to 5 pixels, less preferably by no more than about 10 pixels. This distance tolerance has been empirically determined to yield satisfactory results. Accordingly, throughout this application, the term “same distance” can be construed as “substantially the same distance” for pixels in the manner just described.
- the interproximal regions do not contain a clear demarcation of the adjacent teeth.
- Different image processing approaches have to be taken to identify this second kind of interproximal region in tooth images.
- the second kind of interproximal regions are located in four steps with marker-controlled watershed transformation and distance transformation in the region connected to the pixel with the largest distance.
- FIG. 4A shows a binary image of a target tooth 165a and two neighboring teeth 165b and 165c.
- the light areas represent the teeth, while the dark areas represent background of the teeth.
- the light and dark areas are separated by a boundary.
- the origin point 200 is defined as the pixel with the maximal distance to the boundaries of the teeth, though any point near the center of the target tooth 165a can also be chosen as the origin point.
- the origin point can also be determined with other methods according to practical applications. For example, if the tooth located at the center of the image is chosen as the target tooth, the local maxima point closest to the image center can be selected as the origin point.
- a fan of ray lines 210 are cast from the origin point 200 in every direction between 0° and 360°.
- a contour line 202 is formed or defined from points at which each ray line 210 first encounters the boundary between the light and dark areas.
- internal and external markers are identified or determined as follows.
- internal makers are determined from a certain circular area 222 around the origin point 200 and the gray areas 220a, 220b, 220c, 220d.
- the radius of the circular area 222 is chosen as 3 ⁇ 4 times of the maximal distance, the distance of the origin point 200 to the tooth boundaries.
- the gray areas 220a, 220b, 220c, 220d are obtained by subtracting the area enclosed by the contour line 202 from the tooth areas 165a, 165b, 165c, which have been determined by the boundary between the light and dark areas in reference to FIG. 4A .
- the outer light areas 224, corresponding to the dark areas of FIG. 4A are taken as the external markers.
- a marker-controlled watershed transformation is applied to a gradient image of a grayscale FIRE image with the above determined internal and external markers.
- the grayscale FIRE image is generated from the green channel of the FIRE image, Ifgreen.
- the grayscale FIRE image can be generated from a mixing of the three channels using methods well known in the image processing art. This transformation results in a water basin 170 connected to the internal marker that corresponds to the circular area 222 of FIG. 4C , and water basins 172a, 172b, 172c, 172d connected to the internal markers that correspond to the gray areas 220a, 220b, 220c and 220d of FIG. 4C , respectively.
- Watershed line 173a separates water basins 172a from 172b
- watershed line 173b separates water basins 172c from 172d.
- catchment basin is a term of the marker-controlled watershed transformation art in imaging, known to a person skilled in the art.
- FIG.4E shows parts of the interlines 176, indicating locations of the interproximal regions that are identified.
- Interlines 176 are obtained by marker-controlled watershed transformation and distance transformation.
- Region 174a is obtained from water basin 170.
- Region 174b is obtained from a combination of water basins 172a and 172b.
- a region 174c is obtained from a combination of water basins 172c and 172d.
- the second kind of interproximal regions that have no clear demarcation are located in four steps with a different adaptation of marker-controlled watershed transformation and distance transformation in the region connected to the pixel with the largest distance.
- this second inventive example differs from the first inventive example in the first two steps.
- FIG. 5A shows a binary image of a target tooth 165a and two neighboring teeth 165b and 165c.
- the light areas represent the teeth, while the dark areas represent background of the teeth.
- a distance transformation is applied to the image of FIG. 5A and results in a distance image Idist, in which the pixel value represents the closest distance of that pixel to the background of the teeth.
- the internal markers 230a, 230b, 230c and external marker 232 are determined as follows.
- Iseeds ( Idrecon > Tdreco n) ⁇ ( Idist > Tdist ),
- Seeded regions 230a, 230b, 230c obtained from Iseeds are shown in FIG. 5C .
- a seed point is identified as the pixel with maximal distance.
- seed points 234a, 234b, and 234c are the pixels having maximal distance in seeded areas 230a, 230b, and 230c, respectively. Taking the seed point as the origin point and 3 ⁇ 4 times of its distance as the radius, for each seeded region, a circular region is created as an internal marker corresponding to the seed point.
- circular internal markers 236a, 236b, and 236c are created from seed points 234a, 234b, and 234c, respectively, as shown in FIG. 5D .
- the background regions of the teeth are used as the external markers 232a, 232b.
- marker-controlled watershed transformation is applied to the gradient image of a grayscale FIRE image with the above determined internal markers 236a, 236b, and 236c and external markers 232a, 232b, and water basin regions 238a, 238b, 238c for internal markers 236a, 236b, and 236c are obtained, respectively.
- interlines 240a, 240b are located as the pixels having the same distance to two neighboring water basin regions.
- the suspicious caries areas connected to the interproximal regions are then identified. Because some true caries are also located in these regions, not all the suspicious caries areas connected to the interproximal regions should be removed.
- a true caries often appears as a "grayscale hole", which is an area of dark pixels surrounded by lighter pixels in the grayscale image.
- the "grayscale hole” characteristic is used to test which of the suspicious caries areas are true caries and should be retained, while the other suspicious areas connected to the interproximal regions are removed as false positives.
- the remaining suspicious caries areas are the extracted regions of caries 162. These areas may be outlined or highlighted with false colors in a displayed FIRE, fluorescence, or reflectance image of the teeth to aid caries screening or diagnosis. They are also used for caries quantification analysis, in the steps described below.
- step 130 of identifying a sound tooth region adjacent to the extracted lesion area is performed by expanding the suspicious lesion areas 162 outward to dilated line 166 with morphological dilation, an operation well known in the image processing art.
- This step is performed automatically without a need for user input.
- This step and steps 140 and 150 are preferably performed on the fluorescence image, for reasons explained below.
- the areas surrounding the expanded suspicious lesion areas are taken as the normal/sound areas, and the values of the pixels making up the dilated line 166 are taken as the intensity values of the surrounding normal/sound areas.
- the algorithmic implementation of the morphological dilation step is similar to that presented in FIG. 3 of commonly assigned co-pending U.S. Patent Application Publication No. 2008/0170764 . This step reduces errors even if there are possible detection errors in the detected suspicious caries regions and in the non-significant intensity changes in normal/sound tooth areas.
- the reconstructed intensity value for tooth tissue within the lesion area can be obtained using a bilinear interpolation technique according to values in the adjacent sound region as described below.
- FIG. 3E shows an exploded view of a region of interest 161 shown in FIG. 3D .
- P L the dilated line 166 in the sound area that are to the left, right, top, and bottom of P
- P L , P R , P T , P B the estimation of the reconstructed intensity value I r at P.
- I H I L ⁇ x 2 + I R ⁇ x 1 x 1 + x 2
- I V I T ⁇ y 2 + I B ⁇ y 1 y 2 + y 1
- I r I H + I V 2
- Bilinear interpolation is carried out in this way for every pixel in the region of caries 162 to reconstruct the normal intensity values for the whole region.
- the reconstructed intensity value for tooth tissue within the lesion area can be obtained using a surface fitting technique such as a two-dimensional spline, or Bézier fit.
- Another alternative embodiment for reconstructing intensity value for tooth tissue within the lesion area is to smoothly interpolate inward from the pixel's values on the boundaries of the expanded suspicious caries areas by solving Laplace's equation.
- This embodiment is an adaptation of a common image processing technique (such as what has been implemented in the familiar Matlab software function "roifill" in its image processing toolbox), and results in more accurate estimation.
- the condition of caries in a tooth image can be quantified in a number of ways, including calculating the size (or area) of the lesion area and calculating fluorescence loss ratio of the lesion area.
- the lesion area is calculated by counting the actual pixel number within the regions of caries 162, and then converting that to actual spatial dimension, such as mm 2 .
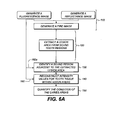
- FIG. 6A shows another method for quantification of caries using step 120 of the prevent invention.
- This method comprises a step of generating a FIRE image or other images obtained by combining a fluorescence image and a reflectance image of the tooth according to the present invention.
- FIG. 6A is similar to FIG. 1 .
- the digital image of the tooth is a FIRE image or the like which is generated from both a reflectance image and a fluorescence image.
- the reflectance image is generated using white or single color light, while the fluorescence image is generated under excitation light in the ultraviolet-blue range.
- the fluorescence image may substitute the FIRE image as input, indicated by the dashed arrow 160a.
- the fluorescence image is also needed as input, indicated by the arrow 160.
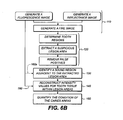
- FIG. 6B shows yet another method for quantifying caries using step 120 of the prevent invention. It is similar to FIG. 6A , but differs in step 120 which specifically comprises steps of identifying the tooth regions 165 from a tooth image, extracting a suspicious lesion area, and removing false positives.
- step 120 which specifically comprises steps of identifying the tooth regions 165 from a tooth image, extracting a suspicious lesion area, and removing false positives.
- the dashed arrow 160a shows that the fluorescence image may be used for step 130, and the arrow 160 shows that the fluorescence image is used for steps 140 and 150.
- the digital image generated in step 110 is a fluorescence image of the tooth.
- the fluorescence image has similar characteristics as the FIRE image, and so the methods used in the lesion areas extraction step 120 can all be carried out on the fluorescence image. Therefore, in this alternative embodiment, the fluorescence image is used in all steps from Step 110 to Step 150.
Landscapes
- Engineering & Computer Science (AREA)
- Health & Medical Sciences (AREA)
- Physics & Mathematics (AREA)
- General Physics & Mathematics (AREA)
- Computer Vision & Pattern Recognition (AREA)
- Theoretical Computer Science (AREA)
- Life Sciences & Earth Sciences (AREA)
- General Health & Medical Sciences (AREA)
- Biophysics (AREA)
- Oral & Maxillofacial Surgery (AREA)
- Dentistry (AREA)
- Medical Informatics (AREA)
- Animal Behavior & Ethology (AREA)
- Biomedical Technology (AREA)
- Public Health (AREA)
- Veterinary Medicine (AREA)
- Nuclear Medicine, Radiotherapy & Molecular Imaging (AREA)
- Pathology (AREA)
- Analytical Chemistry (AREA)
- Molecular Biology (AREA)
- Immunology (AREA)
- Chemical & Material Sciences (AREA)
- High Energy & Nuclear Physics (AREA)
- Epidemiology (AREA)
- Optics & Photonics (AREA)
- Radiology & Medical Imaging (AREA)
- Heart & Thoracic Surgery (AREA)
- Biochemistry (AREA)
- Surgery (AREA)
- Dental Tools And Instruments Or Auxiliary Dental Instruments (AREA)
- Investigating, Analyzing Materials By Fluorescence Or Luminescence (AREA)
- Medicines Containing Antibodies Or Antigens For Use As Internal Diagnostic Agents (AREA)
- Measuring And Recording Apparatus For Diagnosis (AREA)
- Endoscopes (AREA)
- Image Processing (AREA)
- Image Analysis (AREA)
Abstract
A method for extracting a carious lesion area from sound regions of a tooth. In one embodiment, the method includes generating a digital image of the tooth; identifying tooth regions; extracting a suspicious lesion area by using a marker-controlled watershed algorithm or by using a morphological bottom-hat based method along with a multi-resolution surface reconstruction method; and removing false positives. In another embodiment, the method includes generating a digital image of the tooth comprising obtaining a fluorescence image of the tooth, obtaining a reflectance image of the tooth, and combining image data for the fluorescence and reflectance images; identifying tooth regions; extracting suspicious lesion areas; and removing false positives.
Description
- The invention relates generally to the field of dental imaging, and in particular to a method for early detection of caries. More specifically, the invention relates to a method for extracting a carious lesion area in a tooth image captured using fluorescence and back-scattering of light.
- While there have been improvements in detection, treatment and prevention techniques, dental caries remains a prevalent condition affecting people. If not properly and promptly treated, caries could lead to permanent tooth damage and even to loss of teeth.
- Traditional methods for caries detection include visual examination and tactile probing with a sharp dental explorer device, often assisted by radiographic (x-ray) imaging. Detection using these methods can be somewhat subjective, varying in accuracy due to many factors, including practitioner expertise, location of the infected site, extent of infection, viewing conditions, accuracy of x-ray equipment and processing, and other factors. There are also hazards associated with conventional detection techniques, including the risk of damaging weakened teeth and spreading infection with tactile methods as well as exposure to x-ray radiation. By the time a caries condition is evident under visual and tactile examination, the disease is generally in an advanced stage, requiring a filling and, if not timely treated, possibly leading to tooth loss.
- In response to the need for improved caries detection methods, there has been considerable interest in improved imaging techniques that do not employ x-rays. One method employs fluorescence wherein teeth are illuminated with high intensity blue light. This technique, sometimes termed quantitative light-induced fluorescence (QLF), operates on the principle that sound, healthy tooth enamel yields a higher intensity of fluorescence under excitation from some wavelengths than does de-mineralized enamel that has been damaged by caries infection. The correlation between mineral loss and loss of fluorescence for blue light excitation is then used to identify and assess carious areas of the tooth. A different relationship has been found for red light excitation, a region of the spectrum for which bacteria and bacterial by-products in carious regions absorb and fluoresce more pronouncedly than do healthy areas.
- Applicants note some references related to optical detection of caries.
-
U.S. Patent No. 4,515,476 (Ingmar ) describes the use of a laser for providing excitation energy that generates fluorescence at some other wavelength for locating carious areas. -
U.S. Patent No. 6,231,338 (de Josselin de Jong et al. ) describes an imaging apparatus for identifying dental caries using fluorescence detection. -
U.S. Patent Application Publication No. 2004/0240716 (de Josselin de Jong et al. ) describes methods for improved image analysis for images obtained from fluorescing tissue. -
U.S. Patent No. 4,479,499 (Alfano ) describes a method for using transillumination to detect caries based on the translucent properties of tooth structure.
Among products for dental imaging using fluorescence behavior is the QLF Clinical System from Inspektor Research Systems BV, Amsterdam, The Netherlands. The Diagnodent Laser Caries Detection Aid from KaVo Dental Corporation, Lake Zurich, Illinois, USA, detects caries activity monitoring the intensity of fluorescence of bacterial by-products under illumination from red light. -
U.S. Patent Application Publication No. 2004/0202356 (Stookey et al. ) describes mathematical processing of spectral changes in fluorescence in order to detect caries in different stages with improved accuracy. Acknowledging the difficulty of early detection when using spectral fluorescence measurements, the '2356 Stookey et al. disclosure describes approaches for enhancing the spectral values obtained, effecting a transformation of the spectral data that is adapted to the spectral response of the camera that obtains the fluorescent image. - While the described methods and apparatus are intended for non-invasive, non-ionizing imaging methods for caries detection, there is still room for improvement. One recognized drawback with existing techniques that employ fluorescence imaging relates to image contrast. The image provided by fluorescence generation techniques such as QLF can be difficult to assess due to relatively poor contrast between healthy and infected areas. As noted in the '2356 Stookey et al. disclosure, spectral and intensity changes for incipient caries can be very slight, making it difficult to differentiate non-diseased tooth surface irregularities from incipient caries.
- Overall, it is recognized that, with fluorescence techniques, the image contrast that is obtained corresponds to the severity of the condition. Accurate identification of caries using these techniques often requires that the condition be at a more advanced stage, beyond incipient or early caries, because the difference in fluorescence between carious and sound tooth structure is very small for caries at an early stage. In such cases, detection accuracy using fluorescence techniques may not show marked improvement over conventional methods. Because of this shortcoming, the use of fluorescence effects appears to have some practical limits that prevent accurate diagnosis of incipient caries. As a result, a caries condition may continue undetected until it is more serious, requiring a filling, for example.
- Detection of caries at very early stages is of particular interest for preventive dentistry. As noted earlier, conventional techniques generally fail to detect caries at a stage at which the condition can be reversed. As a general rule of thumb, incipient caries is a lesion that has not penetrated substantially into the tooth enamel. Where such a caries lesion is identified before it threatens the dentin portion of the tooth, remineralization can often be accomplished, reversing the early damage and preventing the need for a filling. More advanced caries, however, grows increasingly more difficult to treat, most often requiring some type of filling or other type of intervention.
- To take advantage of opportunities for non-invasive dental techniques to forestall caries, it is desirable that caries be detected at the onset. In many cases, as is acknowledged in the '2356 Stookey et al. disclosure, this level of detection has been found to be difficult to achieve using existing fluorescence imaging techniques, such as QLF. As a result, early caries can continue undetected, so that by the time positive detection is obtained, the opportunity for reversal using low-cost preventive measures can be lost.
- In commonly-assigned
U.S. Patent Application Publication No. 2008/0056551 , a method and apparatus that employs both the reflectance and fluorescence images of the tooth is used to detect caries. It employs observed back-scattering, or reflectance, for incipient caries and in combination with fluorescence effects, to provide an improved dental imaging technique to detect caries. The technique, referred to as Fluorescence Imaging with Reflectance Enhancement (FIRE), helps to increase the contrast of images over that of earlier approaches, and also makes it possible to detect incipient caries at stages when preventive measures are likely to take effect. Advantageously, FIRE detection can be accurate at an earlier stage of caries infection than has been exhibited using existing fluorescence approaches that measure fluorescence alone. The application describes a downshifting method to generate the FIRE image. - Commonly-assigned copending
PCT/CN2009/000078 - Quantification of caries based on a digital image of a tooth such as a fluorescence image provides numerical information on the severity of lesion regions and can help dentists make and carry out treatment plans. It can be a useful tool in the longitudinal monitoring of caries for dentists to observe the evolution of each lesion area over time.
U.S. Patent Application Publication No. 2004/0240716 has disclosed some methods for quantification of caries; however, the disclosed methods generally require manual extraction of lesion regions from sound tooth areas of the image by the user, and they are based on fluorescence-only images. Manual extraction of lesion regions from the image presents two problems. Firstly, the extraction process is slow, requiring the user to make many mouse clicks or to draw lines on the images to indicate the boundary of a lesion region. Secondly, manual extraction requires considerable caries diagnostic experience on the part of the user and is generally subjective. In addition, fluorescence-only images display incipient caries at relatively low contrast, further adding difficulty to the manual lesion extraction process. Therefore, in the disclosed methods, only compromised caries quantification results are achieved at best. - Commonly-assigned copending
U.S. Patent Application No. 12/487,729 entitled METHOD FOR QUANTIFYING CARIES describes an improved method for quantifying caries. This method, however, partly relies on a key step of extracting a lesion area in tooth image data. Although there are existing methods for doing this, conventional techniques can yield disappointing results and fail to properly identify and extract lesion areas from within the tooth image data. - Thus, it can be seen that there is a need for an improved method for extracting a carious lesion area in a tooth image, particularly in a FIRE image or fluorescence image of a tooth.
- An object of the present invention is to provide a method for extracting a carious lesion area in a digital image of a tooth.
- Another object of the present invention is to provide a method for extracting a carious lesion area based a FIRE image of a tooth.
- A feature of the present invention is that carious lesions are automatically extracted from a FIRE image, the high contrast in the FIRE image providing improved sensitivity and accuracy for the identification of caries.
- An advantage of the present invention is that carious lesions in tooth images are extracted and quantified automatically without user intervention, thus providing an efficient workflow in caries identification and monitoring.
- These objects are given only by way of illustrative example, and such objects may be exemplary of one or more embodiments of the invention. Other desirable objectives and advantages inherently achieved by the disclosed invention may occur or become apparent to those skilled in the art. The invention is defined by the appended claims.
- According to one aspect of the invention, there is provided a method for extracting a lesion area from sound regions of a tooth, executed at least in part on data processing hardware, the method comprising generating a digital image of the tooth, identifying tooth regions, extracting a suspicious lesion area by using a marker-controlled watershed algorithm or by using a morphological bottom-hat based method along with a multi-resolution surface reconstruction method, and removing false positives.
- According to another aspect of the invention, there is provided a method for extracting a lesion area from sound regions of a tooth, executed at least in part on data processing hardware, the method comprising generating a digital image of the tooth comprising obtaining a fluorescence image of the tooth, obtaining a reflectance image of the tooth, and combining image data for the fluorescence and reflectance images; identifying tooth regions; extracting suspicious lesion areas; and removing false positives.
- The foregoing and other objects, features, and advantages of the invention will be apparent from the following more particular description of the embodiments of the invention, as illustrated in the accompanying drawings. The elements of the drawings are not necessarily to scale relative to each other.
-
FIG. 1 shows a method for quantifying caries comprising five steps that use the present invention. -
FIGS. 2A, 2B, 2C show illustratively a typical reflectance image, a fluorescence image, and a FIRE image, respectively. -
FIG. 2D is a view showing the process for combining dental image data to generate a FIRE image. -
FIG. 3A shows an embodiment of a digital image generation step. -
FIG. 3B shows a tooth region in a FIRE image having a lesion area identified in an extraction step. -
FIG. 3C shows an embodiment of a step for extracting a lesion area from sound tooth regions according to the present invention. -
FIG. 3D shows a FIRE image with a dilated line in a sound tooth area, and a lesion segmentation border separating a sound tooth area and a lesion area after a sound region identification step. -
FIG. 3E shows an embodiment of an intensity reconstruction step using a bilinear interpolation. -
FIG. 4A shows a binary image of three teeth. -
FIG. 4B shows a contour line formed from a fan of ray lines from the origin point. -
FIG. 4C shows determined internal and external markers. -
FIG. 4D is an illustration of the marker-controlled watershed result. -
FIG. 4E is an illustration of interlines between adjacent teeth. -
FIG. 5A shows a binary image of three teeth similar toFIG. 4A . -
FIG. 5B shows a distance image Idist formed from a distance transformation on the image ofFIG. 5A . -
FIG. 5C shows seed points in seeded areas. -
FIG. 5D shows internal and external markers. -
FIG. 5E is an illustration of interlines after the marker-controlled watershed and distance transform processing. -
FIG. 6A shows a method for quantification of caries that uses the present invention. -
FIG. 6B shows another method for quantifying caries that uses the present invention. - The following is a detailed description of the preferred embodiments of the invention, reference being made to the drawings in which the same reference numerals identify the same elements of structure in each of the several figures.
- Reference is made to commonly-assigned copending
U.S. Patent Application No. 12/487,729 filed on June 19, 2009 - Reference is made to
PCT/CN2009/000078, filed on Jan. 20, 2009 - Reference is made to
U.S. Patent Application Publication No. 2008/0056551, published Mar. 6, 2008 , entitled METHOD FOR DETECTION OF CARIES, by Wong et al. - Reference is made to
U.S. Patent Application Publication No. 2008/0063998, published Mar. 13, 2008 , entitled APPARATUS FOR CARIES DETECTION, by Liang et al. - Reference is made to
U.S. Patent Application Publication No. 2008/0170764, published July 17, 2008 , entitled SYSTEM FOR EARLY DETECTION OF DENTAL CARIES, by Bums et al. - Reference is made to
U.S. Patent Publication No. 2007/0099148, published on May 3, 2007 , entitled METHOD AND APPARATUS FOR DETECTION OF CARIES, by Wong et al. - This invention includes calculation steps. Those skilled in the art will recognize that these calculation steps may be performed by data processing hardware that is provided with instructions for image data processing. Because such image manipulation systems are well known, the present description is directed more particularly to algorithms and systems that execute the method of the present invention. Other aspects of such algorithms and systems, and data processing hardware and/or software for producing and otherwise processing the image signals may be selected from such systems, algorithms, components and elements known in the art. Given the description as set forth in the following specification, software implementation lies within the ordinary skill of those versed in the programming arts.
- The stored instructions of such a software program may be stored in a computer readable storage medium, which may comprise, for example: magnetic storage media such as a magnetic disk or magnetic tape; optical storage media such as an optical disc, optical tape, or machine readable bar code; solid state electronic storage devices such as random access memory (RAM), or read only memory (ROM); or any other physical device or medium employed to store a computer program. Using such software, the present invention can be utilized on a data processing hardware apparatus, such as a computer system or personal computer, or on an embedded system that employs a dedicated data processing component, such as a digital signal digital signal processing chip. Output resulting from executing the method of the present invention is provided as digital data for image display, for storage in an electronic memory, and, optionally, for use by other diagnostic image processing utilities.
- In this disclosure, the word "intensity" is used to refer to light level, and is also broadly used to refer to the value of a pixel in a digital image.
- Where they are used, the terms "first", "second", and so on, do not necessarily denote any ordinal or priority relation, but may be simply used to more clearly distinguish one element from another.
- The term "water basin" as used herein is a term of art used to describe a structure that is identified and used in executing a marker-controlled watershed transformation in the imaging arts. The term "catchment basin" is sometimes used in the same way. References in this disclosure to "water basin" refer to this imaging arts construct.
- Referring to
FIG. 1 , a method for quantifying caries, executed at least in part on data processing hardware such as computer hardware, comprises astep 110 of generating a digital image of a tooth, the image comprising actual intensity values for a region of pixels corresponding to the tooth, gum, and background; astep 120 of extracting a lesion area from sound tooth regions by identifying tooth regions, extracting suspicious lesion areas, and removing false positives; astep 130 of identifying a sound region that is adjacent to the extracted lesion area; astep 140 of reconstructing intensity values for tooth tissue within the lesion area according to values in the adjacent sound region; and astep 150 of quantifying the condition of the caries using the reconstructed intensity values and intensity values from the lesion area. Note that the phrase "extracting a lesion area," as used throughout this application, means identifying at least one lesion area in a digital tooth image. -
FIGS. 2A, 2B, and 2C show illustratively atypical reflectance image 167, afluorescence image 168, and aFIRE image 169, respectively, of a tooth surface including asound tooth area 164 and an early lesion area (or caries region) 162. Generally, in a reflectance image, such as a white light reflectance image, the intensity of early caries regions is higher than that of their surrounding sound areas. In contrast, in a fluorescence image, such as one obtained under blue excitation light, the intensity of caries regions is lower than that of their surrounding sound areas because of the fluorescence loss in caries regions. A FIRE image is obtained through subtracting regional maxima and dome regions of the reflectance image from the fluorescence image. As a result, the FIRE image has a similar appearance as a fluorescence image because both have lower intensity values in a lesion area than in a surrounding sound area. However, the FIRE image has higher contrast than a fluorescence image, making it potentially more sensitive in detecting caries. It should be noted that other images that are generated by combining image data for the fluorescence and reflectance images can also be used for substituting the FIRE image. -
FIG. 2D corresponds toFIG. 5 of commonly-assigned copendingU.S. Patent Application Publication No. 2008/0056551 (Wong et al. ), entitled METHOD FOR DETECTION OF CARIES. This figure shows that aFIRE image 169 is formed by combining thefluorescence image 168 with thereflectance image 167 through aprocessing apparatus 180. - In the image processing field, there are many well known methods used to extract features from images, including but not limited to threshold, top-hat, and morphological grayscale reconstruction techniques (see Luc Vincent, "Morphological grayscale reconstruction in image analysis: applications and efficient algorithms", IEEE Transaction on Image Processing, Vol.2, No.2, pp.176-201, 1993). However, not every technique is suitable for segmenting lesions from an image of a tooth. Teeth images have many characteristics that pose challenges for doing automatic lesion extraction. For example, a tooth image has no flat background (sound tooth areas are the background of the target caries), the caries sites have no fixed sizes and shapes, and surface contour and curvature of teeth cause uneven illumination, resulting in intensity variation across the tooth image. The present invention overcomes these difficulties by employing a combination of different image processing techniques that address the various problems specific to automatic processing of teeth images.
- In the following, steps for quantifying caries are described in reference to
FIGs. 3A through 5E . The methods for extracting a carious lesion according to the present invention, essential in steps for quantifying caries, are also described. -
FIG. 3A shows one embodiment ofstep 110 of generating a digital image of a tooth, comprising steps of obtaining a fluorescence image, obtaining a reflectance image, and combining image data for the fluorescence and reflectance images to generate an image such as a FIRE image. Details of how the fluorescence and reflectance images are obtained are described inU.S. Patent Application Publication No. 2008/0063998, published Mar. 13, 2008 , entitled APPARATUS FOR CARIES DETECTION, by Liang et al. According to this embodiment, the digital image of the tooth is aFIRE image 169, which is formed by combining thefluorescence image 168 with thereflectance image 167 through aprocessing apparatus 180 as shown inFIG. 2D . - The details of generating the FIRE image have been disclosed in the commonly-assigned copending
PCT/CN2009/000078 - 1. Obtaining a reflectance image, and then converting the reflectance image into a gray reflectance image with an intensity value of Iwgreen. The gray reflectance image can be the green channel of the reflectance image. This gray reflectance image is treated as a mask, and it has an intensity value of Imask = Iwgreen. In one example, the reflectance image is a white light reflectance image. The white light can be emitted from one or more white LEDs.
- 2. Generating a marker with an intensity value of Imarker according to the following formula,
Imarker = Imask - hdome, where hdome, representing the height of a dome in the gray reflectance image, is a fixed value and is empirically selected based on the intensity values of a plurality of gray reflectance teeth images obtained. In one inventive example, hdome is 50. - 3. Generating a reconstructed image having an intensity value of Ireconstructed through morphological grayscale reconstruction, which takes Imask and Imarker as input (see the Luc Vincent article, cited earlier).
- 4. Generating an image of regional maxima and dome regions of the gray reflectance image. This image, corresponding to the suspicious caries regions, has an intensity value
Ihdome = Imask - Ireconstructed - 5. Generating a FIRE image with an intensity value
IFIRE = IFluo - Ihdome, where IFIRE and IFluo are the intensity values of the green channel of the generated FIRE image and the obtained fluorescence image, respectively. The generated FIRE image can be displayed as a color image by combining IFIRE with the red and blue channels of the fluorescence image. In one example, the fluorescence image is one obtained under blue excitation light. The blue light can be emitted from one or more blue LEDs. The FIRE image is the digital image used for subsequent image processing steps. - Another embodiment of
step 110 of generating a digital image of a tooth comprises a step of obtaining a fluorescence image. The fluorescence image is the digital image used for subsequent image processing steps. - Generally, a digital image of a tooth can be classified into three groups of regions: 1) gum, 2) tooth, and 3) other background. Caries detection only needs to be performed inside
tooth regions 165. - Referring to
FIG. 3B , inside thetooth region 165 is alesion area 162, a surroundingsound tooth area 164, andsegmentation border 163 that separates the two areas. Methods for identifyingtooth region 165,lesion area 162, surroundingsound tooth area 164, andsegmentation border 163 are described below. -
FIG. 3C shows an embodiment ofstep 120 for extracting alesion area 162 fromtooth regions 165 in a digital image of a tooth according to the present invention. Step 120 is performed automatically without a need for a user input. Specifically,step 120 includes sub-steps of identifying thetooth regions 165, extracting one or more suspicious lesion areas, and removing false positives. These sub-steps include details specific to tooth images, as discussed below. - Since some image processing work is done on a certain channel of a color image, for convenience, the following terms Iwred, Iwgreen, Iwblue, Ibred, Ibgreen, Ibblue, Ifred, Ifgreen, and Ifblue are used to represent the intensity values of the pixels in the red, green, and blue channels of the reflectance, fluorescence, and FIRE images, respectively. And in order to remove the impact of illumination level, intensity values of both reflectance and fluorescence images are adjusted to a range between 0 and 150, where 0 and 150 correspond to minimum and maximum intensity values.
- As discussed, similar to the fluorescence image, the FIRE image has higher green intensity values inside normal/sound tooth areas than in caries and other background areas. Consequently, an adapted threshold technique is preferably used on a fluorescence or FIRE image to separate the tooth region, which contains both normal/sound tooth areas and caries areas, from the gum and other background.
- According to one embodiment of the present invention,
tooth regions 165 are identified from the digital tooth image as follows. In this embodiment and other embodiments throughout the disclosure, grayscale versions of both the fluorescence and reflectance images are used, the grayscale images being generated from one channel of their respective color images, such as the green channel, or from a mixing of the three channels using methods well known in the image processing art. For illustrative purposes, the embodiment is described below using the green channels of the fluorescence and reflectance images, Ibgreen and Iwgreen, respectively. - Threshold images are generated from Ibgreen and Iwgreen by selecting intensity values higher than some predetermined threshold values c1 and c2, for example, 10 and 30, respectively. Secondly, the intersection regions of the two threshold images are taken as the preliminary tooth regions image Iroi0. Thirdly, a reference binary image Irefroi is obtained by thresholding the image Ibgreen with a threshold value c3 higher than the one used in generating Iroi0, such as 30. And lastly, a
refined tooth regions 165 image, Iroi, is generated by choosing the regions that are in Iroi0 and connected to the objects in Irefroi. The above four steps increase the accuracy of selectingtooth regions 165 as compared to thresholding just the FIRE or fluorescence image. Therefined tooth regions 165 image is then used in the following sub-steps of extracting suspicious lesion areas and removing false positives. - In an alternative embodiment, thresholding technique is applied to the fluorescence or FIRE image to determine
tooth regions 165. This embodiment helps provide simpler and faster processing. - In a FIRE image (Ifgreen), there is a definite morphological characteristic for caries, that is, the intensity of region of
caries 162 is lower than that of the surroundingsound tooth area 164. The present invention takes advantage of this characteristic to detect and segment the suspicious caries areas based on mathematical morphology theory. - In one embodiment, a marker-controlled watershed based method is adapted to detect and segment the suspicious caries areas. The key to this method is to determine internal and external markers for the target objects. According to the present invention, the internal markers are determined with the morphological grayscale reconstruction technique. The same technique has also been used for generating a FIRE image as discussed above.
- To determine internal markers with the morphological gray-scale reconstruction method, the regional basins Ihbasin are first detected; they correspond to the target regions of caries because they have lower intensity than surrounding sound areas. Then, the internal markers are obtained by thresholding Ihbasin with a fixed value, for example, 50. Note that the fixed value can be adjusted according to detection sensitivity requirement. The internal markers are the regions inside which the intensities of Ihbasin are higher than the given threshold value.
- To obtain the external markers, a binary image is first formed from the internal markers, wherein the pixel value of the binary image is 1 for a pixel inside internal markers and is 0 otherwise. Then a distance transformation (DT), mapping each image pixel onto its shortest distance to the target objects, is applied to the binary image to generate a DT image (see "Sequential operations in digital picture processing", J. ACM. 13, 1966, by Rosenfeld, A. and Pfaltz, J. and "2D Euclidean distance transform algorithms: a comparative survey", ACM computing surveys 40, 2008, by Ricardo Fabbri, Luciano Da F. Costa, Julio C. Torelli and Odemir M. Bruno). The ridge lines that are composed of the pixels with local maximal values in the DT image and located between the internal markers are taken as the external markers.
- Next, the gradient image of Ifgreen is calculated with the Sobel operator. The Sobel operator is an image processing function well known to those skilled in the image processing/pattern recognition art; a description of it can be found in Pattern Classification and Scene Analysis, Duda, R. and Hart, P., John Wiley and Sons, 1973, pp.271-272.
- With the internal and external markers and the gradient image identified or determined, marker-controlled watershed transformation is then applied to generate a contour of the target regions of
caries 162 directly. A description of the marker-controlled watershed transformation can be found in "Morphological grayscale reconstruction in image analysis: applications and efficient algorithms", IEEE Transaction on Image Processing, Vol.2, pp.176-201, 1993, by Luc Vincent. - In another embodiment, a method based on morphological bottom-hat operation along with a multi-resolution surface reconstruction method is adapted to detect and segment the suspicious caries areas. According to this embodiment of the present invention, a bottom-hat operation is first applied to Ifgreen to produce an original bottom-hat image with an intensity value of Ibothat. Then a multi-resolution strategy is adapted to enable detection of caries with different sizes. According to this strategy, the original bottom-hat image is down-sampled to form one or more reduced-resolution or down-sampled bottom-hat images, such as a 2x-down sampled image and a 4x-down sampled image. Given a 2-dimensional shaped structure element with a fixed size, for example, a disk with a radius of 10 pixels, the morphological bottom hat process is then applied to the images with different resolutions (that is, to the original bottom-hat image, to the 2x-down sampled bottom-hat image, to the 4x-down sampled bottom-hat image, etc.). Note that the 2-dimensional structure element can take other shapes. The size of the structure element, for example, the radius of the disk, can be adjusted according to the image resolution or according to the size of the target objects. For each of the obtained multi-resolution bottom-hat images, according to the statistic of the intensity value inside the corresponding tooth regions, a threshold value *Ithres is calculated as
Ithres = Im ean + w*Istd, where w is the weighting parameter determined experimentally, and Imean and Istd are the mean and standard deviation of intensity values, respectively. After applying a threshold operation to each of the multi-resolution bottom-hat images, a binary image is obtained, inside which the regions with a nonzero value are the initial suspicious caries areas in the image with corresponding resolution. After interpolating each of the binary images back to the original resolution to produce interpolated images, the union of all the interpolated images shows the initial suspicious lesion areas. - Since it is not feasible to use an infinite number of resolutions, and the size and shape of the structure elements are not the same as those of the target regions of
caries 162, the initial suspicious caries areas are usually not the optimal results. - However, by using a small value of the weighting parameter w , the target caries areas can be included inside the initial suspicious caries areas with high confidence. In one example, the weighting parameter w has values 1.0, 0.5, and 0 for the original, 2x-down sampled, and 4x-down sampled images, respectively. This weighting parameter w can be suitably adjusted according to practical requirements.
- The normal intensity values (i.e., intensity values of the areas before the development of caries) inside the initial suspicious caries areas can be further estimated according to those outside the initial suspicious caries areas. According to the present invention, the intensity estimation is a surface reconstruction processing, generating Ireconstructed, where intensity is taken as a topological surface. Subtracting the original image Ifgreen from the reconstructed image Ireconstructed, a difference image Idiff is obtained. Because the intensity values inside the caries areas are lower than those of the normal/sound tooth areas, and the change between parts inside the normal or sound tooth areas is not as much as that between the caries and the normal/sound tooth areas, the regions with larger change in intensity values (for example, 7, which can be adjusted according to the required detection sensitivity) are taken as the refined suspicious caries areas.
- While the morphological grayscale reconstruction technique could also be used to detect regional maxima-dome of a certain height or regional minima-basin of a certain depth in a grayscale image, it is not as suitable as the embodiments discussed above to extract caries lesion in a tooth image. This is because different caries areas have different contrast characteristics with respect to their surrounding areas. Thus, different regional extrema heights or depths are needed to suit different images or different caries infections. After all, the height or depth is still a global parameter. Additionally, the morphological grayscale reconstruction is more difficult to be implemented and is slower than the morphological bottom-hat method of the present invention.
- While a conventional top/bottom hat method might also be considered for use to detect regional maxima dome or minima basin regions, the method also is unsuitable for extracting a caries lesion because it is difficult to determine the size of the structure element. This is unlike the morphological bottom-hat method of the present invention, which when used along with multi-resolution surface reconstruction, successfully overcomes the problem of determining the size of the structure element.
- Based on experimental results, most occurrences of false positives can be grouped into two categories: (1) areas having low contrast (typically lower than 7, though it can be adjusted according to the practical application) compared to the surrounding areas, and (2) areas between the proximal surfaces of adjacent teeth (hereafter referred to as interproximal regions).
- According to the present invention, the low contrast false positives are removed by calculating the intensity contrast between suspicious area and its surrounding area.
- The interproximal false positives are removed according to the morphological features of the suspicious caries located inside or connected to the interproximal regions. To do this, the interproximal region is first identified.
- A detailed description of how interproximal regions are located in teeth images is given below.
- For adjacent teeth that are well separated, the interproximal regions contain spaces that are part of the background. This first kind of interproximal region having clear demarcation of the adjacent teeth is located as follows. Firstly, a distance transformation is applied to the binary image of tooth regions, and the pixel with the largest distance measured from the boundaries of the identified tooth regions in the binary image is located. Note that "largest distance" can be easily determined using any of a number of known algorithms. In the described embodiment, the pixel lying within a tooth region that has the largest distance to the boundary of the tooth region is most preferably chosen. However, any pixel with distance substantially close to the largest distance (for example, preferably within 90% of the largest distance, less preferably within at least 80% of the largest distance) may also be used, as empirically determined to yield satisfactory results. Accordingly, throughout this application, "the pixel with the largest distance" can be construed as "the pixel with distance substantially close to the largest distance" in the manner just described. Secondly, the identified tooth region that is connected to the located pixel is assigned as one object, and the other identified tooth regions are assigned as another object. And thirdly, the pixels in the background having substantially the same distance to each of the two objects are then defined to be the interproximal regions. "The same distance" in this application means that for two pixels, their respective distances to the same feature differ by no more than a small number of pixels, preferably by no more than from 1 to 5 pixels, less preferably by no more than about 10 pixels. This distance tolerance has been empirically determined to yield satisfactory results. Accordingly, throughout this application, the term "same distance" can be construed as "substantially the same distance" for pixels in the manner just described.
- For adjacent teeth that are very close to each other or adjoining, the interproximal regions do not contain a clear demarcation of the adjacent teeth. Different image processing approaches have to be taken to identify this second kind of interproximal region in tooth images. In the first inventive example, referring to
FIGS. 4A through 4E , the second kind of interproximal regions are located in four steps with marker-controlled watershed transformation and distance transformation in the region connected to the pixel with the largest distance. -
FIG. 4A shows a binary image of atarget tooth 165a and two neighboringteeth origin point 200 is defined as the pixel with the maximal distance to the boundaries of the teeth, though any point near the center of thetarget tooth 165a can also be chosen as the origin point. The origin point can also be determined with other methods according to practical applications. For example, if the tooth located at the center of the image is chosen as the target tooth, the local maxima point closest to the image center can be selected as the origin point. - In the first step as shown in
FIG. 4B , a fan ofray lines 210 are cast from theorigin point 200 in every direction between 0° and 360°. Subsequently acontour line 202 is formed or defined from points at which eachray line 210 first encounters the boundary between the light and dark areas. - In the second step, internal and external markers are identified or determined as follows. As shown in
FIG. 4C , internal makers are determined from a certaincircular area 222 around theorigin point 200 and thegray areas circular area 222 is chosen as ¾ times of the maximal distance, the distance of theorigin point 200 to the tooth boundaries. Thegray areas contour line 202 from thetooth areas FIG. 4A . Theouter light areas 224, corresponding to the dark areas ofFIG. 4A , are taken as the external markers. - In the third step, a marker-controlled watershed transformation is applied to a gradient image of a grayscale FIRE image with the above determined internal and external markers. In one embodiment, the grayscale FIRE image is generated from the green channel of the FIRE image, Ifgreen. In alternative embodiments, the grayscale FIRE image can be generated from a mixing of the three channels using methods well known in the image processing art. This transformation results in a
water basin 170 connected to the internal marker that corresponds to thecircular area 222 ofFIG. 4C , andwater basins gray areas FIG. 4C , respectively. This transformation also results inwatershed lines Watershed line 173a separateswater basins 172a from 172b, whilewatershed line 173b separateswater basins 172c from 172d. As noted earlier, the term "water basin", also referred to as catchment basin, is a term of the marker-controlled watershed transformation art in imaging, known to a person skilled in the art. - In the fourth step, the pixels having the same distance to the two groups of basins are then taken to be the second kind of interproximal regions.
FIG.4E shows parts of theinterlines 176, indicating locations of the interproximal regions that are identified.Interlines 176 are obtained by marker-controlled watershed transformation and distance transformation.Region 174a is obtained fromwater basin 170.Region 174b is obtained from a combination ofwater basins region 174c is obtained from a combination ofwater basins - In the second inventive example, referring now to
FIGs. 5A through 5E , the second kind of interproximal regions that have no clear demarcation are located in four steps with a different adaptation of marker-controlled watershed transformation and distance transformation in the region connected to the pixel with the largest distance. Although sharing similar third and fourth steps, this second inventive example differs from the first inventive example in the first two steps. - Similar to
FIG. 4A ,FIG. 5A shows a binary image of atarget tooth 165a and two neighboringteeth - In the first step as shown in
FIG. 5B , a distance transformation is applied to the image ofFIG. 5A and results in a distance image Idist, in which the pixel value represents the closest distance of that pixel to the background of the teeth. In the second step shown inFIG. 5C and FIG. 5D , theinternal markers - With Idist as the mask and Idist - dhome as the marker, using morphological grayscale reconstruction, a reconstructed image Idrecon can be obtained. Then Iseeds can be determined according to the following equation:
Iseeds = (Idrecon > Tdrecon) ∩ (Idist > Tdist),
- where Tdrecon and Tdist are two threshold values (for example, Tdrecon = 5, and Tdist= 10), respectively. The symbol (Idrecon > Tdrecon) refers to the area in which the pixel values of Idrecon are greater than Tdrecon, and the symbol (Idist > Tdist) refers to the area in which the pixel values of Idist are greater than Tdrecon. The symbol ∩ is the intersection operator, familiar to those skilled in set theory.
-
Seeded regions FIG. 5C . In each seeded region, according to the distance image Idist inFIG. 5B , a seed point is identified as the pixel with maximal distance. For example,seed points seeded areas internal markers seed points FIG. 5D . The background regions of the teeth are used as theexternal markers - Similar to the third step of the first inventive example (in reference to
FIGs. 4A through 4E ), in the third step, as shown inFIG. 5E , marker-controlled watershed transformation is applied to the gradient image of a grayscale FIRE image with the above determinedinternal markers external markers water basin regions internal markers - After the interproximal regions are located, the suspicious caries areas connected to the interproximal regions are then identified. Because some true caries are also located in these regions, not all the suspicious caries areas connected to the interproximal regions should be removed. A true caries often appears as a "grayscale hole", which is an area of dark pixels surrounded by lighter pixels in the grayscale image. Thus, the "grayscale hole" characteristic is used to test which of the suspicious caries areas are true caries and should be retained, while the other suspicious areas connected to the interproximal regions are removed as false positives.
- After the false positives are removed, the remaining suspicious caries areas are the extracted regions of
caries 162. These areas may be outlined or highlighted with false colors in a displayed FIRE, fluorescence, or reflectance image of the teeth to aid caries screening or diagnosis. They are also used for caries quantification analysis, in the steps described below. - Referring back to
FIG. 3D , step 130 of identifying a sound tooth region adjacent to the extracted lesion area is performed by expanding thesuspicious lesion areas 162 outward to dilatedline 166 with morphological dilation, an operation well known in the image processing art. This step is performed automatically without a need for user input. This step and steps 140 and 150 are preferably performed on the fluorescence image, for reasons explained below. The areas surrounding the expanded suspicious lesion areas are taken as the normal/sound areas, and the values of the pixels making up the dilatedline 166 are taken as the intensity values of the surrounding normal/sound areas. The algorithmic implementation of the morphological dilation step is similar to that presented inFIG. 3 of commonly assigned co-pendingU.S. Patent Application Publication No. 2008/0170764 . This step reduces errors even if there are possible detection errors in the detected suspicious caries regions and in the non-significant intensity changes in normal/sound tooth areas. - For assessing the severity of the extracted lesions and for monitoring the development of the identified lesions over time, it is helpful to have an estimate of the normal intensity values of the suspicious caries regions before the development of caries. This can be performed through various approaches based on the intensity values of the surrounding normal/sound areas found in
Step 130. - In one embodiment, after the surrounding sound area is identified, the reconstructed intensity value for tooth tissue within the lesion area can be obtained using a bilinear interpolation technique according to values in the adjacent sound region as described below.
-
FIG. 3E shows an exploded view of a region ofinterest 161 shown inFIG. 3D . For each pixel P in thelesion area R 162, there are four pixels on the dilatedline 166 in the sound area that are to the left, right, top, and bottom of P, named PL, PR, PT, PB, respectively. The estimation of the reconstructed intensity value Ir at P can be calculated using a bilinear interpolation, for which the formulae are shown below.
- Bilinear interpolation is carried out in this way for every pixel in the region of
caries 162 to reconstruct the normal intensity values for the whole region. - As an alternative embodiment, after the surrounding sound area is identified, the reconstructed intensity value for tooth tissue within the lesion area can be obtained using a surface fitting technique such as a two-dimensional spline, or Bézier fit.
- Another alternative embodiment for reconstructing intensity value for tooth tissue within the lesion area is to smoothly interpolate inward from the pixel's values on the boundaries of the expanded suspicious caries areas by solving Laplace's equation. This embodiment is an adaptation of a common image processing technique (such as what has been implemented in the familiar Matlab software function "roifill" in its image processing toolbox), and results in more accurate estimation.
- As discussed above, quantitative information on the regions of
caries 162 is helpful for assessing the condition of the extracted lesions and for monitoring the development of the identified lesions over time. The condition of caries in a tooth image can be quantified in a number of ways, including calculating the size (or area) of the lesion area and calculating fluorescence loss ratio of the lesion area. - In one example, the lesion area is calculated by counting the actual pixel number within the regions of
caries 162, and then converting that to actual spatial dimension, such as mm2. - In another example, the fluorescence loss is used to measure the condition of the caries. Fluorescence loss in tooth structure has been demonstrated to be a direct indication of the degree of demineralization in the structure. This quantity can be directly calculated from the intensity values in the tooth's fluorescence image. In the fluorescence image, the fluorescence loss ratio ΔF at each pixel within the lesion area is calculated using the formula below:

- where Ir is the reconstructed intensity value from
step 140, and Io is the actual measured intensity value of the green channel of the fluorescence image IFluo . Where caries has occurred, ΔF>0. - The whole fluorescence loss L of the lesion region is the sum of ΔF within the lesion region R:

-
FIG. 6A shows another method for quantification ofcaries using step 120 of the prevent invention. This method comprises a step of generating a FIRE image or other images obtained by combining a fluorescence image and a reflectance image of the tooth according to the present invention.FIG. 6A is similar toFIG. 1 . However, inFIG. 6A the digital image of the tooth is a FIRE image or the like which is generated from both a reflectance image and a fluorescence image. Particularly, the reflectance image is generated using white or single color light, while the fluorescence image is generated under excitation light in the ultraviolet-blue range. Duringstep 130 of identifying a sound region adjacent to the extracted lesion area, the fluorescence image may substitute the FIRE image as input, indicated by the dashedarrow 160a. Duringstep 140 of reconstructing intensity values within a lesion area and step 150 of quantifying the condition of the caries areas, the fluorescence image is also needed as input, indicated by thearrow 160. -
FIG. 6B shows yet another method for quantifyingcaries using step 120 of the prevent invention. It is similar toFIG. 6A , but differs instep 120 which specifically comprises steps of identifying thetooth regions 165 from a tooth image, extracting a suspicious lesion area, and removing false positives. The dashedarrow 160a shows that the fluorescence image may be used forstep 130, and thearrow 160 shows that the fluorescence image is used forsteps - In another alternative method for quantifying
caries using step 120 of the prevent invention, referring back toFIG.1 , the digital image generated instep 110 is a fluorescence image of the tooth. As discussed previously, the fluorescence image has similar characteristics as the FIRE image, and so the methods used in the lesionareas extraction step 120 can all be carried out on the fluorescence image. Therefore, in this alternative embodiment, the fluorescence image is used in all steps fromStep 110 to Step 150. - The invention has been described in detail with particular reference to a presently preferred embodiment, but it will be understood that variations and modifications can be effected within the spirit and scope of the invention. The presently disclosed embodiments are therefore considered in all respects to be illustrative and not restrictive. The scope of the invention is indicated by the appended claims, and all changes that come within the meaning and range of equivalents thereof are intended to be embraced therein.
-
- 110
- step of generating a digital image of a tooth
- 120
- step of extracting a lesion area from sound tooth regions
- 130
- step of identifying a sound region adjacent to the extracted lesion area
- 140
- step of reconstructing intensity values for tooth tissue within the lesion area
- 150
- step of calculating the condition of the caries
- 160, 160a
- arrow
- 161
- region of interest
- 162
- lesion area (or region of caries)
- 163
- segmentation border
- 164
- sound tooth area
- 165
- tooth region
- 165a, 165b, 165c
- tooth
- 166
- dilated line
- 167
- reflectance image
- 168
- fluorescence image
- 169
- FIRE image
- 170
- water basin corresponding to the circular
internal marker area 222 - 172a, 172b, 172c, 172d
- water basins
- 173a, 173b
- watershed lines
- 174a
- region corresponding to
water basin 170 - 174b
- region corresponding to a combination of
water basins - 174c
- region corresponding to a combination of
water basins - 176
- interlines between teeth
- 180
- processing apparatus
- 200
- origin point
- 202
- contour line
- 210
- ray lines
- 220a, 220b, 220c, 220d
- gray areas corresponding to internal markers
- 222
- circular area on the target tooth corresponding to internal markers
- 224
- light areas corresponding to an external marker
- 230a, 230b, 230c
- seeded areas
- 232a, 232b
- external markers
- 234a, 234b, 234c
- seed points
- 236a, 236b, 236c
- internal markers
- 238a, 238b, 238c
- water basin regions
- 240a, 240b
- interlines
Claims (4)
- A method for extracting, from a digital image of a tooth, one or more lesion areas from sound regions of the tooth, comprising:accessing the digital image of the tooth;identifying one or more tooth regions by processing the digital image of the tooth;extracting one or more suspicious lesion areas from the digital image of the tooth by applying a marker-controlled watershed algorithm or by applying a morphological bottom-hat based method along with a multi-resolution surface reconstruction method; andidentifying and removing one or more false positives from the extracted one or more suspicious lesion areas.
- The method of claim 1, wherein accessing the digital image of the tooth comprises obtaining a fluorescence image of the tooth.
- The method of claim 1, wherein accessing the digital image of the tooth comprises:obtaining a fluorescence image of the tooth;obtaining a reflectance image of the tooth; andcombining image data for the fluorescence and reflectance images.
- The method of claim 1 wherein identifying the one or more tooth regions comprises:generating a first threshold image from a grayscale fluorescence image of the tooth by selecting intensity data values higher than a first predetermined threshold value c1;generating a second threshold image from a grayscale reflectance image of the tooth by selecting intensity data values higher than a second predetermined threshold value c2;generating a preliminary tooth regions image from the intersection of the first and second threshold images;generating a reference binary image from the grayscale fluorescence image by selecting intensity data values higher than a third predetermined threshold value c3, wherein threshold value c3 exceeds threshold value c1; andgenerating a refined tooth regions image from regions that are in the preliminary tooth regions image and are connected to objects in the reference binary image.5. The method of claim 4, wherein one or both of the grayscale fluorescence image and the grayscale reflectance image are obtained from the green channels of the fluorescence image and reflectance image, respectively.6. The method of claim 1 further comprising identifying the one or more tooth regions using thresholding.7. The method of claim 1, wherein removing the one or more false positives comprises locating one or more interproximal regions and removing one or more interproximal false positives.8. The method of claim 1, wherein extracting the one or more suspicious lesion areas further comprises:identifying one or more internal markers from the digital image of the tooth;identifying one or more external markers from the digital image of the tooth;forming a gradient image from the digital image of the tooth; andapplying a marker-controlled watershed transformation to the gradient image.9. The method of claim 1, wherein applying the morphological bottom-hat based method along with the multi-resolution surface reconstruction method comprises:applying a bottom-hat operation to the digital image of the tooth at a first resolution to produce an original bottom-hat image;down-sampling the original bottom-hat image to form one or more down-sampled bottom-hat images, wherein each down-sampled bottom hat image is at a resolution that is reduced from the first resolution;applying the morphological bottom hat method to the original bottom-hat image and to the one or more down-sampled bottom-hat images to form a plurality of morphological bottom-hat processed images;applying a threshold operation to each of the plurality of morphological bottom-hat processed images to form a plurality of binary bottom-hat processed images;interpolating each of the plurality of binary bottom-hat processed images to the first resolution to form a plurality of interpolated images; andidentifying one or more suspicious lesion areas as a union of the plurality of interpolated images.10. The method of claim 7, wherein locating the one or more interproximal regions comprises locating at least a first interproximal region that has clear demarcation with the steps of:applying a distance transformation to a binary image of the digital image of the tooth to locate the pixel lying within an identified tooth region with the largest distance measured from the boundary of the identified tooth region in the binary image;assigning the identified tooth region that is connected to the located pixel as a first object;assigning the identified tooth region that is not connected to the located pixel as a second object; anddefining at least the first interproximal region to be the pixels in the background having substantially the same distance to the first and second objects.11. The method of claim 7, wherein locating the one or more interproximal regions includes locating at least a first interproximal region that lacks clear demarcation, comprising:defining an origin point in a binary image of the tooth;casting a fan of ray lines outward from the origin point in a plurality of angles;defining a contour line at points at which each ray line first encounters the boundary between tooth and background areas,determining internal and external markers from the digital image of the tooth;applying a marker-controlled watershed transformation to a gradient image of a grayscale version of the digital image of the tooth with the internal and external markers to form first and second groups of water basins; andidentifying at least the first interproximal region as those pixels having substantially the same distance to the first and second groups of water basins.12. The method of claim 7, wherein locating the one or more interproximal regions includes locating interproximal regions, comprising:applying a distance transformation to a binary image of the digital image of the tooth to form a distance image in which each pixel value represents the closest distance of that pixel to the background of the teeth;determining internal and external markers according to the distance image;applying a marker-controlled watershed transformation to a gradient image of a grayscale version of the digital image of the tooth using the internal and external markers to form two groups of water basins; andidentifying at least a first interproximal region as those pixels having substantially the same distance to the two groups of water basins.13. The method of claim 1 further comprising displaying the one or more extracted lesion areas.14. A method for extracting, from a digital image of a tooth, at least one lesion area from sound regions of a tooth, comprising:accessing a digital image of the tooth;identifying tooth regions from within the digital image of the tooth;extracting one or more suspicious lesion areas according to the identified tooth regions; andremoving one or more false positives from the extracted one or more suspicious lesion areas.15. A method for extracting a lesion area from sound regions of a tooth, comprising:generating a digital image of the tooth comprising obtaining a fluorescence image of the tooth, obtaining a reflectance image of the tooth, and combining image data for the fluorescence and reflectance images;identifying one or more tooth regions by processing the digital image of the tooth;extracting one or more suspicious lesion areas from the digital image of the tooth; andidentifying and removing one or more false positives from the one or more extracted suspicious lesion areas.
Applications Claiming Priority (1)
| Application Number | Priority Date | Filing Date | Title |
|---|---|---|---|
| US12/578,806 US8908936B2 (en) | 2009-10-14 | 2009-10-14 | Method for extracting a carious lesion area |
Publications (1)
| Publication Number | Publication Date |
|---|---|
| EP2348484A1 true EP2348484A1 (en) | 2011-07-27 |
Family
ID=43498636
Family Applications (1)
| Application Number | Title | Priority Date | Filing Date |
|---|---|---|---|
| EP10013637A Withdrawn EP2348484A1 (en) | 2009-10-14 | 2010-10-14 | Method for extracting a carious lesion area |
Country Status (4)
| Country | Link |
|---|---|
| US (1) | US8908936B2 (en) |
| EP (1) | EP2348484A1 (en) |
| JP (1) | JP2011103118A (en) |
| KR (1) | KR20110040739A (en) |
Cited By (1)
| Publication number | Priority date | Publication date | Assignee | Title |
|---|---|---|---|---|
| JP2017524935A (en) * | 2014-07-24 | 2017-08-31 | ユニバーシティー ヘルス ネットワーク | Data collection and analysis for diagnostic purposes |
Families Citing this family (21)
| Publication number | Priority date | Publication date | Assignee | Title |
|---|---|---|---|---|
| CA2724973C (en) | 2008-05-20 | 2015-08-11 | University Health Network | Device and method for fluorescence-based imaging and monitoring |
| US8768016B2 (en) | 2009-06-19 | 2014-07-01 | Carestream Health, Inc. | Method for quantifying caries |
| US8908936B2 (en) | 2009-10-14 | 2014-12-09 | Carestream Health, Inc. | Method for extracting a carious lesion area |
| US9235901B2 (en) * | 2009-10-14 | 2016-01-12 | Carestream Health, Inc. | Method for locating an interproximal tooth region |
| US8687859B2 (en) * | 2009-10-14 | 2014-04-01 | Carestream Health, Inc. | Method for identifying a tooth region |
| US9486141B2 (en) | 2011-08-09 | 2016-11-08 | Carestream Health, Inc. | Identification of dental caries in live video images |
| KR20130054920A (en) * | 2011-11-17 | 2013-05-27 | 주식회사 엘지화학 | Aqueous dispersion composition, environmentally friendly backsheet of photovoltaic modules, and method for preparation thereof |
| KR101981708B1 (en) | 2012-01-03 | 2019-05-23 | 삼성전자주식회사 | Diagnosis apparatus for lesion able to determine regulation for shape of lesion and diagnosis method thereof |
| JP5974640B2 (en) * | 2012-06-01 | 2016-08-23 | ソニー株式会社 | Dental apparatus and information processing apparatus |
| EP2866644B1 (en) | 2012-06-27 | 2023-11-08 | 3Shape A/S | 3d intraoral scanner measuring fluorescence |
| RU2012156158A (en) * | 2012-12-24 | 2014-07-10 | ЭлЭсАй Корпорейшн | TARGET IMAGE GENERATION USING A FUNCTIONAL BASED ON FUNCTIONS FROM INFORMATION FROM OTHER IMAGES |
| JP6523642B2 (en) * | 2014-09-26 | 2019-06-05 | テルモ株式会社 | Diagnostic imaging device |
| US9870613B2 (en) * | 2014-11-05 | 2018-01-16 | Carestream Health, Inc. | Detection of tooth condition using reflectance images with red and green fluorescence |
| JP6459410B2 (en) * | 2014-11-07 | 2019-01-30 | カシオ計算機株式会社 | Diagnostic device, image processing method in the diagnostic device, and program thereof |
| JP6448356B2 (en) * | 2014-12-22 | 2019-01-09 | キヤノン株式会社 | Image processing apparatus, image processing method, image processing system, and program |
| JP6361501B2 (en) * | 2014-12-26 | 2018-07-25 | カシオ計算機株式会社 | Diagnostic equipment |
| KR20160140232A (en) | 2015-05-29 | 2016-12-07 | 조선대학교산학협력단 | Image segmentation method |
| WO2018049064A1 (en) * | 2016-09-08 | 2018-03-15 | Abbott Laboratories | Automated body fluid analysis |
| KR102133291B1 (en) * | 2018-08-07 | 2020-07-13 | 연세대학교 산학협력단 | Method of providing the information for evaluating the degree of tooth wear |
| TWI818372B (en) * | 2021-12-03 | 2023-10-11 | 財團法人金屬工業研究發展中心 | Oral cavity detecting system |
| CN117788569B (en) * | 2024-02-23 | 2024-05-07 | 陕西省人民医院(陕西省临床医学研究院) | Method and system for positioning abnormal points of oral cavity based on image features |
Citations (11)
| Publication number | Priority date | Publication date | Assignee | Title |
|---|---|---|---|---|
| US4479499A (en) | 1982-01-29 | 1984-10-30 | Alfano Robert R | Method and apparatus for detecting the presence of caries in teeth using visible light |
| US4515476A (en) | 1981-04-01 | 1985-05-07 | Bjelkhagen Hans Ingmar | Device for the ocular determination of any discrepancy in the luminescence capacity of the surface of a tooth for the purpose of identifying any caried area on the surface to the tooth |
| US6231338B1 (en) | 1999-05-10 | 2001-05-15 | Inspektor Research Systems B.V. | Method and apparatus for the detection of carious activity of a carious lesion in a tooth |
| US20040202356A1 (en) | 2003-04-10 | 2004-10-14 | Stookey George K. | Optical detection of dental caries |
| WO2004104927A2 (en) * | 2003-05-22 | 2004-12-02 | Inspektor Research Systems B.V. | Analysis and display of fluorescence images |
| US20070099148A1 (en) | 2005-10-31 | 2007-05-03 | Eastman Kodak Company | Method and apparatus for detection of caries |
| US20080056551A1 (en) | 2006-08-31 | 2008-03-06 | Wong Victor C | Method for detection of caries |
| US20080063998A1 (en) | 2006-09-12 | 2008-03-13 | Rongguang Liang | Apparatus for caries detection |
| US20080170764A1 (en) | 2007-01-17 | 2008-07-17 | Burns Peter D | System for early detection of dental caries |
| EP2083389A2 (en) * | 2008-01-22 | 2009-07-29 | Carestream Health, Inc. | Method for a real-time visualization of caries condition |
| EP2312527A2 (en) * | 2009-06-19 | 2011-04-20 | Carestream Health, Inc. | Method for quantifying caries |
Family Cites Families (19)
| Publication number | Priority date | Publication date | Assignee | Title |
|---|---|---|---|---|
| CA1288176C (en) | 1987-10-29 | 1991-08-27 | David C. Hatcher | Method and apparatus for improving the alignment of radiographic images |
| US7027642B2 (en) | 2000-04-28 | 2006-04-11 | Orametrix, Inc. | Methods for registration of three-dimensional frames to create three-dimensional virtual models of objects |
| US20040184643A1 (en) | 2003-03-21 | 2004-09-23 | Stantchev Gueorgui H. | Methods and apparatus for imaging |
| CA2519187A1 (en) * | 2003-03-25 | 2004-10-14 | Imaging Therapeutics, Inc. | Methods for the compensation of imaging technique in the processing of radiographic images |
| FR2856546B1 (en) | 2003-06-17 | 2005-11-04 | Centre Nat Rech Scient | METHOD AND DEVICE FOR ACQUIRING AND PROCESSING IMAGES OF AN OBJECT SUCH AS A TOOTH |
| US7305111B2 (en) * | 2004-01-30 | 2007-12-04 | University Of Chicago | Automated method and system for the detection of lung nodules in low-dose CT images for lung-cancer screening |
| US7324661B2 (en) | 2004-04-30 | 2008-01-29 | Colgate-Palmolive Company | Computer-implemented system and method for automated and highly accurate plaque analysis, reporting, and visualization |
| US7796243B2 (en) | 2004-06-09 | 2010-09-14 | National Research Council Of Canada | Detection and monitoring of changes in mineralized tissues or calcified deposits by optical coherence tomography and Raman spectroscopy |
| US7270543B2 (en) | 2004-06-29 | 2007-09-18 | Therametric Technologies, Inc. | Handpiece for caries detection |
| JP2009501579A (en) | 2005-07-18 | 2009-01-22 | マンデリス,アンドレアス | Method and apparatus for diagnosing dental defects using infrared photothermal radiometry (PTR) and modulated laser luminescence (LUM) |
| JP4450776B2 (en) | 2005-07-22 | 2010-04-14 | 株式会社日立ハイテクノロジーズ | Defect inspection method and appearance inspection apparatus |
| US20070053491A1 (en) | 2005-09-07 | 2007-03-08 | Eastman Kodak Company | Adaptive radiation therapy method with target detection |
| US7577284B2 (en) * | 2006-04-21 | 2009-08-18 | Carestream Health, Inc. | Optical detection of dental caries |
| US20080062429A1 (en) | 2006-09-12 | 2008-03-13 | Rongguang Liang | Low coherence dental oct imaging |
| US8447087B2 (en) | 2006-09-12 | 2013-05-21 | Carestream Health, Inc. | Apparatus and method for caries detection |
| US8712139B2 (en) * | 2008-03-21 | 2014-04-29 | General Electric Company | Methods and systems for automated segmentation of dense cell populations |
| US8908936B2 (en) | 2009-10-14 | 2014-12-09 | Carestream Health, Inc. | Method for extracting a carious lesion area |
| US9235901B2 (en) | 2009-10-14 | 2016-01-12 | Carestream Health, Inc. | Method for locating an interproximal tooth region |
| US8311302B2 (en) | 2010-12-13 | 2012-11-13 | Carestream Health, Inc. | Method for identification of dental caries in polychromatic images |
-
2009
- 2009-10-14 US US12/578,806 patent/US8908936B2/en active Active
-
2010
- 2010-10-08 JP JP2010228897A patent/JP2011103118A/en not_active Withdrawn
- 2010-10-14 KR KR1020100100540A patent/KR20110040739A/en not_active Withdrawn
- 2010-10-14 EP EP10013637A patent/EP2348484A1/en not_active Withdrawn
Patent Citations (12)
| Publication number | Priority date | Publication date | Assignee | Title |
|---|---|---|---|---|
| US4515476A (en) | 1981-04-01 | 1985-05-07 | Bjelkhagen Hans Ingmar | Device for the ocular determination of any discrepancy in the luminescence capacity of the surface of a tooth for the purpose of identifying any caried area on the surface to the tooth |
| US4479499A (en) | 1982-01-29 | 1984-10-30 | Alfano Robert R | Method and apparatus for detecting the presence of caries in teeth using visible light |
| US6231338B1 (en) | 1999-05-10 | 2001-05-15 | Inspektor Research Systems B.V. | Method and apparatus for the detection of carious activity of a carious lesion in a tooth |
| US20040202356A1 (en) | 2003-04-10 | 2004-10-14 | Stookey George K. | Optical detection of dental caries |
| WO2004104927A2 (en) * | 2003-05-22 | 2004-12-02 | Inspektor Research Systems B.V. | Analysis and display of fluorescence images |
| US20040240716A1 (en) | 2003-05-22 | 2004-12-02 | De Josselin De Jong Elbert | Analysis and display of fluorescence images |
| US20070099148A1 (en) | 2005-10-31 | 2007-05-03 | Eastman Kodak Company | Method and apparatus for detection of caries |
| US20080056551A1 (en) | 2006-08-31 | 2008-03-06 | Wong Victor C | Method for detection of caries |
| US20080063998A1 (en) | 2006-09-12 | 2008-03-13 | Rongguang Liang | Apparatus for caries detection |
| US20080170764A1 (en) | 2007-01-17 | 2008-07-17 | Burns Peter D | System for early detection of dental caries |
| EP2083389A2 (en) * | 2008-01-22 | 2009-07-29 | Carestream Health, Inc. | Method for a real-time visualization of caries condition |
| EP2312527A2 (en) * | 2009-06-19 | 2011-04-20 | Carestream Health, Inc. | Method for quantifying caries |
Non-Patent Citations (10)
| Title |
|---|
| ANDREAS RICK ET AL: "Quantitative Modelling of Microcalcification Detection in Digital Mammography", MEDICAL IMAGE COMPUTING AND COMPUTER-ASSISTED INTERVENTION - MIC CAI'99 LECTURE NOTES IN COMPUTER SCIENCE;;LNCS, SPRINGER, BERLIN, DE, vol. 1679, 1 January 2006 (2006-01-01), pages 32 - 41, XP019036183, ISBN: 978-3-540-66503-8 * |
| DUDA, R.; HART, P.: "Pattern Classification and Scene Analysis", 1973, JOHN WILEY AND SONS, pages: 271 - 272 |
| LUC VINCENT, MORPHOLOGICAL GRAYSCALE RECONSTRUCTION IN IMAGE ANALYSIS: APPLICATIONS AND EFFICIENT ALGORITHMS, vol. 2, no. 2, 1993, pages 176 - 201 |
| PRETTY ET AL: "Caries detection and diagnosis: Novel technologies", JOURNAL OF DENTISTRY, ELSEVIER, vol. 34, no. 10, 1 November 2006 (2006-11-01), pages 727 - 739, XP005706555, ISSN: 0300-5712 * |
| PRETTY I A ET AL: "Quantification of dental plaque in the research environment", JOURNAL OF DENTISTRY, ELSEVIER, vol. 33, no. 3, 1 March 2005 (2005-03-01), pages 193 - 207, XP004756936, ISSN: 0300-5712, DOI: 10.1016/J.JDENT.2004.10.017 * |
| RICARDO FABBRI; LUCIANO DA F. COSTA; JULIO C. TORELLI; ODEMIR M. BRUNO: "2D Euclidean distance transform algorithms: a comparative survey", ACM COMPUTING SURVEYS, vol. 40, 2008 |
| ROSENFELD, A.; PFALTZ, J.: "Sequential operations in digital picture processing", J. ACM., vol. 13, 1966 |
| SUSANTA MUKHOPADHYAY ET AL: "Multiscale Morphological Segmentation of Gray-Scale Images", IEEE TRANSACTIONS ON IMAGE PROCESSING, IEEE SERVICE CENTER, PISCATAWAY, NJ, US, vol. 12, no. 5, 1 May 2003 (2003-05-01), XP011074394, ISSN: 1057-7149 * |
| VINCENT L: "MORPHOLOGICAL GRAYSCALE RECONSTRUCTION IN IMAGE ANALYSIS: APPLICATIONS AND EFFICIENT ALGORITHMS", IEEE TRANSACTIONS ON IMAGE PROCESSING, IEEE SERVICE CENTER, PISCATAWAY, NJ, US, vol. 2, no. 2, 1 April 1993 (1993-04-01), pages 176 - 201, XP000380857, ISSN: 1057-7149, DOI: 10.1109/83.217222 * |
| VINCENT: "Morphological grayscale reconstruction in image analysis: applications and efficient algorithms", IEEE TRANSACTION ON IMAGE PROCESSING, vol. 2, 1993, pages 176 - 201 |
Cited By (1)
| Publication number | Priority date | Publication date | Assignee | Title |
|---|---|---|---|---|
| JP2017524935A (en) * | 2014-07-24 | 2017-08-31 | ユニバーシティー ヘルス ネットワーク | Data collection and analysis for diagnostic purposes |
Also Published As
| Publication number | Publication date |
|---|---|
| JP2011103118A (en) | 2011-05-26 |
| KR20110040739A (en) | 2011-04-20 |
| US8908936B2 (en) | 2014-12-09 |
| US20110085714A1 (en) | 2011-04-14 |
Similar Documents
| Publication | Publication Date | Title |
|---|---|---|
| EP2312528B1 (en) | Method for identifying a tooth region | |
| EP2312529B1 (en) | A method for locating an interproximal tooth region | |
| US8768016B2 (en) | Method for quantifying caries | |
| US8908936B2 (en) | Method for extracting a carious lesion area | |
| US9870613B2 (en) | Detection of tooth condition using reflectance images with red and green fluorescence | |
| EP2688479B1 (en) | A method for tooth surface classification | |
| US9547903B2 (en) | Method for quantifying caries | |
| CN113811916B (en) | System and method for generating digital three-dimensional tooth models | |
| EP2463823A1 (en) | Method for identification of dental caries in polychromatic images | |
| CN119184895A (en) | Second mesial root canal measurement method, device and storage medium |
Legal Events
| Date | Code | Title | Description |
|---|---|---|---|
| PUAI | Public reference made under article 153(3) epc to a published international application that has entered the european phase |
Free format text: ORIGINAL CODE: 0009012 |
|
| AK | Designated contracting states |
Kind code of ref document: A1 Designated state(s): AL AT BE BG CH CY CZ DE DK EE ES FI FR GB GR HR HU IE IS IT LI LT LU LV MC MK MT NL NO PL PT RO RS SE SI SK SM TR |
|
| AX | Request for extension of the european patent |
Extension state: BA ME |
|
| 17P | Request for examination filed |
Effective date: 20120127 |
|
| 17Q | First examination report despatched |
Effective date: 20130207 |
|
| STAA | Information on the status of an ep patent application or granted ep patent |
Free format text: STATUS: THE APPLICATION IS DEEMED TO BE WITHDRAWN |
|
| 18D | Application deemed to be withdrawn |
Effective date: 20130618 |