EP2336918A1 - Method and system for modeling the performance of a gas turbine engine - Google Patents
Method and system for modeling the performance of a gas turbine engine Download PDFInfo
- Publication number
- EP2336918A1 EP2336918A1 EP10252149A EP10252149A EP2336918A1 EP 2336918 A1 EP2336918 A1 EP 2336918A1 EP 10252149 A EP10252149 A EP 10252149A EP 10252149 A EP10252149 A EP 10252149A EP 2336918 A1 EP2336918 A1 EP 2336918A1
- Authority
- EP
- European Patent Office
- Prior art keywords
- data
- training data
- orientation
- module
- flight condition
- Prior art date
- Legal status (The legal status is an assumption and is not a legal conclusion. Google has not performed a legal analysis and makes no representation as to the accuracy of the status listed.)
- Ceased
Links
Images

Classifications
-
- G—PHYSICS
- G06—COMPUTING OR CALCULATING; COUNTING
- G06F—ELECTRIC DIGITAL DATA PROCESSING
- G06F30/00—Computer-aided design [CAD]
- G06F30/20—Design optimisation, verification or simulation
- G06F30/27—Design optimisation, verification or simulation using machine learning, e.g. artificial intelligence, neural networks, support vector machines [SVM] or training a model
-
- F—MECHANICAL ENGINEERING; LIGHTING; HEATING; WEAPONS; BLASTING
- F02—COMBUSTION ENGINES; HOT-GAS OR COMBUSTION-PRODUCT ENGINE PLANTS
- F02C—GAS-TURBINE PLANTS; AIR INTAKES FOR JET-PROPULSION PLANTS; CONTROLLING FUEL SUPPLY IN AIR-BREATHING JET-PROPULSION PLANTS
- F02C9/00—Controlling gas-turbine plants; Controlling fuel supply in air- breathing jet-propulsion plants
-
- G—PHYSICS
- G05—CONTROLLING; REGULATING
- G05B—CONTROL OR REGULATING SYSTEMS IN GENERAL; FUNCTIONAL ELEMENTS OF SUCH SYSTEMS; MONITORING OR TESTING ARRANGEMENTS FOR SUCH SYSTEMS OR ELEMENTS
- G05B17/00—Systems involving the use of models or simulators of said systems
- G05B17/02—Systems involving the use of models or simulators of said systems electric
-
- G—PHYSICS
- G05—CONTROLLING; REGULATING
- G05B—CONTROL OR REGULATING SYSTEMS IN GENERAL; FUNCTIONAL ELEMENTS OF SUCH SYSTEMS; MONITORING OR TESTING ARRANGEMENTS FOR SUCH SYSTEMS OR ELEMENTS
- G05B23/00—Testing or monitoring of control systems or parts thereof
- G05B23/02—Electric testing or monitoring
- G05B23/0205—Electric testing or monitoring by means of a monitoring system capable of detecting and responding to faults
- G05B23/0259—Electric testing or monitoring by means of a monitoring system capable of detecting and responding to faults characterized by the response to fault detection
- G05B23/0283—Predictive maintenance, e.g. involving the monitoring of a system and, based on the monitoring results, taking decisions on the maintenance schedule of the monitored system; Estimating remaining useful life [RUL]
-
- G—PHYSICS
- G06—COMPUTING OR CALCULATING; COUNTING
- G06F—ELECTRIC DIGITAL DATA PROCESSING
- G06F30/00—Computer-aided design [CAD]
- G06F30/20—Design optimisation, verification or simulation
-
- F—MECHANICAL ENGINEERING; LIGHTING; HEATING; WEAPONS; BLASTING
- F05—INDEXING SCHEMES RELATING TO ENGINES OR PUMPS IN VARIOUS SUBCLASSES OF CLASSES F01-F04
- F05D—INDEXING SCHEME FOR ASPECTS RELATING TO NON-POSITIVE-DISPLACEMENT MACHINES OR ENGINES, GAS-TURBINES OR JET-PROPULSION PLANTS
- F05D2270/00—Control
- F05D2270/70—Type of control algorithm
- F05D2270/709—Type of control algorithm with neural networks
-
- G—PHYSICS
- G05—CONTROLLING; REGULATING
- G05B—CONTROL OR REGULATING SYSTEMS IN GENERAL; FUNCTIONAL ELEMENTS OF SUCH SYSTEMS; MONITORING OR TESTING ARRANGEMENTS FOR SUCH SYSTEMS OR ELEMENTS
- G05B23/00—Testing or monitoring of control systems or parts thereof
- G05B23/02—Electric testing or monitoring
- G05B23/0205—Electric testing or monitoring by means of a monitoring system capable of detecting and responding to faults
- G05B23/0218—Electric testing or monitoring by means of a monitoring system capable of detecting and responding to faults characterised by the fault detection method dealing with either existing or incipient faults
- G05B23/0224—Process history based detection method, e.g. whereby history implies the availability of large amounts of data
- G05B23/024—Quantitative history assessment, e.g. mathematical relationships between available data; Functions therefor; Principal component analysis [PCA]; Partial least square [PLS]; Statistical classifiers, e.g. Bayesian networks, linear regression or correlation analysis; Neural networks
-
- G—PHYSICS
- G05—CONTROLLING; REGULATING
- G05B—CONTROL OR REGULATING SYSTEMS IN GENERAL; FUNCTIONAL ELEMENTS OF SUCH SYSTEMS; MONITORING OR TESTING ARRANGEMENTS FOR SUCH SYSTEMS OR ELEMENTS
- G05B23/00—Testing or monitoring of control systems or parts thereof
- G05B23/02—Electric testing or monitoring
- G05B23/0205—Electric testing or monitoring by means of a monitoring system capable of detecting and responding to faults
- G05B23/0218—Electric testing or monitoring by means of a monitoring system capable of detecting and responding to faults characterised by the fault detection method dealing with either existing or incipient faults
- G05B23/0243—Electric testing or monitoring by means of a monitoring system capable of detecting and responding to faults characterised by the fault detection method dealing with either existing or incipient faults model based detection method, e.g. first-principles knowledge model
- G05B23/0254—Electric testing or monitoring by means of a monitoring system capable of detecting and responding to faults characterised by the fault detection method dealing with either existing or incipient faults model based detection method, e.g. first-principles knowledge model based on a quantitative model, e.g. mathematical relationships between inputs and outputs; functions: observer, Kalman filter, residual calculation, Neural Networks
-
- G—PHYSICS
- G06—COMPUTING OR CALCULATING; COUNTING
- G06F—ELECTRIC DIGITAL DATA PROCESSING
- G06F2111/00—Details relating to CAD techniques
- G06F2111/10—Numerical modelling
Definitions
- the present invention relates generally to the field of mathematical and empirical modeling. More specifically, the invention relates to a method and system for modeling the performance of a gas turbine engine.
- SVM piecewise linear state variable models
- Modeling using physics-based principles is a crucial element in conditional based monitoring and engine health management for gas turbine engines.
- modem gas turbine engines have complex mechanical systems that are, practically speaking, difficult to accurately model and represent using physics-based principles.
- the modeling difficulties associated with engine complexity are exacerbated by noisy or inaccurate sensors, engine-to-engine variations, and complex modifications made to engines during their life time. Consequently, it is very difficult to model a gas turbine engine with high fidelity using only a physics-based model component.
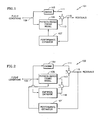
- FIG. 1 illustrates a schematic diagram of an engine model 101 used for performance tracking.
- the major components include the monitored engine 103, a physics-based engine model 105 and a performance estimation module 107.
- the physics-based engine model 105 is typically an SVM and the performance estimation module 107 can be a Kalman filter observer.
- the engine model 101 is driven by a set of input parameters 109 that command the engine 103.
- the input parameters 109 comprise flight parameters such as Mach number, altitude, ambient conditions (e.g., temperature and pressure) and others, and power setting parameters such as engine pressure ratio (EPR), engine low rotor speed, fan pressure ratio (FPR), and engine control parameters such as engine bleed air commands, variable geometry vane commands and others.
- the monitored engine output data 111 comprises data pertaining to gas path parameters (GPP) such as fuel, flow, internal shaft speeds, compressor, combustor and turbine temperatures and pressures and others.
- the physics-based engine model 105 outputs estimated parameter data 113 corresponding to each engine output parameter 111.
- the estimated parameter data 113 may be used for a variety of purposes.
- the parameter data 113 provide for analytical redundancy if a channel mismatch were to occur, for example, in a multichannel redundant system such as a Full Authority Digital Engine Control (FADEC) (not shown), serving as an auctioneer between two redundant signals that have different values.
- FADEC Full Authority Digital Engine Control
- the physics-based engine model 105 estimated output parameter data 113 are compared with the engine output parameter data 111 to form residuals 115. If the physics-based engine model 105 is an accurate representation of the monitored engine 103 and if the engine is performing under nominal conditions, the residuals 115 should be close to zero on the average. The residuals represent the difference between an actual engine output data 111 and the related engine model estimated output data 113. The magnitude of the residuals indicates the accuracy of the physics-based engine model 105. However, as the operating time of an engine increases beyond a certain point, its performance typically decreases and the residuals 115 deviate from zero.
- the performance estimator 107 uses the residuals 115 to observe changes in performance across the engine's modules (e.g., compressor, combustor, turbine, etc.), in the form of adiabatic efficiencies, flow capacities, and turbine nozzle area deltas.
- This type of analysis is referred to as Gas Path Analysis (GPA) or Module Performance Analysis (MPA).
- GPS Gas Path Analysis
- MPA Module Performance Analysis
- the disparities between the physics-based engine model 105 and engine 103 outputs are used to modify the performance output of the engine model estimated outputs 113 to drive the residuals 115 to zero (on the average). In this manner, the physics-based engine model estimated outputs 113 more accurately reflect the current state of the engine 103 and the module performance deltas can be tracked over time to aid in determining proper engine work scope when the engine is removed for maintenance.
- the model 101 described above and shown in FIG. 1 represents an ideal situation where the physics-based engine model 105 is a faithful representation of the engine 103 being monitored.
- the physics-based engine model 105 typically does not hold true in practice.
- Engine-to-engine variations, models simplified in order to save processing time, deviations caused by complicated improvements to the engine's hardware, bleed and stator vane schedules, cooling flows, handling bleeds, etc., over the engine's life cycle are not reflected in the model 105 and contribute to output disparities between the physics-based engine model 105 and engine 103.
- the disparities result in inaccurate estimations in the module performance tracking for the model 101 which can result in unnecessary engine maintenance or removals, etc. Due to the penalties and high costs associated with such events, this is undesirable for both engine manufacturers and airliners.
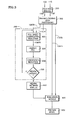
- FIG.2 illustrates an engine model 102 that is a variation of the model 101 shown in FIG. 1 , wherein the input parameters 109 are stored in a database along with the residuals associated with those input parameters.
- This database is used for viewing the performance of the engine over a period of time. Once developed, output 116 from this database is used for empirical fine tuning of the physics-based engine model 105.
- this engine model 102 represents an improvement over the model 101 shown in FIG. 1 , it can still be subject to data biases and correlations and therefore inaccurate.
- a method for modeling the performance of a gas turbine engine includes the steps of: 1) providing a processor; 2) inputting flight condition parameter data and engine output parameter data into a gas turbine engine model operating on the processor, which model includes a physics-based engine model that uses the flight condition parameter data to produce estimated engine output parameter data, and determines residuals from the engine output parameter data and the estimated engine output parameter data; 3) partitioning the flight condition parameter data and residuals into training data and testing data; 4) performing a correlation reduction on the training data, which analysis produces correlation adjusted training data; 5) performing an orientation reduction on the correlation adjusted training data, which reduction produces orientation adjusted training data; 6) reviewing the orientation adjusted training data relative to at least one predetermined criteria, and iteratively repeating the steps of performing a correlation reduction and an orientation reduction using the orientation adjusted training data if the criteria is not satisfied, and if the criteria is satisfied outputting the orientation adjusted training data; 7) producing estimated corrections to the orientation adjusted training data using one or more neural networks; 8) evaluating
- a system for modeling the performance of a gas turbine engine includes a processor adapted to: a) receive flight condition parameter data and engine output parameter data; and b) have a physics based engine model that uses the flight condition parameter data to produce estimated engine output parameter data, and which model determines residual data from the engine output parameter data and the estimated engine output parameter data.
- the processor includes: a) a partitioning module for partitioning the flight condition parameter data and residual data into training data and testing data; b) a training module; c) a neural network module; and d) an evaluation module.
- the training module includes a correlation reduction module for reducing one or more correlations in the training data, which module produces correlation adjusted training data, an orientation reduction module for reducing one or more orientations in the correlation adjusted training data, which module produces orientation adjusted training data, and a review module for evaluating the orientation adjusted training data relative to at least one predetermined criteria, and directing the orientation adjusted training data iteratively within the training module if the criteria is not satisfied, and if the criteria is satisfied outputting the orientation adjusted training data.
- the neural network module is adapted to produce estimated corrections to the orientation adjusted training data using one or more neural networks.
- the evaluation model is adapted to evaluate the neural adjusted data using the partitioned testing data.
- the processor is further adapted to model the performance of the gas turbine using the estimated corrections to the orientation adjusted training data.
- FIG. 1 is a schematic of an engine model for a gas turbine engine.
- FIG. 2 is a schematic of another engine model for a gas turbine engine, including a database.
- FIG. 3 is a block diagram of the present method for modeling the performance of a gas turbine engine.
- FIG. 4A is a graph of input parameter data in PCA format, showing PC 1 data vs. PC2 data in unfiltered form.
- FIG. 4B is a graph of input parameter data in PCA format, showing PC I data vs. PC2 data in filtered form, with outliers removed.
- FIG. 5A is a graph of residual data values vs. flight condition data values prior to correlation reduction and orientation reduction.
- FIG. 5B is a graph of residual data values vs. flight condition data values with correlation reduction performed.
- FIG. 5C is a graph of residual data values vs. flight condition data values with orientation reduction performed.
- the present invention includes a method and system for modeling the performance of a gas turbine.
- the invention utilizes a modular framework and can be deployed as an application program within a processor, CPU, and/or tangibly embodied on a program storage device (e.g., deployed in the form of software, hardware, or some combination thereof).
- the application code for execution can reside on a plurality of different types of computer readable media known to those skilled in the art.
- the processing devices adapted to implement the present turbine engine performance models may be provided with the gas turbine engine or may be independent from the engine, adapted to receive data from the engine.
- various different engine models 101, 102 exist that are operable to create residual values for given flight condition parameters; e.g., Mach number, altitude, ambient conditions (e.g., temperature and pressure) and others, and power setting parameters such as engine pressure ratio (EPR), engine low rotor speed, fan pressure ratio (FPR), and engine control parameters such as engine bleed air commands, variable geometry vane commands and others.
- Some of the aforesaid engine models 102 include the ability to develop a database of residual and flight condition values.
- the present method of modeling the performance of a gas turbine engine utilizes such an engine model and builds upon it to create an engine model having significantly improved accuracy.
- An example of an acceptable engine model that produces residual values is shown in FIG. 2 .
- the present invention method of modeling is not limited to that engine model, however.
- the flight condition parameter values and the residual values are subjected to a Filtering Module 200 that identifies and removes outlying data points ("outliers").
- a Filtering Module 200 utilizes a Principal Component Analysis (PCA) to filter the data and thereby identify and remove outlying data points ("outliers") that would otherwise negatively affect the accuracy of the modeling.
- the inputs to the Filtering Module 200 include the flight condition parameters 109 and the residual values 115.
- the data input to the Filtering Module 200 is initially organized, for example in a matrix form with columns and rows.
- the number of columns reflects the number of different flight condition parameters.
- Each row in contrast, contains flight condition data associated with a distinct event (e.g., an engine flight) for each parameter.
- the number of rows is typically a large number (in the order of hundreds, or thousands), and increases with the life of the engine.
- the columns are organized within the matrix based on the relative degree of variance within the data; e.g., the flight condition parameter having the most variant data is positioned within the first column, the parameter having the second most variant data is positioned within the second column, etc.
- the difference in variance from column to column typically does not change linearly.
- the present method performs the PCA analysis using a matrix based on a limited number of columns; e.g., those columns most likely to contain a high percentage of outliers.
- a limited "N" number of columns referred to as PC1, PC2, etc.
- PC1, PC2 a limited "N” number of columns
- each with a high percentage of outliers the present filtration process is likely to identify a significant percentage of all outliers with limited processing demands.
- the present filtration step is not, however, limited to using a two column data matrix.
- a distance value is calculated (using the Euclidian distance metric) between a PCA signal based on the data points within each row (i.e., which signal is defined in terms of the values in that row; e.g., PC1, PC2) and an average value of all the PCA signals.
- This process creates an array of distance values ("scalar values") having the same number of rows as the original data matrix.
- a predetermined threshold value typically referred to as "K", having a magnitude, for example, between 1 and 3) is used for identifying outliers. All of the PCA signals having a scalar value above the threshold value (e.g., "K" times the standard deviation of the distance values) are identified.
- FIGS. 4A and 4B graphically illustrate the PCA analysis process.
- the data 109 is projected in two dimensions (i.e., PC1 and PC2) as a PCA signal, and the distance between each PCA signal and the average PCA signal (PC center ) is shown.
- the outliers present in most data sets are readily apparent as anomalies to the primary data group.
- FIG. 4B illustrates the data group with the outliers removed through filtration.
- the above described filtration process is a preferred process because of the accuracy gained with relatively low data processing requirements.
- the present method is not limited to this filtering process, and other processes may be used.
- the filtered signal data and residuals are subjected to a data partitioning within a data Partitioning Module 300.
- a predetermined percentage typically 60% to 80%
- the remaining percentage is defined as testing data (109TS, 115TS).
- the testing data is used within an Evaluation Module 900 as will be explained below.
- the partitioning percentages e.g., 60/40, 70/30, 80/20
- the training data (109TR, 115TR) from the Partitioning Module 300 are subsequently used within a Training Module 350 that includes a Correlation Reduction Module 400, an Orientation Reduction Module 600, and a Review Module 700.
- the training data is subjected serially to the Correlation Reduction Module 400, Orientation Reduction Module 600, and the Review Module 700 in an iterative process.
- certain criteria are applied to the training data. If one or more of the criteria are met, then the training data is passed onto a Neural Network Module 800. If no criteria are met, then the training data iteratively returns to the Correlation Reduction Module 400 and once again is passed through the Training Module 350.
- review criteria include data within an acceptable variance range, or data that has iteratively passed through the Training Module 350 a predetermined number of times. Other criteria may be used alternatively.
- the Correlation Reduction Module 400 operates to reduce non-uniformity in the residuals that can introduce biases and shape-shifts within the data.
- the 109TR portion of the training data is again subject to a PCA analysis.
- the PCA analysis is applied in the manner described above within the Filtering Module 300 with the exception that the PCA process is applied to the filtered data within all of the columns; i.e., each flight condition parameter is considered.
- the PCA transformed data is used for determining the scalar distance values corresponding to the data values in each row (109TR).
- the scalar values are arranged in a matrix having the same number of rows as the original data matrix, and the values are sorted in descending order from the most variant value to the least variant value.
- the most variant value is the greatest distance from the average scalar value, and is the one that is causing the highest correlation in the data.
- the most variant points in this Module 400 are adjusted rather than eliminated.
- the variant points are adjusted such that their contribution to the overall correlation is minimized after the adjustment. For example, while each point is adjusted, the points that have more variance are adjusted more than those with less variance.
- the adjustment is preferably performed in a gradual manner to prevent excessive adjustment.
- P after P before + ⁇ ⁇ P center - P before
- P before and P after are the position of a point in the PCA data before and after adjustments respectively.
- P center is the position of the center of the PCA cluster (PC1 average , PC2 average ).
- the constant value " ⁇ " is a learning constant that determines the rate of adjustment (typically between 0.1 and 0.5).
- FIG. 5A diagrammatically illustrates correlated data prior to the above-described correlation reduction.
- FIG. 5B illustrates the data after the correlation reduction is performed. It should be noted that the before and after depictions of correlated data illustrate a single iterative change. Using the present method the correlation reduction process may take several iterative steps.
- the Correlation Reduction Module 400 After the data has been adjusted within the Correlation Reduction Module 400, the data is subjected to a reverse PCA process 500 that returns the data from its PCA analysis form to its original form, now adjusted as described above. In this form, any correlation that may exist within the data is decreased.
- the Correlation Reduction Module 400 does not, however, reduce any orientation that may exist within the data; e.g., the magnitude of the residuals within the signal data 109TR for a given event may vary between flight condition parameters. If the variance in residuals is sufficiently significant, the residual data may not be "flat" across the parameters; i.e., it may have a sloped orientation.
- FIG. 5B diagrammatically illustrates non-flat data that may be fitted along a sloped line. To reduce the slope of the residuals, the data is subjected to orientation (slope) reduction process within the Orientation Reduction Module 600.
- the Orientation Reduction Module 600 first evaluates if there is an orientation within the data by fitting a line to the residual data points 115TR associated with each flight condition parameter. The slopes of the individual fitted lines are collectively averaged, and the average slope is used as a basis for adjusting all of the data. The residual engine output values are rotated in the opposite direction of the average slope for each flight condition. Like the correlation reduction process described above, the orientation reduction adjustments are performed gradually.
- FIG. 5C illustrates the data shown in FIG. 5B subject to an orientation reduction.
- the now adjusted training data (109TR, 115TR) is subsequently input into the Review Module 700 where, as described above, the adjusted training data is evaluated relative to certain criteria (e.g., variance range, number of Training Module iterations, etc.). The present method is not limited to any particular review criteria. Once one or more of the criteria are met, the adjusted training data transfers from the Training Module 350 to a Neural Network Module 800.
- certain criteria e.g., variance range, number of Training Module iterations, etc.
- the Neural Network Module 800 utilizes learning process that model the adjusted residuals as a function of the flight condition parameters 109, and produces an estimate of the correction required, if any, to reduce the residual between the engine output parameters 111 and the output parameters 113 produced by the physics-based engine model.
- the neural network module consists of multiple layers of inter connected computational units known as neurons or nodes, where error from learning is propagated back to the nodes and their connection strengths adjusted. This architecture is referred to as feed-forward, back propagation artificial neural networks. Each neural network is defined by a series of layers consisting of an input layer, hidden layers, and an output layer. Each layer consists of a number of neurons.
- the algorithm models the adjusted residuals as a function of the flight condition parameters, and produces an estimate of the correction required, if any, to reduce the residual between the engine output parameters 111 and the output parameters 113 produced by the physics-based engine model.
- the input layer consists of four (4) neurons for each flight condition parameter, the hidden layer is made up of five (5) neurons, and the number of output layer neurons has one (1) neuron for the adjustment for a gas path parameter.
- a nonlinear transfer function (sigmoid) is used in the hidden layer and a linear transfer function is used in the output layer. Because each neural network has one output, there are multiple neural networks, one network for each gas path parameter.
- the estimated corrections for the residuals produced within the Neural Network Module 800 are utilized within an Evaluation Module 900.
- the purpose of the Evaluation Module 900 is to ensure that the trained Neural Network Module 800 is accurately accounting for the difference between the Engine Module 103 and the Physics-Based Engine Model Module 105.
- the Evaluation Module 900 utilizes an engine model similar to that shown in FIG. 2 .
- the "trained" Neural Network Module 800 i.e., the Neural Network Model trained with the training data from the Training Module 350
- the engine model does not use a performance estimator module (e.g., the estimator 107 shown in FIG. 2 ).
- the residual data used within the Evaluation Module 900 before neural network correction is 11 5TS.
- the trained residual value from the Neural Network Module 800 is added to the teats residual value (115TS) as a correction within the Evaluation Module 900.
- the corrected residual data can be plotted to visually check the performance of the neural network and verify that the neural network is performing in a satisfactory manner. If the neural network is operating in a satisfactory manner, the trained neural network is finalized and used as the empirical database module as shown within FIG. 2 .
Landscapes
- Engineering & Computer Science (AREA)
- Physics & Mathematics (AREA)
- General Physics & Mathematics (AREA)
- Theoretical Computer Science (AREA)
- General Engineering & Computer Science (AREA)
- Chemical & Material Sciences (AREA)
- Combustion & Propulsion (AREA)
- Evolutionary Computation (AREA)
- Computer Hardware Design (AREA)
- Geometry (AREA)
- Automation & Control Theory (AREA)
- Mechanical Engineering (AREA)
- Artificial Intelligence (AREA)
- Computer Vision & Pattern Recognition (AREA)
- Medical Informatics (AREA)
- Software Systems (AREA)
- Feedback Control In General (AREA)
Abstract
Description
- The present invention relates generally to the field of mathematical and empirical modeling. More specifically, the invention relates to a method and system for modeling the performance of a gas turbine engine.
- Early gas turbine engine models include piecewise linear state variable models (SVM) operable to describe reasonable behavior of an engine during steady state operation and mild transients. As processor speeds increased, more complex engine models that were a combination of linear and non-linear physics based elements were created. While the latter provided greater fidelity for transient operation over an engine's operational flight envelope, the accuracy required for long-term performance tracking as well as the need to address engine-to-engine variation was inadequate.
- Modeling using physics-based principles is a crucial element in conditional based monitoring and engine health management for gas turbine engines. However, modem gas turbine engines have complex mechanical systems that are, practically speaking, difficult to accurately model and represent using physics-based principles. The modeling difficulties associated with engine complexity are exacerbated by noisy or inaccurate sensors, engine-to-engine variations, and complex modifications made to engines during their life time. Consequently, it is very difficult to model a gas turbine engine with high fidelity using only a physics-based model component.
-
FIG. 1 illustrates a schematic diagram of anengine model 101 used for performance tracking. The major components include the monitoredengine 103, a physics-basedengine model 105 and aperformance estimation module 107. The physics-basedengine model 105 is typically an SVM and theperformance estimation module 107 can be a Kalman filter observer. - The
engine model 101 is driven by a set ofinput parameters 109 that command theengine 103. Theinput parameters 109 comprise flight parameters such as Mach number, altitude, ambient conditions (e.g., temperature and pressure) and others, and power setting parameters such as engine pressure ratio (EPR), engine low rotor speed, fan pressure ratio (FPR), and engine control parameters such as engine bleed air commands, variable geometry vane commands and others. The monitoredengine output data 111 comprises data pertaining to gas path parameters (GPP) such as fuel, flow, internal shaft speeds, compressor, combustor and turbine temperatures and pressures and others. The physics-basedengine model 105 outputs estimatedparameter data 113 corresponding to eachengine output parameter 111. - The estimated
parameter data 113 may be used for a variety of purposes. Theparameter data 113 provide for analytical redundancy if a channel mismatch were to occur, for example, in a multichannel redundant system such as a Full Authority Digital Engine Control (FADEC) (not shown), serving as an auctioneer between two redundant signals that have different values. - The physics-based
engine model 105 estimatedoutput parameter data 113 are compared with the engineoutput parameter data 111 to formresiduals 115. If the physics-basedengine model 105 is an accurate representation of the monitoredengine 103 and if the engine is performing under nominal conditions, theresiduals 115 should be close to zero on the average. The residuals represent the difference between an actualengine output data 111 and the related engine model estimatedoutput data 113. The magnitude of the residuals indicates the accuracy of the physics-basedengine model 105. However, as the operating time of an engine increases beyond a certain point, its performance typically decreases and theresiduals 115 deviate from zero. - The
performance estimator 107 uses theresiduals 115 to observe changes in performance across the engine's modules (e.g., compressor, combustor, turbine, etc.), in the form of adiabatic efficiencies, flow capacities, and turbine nozzle area deltas. This type of analysis is referred to as Gas Path Analysis (GPA) or Module Performance Analysis (MPA). The disparities between the physics-basedengine model 105 andengine 103 outputs are used to modify the performance output of the engine model estimatedoutputs 113 to drive theresiduals 115 to zero (on the average). In this manner, the physics-based engine model estimatedoutputs 113 more accurately reflect the current state of theengine 103 and the module performance deltas can be tracked over time to aid in determining proper engine work scope when the engine is removed for maintenance. - The
model 101 described above and shown inFIG. 1 represents an ideal situation where the physics-basedengine model 105 is a faithful representation of theengine 103 being monitored. However, the physics-basedengine model 105 typically does not hold true in practice. Engine-to-engine variations, models simplified in order to save processing time, deviations caused by complicated improvements to the engine's hardware, bleed and stator vane schedules, cooling flows, handling bleeds, etc., over the engine's life cycle are not reflected in themodel 105 and contribute to output disparities between the physics-basedengine model 105 andengine 103. The disparities result in inaccurate estimations in the module performance tracking for themodel 101 which can result in unnecessary engine maintenance or removals, etc. Due to the penalties and high costs associated with such events, this is undesirable for both engine manufacturers and airliners. -
FIG.2 illustrates anengine model 102 that is a variation of themodel 101 shown inFIG. 1 , wherein theinput parameters 109 are stored in a database along with the residuals associated with those input parameters. This database is used for viewing the performance of the engine over a period of time. Once developed,output 116 from this database is used for empirical fine tuning of the physics-basedengine model 105. Although thisengine model 102 represents an improvement over themodel 101 shown inFIG. 1 , it can still be subject to data biases and correlations and therefore inaccurate. - According to an aspect of the present invention, a method for modeling the performance of a gas turbine engine is provided. The method includes the steps of: 1) providing a processor; 2) inputting flight condition parameter data and engine output parameter data into a gas turbine engine model operating on the processor, which model includes a physics-based engine model that uses the flight condition parameter data to produce estimated engine output parameter data, and determines residuals from the engine output parameter data and the estimated engine output parameter data; 3) partitioning the flight condition parameter data and residuals into training data and testing data; 4) performing a correlation reduction on the training data, which analysis produces correlation adjusted training data; 5) performing an orientation reduction on the correlation adjusted training data, which reduction produces orientation adjusted training data; 6) reviewing the orientation adjusted training data relative to at least one predetermined criteria, and iteratively repeating the steps of performing a correlation reduction and an orientation reduction using the orientation adjusted training data if the criteria is not satisfied, and if the criteria is satisfied outputting the orientation adjusted training data; 7) producing estimated corrections to the orientation adjusted training data using one or more neural networks; 8) evaluating the neural adjusted data using the partitioned testing data; and 9) modeling the performance of the gas turbine using the estimated corrections to the orientation adjusted training data.
- According to another aspect of the present invention, a system for modeling the performance of a gas turbine engine is provided. The system includes a processor adapted to: a) receive flight condition parameter data and engine output parameter data; and b) have a physics based engine model that uses the flight condition parameter data to produce estimated engine output parameter data, and which model determines residual data from the engine output parameter data and the estimated engine output parameter data. The processor includes: a) a partitioning module for partitioning the flight condition parameter data and residual data into training data and testing data; b) a training module; c) a neural network module; and d) an evaluation module. The training module includes a correlation reduction module for reducing one or more correlations in the training data, which module produces correlation adjusted training data, an orientation reduction module for reducing one or more orientations in the correlation adjusted training data, which module produces orientation adjusted training data, and a review module for evaluating the orientation adjusted training data relative to at least one predetermined criteria, and directing the orientation adjusted training data iteratively within the training module if the criteria is not satisfied, and if the criteria is satisfied outputting the orientation adjusted training data. The neural network module is adapted to produce estimated corrections to the orientation adjusted training data using one or more neural networks. The evaluation model is adapted to evaluate the neural adjusted data using the partitioned testing data. The processor is further adapted to model the performance of the gas turbine using the estimated corrections to the orientation adjusted training data.
- The details of one or more embodiments of the invention are set forth in the accompanying drawings and the description below. Other features, objects, and advantages of the invention will be apparent from the description and drawings, and from the claims.
-
FIG. 1 is a schematic of an engine model for a gas turbine engine. -
FIG. 2 is a schematic of another engine model for a gas turbine engine, including a database. -
FIG. 3 is a block diagram of the present method for modeling the performance of a gas turbine engine. -
FIG. 4A is a graph of input parameter data in PCA format, showing PC 1 data vs. PC2 data in unfiltered form. -
FIG. 4B is a graph of input parameter data in PCA format, showing PC I data vs. PC2 data in filtered form, with outliers removed. -
FIG. 5A is a graph of residual data values vs. flight condition data values prior to correlation reduction and orientation reduction. -
FIG. 5B is a graph of residual data values vs. flight condition data values with correlation reduction performed. -
FIG. 5C is a graph of residual data values vs. flight condition data values with orientation reduction performed. - The present invention includes a method and system for modeling the performance of a gas turbine. The invention utilizes a modular framework and can be deployed as an application program within a processor, CPU, and/or tangibly embodied on a program storage device (e.g., deployed in the form of software, hardware, or some combination thereof). The application code for execution can reside on a plurality of different types of computer readable media known to those skilled in the art. The processing devices adapted to implement the present turbine engine performance models may be provided with the gas turbine engine or may be independent from the engine, adapted to receive data from the engine.
- As stated above, various
different engine models aforesaid engine models 102 include the ability to develop a database of residual and flight condition values. The present method of modeling the performance of a gas turbine engine utilizes such an engine model and builds upon it to create an engine model having significantly improved accuracy. An example of an acceptable engine model that produces residual values is shown inFIG. 2 . The present invention method of modeling is not limited to that engine model, however. - Now referring to
FIG. 3 , according to one aspect of the present invention modeling method, the flight condition parameter values and the residual values are subjected to aFiltering Module 200 that identifies and removes outlying data points ("outliers"). A variety of different filtration techniques can be used. In a preferred embodiment, theFiltering Module 200 utilizes a Principal Component Analysis (PCA) to filter the data and thereby identify and remove outlying data points ("outliers") that would otherwise negatively affect the accuracy of the modeling. The inputs to theFiltering Module 200 include theflight condition parameters 109 and theresidual values 115. - The data input to the
Filtering Module 200 is initially organized, for example in a matrix form with columns and rows. The number of columns reflects the number of different flight condition parameters. Each row, in contrast, contains flight condition data associated with a distinct event (e.g., an engine flight) for each parameter. The number of rows is typically a large number (in the order of hundreds, or thousands), and increases with the life of the engine. The columns are organized within the matrix based on the relative degree of variance within the data; e.g., the flight condition parameter having the most variant data is positioned within the first column, the parameter having the second most variant data is positioned within the second column, etc. The difference in variance from column to column typically does not change linearly. In most instances the difference in variance change is significant in the first few columns, and subsequently tapers to a much smaller rate of change; e.g., an exponential distribution. The variance distribution is unique for each engine, however. During filtration, the present method performs the PCA analysis using a matrix based on a limited number of columns; e.g., those columns most likely to contain a high percentage of outliers. By using a limited "N" number of columns (referred to as PC1, PC2, etc.), each with a high percentage of outliers, the present filtration process is likely to identify a significant percentage of all outliers with limited processing demands. The present PCA analysis for filtration may, therefore, be described as applied to a "i" row by "N" column matrix. In most applications, a matrix have two (N = 2) columns (e.g., PC1, PC2) is adequate. The present filtration step is not, however, limited to using a two column data matrix. - During the PCA analysis, a distance value is calculated (using the Euclidian distance metric) between a PCA signal based on the data points within each row (i.e., which signal is defined in terms of the values in that row; e.g., PC1, PC2) and an average value of all the PCA signals. This process creates an array of distance values ("scalar values") having the same number of rows as the original data matrix. A predetermined threshold value (typically referred to as "K", having a magnitude, for example, between 1 and 3) is used for identifying outliers. All of the PCA signals having a scalar value above the threshold value (e.g., "K" times the standard deviation of the distance values) are identified. These data points represent the data points within the flight condition signals 109 that are outside what is considered nominal and are consequently defined as outliers. The set of outliers is a sub-set of the original set of distance values, and typically constitutes only a small portion (depending on the value of K) of the total number of data points "i".
FIGS. 4A and 4B graphically illustrate the PCA analysis process. Thedata 109 is projected in two dimensions (i.e., PC1 and PC2) as a PCA signal, and the distance between each PCA signal and the average PCA signal (PCcenter) is shown. The outliers present in most data sets are readily apparent as anomalies to the primary data group. - Once the outliers are identified, the data values 109 in the rows identified as outliers, and the
residuals 115 associated with those data values are removed from thesignals 109 that will be subsequently used within the model. The flight condition signals 109 and associatedresiduals 115 that remain are referred to as filteredsignals 109F and filteredresiduals 115F.FIG. 4B illustrates the data group with the outliers removed through filtration. - The above described filtration process is a preferred process because of the accuracy gained with relatively low data processing requirements. The present method is not limited to this filtering process, and other processes may be used.
- Now referring back to
FIG. 3 , according to another aspect of the present method, the filtered signal data and residuals (109F, 115F) are subjected to a data partitioning within adata Partitioning Module 300. In thisModule 300, a predetermined percentage (typically 60% to 80%) of the filteredsignals Evaluation Module 900 as will be explained below. The partitioning percentages (e.g., 60/40, 70/30, 80/20) are not limited to any particular split and can be adjusted to suit the application on hand. - The training data (109TR, 115TR) from the
Partitioning Module 300 are subsequently used within aTraining Module 350 that includes aCorrelation Reduction Module 400, anOrientation Reduction Module 600, and aReview Module 700. As will be described, the training data is subjected serially to theCorrelation Reduction Module 400,Orientation Reduction Module 600, and theReview Module 700 in an iterative process. Within theReview Module 700, certain criteria are applied to the training data. If one or more of the criteria are met, then the training data is passed onto aNeural Network Module 800. If no criteria are met, then the training data iteratively returns to theCorrelation Reduction Module 400 and once again is passed through theTraining Module 350. Examples of review criteria include data within an acceptable variance range, or data that has iteratively passed through the Training Module 350 a predetermined number of times. Other criteria may be used alternatively. - The
Correlation Reduction Module 400 operates to reduce non-uniformity in the residuals that can introduce biases and shape-shifts within the data. In thisModule 400, the 109TR portion of the training data is again subject to a PCA analysis. The PCA analysis is applied in the manner described above within theFiltering Module 300 with the exception that the PCA process is applied to the filtered data within all of the columns; i.e., each flight condition parameter is considered. As described above, the PCA transformed data is used for determining the scalar distance values corresponding to the data values in each row (109TR). Like the Filtering Module PCA process, the scalar values are arranged in a matrix having the same number of rows as the original data matrix, and the values are sorted in descending order from the most variant value to the least variant value. The most variant value is the greatest distance from the average scalar value, and is the one that is causing the highest correlation in the data. Unlike theFiltering Module 200, the most variant points in thisModule 400 are adjusted rather than eliminated. The variant points are adjusted such that their contribution to the overall correlation is minimized after the adjustment. For example, while each point is adjusted, the points that have more variance are adjusted more than those with less variance. The adjustment is preferably performed in a gradual manner to prevent excessive adjustment. The following equation is an example of an equation that can be used to adjust the data and decrease the overall correlation in the residuals:
In the above equation, Pbefore and Pafter are the position of a point in the PCA data before and after adjustments respectively. Pcenter is the position of the center of the PCA cluster (PC1average, PC2average). The constant value "ε" is a learning constant that determines the rate of adjustment (typically between 0.1 and 0.5).FIG. 5A diagrammatically illustrates correlated data prior to the above-described correlation reduction.FIG. 5B illustrates the data after the correlation reduction is performed. It should be noted that the before and after depictions of correlated data illustrate a single iterative change. Using the present method the correlation reduction process may take several iterative steps. - After the data has been adjusted within the
Correlation Reduction Module 400, the data is subjected to areverse PCA process 500 that returns the data from its PCA analysis form to its original form, now adjusted as described above. In this form, any correlation that may exist within the data is decreased. - The
Correlation Reduction Module 400 does not, however, reduce any orientation that may exist within the data; e.g., the magnitude of the residuals within the signal data 109TR for a given event may vary between flight condition parameters. If the variance in residuals is sufficiently significant, the residual data may not be "flat" across the parameters; i.e., it may have a sloped orientation.FIG. 5B , for example, diagrammatically illustrates non-flat data that may be fitted along a sloped line. To reduce the slope of the residuals, the data is subjected to orientation (slope) reduction process within theOrientation Reduction Module 600. - The
Orientation Reduction Module 600 first evaluates if there is an orientation within the data by fitting a line to the residual data points 115TR associated with each flight condition parameter. The slopes of the individual fitted lines are collectively averaged, and the average slope is used as a basis for adjusting all of the data. The residual engine output values are rotated in the opposite direction of the average slope for each flight condition. Like the correlation reduction process described above, the orientation reduction adjustments are performed gradually.FIG. 5C illustrates the data shown inFIG. 5B subject to an orientation reduction. - The now adjusted training data (109TR, 115TR) is subsequently input into the
Review Module 700 where, as described above, the adjusted training data is evaluated relative to certain criteria (e.g., variance range, number of Training Module iterations, etc.). The present method is not limited to any particular review criteria. Once one or more of the criteria are met, the adjusted training data transfers from theTraining Module 350 to aNeural Network Module 800. - The
Neural Network Module 800 utilizes learning process that model the adjusted residuals as a function of theflight condition parameters 109, and produces an estimate of the correction required, if any, to reduce the residual between theengine output parameters 111 and theoutput parameters 113 produced by the physics-based engine model. The neural network module consists of multiple layers of inter connected computational units known as neurons or nodes, where error from learning is propagated back to the nodes and their connection strengths adjusted. This architecture is referred to as feed-forward, back propagation artificial neural networks. Each neural network is defined by a series of layers consisting of an input layer, hidden layers, and an output layer. Each layer consists of a number of neurons. In terms of the present method, the algorithm models the adjusted residuals as a function of the flight condition parameters, and produces an estimate of the correction required, if any, to reduce the residual between theengine output parameters 111 and theoutput parameters 113 produced by the physics-based engine model. The input layer consists of four (4) neurons for each flight condition parameter, the hidden layer is made up of five (5) neurons, and the number of output layer neurons has one (1) neuron for the adjustment for a gas path parameter. A nonlinear transfer function (sigmoid) is used in the hidden layer and a linear transfer function is used in the output layer. Because each neural network has one output, there are multiple neural networks, one network for each gas path parameter. - The estimated corrections for the residuals produced within the
Neural Network Module 800 are utilized within anEvaluation Module 900. The purpose of theEvaluation Module 900 is to ensure that the trainedNeural Network Module 800 is accurately accounting for the difference between theEngine Module 103 and the Physics-BasedEngine Model Module 105. TheEvaluation Module 900 utilizes an engine model similar to that shown inFIG. 2 . In theEvaluation Module 900, the "trained" Neural Network Module 800 (i.e., the Neural Network Model trained with the training data from the Training Module 350) is used as the empirical database as shown withinFIG. 2 . Within theEvaluation Module 900, however, the engine model does not use a performance estimator module (e.g., theestimator 107 shown inFIG. 2 ). The residual data used within theEvaluation Module 900 before neural network correction is 11 5TS. The trained residual value from theNeural Network Module 800 is added to the teats residual value (115TS) as a correction within theEvaluation Module 900. The corrected residual data can be plotted to visually check the performance of the neural network and verify that the neural network is performing in a satisfactory manner. If the neural network is operating in a satisfactory manner, the trained neural network is finalized and used as the empirical database module as shown withinFIG. 2 . - One or more embodiments of the present invention have been described. Nevertheless, it will be understood that various modifications may be made without departing from the scope of the invention as defined by the claims. Accordingly, other embodiments are within the scope of the following claims. The invention is not limited to any particular software language described or implied in the figures. A variety of alternative software languages may be used for implementation of the invention. Some components and items are illustrated and described as if they were hardware elements, as is common practice within the art. However, various components in the method and system may be implemented in software or hardware.
Claims (13)
- A method for modeling the performance of a gas turbine engine, comprising the steps of:providing a processor;inputting flight condition parameter data and engine output parameter data into a gas turbine engine model operating on the processor, which model includes a physics-based engine model that uses the flight condition parameter data to produce estimated engine output parameter data, and determines residual data from the engine output parameter data and the estimated engine output parameter data;partitioning the flight condition parameter data and residual data into training data and testing data;performing a correlation reduction on the training data, which analysis produces correlation adjusted training data;performing an orientation reduction on the correlation adjusted training data, which reduction produces orientation adjusted training data;reviewing the orientation adjusted training data relative to at least one predetermined criteria, and iteratively repeating the steps of performing a correlation reduction and an orientation reduction using the orientation adjusted training data, and reviewing if the criteria is not satisfied, and if the criteria is satisfied outputting the orientation adjusted training data;producing estimated corrections to the orientation adjusted training data using one or more neural networks;evaluating the neural adjusted data using the partitioned testing data; andmodeling the performance of the gas turbine using the estimated corrections to the orientation adjusted training data.
- The method of claim 1, wherein the step of performing a correlation reduction includes performing a principal component analysis (PCA) on the training data to reduce correlations within the training data, which analysis produces the correlation adjusted training data, and the method further includes the step of performing a reverse PCA on the correlation adjusted training data.
- The method of claim 2, wherein the PCA is performed on all of the training data.
- The method of claim 1, 2 or 3, further comprising the step of filtering the flight condition parameter data to remove outliers.
- The method of claim 4, wherein the filtering step includes performing a PCA on the flight condition parameter data to remove the outliers.
- The method of claim 5, wherein the flight condition parameter data are organized in matrix of engine event by flight condition parameter, and the filtering step includes removing data from any engine events having outliers.
- The method of claim 6, wherein flight condition parameter data in less than all of the flight condition parameters is considered in the filtering step.
- A system for modeling the performance of a gas turbine engine, comprising:a processor adapted to receive flight condition parameter data and engine output parameter data, and adapted to have a physics based engine model that uses the flight condition parameter data to produce estimated engine output parameter data, and determines residual data from the engine output parameter data and the estimated engine output parameter data, wherein the processor includes:a partitioning module for partitioning the flight condition parameter data and residual data into training data and testing data;a training module having a correlation reduction module for reducing one or more correlations in the training data, which module produces correlation adjusted training data, an orientation reduction module for reducing one or more orientations in the correlation adjusted training data, which module produces orientation adjusted training data, and a review module for reviewing the orientation adjusted training data relative to at least one predetermined criteria, and directing the orientation adjusted training data iteratively within the training module if the criteria is not satisfied, and if the criteria is satisfied outputting the orientation adjusted training data;a neural network module for producing estimated corrections to the orientation adjusted training data using one or more neural networks; andan evaluation model for evaluating the neural adjusted data using the partitioned testing data; andwherein the processor is further adapted to model the performance of the gas turbine using the estimated corrections to the orientation adjusted training data.
- The system of claim 8, wherein the correlation reduction module is adapted to perform a principal component analysis (PCA) on the training data to reduce correlations within the training data, which analysis produces the correlation adjusted training data, and to perform a reverse PCA on the correlation adjusted training data.
- The system of claim 9, wherein the correlation reduction module is adapted to perform a PCA on all of the training data.
- The system of claim 8, 9 or 10, wherein the processor is further includes a filtering module for filtering the flight condition parameter data to remove outliers.
- The system of claim 11, wherein the filtering module is adapted to perform a PCA on the flight condition parameter data to remove the outliers.
- The system of claim 12, wherein filtering module is adapted to consider flight condition parameter data associated with less than all of the flight condition parameters.
Applications Claiming Priority (1)
| Application Number | Priority Date | Filing Date | Title |
|---|---|---|---|
| US12/643,579 US8306791B2 (en) | 2009-12-21 | 2009-12-21 | Method and system for modeling the performance of a gas turbine engine |
Publications (1)
| Publication Number | Publication Date |
|---|---|
| EP2336918A1 true EP2336918A1 (en) | 2011-06-22 |
Family
ID=43856189
Family Applications (1)
| Application Number | Title | Priority Date | Filing Date |
|---|---|---|---|
| EP10252149A Ceased EP2336918A1 (en) | 2009-12-21 | 2010-12-17 | Method and system for modeling the performance of a gas turbine engine |
Country Status (2)
| Country | Link |
|---|---|
| US (1) | US8306791B2 (en) |
| EP (1) | EP2336918A1 (en) |
Cited By (11)
| Publication number | Priority date | Publication date | Assignee | Title |
|---|---|---|---|---|
| CN103089454A (en) * | 2013-02-04 | 2013-05-08 | 哈尔滨东安发动机(集团)有限公司 | Digital control apparatus of micro gas turbine |
| CN110513199A (en) * | 2019-07-23 | 2019-11-29 | 南京航空航天大学 | A kind of neural network control method that aeroengine thrust decline is alleviated |
| CN111240235A (en) * | 2018-11-28 | 2020-06-05 | 霍尼韦尔国际公司 | Self-generating engine-specific health monitoring models from generic model libraries |
| CN113158564A (en) * | 2021-04-19 | 2021-07-23 | 南京航空航天大学 | Data-driven aeroengine state variable model establishing method |
| WO2021173356A1 (en) * | 2020-02-26 | 2021-09-02 | Northrop Grumman Systems Corporation | Prognostics for improved maintenance of vehicles |
| US11170586B1 (en) | 2018-10-18 | 2021-11-09 | Northrop Grumman Systems Corporation | Fleet level prognostics for improved maintenance of vehicles |
| US11409866B1 (en) | 2021-06-25 | 2022-08-09 | Northrop Grumman Systems Corporation | Adaptive cybersecurity for vehicles |
| US11681811B1 (en) | 2021-06-25 | 2023-06-20 | Northrop Grumman Systems Corporation | Cybersecurity for configuration and software updates of vehicle hardware and software based on fleet level information |
| EP4535106A1 (en) * | 2023-10-06 | 2025-04-09 | Doosan Enerbility Co., Ltd. | Apparatus for updating and employing a digital twin-based model and method therefor |
| EP4401014A4 (en) * | 2021-09-06 | 2025-10-08 | Kawasaki Heavy Ind Ltd | METHOD FOR CONSTRUCTING A TRAINED MODEL |
| KR102961218B1 (en) | 2023-10-06 | 2026-05-07 | 두산에너빌리티 주식회사 | Apparatus for updating a digital twin-based model and method therefor |
Families Citing this family (55)
| Publication number | Priority date | Publication date | Assignee | Title |
|---|---|---|---|---|
| US20100017092A1 (en) * | 2008-07-16 | 2010-01-21 | Steven Wayne Butler | Hybrid fault isolation system utilizing both model-based and empirical components |
| US9354618B2 (en) | 2009-05-08 | 2016-05-31 | Gas Turbine Efficiency Sweden Ab | Automated tuning of multiple fuel gas turbine combustion systems |
| US8437941B2 (en) | 2009-05-08 | 2013-05-07 | Gas Turbine Efficiency Sweden Ab | Automated tuning of gas turbine combustion systems |
| US9267443B2 (en) | 2009-05-08 | 2016-02-23 | Gas Turbine Efficiency Sweden Ab | Automated tuning of gas turbine combustion systems |
| US9671797B2 (en) | 2009-05-08 | 2017-06-06 | Gas Turbine Efficiency Sweden Ab | Optimization of gas turbine combustion systems low load performance on simple cycle and heat recovery steam generator applications |
| US8560279B2 (en) * | 2011-02-08 | 2013-10-15 | General Electric Company | Method of determining the influence of a variable in a phenomenon |
| US20130054213A1 (en) * | 2011-08-23 | 2013-02-28 | General Electric Company | Process for adaptive modeling of performance degradation |
| US8423161B2 (en) * | 2011-08-24 | 2013-04-16 | General Electric Company | Methods and systems for gas turbine modeling using adaptive kalman filter |
| US10531251B2 (en) * | 2012-10-22 | 2020-01-07 | United States Cellular Corporation | Detecting and processing anomalous parameter data points by a mobile wireless data network forecasting system |
| JP6604939B2 (en) | 2013-03-15 | 2019-11-13 | ユナイテッド テクノロジーズ コーポレイション | Control system, control method and gas turbine engine |
| US9852240B2 (en) * | 2014-07-23 | 2017-12-26 | General Electric Company | Systems and methods for gas turbine operational impact modeling using statistical and physics-based methodologies |
| US9791352B2 (en) | 2014-09-17 | 2017-10-17 | General Electric Company | Automated prognostics systems and methods |
| US10539079B2 (en) | 2016-02-12 | 2020-01-21 | United Technologies Corporation | Bowed rotor start mitigation in a gas turbine engine using aircraft-derived parameters |
| US10174678B2 (en) | 2016-02-12 | 2019-01-08 | United Technologies Corporation | Bowed rotor start using direct temperature measurement |
| US10040577B2 (en) | 2016-02-12 | 2018-08-07 | United Technologies Corporation | Modified start sequence of a gas turbine engine |
| US9664070B1 (en) | 2016-02-12 | 2017-05-30 | United Technologies Corporation | Bowed rotor prevention system |
| US10508567B2 (en) | 2016-02-12 | 2019-12-17 | United Technologies Corporation | Auxiliary drive bowed rotor prevention system for a gas turbine engine through an engine accessory |
| US10436064B2 (en) | 2016-02-12 | 2019-10-08 | United Technologies Corporation | Bowed rotor start response damping system |
| US10125691B2 (en) | 2016-02-12 | 2018-11-13 | United Technologies Corporation | Bowed rotor start using a variable position starter valve |
| US10443505B2 (en) | 2016-02-12 | 2019-10-15 | United Technologies Corporation | Bowed rotor start mitigation in a gas turbine engine |
| US10125636B2 (en) | 2016-02-12 | 2018-11-13 | United Technologies Corporation | Bowed rotor prevention system using waste heat |
| US10443507B2 (en) | 2016-02-12 | 2019-10-15 | United Technologies Corporation | Gas turbine engine bowed rotor avoidance system |
| US10508601B2 (en) | 2016-02-12 | 2019-12-17 | United Technologies Corporation | Auxiliary drive bowed rotor prevention system for a gas turbine engine |
| US10598047B2 (en) | 2016-02-29 | 2020-03-24 | United Technologies Corporation | Low-power bowed rotor prevention system |
| US10787933B2 (en) | 2016-06-20 | 2020-09-29 | Raytheon Technologies Corporation | Low-power bowed rotor prevention and monitoring system |
| US10358936B2 (en) | 2016-07-05 | 2019-07-23 | United Technologies Corporation | Bowed rotor sensor system |
| US10618666B2 (en) | 2016-07-21 | 2020-04-14 | United Technologies Corporation | Pre-start motoring synchronization for multiple engines |
| US10384791B2 (en) | 2016-07-21 | 2019-08-20 | United Technologies Corporation | Cross engine coordination during gas turbine engine motoring |
| EP3273016B1 (en) | 2016-07-21 | 2020-04-01 | United Technologies Corporation | Multi-engine coordination during gas turbine engine motoring |
| EP3273006B1 (en) | 2016-07-21 | 2019-07-03 | United Technologies Corporation | Alternating starter use during multi-engine motoring |
| US10221774B2 (en) | 2016-07-21 | 2019-03-05 | United Technologies Corporation | Speed control during motoring of a gas turbine engine |
| US10787968B2 (en) | 2016-09-30 | 2020-09-29 | Raytheon Technologies Corporation | Gas turbine engine motoring with starter air valve manual override |
| US10443543B2 (en) | 2016-11-04 | 2019-10-15 | United Technologies Corporation | High compressor build clearance reduction |
| US10823079B2 (en) | 2016-11-29 | 2020-11-03 | Raytheon Technologies Corporation | Metered orifice for motoring of a gas turbine engine |
| US11514056B2 (en) | 2017-01-23 | 2022-11-29 | Raytheon Technologies Corporation | Data request workflow system |
| US11036883B2 (en) | 2017-01-23 | 2021-06-15 | Raytheon Technologies Corporation | Data filtering for data request workflow system |
| US10474113B2 (en) | 2017-03-09 | 2019-11-12 | General Electric Company | Power generation system control through adaptive learning |
| US20180268288A1 (en) * | 2017-03-14 | 2018-09-20 | General Electric Company | Neural Network for Steady-State Performance Approximation |
| US20190005826A1 (en) * | 2017-06-28 | 2019-01-03 | Ge Aviation Systems, Llc | Engine load model systems and methods |
| KR102025145B1 (en) * | 2017-09-01 | 2019-09-25 | 두산중공업 주식회사 | Apparatus and Method for Predicting Plant Data |
| US10822996B2 (en) | 2018-03-12 | 2020-11-03 | General Electric Company | Gas turbine engine health determination |
| US11755791B2 (en) * | 2018-07-03 | 2023-09-12 | Rtx Corporation | Aircraft component qualification system and process |
| CN109523171B (en) * | 2018-11-20 | 2022-11-25 | 未必然数据科技(北京)有限公司 | SVDD-based gas turbine air inlet system health degree evaluation method |
| US10928809B2 (en) * | 2018-12-04 | 2021-02-23 | General Electric Company | As-designed, as-manufactured, as-tested, as-operated and as-serviced coupled digital twin ecosystem |
| US11280751B2 (en) * | 2018-12-04 | 2022-03-22 | General Electric Company | System and method for optimizing a manufacturing process based on an inspection of a component |
| US12180892B2 (en) | 2019-02-01 | 2024-12-31 | Rtx Corporation | Machine learned aero-thermodynamic engine inlet condition synthesis |
| CN109992880B (en) * | 2019-03-29 | 2021-08-27 | 中国石油大学(北京) | Method, equipment and system for performance adaptation of gas turbine |
| CN110147573B (en) * | 2019-04-16 | 2023-04-07 | 新奥能源动力科技(上海)有限公司 | Simulation method and device of gas turbine and storage medium |
| EP3751370B1 (en) | 2019-06-14 | 2024-07-24 | General Electric Company | Additive manufacturing-coupled digital twin ecosystem based on multi-variant distribution model of performance |
| EP3751368B1 (en) | 2019-06-14 | 2023-09-27 | General Electric Company | Additive manufacturing-coupled digital twin ecosystem based on a surrogate model of measurement |
| EP3751369B1 (en) | 2019-06-14 | 2024-07-24 | General Electric Company | Additive manufacturing-coupled digital twin ecosystem |
| CN112200479B (en) * | 2020-10-20 | 2024-08-09 | 厦门航空有限公司 | Quantitative evaluation method for performance of radiator of civil air conditioning system |
| CN115965280A (en) * | 2022-12-21 | 2023-04-14 | 西北工业大学 | Digitization method for performance evaluation of aero-engine and gas turbine |
| CN115952621B (en) * | 2023-01-09 | 2026-02-27 | 南京航空航天大学 | A Modeling Method for Estimating the Performance Degradation of Aero-engines |
| FR3167619A1 (en) * | 2024-10-21 | 2026-04-24 | Safran Helicopter Engines | METHOD AND SYSTEM FOR CONTROLLING THE PERFORMANCE OF HIGH-FREQUENCY, LOW-VARIABILITY HELICOPTER ENGINES |
Citations (2)
| Publication number | Priority date | Publication date | Assignee | Title |
|---|---|---|---|---|
| EP1357487A2 (en) * | 2002-04-23 | 2003-10-29 | United Technologies Corporation | Method and system for developing a hybrid gas turbine engine state variable model |
| EP1906291A1 (en) * | 2006-09-29 | 2008-04-02 | United Technologies Corporation | Empirical tuning of an on board real-time gas turbine engine model |
Family Cites Families (8)
| Publication number | Priority date | Publication date | Assignee | Title |
|---|---|---|---|---|
| US6909960B2 (en) | 2002-10-31 | 2005-06-21 | United Technologies Corporation | Method for performing gas turbine performance diagnostics |
| US7136809B2 (en) | 2002-10-31 | 2006-11-14 | United Technologies Corporation | Method for performing an empirical test for the presence of bi-modal data |
| US7233884B2 (en) | 2002-10-31 | 2007-06-19 | United Technologies Corporation | Methodology for temporal fault event isolation and identification |
| US7769507B2 (en) | 2004-08-26 | 2010-08-03 | United Technologies Corporation | System for gas turbine health monitoring data fusion |
| US7277838B2 (en) | 2004-08-26 | 2007-10-02 | United Technologies Corporation | Bootstrap data methodology for sequential hybrid model building |
| US7415328B2 (en) | 2004-10-04 | 2008-08-19 | United Technologies Corporation | Hybrid model based fault detection and isolation system |
| US7441448B2 (en) | 2007-01-24 | 2008-10-28 | United Technologies Corporation | Process for adapting measurement suite configuration for gas turbine performance diagnostics |
| US7788014B2 (en) | 2007-03-05 | 2010-08-31 | United Technologies Corporation | Process and methodology for root cause identification in gas turbine engine performance tracking |
-
2009
- 2009-12-21 US US12/643,579 patent/US8306791B2/en not_active Expired - Fee Related
-
2010
- 2010-12-17 EP EP10252149A patent/EP2336918A1/en not_active Ceased
Patent Citations (2)
| Publication number | Priority date | Publication date | Assignee | Title |
|---|---|---|---|---|
| EP1357487A2 (en) * | 2002-04-23 | 2003-10-29 | United Technologies Corporation | Method and system for developing a hybrid gas turbine engine state variable model |
| EP1906291A1 (en) * | 2006-09-29 | 2008-04-02 | United Technologies Corporation | Empirical tuning of an on board real-time gas turbine engine model |
Non-Patent Citations (3)
| Title |
|---|
| BATTITI R: "USING MUTUAL INFORMATION FOR SELECTING FEATURES IN SUPERVISED NEURAL NET LEARNING", IEEE TRANSACTIONS ON NEURAL NETWORKS, IEEE SERVICE CENTER, PISCATAWAY, NJ, US, vol. 5, no. 4, 1 July 1994 (1994-07-01), pages 537 - 550, XP000460492, ISSN: 1045-9227, DOI: 10.1109/72.298224 * |
| DUNIA RICARDO ET AL: "Identification of faulty sensors using principal component analysis", AICHE JOURNAL 1996 OCT, vol. 42, no. 10, October 1996 (1996-10-01), pages 2797 - 2812, XP002634077 * |
| KARHUNEN J ET AL: "Generalizations of Principal Component Analysis, Optimization Problems, and Neural Networks", NEURAL NETWORKS, ELSEVIER SCIENCE PUBLISHERS, BARKING, GB, vol. 8, no. 4, 1 January 1995 (1995-01-01), pages 549 - 562, XP004008601, ISSN: 0893-6080, DOI: 10.1016/0893-6080(94)00098-7 * |
Cited By (13)
| Publication number | Priority date | Publication date | Assignee | Title |
|---|---|---|---|---|
| CN103089454A (en) * | 2013-02-04 | 2013-05-08 | 哈尔滨东安发动机(集团)有限公司 | Digital control apparatus of micro gas turbine |
| CN103089454B (en) * | 2013-02-04 | 2015-07-15 | 哈尔滨东安发动机(集团)有限公司 | Micro gas turbine digital control device |
| US11170586B1 (en) | 2018-10-18 | 2021-11-09 | Northrop Grumman Systems Corporation | Fleet level prognostics for improved maintenance of vehicles |
| CN111240235A (en) * | 2018-11-28 | 2020-06-05 | 霍尼韦尔国际公司 | Self-generating engine-specific health monitoring models from generic model libraries |
| CN110513199A (en) * | 2019-07-23 | 2019-11-29 | 南京航空航天大学 | A kind of neural network control method that aeroengine thrust decline is alleviated |
| WO2021173356A1 (en) * | 2020-02-26 | 2021-09-02 | Northrop Grumman Systems Corporation | Prognostics for improved maintenance of vehicles |
| CN113158564A (en) * | 2021-04-19 | 2021-07-23 | 南京航空航天大学 | Data-driven aeroengine state variable model establishing method |
| CN113158564B (en) * | 2021-04-19 | 2024-03-29 | 南京航空航天大学 | Method for establishing state variable model of aero-engine based on data driving |
| US11409866B1 (en) | 2021-06-25 | 2022-08-09 | Northrop Grumman Systems Corporation | Adaptive cybersecurity for vehicles |
| US11681811B1 (en) | 2021-06-25 | 2023-06-20 | Northrop Grumman Systems Corporation | Cybersecurity for configuration and software updates of vehicle hardware and software based on fleet level information |
| EP4401014A4 (en) * | 2021-09-06 | 2025-10-08 | Kawasaki Heavy Ind Ltd | METHOD FOR CONSTRUCTING A TRAINED MODEL |
| EP4535106A1 (en) * | 2023-10-06 | 2025-04-09 | Doosan Enerbility Co., Ltd. | Apparatus for updating and employing a digital twin-based model and method therefor |
| KR102961218B1 (en) | 2023-10-06 | 2026-05-07 | 두산에너빌리티 주식회사 | Apparatus for updating a digital twin-based model and method therefor |
Also Published As
| Publication number | Publication date |
|---|---|
| US8306791B2 (en) | 2012-11-06 |
| US20110153295A1 (en) | 2011-06-23 |
Similar Documents
| Publication | Publication Date | Title |
|---|---|---|
| US8306791B2 (en) | Method and system for modeling the performance of a gas turbine engine | |
| US7904282B2 (en) | Method and system for fault accommodation of machines | |
| US6539783B1 (en) | Methods and apparatus for estimating engine health | |
| EP1906291B1 (en) | Empirical tuning of an on board real-time gas turbine engine model | |
| US6466858B1 (en) | Methods and apparatus for monitoring gas turbine engine operation | |
| US12180892B2 (en) | Machine learned aero-thermodynamic engine inlet condition synthesis | |
| US7797113B2 (en) | Gas turbine performance analysis method and gas turbine performance analysis system | |
| US8849542B2 (en) | Real time linearization of a component-level gas turbine engine model for model-based control | |
| EP1103926A2 (en) | Methods and apparatus for model-based diagnostics | |
| RU2635435C2 (en) | System for equipment components assembly check | |
| US20080177505A1 (en) | Process for adapting measurement suite configuration for gas turbine performance diagnostics | |
| CN108732962B (en) | Compressor wash planning | |
| Simon et al. | Benchmarking gas path diagnostic methods: a public approach | |
| Simon | Propulsion diagnostic method evaluation strategy (ProDiMES) user's guide | |
| CN106935116A (en) | Adaptivity engine mockup moment of torsion shares optimization | |
| JP4116026B2 (en) | Engine operation modeling method | |
| EP1852591A2 (en) | Apparatus for estimating engine thrust | |
| US20070005527A1 (en) | Model reduction system and method for component lifing | |
| EP2562611A2 (en) | Process for adaptive modeling of performance degradation | |
| Armstrong et al. | Implementation of an integrated on-board aircraft engine diagnostic architecture | |
| EP1538319A1 (en) | Apparatus for model predictive control of aircraft gas turbine engines | |
| US20240427966A1 (en) | Methods and systems for model calibration | |
| Rausch et al. | Towards in-flight detection and accommodation of faults in aircraft engines | |
| CN117763706A (en) | Aircraft performance model based on historical flight data | |
| US20150268131A1 (en) | Method and a device for normalizing values of operating parameters of an aeroengine |
Legal Events
| Date | Code | Title | Description |
|---|---|---|---|
| PUAI | Public reference made under article 153(3) epc to a published international application that has entered the european phase |
Free format text: ORIGINAL CODE: 0009012 |
|
| AK | Designated contracting states |
Kind code of ref document: A1 Designated state(s): AL AT BE BG CH CY CZ DE DK EE ES FI FR GB GR HR HU IE IS IT LI LT LU LV MC MK MT NL NO PL PT RO RS SE SI SK SM TR |
|
| AX | Request for extension of the european patent |
Extension state: BA ME |
|
| 17P | Request for examination filed |
Effective date: 20111222 |
|
| 17Q | First examination report despatched |
Effective date: 20151001 |
|
| RAP1 | Party data changed (applicant data changed or rights of an application transferred) |
Owner name: UNITED TECHNOLOGIES CORPORATION |
|
| APBK | Appeal reference recorded |
Free format text: ORIGINAL CODE: EPIDOSNREFNE |
|
| APBN | Date of receipt of notice of appeal recorded |
Free format text: ORIGINAL CODE: EPIDOSNNOA2E |
|
| APAF | Appeal reference modified |
Free format text: ORIGINAL CODE: EPIDOSCREFNE |
|
| APBT | Appeal procedure closed |
Free format text: ORIGINAL CODE: EPIDOSNNOA9E |
|
| STAA | Information on the status of an ep patent application or granted ep patent |
Free format text: STATUS: THE APPLICATION HAS BEEN REFUSED |
|
| 18R | Application refused |
Effective date: 20180403 |