EP2294420B1 - Survival predictor for diffuse large B cell lymphoma - Google Patents
Survival predictor for diffuse large B cell lymphoma Download PDFInfo
- Publication number
- EP2294420B1 EP2294420B1 EP09759517.7A EP09759517A EP2294420B1 EP 2294420 B1 EP2294420 B1 EP 2294420B1 EP 09759517 A EP09759517 A EP 09759517A EP 2294420 B1 EP2294420 B1 EP 2294420B1
- Authority
- EP
- European Patent Office
- Prior art keywords
- stromal
- signature
- survival
- gcb
- gene expression
- Prior art date
- Legal status (The legal status is an assumption and is not a legal conclusion. Google has not performed a legal analysis and makes no representation as to the accuracy of the status listed.)
- Active
Links
Images








Classifications
-
- C—CHEMISTRY; METALLURGY
- C12—BIOCHEMISTRY; BEER; SPIRITS; WINE; VINEGAR; MICROBIOLOGY; ENZYMOLOGY; MUTATION OR GENETIC ENGINEERING
- C12Q—MEASURING OR TESTING PROCESSES INVOLVING ENZYMES, NUCLEIC ACIDS OR MICROORGANISMS; COMPOSITIONS OR TEST PAPERS THEREFOR; PROCESSES OF PREPARING SUCH COMPOSITIONS; CONDITION-RESPONSIVE CONTROL IN MICROBIOLOGICAL OR ENZYMOLOGICAL PROCESSES
- C12Q1/00—Measuring or testing processes involving enzymes, nucleic acids or microorganisms; Compositions therefor; Processes of preparing such compositions
- C12Q1/68—Measuring or testing processes involving enzymes, nucleic acids or microorganisms; Compositions therefor; Processes of preparing such compositions involving nucleic acids
- C12Q1/6876—Nucleic acid products used in the analysis of nucleic acids, e.g. primers or probes
- C12Q1/6883—Nucleic acid products used in the analysis of nucleic acids, e.g. primers or probes for diseases caused by alterations of genetic material
- C12Q1/6886—Nucleic acid products used in the analysis of nucleic acids, e.g. primers or probes for diseases caused by alterations of genetic material for cancer
-
- A—HUMAN NECESSITIES
- A61—MEDICAL OR VETERINARY SCIENCE; HYGIENE
- A61P—SPECIFIC THERAPEUTIC ACTIVITY OF CHEMICAL COMPOUNDS OR MEDICINAL PREPARATIONS
- A61P35/00—Antineoplastic agents
-
- G—PHYSICS
- G01—MEASURING; TESTING
- G01N—INVESTIGATING OR ANALYSING MATERIALS BY DETERMINING THEIR CHEMICAL OR PHYSICAL PROPERTIES
- G01N33/00—Investigating or analysing materials by specific methods not covered by groups G01N1/00 - G01N31/00
- G01N33/48—Biological material, e.g. blood, urine; Haemocytometers
- G01N33/50—Chemical analysis of biological material, e.g. blood, urine; Testing involving biospecific ligand binding methods; Immunological testing
- G01N33/53—Immunoassay; Biospecific binding assay; Materials therefor
- G01N33/575—Immunoassay; Biospecific binding assay; Materials therefor for cancer
- G01N33/57557—Immunoassay; Biospecific binding assay; Materials therefor for cancer of other specific parts of the body, e.g. brain
-
- C—CHEMISTRY; METALLURGY
- C12—BIOCHEMISTRY; BEER; SPIRITS; WINE; VINEGAR; MICROBIOLOGY; ENZYMOLOGY; MUTATION OR GENETIC ENGINEERING
- C12Q—MEASURING OR TESTING PROCESSES INVOLVING ENZYMES, NUCLEIC ACIDS OR MICROORGANISMS; COMPOSITIONS OR TEST PAPERS THEREFOR; PROCESSES OF PREPARING SUCH COMPOSITIONS; CONDITION-RESPONSIVE CONTROL IN MICROBIOLOGICAL OR ENZYMOLOGICAL PROCESSES
- C12Q2600/00—Oligonucleotides characterized by their use
- C12Q2600/106—Pharmacogenomics, i.e. genetic variability in individual responses to drugs and drug metabolism
-
- C—CHEMISTRY; METALLURGY
- C12—BIOCHEMISTRY; BEER; SPIRITS; WINE; VINEGAR; MICROBIOLOGY; ENZYMOLOGY; MUTATION OR GENETIC ENGINEERING
- C12Q—MEASURING OR TESTING PROCESSES INVOLVING ENZYMES, NUCLEIC ACIDS OR MICROORGANISMS; COMPOSITIONS OR TEST PAPERS THEREFOR; PROCESSES OF PREPARING SUCH COMPOSITIONS; CONDITION-RESPONSIVE CONTROL IN MICROBIOLOGICAL OR ENZYMOLOGICAL PROCESSES
- C12Q2600/00—Oligonucleotides characterized by their use
- C12Q2600/112—Disease subtyping, staging or classification
-
- G—PHYSICS
- G01—MEASURING; TESTING
- G01N—INVESTIGATING OR ANALYSING MATERIALS BY DETERMINING THEIR CHEMICAL OR PHYSICAL PROPERTIES
- G01N2800/00—Detection or diagnosis of diseases
- G01N2800/52—Predicting or monitoring the response to treatment, e.g. for selection of therapy based on assay results in personalised medicine; Prognosis
-
- G—PHYSICS
- G01—MEASURING; TESTING
- G01N—INVESTIGATING OR ANALYSING MATERIALS BY DETERMINING THEIR CHEMICAL OR PHYSICAL PROPERTIES
- G01N2800/00—Detection or diagnosis of diseases
- G01N2800/56—Staging of a disease; Further complications associated with the disease
Definitions
- the current standard of care for the treatment of diffuse large B cell lymphoma includes anthracycline-based chemotherapy regimens such as CHOP in combination with the administration of the anti-CD20 monoclonal antibody Rituximab.
- This combination regimen R-CHOP
- R-CHOP can cure about 60% of patients and has improved the overall survival of DLBCL patients by 10-15% ( Coiffier et al., N. Engl. J. Med., 346: 235-42 (2002 )). Nonetheless, the molecular basis of response or resistance to this therapy is unknown.
- DLBCL is a molecularly heterogeneous disease ( Staudt et al., Adv. Immunol., 87: 163-208 (2005 )), and different molecular subtypes of DLBCL can have very different prognoses following treatment. For example, gene expression profiling has identified two molecular subtypes of DLBCL that are biologically and clinically distinct ( Rosenwald et al., N. Engl. J. Med., 346: 1937-47 (2002 ); Alizadeh et al., Nature, 403: 503-11 (2000 )).
- the germinal center B cell-like (GCB) DLBCL subtype likely arises from normal germinal center B cells, whereas the activated B cell-like (ABC) DLBCL subtype may arise from a post-germinal center B cell that is blocked during plasmacytic differentiation.
- GCB DLBCLs have recurrent t(14,18) translocations
- ABC DLBCLs have recurrent trisomy 3 and deletion of the INK4a/ARF locus as well as constitutive activation of the anti-apoptotic NF-kB signalling pathway ( Rosenwald et al., N. Engl. J.
- a separate analytical approach identified four gene expression signatures that reflect distinct DLBCL tumor attributes and that were associated with distinct survival profiles in CHOP-treated DLBCL patients ( Rosenwald et al., N. Engl. J. Med., 346: 1937-47 (2002 )).
- a "germinal center B cell” (GCB) signature was associated with a favorable prognosis and paralleled the distinction between ABC and GCB DLBCL.
- the "proliferation” signature was associated with an adverse prognosis and included MYC and its target genes.
- the "MHC class II” signature was silenced in the malignant cells in a subset of DLBCL cases, an event that was associated with inferior survival ( Rosenwald et al., N. Engl. J.
- a fourth prognostic signature termed "lymph node” signature was associated with favorable prognosis and included components of the extracellular matrix, suggesting that it reflects the nature of the tumor-infiltrating non-malignant cells. These signatures predicted survival in a statistically independent fashion, indicating that multiple biological variables dictate the response to CHOP chemotherapy in DLBCL.
- WO2005/024043 discloses a method for predicting survival in a diffuse large B-cell lymphoma (DLBCL) subject, comprising the steps of:
- WO2005/024043 is silent of R-CHOP treated cases.
- the invention provides methods and arrays related to a gene expression-based survival predictor for DLBCL patients, including patients treated with the current standard of care, which includes chemotherapy and the administration of Rituximab.
- the invention provides a method of predicting survival outcome based on one or more diffuse large B cell lymphoma (DLBCL) samples.
- the method includes isolating gene expression products from one or more DLBCL biopsy samples from a subject treated with a therapeutic regimen that includes chemotherapy and Rituximab (R-CHOP).
- the method further comprises obtaining a gene expression profile from the gene expression products, wherein the expression profile comprises an expression level for each of at least 31 of the genes listed in Table 1 for the germinal center B cell (GCB) gene expression signature and at least 226 of the genes listed in Table 1 for the stromal-1 gene expression signature.
- GCB germinal center B cell
- the method also includes determining a GCB signature value and a stromal-1 signature value from the gene expression profile, wherein the GCB signature value is an average of the expression levels of the at least 31 genes listed in Table 1 for the GCB gene expression signature and the stromal-1 signature value is an average of the expression levels of the at least 226 genes listed in Table 1 for the stromal-1 gene expression signature.
- a survival predictor score which is equal to A - [(x)*(the GCB signature value)] - [(y)*(the stromal-1 signature value)] is calculated, wherein A is an offset term, (x) is a scale factor between 0.200 and 0.625, and (y) is a scale factor between 0.800 and 1.250.
- the method further includes determining the survival outcome for the subject based on the survival predictor score calculated for any fixed same value of A and for any fixed same values of (x) and (y), wherein a lower survival predictor score indicates a more favorable survival outcome and a higher survival predictor score indicates a less favorable survival outcome for the subject.
- the invention also provides a method of predicting survival outcome based on one or more diffuse large B cell lymphoma (DLBCL) samples.
- the method comprises isolating gene expression products from one or more DLBCL biopsy samples from a subject treated with a therapeutic regimen that includes chemotherapy and Rituximab (R-CHOP).
- the method further includes obtaining a gene expression profile from the gene expression products, wherein the gene expression profile comprises an expression level for each of at least 31 of the genes listed in Table 1 for the germinal center B-cell gene (GCB) expression signature, at least 226 of the genes listed in Table 1 for the stromal-1 gene expression signature, and at least 58 of the genes listed in Table 1 for the stromal-2 gene expression signature.
- GCB germinal center B-cell gene
- the method also comprises determining a GCB signature value, a stromal-1 signature value, and a stromal-2 signature value from the gene expression profile, wherein the GCB signature value is an average of the expression levels of the at least 31 genes listed in Table 1 for the GCB gene expression signature and the stromal-1 signature value is an average of the expression levels of the at least 226 genes listed in Table 1 for the stromal-1 gene expression signature and the stromal-2 signature value is an average of the expression levels of the at least 58 genes listed in Table 1 for the stromal-2 gene expression signature.
- survival predictor score A - [(x)*(the GCB signature value)] - [(y)*(the stromal-1 signature value)] + [(z)*(the stromal-2 signature value)], wherein A is an offset term and (x) is a scale factor between 0.200 and 0.625, (y) is a scale factor between 0.800 and 1.250, and (z) is a scale factor between 0.450 and 0.900.
- the invention further provides a targeted array comprising at least one probe or set of probes for each gene in (a) a germinal center B-cell gene (GCB) expression signature comprising at least 31 of the GCB signature genes listed in Table 1, (b) a stromal-1 gene expression signature comprising at least 226 of the stromal-1 signature genes listed in Table 1, and (c) a stromal-2 gene expression signature comprising at least 58 of the stromal-2 signature genes listed in Table 1, wherein the array comprises probes for fewer than 10,000 genes.
- GCB germinal center B-cell gene
- the invention provides a gene expression-based survival predictor for DLBCL patients, including those patients receiving the current standard of care, R-CHOP.
- the survival predictor can be used to determine the relative probability of a survival outcome in a specific subject.
- the survival predictor can also be used to predict; i.e., determine the expected probability that a survival outcome will occur by a defined period following treatment for DLBCL.
- prognostic information can be very useful to both the patient and the physician.
- Patients with survival predictor scores that indicate inferior outcome with R-CHOP therapy could be candidates for a different therapeutic regimen, if, for example, they relapse from R-CHOP treatment.
- the survival predictor can also be used in the design of clinical studies and analysis of clinical data to provide a quantitative survey of the types of DLBCL patients from which clinical data was gathered.
- the predictor can be used to improve one or more comparisons between data from different sources (e.g., from different clinical trials), by enabling comparisons with respect to patient characteristics, which are manifested in the gene expression levels that determine and, thus, are embodied in the predictor.
- the invention provides information that can be very valuable to a DLBCL patient, since the patient may be inclined to order his or her life quite differently, depending on whether the patient has,a high or low probability of surviving and/or remaining progression-free for a period of time following treatment.
- ABC activated B cell-like diffuse large B cell lymphoma
- CHOP cyclophosphamide, doxorubicine, vincristine, and prednisone
- CI confidence interval
- COP cyclophosphamide, vincristine, and prednisone
- DLBCL diffuse large B cell lymphoma
- DOD dead of disease
- ECOG Eastern Cooperative Oncology Group
- FACS fluorescence-activated cell sorting
- FH follicular hyperplasia
- FISH fluorescence in situ hybridization
- FL follicular lymphoma
- GC germinal center
- GCB germinal center B cell-like diffuse large B cell lymphoma
- IPI International Prognostic Index
- LPC lymphoplasmacytic lymphoma
- MHC major histocompatibility complex
- NA not available or not applicable
- NK natural killer
- PCR polymerase chain reaction
- RQ-PCR polymerase chain reaction
- R-CHOP refers generally to any therapeutic regimen that includes chemotherapy and the administration of Rituximab. Accordingly, while the term can refer to a Rituximab combination therapy that includes a CHOP regimen of cyclophosphamide, doxorubicine, vincristine, and prednisone, the term R-CHOP can also refer to therapy that includes Rituximab in combination with a chemotherapeutic regimen other than CHOP.
- gene expression data refers to information regarding the relative or absolute level of expression of a gene or set of genes in a cell or group of cells.
- the level of expression of a gene may be determined based on the level of RNA, such as mRNA, encoded by the gene. Alternatively, the level of expression may be determined based on the level of a polypeptide or fragment thereof encoded by the gene.
- Gene expression data may be acquired for an individual cell, or for a group of cells such as a tumor or biopsy sample.
- Gene expression data and gene expression levels can be stored on computer readable media, e.g., the computer readable medium used in conjunction with a microarray or chip reading device. Such gene expression data can be manipulated to generate gene expression signatures.
- microarray refers to a plurality of nucleic acid probes coupled to the surface of a substrate in different known locations.
- the substrate is preferably solid.
- Microarrays have been generally described in the art in, for example, U.S. Patent Nos. 5,143,854 (Pirrung ), 5,424,186 (Fodor ), 5,445,934 (Fodor ), 5,677,195 (Winkler ), 5,744,305 (Fodor ), 5,800,992 (Fodor ), and 6,040,193 (Winkler ), and Fodor et al., Science, 251:767-777 (1991 ).
- gene expression signature refers to a group of coordinately expressed genes.
- the genes making up this signature may be expressed in a specific cell lineage, stage of differentiation, or during a particular biological response.
- the genes can reflect biological aspects of the tumors in which they are expressed, such as the cell of origin of the cancer, the nature of the non-malignant cells in the biopsy, and the oncogenic mechanisms responsible for the cancer ( Shaffer et al., Immunity, 15: 375-385 (2001 )).
- Examples of gene expression signatures include lymph node, proliferation ( Rosenwald et al., New Engl. J.
- signature value corresponds to a mathematical combination of measurements from expression levels of the genes in a gene expression signature.
- An exemplary signature value is a signature average which corresponds to the average or mean of the individual expression levels in a gene expression signature.
- survival predictor score refers to a score generated by a multivariate model used to predict survival based on gene expression. A subject with a higher survival predictor score is predicted to have poorer survival than a subject with a lower survival predictor score.
- survival may refer to the probability or likelihood of a subject surviving for a particular period of time. Alternatively, it may refer to the likely term of survival for a subject, such as expected mean or median survival time for a subject with a particular gene expression pattern.
- progression free survival can refer to the probability or likelihood of a subject surviving without significant progression or worsening of disease for a particular period of time. Alternatively, it may refer to the likely term for a subject of survival without significant progression or worsening of disease, such as expected mean or median survival time for a subject with a particular gene expression pattern without significant progression or worsening of disease.
- survival outcome may refer to survival, overall survival, or progression free survival.
- scale factor refers to a factor that relates change in gene expression to prognosis.
- An example of a scale factor is a factor obtained by maximizing the partial likelihoods of the Cox proportional hazards model.
- the gene expression signatures, signature values, survival predictor scores, stromal scores, survival estimate curves, and probabilities of survival disclosed herein may be stored in digitally encoded format on computer readable media, e.g., computer readable media used in conjunction with microarray or chip reading devices or computer readable media used to store patient data during treatment for DLBCL.
- computer readable media e.g., computer readable media used in conjunction with microarray or chip reading devices or computer readable media used to store patient data during treatment for DLBCL.
- Such media and the specialized devices that use them, e.g., for diagnostic and clinical applications, are known in the art.
- the invention provides a method for predicting a survival outcome in a subject diagnosed with DLBCL using gene expression data.
- data may be gathered using any effective method of quantifying gene expression.
- gene expression data may be measured or estimated using one or more microarrays.
- the microarrays may be of any effective type, including, but not limited to, nucleic acid based or antibody based.
- Gene expression may also be measured by a variety of other techniques, including, but not limited to, PCR, quantitative RT-PCR, real-time PCR, RNA amplification, in situ hybridization, immunohistochemistry, immunocytochemistry, FACS, serial analysis of gene expression (SAGE) ( Velculescu et al., Science, 270: 484-87 (1995 )), Northern blot hybridization, or western blot hybridization.
- Nucleic acid microarrays generally comprise nucleic acid probes derived from individual genes and placed in an ordered array on a support.
- This support may be, for example, a glass slide, a nylon membrane, or a silicon wafer.
- Gene expression patterns in a sample are obtained by hybridizing the microarray with the gene expression product from the sample.
- This gene expression product may be, for example, total cellular mRNA, rRNA, or cDNA obtained by reverse transcription of total cellular mRNA.
- the gene expression product from a sample is labeled with a radioactive, fluorescent, or other label to allow for detection.
- the microarray is washed, and hybridization of the gene expression product to each nucleic acid probe on the microarray is detected and quantified using a detection device such as a phosphorimager or scanning confocal microscope.
- cDNA arrays consist of hundreds or thousands of cDNA probes immobilized on a solid support. These cDNA probes are usually 100 nucleotides or greater in size. There are two commonly used designs for cDNA arrays.
- the first is the nitrocellulose filter array, which is generally prepared by robotic spotting of purified DNA fragments or lysates of bacteria containing cDNA clones onto a nitrocellulose filter ( Southern et al., Genomics, 13: 1008-17 (1992 ); Southern et al., Nucl Acids Res 22: 1368-73 (1994 ); Gress et al., Oncogene, 13: 1819-30 (1996 ); Pietu et al., Genome Res., 6: 492-503 (1996 )).
- the other commonly used cDNA arrays is fabricated by robotic spotting of PCR fragments from cDNA clones onto glass microscope slides ( Schena et al., Science, 270: 467-70 (1995 ); DeRisi et al., Nature Genet., 14: 457-60 (1996 ); Schena et al., Proc. Nat'l. Acad. Sci. USA, 93: 10614-19 (1996 ); Shalon et al., Genome Res., 6: 639-45 (1996 ); DeRisi et al., Science, 278: 680-86 (1997 ); Heller et al., Proc. Nat'l. Acad. Sci.
- cDNA microarrays are simultaneously hybridized with two fluorescent cDNA probes, each labeled with a different fluorescent dye (typically Cy3 or Cy5). In this format, the relative mRNA expression in two samples is directly compared for each gene on the microarray.
- Oligonucleotide arrays differ from cDNA arrays in that the probes are 20- to 25-mer oligonucleotides.
- Oligonucleotide arrays are generally produced by in situ oligonucleotide synthesis in conjunction with photolithographic masking techniques ( Pease et al., Proc. Nat'l. Acad. Sci. USA, 91: 5022-26 (1994 ); Lipshutz et al., Biotechniques 19: 442-47 (1995 ); Chee et al., Science, 274: 610-14 (1996 ); Lockhart et al., Nature Biotechnol., 14: 1675-80 (1996 ); Wodicka et al., Nature Biotechnol., 15: 1359-6714 (1997 )).
- the solid support for oligonucleotide arrays is typically a glass or silicon surface.
- Microarrays may generally be produced using a variety of techniques, such as mechanical or light directed synthesis methods that incorporate a combination of photolithographic methods and solid phase synthesis methods. Techniques for the synthesis of microarrays using mechanical synthesis methods are described in, for example, U.S. Patent Nos. 5,384,261 (Winkler ) and 6,040,193 (Winkler ). Although a planar array surface is preferred, the microarray may be fabricated on a surface of virtually any shape, or even on a multiplicity of surfaces. Microarrays may be nucleic acids on beads, gels, polymeric surfaces, fibers such as fiber optics, glass, or any other appropriate substrate. See, for example, U.S. Patent Nos. 5,708,153 (Dower ), 5,770,358 (Dower ), 5,789,162 (Dower ), 5,800,992 (Fodor ), and 6,040,193 (Winkler ).
- Microarrays can be packaged in such a manner as to allow for diagnostic use, or they can be all-inclusive devices. See, for example, U.S. Patent Nos. 5,856,174 (Lipshutz ) and 5,922,591 (Anderson ).
- Microarrays directed to a variety of purposes are commercially available from Affymetrix (Santa Clara, CA). For instance, these microarrays may be used for genotyping and gene expression monitoring.
- Gene expression data can be used to identify genes that are coordinately regulated. Genes that encode components of the same multi-subunit protein complex are often coordinately regulated. Coordinate regulation is also observed among genes whose products function in a common differentiation program or in the same physiological response pathway. Recent application of gene expression profiling to the immune system has shown that lymphocyte differentiation and activation are accompanied by parallel changes in expression among hundreds of genes. Gene expression databases may be used to interpret the pathological changes in gene expression that accompany autoimmunity, immune deficiencies, cancers of immune cells and of normal immune responses.
- microarray gene expression data for the prediction of survival in DLBCL patients, there is a need for new algorithms to be developed, which can identify important information and convert it to a more manageable format.
- microarrays used to generate this data can be streamlined to incorporate probe sets that are useful for survival outcome prediction.
- Mathematical analysis of gene expression data is a rapidly evolving science based on a rich mathematics of pattern recognition developed in other contexts ( Kohonen, Self-Organizing Maps, Springer Press (Berlin 1997 )).
- Mathematical analysis of gene expression data can be used, for example, to identify groups of genes that are coordinately regulated within a biological system, to recognize and interpret similarities between biological samples on the basis of similarities in gene expression patterns, and/or to recognize and identify those features of a gene expression pattern that are related to distinct biological processes or phenotypes.
- Mathematical analysis of gene expression data often begins by establishing the expression pattern for each gene on an array across a number (n) of experimental samples.
- the expression pattern of each gene can be represented by a point in n-dimensional space, with each coordinate specified by an expression measurement in one of the n samples ( Eisen et al., Proc. Nat'l. Acad. Sci. USA, 95: 14863-68 (1998 )).
- a clustering algorithm that uses distance metrics can then be applied to locate clusters of genes in this n-dimensional space. These clusters indicate genes with similar patterns of variation in expression over a series of experiments.
- Clustering methods that have been applied to microarray data in the past include hierarchical clustering (Eisen et al., supra), self-organizing maps (SOMs) ( Tamayo et al., Proc. Nat'l. Acad. Sci. USA, 96: 2907-12 (1999 )), k-means ( Tavazoie et al., Nature Genet., 22: 281-85 (1999 )), and deterministic annealing ( Alon et al., Proc. Nat'l. Acad. Sci. USA, 96: 6745-50 (1999 )).
- SOMs self-organizing maps
- k-means Tavazoie et al., Nature Genet., 22: 281-85 (1999 )
- deterministic annealing Alon et al., Proc. Nat'l. Acad. Sci. USA, 96: 6745-50 (1999 )).
- Hierarchical clustering begins by determining the gene expression correlation coefficients for each pair of the n genes studied. Genes with similar gene expression correlation coefficients are grouped next to one another in a hierarchical fashion. Generally, genes with similar expression patterns under a particular set of conditions can encode protein products with related roles in the physiological adaptation to those conditions. Novel genes of unknown function that are clustered with a large group of functionally related genes likely participate in similar or related biological process. Likewise, other clustering methods mentioned herein can also group genes together that encode proteins with related biological function.
- genes that are clustered together reflect a particular biological function, and are termed gene expression signatures ( Shaffer et al., Immunity 15: 375-85 (2001 )).
- gene expression signatures include genes that are characteristically expressed in a particular cell type or at a particular stage of cellular differentiation or activation.
- Another general type of gene expression signature includes genes that are regulated in their expression by a particular biological process such as proliferation, or by the activity of a particular transcription factor or signaling pathway.
- the pattern of gene expression in a biological sample can provide a distinctive and accessible molecular picture of its functional state and identity ( DeRisi et al., Science, 278: 680-86 (1997 ); Cho et al., Mol. Cell., 2: 65-73 (1998 ); Chu et al., Science, 282: 699-705 (1998 ); Holstege et al., Cell., 95: 717-728 (1998 ); Spellman et al., Mol. Biol. Cell, 9: 3273-97 (1998 )).
- Each cell transduces variations in its environment, internal state, and developmental state into readily measured and recognizable variations in its gene expression patterns. Two different samples with related gene expression patterns are therefore likely to be biologically and functionally similar to one another.
- a specific gene expression signature in a sample can provide important biological insights into its cellular composition and the function of various intracellular pathways within those cells.
- the expression pattern of genes in the germinal center B cell signature in a lymphoma biopsy indicates that the lymphoma includes cells derived from the germinal center stage of differentiation.
- the expression of genes from the T cell signature can be used to estimate the degree of infiltration of the tumor by host T cells, while the expression of genes from the proliferation signature can be used to quantitate the tumor cell proliferation rate.
- gene expression signatures provide an "executive summary" of the biological properties of a tumor specimen. Gene expression signatures can also be helpful in interpreting the results of a supervised analysis of gene expression data.
- a supervised analysis generates a list of genes with expression patterns that correlate with survival. Gene expression signatures can be useful in assigning these "predictive" genes to functional categories. In building a multivariate model of survival based on gene expression data, this functional categorization helps to limit the inclusion of multiple genes in the model that measure the same aspect of tumor biology.
- the model of the invention generates a survival predictor score, with a higher score being associated with worse clinical outcome.
- the resulting model can be used separately to predict a survival outcome.
- the model can be used in conjunction with one or more other models, disclosed herein or in other references, to predict a survival outcome.
- the present invention discloses several gene expression signatures related to the clinical outcome of DLBCL patients.
- the signatures were identified using the clinical data and methods described below in Examples 1 and 2.
- Three of these gene expression signatures are the germinal center B cell (GCB) signature, the stromal-1 signature, and the stromal-2 signature.
- GCB germinal center B cell
- stromal-1 signature the stromal-1 signature
- stromal-2 signature Each component gene of these signatures is identified in Table 1 according to its GenBank accession number, its GeneID assigned by Entrez Gene, a common gene symbol, and a descriptive gene title.
- Table 1 also provides the Affymetrix Probe Set ID, which can be used (e.g., on the Affymetrix U133+ (Affymetrix, Santa Clara, CA) microarray) to determine the gene expression level for the indicated gene.
- the computer-readable sequence listing filed herewith includes a representative fragment sequence (of about 100 bp or greater) for each genomic target sequence listed in Table 1, followed by the sequence for each probe in the corresponding Affymetrix probe set listed in Table 1.
- the DLBCL survival predictors of the invention were generated using expression data and methods described in Examples 1 and 2, below.
- A is an offset term
- (x) and (y) are scale factors.
- the GCB signature value and the stromal-1 signature value can correspond to the average of the expression levels of all genes in the GCB signature and the stromal-1 signature, respectively.
- a lower survival predictor score indicates a more favorable survival outcome, and a higher survival predictor score indicates a less favorable survival outcome for the subject.
- the bivariate survival predictor was refined into a multivariate survival predictor that incorporates GCB, stromal-1, and stomal-2 gene expression signatures. Fitting the Cox proportional hazards model to the gene expression data obtained from these three signatures resulted in a multivariate model survival predictor score calculated using the following generalized equation:
- General multivariate DLBCL survival predictor score A - x * GCB signature value - y * stromal - 1 signature value + z * stroma ⁇ 1 - 2 signature value .
- A is an offset term, while (x), (y), and (z) are scale factors.
- the GCB signature value, the stromal-1 signature value, and the stromal-2 signature value can correspond to the average of the expression levels of all genes in the GCB signature, the stromal-1 signature, and the stromal-2 signature, respectively.
- a lower survival predictor score indicates a more favorable survival outcome and a higher survival predictor score indicates a less favorable survival outcome for the subject.
- the offset term (A) or (8.11) can be varied without affecting the equation's usefulness in predicting clinical outcome.
- Scale factors (x), (y), and (z) can also be varied, individually or in combination.
- scale factor (x) can be from about 0.200 or more, from about 0.225 or more, from about 0.250 or more, from about 0.275 or more, from about 0.300, from about 0.325 or more, from about 0.350 or more, from about 0.375 or more, or from about 0.400 or more.
- scale factor (x) can be about 0.625 or less, about 0.600 or less, about 0.575 or less, about 0.550 or less, about 0.525 or less, about 0.500 or less, about 0.475 or less, about 0.450 or less, or about 0.425 or less.
- scale factor (z) can be one that is bounded by any two of the previous endpoints.
- scale factor (x) can be a value from 0.200-0.625, from 0.350-0.550, from 0.350-0.475, or from 0.400-0.425.
- scale factor (y) can be from about 0.800 or more, from about 0.825 or more, from about 0.850 or more, from about 0.875 or more, from about 0.900or more, from about 0.925 or more, from about 0.950 or more, from about 0.975 or more, or from about 1.000 or more.
- scale factor (y) can be, e.g., about 1.250 or less, e.g., about 1.225 or less, about 1.200, about 1.175 or less, about 1.150 or less, about 1.125 or less, about 1.100 or less, about 1.075 or less, about 1.050 or less, or about 1.025 or less.
- scale factor (y) can be one that is bounded by any two of the previous endpoints.
- scale factor (y) can be a value from 0.800-1.250, a value from 0.950-1.1025, a value from 0.950-1.200 or a value from 1.000-1.025.
- scale factor (z) can be from about 0.450 or more, about 0.475 or more, about 0.500 or more, about 0.525 or more, about 0.550 or more, about 0.575 or more, about 0.600 or more, about 0.625 or more, or about 0.650 or more.
- scale factor (z) can be, e.g., about 0.900 or less, e.g., about 0.875 or less, about 0.850, about 0.825 or less, about 0.800 or less, about 0.775 or less, about 0.750 or less, or about 0.725 or less.
- scale factor (z) can be one that is bounded by any two of the previous endpoints.
- scale factor (z) can be a value from 0.450-0.900, any value from 0.650-0.725, any value from 0.625-0.775 or any value from 0.650-0.700.
- the invention includes any set of scale factors (x), (y), and (z) in conjunction in the general multivariate DLBCL survival predictor score that creates a function that is monotonically related to a multivariate DLBCL survival predictor score equation using any combination of the foregoing specified scale factor (x), (y), and (z) values.
- a survival predictor score can be calculated using fewer than all of the gene components of the GCB signature, the stromal-1 signature, and/or the stromal-2 signature listed in Table 1.
- the survival prediction equations disclosed herein can be calculated using mathematical combinations of the expressions of 98% (38), 95% (37), 93% (36), or 90% (35) of the genes listed in Table 1 for the GCB signature, about 99% (about 280), about 98% (about 277), 97% (about 275), about 96% (about 272), about 95% (about 270), about 94% (about 266), about 93% (about 263), about 92% (about 260), about 91% (about 257), or about 90% (about 255) of the genes listed in Table 1 for the stromal-1 signature, and/or 99% (71), 97% (70), 96% (69), 95% (68) 93% (67), 92% (66), or 90% (65) of the genes listed in Table 1 for the stromal-2 signature (instead
- the survival prediction equations disclosed herein can be calculated using mathematical combinations of the expressions of 88% (34 genes), 85% (33 genes), 82% (32 genes), 80% (31 genes) of the genes listed in Table 1 for the GCB signature, about 89% (about 252), about 88% (about 249), about 87% (about 246), about 86% (about 243), about 85% (about 241), about 84% (about 238), about 83% (about 235), about 82% (about 232), about 81% (about 229), or about 80% (about 226) of the genes listed in Table 1 for the stromal-1 signature, and/or 89% (64), 88% (63), 86% (62), 85% (61), 83% (60), 82% (59) or 80% (58) of the genes listed in Table 1 for the stromal-2 signature (instead of using all of the genes corresponding to a gene signature in Table 1 to calculate the GCB signature value, the stromal-1 signature value, and/or stromal-2 signature value
- the invention also provides a method of using a DLBCL survival predictor score to predict the probability of a survival outcome beyond an amount of time t following treatment for DLBCL.
- P(SO) is the subject's probability of the survival outcome beyond time t following treatment for DLBCL
- SO 0 (t) is the probability of survival outcome, which corresponds to the largest time value smaller than t in a survival outcome curve
- (s) is a scale factor.
- Treatment for DLBCL can include chemotherapy and the administration of Rituximab.
- a survival curve can be calculated using statistical methods, such as the Cox Proportional Hazard Model. Additional information regarding survival outcome curves is set forth in Lawless, Statistical Models and Methods for Lifetime Data, John Wiley and Sons (New York 1982 ) and Kalbyak et al., Biometrika, 60: 267-79
- the method of the invention includes calculating the probability of overall survival for a subject beyond an amount of time t following treatment for DLBCL.
- P(OS) is the subject's probability of overall survival beyond time t following treatment for DLBCL
- SO 0 (t) is the curve probability of survival outcome, which corresponds to the largest time value in a survival curve which is smaller than t
- scale factor (s) 1.
- Treatment for DLBCL can include chemotherapy alone or in combination with the administration of Rituximab (R-CHOP).
- the method of the invention includes calculating the probability of progression-free survival for a subject beyond an amount of time t following treatment for DLBCL.
- P(PFS) is the subject's probability of progression-free survival beyond time t following treatment for DLBCL
- SO 0 (t) is the curve probability of progression-free survival, which corresponds to the largest time value in a survival curve which is smaller than t
- the general equation scale factor (s) 0.976.
- the treatment for DLBCL can include chemotherapy alone or in combination with the administration of Rituximab (R-CHOP).
- the scale factor in the foregoing P(PFS) can be varied such that (instead of 0.976) scale factor (s) is a value between 0.970 and 0.980, e.g. 0.971, 0.972, 0.973, 0.973, 0.974, 0.975, 0.977, 0.978, and 0.979.
- the invention further provides a targeted array that can be used to detect the expression levels of all or most of the genes in a germinal center B cell gene (GCB) expression signature, a stromal-1 gene expression signature, and/or a stromal-2 gene expression signature.
- GEB germinal center B cell gene
- a targeted array is an array directed to a limited set of genes and thus differs from a whole genome array.
- the targeted array of the invention can include probes for fewer than 10,000 genes, fewer than 8,000 genes, fewer than 7,000 genes, fewer than 6,000 genes, fewer than 5,000 genes, or fewer than 4,000 genes.
- the targeted array includes probes for at least 80% of the genes in a germinal center B cell gene (GCB) expression signature, a stromal-1 gene expression signature, and/or a stromal-2 gene expression signature.
- GCB germinal center B cell gene
- the targeted arrays of the invention can be used, for example, to detect expression levels for use in the methods described herein.
- the invention provides a targeted array that includes probes for all of the genes in the stromal-1 gene expression signature.
- the invention also provides a targeted array that includes probes for all of the genes in the stromal-2 gene expression signature.
- the invention provides a targeted array that includes probes for all of the genes in the stromal-1 gene expression signature and all of the genes in the stromal-2 gene expression signature.
- the invention provides a targeted array that includes probes for all of the genes in the stromal-1 gene expression signature, all of the genes in the stromal-2 gene expression signature, and all of the genes in the GCB signature.
- the arrays of the invention can include 98% (38), 95% (37), 93% (36), or 90% (35) of the genes listed in Table 1 for the GCB signature, about 99% (about 280), about 98% (about 277), 97% (about 275), about 96% (about 272), about 95% (about 270), about 94% (about 266), about 93% (about 263), about 92% (about 260), about 91% (about 257), or about 90% (about 255) of the genes listed in Table 1 for the stromal-1 signature, and/or 99% (71), 97% (70), 96% (69), 95% (68) 93% (67), 92% (66), or 90% (65) of the genes listed in Table 1 for the stromal-2 signature (instead of all of the genes listed in Table 1 for the GCB signature average, the stromal-1 signature average, and/or stromal-2 signature average, respectively).
- the arrays of the invention can include 88% (34 genes), 85% (33 genes), 82% (32 genes), 80% (31 genes) of the genes listed in Table 1 for the GCB signature, about 89% (about 252), about 88% (about 249), about 87% (about 246), about 86% (about 243), about 85% (about 241), about 84% (about 238), about 83% (about 235), about 82% (about 232), about 81% (about 229), or about 80% (about 226) of the genes listed in Table 1 for the stromal-1 signature, and/or 89% (64), 88% (63), 86% (62), 85% (61), 83% (60), 82% (59) or 80% (58) of the genes listed in Table 1 for the stromal-2 signature (instead of all of the genes listed in Table 1 for the GCB signature average, the stromal-1 signature average, and/or stromal-2 signature average, respectively).
- Pre-treatment tumor biopsy specimens and clinical data were obtained from 414 patients with de novo DLBCL treated at 10 institutions in North America and Europe and studied according to a protocol approved by the National Cancer Institute's Institutional Review Board.
- Patients included in a "LLMP CHOP cohort" of 181 patients were treated with anthracycline-based combinations, most often cyclophosphamide, doxorubicin, vincristine, and prednisone (CHOP) or similar regimens, as previously described ( Rosenwald et al., N. Engl. J. Med., 346: 1937-47 (2002 )).
- the remaining 233 patients constituted an R-CHOP cohort that received similar chemotherapy plus Rituximab.
- the median follow-up in the R-CHOP cohort was 2.1 years (2.8 years for survivors).
- a panel of expert hematopathologists confirmed the diagnosis of DLBCL using current WHO criteria. Additional clinical patient characteristics for the R-CHOP cohort are described in Table 2. Additional analysis used a second "MMMNLP CHOP" cohort of 177 patients studied by the Molecular Mechanisms of Non-Hodgkin's Lymphoma Network Project ( Hummel et al., N. Engl. J. Med., 354: 2419-30 (2006 )).
- Gene expression profiling was performed using Affymetrix U133+ 2.0 microarrays. Gene expression profiling data are available through the National Center for Biotechnology Information web site as described in Lenz et al., New Engl. J. Med, 359: 2313-23 (2008 ), at page 2314. All gene expression array data were normalized using MAS 5.0 software, and were log2 transformed. To account for technical differences in the microarray processing between the R-CHOP cohort data and the LLMPP CHOP cohort data, the expression values of each gene in the R-CHOP cohort data were adjusted so that its median matched the median of the LLMPP CHOP data.
- the remaining fourth gene expression signature was not associated with survival in the R-CHOP cohort (see MHC class II signature panel in Figure 1C ).
- tumors with extremely low "outlier" expression of this signature were associated with inferior survival in both CHOP cohorts (see Figures 8A and 8B ), but not in the R-CHOP cohort (see Figure 8C ).
- future clinical trials in DLBCL should incorporate quantitative methods to discern these biological differences so that patient cohorts in different trials can be compared and treatment responses can be related to defined tumor phenotypes.
- This example demonstrates the development of GCB, stromal-1, and stromal-2 survival signatures and a related multivariate model of survival for R-CHOP-treated DLBCL.
- LLMPP CHOP CHOP cohort data 936 genes were identified as associated with poor prognosis p ⁇ 0.01 (1-sided). For genes having multiple array probe sets associated with survival, only the probe set with the strongest association with survival was used. The expression values of the probe sets in the LLMPP CHOP cohort data were then clustered. The largest cluster with an average correlation of >0.6 and containing myc was identified as the proliferation survival signature. 1396 genes were identified as associated with favorable outcome. The largest cluster with average correlation of >0.6 and containing BCL6 was identified as the germinal center B cell (GCB) survival signature.
- GCB germinal center B cell
- a cluster with average correlation of >0.6 and containing FNl was identified as the stromal-1 survival signature, whereas another cluster with average correlation of >0.6 containing HLADRA was identified as the MHC class II survival signature.
- the expression levels of genes within each signature were then averaged to create a "signature average" for each biopsy specimen. For the MMMLNP CHOP data set, the average was calculated for those array elements represented on the Affymetrix U133A microarray.
- the CHOP training set was used to discover and refine signatures that added to the prognostic significance of this bivariate model, and the resulting multivariate models were tested in the R-CHOP cohort.
- 563 genes were identified as adding to the model in the direction of adverse prognosis. These genes were clustered by hierarchical clustering, and three clusters of more than 10 genes with an average correlation of >0.6 were identified.
- 542 genes were identified which added to the stromal-1 and GCB signature model in the direction of favorable prognosis. These genes were clustered, and two clusters of more than 10 genes with an average correlation of >0.6 were identified.
- Signature averages were determined for these clusters, and three variable models containing the stromal-1 and GCB signature and each of the cluster averages were formed on the MMMLNP CHOP and R-CHOP data sets. Of the five cluster averages, two were found to add statistical significance (p ⁇ 0.02) in the MMMLNP CHOP data as compared to a model containing the stromal-1 and GCB signatures alone. By contrast, in the R-CHOP data, three of the five cluster averages were found to add significance (p ⁇ 0.02) to the bivariate model. One of these cluster averages added significantly to the bivariate model in both the MMMLNP CHOP and R-CHOP data. This signature, designated Signature 122, was also found to add to the stromal-1 and GCB signature far more significantly than any of the four other signatures on the LLMPP CHOP data and, thus, was retained for further analysis.
- This Signature 122 positively correlated with the stromal-1 signature, although it was associated with adverse survival when added to the bivariate model.
- we identified genes that were more correlated with Signature 122 than with the stromal-1 signature (p ⁇ 0.02). These genes were organized by hierarchical clustering, and three sets of correlated genes (r>0.6) were observed. One of these clusters, the stromal-2 signature, added to the significance of the bivariate model in both the MMMLNP CHOP cohort (p 0.002) and the R-CHOP cohort (p ⁇ 0.001) ( Figures 2B and 9D).
- a multivariate survival model was formed by fitting a Cox model with the GCB, stromal-1, and stomal-2 signatures to the LLMPP CHOP cohort data shown in Table 3. This final multivariate model with its associated scaling coefficients was then evaluated on the MMLLMPP CHOP and R-CHOP cohort data sets. Survival predictor scores from the final model were used to divide the R-CHOP cohort into quartile groups with 3-year overall survival rates of 89%, 82%, 74%, and 48%, and 3-year progression-free survival rates of 84%, 69%, 61% and 33% ( Figure 2B ). The survival predictor scores from the final model are illustrated in Figure 3 along with the three component signatures and representative genes of each signature.
- IPI International Prognostic Index
- the inventive gene expression-based survival model retained its prognostic significance among R-CHOP-treated patients segregated according to IPI into high, intermediate and low IPI risk groups, both as originally defined (Shipp et al., supra) (p ⁇ 0.001) ( Figure 2C ) and as recently modified for R-CHOP-treated DLBCL (Sehn et al., supra) (p ⁇ 0.001) ( Figure 10 ).
- the gene expression-based multivariate model can be used to identify large disparities in survival among patients with different DLBCL gene signature profiles.
- survival predictor scores were used to divide patients into least and most favorable quartile groups having 3-year progression-free survival rates of 33% and 84%, respectively.
- the gene expression-based survival predictor provides a complementary view of DLBCL variation that can be considered when analyzing data from DLBCL clinical trials.
- whole-genome gene expression profiles in conjunction with the survival model described herein can be used to provide optimal predictions of expected survival outcomes for subjects suffering from DLBCL.
- This example demonstrates the use of a survival predictor score to predict the probability of progression free and overall survival outcomes at a period of time t following R-CHOP treatment in accordance with the invention.
- RNA is isolated from a patient's DLBCL biopsy and hybridized to a U133+ array from Affymetrix (Santa Clara, CA). The array is scanned, and MAS 5.0 algorithm is applied to obtain signal values normalized to a target intensity of 500. Signal values are log2 transformed to intensity values. For genes of interest with multiple probe sets, the intensity value of the multiple probe sets are averaged to obtain a single intensity value for each gene. The single intensity values of genes in the GCB signature are averaged to obtain a GCB signature average of 9.2. The single intensity values of genes in the stromal-1 signature are averaged to obtain a stromal-1 signature average of 8.5. The single intensity values of genes in the stromal-2 signature are averaged to obtain a stromal-2 signature average of 7.2.
- Table 4 includes values from a progression free survival curve generated using baseline hazard functions calculated from the R-CHOP patient data described in Table 3. The curve was generated in accordance with the methods of Kalbées and Prentice, Biometrika, 60: 267-279 (1973 ), which involves maximizing the full likelihood, under the assumption that the true scaling coefficients were equal to prior estimates.
- F 0 (t) is the probability of progression free survival for each indicated time period following R-CHOP treatment (t-RCHOP).
- the largest time value smaller than 2 is 1.919, and the corresponding PF 0 (t) value is 0.705.
- Table 5 includes values from an overall survival curve generated using baseline hazard functions calculated from the R-CHOP patient data described in Table 3. The curve was made according to the method of Kalbées and Prentice, Biometrika, 60: 267-279 (1973 ), which involves maximizing the full likelihood, under the assumption that the true scaling coefficients were equal to our estimates.
- OS 0 (t) is the probability of overall survival for each indicated time period following R-CHOP treatment (t-RCHOP).
- OS 0 (t) is the value that corresponds to the largest time value in the overall survival curve which is smaller than 2 years.
- the largest time value smaller than 2 is 1.889
- the corresponding OS 0 (t) value is 0.791.
- This example demonstrates the biological basis for DLBCL prognostic signatures.
- Example 2 To assess whether the gene expression signatures in the final survival model of Example 2 were derived from the malignant lymphoma cells or from the host microenvironment, three DLBCL biopsy samples were fractionated into CD19+ malignant cells and CD19- non-malignant cells by flow sorting. Most germinal center B cell signature genes were more highly expressed in the malignant fraction, whereas genes from the stromal-1 and stromal-2 signatures were more highly expressed in the non-malignant stromal fraction ( Figure 4A ), hence their name. Since these two signatures were synergistic in predicting survival, they were combined into a "stromal score" ( Figure 3 ), high values of which were associated with adverse outcome.
- the germinal center B cell signature relates to the distinction between the ABC and GCB DLBCL subtypes ( Figure 3 ).
- the genes defining the stromal-1 signature encodes components of the extracellular matrix, including fibronectin, osteonectin, various collagen and laminin isoforms, and the anti-angiogenic factor thrombospondin ( Figure 3 and Table 1).
- This signature also encodes modifiers of collagen synthesis (LOXL1, SERPINH1 ), proteins that remodel the extracellular matrix ( MMP2, MMP9, MMP14, PLAU, TIMP2), and CTGF, a secreted protein that can initiate fibrotic responses ( Frazier et al., J. Invest. Dermatol., 107(3): 404-11 (1996 )).
- the stromal-1 signature includes genes characteristically expressed in cells of the monocytic lineage, such as CEBPA and CSF2RA.
- the stromal-1 signature is significantly related to several previously curated gene expression signatures ( Shaffer et al., Immunol. Rev., 210: 67-85 (2006 )) based on gene set enrichment analysis ( Subramanian et al., Proc. Nat'l. Acad. Sci. USA, 102(43): 15545-50 (2005 )).
- Two of these signatures include genes that are coordinately expressed in normal mesenchymal tissues but not in hematopoietic subsets, many of which encode extracellular matrix proteins (false discovery rate (FDR) ⁇ 0.001) ( Figures 4B and 11 ) ( Su et al., Proc. Nat'l. Acad. Sci.
- the stromal-1 signature gene product fibronectin was prominently localized by immunohistochemistry to fibrous strands running between the malignant cells in DLBCL biopsy samples, in keeping with its role in extracellular matrix formation.
- the protein products of three other stromal-1 genes - MMP9, SPARC, and CTGF - were localized primarily in histiocytic cells that infiltrated the DLBCL biopsies.
- SPARC and CTGF colocalized with CD68, which is a marker for cells in the monocytic lineage.
- SPARC protein levels were associated with favorable overall survival ( Figure 5A ).
- the stromal-1 signature includes genes that are coordinately expressed in many normal mesenchymal tissues, most of which encode proteins that form or modify the extracellular matrix.
- the localization of fibronectin to fibrous strands insinuated between the malignant lymphoma cells suggests that the stromal-1 signature reflects the fibrotic nature of many DLBCL tumors.
- This fibrotic reaction may be related to another stromal-1 signature component, CTGF, which participates in many fibrotic responses and diseases, and promotes tumor growth and metastasis of epithelial cancers ( Shi-Wen et al., Cytokine Growth Factor Rev., 19: 133-44 (2008 )).
- the stromal-1 signature reflects a monocyte-rich host reaction to the lymphoma that is associated with the abundant deposition of extracellular matrix.
- Tumors with high expression of the stromal-1 signature were infiltrated by cells of the myeloid lineage, which include cells that have been implicated in the pathogenesis of epithelial cancers, including tumor-associated macrophages, myeloid-derived suppressor cells, and Tie2-expressing monocytes (reviewed in Wels et al., Genes Dev., 22: 559-74 (2008 )).
- these myeloid lineage cells promote tumor cell invasion by secreting matrix metalloproteinases such as MMP9, suppress T cell immune responses, and initiate angiogenesis.
- stromal-2 signature genes encode well-known markers of endothelial cells. These include von-Willebrand factor ( VWF ) and CD31 ( PECAM1 ), as well as other genes specifically expressed in endothelium such as EGFL7, MMRN2, GPR116, and SPARCL (Table 1).
- VWF von-Willebrand factor
- PECAM1 CD31
- other genes specifically expressed in endothelium such as EGFL7, MMRN2, GPR116, and SPARCL (Table 1).
- This signature also includes genes encoding key regulators of angiogenesis, such as, for example, KDR (VEGF receptor-2); Grb10, which mediates KDR signaling; integrin alpha 9, which enhances VEGF signaling; TEK, the receptor tyrosine kinase for the cytokine angiopoietin; ROBO4, an endothelial-specific molecular guidance molecule that regulates angiogenesis; and ERG, a transcription factor required for endothelial tube formation.
- KDR VEGF receptor-2
- Grb10 which mediates KDR signaling
- integrin alpha 9 which enhances VEGF signaling
- TEK the receptor tyrosine kinase for the cytokine angiopoietin
- ROBO4 an endothelial-specific molecular guidance molecule that regulates angiogenesis
- ERG a transcription factor required for endothelial tube formation.
- stromal-2 signature includes a large number of genes expressed in endothelial cells, other genes are expressed exclusively in adipocytes, including ADIPOQ, FABP4, RBP4, and PLIN.
- the stromal-1 and stromal-2 gene expression signatures reflect the character of the non-malignant cells in DLBCL tumors, and the stromal-2 signature may represent an "angiogenic switch" in which the progression of a hyperplastic lesion to a fully malignant tumor is accompanied by new blood vessel formation ( Hanahan et al., Cell, 86: 353-64 (1996 )). DLBCL tumors with high relative expression of the stomal-2 signature were associated with increased tumor blood vessel density and adverse survival.
- CXCL12 SDF-1
- stromal-2 signature component is a chemokine secreted either by fibroblasts or endothelial cells that can promote angiogenesis by recruiting CXCR4+ endothelial precursor cells from the bone marrow ( Orimo et al., Cell, 121: 335-48 (2005 )).
- an antagonist of angiogenesis is a stromal-1 signature component, which may explain why tumors with low relative expression of this signature had an elevated blood vessel density.
- thrombospondin-2 Kazerounian et al., Cell Mol. Life Sci., 65: 700-12 (2008 )
- a stromal-1 signature component which may explain why tumors with low relative expression of this signature had an elevated blood vessel density.
- the expression of adipocyte-associated genes in DLBCL tumors with high stromal-2 signature expression may play a role in angiogenesis since some cells in adipose tissue may have the potential to differentiate into endothelial cells ( Planat-Benard et al., Circulation, 109: 656-63 (2004 )).
- adipose-associated genes may reflect the recruitment of bone marrow-derived mesenchymal stem cells, which home efficiently to tumors ( Karnoub et al., Nature, 449: 557-63 (2007 )) and can stabilize newly formed blood vessels ( Au et al., Blood, 111:. 4551-4558 (2008 )).
- the stromal-1 and stromal-2 gene signatures can be used to generate a stromal score that correlates with increased blood vessel density.
- the stromal score can be used to determine if a DLBCL patient is likely to benefit from administration of antiangiogenic therapy (alone, or in conjunction with another DLBCL therapeutic regimen).
Landscapes
- Health & Medical Sciences (AREA)
- Life Sciences & Earth Sciences (AREA)
- Chemical & Material Sciences (AREA)
- Engineering & Computer Science (AREA)
- Immunology (AREA)
- Molecular Biology (AREA)
- Organic Chemistry (AREA)
- Pathology (AREA)
- Analytical Chemistry (AREA)
- General Health & Medical Sciences (AREA)
- Hematology (AREA)
- Urology & Nephrology (AREA)
- Biomedical Technology (AREA)
- Proteomics, Peptides & Aminoacids (AREA)
- Microbiology (AREA)
- Physics & Mathematics (AREA)
- Biotechnology (AREA)
- Biochemistry (AREA)
- Medicinal Chemistry (AREA)
- Genetics & Genomics (AREA)
- Wood Science & Technology (AREA)
- Zoology (AREA)
- Cell Biology (AREA)
- Food Science & Technology (AREA)
- General Physics & Mathematics (AREA)
- Biophysics (AREA)
- Bioinformatics & Cheminformatics (AREA)
- General Engineering & Computer Science (AREA)
- Hospice & Palliative Care (AREA)
- Oncology (AREA)
- Nuclear Medicine, Radiotherapy & Molecular Imaging (AREA)
- Pharmacology & Pharmacy (AREA)
- Public Health (AREA)
- Animal Behavior & Ethology (AREA)
- Veterinary Medicine (AREA)
- General Chemical & Material Sciences (AREA)
- Chemical Kinetics & Catalysis (AREA)
- Measuring Or Testing Involving Enzymes Or Micro-Organisms (AREA)
- Medicines Containing Material From Animals Or Micro-Organisms (AREA)
Description
- The current standard of care for the treatment of diffuse large B cell lymphoma (DLBCL) includes anthracycline-based chemotherapy regimens such as CHOP in combination with the administration of the anti-CD20 monoclonal antibody Rituximab. This combination regimen (R-CHOP) can cure about 60% of patients and has improved the overall survival of DLBCL patients by 10-15% (Coiffier et al., N. Engl. J. Med., 346: 235-42 (2002)). Nonetheless, the molecular basis of response or resistance to this therapy is unknown.
- DLBCL is a molecularly heterogeneous disease (Staudt et al., Adv. Immunol., 87: 163-208 (2005)), and different molecular subtypes of DLBCL can have very different prognoses following treatment. For example, gene expression profiling has identified two molecular subtypes of DLBCL that are biologically and clinically distinct (Rosenwald et al., N. Engl. J. Med., 346: 1937-47 (2002); Alizadeh et al., Nature, 403: 503-11 (2000)). The germinal center B cell-like (GCB) DLBCL subtype likely arises from normal germinal center B cells, whereas the activated B cell-like (ABC) DLBCL subtype may arise from a post-germinal center B cell that is blocked during plasmacytic differentiation. Many oncogenic mechanisms distinguish these subtypes: GCB DLBCLs have recurrent t(14,18) translocations, whereas ABC DLBCLs have
recurrent trisomy 3 and deletion of the INK4a/ARF locus as well as constitutive activation of the anti-apoptotic NF-kB signalling pathway (Rosenwald et al., N. Engl. J. Med., 346: 1937-47 (2002); Bea et al., Blood, 106: 3183-90 (2005); Tagawa et al., Blood, 106: 1770-77 (2005); Davis et al., J. Exp. Med., 194:1861-74 (2001); Ngo et al., Nature, 441: 106-10 (2006); Lenz et al., Science, 319: 1676-79 (2008)). When treated with CHOP-like chemotherapy, the overall survival rates of patients with GCB DLBCL and ABC DLBCL were 60% and 30%, respectively (Wright et al., Proc. Nat'l. Acad. Sci. USA, 100: 9991-96 (2003)). Thus, the prognosis for different DLBCL can vary widely. - A separate analytical approach identified four gene expression signatures that reflect distinct DLBCL tumor attributes and that were associated with distinct survival profiles in CHOP-treated DLBCL patients (Rosenwald et al., N. Engl. J. Med., 346: 1937-47 (2002)). A "germinal center B cell" (GCB) signature was associated with a favorable prognosis and paralleled the distinction between ABC and GCB DLBCL. The "proliferation" signature was associated with an adverse prognosis and included MYC and its target genes. The "MHC class II" signature was silenced in the malignant cells in a subset of DLBCL cases, an event that was associated with inferior survival (Rosenwald et al., N. Engl. J. Med., 346: 1937-47 (2002); Rimsza et al., Blood, 103: 4251-58 (2004)). A fourth prognostic signature, termed "lymph node" signature was associated with favorable prognosis and included components of the extracellular matrix, suggesting that it reflects the nature of the tumor-infiltrating non-malignant cells. These signatures predicted survival in a statistically independent fashion, indicating that multiple biological variables dictate the response to CHOP chemotherapy in DLBCL.
- Reports have suggested that the benefit of Rituximab immunotherapy might be restricted to certain molecular subtypes of DLBCL. High expression of BCL-2 or low expression of BCL-6 was associated with inferior survival with CHOP therapy. However, this distinction disappeared with R-CHOP therapy (Mounier et al., Blood, 101: 4279-84 (2003); Winter et al., Blood, 107: 4207-13 (2006)). Immunohistochemistry has also been used to distinguish DLBCLs with a germinal center versus post-germinal center phenotype. Although such immunohistochemical phenotypes were prognostically significant in CHOP-treated cases, they were not prognostic for R-CHOP-treated cases (Nyman et al., Blood, 109: 4930-35 (2007)).
-
WO2005/024043 discloses a method for predicting survival in a diffuse large B-cell lymphoma (DLBCL) subject, comprising the steps of: - a). obtaining a biopsy from said subject, and isolating RNA from the samples;
- b). obtaining gene expression data for a set of genes in said biopsy sample. The gene expression level of genes from a germinal B-cell gene center comprises a GCB gene expression signature, the gene expression level of genes from a lymph node comprises a lymph node gene expression signature, the gene expression level of genes from proliferation comprises a proliferation gene expression signature and the gene expression level of genes from MHC class II activity comprises a MHC class II gene expression signature;
- c). averaging the gene expression level of genes from said signatures to obtain said respective gene expression signature values; and
- d). calculating a survival predictor score using an equation, wherein a higher survival predictor score is associated with worse survival.
-
WO2005/024043 is silent of R-CHOP treated cases. - Accordingly, there is a need for new methods of distinguishing among DLBCL subtypes that is prognostically significant for R-CHOP-treated patients.
- The invention provides methods and arrays related to a gene expression-based survival predictor for DLBCL patients, including patients treated with the current standard of care, which includes chemotherapy and the administration of Rituximab.
- The invention provides a method of predicting survival outcome based on one or more diffuse large B cell lymphoma (DLBCL) samples. The method includes isolating gene expression products from one or more DLBCL biopsy samples from a subject treated with a therapeutic regimen that includes chemotherapy and Rituximab (R-CHOP). The method further comprises obtaining a gene expression profile from the gene expression products, wherein the expression profile comprises an expression level for each of at least 31 of the genes listed in Table 1 for the germinal center B cell (GCB) gene expression signature and at least 226 of the genes listed in Table 1 for the stromal-1 gene expression signature. The method also includes determining a GCB signature value and a stromal-1 signature value from the gene expression profile, wherein the GCB signature value is an average of the expression levels of the at least 31 genes listed in Table 1 for the GCB gene expression signature and the stromal-1 signature value is an average of the expression levels of the at least 226 genes listed in Table 1 for the stromal-1 gene expression signature. A survival predictor score which is equal to A - [(x)*(the GCB signature value)] - [(y)*(the stromal-1 signature value)] is calculated, wherein A is an offset term, (x) is a scale factor between 0.200 and 0.625, and (y) is a scale factor between 0.800 and 1.250. The method further includes determining the survival outcome for the subject based on the survival predictor score calculated for any fixed same value of A and for any fixed same values of (x) and (y), wherein a lower survival predictor score indicates a more favorable survival outcome and a higher survival predictor score indicates a less favorable survival outcome for the subject.
- The invention also provides a method of predicting survival outcome based on one or more diffuse large B cell lymphoma (DLBCL) samples. The method comprises isolating gene expression products from one or more DLBCL biopsy samples from a subject treated with a therapeutic regimen that includes chemotherapy and Rituximab (R-CHOP). The method further includes obtaining a gene expression profile from the gene expression products, wherein the gene expression profile comprises an expression level for each of at least 31 of the genes listed in Table 1 for the germinal center B-cell gene (GCB) expression signature, at least 226 of the genes listed in Table 1 for the stromal-1 gene expression signature, and at least 58 of the genes listed in Table 1 for the stromal-2 gene expression signature. The method also comprises determining a GCB signature value, a stromal-1 signature value, and a stromal-2 signature value from the gene expression profile, wherein the GCB signature value is an average of the expression levels of the at least 31 genes listed in Table 1 for the GCB gene expression signature and the stromal-1 signature value is an average of the expression levels of the at least 226 genes listed in Table 1 for the stromal-1 gene expression signature and the stromal-2 signature value is an average of the expression levels of the at least 58 genes listed in Table 1 for the stromal-2 gene expression signature. A survival predictor score is calculated using the equation: survival predictor score = A - [(x)*(the GCB signature value)] - [(y)*(the stromal-1 signature value)] + [(z)*(the stromal-2 signature value)], wherein A is an offset term and (x) is a scale factor between 0.200 and 0.625, (y) is a scale factor between 0.800 and 1.250, and (z) is a scale factor between 0.450 and 0.900. The method further comprises calculating the probability of a survival outcome for the subject beyond an amount of time t following treatment for DLBCL, wherein the subject's probability of the survival outcome P(SO) is calculated using the equation: P(SO) = SO0(t)(exp((s)*survival predictor score)), wherein SO0(t) is the probability of the survival outcome, which corresponds to the largest time value smaller than t in a survival outcome curve, and wherein (s) is a scale factor between 0.970 and 0.980.
- The invention further provides a targeted array comprising at least one probe or set of probes for each gene in (a) a germinal center B-cell gene (GCB) expression signature comprising at least 31 of the GCB signature genes listed in Table 1, (b) a stromal-1 gene expression signature comprising at least 226 of the stromal-1 signature genes listed in Table 1, and (c) a stromal-2 gene expression signature comprising at least 58 of the stromal-2 signature genes listed in Table 1, wherein the array comprises probes for fewer than 10,000 genes.
-
-
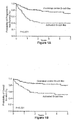
Figure 1A is a Kaplan-Meier estimates plot depicting the probability of progression-free-survival versus time (in years) of patients with GCB DLBCL and ABC DLBCL. The plot indicates that GCB patients have a more favorable, i.e., higher probability of progression-free survival rate than ABC patients for at least five years following R-CHOP therapy. -
Figure 1B a Kaplan-Meier estimates plot depicting the probability of overall survival versus time (in years) of patients with GCB DLBCL and ABC DLBCL. The plot indicates that GCB patients have a more favorable, i.e., higher probability, of overall survival than ABC patients for at least five years following R-CHOP therapy. -
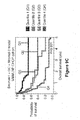
Figure 1C is a series of four Kaplan-Meier estimates plots depicting the probabilities of overall survival versus time (in years) in DLBCL patients. Each of the four plots correlates the probability of overall survival with the lymph node/stromal-1, germinal center B cell, proliferation, or MHC class II gene expression signature, respectively. Moreover, in each plot, the average expression of the signature genes in each biopsy sample was used to rank cases and divide the cohort into quartile groups as indicated. -
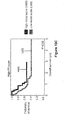
Figure 2A is a pair of Kaplan-Meier estimates plots depicting the probability of progression-free-survival and the probability of overall survival, as indicated, versus time (in years) among DLBCL patients treated with R-CHOP. Patient samples were ranked according to a bivariate model created using the germinal center B cell (GCB) and stromal-1 signatures and divided into quartile groups. -
Figure 2B is a pair of Kaplan-Meier plots depicting the probability of progression-free-survival and the probability of overall survival, as indicated, versus time (in years) among DLBCL patients treated with R-CHOP. Patient samples were ranked according to a survival predictor score derived from a model incorporating the germinal center B cell, stromal-1, and stromal-2 signatures and divided into quartile groups. -
Figure 2C is a series of three Kaplan-Meier estimates plots depicting the probability of overall survival versus time (in years) among R-CHOP treated DLBCL patients in the indicated low, intermediate, or high IPI risk groups. Patient samples were stratified according to the same survival predictor score used inFigure 2B , except that the first and second quartiles were merged, and the third and fourth quartiles were merged. -
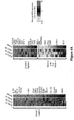
Figure 3 depicts the expression levels of the indicated GCB cell, stromal-1, and stromal-2 signature genes in ABC, GCB, and unclassified DLBCL biopsy samples. Relative levels of gene expression are depicted according to the scale shown. Shown at the bottom are the signature averages for each patient. Also shown is the stromal score, which is the component of the survival model contributed by the difference between the stromal-2 and stromal-1 signature averages. The survival predictor score is shown for each patient and was used to order the cases, after grouping into ABC DLBCL, GCB DLBCL, and unclassified categories. -
Figure 4A depicts the relative gene expression of stromal-1, stromal-2, and germinal center B cell signatures inCD 19+ malignant and CD19- non-malignant subpopulations of cells isolated from three biopsy specimens from patients with DLBCL. Stromal-1 and stromal-2 signature genes were more highly expressed in the non-malignant cells, whereas the germinal center B cell signature genes were more highly expressed in the malignant cells. The log2 ratios of gene expression levels in the CD19- subpopulation to those in the CD19+ subpopulations are depicted according to the scale shown. -
Figure 4B depicts the results of gene enrichment analysis comparing the stromal-1 gene signature with mesenchyme-1 and mesenchyme-2 signatures (from normal mesenchymal origin cells), with a monocyte signature expressed more highly in normal blood monocytes than in blood B, T, and NK cells, and in a pan-T cell signature expressed more highly in blood T cells than in blood B cells, NK cells, and monocytes. While a relationship was seen between stromal-1 signature and mesenchyme-1, mesenchyme-2, and monocyte signatures, no relationship was observed between the stromal-1 signature and a pan-T cell signature expressed more highly in blood T cells than in blood B cells, NK cells, and monocytes. The relative levels of gene expression are depicted according to the scale shown. -
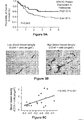
Figures 5A is a Kaplan-Meier estimates plot depicting the probability of overall survival versus time (in years) in DLBCL cases segregated according to SPARC protein expression levels, as indicated. -
Figure 5B is a pair of images showing the identification of tumor blood vessels by immunohistochemical analysis of CD34+ endothelial cells in representative DLBCL biopsies having low or high blood vessel density (CD34+ objects/µM2), as indicated. -
Figure 5C is a plot depicting the correlation between the tumor blood vessel density and the stromal score in analyzed DLBCL biopsies. -
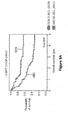
Figures 6A is a Kaplan-Meier estimates plot depicting the probability of overall survival versus time (in years) for "LLMPP CHOP" patients with DLBCL following therapy. The plot indicates that in this cohort, patients with GCB DLBCL show significantly superior overall survival compared to patients with ABC DLBCL following CHOP therapy. -
Figure 6B is a is a Kaplan-Meier estimates plot depicting depicting the probability of overall survival versus time (in years) for "MMMLNP CHOP" patients with DLBCL following therapy. In this cohort, patients with GCB DLBCL show significantly superior overall survival compared to patients with ABC DLBCL following CHOP therapy. -
Figure 7 is a set of four Kaplan-Meier estimates plots depicting the probability of overall survival versus time (in years) in a "MMMLNP CHOP" cohort. Each of the four plots correlates the probability of overall survival with the lymph node/stromal-1, germinal center B cell, proliferation, or MHC class II gene expression signature, respectively. Moreover, in each plot, the average expression of the signature genes in each biopsy sample was used to rank cases and divide the cohort into quartile groups as indicated. -
Figure 8A is a Kaplan-Meier estimates plot depicting the probability of overall survival versus time (in years) in a "LLMPP CHOP" cohort, which was divided according to MHC class II signature expression levels. Patients with low MHC class II signature expression have significantly inferior overall survival compared to patients with normal MHC class II expression. -
Figure 8B is a Kaplan-Meier estimates plot depicting the probability of overall survival versus time (in years) in a "MMMLNP CHOP" cohort, which was divided according to MHC class II signature expression levels. Patients with low MHC class II signature expression have significantly inferior overall survival compared to patients with normal MHC class II expression. -
Figure 8C is a Kaplan-Meier estimates plot depicting the probability of overall survival versus time (in years) in a "LLMPP R-CHOP" cohort, which was divided according to MHC class II signature expression levels. There was no significant difference in the overall survival of patients with low MHC class II signature expression as compared to patients with normal MHC class II expression. -
Figure 9A is a pair of Kaplan-Meier estimates plots depicting the probabilities of progression-free survival or overall survival, as indicated, versus time (in years) among patients grouped into quartiles according to a gene expression model consisting of stromal-1 signature, GCB signature, andsignature 122 following R-CHOP therapy. -
Figure 9B is a pair Kaplan-Meier estimates plots depicting the probabilities of overall survival versus time (in years) among "MMMLNP CHOP" cohort patients grouped into quartiles according to a gene expression model consisting of either stromal-1 signature and GCB signature or stromal-1, GCB signature, andsignature 122, as indicated, following CHOP therapy. -
Figure 9C is a Kaplan-Meier estimates plot depicting the probabilities of overall survival versus time (in years) among "MMMLNP CHOP" cohort patients grouped into quartiles according to a gene expression model consisting of stromal-1 signature, GCB signature, and stromal-2 signature following CHOP therapy. -
Figure 10A is a Kaplan-Meier estimates plot depicting the overall survival among low revised International Prognostic Index (IPI) risk group patients stratified according to the gene expression-based outcome predictor score. After grouping patients into quartiles according to gene expression-based outcome predictor score,quartiles quartiles -
Figure 10B is a Kaplan-Meier estimates plot depicting the overall survival among intermediate revised International Prognostic Index (IPI) risk group patients stratified according to the gene expression-based outcome predictor. After grouping patients into quartiles according to gene expression-based outcome predictor score,quartiles quartiles -
Figure 10C is a Kaplan-Meier estimates plot depicting the overall survival among high revised International Prognostic Index (IPI) risk group patients stratified according to the gene expression-based outcome predictor. After grouping patients into quartiles according to gene expression-based outcome predictor score,quartiles quartiles -
Figure 11 depicts normal mesenchymal-1 and normal mesenchymal-2 signature gene expression in various normal tissues. - The invention provides a gene expression-based survival predictor for DLBCL patients, including those patients receiving the current standard of care, R-CHOP. The survival predictor can be used to determine the relative probability of a survival outcome in a specific subject. The survival predictor can also be used to predict; i.e., determine the expected probability that a survival outcome will occur by a defined period following treatment for DLBCL. Such prognostic information can be very useful to both the patient and the physician. Patients with survival predictor scores that indicate inferior outcome with R-CHOP therapy could be candidates for a different therapeutic regimen, if, for example, they relapse from R-CHOP treatment. The survival predictor can also be used in the design of clinical studies and analysis of clinical data to provide a quantitative survey of the types of DLBCL patients from which clinical data was gathered. The predictor can be used to improve one or more comparisons between data from different sources (e.g., from different clinical trials), by enabling comparisons with respect to patient characteristics, which are manifested in the gene expression levels that determine and, thus, are embodied in the predictor. Furthermore, the invention provides information that can be very valuable to a DLBCL patient, since the patient may be inclined to order his or her life quite differently, depending on whether the patient has,a high or low probability of surviving and/or remaining progression-free for a period of time following treatment.
- The following abbreviations are used herein: ABC, activated B cell-like diffuse large B cell lymphoma; CHOP, cyclophosphamide, doxorubicine, vincristine, and prednisone; CI, confidence interval; COP, cyclophosphamide, vincristine, and prednisone; DLBCL, diffuse large B cell lymphoma; DOD, dead of disease; ECOG, Eastern Cooperative Oncology Group; FACS, fluorescence-activated cell sorting; FH, follicular hyperplasia; FISH, fluorescence in situ hybridization; FL, follicular lymphoma; GC, germinal center; GCB, germinal center B cell-like diffuse large B cell lymphoma; IPI, International Prognostic Index; LPC, lymphoplasmacytic lymphoma; MHC, major histocompatibility complex; NA, not available or not applicable; NK, natural killer; PCR, polymerase chain reaction; RQ-PCR, real-time quantitative PCR; RT-PCR, reverse transcriptase polymerase chain reaction; SAGE, serial analysis of gene expression; WHO, World Health Organization.
- The term "R-CHOP" as used herein refers generally to any therapeutic regimen that includes chemotherapy and the administration of Rituximab. Accordingly, while the term can refer to a Rituximab combination therapy that includes a CHOP regimen of cyclophosphamide, doxorubicine, vincristine, and prednisone, the term R-CHOP can also refer to therapy that includes Rituximab in combination with a chemotherapeutic regimen other than CHOP.
- The phrase "gene expression data" as well as "gene expression level" as used herein refers to information regarding the relative or absolute level of expression of a gene or set of genes in a cell or group of cells. The level of expression of a gene may be determined based on the level of RNA, such as mRNA, encoded by the gene. Alternatively, the level of expression may be determined based on the level of a polypeptide or fragment thereof encoded by the gene. Gene expression data may be acquired for an individual cell, or for a group of cells such as a tumor or biopsy sample. Gene expression data and gene expression levels can be stored on computer readable media, e.g., the computer readable medium used in conjunction with a microarray or chip reading device. Such gene expression data can be manipulated to generate gene expression signatures.
- The term "microarray," "array," or "chip" refers to a plurality of nucleic acid probes coupled to the surface of a substrate in different known locations. The substrate is preferably solid. Microarrays have been generally described in the art in, for example,
U.S. Patent Nos. 5,143,854 (Pirrung ),5,424,186 (Fodor ),5,445,934 (Fodor ),5,677,195 (Winkler ),5,744,305 (Fodor ),5,800,992 (Fodor ), and6,040,193 (Winkler ), and Fodor et al., Science, 251:767-777 (1991). - The term "gene expression signature" or "signature" as used herein refers to a group of coordinately expressed genes. The genes making up this signature may be expressed in a specific cell lineage, stage of differentiation, or during a particular biological response. The genes can reflect biological aspects of the tumors in which they are expressed, such as the cell of origin of the cancer, the nature of the non-malignant cells in the biopsy, and the oncogenic mechanisms responsible for the cancer (Shaffer et al., Immunity, 15: 375-385 (2001)). Examples of gene expression signatures include lymph node, proliferation (Rosenwald et al., New Engl. J. Med., 346: 1937-1947 (2002)), MHC class II, ABC DLBCL high, B cell differentiation, T-cell, macrophage, immune response-1, and immune response-2 signatures (
U.S. Patent Application Publication No. 2007/0105136 (Staudt )). - The term "signature value" as used herein corresponds to a mathematical combination of measurements from expression levels of the genes in a gene expression signature. An exemplary signature value is a signature average which corresponds to the average or mean of the individual expression levels in a gene expression signature.
- The phrase "survival predictor score" as used herein refers to a score generated by a multivariate model used to predict survival based on gene expression. A subject with a higher survival predictor score is predicted to have poorer survival than a subject with a lower survival predictor score.
- The term "survival" or "overall survival" as used herein may refer to the probability or likelihood of a subject surviving for a particular period of time. Alternatively, it may refer to the likely term of survival for a subject, such as expected mean or median survival time for a subject with a particular gene expression pattern.
- The term "progression free survival" as used herein can refer to the probability or likelihood of a subject surviving without significant progression or worsening of disease for a particular period of time. Alternatively, it may refer to the likely term for a subject of survival without significant progression or worsening of disease, such as expected mean or median survival time for a subject with a particular gene expression pattern without significant progression or worsening of disease.
- The term "survival outcome" as used herein may refer to survival, overall survival, or progression free survival.
- The phrase "scale factor" as used herein refers to a factor that relates change in gene expression to prognosis. An example of a scale factor is a factor obtained by maximizing the partial likelihoods of the Cox proportional hazards model.
- The gene expression signatures, signature values, survival predictor scores, stromal scores, survival estimate curves, and probabilities of survival disclosed herein may be stored in digitally encoded format on computer readable media, e.g., computer readable media used in conjunction with microarray or chip reading devices or computer readable media used to store patient data during treatment for DLBCL. Such media and the specialized devices that use them, e.g., for diagnostic and clinical applications, are known in the art.
- The invention provides a method for predicting a survival outcome in a subject diagnosed with DLBCL using gene expression data. Such data may be gathered using any effective method of quantifying gene expression. For example, gene expression data may be measured or estimated using one or more microarrays. The microarrays may be of any effective type, including, but not limited to, nucleic acid based or antibody based. Gene expression may also be measured by a variety of other techniques, including, but not limited to, PCR, quantitative RT-PCR, real-time PCR, RNA amplification, in situ hybridization, immunohistochemistry, immunocytochemistry, FACS, serial analysis of gene expression (SAGE) (Velculescu et al., Science, 270: 484-87 (1995)), Northern blot hybridization, or western blot hybridization.
- Nucleic acid microarrays generally comprise nucleic acid probes derived from individual genes and placed in an ordered array on a support. This support may be, for example, a glass slide, a nylon membrane, or a silicon wafer. Gene expression patterns in a sample are obtained by hybridizing the microarray with the gene expression product from the sample. This gene expression product may be, for example, total cellular mRNA, rRNA, or cDNA obtained by reverse transcription of total cellular mRNA. The gene expression product from a sample is labeled with a radioactive, fluorescent, or other label to allow for detection. Following hybridization, the microarray is washed, and hybridization of the gene expression product to each nucleic acid probe on the microarray is detected and quantified using a detection device such as a phosphorimager or scanning confocal microscope.
- There are two broad classes of microarrays: cDNA and oligonucleotide arrays. cDNA arrays consist of hundreds or thousands of cDNA probes immobilized on a solid support. These cDNA probes are usually 100 nucleotides or greater in size. There are two commonly used designs for cDNA arrays. The first is the nitrocellulose filter array, which is generally prepared by robotic spotting of purified DNA fragments or lysates of bacteria containing cDNA clones onto a nitrocellulose filter (Southern et al., Genomics, 13: 1008-17 (1992); Southern et al., Nucl Acids Res 22: 1368-73 (1994); Gress et al., Oncogene, 13: 1819-30 (1996); Pietu et al., Genome Res., 6: 492-503 (1996)). The other commonly used cDNA arrays is fabricated by robotic spotting of PCR fragments from cDNA clones onto glass microscope slides (Schena et al., Science, 270: 467-70 (1995); DeRisi et al., Nature Genet., 14: 457-60 (1996); Schena et al., Proc. Nat'l. Acad. Sci. USA, 93: 10614-19 (1996); Shalon et al., Genome Res., 6: 639-45 (1996); DeRisi et al., Science, 278: 680-86 (1997); Heller et al., Proc. Nat'l. Acad. Sci. USA, 94: 2150-55 (1997); Lashkari et al., Proc. Nat'l. Acad. Sci. USA, 94: 13057-62 (1997)). These cDNA microarrays are simultaneously hybridized with two fluorescent cDNA probes, each labeled with a different fluorescent dye (typically Cy3 or Cy5). In this format, the relative mRNA expression in two samples is directly compared for each gene on the microarray. Oligonucleotide arrays differ from cDNA arrays in that the probes are 20- to 25-mer oligonucleotides. Oligonucleotide arrays are generally produced by in situ oligonucleotide synthesis in conjunction with photolithographic masking techniques (Pease et al., Proc. Nat'l. Acad. Sci. USA, 91: 5022-26 (1994); Lipshutz et al., Biotechniques 19: 442-47 (1995); Chee et al., Science, 274: 610-14 (1996); Lockhart et al., Nature Biotechnol., 14: 1675-80 (1996); Wodicka et al., Nature Biotechnol., 15: 1359-6714 (1997)). The solid support for oligonucleotide arrays is typically a glass or silicon surface.
- Methods and techniques applicable to array synthesis and use have been described in, for example,
U.S. Patent Nos. 5,143,854 (Pirrung ),5,242,974 (Holmes ),5,252,743 (Barrett ),5,324,633 (Fodor ),5,384,261 (Winkler ),5,424,186 (Fodor ),5,445,934 (Fodor ),5,451,683 (Barrett ),5,482,867 (Barrett ),5,491,074 (Aldwin ),5,527,681 (Holmes ),5,550,215 (Holmes ),5,571,639 (Hubbell ),5,578,832 (Trulson ),5,593,839 (Hubbell ),5,599,695 (Pease ),5,624,711 (Sundberg ),5,631,734 (Stern ),5,795,716 (Chee ),5,831,070 (Pease ),5,837,832 (Chee ),5,856,101 (Hubbell ),5,858,659 (Sapolsky ),5,936,324 (Montagu ),5,968,740 (Fodor ),5,974,164 (Chee ),5,981,185 (Matson ),5,981,956 (Stem ),6,025,601 (Trulson ),6,033,860 (Lockhart ),6,040,193 (Winkler ),6,090,555 (Fiekowsky ), and6,410,229 (Lockhart ), andU.S. Patent Application Publication No. 2003/0104411 (Fodor ). - Microarrays may generally be produced using a variety of techniques, such as mechanical or light directed synthesis methods that incorporate a combination of photolithographic methods and solid phase synthesis methods. Techniques for the synthesis of microarrays using mechanical synthesis methods are described in, for example,
U.S. Patent Nos. 5,384,261 (Winkler ) and6,040,193 (Winkler ). Although a planar array surface is preferred, the microarray may be fabricated on a surface of virtually any shape, or even on a multiplicity of surfaces. Microarrays may be nucleic acids on beads, gels, polymeric surfaces, fibers such as fiber optics, glass, or any other appropriate substrate. See, for example,U.S. Patent Nos. 5,708,153 (Dower ),5,770,358 (Dower ),5,789,162 (Dower ),5,800,992 (Fodor ), and6,040,193 (Winkler ). - Microarrays can be packaged in such a manner as to allow for diagnostic use, or they can be all-inclusive devices. See, for example,
U.S. Patent Nos. 5,856,174 (Lipshutz ) and5,922,591 (Anderson ). - Microarrays directed to a variety of purposes are commercially available from Affymetrix (Santa Clara, CA). For instance, these microarrays may be used for genotyping and gene expression monitoring.
- Gene expression data can be used to identify genes that are coordinately regulated. Genes that encode components of the same multi-subunit protein complex are often coordinately regulated. Coordinate regulation is also observed among genes whose products function in a common differentiation program or in the same physiological response pathway. Recent application of gene expression profiling to the immune system has shown that lymphocyte differentiation and activation are accompanied by parallel changes in expression among hundreds of genes. Gene expression databases may be used to interpret the pathological changes in gene expression that accompany autoimmunity, immune deficiencies, cancers of immune cells and of normal immune responses.
- Scanning and interpreting large bodies of relative gene expression data is a formidable task. This task is greatly facilitated by algorithms designed to organize the data in a way that highlights systematic features, and by visualization tools that represent the differential expression of each gene as varying intensities and hues of color (Eisen et al., Proc. Nat'l. Acad. Sci. USA, 95: 14863-68 (1998)). The development of microarrays, which are capable of generating massive amounts of expression data in a single experiment, has greatly increased the need for faster and more efficient methods of analyzing large-scale expression data sets. In order to effectively utilize microarray gene expression data for the prediction of survival in DLBCL patients, there is a need for new algorithms to be developed, which can identify important information and convert it to a more manageable format. In addition, the microarrays used to generate this data can be streamlined to incorporate probe sets that are useful for survival outcome prediction.
- Mathematical analysis of gene expression data is a rapidly evolving science based on a rich mathematics of pattern recognition developed in other contexts (Kohonen, Self-Organizing Maps, Springer Press (Berlin 1997)). Mathematical analysis of gene expression data can be used, for example, to identify groups of genes that are coordinately regulated within a biological system, to recognize and interpret similarities between biological samples on the basis of similarities in gene expression patterns, and/or to recognize and identify those features of a gene expression pattern that are related to distinct biological processes or phenotypes.
- Mathematical analysis of gene expression data often begins by establishing the expression pattern for each gene on an array across a number (n) of experimental samples. The expression pattern of each gene can be represented by a point in n-dimensional space, with each coordinate specified by an expression measurement in one of the n samples (Eisen et al., Proc. Nat'l. Acad. Sci. USA, 95: 14863-68 (1998)). A clustering algorithm that uses distance metrics can then be applied to locate clusters of genes in this n-dimensional space. These clusters indicate genes with similar patterns of variation in expression over a series of experiments. Clustering methods that have been applied to microarray data in the past include hierarchical clustering (Eisen et al., supra), self-organizing maps (SOMs) (Tamayo et al., Proc. Nat'l. Acad. Sci. USA, 96: 2907-12 (1999)), k-means (Tavazoie et al., Nature Genet., 22: 281-85 (1999)), and deterministic annealing (Alon et al., Proc. Nat'l. Acad. Sci. USA, 96: 6745-50 (1999)).
- A variety of different algorithms, each emphasizing distinct orderly features of the data, may be required to glean the maximal biological insight from a set of samples (Alizadeh et al., J. Clin. Immunol., 18: 373-79 (1998)). One such algorithm, hierarchical clustering, begins by determining the gene expression correlation coefficients for each pair of the n genes studied. Genes with similar gene expression correlation coefficients are grouped next to one another in a hierarchical fashion. Generally, genes with similar expression patterns under a particular set of conditions can encode protein products with related roles in the physiological adaptation to those conditions. Novel genes of unknown function that are clustered with a large group of functionally related genes likely participate in similar or related biological process. Likewise, other clustering methods mentioned herein can also group genes together that encode proteins with related biological function.
- In such clustering methods, genes that are clustered together reflect a particular biological function, and are termed gene expression signatures (Shaffer et al., Immunity 15: 375-85 (2001)). One general type of gene expression signature includes genes that are characteristically expressed in a particular cell type or at a particular stage of cellular differentiation or activation. Another general type of gene expression signature includes genes that are regulated in their expression by a particular biological process such as proliferation, or by the activity of a particular transcription factor or signaling pathway.
- The pattern of gene expression in a biological sample can provide a distinctive and accessible molecular picture of its functional state and identity (DeRisi et al., Science, 278: 680-86 (1997); Cho et al., Mol. Cell., 2: 65-73 (1998); Chu et al., Science, 282: 699-705 (1998); Holstege et al., Cell., 95: 717-728 (1998); Spellman et al., Mol. Biol. Cell, 9: 3273-97 (1998)). Each cell transduces variations in its environment, internal state, and developmental state into readily measured and recognizable variations in its gene expression patterns. Two different samples with related gene expression patterns are therefore likely to be biologically and functionally similar to one another. Thus, a specific gene expression signature in a sample can provide important biological insights into its cellular composition and the function of various intracellular pathways within those cells.
- Databases of gene expression signatures have proven useful in elucidating the complex gene expression patterns of various cancers. For example, the expression pattern of genes in the germinal center B cell signature in a lymphoma biopsy indicates that the lymphoma includes cells derived from the germinal center stage of differentiation. In the same lymphoma biopsy, the expression of genes from the T cell signature can be used to estimate the degree of infiltration of the tumor by host T cells, while the expression of genes from the proliferation signature can be used to quantitate the tumor cell proliferation rate. In this manner, gene expression signatures provide an "executive summary" of the biological properties of a tumor specimen. Gene expression signatures can also be helpful in interpreting the results of a supervised analysis of gene expression data. A supervised analysis generates a list of genes with expression patterns that correlate with survival. Gene expression signatures can be useful in assigning these "predictive" genes to functional categories. In building a multivariate model of survival based on gene expression data, this functional categorization helps to limit the inclusion of multiple genes in the model that measure the same aspect of tumor biology.
- This following approach was utilized to create the survival prediction models for DLBCL of the invention. Gene expression profiles were used to create multivariate models for predicting survival. The methods for creating these models were "supervised" in that they used clinical data to guide the selection of genes to be used in the prognostic classification. The method identified genes with expression patterns that correlated with the length of overall survival following chemotherapy. Generally the process for identifying the multivariate model for predicting survival included the following steps:
- 1. Genes were identified having expression patterns univariately associated with a particular clinical outcome using a Cox proportional hazards model. Generally, a univariate p-value of <0.01 is considered the cut-off for significance (however, another criterion can be used). These genes were termed "predictor" genes.
- 2. Within a set of predictor genes, gene expression signatures were identified.
- 3. For each gene expression signature significantly associated with survival, the average expression of each component genes within this signature was used to generate a gene expression signature value.
- 4. A multivariate Cox model of clinical outcome using the gene expression signature values was built.
- 5. Additional genes were added to the model, which added to the statistical power of the model.
- The model of the invention generates a survival predictor score, with a higher score being associated with worse clinical outcome. The resulting model can be used separately to predict a survival outcome. Alternatively, the model can be used in conjunction with one or more other models, disclosed herein or in other references, to predict a survival outcome.
- The present invention discloses several gene expression signatures related to the clinical outcome of DLBCL patients. The signatures were identified using the clinical data and methods described below in Examples 1 and 2. Three of these gene expression signatures are the germinal center B cell (GCB) signature, the stromal-1 signature, and the stromal-2 signature. Each component gene of these signatures is identified in Table 1 according to its GenBank accession number, its GeneID assigned by Entrez Gene, a common gene symbol, and a descriptive gene title. Table 1 also provides the Affymetrix Probe Set ID, which can be used (e.g., on the Affymetrix U133+ (Affymetrix, Santa Clara, CA) microarray) to determine the gene expression level for the indicated gene. The computer-readable sequence listing filed herewith includes a representative fragment sequence (of about 100 bp or greater) for each genomic target sequence listed in Table 1, followed by the sequence for each probe in the corresponding Affymetrix probe set listed in Table 1.
Table 1 Signature GenBank Accession No. Entrez GenelD Gene Symbol Gene Title Affymetrix Probe Set ID GCB NM_052932 114908 TMEM123 transmembrane protein 123 211967_at GCB NM_001014380 84056 KATNAL1 katanin p60 subunit A-like 1 227713_at GCB NM_004665 8875 VNN2 vanin 2 205922_at GCB NM_004760 9263 STK17A serine/threonine kinase 17a (apoptosis-inducing) 202693_s_at GCB CR590554 Full-length cDNA clone CS0DF007YJ21 of Fetal brain of Homo sapiens (human) 228464_at GCB NM_017599 55591 VEZT vezatin, adherens junctions transmembrane protein 223089_at GCB NM_018351 55785 FGD6 FYVE, RhoGEF and PH domain containing 6 1555136_at GCB NM_001007075 51088 KLHL5 kelch-like 5 (Drosophila) 226001_at GCB NM_004845 9468 PCYT1B phosphate cytidylyltransferase 1, choline, beta 228959_at GCB AK026881 CDNA: FLJ23228 fis, clone CAE06654 226799_at GCB NM_018440 55824 PAG1 phosphoprotein associated with glycosphingolipid microdomains 1 225626_at GCB NM_004965 3150 HMGN1 high-mobility group nucleosome binding domain 1 200944_s_at GCB NM_001706 604 BCL6 B cell CLL/lymphoma 6 (zinc finqer protein 51) 228758_at GCB NM_020747 57507 ZNF608 zinc finqer protein 608 229817_at GCB NM_001001695 400941 FLJ42418 FLJ42418 protein 231455_at GCB NM_015055 23075 SWAP70 SWAP-70 protein 209306_s_at GCB NM_005607 5747 PTK2 PTK2 protein tyrosine kinase 2 208820_at GCB XM_027236 23508 TTC9 tetratricopeptide repeat domain 9 213172_at GCB BQ213652 440864 LOC440864 hypothetical gene supported by BC040724 1569034_a_at GCB NM_005574 4005 LMO2 LIM domain only 2 (rhombotin-like 1) 204249_s_at GCB NM_014667 9686 VGLL4 vestigial like 4 (Drosophila) 212399_s_at GCB NM_002221 3707 ITPKB inositol 1,4,5-trisphosphate 3-kinase B 203723_at GCB NM_000902 4311 MME membrane metallo-endopeptidase (neutral endopeptidase, enkephalinase) 203434_s_at GCB NM_012446 23635 SSBP2 single-stranded DNA binding protein 2 203787_at GCB NM_024613 79666 PLEKHF2 pleckstrin homology domain containing, family F (with FYVE domain) member 2 222699_s_at GCB AV705976 Transcribed locus 204681_s_at GCB NM_012108 26228 BRDG1 BCR downstream signaling 1 220059_at GCB NM_014397 10783 NEK6 NIMA (never in mitosis gene a)-related kinase 6 223158_s_at GCB NM_018981 54431 DNAJC10 DnaJ (Hsp40) homolog, subfamily C, member 10 225174_at GCB NM_001379 1786 DNMT1 DNA (cytosine-5-)-methyltransferase 1 227684_at GCB NM_006152 4033 LRMP lymphoid-restricted membrane protein 35974_at GCB NM_024701 79754 ASB13 ankyrin repeat and SOCS box-containing 13 218862_at GCB NM_006085 10380 BPNT1 3'(2'), 5'-bisphosphate nucleotidase 1 232103_at GCB NM_023009 65108 MARCKSL1 MARCKS-like 1 200644_at GCB NM_033121 88455 ANKRD13A ankyrin repeat domain 13A 224810_s_at GCB NM_015187 23231 KIAA0746 KIAA0746 protein 235353_at GCB NM_175739 327657 SERPINA9 serpin peptidase inhibitor, clade A (alpha-1 antiproteinase, antitrypsin), member 9 1553499_s_at GCB NM_001012391 400509 RUNDC2B RUN domain containing 2B 1554413_s_at GCB XM_034274 4603 MYBL1 v-myb myeloblastosis viral oncogene homolog (avian)-like 1 213906_at Stromal-1 NM_024579 79630 C1orf54 chromosome 1 open readinq frame 54 219506_at Stromal-1 NM_001645 341 APOC1 apolipoprotein C-1 213553_x_at Stromal-1 NM_001562 3606 IL18 interleukin 18 (interferon-gamma-inducing, factor) 206295_at Stromal-1 NM_014479 27299 ADAMDEC1 ADAM-like; decysin 1 206134_at Stromal-1 NM_003465 1118 CHIT1 chitinase 1 (chitotriosidase) 208168_s_at Stromal-1 NM_000954 5730 PTGDS prostaglandin D2 synthase 21 kDa (brain) 211748_x_at Stromal-1 NM_001056 6819 SULT1C1 sulfotransferase family, cytosolic, 1C, member 1 211470_s_at Stromal-1 NM_018000 55686 MREG melanoregulin 219648_at Stromal-1 NM_001018058 22797 TFEC transcription factor EC 206715_at Stromal-1 NM_000239 4069 LYZ lysozyme (renal amyloidosis) 213975_s_at Stromal-1 NM_006834 10981 RAB32 RAB32, member RAS oncogene family 204214_s_at Stromal-1 NM_000416 3459 IFNGR1 interferon gamma receptor 1 202727_s_at Stromal-1 NM_004666 8876 VNN1 vanin 1 205844_at Signature GenBank Accession No. Entrez GeneID Gene Symbol Gene Title Affymetrix Probe Set ID Stromal-1 NM_031491 83758 RBP5 retinol binding protein 5, cellular 223820_at Stromal-1 NM_001276 1116 CHI3L1 chitinase 3-like 1 (cartilage glycoprotein-39) 209396_s_at Stromal-1 NM_138434 113763 C7orf29 chromosome 7 open reading frame 29 227598_at Stromal-1 NM_001005340 10457 GPNMB glycoprotein (transmembrane) nmb 201141_at Stromal-1 NM_002294 3920 LAMP2 lysosomal-associated membrane protein 2 203041_s_at Stromal-1 NM_002888 5918 RARRES1 retinoic acid receptor responder (tazarotene induced) 1 221872_at Stromal-1 NM_172248 1438 CSF2RA colony stimulating factor 2 receptor, alpha, low-affinity (granulocyte-macrophage) 210340_s_at Stromal-1 NM_018344 55315 SLC29A3 solute carrier family 29 (nucleoside transporters), member 3 219344_at Stromal-1 NM_032413 84419 C15orf48 chromosome 15 open reading frame 48 223484_at Stromal-1 NM_001001851 80760 ITIH5 inter-alpha (globulin) inhibitor H5 1553243_at Stromal-1 NM_000211 3689 ITGB2 integrin, beta 2 (complement component 3 receptor 3 and 4 subunit) 1555349_a_at Stromal-1 NM_005213 1475 CSTA cystatin A (stefin A) 204971_at Stromal-1 NM_003874 8832 CD84 CD84 molecule 205988_at Stromal-1 NM_000228 3914 LAMB3 laminin, beta 3 209270_at Stromal-1 NM_005651 6999 TDO2 tryptophan 2,3-dioxygenase 205943_at Stromal-1 NM_001005266 283651 C15orf21 chromosome 15 open reading frame 21 242649_x_at Stromal-1 AV659177 Transcribed locus 230391_at Stromal-1 NM_001747 822 CAPG capping protein (actin filament), gelsolin-like 201850_at Stromal-1 NM_000784 1593 CYP27A1 cytochrome P450, family 27, subfamily A, polypeptide 1 203979_at Stromal-1 NM_052998 113451 ADC arginine decarboxylase 228000_at Stromal-1 NM_016240 51435 SCARA3 scavenger receptor class A, member 3 219416_at Stromal-1 Z74615 COL1A1 Collagen, type I, alpha 1 217430_x_at Stromal-1 NM_052947 115701 ALPK2 alpha-kinase 2 228367_at Stromal-1 NM_021136 6252 RTN1 reticulon 1 210222_s_at Stromal-1 AL049370 Full-length cDNA clone CL0BB018ZE07 of Neuroblastoma of Homo sapiens (human) 213100_at Stromal-1 NM_006042 9955 HS3ST3A1 heparan sulfate (glucosamine) 3-O-sulfotransferase 3A1 219985_at Stromal-1 NM_000041 348 APOE apolipoprotein E 203382_s_at Stromal-1 NM_004994 4318 MMP9 matrix metallopeptidase 9 (gelatinase B, 92kDa gelatinase, 92kDa type IV collagenase) 203936_s_at Stromal-1 NM_001831 1191 CLU clusterin 222043_at Stromal-1 NM_002305 3956 LGALS1 lectin, galactoside-binding, soluble, 1 (galectin 1) 201105_at Stromal-1 NM_032024 83938 C10orf11 chromosome 10 open reading frame 11 223703_at Stromal-1 NM_001025201 1123 CHN1 chimerin (chimaerin) 1 212624_s_at Stromal-1 NM_003489 8204 NRIP1 nuclear receptor interacting protein 1 202599_s_at Stromal-1 NM_032646 94015 TTYH2 tweety homolog 2 (Drosophila) 223741_s_at Stromal-1 NM_001312 1397 CRIP2 cysteine-rich protein 2 208978_at Stromal-1 NM_023075 65258 MPPE1 metallophosphoesterase 1 213924_at Stromal-1 NM_004364 1050 CEBPA CCAAT/enhancer binding protein (C/EBP), alpha 204039_at Stromal-1 NM_000248 4286 MITF microphthalmia-associated transcription factor 207233_s_at Stromal-1 NM_002185 3575 IL7R interleukin 7 receptor 226218_at Stromal-1 NM_021638 60312 AFAP actin filament associated protein 203563_at Stromal-1 NM_003786 8714 ABCC3 ATP-binding cassette, sub-family C (CFTR/MRP), member 3 208161_s_at Stromal-1 730351 LOC730351 hypothetical protein LOC730351 229407_at Stromal-1 NM_012153 26298 EHF ets homologous factor 225645_at Stromal-1 NM_004887 9547 CXCL14 chemokine (C-X-C motif) ligand 14 222484_s_at Stromal-1 NM_002030 2359 FPRL2 formyl peptide receptor-like 2 230422_at Stromal-1 NM_001321 1466 CSRP2 cysteine and glycine-rich protein 2 207030_s_at Stromal-1 NM_001945 1839 HBEGF heparin-binding EGF-like growth factor 203821_at Stromal-1 NM_031412 23710 GABARAPL1 GABA(A) receptor-associated protein like 1 208869_s_at Stromal-1 NM_006022 8848 TSC22D1 TSC22 domain family, member 1 215111_s_at Stromal-1 NM_016174 51148 CEECAM1 cerebral endothelial cell adhesion molecule 1 224794_s_at Stromal-1 NM_015103 23129 PLXND1 plexin D1 212235_at Stromal-1 NM_003270 7105 TSPAN6 tetraspanin 6 209109_s_at Stromal-1 NM_000887 3687 ITGAX integrin, alpha X (complement component 3 receptor 4 subunit) 210184_at Stromal-1 NM_001864 1346 COX7A1 cytochrome c oxidase subunit VIIa polypeptide 1 (muscle) 204570_at Stromal-1 CR599008 GPR157 Full-length cDNA clone CS0DJ007YL22 of T cells (Jurkat cell line) Cot 10-normalized of Homo sapiens (human) 227970_at Stromal-1 NM_198580 376497 SLC27A1 solute carrier family 27 (fatty acid transporter), member 1 226728_at Stromal-1 NM_025106 80176 SPSB1 splA/ryanodine receptor domain and SOCS box containing 1 226075_at Stromal-1 NM_020130 56892 C8orf4 chromosome 8 open reading frame 4 218541_s_at Stromal-1 NM_173833 286133 SCARA5 scavenger receptor class A, member 5 (putative) 229839_at Stromal-1 NM_007223 11245 GPR176 G protein-coupled receptor 176 227846_at Stromal-1 NM_013437 29967 LRP12 low density lipoprotein-related protein 12 219631_at Stromal-1 NM_007332 8989 TRPA1 transient receptor potential cation channel, subfamily A, member 1 228438_at Stromal-1 NM_152744 221935 SDK1 sidekick homolog 1 (chicken) 229912_at Stromal-1 NM_001409 1953 MEGF6 multiple ECF-like-domains 6 226869_at Stromal-1 NM_012082 23414 ZFPM2 zinc finger protein, multitype 2 219778_at Stromal-1 NM_080430 140606 SELM selenoprotein M 226051_at Stromal-1 NM_030971 81855 SFXN3 sideroflexin 3 217226_s_at Stromal-1 NM_003246 7057 THBS1 thrombospondin 1 201109_s_at Stromal-1 NM_003882 8840 WISP1 WNT1 inducible signaling pathway protein 1 235821_at Stromal-1 NM_005202 1296 COL8A2 collagen, type VIII, alpha 2 221900_at Stromal-1 NM_003711 8611 PPAP2A phosphatidic acid phosphatase type 2A 210946_at Stromal-1 NM_004995 4323 MMP14 matrix metallopeptidase 14 (membrane-inserted) 202828_s_at Stromal-1 NM_001005336 1759 DNM1 dynamin 1 215116_s_at Stromal-1 NM_153717 2121 EVC Ellis van Creveld syndrome 219432_at Stromal-1 NM_173462 89932 PAPLN papilin, proteoglycan-like sulfated glycoprotein 226435_at Stromal-1 XM_496707 441027 FLJ12993 hypothetical LOC441027 229623_at Stromal-1 NM_001839 1266 CNN3 calponin 3, acidic 228297_at Stromal-1 NM_015429 25890 ABI3BP ABI gene family, member 3 (NESH) binding protein 223395_at Stromal-1 NM_002840 5792 PTPRF protein tyrosine phosphatase, receptor type, F 200636_s_at Stromal-1 NM_001001522 6876 TAGLN transgelin 1555724_s_at Stromal-1 NM_017637 54796 BNC2 basonuclin 2 229942_at Stromal-1 NM_003391 7472 WNT2 wingless-type MMTV integration site family member 2 205648_at Stromal-1 NM_015461 25925 ZNF521 zinc finger protein 521 226677_at Stromal-1 NM_006475 10631 POSTN periostin, osteoblast specific factor 210809_s_at Stromal-1 NM_005418 6764 ST5 suppression of tumorigenicity 5 202440_s_at Stromal-1 NM_005203 1305 COL13A1 collagen, type XIII, alpha 1 211343_s_at Stromal-1 NM_000681 150 ADRA2A adrenergic, alpha-2A-, receptor 209669_at Stromal-1 NM_006622 10769 PLK2 polo-like kinase 2 (Drosophila) 201939_at Stromal-1 AL528626 Full-length cDNA clone CS0DD001YA12 of Neuroblastoma Cot 50-normalized of Homo sapiens (human) 228573_at Stromal-1 AF180519 23766 GABARAPL3 GABA(A) receptors associated protein like 3 211458_s_at Stromal-1 NM_024723 79778 MICALL2 MICAL-like 2 219332_at Stromal-1 NM_057177 117583 PARD3B par-3 partitioning defective 3 homolog B (C. elegans) 228411_at Stromal-1 NM_004949 1824 DSC2 desmocollin 2 226817_at Stromal-1 NM_032784 84870 RSPO3 R-spondin 3 homolog (Xenopus laevis) 228186_s_at Stromal-1 NM_007039 11099 PTPN21 protein tyrosine phosphatase, non-receptor type 21 226380_at Stromal-1 NM_031935 83872 HMCN1 hemicentin 1 235944_at Stromal-1 AK022877 Clone TUA8 Cri-du-chat reqion mRNA 213169_at Stromal-1 AK127644 CDNA FLJ45742 fis, clone KIDNE2016327 236297_at Stromal-1 AK056963 Full length insert cDNA clone ZE03F06 226282_at Stromal-1 NM_000899 4254 KITLG KIT ligand 226534_at Stromal-1 NM_002387 4163 MCC mutated in colorectal cancers 226225_at Stromal-1 NM_198270 4810 NHS Nance-Horan syndrome (congenital cataracts and dental anomalies) 228933_at Stromal-1 NM_183376 91947 ARRDC4 arrestin domain containing 4 225283_at Stromal-1 NM_000216 3730 KAL1 Kallmann syndrome 1 sequence 205206_at Stromal-1 NM_001008224 55075 UACA uveal autoantigen with coiled-coil domains and ankyrin repeats 223279_s_at Stromal-1 NM_133493 135228 CD109 CD109 molecule 226545_at Stromal-1 NM_005545 3671 ISLR immunoglobulin superfamily containing leucine-rich repeat 207191_s_at Stromal-1 NM_014365 26353 HSPB8 heat shock 22kDa protein 8 221667_s_at Stromal-1 NM_014476 27295 PDLIM3 PDZ and LIM domain 3 209621_s_at Stromal-1 NM_020962 57722 NOPE likely ortholog of mouse neighbor of Punc E11 227870_at Stromal-1 NM_018357 55323 LARP6 La ribonucleoprotein domain family, member 6 218651_s_at Stromal-1 NM_012323 23764 MAFF v-maf musculoaponeurotic fibrosarcoma oncogene homolog F (avian) 36711_at Stromal-1 NM_003713 8613 PPAP2B phosphatidic acid phosphatase type 2B 212230_at Stromal-1 NM_023016 65124 ANKRD57 ankyrin repeat domain 57 227034_at Stromal-1 NM_032777 25960 GPR124 G protein-coupled receptor 124 65718_at Stromal-1 NM_001554 3491 CYR61 cysteine-rich, angiogenic inducer, 61 201289_at Stromal-1 NM_145117 89797 NAV2 neuron navigator 2 218330_s_at Stromal-1 NM_001002292 79971 GPR177 G protein-coupled receptor 177 228950_s_at Stromal-1 NM_001401 1902 EDG2 endothelial differentiation, lysophosphatidic acid G-protein-coupled receptor, 2 204036_at Stromal-1 NM_198282 340061 TMEM173 transmembrane protein 173 224929_at Stromal-1 NM_014934 22873 DZIP1 DAZ interacting protein 1 204556_s_at Stromal-1 NM_001901 1490 CTGF connective tissue growth factor 209101_at Stromal-1 NM_024600 79652 C16orf30 chromosome 16 open reading frame 30 219315_s_at Stromal-1 NM_138370 91461 LOC91461 hypothetical protein BC007901 225380_at Stromal-1 NM_014632 9645 MICAL2 microtubule associated monoxygenase, calponin and LIM domain containing 2 212472_at Stromal-1 NM_032866 84952 CGNL1 cingulin-like 1 225817_at Stromal-1 NM_003687 8572 PDLIM4 PDZ and LIM domain 4 211564_s_at Stromal-1 BM544548 Transcribed locus 236179_at Stromal-1 NM_001856 1307 COL16A1 collagen, type XVI, alpha 1 204345_at Stromal-1 XM_087386 57493 HEG1 HEG homolog 1 (zebrafish) 213069_at Stromal-1 NM_003887 8853 DDEF2 development and differentiation enhancing factor 2 2064144_s_at Stromal-1 NM_002844 5796 PTPRK protein tyrosine phosphatase, receptor type, K 203038_at Stromal-1 NM_022138 64094 SMOC2 SPARC related modular calcium binding 2 223235_s_at Stromal-1 NM_001006624 10630 PDPN podoplanin 204879_at Stromal-1 NM_003174 6840 SVIL supervillin 202565_s_at Stromat-1 NM_002845 5797 PTPRM protein tyrosine phosphatase, receptor type, M 1555579_s_at Stromal-1 NM_002889 5919 RARRES2 retinoic acid receptor responder (tazarotene induced) 2 209496_at Stromal-1 NM_006094 10395 DLC1 deleted in liver cancer 1 210762_s_at Stromal-1 NM_022463 64359 NXN nucleoredoxin 219489_s_at Stromal-1 AK027294 CDNA FLJ14388 fis, clone HEMBA1002716 229802_at Stromal-1 NM_005711 10085 EDIL3 EGF-like repeats and discoidin I-like domains 3 225275_at Stromal-1 NM_000177 2934 GSN gelsolin (amyloidosis, Finnish type) 200696_s_at Stromal-1 NM_016639 51330 TNFRSF12A tumor necrosis factor receptor superfamily, member 12A 218368_s_at Stromal-1 NM_004460 2191 FAP fibroblast activation protein, alpha 209955_s_at Stromal-1 NM_000064 718 C3 complement component 3 217767_at Stromal-1 NM_016206 389136 VGLL3 vestigial like 3 (Drosophila) 227399_at Stromal-1 NM_004339 754 PTTG1 IP pituitary tumor-transforming 1 interacting protein 200677_at Stromal-1 NM_003255 7077 TIMP2 TIMP metallopeptidase inhibitor 2 224560_at Stromal-1 NM_002998 6383 SDC2 syndecan 2 (heparan sulfate proteoglycan 1, cell surface-associated, fibroglycan) 212158_at Stromal-1 NM_012223 4430 MYO1B myosin IB 212364_at Stromal-1 NM_020650 57333 RCN3 reticulocalbin 3, EF-hand calcium bindinq domain 61734_at Stromal-1 AL573464 Transcribed locus 229554_at Stromal-1 AK001903 CDNA FLJ11041 fis, clone PLACE1004405 227140_at Stromal-1 NM_005928 4240 MFGE8 milk fat globule-EGF factor 8 protein 210605_s_at Stromal-1 NM_000943 5480 PPIC peptidylprolyl isomerase C (cyclophilin C) 204518_s_at Stromal-1 NM_001008397 493869 LOC493869 similar to RIKEN cDNA 2310016C16 227628_at Stromal-1 AK025431 768211 RELL1 receptor expressed in lymphoid tissues like 1 226430_at Stromal-1 NM_000297 5311 PKD2 polycystic kidney disease 2 (autosomal dominant) 203688_at Stromal-1 NM_002975 6320 CLEC11A C-type lectin domain family 11, member A 211709_s_at Stromal-1 NM_001920 1634 DCN decorin 211813_x_at Stromal-1 NM_001723 667 DST dystonin 215016_x_at Stromal-1 CR749529 MRNA; cDNA DKFZp686118116 (from clone DKFZp686118116) 227554_at Stromal-1 NM_000165 2697 GJA1 gap junction protein, alpha 1, 43kDa (connexin 43) 201667_at Stromal-1 NM_012104 23621 BACE1 beta-site APP-cleaving enzyme 1 217904_s_at Stromal-1 NM_001957 1909 EDNRA endothelin receptor type A 204464_s_at Stromal-1 NM_138455 115908 CTHRC1 collagen triple helix repeat containing 1 225681_at Stromal-1 NM_001331 1500 CTNND1 catenin (cadherin-associated protein), delta 1 208407_s_at Stromal-1 NM_001613 59 ACTA2 actin, alpha 2, smooth muscle, aorta 200974_at Stromal-1 NM_002192 3624 INHBA inhibin, beta A (activin A, activin AB alpha polypeptide) 210511_s_at Stromal-1 NM_000935 5352 PLOD2 procollagen-lysine, 2-oxoglutarate 5-dioxyqenase 2 202620_s_at Stromal-1 NM_015170 23213 SULF1 sulfatase 1 212354_at Stromal-1 NM_006039 9902 MRC2 mannose receptor, C type 2 37408_at Stromal-1 NM_005261 2669 GEM GTP-binding protein overexpressed in skeletal muscle 204472_at Stromal-1 NM_001008707 2009 EML1 echinoderm microtubule associated protein like 1 204797_s_at Stromal-1 NM_001031679 253827 MSRB3 methionine sulfoxide reductase B3 225782_at Stromal-1 NM_001004125 286319 TUSC1 tumor suppressor candidate 1 227388_at Stromal-1 NM_005965 4638 MYLK myosin, light chain kinase 202555_s_at Stromal-1 NM_016205 56034 PDGFC platelet derived growth factor C 218718_at Stromal-1 NM_015976 51375 SNX7 sorting nexin 7 205573_s_at Stromal-1 NM_130830 131578 LRRC15 leucine rich repeat containing 15 213909_at Stromal-1 NM_002026 2335 FN1 fibronectin 1 212464_s_at Stromal-1 NM_006855 11015 KDELR3 KDEL (Lys-Asp-Glu-Leu) endoplasmic reticulum protein retention receptor 3 204017_at Stromal-1 NM_002292 3913 LAMB2 laminin, beta 2 (laminin S) 216264_s_at Stromal-1 NM_002658 5328 PLAU plasminogen activator, urokinase 205479_s_at Stromal-1 NM_005529 3339 HSPG2 heparan sulfate proteoglycan 2 (perlecan) 201655_s_at Stromal-1 NM_001235 871 SERPINH1 serpin peptidase inhibitor, clade H (heat shock protein 47), member 1, (collagen binding protein 1) 207714_s_at Stromal-1 AJ318805 CDNA CDNA CDNA FLJ44429 fis, clone UTERU2015653 227061_at Stromal-1 NM_000396 1513 CTSK cathepsin K 202450_s_at Stromal-1 NM_031302 83468 GLT8D2 glycosyltransferase 8 domain containing 2 227070_at Stromal-1 NM_080821 116151 C20orf108 chromosome 20 open reading frame 108 224690_at Stromal-1 NM_002345 4060 LUM lumican 201744_s_at Stromal-1 NM_005110 9945 GFPT2 glutamine-fructose-6-phosphate transaminase 2 205100_at Stromal-1 NM_002941 6091 ROBO1 roundabout, axon guidance receptor, homolog 1 (Drosophila) 213194_at Stromal-1 NM_005429 7424 VEGFC vascular endothelial growth factor C 209946_at Stromal-1 NM_002213 3693 ITGB5 inteqrin, beta 5 201125_s_at Stromal-1 XM_051017 23363 OBSL1 obscurin-like 1 212775_at Stromal-1 NM_181724 338773 TMEM119 transmembrane protein 119 227300_at Stromal-1 NM_003474 8038 ADAM12 ADAM metallopeptidase domain 12 (meltrin alpha) 213790_at Stromal-1 NM_018222 55742 PARVA parvin, alpha 217890_s_at Stromal-1 NM_006478 10634 GAS2L1 growth arrest-specific 2 like 1 31874_at Stromal-1 NM_000093 1289 COL5A1 collagen, type V, alpha 1 212489_at Stromal-1 NM_006288 7070 THY1 Thy-1 cell surface antigen 208851_s_at Stromal-1 CD357685 TIMP2 Transcribed locus, strongly similar to XP_511714.1 similar to Metalloproteinase inhibitor 2 precursor (TIMP-2) (Tissue inhibitor of metalloproteinases-2) (CSC-21 K) [Pan troglodytes] 231579_s_at Stromal-1 NM_003247 7058 THBS2 thrombospondin 2 203083_at Stromal-1 NM_000088 1277 COL1A1 collagen, type I, alpha 1 1556499_s_at Stromal-1 NM_006832 10979 PLEKHC1 pleckstrin homology domain containing, family C (with FERM domain) member 1 209210_s_at Stromal-1 NM_021961 7003 TEAD1 TEA domain family member 1 (SV40 transcriptional enhancer factor) 224955_at Stromal-1 AK128814 CDNA FLJ25106 fis, clone CBR01467 213675_at Stromal-1 NM_153367 219654 C10orf56 chromosome 10 open reading frame 56 212423_at Stromal-1 AK092048 MRNA; cDNA DKFZp313C0240 (from clone DKFZp313C0240) 227623_at Stromal-1 NM_005245 2195 FAT FAT tumor suppressor homolog 1 (Drosophila) 201579_at Stromal-1 NM_001129 165 AEBP1 AE bindinq protein 1 201792_at Stromal-1 NM_002403 4237 MFAP2 microfibrillar-associated protein 2 203417_at Stromal-1 NM_004342 800 CALD1 caldesmon 1 201616_s_at Stromal-1 NM_005576 4016 LOXL1 lysyl oxidase-like 1 203570_at Stromal-1 NM_199511 151887 CCDC80 coiled-coil domain containing 80 225242_s_at Stromal-1 NM_012098 23452 ANGPTL2 angiopoietin-like 2 213001_at Stromal-1 NM_002210 3685 ITGAV integrin, alpha V (vitronectin receptor, alpha polypeptide, antigen CD51) 202351_at Stromal-1 NM_000366 7168 TPM1 tropomyosin 1 (alpha) 210986_s_at Stromal-1 NM_198474 283298 OLFML1 olfactomedin-like 1 217525_at Stromal-1 NM_001424 2013 EMP2 epithelial membrane protein 2 225078_at Stromal-1 NM_032575 84662 GLIS2 GLIS family zinc finger 2 223378_at Stromal-1 NM_007173 11098 PRSS23 protease, serine, 23 226279_at Stromal-1 NM_001015880 9060 PAPSS2 3'-phosphoadenosine 5'-phosphosulfate synthase 2 203060_s_at Stromal-1 NM_015645 114902 C1QTNF5 C1q and tumor necrosis factor related protein 5 223499_at Stromal-1 AK130049 CDNA FLJ26539 fis, clone KDN09310 213429_at Stromal-1 NM_001849 1292 COL6A2 collagen, type VI, alpha 2 209156_s_at Stromal-1 NM_001014796 4921 DDR2 discoidin domain receptor family, member 2 225442_at Stromal-1 NM_015463 25927 C2orf32 chromosome 2 open reading frame 32 226751_at Stromal-1 AK055628 ADAM12 CDNA FLJ31066 fis, clone HSYRA2001153 226777_at Stromal-1 NM_014799 9843 HEPH hephaestin 203903_s_at Stromal-1 NM_004385 1462 CSPG2 chondroitin sulfate proteoglycan 2 (versican) 221731_x_at Stromal-1 NM_152330 122786 FRMD6 FERM domain containing 6 225481_at Stromal-1 BQ917964 PPP4R2 Transcribed locus 235733_at Stromal-1 NM_002615 5176 SERPINF1 serpin peptidase inhibitor, clade F (alpha-2 antiplasmin, pigment epithelium derived factor), member 1 202283_at Stromal-1 NM_032348 54587 MXRA8 matrix-remodelling associated 8 213422_s_at Stromal-1 NM_006106 10413 YAP1 Yes-associated protein 1, 65kDa 224894_at Stromal-1 NM_020182 56937 TMEPAI transmembrane, prostate androgen induced RNA 222449_at Stromal-1 CB999028 Transcribed locus 226834_at Stromal-1 NM_001711 633 BGN biglycan 201261_x_at Stromal-1 NM_006902 5396 PRRX1 paired related homeobox 1 226695_at Stromal-1 NM_000428 4053 LTBP2 latent transforming growth factor beta binding protein 2 204682_at Stromal-1 NM_004369 1293 COL6A3 collagen, type VI, alpha 3 201438_at Stromal-1 NM_000393 1290 COL5A2 collagen, type V, alpha 2 221730_at Stromal-1 NM_015419 25878 MXRA5 matrix-remodelling associated 5 209596_at Stromal-1 NM_001102 87 ACTN1 actinin, alpha 1 208637_x_at Stromal-1 NM_000877 3554 IL1R1 interleukin 1 receptor, type I 202948_at Stromal-1 NM_015927 7041 TGFB111 transforming growth factor beta 1 induced transcript 1 209651_at Stromal-1 NM_032772 84858 ZNF503 zinc finger protein 503 227195_at Stromal-1 NM_020440 5738 PTGFRN prostaglandin F2 receptor neqative regulator 224937_at Stromal-1 NM_000138 2200 FBN1 fibrillin 1 202765_s_at Stromal-1 NM_031442 83604 TMEM47 transmembrane protein 47 209656_s_at Stromal-1 NM_001734 716 C1S complement component 1, s subcomponent 208747_s_at Stromal-1 NM_002290 3910 LAMA4 laminin, alpha 4 202202_s_at Stromal-1 CN312045 PPP4R2 Transcribed locus, weakly similar to NP_001013658.1 protein LOC387873 [Homo sapiens] 222288_at Stromal-1 NM_000089 1278 COL1A2 collagen, type I, alpha 2 202403_s_at Stromal-1 NM_004530 4313 MMP2 matrix metallopeptidase 2 (gelatinase A, 72kDa gelatinase, 72kDa type IV collagenase) 201069_at Stromal-1 NM_001387 1809 DPYSL3 dihydropyrimidinase-like 3 201431_s_at Stromal-1 NM_138389 92689 FAM114A1 family with sequence similarity 114, member A1 213455_at Stromal-1 NM_006670 7162 TPBG trophoblast glycoprotein 203476_at Stromal-1 NM_000304 5376 PMP22 peripheral myelin protein 22 210139_s_at Stromal-1 NM_002775 5654 HTRA1 HtrA serine peptidase 1 201185_at Stromal-1 NM_002593 5118 PCOLCE procollagen C-endopeptidase enhancer 202465_at Stromal-1 NM_003118 6678 SPARC secreted protein, acidic, cysteine-rich (osteonectin) 212667_at Stromal-1 NM_007085 11167 FSTL1 follistatin-like 1 208782_at Stromal-1 NM_001080393 727936 predicted glycosyl-transferase 8 domain containing 4 235371_at Stromal-1 NM_018153 84168 ANTXR1 anthrax toxin receptor 1 224694_at Stromal-1 NM_001733 715 C1R complement component 1, r subcomponent 212067_s_at Stromal-1 NM_001797 1009 CDH11 cadherin 11, type 2, OB-cadherin (osteoblast) 207173_x_at Stromal-1 NM_016938 30008 EFEMP2 EGF-containing fibulin-like extracellular matrix protein 2 209356_x_at Stromal-2 NM_014601 30846 EHD2 EH-domain containing 2 45297_at Stromal-2 NM_017789 54910 SEMA4C sema domain, immunoglobulin domain (Ig), transmembrane domain (TM) and short cytoplasmic domain, (semaphorin) 4C 46665_at Stromal-2 NM_000484 351 APP amyloid beta (A4) precursor protein (peptidase nexin-II, Alzheimer disease) 200602_at Stromal-2 NM_004684 8404 SPARCL1 SPARC-like 1 (mast9, hevin) 200795_at Stromal-2 NM_002291 3912 LAMB1 laminin, beta 1 201505_at Stromal-2 NM_000210 3655 ITGA6 integrin, alpha 6 201656_at Stromal-2 NM_000552 7450 VWF von Willebrand factor 202112_at Stromal-2 NM_001233 858 CAV2 caveolin 2 203323_at Stromal-2 NM_006404 10544 PROCR protein C receptor, endothelial (EP.CR) 203650_at Stromal-2 NM_000609 6387 CXCL12 chemokine (C-X-C motif) ligand 12 (stromal cell-derived factor 1) 203666_at Stromal-2 NM_002253 3791 KDR kinase insert domain receptor (a type III receptor tyrosine kinase) 203934_at Stromal-2 NM_001442 2167 FABP4 fatty acid binding protein 4, adipocyte 203980_at Stromal-2 NM_016315 51454 GULP1 GULP, engulfment adaptor PTB domain containing 1 204237_at Stromal-2 NM_006307 8406 SRPX sushi-repeat-containing protein, X-linked 204955_at Stromal-2 NM_000163 2690 GHR growth hormone receptor 205498_at Stromal-2 NM_000950 5638 PRRG1 proline rich Gla (G-carboxyglutamic acid) 1 205618_at Stromal-2 NM_002666 5346 PLIN perilipin 205913_at Stromal-2 NM_000459 7010 TEK TEK tyrosine kinase, endothelial (venous malformations, multiple cutaneous and mucosal) 206702_at Stromal-2 NM_004797 9370 ADIPOQ adiponectin, C1Q and collagen domain containinq 207175_at Stromal-2 NM_000442 5175 PECAM1 platelet/endothelial cell adhesion molecule (CD31 antigen) 208981_at Stromal-2 NM_198098 358 AQP1 aquaporin 1 (Colton blood qroup) 209047_at Stromal-2 NM_021005 7026 NR2F2 nuclear receptor subfamily 2, group F, member 2 209120_at Stromal-2 NM_014220 4071 TM4SF1 transmembrane 4 L six family member 1 209386_at Stromal-2 NM_001001549 2887 GRB10 growth factor receptor-bound protein 10 209409_at Stromal-2 NM_006108 10418 SPON1 spondin 1, extracellular matrix protein 209436_at Stromal-2 NM_001003679 3953 LEPR leptin receptor 209894_at Stromal-2 NM_000599 3488 IGFBP5 insulin-like growth factor binding protein 5 211959_at Stromal-2 NM_001753 857 CAV1 caveolin 1, caveolae protein, 22kDa 212097_at Stromal-2 NM_005841 10252 SPRY1 sprouty homolog 1, antagonist of FGF signaling (Drosophila) 212558_at Stromal-2 NM_015345 23500 DAAM2 dishevelled associated activator of morphogenesis 2 212793_at Stromal-2 NM_015234 221395 GPR116 G protein-coupled receptor 116 212950_at Stromal-2 NM_006108 10418 SPON1 spondin 1, extracellular matrix protein 213993_at Stromal-2 NM_016215 51162 EGFL7 EGF-like-domain, multiple 7 218825_at Stromal-2 NM_022481 64411 CENTD3 centaurin, delta 3 218950_at Stromal-2 XM_371262 64123 ELTD1 EGF, latrophilin and seven transmembrane domain containing 1 219134_at Stromal-2 NM_016563 51285 RASL12 RAS-like, family 12 219167_at Stromal-2 NM_006094 10395 DLC1 deleted in liver cancer 1 224822_at Stromal-2 NM_019035 54510 PCDH18 protocadherin 18 225975_at Stromal-2 NM_019055 54538 ROBO4 roundabout homolog 4, magic roundabout (Drosophila) 226028_at Stromal-2 NM_002207 3680 ITGA9 inteqrin, alpha 9 227297_at Stromal-2 XM_93060B 641700 ECSM2 endothelial cell-specific molecule 2 227779_at Stromal-2 XM_037493 85358 SHANK3 SH3 and multiple ankyrin repeat domains 3 227923_at Stromal-2 NM_052954 116159 CYYR1 cysteine/tyrosine-rich 1 228665_at Stromal-2 NM_002837 5787 PTPRB protein tyrosine phosphatase, receptor type, B 230250_at Stromal-2 NM_019558 3234 HOXD8 homeobox D8 231906_at Stromal-2 NM_001442 2167 FABP4 fatty acid binding protein 4, adipocyte 235978_at Stromal-2 NM_024756 79812 MMRN2 multimerin 2 236262_at Stromal-2 BQ897248 Transcribed locus 242680_at Stromal-2 NM_020663 57381 RHOJ ras homolog gene family, member J 243481_at Stromal-2 AK091419 CDNA FLJ34100 fis, clone FCBBF3007597 1558397_at Stromal-2 NM_015719 50509 COL5A3 collagen, type V, alpha 3 52255_s_at Stromal-2 NM_012072 22918 CD93 CD93 molecule 202878_s_at Stromal-2 NM_000300 5320 PLA2G2A phospholipase A2, group IIA (platelets, synovial fluid) 203649_s_at Stromal-2 NM_019105 7148 TNXB tenascin XB 206093_x_at Stromal-2 NM_030754 6289 SAA2 serum amyloid A2 208607_s_at Stromal-2 NM_019105 7148 TNXB tenascin XB 208609_s_at Stromal-2 NM_014220 4071 TM4SF1 transmembrane 4 L six family member 1 209367_s_at Stromal-2 NM_000668 125 ADH1 B alcohol dehydrogenase IB (class I), beta polypeptide 209612_s_at Stromal-2 NM_000668 125 ADH1B alcohol dehydrogenase IB (class I), beta polypeptide 209613_s_at Stromal-2 NM_001354 1646 AKR1C2 aldo-keto reductase family 1, member C2 (dihydrodiol - dehydrogenase 2; bile acid binding protein; 3-alpha hydroxysteroid dehydrogenase, type III) 209699_x_at Stromal-2 NM_001032281 7035 TFPI tissue factor pathway inhibitor (lipoprotein-associated coagulation inhibitor) 210664_s_at Stromal-2 NM_001001924 57509 MTUS1 mitochondrial tumor suppressor 1 212096_s_at Stromal-2 NM_019105 7148 TNXB tenascin XB 213451_x_at Stromal-2 NM_004449 2078 ERG v-ets erythroblastosis virus E26 oncogene homolog (avian) 213541_s_at Stromal-2 NM_018407 55353 LAPTM4B lysosomal associated protein transmembrane 4 beta 214039_s_at Stromal-2 NM_000331 6288 SAA1 serum amyloid A1 214456_x_at Stromal-2 NM_019105 7148 TNXB tenascin XB 216333_x_at Stromal-2 NM_001034954 10580 SORBS1 sorbin and SH3 domain containinq 1 218087_s_at Stromal-2 NM_017734 54873 PALMD palmdelphin 218736_s_at Stromal-2 NM_024756 79812 MMRN2 multimerin 2 219091 _s_at Stromal-2 NM_006744 5950 RBP4 retinol binding protein 4, plasma 219140_s_at Stromal-2 NM_001034954 10580 SORBS1 sorbin and SH3 domain containing 1 222513_s_at - The DLBCL survival predictors of the invention were generated using expression data and methods described in Examples 1 and 2, below. The first bivariate survival predictor incorporates the GCB and stromal-1 gene expression signatures. Fitting the Cox proportional hazards model to the gene expression data obtained from these two signatures resulted in a bivariate model survival predictor score calculated using the following generalized equation:

In this equation, A is an offset term, while (x) and (y) are scale factors. The GCB signature value and the stromal-1 signature value can correspond to the average of the expression levels of all genes in the GCB signature and the stromal-1 signature, respectively. A lower survival predictor score indicates a more favorable survival outcome, and a higher survival predictor score indicates a less favorable survival outcome for the subject. - The bivariate survival predictor was refined into a multivariate survival predictor that incorporates GCB, stromal-1, and stomal-2 gene expression signatures. Fitting the Cox proportional hazards model to the gene expression data obtained from these three signatures resulted in a multivariate model survival predictor score calculated using the following generalized equation:

In this equation, A is an offset term, while (x), (y), and (z) are scale factors. The GCB signature value, the stromal-1 signature value, and the stromal-2 signature value can correspond to the average of the expression levels of all genes in the GCB signature, the stromal-1 signature, and the stromal-2 signature, respectively. A lower survival predictor score indicates a more favorable survival outcome and a higher survival predictor score indicates a less favorable survival outcome for the subject. - In one embodiment, the invention provides the following multivariate survival predictor equation:

In this equation, a lower survival predictor score indicates a more favorable survival outcome, and a higher survival predictor score indicates a poorer survival outcome for the subject. - In other embodiments of the multivariate DLBCL survival predictor score equation, the offset term (A) or (8.11) can be varied without affecting the equation's usefulness in predicting clinical outcome. Scale factors (x), (y), and (z) can also be varied, individually or in combination. For example, scale factor (x) can be from about 0.200 or more, from about 0.225 or more, from about 0.250 or more, from about 0.275 or more, from about 0.300, from about 0.325 or more, from about 0.350 or more, from about 0.375 or more, or from about 0.400 or more. Alternatively, or in addition, scale factor (x) can be about 0.625 or less, about 0.600 or less, about 0.575 or less, about 0.550 or less, about 0.525 or less, about 0.500 or less, about 0.475 or less, about 0.450 or less, or about 0.425 or less. Thus, scale factor (z) can be one that is bounded by any two of the previous endpoints. For example scale factor (x) can be a value from 0.200-0.625, from 0.350-0.550, from 0.350-0.475, or from 0.400-0.425. Similarly, scale factor (y) can be from about 0.800 or more, from about 0.825 or more, from about 0.850 or more, from about 0.875 or more, from about 0.900or more, from about 0.925 or more, from about 0.950 or more, from about 0.975 or more, or from about 1.000 or more. Alternatively, or in addition, scale factor (y) can be, e.g., about 1.250 or less, e.g., about 1.225 or less, about 1.200, about 1.175 or less, about 1.150 or less, about 1.125 or less, about 1.100 or less, about 1.075 or less, about 1.050 or less, or about 1.025 or less. Thus, scale factor (y) can be one that is bounded by any two of the previous endpoints. For example, scale factor (y) can be a value from 0.800-1.250, a value from 0.950-1.1025, a value from 0.950-1.200 or a value from 1.000-1.025. Also similarly, scale factor (z) can be from about 0.450 or more, about 0.475 or more, about 0.500 or more, about 0.525 or more, about 0.550 or more, about 0.575 or more, about 0.600 or more, about 0.625 or more, or about 0.650 or more. Alternatively, or in addition, scale factor (z) can be, e.g., about 0.900 or less, e.g., about 0.875 or less, about 0.850, about 0.825 or less, about 0.800 or less, about 0.775 or less, about 0.750 or less, or about 0.725 or less. Thus, scale factor (z) can be one that is bounded by any two of the previous endpoints. For example, scale factor (z) can be a value from 0.450-0.900, any value from 0.650-0.725, any value from 0.625-0.775 or any value from 0.650-0.700.
- Furthermore, the invention includes any set of scale factors (x), (y), and (z) in conjunction in the general multivariate DLBCL survival predictor score that creates a function that is monotonically related to a multivariate DLBCL survival predictor score equation using any combination of the foregoing specified scale factor (x), (y), and (z) values.
- In some embodiments of the invention, a survival predictor score can be calculated using fewer than all of the gene components of the GCB signature, the stromal-1 signature, and/or the stromal-2 signature listed in Table 1. For example, the survival prediction equations disclosed herein can be calculated using mathematical combinations of the expressions of 98% (38), 95% (37), 93% (36), or 90% (35) of the genes listed in Table 1 for the GCB signature, about 99% (about 280), about 98% (about 277), 97% (about 275), about 96% (about 272), about 95% (about 270), about 94% (about 266), about 93% (about 263), about 92% (about 260), about 91% (about 257), or about 90% (about 255) of the genes listed in Table 1 for the stromal-1 signature, and/or 99% (71), 97% (70), 96% (69), 95% (68) 93% (67), 92% (66), or 90% (65) of the genes listed in Table 1 for the stromal-2 signature (instead of using all of the genes corresponding to a gene signature in Table 1 to calculate the GCB signature value, the stromal-1 signature value, and/or stromal-2 signature value, respectively). In other embodiments, the survival prediction equations disclosed herein can be calculated using mathematical combinations of the expressions of 88% (34 genes), 85% (33 genes), 82% (32 genes), 80% (31 genes) of the genes listed in Table 1 for the GCB signature, about 89% (about 252), about 88% (about 249), about 87% (about 246), about 86% (about 243), about 85% (about 241), about 84% (about 238), about 83% (about 235), about 82% (about 232), about 81% (about 229), or about 80% (about 226) of the genes listed in Table 1 for the stromal-1 signature, and/or 89% (64), 88% (63), 86% (62), 85% (61), 83% (60), 82% (59) or 80% (58) of the genes listed in Table 1 for the stromal-2 signature (instead of using all of the genes corresponding to a gene signature in Table 1 to calculate the GCB signature value, the stromal-1 signature value, and/or stromal-2 signature value, respectively).
- The invention also provides a method of using a DLBCL survival predictor score to predict the probability of a survival outcome beyond an amount of time t following treatment for DLBCL. The method includes calculating the probability of a survival outcome for a subject using the following general equation:

In this equation, P(SO) is the subject's probability of the survival outcome beyond time t following treatment for DLBCL, SO0(t) is the probability of survival outcome, which corresponds to the largest time value smaller than t in a survival outcome curve, and (s) is a scale factor. Treatment for DLBCL can include chemotherapy and the administration of Rituximab. A survival curve can be calculated using statistical methods, such as the Cox Proportional Hazard Model. Additional information regarding survival outcome curves is set forth in Lawless, Statistical Models and Methods for Lifetime Data, John Wiley and Sons (New York 1982) and Kalbfleisch et al., Biometrika, 60: 267-79 (1973). - In one embodiment, the method of the invention includes calculating the probability of overall survival for a subject beyond an amount of time t following treatment for DLBCL. The method includes calculating the probability of a survival outcome for a subject using the following general equation:

In the equation, P(OS) is the subject's probability of overall survival beyond time t following treatment for DLBCL, SO0(t) is the curve probability of survival outcome, which corresponds to the largest time value in a survival curve which is smaller than t, and the general equation scale factor (s) = 1. Treatment for DLBCL can include chemotherapy alone or in combination with the administration of Rituximab (R-CHOP). - In another embodiment, the method of the invention includes calculating the probability of progression-free survival for a subject beyond an amount of time t following treatment for DLBCL. The method includes calculating the probability of a survival outcome for a subject using the following general equation:

In this equation, P(PFS) is the subject's probability of progression-free survival beyond time t following treatment for DLBCL, SO0(t) is the curve probability of progression-free survival, which corresponds to the largest time value in a survival curve which is smaller than t, and the general equation scale factor (s) = 0.976. The treatment for DLBCL can include chemotherapy alone or in combination with the administration of Rituximab (R-CHOP). - The foregoing equations for P(OS) and P(PFS) were generated by maximizing the partial likelihoods of the Cox proportional hazards model within the LLMPP CHOP data described below in Examples 1 and 2. Separate single variable Cox proportional hazards models were considered for overall survival P(OS) and for progression free survival P(PFS) based on this model score formulation. The single variable scale factor (1.0 for overall survival and 0.997 for progression free survival) were generated for each model by maximization of the partial likelihoods within the R-CHOP patients described below in Examples 1 and 2.
- In other embodiments, the scale factor in the foregoing P(PFS) can be varied such that (instead of 0.976) scale factor (s) is a value between 0.970 and 0.980, e.g. 0.971, 0.972, 0.973, 0.973, 0.974, 0.975, 0.977, 0.978, and 0.979.
- The invention further provides a targeted array that can be used to detect the expression levels of all or most of the genes in a germinal center B cell gene (GCB) expression signature, a stromal-1 gene expression signature, and/or a stromal-2 gene expression signature. A targeted array, as used herein, is an array directed to a limited set of genes and thus differs from a whole genome array. The targeted array of the invention can include probes for fewer than 10,000 genes, fewer than 8,000 genes, fewer than 7,000 genes, fewer than 6,000 genes, fewer than 5,000 genes, or fewer than 4,000 genes. Generally, the targeted array includes probes for at least 80% of the genes in a germinal center B cell gene (GCB) expression signature, a stromal-1 gene expression signature, and/or a stromal-2 gene expression signature. The targeted arrays of the invention can be used, for example, to detect expression levels for use in the methods described herein.
- The invention provides a targeted array that includes probes for all of the genes in the stromal-1 gene expression signature. The invention also provides a targeted array that includes probes for all of the genes in the stromal-2 gene expression signature. Additionally, the invention provides a targeted array that includes probes for all of the genes in the stromal-1 gene expression signature and all of the genes in the stromal-2 gene expression signature. Moreover, the invention provides a targeted array that includes probes for all of the genes in the stromal-1 gene expression signature, all of the genes in the stromal-2 gene expression signature, and all of the genes in the GCB signature.
- In certain embodiments, the arrays of the invention can include 98% (38), 95% (37), 93% (36), or 90% (35) of the genes listed in Table 1 for the GCB signature, about 99% (about 280), about 98% (about 277), 97% (about 275), about 96% (about 272), about 95% (about 270), about 94% (about 266), about 93% (about 263), about 92% (about 260), about 91% (about 257), or about 90% (about 255) of the genes listed in Table 1 for the stromal-1 signature, and/or 99% (71), 97% (70), 96% (69), 95% (68) 93% (67), 92% (66), or 90% (65) of the genes listed in Table 1 for the stromal-2 signature (instead of all of the genes listed in Table 1 for the GCB signature average, the stromal-1 signature average, and/or stromal-2 signature average, respectively). In certain embodiments, the arrays of the invention can include 88% (34 genes), 85% (33 genes), 82% (32 genes), 80% (31 genes) of the genes listed in Table 1 for the GCB signature, about 89% (about 252), about 88% (about 249), about 87% (about 246), about 86% (about 243), about 85% (about 241), about 84% (about 238), about 83% (about 235), about 82% (about 232), about 81% (about 229), or about 80% (about 226) of the genes listed in Table 1 for the stromal-1 signature, and/or 89% (64), 88% (63), 86% (62), 85% (61), 83% (60), 82% (59) or 80% (58) of the genes listed in Table 1 for the stromal-2 signature (instead of all of the genes listed in Table 1 for the GCB signature average, the stromal-1 signature average, and/or stromal-2 signature average, respectively).
- The following examples further illustrate the invention.
- This example demonstrates that significant differences were found between the survival outcomes for R-CHOP treated ABC DLBCL and GCB DLBCL patients and that survival outcome correlated with three prognostic gene expression signatures.
- Pre-treatment tumor biopsy specimens and clinical data were obtained from 414 patients with de novo DLBCL treated at 10 institutions in North America and Europe and studied according to a protocol approved by the National Cancer Institute's Institutional Review Board. Patients included in a "LLMP CHOP cohort" of 181 patients were treated with anthracycline-based combinations, most often cyclophosphamide, doxorubicin, vincristine, and prednisone (CHOP) or similar regimens, as previously described (Rosenwald et al., N. Engl. J. Med., 346: 1937-47 (2002)). The remaining 233 patients constituted an R-CHOP cohort that received similar chemotherapy plus Rituximab. The median follow-up in the R-CHOP cohort was 2.1 years (2.8 years for survivors). A panel of expert hematopathologists confirmed the diagnosis of DLBCL using current WHO criteria. Additional clinical patient characteristics for the R-CHOP cohort are described in Table 2. Additional analysis used a second "MMMNLP CHOP" cohort of 177 patients studied by the Molecular Mechanisms of Non-Hodgkin's Lymphoma Network Project (Hummel et al., N. Engl. J. Med., 354: 2419-30 (2006)).
Table 2: Clinical characteristics of DLBCL patients treated with R-CHOP Characteristic % Total (N=233) % Germinal center B cell-like DLBCL (N=107) % Activated B cell-like DLBCL (N=93) % Unclassified DLBCL (N=33) P-value Age > 60 yr 52 47 63 39 0.02 Ann Arbor stage > II 54 48 62 50 0.06 Lactate Dehydrogenase > 1x Normal 48 43 58 41 0.06 No. of extranodal sites >1 15 14 15 14 0.8 Eastern Cooperative Oncology Group (ECOG) performance status 25 17 33 27 0.02 International Prognostic Index (IPI) Score <0.001 0 or 1 41 55 21 50 2 or 3 46 33 63 38 4 or 5 13 12 15 12 Revised IPI Score <0.001 0 19 27 5 28 1 or 2 56 52 64 48 3-5 25 21 31 24 - Gene expression profiling was performed using Affymetrix U133+ 2.0 microarrays. Gene expression profiling data are available through the National Center for Biotechnology Information web site as described in Lenz et al., New Engl. J. Med, 359: 2313-23 (2008), at page 2314. All gene expression array data were normalized using MAS 5.0 software, and were log2 transformed. To account for technical differences in the microarray processing between the R-CHOP cohort data and the LLMPP CHOP cohort data, the expression values of each gene in the R-CHOP cohort data were adjusted so that its median matched the median of the LLMPP CHOP data.
- Gene expression signature identification and survival predictor model development were based solely on the data from the LLMPP CHOP training set. No prior survival analysis or subgroup analysis was performed with the test sets (MMMLNP CHOP and R-CHOP cohorts). The Cox model was used to identify genes associated with survival in the CHOP training set and to build multivariate survival models. The models and their associated scaling coefficients were fixed based on the CHOP training set and then evaluated on the test sets. The P-values of survival effects of continuous variables such as gene expression or signature expression were calculated with the Cox likelihood ratio test. The significance of survival effects based on discrete variables such as lymphoma subtype or International Prognostic Index (IPI) was calculated using the log rank test. Validation P-values presented are one-sided in the direction observed in the training set. All other P-values were two sided. Survival curves were estimated using the Kaplan-Meier method.
- All aspects of gene expression signature identification and survival predictor model development were based solely on the data from the CHOP training set. No prior survival analysis or subgroup analysis was performed with the test sets (MMMLNP CHOP and R-CHOP cohorts). The Cox model was used to identify genes associated with survival in the CHOP training set and to build multivariate survival models. The models and their associated scale factors were fixed based on the CHOP training set, and then evaluated on the test sets.
- Since ABC and GCB DLBCL subtypes have distinct overall survival rates with CHOP chemotherapy (Rosenwald et al., N. Engl. J. Med., 346: 1937-47 (2002); Alizadeh et al., Nature, 403:503-11(2000); Hummel et al., N. Engl. J. Med., 354:2419-30 (2006); Monti, Blood, 105:1851-61(2005)), whether this distinction remains prognostically significant among patients treated with R-CHOP was tested (Coiffier et al, N. Engl. J. Med., 346: 235-42 (2002)). Gene expression profiles were determined for pre-treatment biopsy samples from a "training set" of 181 patients treated with CHOP or CHOP-like chemotherapy alone and from a "test set" of 233 patients treated with R-CHOP. The patients in these two cohorts were comparable with respect to age range and distribution of the clinical prognostic variables that constitute the International Prognostic Index (EPI) (Table 2). In the R-CHOP cohort, patients with GCB DLBCL had better survival rates than those with ABC DLBCL. Specifically, R-CHOP treated GCB DLBCL and ABC DLBCL patients had 3-year overall survival rates of 84% and 56%, respectively, and 3-year progression-free survival rates of 74% and 40%, respectively (
Fig. 1A and 1B ). In the CHOP training set, and in a second "MMMLMP" CHOP cohort (Hummel et al., supra), the overall survival rates for ABC DLBCL and GCB DLBCL were lower than in the R-CHOP cohort (Fig. 6 ). Multivariate analysis indicated that the relative benefit (i.e., change in survival outcome) due to R-CHOP therapy (as compared to CHOP) was not significantly different between ABC and GCB DLBCL. - Four gene expression signatures have been previously shown to have prognostic significance in DLBCL patients treated with CHOP (Rosenwald et al., supra). Of these, the GCB signature and lymph node signature were associated with favorable survival, and the proliferation signature was associated with inferior survival within the CHOP training set, in the MMMLNP CHOP cohort (see the corresponding signature panels in
Figure 7 ), and in the R-CHOP cohort (see corresponding signature panels inFigure 1C ). Thus, the biological differences among DLBCL tumors reflected by these three signatures remain prognostically important in Rituximab treated patients, even though Rituximab treatment generally improved survival in DLBCL. - The remaining fourth gene expression signature, the MHC class II signature, which was associated with survival in the CHOP training set when treated as a continuous variable, was not associated with survival in the R-CHOP cohort (see MHC class II signature panel in
Figure 1C ). Moreover, tumors with extremely low "outlier" expression of this signature were associated with inferior survival in both CHOP cohorts (seeFigures 8A and8B ), but not in the R-CHOP cohort (seeFigure 8C ). - The foregoing results indicate that Rituximab immunotherapy combined with chemotherapy (R-CHOP) benefits both the ABC and GCB subtypes of DLBCL and that gene expression signatures that predicted survival in the context of CHOP chemotherapy retained their prognostic power among R-CHOP-treated patients.
- The foregoing results also indicate that the biological variation among DLBCL tumors, as measured by gene expression signatures, has a consistent relationship to therapeutic response regardless of the treatment regimen used. There is a striking difference in 3-year progression-free survival between ABC DLBCL patients and GCB DLBCL patients treated with R-CHOP (40% vs. 74%). This difference is likely due to genetic and biological differences between these DLBCL subtypes (Staudt et-al., Adv. Immunol., 87: 163-208 (2005)).
- Hence, future clinical trials in DLBCL should incorporate quantitative methods to discern these biological differences so that patient cohorts in different trials can be compared and treatment responses can be related to defined tumor phenotypes.
- This example demonstrates the development of GCB, stromal-1, and stromal-2 survival signatures and a related multivariate model of survival for R-CHOP-treated DLBCL.
- Unless otherwise indicated, patient cohorts and methods of gene expression analysis are as described in Example 1.
- In the LLMPP CHOP cohort data, 936 genes were identified as associated with poor prognosis p<0.01 (1-sided). For genes having multiple array probe sets associated with survival, only the probe set with the strongest association with survival was used. The expression values of the probe sets in the LLMPP CHOP cohort data were then clustered. The largest cluster with an average correlation of >0.6 and containing myc was identified as the proliferation survival signature. 1396 genes were identified as associated with favorable outcome. The largest cluster with average correlation of >0.6 and containing BCL6 was identified as the germinal center B cell (GCB) survival signature. A cluster with average correlation of >0.6 and containing FNl was identified as the stromal-1 survival signature, whereas another cluster with average correlation of >0.6 containing HLADRA was identified as the MHC class II survival signature. The expression levels of genes within each signature were then averaged to create a "signature average" for each biopsy specimen. For the MMMLNP CHOP data set, the average was calculated for those array elements represented on the Affymetrix U133A microarray.
- From the four prognostic clusters or signatures, two signatures, the stromal-1 and the GCB signatures were used to create the best two variable survival model. Neither the proliferation nor the MHC class II signatures added to the prognostic value of this two variable model. This bivariate model performed well in the MMMLNP CHOP cohort (
Figure 9A ) and in the R-CHOP cohort (Figure 2A ). - The CHOP training set was used to discover and refine signatures that added to the prognostic significance of this bivariate model, and the resulting multivariate models were tested in the R-CHOP cohort. 563 genes were identified as adding to the model in the direction of adverse prognosis. These genes were clustered by hierarchical clustering, and three clusters of more than 10 genes with an average correlation of >0.6 were identified. In addition, 542 genes were identified which added to the stromal-1 and GCB signature model in the direction of favorable prognosis. These genes were clustered, and two clusters of more than 10 genes with an average correlation of >0.6 were identified. Signature averages were determined for these clusters, and three variable models containing the stromal-1 and GCB signature and each of the cluster averages were formed on the MMMLNP CHOP and R-CHOP data sets. Of the five cluster averages, two were found to add statistical significance (p<0.02) in the MMMLNP CHOP data as compared to a model containing the stromal-1 and GCB signatures alone. By contrast, in the R-CHOP data, three of the five cluster averages were found to add significance (p<0.02) to the bivariate model. One of these cluster averages added significantly to the bivariate model in both the MMMLNP CHOP and R-CHOP data. This signature, designated
Signature 122, was also found to add to the stromal-1 and GCB signature far more significantly than any of the four other signatures on the LLMPP CHOP data and, thus, was retained for further analysis. -
Signature 122 added significantly to the bivariate model in both the (MMMLNP CHOP cohort (p=0.011) and in the R-CHOP cohort (p=0.001) (Figures 9B and9C ). ThisSignature 122 positively correlated with the stromal-1 signature, although it was associated with adverse survival when added to the bivariate model. To further refine our model, we identified genes that were more correlated withSignature 122 than with the stromal-1 signature (p<0.02). These genes were organized by hierarchical clustering, and three sets of correlated genes (r>0.6) were observed. One of these clusters, the stromal-2 signature, added to the significance of the bivariate model in both the MMMLNP CHOP cohort (p=0.002) and the R-CHOP cohort (p<0.001) (Figures 2B and 9D). - A multivariate survival model was formed by fitting a Cox model with the GCB, stromal-1, and stomal-2 signatures to the LLMPP CHOP cohort data shown in Table 3. This final multivariate model with its associated scaling coefficients was then evaluated on the MMLLMPP CHOP and R-CHOP cohort data sets. Survival predictor scores from the final model were used to divide the R-CHOP cohort into quartile groups with 3-year overall survival rates of 89%, 82%, 74%, and 48%, and 3-year progression-free survival rates of 84%, 69%, 61% and 33% (
Figure 2B ). The survival predictor scores from the final model are illustrated inFigure 3 along with the three component signatures and representative genes of each signature.TABLE 3 Patient Time to death or last follow up (years) Status at last follow up (1=dead, 0=alive) Time to death, progression, or last follow up (years) Status at last follow up (1=progressed or died, 0=no progression) Germinal Center Signature Average Stromal-1 Signature Average Stromal-2 Signature Average Model Score 2 2.75 0 2.75 0 9.238 8.778 7.475 0.376 3 2.67 0 2.67 0 9.942 8.227 7.102 0.387 5 1.27 1 0.72 1 8.859 9.033 8.716 1.113 21 2.39 0 2.40 0 10.573 8.519 6.959 -0.270 22 2.38 0 2.38 0 8.737 8.686 7.598 0.761 23 2.52 0 2.52 0 10.694 10.322 8.817 -0.897 24 5.11 0 5.11 0 11.376 7.854 7.598 0.500 26 4.01 0 4.01 0 9.829 9.956 8.507 -0.372 28 3.96 0 3.96 0 10.957 9.277 8.248 -0.330 41 0.52 1 0.52 1 9.273 9.437 8.202 0.183 47 1.53 1 0.77 1 9.548 8.802 8.061 0.617 48 0.37 1 0.12 1 8.660 8.279 6.891 0.729 49 2.37 0 2.35 1 10.915 8.988 6.847 -0.965 53 3.89 0 2.23 1 9.530 9.792 9.693 0.721 61 0.90 1 0.46 1 8.649 8.038 8.104 1.798 65 4.04 0 4.04 0 10.744 9.330 7.930 -0.508 66 4.04 0 4.04 0 10.714 10.016 7.536 -1.459 95 0.62 1 0.44 1 9.244 9.197 8.105 0.373 96 5.37 0 5.37 0 10.107 8.723 7.608 0.157 97 5.07 0 5.07 0 9.777 9.192 7.359 -0.349 98 0.94 1 0.59 1 8.794 7.711 7.367 1.571 99 0.40 1 0.40 1 9.024 9.272 9.160 1.101 103 0.03 1 0.02 1 8.883 8.190 7.742 1.301 104 3.76 0 3.76 0 9.785 9.866 7.929 -0.652 106 2.95 0 2.95 0 10.585 7.797 6.824 0.367 107 2.94 0 2.94 0 11.535 8.358 6.660 -0.711 108 2.73 0 2.73 0 9.653 8.495 7.550 0.539 109 0.16 1 0.11 1 9.301 9.376 7.994 0.092 110 2.46 0 2.46 0 10.254 8.980 7.324 -0.357 111 2.44 0 2.44 0 10.137 10.691 8.948 -0.949 113 2.12 0 2.12 0 10.746 8.555 6.942 -0.390 114 1.98 0 0.88 1 8.562 8.159 7.120 1.047 115 1.92 0 1.92 0 10.313 9.385 8.157 -0.231 118 1.64 0 1.64 0 10.209 10.194 8.231 -0.959 119 1.60 0 1.60 0 11.059 8.852 7.479 -0.461 1087 0.05 1 0.05 1 8.756 8.491 7.949 1.188 1089 5.12 0 1.27 1 9.863 9.135 8.034 0.129 1091 5.15 0 5.15 0 10.454 9.918 8.742 -0.437 1092 5.06 0 5.07 0 9.452 9.467 8.912 0.556 1093 3.83 1 1.62 1 9.915 9.138 7.747 -0.090 1096 4.02 0 4.02 0 8.887 9.236 7.795 0.274 1097 1.26 1 1.08 1 11.219 9.234 8.321 -0.347 1098 3.53 0 3.53 0 9.117 9.236 7.655 0.082 1099 3.07 0 0.91 1 9.284 8.798 7.741 0.515 1101 5.64 0 5.64 0 9.803 9.466 8.156 -0.101 1108 3.30 0 3.30 0 9.195 10.456 9.065 -0.237 1109 3.78 0 3.78 0 11.008 10.051 8.273 -1.120 1164 0.19 1 0.16 1 9.242 10.307 10.548 0.896 1167 1.49 1 0.45 1 9.809 9.105 8.784 0.687 1168 0.42 1 0.30 1 8.718 8.368 7.149 0.790 1169 1.71 1 1.22 1 11.512 8.108 7.507 0.125 1172 2.82 0 2.82 0 11.137 8.871 8.153 -0.057 1173 0.87 1 0.79 1 11.324 9.914 8.514 -0.950 1175 1.06 1 0.56 1 9.107 10.310 9.063 -0.053 1179 2.53 0 2.53 0 9.506 9.437 8.461 0.260 1181 1.72 0 1.72 0 10.688 9.018 7.647 -0.360 1184 4.74 0 2.97 1 10.812 8.979 7.922 -0.187 1185 3.71 0 3.71 0 10.431 8.397 7.317 0.156 1186 3.43 0 3.43 0 8.688 8.944 8.552 1.164 1187 5.23 0 5.23 0 10.072 10.192 8.667 -0.604 1189 5.13 0 5.13 0 10.109 9.212 7.967 -0.097 1190 3.66 0 3.66 0 10.713 10.409 8.910 -0.930 1192 0.16 1 0.16 1 8.825 9.903 8.061 -0.199 1195 4.36 0 4.36 0 11.539 7.567 6.873 0.234 1197 3.13 0 3.13 0 10.287 10.365 9.549 -0.275 1200 0.31 1 0.31 1 9.432 8.950 9.805 1.692 1206 6.51 0 6.51 0 10.410 9.946 8.925 -0.323 1211 6.25 0 6.25 0 11.596 7.908 6.524 -0.372 1215 5.35 0 5.35 0 10.504 9.061 7.550 -0.392 1216 0.46 1 0.29 1 10.017 9.010 7.794 0.028 1219 0.51 1 0.51 1 10.614 10.014 8.619 -0.683 1220 2.24 1 2.25 1 8.850 9.400 8.036 0.286 1221 3.94 0 3.95 0 8.777 7.489 6.672 1.334 1222 3.53 0 3.53 0 10:463 9.310 7.019 -0.986 1224 3.22 0 2.11 1 9.751 9.505 8.453 0.082 1225 2.95 0 2.95 0 8.613 8.313 7.668 1.240 1226 0.08 1 0.08 1 9.229 8.851 7.950 0.625 1228 2.78 0 0.99 1 11.532 8.261 6.932 -0.428 1230 0.59 1 0.54 1 9.369 6.951 6.956 1.825 1231 1.41 0 1.41 0 10.248 8.788 8.011 0.303 1232 2.49 0 0.68 1 10.362 8.528 7.975 0.495 1233 2.50 0 2.50 0 9.239 10.581 8.470 -0.784 1236 2.56 0 2.56 0 9.156 10.000 7.805 -0.608 1238 0.16 1 0.16 1 9.488 9.055 8.256 0.517 1239 2.24 0 2.24 0 8.886 8.978 7.838 0.564 1240 1.48 0 1.48 0 10.474 9.073 7.702 -0.288 1241 1.41 1 1.17 1 9.044 9.054 7.451 0.160 1251 2.72 0 2.72 0 8.410 8.687 7.082 0.549 1252 0.01 1 0.01 1 11.167 8.070 7.358 0.206 1255 5.17 0 5.17 0 9.501 9.411 7.887 -0.099 1271 4.72 0 4.73 0 10.718 8.452 7.060 -0.194 1272 5.68 0 5.68 0 9.161 9.080 7.668 0.231 1275 1.89 1 1.48 1 9.257 8.559 8.607 1.354 1277 5.06 0 5.07 0 11.091 9.938 8.274 -1.038 1279 4.87 0 4.87 0 9.309 10.085 9.676 0.504 1281 3.36 0 not available (n/a) n/a 9.535 9.969 9.090 0.132 1284 3.51 0 3.51 0 10.922 9.680 8.481 -0.567 1288 1.54 0 n/a n/a 9.430 8.896 8.037 0.554 1289 0.03 1 0.03 1 8.915 9.052 8.002 0.589 1290 5.23 0 5.23 0 10.432 10.426 8.154 -1.340 1291 0.04 1 0.04 1 11.319 8.246 7.323 -0.059 1292 0.10 1 0.10 1 8.667 8.764 8.110 1.058 1293 4.81 0 4.81 0 11.116 9:842 8.083 -1.081 1294 0.53 1 0.53 1 10.138 10.181 8:501 -0.733 1295 5.16 0 5.17 0 9.445 9.694 7.739 -0.463 1296 4.79 0 4.79 0 10.228 9.064 8.852 0.600 1297 4.24 0 4.24 0 9.524 7.990 7.008 0.740 1298 4.56 0 4.56 0 9.022 9.000 7.695 0.389 1331 3.29 0 3.29 0 11.004 9.488 8.289 -0.536 1334 2.87 0 2.87 0 11.434 9.509 8.109 -0.859 1335 1.38 1 0.90 1 9.586 8.545 7.423 0.431 1336 2.44 0 2.44 0 10.844 9.704 7.706 -1.082 1337 0.02 1 0.02 1 8.521 7.788 7.860 1.941 1449 1.62 0 1.62 0 9.604 8.463 8.030 0.917 1450 1.30 0 0.53 1 8.571 8.112 7.241 1.173 1451 1.84 0 1.85 0 10.637 9.205 7.759 -0.452 1453 1.71 0 1.71 0 10.964 9.089 8.226 -0.157 1454 0.62 0 0.62 0 11.106 8.514 7.604 -0.052 1553 2.93 0 1.92 1 8.975 9.284 7.475 -0.029 1612 5.37 0 5.37 0 10.526 9.471 7.809 -0.643 1613 5.81 0 n/a n/a 10.868 9.695 7.730 -1.067 1614 4.36 1 4.36 1 10.358 9.226 8.765 0.322 1617 0.52 0 0.52 0 10.332 8.723 7.180 -0.227 1618 1.70 0 0.98 1 11.233 8.956 7.852 -0.387 1619 0.25 1 0.25 1 8.646 8.028 7.123 1.146 1620 2.17 0 2.17 0 11.647 8.385 7.343 -0.325 1623 2.80 0 2.80 0 9.611 9.484 8.249 0.024 1626 1.76 0 1.76 0 11.236 9.495 8.108 -0.763 1628 3.13 0 1.23 1 8.714 7.972 7.149 1.192 1645 2.85 0 2.85 0 10.146 9.476 8.914 0.258 1647 2.79 0 2.80. 0 10.485 10.495 8.707 -1.058 1650 0.75 1 0.75 1 8.830 7.346 6.486 1.333 1651 1.66 0 1.66 0 9.190 7.949 6.829 0.801 1652 1.64 0 nia n/a 8.798 8.943 8.331 0.969 1702 1.05 0 1.05 1 9.008 8.217 8.078 1.447 1703 0.70 1 0.70 1 9.499 8.637 7.790 0.621 1704 3.14 0 3.14 0 9.908 9.231 7.503 -0.347 1705 3.94 0 3.94 0 8.933 8.445 8.187 1.321 1707 2.80 0 2.80 0 10.610 9.348 7.872 -0.510 1742 3.27 0 n/a n/a 10.033 8.715 7.412 0.063 1746 1.91 0 1.55 1 9.249 8.705 8.205 0.937 1747 1.48 0 1.48 0 10.162 8.866 7.602 -0.016 1756 3.47 0 3.47 0 10.815 9.638 7.248 -1.312 1761 0.23 1 0.23 1 9.842 10.192 8.664 -0.511 1762 5.20 0 5.20 0 10.583 9.333 7.445 -0.772 1763 5.51 0 5.51 0 8.917 8.925 8.084 0.771 1766 1.59 0 1.59 0 10.919 10.037 8.389 -0.990 1782 1.09 0 1.09 0 10.753 9.600 8.332 -0.516 1788 0.39 1 0.24 1 10.364 8.738 8.914 0.915 1861 0.56 1 0.19 1 9.728 8.604 7.594 0.427 1867 1.17 1 0.38 1 8.903 11.501 10.559 -0.166 1916 1.41 0 n/a n/a 9.295 11.197 11.508 0.619 1920 1.32 0 1.32 0 10.165 9.630 8.789 0.009 1927 1.53 0 1.53 0 9.195 10.261 9.791 0.451 1928 0.72 0 0.72 0 9.769 8.510 7.330 0.328 1939 0.47 1 0.47 1 9.097 9.363 7.647 -0.043 2002 1.29 0 1.30 0 9.469 9.542 8.600 0.262 2006 1.23 0 1.23 0 10.434 8.223 7.162 0.227 2067 2.18 0 2.18 0 10.244 11.186 9.391 -1.197 2070 0.31 0 0.12 1 10.486 10.680 10.353 -0.135 2162 0.38 1 0.38 1 10.934 10.020 7.960 -1.268 2270 1.59 0 1.59 0 10.117 9.904 8.506 -0.440 2271 1.60 0 1.60 0 8.995 9.349 8.261 0.428 2274 0.41 0 0.41 0 8.863 7.623 7.222 1.533 2283 1.19 0 1.19 0 10.501 8.361 6.741 -0.226 2291 0.87 1 0.85 1 10.732 10.184 9.436 -0.353 2299 0.93 0 0.93 0 10.661 9.905 8.189 -0.883 2301 0.61 0 0.61 0 9.852 9.903 8.352 -0.432 2306 0.68 0 0.68 0 8.586 8.759 8.191 1.151 2309 0.43 0 0.43 0 10.839 7.671 6.860 0.413 2311 0.80 0 0.80 0 10.901 7.797 6.912 0.294 2318 0.99 0 0.99 0 10.283 9.403 8.655 0.100 2321 0.82 0 0.82 0 9.691 8.956 7.404 -0.044 2411 0.67 0 0.67 0 8.986 8.383 7.854 1.137 2415 0.62 0 0.62 0 9.296 10.509 9.551 -0.005 2444 3.99 0 3.99 0 10.154 9.871 9.026 -0.071 2445 3.36 0 3.36 0 8.788 8.184 7.964 1.497 2479 0.51 0 0.51 0 11.151 9.023 8.199 -0.186 2482 4.54 0 4.54 0 10.373 9.847 8.208 -0.691 2483 3.89 1 3.89 1 9.241 8.902 7.742 0.428 2484 2.69 1 1.90 1 10.279 9.619 8.312 -0.349 2485 4.43 0 4.43 0 9.957 9.865 8.439 -0.378 2486 4.37 0 n/a n/a 10.698 10.203 8.041 -1.301 2487 4.34 0 4.34 0 11.227 9.909 8.260 -1.076 2488 4.20 0 4.21 0 9.510 8.709 7.615 0.426 2490 4.02 0 4.02 0 10.510 10.961 8.956 -1.374 2491 0.50 1 0.25 1 9.047 8.554 7.624 0.784 2492 3.96 0 3.96 0 9.904 10.901 9.140 -0.935 2497 3.44 0 3.44 0 9.221 9.438 8.065 0.111 2498 3.37 0 3.37 0 9.318 9.427 8.003 0.040 2500 3.31 0 3.31 0 11.014 9.406 7.375 -1.074 2501 3.28 0 n/a n/a 8.822 8.551 7.750 0.966 2503 2.99 0 2.99 0 8.301 7.967 6.929 1.222 2504 2.78 0 2.78 0 10.145 8.004 7.017 0.472 2505 2.76 0 2.76 0 11.036 8.442 7.136 -0.266 2507 0.86 1 0.54 1 9.737 9.475 8.988 0.480 2508 2.58 0 2.58 0 8.678 9.389 8.230 0.498 2509 0.96 1 0.76 1 8.895 10.441 9.088 -0.081 2511 1.55 1 1.06 1 9.225 9.267 9.191 1.042 2512 2.45 0 2.45 0 11.047 10.465 9.337 -0.838 2513 0.61 1 0.61 1 10.855 10.378 8.395 -1.305 2514 2.18 0 2.18 0 10.477 9.832 7.498 -1.198 2515 2.13 0 2.13 0 9.295 10.519 9.788 0.145 2516 2.07 0 2.07 0 10.575 10.592 8.642 -1.238 2517 2.04 0 0.76 1 9.385 9.163 8.328 0.498 2584 0.68 0 0.68 0 10.759 9.356 8.135 -0.404 2599 4.05 0 4.05 0 10.629 9.158 7.724 -0.425 2600 1.01 1 0.54 1 9.785 8.619 7.291 0.184 2601 1.22 1 0.88 1 9.385 8.044 7.178 0.859 2603 4.43 0 4.43 0 9.582 10.707 9.803 -0.156 2604 0.84 0 0.36 1 9.844 10.511 8.382 -1.026 2609 8.89 0 2.55 1 8.981 8.775 7.506 0.507 2610 0.74 0 0.74 0 10.793 8.964 7.421 -0.502 2611 0.66 0 0.66 0 10.353 10.233 9.032 -0.518 2612 1.17 1 1.13 1 10.290 9.028 8.287 0.230 2613 1.66 0 1.66 0 10.997 9.089 7.749 -0.493 2614 0.21 1 0.21 1 8.768 7.850 7.100 1.261 2615 0.48 0 0.48 0 11.359 9.470 7.647 -1.100 2639 10.29 0 10.30 0 11.085 10.385 8.003 -1.674 2641 1.38 0 1.38 0 9.199 8.818 7.340 0.259 2642 3.67 0 3.67 0 10.731 8.777 7.167' -0.458 2643 5.49 0 5.49 0 10.236 10.578 8.473 -1.197 2645 0.19 0 n/a n/a 11.130 9.997 8.254 -1.129 2646 0.18 1 0.18 1 8.893 7.648 6.871 1.260 2648 0.25 0 0.25 0 8.855 7.745 7.060 1.303 2649 2.13 0 2.13 0 9.688 10.354 9.885 0.214 2650 2.43 0 n/a n/a 10.007 10.052 8.861 -0.305 2651 1.61 0 n/a n/a 10.660 9.452 7.831 -0.665 2652 1.84 0 1.84 0 11.378 9.247 7.684 -0.856 2653 1.88 0 1.88 0 11.182 9.638 7.781 -1.106 2654 1.43 0 1.43 0 8.791 9.395 8.905 0.902 2813 3.97 0 3.97 0 10.701 9.366 8.258 -0.306 2814 0.81 1 0.70 1 10.561 9.176 9.275 0.632 - The International Prognostic Index (IPI), which is based on 5 clinical variables, predicts survival in both CHOP-treated and R-CHOP-treated patients (Shipp et al., N. Engl. J. Med., 329:987-94 (1993); Sehn et al., Blood, 109: 1857-61 (2007)). The inventive gene expression-based survival model retained its prognostic significance among R-CHOP-treated patients segregated according to IPI into high, intermediate and low IPI risk groups, both as originally defined (Shipp et al., supra) (p<0.001) (
Figure 2C ) and as recently modified for R-CHOP-treated DLBCL (Sehn et al., supra) (p<0.001) (Figure 10 ). - The foregoing results indicate that the gene expression-based multivariate model can be used to identify large disparities in survival among patients with different DLBCL gene signature profiles. Thus, survival predictor scores were used to divide patients into least and most favorable quartile groups having 3-year progression-free survival rates of 33% and 84%, respectively. Given its statistical independence from the IPI, the gene expression-based survival predictor provides a complementary view of DLBCL variation that can be considered when analyzing data from DLBCL clinical trials. Additionally, the foregoing results indicate that whole-genome gene expression profiles in conjunction with the survival model described herein can be used to provide optimal predictions of expected survival outcomes for subjects suffering from DLBCL.
- This example demonstrates the use of a survival predictor score to predict the probability of progression free and overall survival outcomes at a period of time t following R-CHOP treatment in accordance with the invention.
- RNA is isolated from a patient's DLBCL biopsy and hybridized to a U133+ array from Affymetrix (Santa Clara, CA). The array is scanned, and MAS 5.0 algorithm is applied to obtain signal values normalized to a target intensity of 500. Signal values are log2 transformed to intensity values. For genes of interest with multiple probe sets, the intensity value of the multiple probe sets are averaged to obtain a single intensity value for each gene. The single intensity values of genes in the GCB signature are averaged to obtain a GCB signature average of 9.2. The single intensity values of genes in the stromal-1 signature are averaged to obtain a stromal-1 signature average of 8.5. The single intensity values of genes in the stromal-2 signature are averaged to obtain a stromal-2 signature average of 7.2.
- The patient's survival predictor score is calculated using the following equation

- Table 4 includes values from a progression free survival curve generated using baseline hazard functions calculated from the R-CHOP patient data described in Table 3. The curve was generated in accordance with the methods of Kalbfleisch and Prentice, Biometrika, 60: 267-279 (1973), which involves maximizing the full likelihood, under the assumption that the true scaling coefficients were equal to prior estimates. In Table 4, F0(t) is the probability of progression free survival for each indicated time period following R-CHOP treatment (t-RCHOP).
Table 4 t-RCHOP (years) F0(t) 0.000 1.000 0.008 0.997 0.016 0.993 0.025 0.990 0.030 0.987 0.036 0.983 0.049 0.980 0.082 0.977 0.096 0.973 0.107 0.970 0.118 0.967 0.120 0.963 0.156 0.960 0.156 0.956 0.159 0.953 0.178 0.950 0.192 0.946 0.211 0.943 0.233 0.939 0.241 0.936 0.246 0.932 0.252 0.928 0.290 0.925 0.298 0.921 0.307 0.918 0.364 0.914 0.381 0.910 0.381 0.907 0.400 0.903 0.441 0.899 0.446 0.895 0.463 0.891 0.468 0.887 0.515 0.884 0.517 0.880 0.531 0.876 0.534 0.872 0.537 0.868 0.537 0.864 0.539 0.860 0.561 0.856 0.586 0.852 0.611 0.848 0.679 0.843 0.698 0.839 0.698 0.834 0.720 0.830 0.747 0:826 0.756 0.821 0.761 0.816 0.767 0.812 0.786 0.807 0.849 0.803 0.879 0.798 0.884 0.793 0.898 0.789 0.912 0.784 0.977 0.779 0.986 0.774 1.046 0.770 1.057 0.765 1.076 0.760 1.128 0.755 1.166 0.750 1.216 0.745 1.227 0.740 1.270 0.735 1.481 0.729 1.547 0.724 1.624 0.718 1.900 0.711 1.919 0.705 2.105 0.699 2.231 0.692 2.245 0.685 2.352 0.678 2.546 0.671 2.968 0.662 3.890 0.648 4.364 0.623 - The patient's probability of 2 year progression free survival is calculated using the equation: P(PFS) = F0(t)(exp(0-976*survival predictor score)), were F0(t) is the F0(t) value that corresponds to the largest time value smaller than 2 years in the progression free survival curve. In Table 4, the largest time value smaller than 2 is 1.919, and the corresponding PF0(t) value is 0.705. Accordingly, the patient's probability of 2 year progression free survival P(PFS) = 0.705(exp(0.976*survival predictor score)) =0.7051.462 = 0.600 or about 60%.
- Table 5 includes values from an overall survival curve generated using baseline hazard functions calculated from the R-CHOP patient data described in Table 3. The curve was made according to the method of Kalbfleisch and Prentice, Biometrika, 60: 267-279 (1973), which involves maximizing the full likelihood, under the assumption that the true scaling coefficients were equal to our estimates. In Table 5, OS0(t) is the probability of overall survival for each indicated time period following R-CHOP treatment (t-RCHOP).
Table 5 t-RCHOP (years) OS0(t) 0.000 1.000 0.008 0.997 0.016 0.994 0.030 0.991 0.033 0.988 0.036 0.984 0.049 0.981 0.082 0.978 0.096 0.975 0.156 0.972 0.156 0.969 0.159 0.965 0.178 0.962 0.192 0.959 0.211 0.956 0.233 0.952 0.246 0.949 0.307 0.946 0.367 0.942 0.380 0.939 0.386 0.935 0.402 0.932 0.416 0.928 0.463 0:925 0.468 0.921 0.504 0.918 0.515 0.914 0.517 0.910 0.531 0.907 0.556 0.903 0.586 0.900 0.610 0.896 0.619 0.892 0.698 0.888 0.747 0.885 0.807 0.881 0.862 0.877 0.868 0.873 0.873 0.869 0.895 0.864 0.944 0.860 0.963 0.856 1.010 0.852 1.057 0.848 1.169 0.843 1.169 0.839 1.215 0.835 1.262 0.830 1.273 0.826 1.382 0.821 1.412 0.817 1.492 0.812 1.527 0.807 1.552 0.802 1.708 0.796 1.889 0.791 2.244 0.784 2.693 0.777 3.826 0.763 3.889 0.749 4.363 0.724 - The patient's probability of 2 year overall survival is calculated using the equation: P(OS) = Os0(t)(exp(survival predictor score)), where OS0(t) is the value that corresponds to the largest time value in the overall survival curve which is smaller than 2 years. In Table 5, the largest time value smaller than 2 is 1.889, and the corresponding OS0(t) value is 0.791. Accordingly, the patient's probability of 2 year overall survival is P(PFS) = 0.791(exp(0.389)) = 0.7911.4476 = 0.707 or 70.7%.
- This example demonstrates the biological basis for DLBCL prognostic signatures.
- Unless otherwise indicated, cohorts and methods of gene expression analysis are described in Examples 1 and 2. Furthermore, cell suspensions from three biopsies were separated by flow cytometry into a CD19+ malignant subpopulation and a CD19- non-malignant subpopulation. Gene expression profiling was performed following two rounds of linear amplification from total RNA (Dave et al., N. Engl. J. Med., 351: 2159-69 (2004)). After MAS5.0 normalization, genes were selected that had a log2 signal value greater than 7 in either the
CD 19+ or CD19- fractions in at least two of the sorted samples. - To assess whether the gene expression signatures in the final survival model of Example 2 were derived from the malignant lymphoma cells or from the host microenvironment, three DLBCL biopsy samples were fractionated into CD19+ malignant cells and CD19- non-malignant cells by flow sorting. Most germinal center B cell signature genes were more highly expressed in the malignant fraction, whereas genes from the stromal-1 and stromal-2 signatures were more highly expressed in the non-malignant stromal fraction (
Figure 4A ), hence their name. Since these two signatures were synergistic in predicting survival, they were combined into a "stromal score" (Figure 3 ), high values of which were associated with adverse outcome. - The germinal center B cell signature relates to the distinction between the ABC and GCB DLBCL subtypes (
Figure 3 ). By contrast, the genes defining the stromal-1 signature encodes components of the extracellular matrix, including fibronectin, osteonectin, various collagen and laminin isoforms, and the anti-angiogenic factor thrombospondin (Figure 3 and Table 1). This signature also encodes modifiers of collagen synthesis (LOXL1, SERPINH1), proteins that remodel the extracellular matrix (MMP2, MMP9, MMP14, PLAU, TIMP2), and CTGF, a secreted protein that can initiate fibrotic responses (Frazier et al., J. Invest. Dermatol., 107(3): 404-11 (1996)). In addition, the stromal-1 signature includes genes characteristically expressed in cells of the monocytic lineage, such as CEBPA and CSF2RA. - The stromal-1 signature is significantly related to several previously curated gene expression signatures (Shaffer et al., Immunol. Rev., 210: 67-85 (2006)) based on gene set enrichment analysis (Subramanian et al., Proc. Nat'l. Acad. Sci. USA, 102(43): 15545-50 (2005)). Two of these signatures include genes that are coordinately expressed in normal mesenchymal tissues but not in hematopoietic subsets, many of which encode extracellular matrix proteins (false discovery rate (FDR) < 0.001) (
Figures 4B and11 ) (Su et al., Proc. Nat'l. Acad. Sci. USA, 101: 6062-7 (2004)). Also enriched was a "monocyte" signature, comprised of genes that are more highly expressed in CD 14+ blood monocytes than in B cells, T cells, or NK cells (FDR=0.014) (Figure 4B ). By contrast, a pan-T cell signature was not related to the stromal-1 signature (Figure 4B ). These findings suggest that high expression of the stromal-1 signature identifies tumors with vigorous extracellular matrix deposition and infiltration by cells in the monocytic lineage. - In this regard, the stromal-1 signature gene product fibronectin was prominently localized by immunohistochemistry to fibrous strands running between the malignant cells in DLBCL biopsy samples, in keeping with its role in extracellular matrix formation. By contrast, the protein products of three other stromal-1 genes - MMP9, SPARC, and CTGF - were localized primarily in histiocytic cells that infiltrated the DLBCL biopsies. By immunofluorescence, SPARC and CTGF colocalized with CD68, which is a marker for cells in the monocytic lineage. As expected for a stromal-1 gene product, SPARC protein levels were associated with favorable overall survival (
Figure 5A ). - The stromal-1 signature includes genes that are coordinately expressed in many normal mesenchymal tissues, most of which encode proteins that form or modify the extracellular matrix. The localization of fibronectin to fibrous strands insinuated between the malignant lymphoma cells suggests that the stromal-1 signature reflects the fibrotic nature of many DLBCL tumors. This fibrotic reaction may be related to another stromal-1 signature component, CTGF, which participates in many fibrotic responses and diseases, and promotes tumor growth and metastasis of epithelial cancers (Shi-Wen et al., Cytokine Growth Factor Rev., 19: 133-44 (2008)).
- The foregoing results also indicate that the stromal-1 signature reflects a monocyte-rich host reaction to the lymphoma that is associated with the abundant deposition of extracellular matrix. Tumors with high expression of the stromal-1 signature were infiltrated by cells of the myeloid lineage, which include cells that have been implicated in the pathogenesis of epithelial cancers, including tumor-associated macrophages, myeloid-derived suppressor cells, and Tie2-expressing monocytes (reviewed in Wels et al., Genes Dev., 22: 559-74 (2008)). In animal models, these myeloid lineage cells promote tumor cell invasion by secreting matrix metalloproteinases such as MMP9, suppress T cell immune responses, and initiate angiogenesis.
- Several stromal-2 signature genes encode well-known markers of endothelial cells. These include von-Willebrand factor (VWF) and CD31 (PECAM1), as well as other genes specifically expressed in endothelium such as EGFL7, MMRN2, GPR116, and SPARCL (Table 1). This signature also includes genes encoding key regulators of angiogenesis, such as, for example, KDR (VEGF receptor-2); Grb10, which mediates KDR signaling; integrin alpha 9, which enhances VEGF signaling; TEK, the receptor tyrosine kinase for the cytokine angiopoietin; ROBO4, an endothelial-specific molecular guidance molecule that regulates angiogenesis; and ERG, a transcription factor required for endothelial tube formation. The stromal-2 signature genes CAV1, CA V2, and EHD2 encode components of caveolae, which are specialized plasma membrane structures that are abundant in endothelial cells and required for angiogenesis (Frank et al., Arterioscler. Thromb. Vasc. Biol., 23: 1161-8 (2003); Woodman et al., Am. J. Pathol., 162: 2059-68 (2003)). Although the stromal-2 signature includes a large number of genes expressed in endothelial cells, other genes are expressed exclusively in adipocytes, including ADIPOQ, FABP4, RBP4, and PLIN.
- Quantitative tests were done to determine whether expression of the stromal-2 signature relative to the stromal-1 signature (i.e., high stromal score) is related to high tumor blood vessel density, given the connection between many stromal-2 signature genes and angiogenesis. More specifically, the stromal-1 signature averages were subtracted from the stromal-2 signature average to thereby obtain a stromal score for each biopsy. Tests showed a quantitative measure of blood vessel density correlated significantly with the stromal score (r=0.483, p=0.019) (see
Figures 5B and 5C ), such that higher blood vessel densities correlated with higher stromal scores. - Thus, the stromal-1 and stromal-2 gene expression signatures reflect the character of the non-malignant cells in DLBCL tumors, and the stromal-2 signature may represent an "angiogenic switch" in which the progression of a hyperplastic lesion to a fully malignant tumor is accompanied by new blood vessel formation (Hanahan et al., Cell, 86: 353-64 (1996)). DLBCL tumors with high relative expression of the stomal-2 signature were associated with increased tumor blood vessel density and adverse survival. Significant macrophage infiltration in some DLBCL tumors may predispose to angiogenesis since, in experimental models, tumor-associated macrophages accumulate prior to the angiogenic switch and are required for the switch to occur (Lin et al., Cancer Res., 66: 11238-46 (2006)). Additionally, CXCL12 (SDF-1), a stromal-2 signature component, is a chemokine secreted either by fibroblasts or endothelial cells that can promote angiogenesis by recruiting CXCR4+ endothelial precursor cells from the bone marrow (Orimo et al., Cell, 121: 335-48 (2005)). Moreover, an antagonist of angiogenesis, thrombospondin-2 (Kazerounian et al., Cell Mol. Life Sci., 65: 700-12 (2008)), is a stromal-1 signature component, which may explain why tumors with low relative expression of this signature had an elevated blood vessel density. Furthermore, the expression of adipocyte-associated genes in DLBCL tumors with high stromal-2 signature expression may play a role in angiogenesis since some cells in adipose tissue may have the potential to differentiate into endothelial cells (Planat-Benard et al., Circulation, 109: 656-63 (2004)). Alternatively, the expression of adipose-associated genes may reflect the recruitment of bone marrow-derived mesenchymal stem cells, which home efficiently to tumors (Karnoub et al., Nature, 449: 557-63 (2007)) and can stabilize newly formed blood vessels (Au et al., Blood, 111:. 4551-4558 (2008)).
- The foregoing results indicate that the stromal-1 and stromal-2 gene signatures can be used to generate a stromal score that correlates with increased blood vessel density. Thus, the stromal score can be used to determine if a DLBCL patient is likely to benefit from administration of antiangiogenic therapy (alone, or in conjunction with another DLBCL therapeutic regimen).
- The use of the terms "a" and "an" and "the" and similar referents in the context of describing the invention (especially in the context of the following claims) are to be construed to cover both the singular and the plural, unless otherwise indicated herein or clearly contradicted by context. The terms "comprising," "having," "including," and "containing" are to be construed as open-ended terms (i.e., meaning "including, but not limited to,") unless otherwise noted. Recitation of ranges of values herein are merely intended to serve as a shorthand method of referring individually to each separate value falling within the range, unless otherwise indicated herein, and each separate value is incorporated into the specification as if it were individually recited herein. All methods described herein can be performed in any suitable order unless otherwise indicated herein or otherwise clearly contradicted by context. The use of any and all examples, or exemplary language (e.g., "such as") provided herein, is intended merely to better illuminate the invention. No language in the specification should be construed as indicating any non-claimed element as essential to the practice of the invention.
- Preferred embodiments of this invention are described herein, including the best mode known to the inventors for carrying out the invention. Variations of those preferred embodiments may become apparent to those of ordinary skill in the art upon reading the foregoing description. The inventors expect skilled artisans to employ such variations as appropriate.
Claims (14)
- A method of predicting survival outcome based on one or more diffuse large B cell lymphoma (DLBCL) samples, which method comprises:a) isolating gene expression products from one or more DLBCL biopsy samples from a subject treated with a therapeutic regimen that includes chemotherapy and Rituximab (R-CHOP);b) obtaining a gene expression profile from the gene expression products, wherein the expression profile comprises an expression level for each of at least 31 of the genes listed in Table 1 for the germinal center B cell (GCB) gene expression signature and at least 226 of the genes listed in Table 1 for the stromal-1 gene expression signature;c) determining a GCB signature value and a stromal-1 signature value from the gene expression profile, wherein the GCB signature value is an average of the expression levels of the at least 31 genes listed in Table 1 for the GCB gene expression signature and the stromal-1 signature value is an average of the expression levels of the at least 226 genes listed in Table 1 for the stromal-1 gene expression signature;d) calculating a survival predictor score = A - [(x)*(the GCB signature value)] - [(y)*(the stromal-1 signature value)], wherein A is an offset term, (x) is a scale factor between 0.200 and 0.625, and (y) is a scale factor between 0.800 and 1.250, ande) determining the survival outcome for the subject based on the survival predictor score calculated in step d) for any fixed same value of A and for any fixed same values of (x) and (y), wherein a lower survival predictor score indicates a more favorable survival outcome and a higher survival predictor score indicates a less favorable survival outcome for the subject.
- The method of claim 1, wherein the method comprises:b) obtaining a gene expression profile from the gene expression products, wherein the expression profile comprises an expression level for each of at least 31 of the genes listed in Table 1 for the GCB expression signature, at least 226 of the genes listed in Table 1 for the stromal-1 gene expression signature, and at least 58 of the genes listed in Table 1 for the stromal-2 gene expression signature;c) determining a GCB signature value, a stromal-1 signature value, and a stromal-2 gene signature value from the gene expression profile, wherein the GCB signature value is an average of the expression levels of the at least 31 genes listed in Table 1 for the GCB gene expression signature and the stromal-1 signature value is an average of the expression levels of the at least 226 genes listed in Table 1 for the stromal-1 gene expression signature and the stromal-2 signature value is an average of the expression levels of the at least 58 genes listed in Table 1 for the stromal-2 gene expression signature; andd) calculating a survival predictor score = A - [(x)*(the GCB signature value)] - [(y)*(the stromal-1 signature value)] + [(z)*(the stromal-2 signature value)], wherein A is an offset term, (x) is a scale factor between 0.200 and 0.625, (y) is a scale factor between 0.800 and 1.250, and (z) is a scale factor between 0.450 and 0.900, ande) determining the survival outcome for the subject based on the survival predictor score calculated in step d) for any fixed same value of A and for any fixed same values of (x), (y), and (z), wherein a lower survival predictor score indicates a more favorable survival outcome and a higher survival predictor score indicates a less favorable survival outcome for the subject.
- The method of claim 2, wherein the method comprisesd) calculating a survival predictor score using the equation: survival predictor score = 8.11 - [0.419*(the GCB signature value)] - [1.015*(the stromal-1 signature value)] + [0.675*(the stromal-2 signature value)]
- A method of predicting survival outcome based on one or more diffuse large B cell lymphoma (DLBCL) samples, which method comprises:a) isolating gene expression products from one or more DLBCL biopsy samples from a subject treated with a therapeutic regimen that includes chemotherapy and Rituximab (R-CHOP);b) obtaining a gene expression profile from the gene expression products, wherein the gene expression profile comprises an expression level for each of at least 31 of the genes listed in Table 1 for the germinal center B-cell gene (GCB) expression signature, at least 226 of the genes listed in Table 1 for the stromal-1 gene expression signature, and at least 58 of the genes listed in Table 1 for the stromal-2 gene expression signature;c) determining a GCB signature value, a stromal-1 signature value, and a stromal-2 signature value from the gene expression profile, wherein the GCB signature value is an average of the expression levels of the at least 31 genes listed in Table 1 for the GCB gene expression signature and the stromal-1 signature value is an average of the expression levels of the at least 226 genes listed in Table 1 for the stromal-1 gene expression signature and the stromal-2 signature value is an average of the expression levels of the at least 58 genes listed in Table 1 for the stromal-2 gene expression signature;d) calculating a survival predictor score using the equation: survival predictor score = A - [(x)*(the GCB signature value)] - [(y)*(the stromal-1 signature value)] + [(z)*(the stromal-2 signature value)], wherein A is an offset term and (x) is a scale factor between 0.200 and 0.625, (y) is a scale factor between 0.800 and 1.250, and (z) is a scale factor between 0.450 and 0.900; ande) calculating the probability of a survival outcome for the subject beyond an amount of time t following treatment for DLBCL, wherein the subject's probability of the survival outcome P(SO) is calculated using the equation: P(SO) = SO0(t)(exp((s)*survival predictor score)), wherein SO0(t) is the probability of the survival outcome, which corresponds to the largest time value smaller than t in a survival outcome curve, and wherein (s) is a scale factor between 0.970 and 0.980.
- The method of claim 4, wherein the survival outcome is overall survival and the method comprises:d) calculating a survival predictor score using the equation: survival predictor score = [0.419*(the GCB signature value)] - [1.015*(the stromal-1 signature value)] + [0.675*(the stromal-2 signature value)]; ande) calculating the probability of overall survival after time t for the subject, wherein the subject's probability of overall survival P(OS) is calculated using the equation: P(OS) = OS0(t)(exp(survival predictor score)) wherein OS0(t) is the probability of overall survival, which corresponds to the largest time value smaller than t in an overall survival curve.
- The method of claim 4, wherein the survival outcome is progression free survival and the method comprises:d) calculating a survival predictor score using the equation: survival predictor score = 8.11 - [0.419*(the GCB signature value)] - [1.015*(the stromal-1 signature value)] + [0.675*(the stromal-2 signature value)]; ande) calculating the probability of progression free survival after time t for the subject, wherein the subject's probability of progression free survival P(PFS) is calculated using the equation P(PFS) = F0(t)(exp(0.976*survival predictor score)), wherein F0(t) is the probability of progression free survival, which corresponds to the largest time smaller than t in a survival curve, and wherein wherein scale factor (s) = 0.976.
- The method of any one of claims 4-6, wherein the probability of a survival outcome is the probability of a survival outcome for the subject beyond an amount of time t following treatment for DLCBL that includes chemotherapy and the administration of Rituximab.
- The method of any one of claims 4-7, wherein the method further includes providing the subject with the calculated probability of the survival outcome after time t.
- A targeted array comprising at least one probe or set of probes for each gene in (a) a germinal center B-cell gene (GCB) expression signature comprising at least 31 of the GCB signature genes listed in Table 1, (b) a stromal-1 gene expression signature comprising at least 226 of the stromal-1 signature genes listed in Table 1, and (c) a stromal-2 gene expression signature comprising at least 58 of the stromal-2 signature genes listed in Table 1, wherein the array comprises probes for fewer than 10,000 genes.
- The targeted array of claim 9, wherein the GCB expression signature comprises at least 37 of the GCB signature genes listed in Table 1, wherein the stromal-1 gene expression signature comprises at least 270 of the stromal-1 signature genes listed in Table 1, and wherein the stromal-2 gene expression signature comprises at least 68 of the stromal-2 signature genes listed in Table 1.
- The method of claim 1, wherein the GCB signature value is an average of the expression levels of at least 37 genes listed in Table 1 for the GCB signature and the stromal-1 signature value is an average of the expression levels of at least 270 genes listed in Table 1 for the stromal-1 signature.
- The method of claim 1, wherein the GCB signature value is an average of the expression levels of all of the genes listed in Table 1 for the GCB signature and the stromal-1 signature value is an average of the expression levels of all of the genes listed in Table 1 for the stromal-1 signature.
- The method of any one of claims 2-8, wherein the GCB signature value is an average of the expression levels of at least 37 genes listed in Table 1 for the GCB signature, the stromal-1 signature value is an average of the expression levels of at least 270 genes listed in Table 1 for the stromal-1 signature, and the stromal-2 signature value is an average of the expression levels of at least 68 genes listed in Table 1 for the stromal-2 signature value.
- The method of any one of claims 2-8, wherein the GCB signature value is an average of the expression levels of all of the genes listed in Table 1 for the GCB signature, the stromal-1 signature value is an average of the expression levels of all of the genes listed in Table 1 for the stromal-1 signature, and the stromal-2 signature value is an average of the expression levels of all of the genes listed in Table 1 for the stromal-2 signature value.
Applications Claiming Priority (2)
| Application Number | Priority Date | Filing Date | Title |
|---|---|---|---|
| US5967808P | 2008-06-06 | 2008-06-06 | |
| PCT/US2009/046421 WO2009149359A2 (en) | 2008-06-06 | 2009-06-05 | Survival predictor for diffuse large b cell lymphoma |
Related Child Applications (1)
| Application Number | Title | Priority Date | Filing Date |
|---|---|---|---|
| EP15180558 Division-Into | 2015-08-11 |
Publications (3)
| Publication Number | Publication Date |
|---|---|
| EP2294420A2 EP2294420A2 (en) | 2011-03-16 |
| EP2294420B1 true EP2294420B1 (en) | 2015-08-12 |
| EP2294420B8 EP2294420B8 (en) | 2015-10-21 |
Family
ID=41165407
Family Applications (1)
| Application Number | Title | Priority Date | Filing Date |
|---|---|---|---|
| EP09759517.7A Active EP2294420B8 (en) | 2008-06-06 | 2009-06-05 | Survival predictor for diffuse large B cell lymphoma |
Country Status (5)
| Country | Link |
|---|---|
| US (3) | US20110195064A1 (en) |
| EP (1) | EP2294420B8 (en) |
| CA (1) | CA2726811C (en) |
| ES (1) | ES2552937T3 (en) |
| WO (1) | WO2009149359A2 (en) |
Families Citing this family (10)
| Publication number | Priority date | Publication date | Assignee | Title |
|---|---|---|---|---|
| SG10201604497UA (en) * | 2011-06-02 | 2016-07-28 | Almac Diagnostics Ltd | Molecular Diagnostic Test For Cancer |
| US20140095193A1 (en) * | 2012-10-01 | 2014-04-03 | Health Diagnostic Laboratory, Inc. | System and method for automatically generating a historical health trend graph for a patient |
| CA2893033A1 (en) | 2012-12-03 | 2014-06-12 | Almac Diagnostics Limited | Molecular diagnostic test for cancer |
| EP3066215B1 (en) * | 2013-11-06 | 2019-04-24 | The United States of America, represented by the Secretary, Department of Health and Human Services | Method for subtyping lymphoma types by means of expression profiling |
| CA2930305A1 (en) | 2013-11-19 | 2015-05-28 | Brandeis University | Multiplex target detection assay |
| GB201409479D0 (en) | 2014-05-28 | 2014-07-09 | Almac Diagnostics Ltd | Molecular diagnostic test for cancer |
| US9646258B2 (en) * | 2015-09-24 | 2017-05-09 | Sas Institute Inc. | Techniques to provide real-time processing enhancements and modeling for data anomaly detection pertaining to medical events using decision trees |
| CA3021569A1 (en) | 2016-04-20 | 2017-10-26 | The United States Of America, As Represented By The Secretary, Department Of Health And Human Services | Evaluation of mantle cell lymphoma and methods related thereto |
| JP7357921B2 (en) * | 2017-09-29 | 2023-10-10 | 国立大学法人九州大学 | Method and kit for predicting therapeutic effect on chemotherapy in patients with diffuse large B-cell lymphoma |
| CN114045339B (en) * | 2021-11-05 | 2022-06-28 | 山东第一医科大学附属省立医院(山东省立医院) | Application of ferroptosis-related genes in prognostic assessment of diffuse large B-cell lymphoma |
Family Cites Families (42)
| Publication number | Priority date | Publication date | Assignee | Title |
|---|---|---|---|---|
| US5424186A (en) | 1989-06-07 | 1995-06-13 | Affymax Technologies N.V. | Very large scale immobilized polymer synthesis |
| US5242974A (en) | 1991-11-22 | 1993-09-07 | Affymax Technologies N.V. | Polymer reversal on solid surfaces |
| US5143854A (en) * | 1989-06-07 | 1992-09-01 | Affymax Technologies N.V. | Large scale photolithographic solid phase synthesis of polypeptides and receptor binding screening thereof |
| US6040138A (en) * | 1995-09-15 | 2000-03-21 | Affymetrix, Inc. | Expression monitoring by hybridization to high density oligonucleotide arrays |
| US5527681A (en) | 1989-06-07 | 1996-06-18 | Affymax Technologies N.V. | Immobilized molecular synthesis of systematically substituted compounds |
| US5800992A (en) | 1989-06-07 | 1998-09-01 | Fodor; Stephen P.A. | Method of detecting nucleic acids |
| US5744101A (en) * | 1989-06-07 | 1998-04-28 | Affymax Technologies N.V. | Photolabile nucleoside protecting groups |
| US5252743A (en) | 1989-11-13 | 1993-10-12 | Affymax Technologies N.V. | Spatially-addressable immobilization of anti-ligands on surfaces |
| WO1992010588A1 (en) | 1990-12-06 | 1992-06-25 | Affymax Technologies N.V. | Sequencing by hybridization of a target nucleic acid to a matrix of defined oligonucleotides |
| DK0604552T3 (en) | 1991-09-18 | 1997-08-04 | Affymax Tech Nv | Process for the synthesis of different assemblies of oligomers |
| US5384261A (en) | 1991-11-22 | 1995-01-24 | Affymax Technologies N.V. | Very large scale immobilized polymer synthesis using mechanically directed flow paths |
| US5324633A (en) | 1991-11-22 | 1994-06-28 | Affymax Technologies N.V. | Method and apparatus for measuring binding affinity |
| US5677195A (en) | 1991-11-22 | 1997-10-14 | Affymax Technologies N.V. | Combinatorial strategies for polymer synthesis |
| US5550215A (en) | 1991-11-22 | 1996-08-27 | Holmes; Christopher P. | Polymer reversal on solid surfaces |
| US5491074A (en) | 1993-04-01 | 1996-02-13 | Affymax Technologies Nv | Association peptides |
| US5858659A (en) | 1995-11-29 | 1999-01-12 | Affymetrix, Inc. | Polymorphism detection |
| US5837832A (en) | 1993-06-25 | 1998-11-17 | Affymetrix, Inc. | Arrays of nucleic acid probes on biological chips |
| US6090555A (en) | 1997-12-11 | 2000-07-18 | Affymetrix, Inc. | Scanned image alignment systems and methods |
| US5631734A (en) | 1994-02-10 | 1997-05-20 | Affymetrix, Inc. | Method and apparatus for detection of fluorescently labeled materials |
| US5578832A (en) | 1994-09-02 | 1996-11-26 | Affymetrix, Inc. | Method and apparatus for imaging a sample on a device |
| WO1995030774A1 (en) | 1994-05-05 | 1995-11-16 | Beckman Instruments, Inc. | Oligonucleotide repeat arrays |
| US5571639A (en) | 1994-05-24 | 1996-11-05 | Affymax Technologies N.V. | Computer-aided engineering system for design of sequence arrays and lithographic masks |
| US5795716A (en) | 1994-10-21 | 1998-08-18 | Chee; Mark S. | Computer-aided visualization and analysis system for sequence evaluation |
| US5599695A (en) | 1995-02-27 | 1997-02-04 | Affymetrix, Inc. | Printing molecular library arrays using deprotection agents solely in the vapor phase |
| US5624711A (en) | 1995-04-27 | 1997-04-29 | Affymax Technologies, N.V. | Derivatization of solid supports and methods for oligomer synthesis |
| US5856174A (en) | 1995-06-29 | 1999-01-05 | Affymetrix, Inc. | Integrated nucleic acid diagnostic device |
| US5968740A (en) | 1995-07-24 | 1999-10-19 | Affymetrix, Inc. | Method of Identifying a Base in a Nucleic Acid |
| JP2000512744A (en) | 1996-05-16 | 2000-09-26 | アフィメトリックス,インコーポレイテッド | System and method for detecting label material |
| AU1287799A (en) | 1997-10-31 | 1999-05-24 | Affymetrix, Inc. | Expression profiles in adult and fetal organs |
| US5936324A (en) | 1998-03-30 | 1999-08-10 | Genetic Microsystems Inc. | Moving magnet scanner |
| US6020198A (en) * | 1998-09-25 | 2000-02-01 | Isis Pharmaceuticals Inc. | Antisense modulation of RIP-1 expression |
| JP2004509629A (en) * | 2000-09-19 | 2004-04-02 | ホワイトヘッド インスチチュート フォアー バイオメディカル リサーチ | Gene markers for tumors |
| US20030194701A1 (en) * | 2000-11-20 | 2003-10-16 | Golub Todd R. | Diffuse large cell lymphoma diagnosis and outcome prediction by expression analysis |
| US7622260B2 (en) * | 2001-09-05 | 2009-11-24 | The Brigham And Women's Hospital, Inc. | Diagnostic and prognostic tests |
| WO2003021229A2 (en) | 2001-09-05 | 2003-03-13 | The Brigham And Women's Hospital, Inc. | Diagnostic and prognostic tests |
| MXPA04002653A (en) | 2001-09-21 | 2004-07-08 | Boryung Pharm | Method for preparing pyrimidinone compound and pharmaceutically acceptable salts thereof. |
| EP1664762A4 (en) * | 2003-09-03 | 2008-08-13 | Us Gov Health & Human Serv | METHODS OF IDENTIFICATION, DIAGNOSIS AND PREDICTION FOR LYMPHOMES SURVIVAL |
| US8131475B2 (en) | 2003-09-03 | 2012-03-06 | The United States Of America As Represented By The Secretary, Department Of Health And Human Services | Methods for identifying, diagnosing, and predicting survival of lymphomas |
| US20080051379A1 (en) * | 2004-12-01 | 2008-02-28 | Trustees Of Boston University | Compositions and Methods for the Treatment of Peripheral B-Cell Neoplasms |
| US8445198B2 (en) * | 2005-12-01 | 2013-05-21 | Medical Prognosis Institute | Methods, kits and devices for identifying biomarkers of treatment response and use thereof to predict treatment efficacy |
| US20090280493A1 (en) * | 2006-09-08 | 2009-11-12 | Siemens Healthcare Diagnostics Inc. | Methods and Compositions for the Prediction of Response to Trastuzumab Containing Chemotherapy Regimen in Malignant Neoplasia |
| JP5401314B2 (en) * | 2006-09-08 | 2014-01-29 | メディミューン,エルエルシー | Humanized anti-CD19 antibodies and their use in the treatment of cancer, transplantation and autoimmune diseases |
-
2009
- 2009-06-05 CA CA2726811A patent/CA2726811C/en active Active
- 2009-06-05 EP EP09759517.7A patent/EP2294420B8/en active Active
- 2009-06-05 WO PCT/US2009/046421 patent/WO2009149359A2/en not_active Ceased
- 2009-06-05 ES ES09759517.7T patent/ES2552937T3/en active Active
- 2009-06-05 US US12/996,489 patent/US20110195064A1/en not_active Abandoned
-
2014
- 2014-11-13 US US14/540,302 patent/US9970059B2/en active Active
-
2018
- 2018-04-27 US US15/965,510 patent/US11028444B2/en active Active
Also Published As
| Publication number | Publication date |
|---|---|
| US20150132297A1 (en) | 2015-05-14 |
| US20180245165A1 (en) | 2018-08-30 |
| US9970059B2 (en) | 2018-05-15 |
| EP2294420A2 (en) | 2011-03-16 |
| US20110195064A1 (en) | 2011-08-11 |
| CA2726811A1 (en) | 2009-12-10 |
| US11028444B2 (en) | 2021-06-08 |
| WO2009149359A8 (en) | 2011-07-14 |
| CA2726811C (en) | 2019-11-26 |
| WO2009149359A3 (en) | 2010-02-25 |
| ES2552937T3 (en) | 2015-12-03 |
| WO2009149359A2 (en) | 2009-12-10 |
| EP2294420B8 (en) | 2015-10-21 |
Similar Documents
| Publication | Publication Date | Title |
|---|---|---|
| US11028444B2 (en) | Survival predictor for diffuse large B cell lymphoma | |
| JP6670774B2 (en) | Urine marker for detecting bladder cancer | |
| Badea et al. | Combined gene expression analysis of whole-tissue and microdissected pancreatic ductal adenocarcinoma identifies genes specifically overexpressed in tumor epithelia-the authors reported a combined gene expression analysis of whole-tissue and microdissected pancreatic ductal adenocarcinoma identifies genes specifically overexpressed in tumor epithelia | |
| US10329624B2 (en) | Grading of breast cancer | |
| US8450057B2 (en) | Diagnostic tests using gene expression ratios | |
| US20120196761A1 (en) | Diagnosis of in situ and invasive breast cancer | |
| PT2138848E (en) | METHOD OF DIAGNOSIS AND / OR PROGNOSIS OF BLADDER CANCER | |
| CA2699434A1 (en) | Stroma derived predictor of breast cancer | |
| US12195805B2 (en) | Methods for subtyping of bladder cancer | |
| US20120201750A1 (en) | Serum biomarkers for melanoma metastasis | |
| US10233502B2 (en) | Compositions for and methods of detecting, diagnosing, and prognosing thymic cancer | |
| US20090005258A1 (en) | Diagnosis of Metastases in Hnscc Tumours | |
| KR101182974B1 (en) | Pellino 1 as a marker for the diagnosis or prognosis of lymphoma | |
| KR102163550B1 (en) | Urine markers for detection of bladder cancer | |
| WO2015105191A1 (en) | Method for assessing lymphadenopathy lesions | |
| KR102959115B1 (en) | Biomarkers for predicting therapeutic response to immunotherapy based on spatial transcriptome analysis and uses thereof | |
| US20250354215A1 (en) | Method for detecting high-risk nasopharyngeal cancer | |
| CN119570928A (en) | LncRNA combination for colorectal cancer diagnosis and prognosis prediction | |
| HK1213297A1 (en) | Compositions and methods for detecting and determining a prognosis for prostate cancer |
Legal Events
| Date | Code | Title | Description |
|---|---|---|---|
| PUAI | Public reference made under article 153(3) epc to a published international application that has entered the european phase |
Free format text: ORIGINAL CODE: 0009012 |
|
| 17P | Request for examination filed |
Effective date: 20101206 |
|
| AK | Designated contracting states |
Kind code of ref document: A2 Designated state(s): AT BE BG CH CY CZ DE DK EE ES FI FR GB GR HR HU IE IS IT LI LT LU LV MC MK MT NL NO PL PT RO SE SI SK TR |
|
| AX | Request for extension of the european patent |
Extension state: AL BA RS |
|
| RAP1 | Party data changed (applicant data changed or rights of an application transferred) |
Owner name: UNIVERSITAT DE BARCELONA HOSPITAL CLINIC Owner name: HOSPITAL CLINIC Owner name: UNIVERSITY OF ROCHESTER Owner name: OSLO UNIVERSITY HOSPITAL HF Owner name: OREGON HEALTH&SCIENCE UNIVERSITY Owner name: ARIZONA BOARD OF REGENTS ON BEHALF OF THE UNIVERSI Owner name: QUEEN MARY AND WESTFIELD COLLEGE, UNIVERSITY OF LO Owner name: BOARD OF REGENTS OF THE UNIVERSITY OF NEBRASKA Owner name: THE UNITED STATES OF AMERICA, AS REPRESENTED BY TH Owner name: BRITISH COLUMBIA CANCER AGENCY BRANCH Owner name: JULIUS-MAXIMILIANS-UNIVERSITY OF WUERZBURG |
|
| RIN1 | Information on inventor provided before grant (corrected) |
Inventor name: RIMSZA, LISA Inventor name: JARES, PEDRO Inventor name: GASCOYNE, RANDY D. Inventor name: LENZ, GEORGE Inventor name: ROSENWALD, ANDREAS Inventor name: DELABIE, JAN Inventor name: OTT, GERMAN Inventor name: LOPEZ-GUILLERMO, ARMANDO Inventor name: KVALOY, STEIN Inventor name: WYNDHAM, WILSON H. Inventor name: WRIGHT, GEORGE Inventor name: JAFFE, ELAINE S. Inventor name: BRAZIEL, RITA M. Inventor name: MUELLER-HERMELINK, HANS-KONRAD Inventor name: FISHER, RICHARD I. Inventor name: STAUDT, LOUIS, M. Inventor name: DAVE, SANDEEP S. Inventor name: LISTER, ANDREW T. Inventor name: SMELAND, ERLEND B. Inventor name: GUERRI, ELIAS CAMPO Inventor name: HOLTE, HARALD Inventor name: CONNORS, JOSEPH M. Inventor name: WEISENBURGER, DENNIS |
|
| RIN1 | Information on inventor provided before grant (corrected) |
Inventor name: KVALOY, STEIN Inventor name: OTT, GERMAN Inventor name: ROSENWALD, ANDREAS Inventor name: WEISENBURGER, DENNIS Inventor name: LISTER, ANDREW T. Inventor name: GASCOYNE, RANDY D. Inventor name: STAUDT, LOUIS, M. Inventor name: SMELAND, ERLEND B. Inventor name: JAFFE, ELAINE S. Inventor name: BRAZIEL, RITA M. Inventor name: LOPEZ-GUILLERMO, ARMANDO Inventor name: MUELLER-HERMELINK, HANS-KONRAD Inventor name: CONNORS, JOSEPH M. Inventor name: RIMSZA, LISA Inventor name: JARES, PEDRO Inventor name: WYNDHAM, H.WILSON. Inventor name: FISHER, RICHARD I. Inventor name: HOLTE, HARALD Inventor name: WRIGHT, GEORGE Inventor name: DAVE, SANDEEP S. Inventor name: LENZ, GEORG Inventor name: GUERRI, ELIAS CAMPO Inventor name: DELABIE, JAN |
|
| DAX | Request for extension of the european patent (deleted) | ||
| RIN1 | Information on inventor provided before grant (corrected) |
Inventor name: JAFFE, ELAINE S. Inventor name: STAUDT, LOUIS, M. Inventor name: CONNORS, JOSEPH M. Inventor name: WEISENBURGER, DENNIS Inventor name: BRAZIEL, RITA M. Inventor name: JARES, PEDRO Inventor name: LISTER, ANDREW T. Inventor name: WRIGHT, GEORGE Inventor name: DAVE, SANDEEP S. Inventor name: FISHER, RICHARD I. Inventor name: RIMSZA, LISA Inventor name: LOPEZ-GUILLERMO, ARMANDO Inventor name: MUELLER-HERMELINK, HANS-KONRAD Inventor name: DELABIE, JAN Inventor name: WYNDHAM, H.WILSON. Inventor name: KVALOY, STEIN Inventor name: HOLTE, HARALD Inventor name: GUERRI, ELIAS CAMPO Inventor name: GASCOYNE, RANDY D. Inventor name: SMELAND, ERLEND B. Inventor name: LENZ, GEORG Inventor name: WING, C CHAN Inventor name: ROSENWALD, ANDREAS Inventor name: OTT, GERMAN |
|
| 17Q | First examination report despatched |
Effective date: 20120413 |
|
| RAP1 | Party data changed (applicant data changed or rights of an application transferred) |
Owner name: BOARD OF REGENTS OF THE UNIVERSITY OF NEBRASKA Owner name: THE UNITED STATES OF AMERICA, AS REPRESENTED BY TH Owner name: ARIZONA BOARD OF REGENTS ON BEHALF OF THE UNIVERSI Owner name: BRITISH COLUMBIA CANCER AGENCY BRANCH Owner name: HOSPITAL CLINIC Owner name: QUEEN MARY AND WESTFIELD COLLEGE, UNIVERSITY OF LO Owner name: JULIUS-MAXIMILIANS-UNIVERSITY OF WUERZBURG Owner name: OREGON HEALTH & SCIENCE UNIVERSITY Owner name: UNIVERSITAT DE BARCELONA HOSPITAL CLINIC Owner name: UNIVERSITY OF ROCHESTER Owner name: OSLO UNIVERSITY HOSPITAL HF |
|
| GRAP | Despatch of communication of intention to grant a patent |
Free format text: ORIGINAL CODE: EPIDOSNIGR1 |
|
| INTG | Intention to grant announced |
Effective date: 20141218 |
|
| GRAS | Grant fee paid |
Free format text: ORIGINAL CODE: EPIDOSNIGR3 |
|
| GRAA | (expected) grant |
Free format text: ORIGINAL CODE: 0009210 |
|
| AK | Designated contracting states |
Kind code of ref document: B1 Designated state(s): AT BE BG CH CY CZ DE DK EE ES FI FR GB GR HR HU IE IS IT LI LT LU LV MC MK MT NL NO PL PT RO SE SI SK TR |
|
| REG | Reference to a national code |
Ref country code: GB Ref legal event code: FG4D |
|
| REG | Reference to a national code |
Ref country code: CH Ref legal event code: EP |
|
| REG | Reference to a national code |
Ref country code: AT Ref legal event code: REF Ref document number: 742622 Country of ref document: AT Kind code of ref document: T Effective date: 20150815 |
|
| REG | Reference to a national code |
Ref country code: IE Ref legal event code: FG4D |
|
| REG | Reference to a national code |
Ref country code: DE Ref legal event code: R096 Ref document number: 602009032854 Country of ref document: DE |
|
| RAP2 | Party data changed (patent owner data changed or rights of a patent transferred) |
Owner name: BRITISH COLUMBIA CANCER AGENCY BRANCH Owner name: ARIZONA BOARD OF REGENTS ON BEHALF OF THE UNIVERSI Owner name: HOSPITAL CLINIC Owner name: QUEEN MARY AND WESTFIELD COLLEGE, UNIVERSITY OF LO Owner name: UNIVERSITY OF ROCHESTER Owner name: THE UNITED STATES OF AMERICA, AS REPRESENTED BY TH Owner name: UNIVERSITAT DE BARCELONA HOSPITAL CLINIC Owner name: JULIUS-MAXIMILIANS-UNIVERSITY OF WUERZBURG Owner name: BOARD OF REGENTS OF THE UNIVERSITY OF NEBRASKA Owner name: OSLO UNIVERSITY HOSPITAL HF Owner name: OREGON HEALTH & SCIENCE UNIVERSITY |
|
| REG | Reference to a national code |
Ref country code: ES Ref legal event code: FG2A Ref document number: 2552937 Country of ref document: ES Kind code of ref document: T3 Effective date: 20151203 |
|
| REG | Reference to a national code |
Ref country code: LT Ref legal event code: MG4D |
|
| REG | Reference to a national code |
Ref country code: AT Ref legal event code: MK05 Ref document number: 742622 Country of ref document: AT Kind code of ref document: T Effective date: 20150812 |
|
| REG | Reference to a national code |
Ref country code: NL Ref legal event code: MP Effective date: 20150812 |
|
| PG25 | Lapsed in a contracting state [announced via postgrant information from national office to epo] |
Ref country code: FI Free format text: LAPSE BECAUSE OF FAILURE TO SUBMIT A TRANSLATION OF THE DESCRIPTION OR TO PAY THE FEE WITHIN THE PRESCRIBED TIME-LIMIT Effective date: 20150812 Ref country code: LV Free format text: LAPSE BECAUSE OF FAILURE TO SUBMIT A TRANSLATION OF THE DESCRIPTION OR TO PAY THE FEE WITHIN THE PRESCRIBED TIME-LIMIT Effective date: 20150812 Ref country code: GR Free format text: LAPSE BECAUSE OF FAILURE TO SUBMIT A TRANSLATION OF THE DESCRIPTION OR TO PAY THE FEE WITHIN THE PRESCRIBED TIME-LIMIT Effective date: 20151113 Ref country code: LT Free format text: LAPSE BECAUSE OF FAILURE TO SUBMIT A TRANSLATION OF THE DESCRIPTION OR TO PAY THE FEE WITHIN THE PRESCRIBED TIME-LIMIT Effective date: 20150812 Ref country code: NO Free format text: LAPSE BECAUSE OF FAILURE TO SUBMIT A TRANSLATION OF THE DESCRIPTION OR TO PAY THE FEE WITHIN THE PRESCRIBED TIME-LIMIT Effective date: 20151112 |
|
| PG25 | Lapsed in a contracting state [announced via postgrant information from national office to epo] |
Ref country code: SE Free format text: LAPSE BECAUSE OF FAILURE TO SUBMIT A TRANSLATION OF THE DESCRIPTION OR TO PAY THE FEE WITHIN THE PRESCRIBED TIME-LIMIT Effective date: 20150812 Ref country code: PL Free format text: LAPSE BECAUSE OF FAILURE TO SUBMIT A TRANSLATION OF THE DESCRIPTION OR TO PAY THE FEE WITHIN THE PRESCRIBED TIME-LIMIT Effective date: 20150812 Ref country code: IS Free format text: LAPSE BECAUSE OF FAILURE TO SUBMIT A TRANSLATION OF THE DESCRIPTION OR TO PAY THE FEE WITHIN THE PRESCRIBED TIME-LIMIT Effective date: 20151212 Ref country code: HR Free format text: LAPSE BECAUSE OF FAILURE TO SUBMIT A TRANSLATION OF THE DESCRIPTION OR TO PAY THE FEE WITHIN THE PRESCRIBED TIME-LIMIT Effective date: 20150812 Ref country code: AT Free format text: LAPSE BECAUSE OF FAILURE TO SUBMIT A TRANSLATION OF THE DESCRIPTION OR TO PAY THE FEE WITHIN THE PRESCRIBED TIME-LIMIT Effective date: 20150812 Ref country code: PT Free format text: LAPSE BECAUSE OF FAILURE TO SUBMIT A TRANSLATION OF THE DESCRIPTION OR TO PAY THE FEE WITHIN THE PRESCRIBED TIME-LIMIT Effective date: 20151214 |
|
| PG25 | Lapsed in a contracting state [announced via postgrant information from national office to epo] |
Ref country code: NL Free format text: LAPSE BECAUSE OF FAILURE TO SUBMIT A TRANSLATION OF THE DESCRIPTION OR TO PAY THE FEE WITHIN THE PRESCRIBED TIME-LIMIT Effective date: 20150812 |
|
| PG25 | Lapsed in a contracting state [announced via postgrant information from national office to epo] |
Ref country code: EE Free format text: LAPSE BECAUSE OF FAILURE TO SUBMIT A TRANSLATION OF THE DESCRIPTION OR TO PAY THE FEE WITHIN THE PRESCRIBED TIME-LIMIT Effective date: 20150812 Ref country code: SK Free format text: LAPSE BECAUSE OF FAILURE TO SUBMIT A TRANSLATION OF THE DESCRIPTION OR TO PAY THE FEE WITHIN THE PRESCRIBED TIME-LIMIT Effective date: 20150812 Ref country code: DK Free format text: LAPSE BECAUSE OF FAILURE TO SUBMIT A TRANSLATION OF THE DESCRIPTION OR TO PAY THE FEE WITHIN THE PRESCRIBED TIME-LIMIT Effective date: 20150812 Ref country code: CZ Free format text: LAPSE BECAUSE OF FAILURE TO SUBMIT A TRANSLATION OF THE DESCRIPTION OR TO PAY THE FEE WITHIN THE PRESCRIBED TIME-LIMIT Effective date: 20150812 |
|
| REG | Reference to a national code |
Ref country code: DE Ref legal event code: R097 Ref document number: 602009032854 Country of ref document: DE |
|
| PG25 | Lapsed in a contracting state [announced via postgrant information from national office to epo] |
Ref country code: RO Free format text: LAPSE BECAUSE OF FAILURE TO SUBMIT A TRANSLATION OF THE DESCRIPTION OR TO PAY THE FEE WITHIN THE PRESCRIBED TIME-LIMIT Effective date: 20150812 |
|
| PLBE | No opposition filed within time limit |
Free format text: ORIGINAL CODE: 0009261 |
|
| STAA | Information on the status of an ep patent application or granted ep patent |
Free format text: STATUS: NO OPPOSITION FILED WITHIN TIME LIMIT |
|
| REG | Reference to a national code |
Ref country code: FR Ref legal event code: PLFP Year of fee payment: 8 |
|
| 26N | No opposition filed |
Effective date: 20160513 |
|
| PG25 | Lapsed in a contracting state [announced via postgrant information from national office to epo] |
Ref country code: SI Free format text: LAPSE BECAUSE OF FAILURE TO SUBMIT A TRANSLATION OF THE DESCRIPTION OR TO PAY THE FEE WITHIN THE PRESCRIBED TIME-LIMIT Effective date: 20150812 |
|
| PG25 | Lapsed in a contracting state [announced via postgrant information from national office to epo] |
Ref country code: BE Free format text: LAPSE BECAUSE OF FAILURE TO SUBMIT A TRANSLATION OF THE DESCRIPTION OR TO PAY THE FEE WITHIN THE PRESCRIBED TIME-LIMIT Effective date: 20150812 |
|
| PG25 | Lapsed in a contracting state [announced via postgrant information from national office to epo] |
Ref country code: MC Free format text: LAPSE BECAUSE OF FAILURE TO SUBMIT A TRANSLATION OF THE DESCRIPTION OR TO PAY THE FEE WITHIN THE PRESCRIBED TIME-LIMIT Effective date: 20150812 |
|
| REG | Reference to a national code |
Ref country code: CH Ref legal event code: PL |
|
| REG | Reference to a national code |
Ref country code: IE Ref legal event code: MM4A |
|
| PG25 | Lapsed in a contracting state [announced via postgrant information from national office to epo] |
Ref country code: LI Free format text: LAPSE BECAUSE OF NON-PAYMENT OF DUE FEES Effective date: 20160630 Ref country code: CH Free format text: LAPSE BECAUSE OF NON-PAYMENT OF DUE FEES Effective date: 20160630 |
|
| PG25 | Lapsed in a contracting state [announced via postgrant information from national office to epo] |
Ref country code: IE Free format text: LAPSE BECAUSE OF NON-PAYMENT OF DUE FEES Effective date: 20160605 |
|
| REG | Reference to a national code |
Ref country code: FR Ref legal event code: PLFP Year of fee payment: 9 |
|
| PG25 | Lapsed in a contracting state [announced via postgrant information from national office to epo] |
Ref country code: HU Free format text: LAPSE BECAUSE OF FAILURE TO SUBMIT A TRANSLATION OF THE DESCRIPTION OR TO PAY THE FEE WITHIN THE PRESCRIBED TIME-LIMIT; INVALID AB INITIO Effective date: 20090605 Ref country code: CY Free format text: LAPSE BECAUSE OF FAILURE TO SUBMIT A TRANSLATION OF THE DESCRIPTION OR TO PAY THE FEE WITHIN THE PRESCRIBED TIME-LIMIT Effective date: 20150812 |
|
| REG | Reference to a national code |
Ref country code: FR Ref legal event code: PLFP Year of fee payment: 10 |
|
| PG25 | Lapsed in a contracting state [announced via postgrant information from national office to epo] |
Ref country code: LU Free format text: LAPSE BECAUSE OF NON-PAYMENT OF DUE FEES Effective date: 20160605 Ref country code: MT Free format text: LAPSE BECAUSE OF NON-PAYMENT OF DUE FEES Effective date: 20160630 Ref country code: MK Free format text: LAPSE BECAUSE OF FAILURE TO SUBMIT A TRANSLATION OF THE DESCRIPTION OR TO PAY THE FEE WITHIN THE PRESCRIBED TIME-LIMIT Effective date: 20150812 Ref country code: TR Free format text: LAPSE BECAUSE OF FAILURE TO SUBMIT A TRANSLATION OF THE DESCRIPTION OR TO PAY THE FEE WITHIN THE PRESCRIBED TIME-LIMIT Effective date: 20150812 |
|
| PG25 | Lapsed in a contracting state [announced via postgrant information from national office to epo] |
Ref country code: BG Free format text: LAPSE BECAUSE OF FAILURE TO SUBMIT A TRANSLATION OF THE DESCRIPTION OR TO PAY THE FEE WITHIN THE PRESCRIBED TIME-LIMIT Effective date: 20150812 |
|
| P01 | Opt-out of the competence of the unified patent court (upc) registered |
Effective date: 20230523 |
|
| PGFP | Annual fee paid to national office [announced via postgrant information from national office to epo] |
Ref country code: DE Payment date: 20250627 Year of fee payment: 17 |
|
| PGFP | Annual fee paid to national office [announced via postgrant information from national office to epo] |
Ref country code: GB Payment date: 20250617 Year of fee payment: 17 |
|
| PGFP | Annual fee paid to national office [announced via postgrant information from national office to epo] |
Ref country code: FR Payment date: 20250623 Year of fee payment: 17 |
|
| PGFP | Annual fee paid to national office [announced via postgrant information from national office to epo] |
Ref country code: ES Payment date: 20250701 Year of fee payment: 17 |
|
| PGFP | Annual fee paid to national office [announced via postgrant information from national office to epo] |
Ref country code: IT Payment date: 20250619 Year of fee payment: 17 |
|
| REG | Reference to a national code |
Ref country code: DE Ref legal event code: R079 Ref document number: 602009032854 Country of ref document: DE Free format text: PREVIOUS MAIN CLASS: G01N0033574000 Ipc: G01N0033575000 |