EP2281062B1 - Geometric patterns and lipid bilayers for dna molecule organization - Google Patents
Geometric patterns and lipid bilayers for dna molecule organization Download PDFInfo
- Publication number
- EP2281062B1 EP2281062B1 EP09734195.2A EP09734195A EP2281062B1 EP 2281062 B1 EP2281062 B1 EP 2281062B1 EP 09734195 A EP09734195 A EP 09734195A EP 2281062 B1 EP2281062 B1 EP 2281062B1
- Authority
- EP
- European Patent Office
- Prior art keywords
- dna
- molecules
- barrier
- nucleic acid
- barriers
- Prior art date
- Legal status (The legal status is an assumption and is not a legal conclusion. Google has not performed a legal analysis and makes no representation as to the accuracy of the status listed.)
- Not-in-force
Links
Images


Classifications
-
- C—CHEMISTRY; METALLURGY
- C12—BIOCHEMISTRY; BEER; SPIRITS; WINE; VINEGAR; MICROBIOLOGY; ENZYMOLOGY; MUTATION OR GENETIC ENGINEERING
- C12Q—MEASURING OR TESTING PROCESSES INVOLVING ENZYMES, NUCLEIC ACIDS OR MICROORGANISMS; COMPOSITIONS OR TEST PAPERS THEREFOR; PROCESSES OF PREPARING SUCH COMPOSITIONS; CONDITION-RESPONSIVE CONTROL IN MICROBIOLOGICAL OR ENZYMOLOGICAL PROCESSES
- C12Q1/00—Measuring or testing processes involving enzymes, nucleic acids or microorganisms; Compositions therefor; Processes of preparing such compositions
- C12Q1/68—Measuring or testing processes involving enzymes, nucleic acids or microorganisms; Compositions therefor; Processes of preparing such compositions involving nucleic acids
- C12Q1/6813—Hybridisation assays
- C12Q1/6834—Enzymatic or biochemical coupling of nucleic acids to a solid phase
- C12Q1/6837—Enzymatic or biochemical coupling of nucleic acids to a solid phase using probe arrays or probe chips
-
- B—PERFORMING OPERATIONS; TRANSPORTING
- B01—PHYSICAL OR CHEMICAL PROCESSES OR APPARATUS IN GENERAL
- B01J—CHEMICAL OR PHYSICAL PROCESSES, e.g. CATALYSIS OR COLLOID CHEMISTRY; THEIR RELEVANT APPARATUS
- B01J19/00—Chemical, physical or physico-chemical processes in general; Their relevant apparatus
- B01J19/0046—Sequential or parallel reactions, e.g. for the synthesis of polypeptides or polynucleotides; Apparatus and devices for combinatorial chemistry or for making molecular arrays
-
- B—PERFORMING OPERATIONS; TRANSPORTING
- B01—PHYSICAL OR CHEMICAL PROCESSES OR APPARATUS IN GENERAL
- B01L—CHEMICAL OR PHYSICAL LABORATORY APPARATUS FOR GENERAL USE
- B01L3/00—Containers or dishes for laboratory use, e.g. laboratory glassware; Droppers
- B01L3/50—Containers for the purpose of retaining a material to be analysed, e.g. test tubes
- B01L3/502—Containers for the purpose of retaining a material to be analysed, e.g. test tubes with fluid transport, e.g. in multi-compartment structures
- B01L3/5027—Containers for the purpose of retaining a material to be analysed, e.g. test tubes with fluid transport, e.g. in multi-compartment structures by integrated microfluidic structures, i.e. dimensions of channels and chambers are such that surface tension forces are important, e.g. lab-on-a-chip
- B01L3/502761—Containers for the purpose of retaining a material to be analysed, e.g. test tubes with fluid transport, e.g. in multi-compartment structures by integrated microfluidic structures, i.e. dimensions of channels and chambers are such that surface tension forces are important, e.g. lab-on-a-chip specially adapted for handling suspended solids or molecules independently from the bulk fluid flow, e.g. for trapping or sorting beads, for physically stretching molecules
-
- C—CHEMISTRY; METALLURGY
- C12—BIOCHEMISTRY; BEER; SPIRITS; WINE; VINEGAR; MICROBIOLOGY; ENZYMOLOGY; MUTATION OR GENETIC ENGINEERING
- C12Q—MEASURING OR TESTING PROCESSES INVOLVING ENZYMES, NUCLEIC ACIDS OR MICROORGANISMS; COMPOSITIONS OR TEST PAPERS THEREFOR; PROCESSES OF PREPARING SUCH COMPOSITIONS; CONDITION-RESPONSIVE CONTROL IN MICROBIOLOGICAL OR ENZYMOLOGICAL PROCESSES
- C12Q1/00—Measuring or testing processes involving enzymes, nucleic acids or microorganisms; Compositions therefor; Processes of preparing such compositions
- C12Q1/68—Measuring or testing processes involving enzymes, nucleic acids or microorganisms; Compositions therefor; Processes of preparing such compositions involving nucleic acids
- C12Q1/6869—Methods for sequencing
- C12Q1/6874—Methods for sequencing involving nucleic acid arrays, e.g. sequencing by hybridisation
-
- B—PERFORMING OPERATIONS; TRANSPORTING
- B01—PHYSICAL OR CHEMICAL PROCESSES OR APPARATUS IN GENERAL
- B01J—CHEMICAL OR PHYSICAL PROCESSES, e.g. CATALYSIS OR COLLOID CHEMISTRY; THEIR RELEVANT APPARATUS
- B01J2219/00—Chemical, physical or physico-chemical processes in general; Their relevant apparatus
- B01J2219/00274—Sequential or parallel reactions; Apparatus and devices for combinatorial chemistry or for making arrays; Chemical library technology
- B01J2219/00277—Apparatus
- B01J2219/00279—Features relating to reactor vessels
- B01J2219/00306—Reactor vessels in a multiple arrangement
- B01J2219/00313—Reactor vessels in a multiple arrangement the reactor vessels being formed by arrays of wells in blocks
- B01J2219/00315—Microtiter plates
- B01J2219/00317—Microwell devices, i.e. having large numbers of wells
-
- B—PERFORMING OPERATIONS; TRANSPORTING
- B01—PHYSICAL OR CHEMICAL PROCESSES OR APPARATUS IN GENERAL
- B01J—CHEMICAL OR PHYSICAL PROCESSES, e.g. CATALYSIS OR COLLOID CHEMISTRY; THEIR RELEVANT APPARATUS
- B01J2219/00—Chemical, physical or physico-chemical processes in general; Their relevant apparatus
- B01J2219/00274—Sequential or parallel reactions; Apparatus and devices for combinatorial chemistry or for making arrays; Chemical library technology
- B01J2219/00277—Apparatus
- B01J2219/00497—Features relating to the solid phase supports
- B01J2219/00513—Essentially linear supports
-
- B—PERFORMING OPERATIONS; TRANSPORTING
- B01—PHYSICAL OR CHEMICAL PROCESSES OR APPARATUS IN GENERAL
- B01J—CHEMICAL OR PHYSICAL PROCESSES, e.g. CATALYSIS OR COLLOID CHEMISTRY; THEIR RELEVANT APPARATUS
- B01J2219/00—Chemical, physical or physico-chemical processes in general; Their relevant apparatus
- B01J2219/00274—Sequential or parallel reactions; Apparatus and devices for combinatorial chemistry or for making arrays; Chemical library technology
- B01J2219/00277—Apparatus
- B01J2219/00497—Features relating to the solid phase supports
- B01J2219/00527—Sheets
- B01J2219/00529—DNA chips
-
- B—PERFORMING OPERATIONS; TRANSPORTING
- B01—PHYSICAL OR CHEMICAL PROCESSES OR APPARATUS IN GENERAL
- B01J—CHEMICAL OR PHYSICAL PROCESSES, e.g. CATALYSIS OR COLLOID CHEMISTRY; THEIR RELEVANT APPARATUS
- B01J2219/00—Chemical, physical or physico-chemical processes in general; Their relevant apparatus
- B01J2219/00274—Sequential or parallel reactions; Apparatus and devices for combinatorial chemistry or for making arrays; Chemical library technology
- B01J2219/00583—Features relative to the processes being carried out
- B01J2219/00596—Solid-phase processes
-
- B—PERFORMING OPERATIONS; TRANSPORTING
- B01—PHYSICAL OR CHEMICAL PROCESSES OR APPARATUS IN GENERAL
- B01J—CHEMICAL OR PHYSICAL PROCESSES, e.g. CATALYSIS OR COLLOID CHEMISTRY; THEIR RELEVANT APPARATUS
- B01J2219/00—Chemical, physical or physico-chemical processes in general; Their relevant apparatus
- B01J2219/00274—Sequential or parallel reactions; Apparatus and devices for combinatorial chemistry or for making arrays; Chemical library technology
- B01J2219/00583—Features relative to the processes being carried out
- B01J2219/00603—Making arrays on substantially continuous surfaces
- B01J2219/00605—Making arrays on substantially continuous surfaces the compounds being directly bound or immobilised to solid supports
- B01J2219/00608—DNA chips
-
- B—PERFORMING OPERATIONS; TRANSPORTING
- B01—PHYSICAL OR CHEMICAL PROCESSES OR APPARATUS IN GENERAL
- B01J—CHEMICAL OR PHYSICAL PROCESSES, e.g. CATALYSIS OR COLLOID CHEMISTRY; THEIR RELEVANT APPARATUS
- B01J2219/00—Chemical, physical or physico-chemical processes in general; Their relevant apparatus
- B01J2219/00274—Sequential or parallel reactions; Apparatus and devices for combinatorial chemistry or for making arrays; Chemical library technology
- B01J2219/00583—Features relative to the processes being carried out
- B01J2219/00603—Making arrays on substantially continuous surfaces
- B01J2219/00605—Making arrays on substantially continuous surfaces the compounds being directly bound or immobilised to solid supports
- B01J2219/00614—Delimitation of the attachment areas
- B01J2219/00621—Delimitation of the attachment areas by physical means, e.g. trenches, raised areas
-
- B—PERFORMING OPERATIONS; TRANSPORTING
- B01—PHYSICAL OR CHEMICAL PROCESSES OR APPARATUS IN GENERAL
- B01J—CHEMICAL OR PHYSICAL PROCESSES, e.g. CATALYSIS OR COLLOID CHEMISTRY; THEIR RELEVANT APPARATUS
- B01J2219/00—Chemical, physical or physico-chemical processes in general; Their relevant apparatus
- B01J2219/00274—Sequential or parallel reactions; Apparatus and devices for combinatorial chemistry or for making arrays; Chemical library technology
- B01J2219/00583—Features relative to the processes being carried out
- B01J2219/00603—Making arrays on substantially continuous surfaces
- B01J2219/00605—Making arrays on substantially continuous surfaces the compounds being directly bound or immobilised to solid supports
- B01J2219/00632—Introduction of reactive groups to the surface
- B01J2219/00637—Introduction of reactive groups to the surface by coating it with another layer
-
- B—PERFORMING OPERATIONS; TRANSPORTING
- B01—PHYSICAL OR CHEMICAL PROCESSES OR APPARATUS IN GENERAL
- B01J—CHEMICAL OR PHYSICAL PROCESSES, e.g. CATALYSIS OR COLLOID CHEMISTRY; THEIR RELEVANT APPARATUS
- B01J2219/00—Chemical, physical or physico-chemical processes in general; Their relevant apparatus
- B01J2219/00274—Sequential or parallel reactions; Apparatus and devices for combinatorial chemistry or for making arrays; Chemical library technology
- B01J2219/0068—Means for controlling the apparatus of the process
- B01J2219/00702—Processes involving means for analysing and characterising the products
-
- B—PERFORMING OPERATIONS; TRANSPORTING
- B01—PHYSICAL OR CHEMICAL PROCESSES OR APPARATUS IN GENERAL
- B01J—CHEMICAL OR PHYSICAL PROCESSES, e.g. CATALYSIS OR COLLOID CHEMISTRY; THEIR RELEVANT APPARATUS
- B01J2219/00—Chemical, physical or physico-chemical processes in general; Their relevant apparatus
- B01J2219/00274—Sequential or parallel reactions; Apparatus and devices for combinatorial chemistry or for making arrays; Chemical library technology
- B01J2219/00718—Type of compounds synthesised
- B01J2219/0072—Organic compounds
- B01J2219/00722—Nucleotides
-
- B—PERFORMING OPERATIONS; TRANSPORTING
- B01—PHYSICAL OR CHEMICAL PROCESSES OR APPARATUS IN GENERAL
- B01J—CHEMICAL OR PHYSICAL PROCESSES, e.g. CATALYSIS OR COLLOID CHEMISTRY; THEIR RELEVANT APPARATUS
- B01J2219/00—Chemical, physical or physico-chemical processes in general; Their relevant apparatus
- B01J2219/00274—Sequential or parallel reactions; Apparatus and devices for combinatorial chemistry or for making arrays; Chemical library technology
- B01J2219/00718—Type of compounds synthesised
- B01J2219/0072—Organic compounds
- B01J2219/00734—Lipids
-
- B—PERFORMING OPERATIONS; TRANSPORTING
- B01—PHYSICAL OR CHEMICAL PROCESSES OR APPARATUS IN GENERAL
- B01L—CHEMICAL OR PHYSICAL LABORATORY APPARATUS FOR GENERAL USE
- B01L2200/00—Solutions for specific problems relating to chemical or physical laboratory apparatus
- B01L2200/06—Fluid handling related problems
- B01L2200/0647—Handling flowable solids, e.g. microscopic beads, cells, particles
- B01L2200/0663—Stretching or orienting elongated molecules or particles
-
- B—PERFORMING OPERATIONS; TRANSPORTING
- B01—PHYSICAL OR CHEMICAL PROCESSES OR APPARATUS IN GENERAL
- B01L—CHEMICAL OR PHYSICAL LABORATORY APPARATUS FOR GENERAL USE
- B01L2400/00—Moving or stopping fluids
- B01L2400/04—Moving fluids with specific forces or mechanical means
- B01L2400/0403—Moving fluids with specific forces or mechanical means specific forces
- B01L2400/0415—Moving fluids with specific forces or mechanical means specific forces electrical forces, e.g. electrokinetic
- B01L2400/0421—Moving fluids with specific forces or mechanical means specific forces electrical forces, e.g. electrokinetic electrophoretic flow
-
- B—PERFORMING OPERATIONS; TRANSPORTING
- B01—PHYSICAL OR CHEMICAL PROCESSES OR APPARATUS IN GENERAL
- B01L—CHEMICAL OR PHYSICAL LABORATORY APPARATUS FOR GENERAL USE
- B01L2400/00—Moving or stopping fluids
- B01L2400/04—Moving fluids with specific forces or mechanical means
- B01L2400/0475—Moving fluids with specific forces or mechanical means specific mechanical means and fluid pressure
- B01L2400/0487—Moving fluids with specific forces or mechanical means specific mechanical means and fluid pressure fluid pressure, pneumatics
Definitions
- the invention is based, in part, on the discovery that nucleic acid molecules can be disposed on a substrate and positionally aligned to allow analysis of individual nucleic acid molecules.
- the invention features an array that includes a substrate and nucleic acid molecules attached to the substrate.
- the nucleic acid molecules can be attached to the substrate by means of a linkage, e.g., a linkage between cognate binding proteins, e.g., neutravidin and biotin, or an antibody and antigen (e.g., anti-digoxigenin antibody and digoxigenin); or a crosslinking linkage, e.g., disulfide linkage or coupling between primary amines using gluteraldehyde.
- the nucleic acid molecules are attached at one end.
- the nucleic acid molecules are attached at both ends.
- the nucleic acid molecule is reversibly attached to the lipid bilayer along its contour.
- the array further includes a coating material, e.g., lipids, e.g., a lipid layer, e.g., a lipid bilayer, deposited onto the substrate.
- lipids e.g., a lipid layer, e.g., a lipid bilayer
- the lipids are zwitterionic lipids.
- polyethylene glycol (PEG) is added to the lipid bilayer.
- PEG polyethylene glycol
- 1%, 2%, 3%, 4%, 5%, 6%, 7%, 8%, 9%, 10%, 12% (w/w) or more of PEG can be included in the lipid bilayer.
- the substrate can be, e.g., glass, fused silica (SiO 2 ) quartz, borosilicate glass, polydimethylsiloxane, polymerized Langmuir Blodgett film, functionalized glass, Si, Ge, GaAs, GaP, SiO 2 SiN 4 , modified silicon, or a polymer (e.g., (poly)tetrafluoroethylene, (poly)vinylidenedifluoride, polystyrene, or polycarbonate).
- the substrate is fused silica.
- the substrate can be, e.g., a disc, square, rectangle, sphere or circle.
- the substrate can be a suitable to be used in the methods described herein.
- the substrate is a slide used for fluorescent microscopy.
- the nucleic acid molecules can be, e.g., single stranded DNA, double stranded DNA, or RNA.
- the nucleic acid molecules can be about 10, 20, 30, 40, 50, 100, 150, 200, 500, 1000, 2000, 5000, 10000, 50000, 100000, 200000, or more nucleotides in length.
- the number of nucleic acid molecules that can be attached to the substrate can be determined by the size of the substrate and by the design of the array. In some embodiments, about 50, 100, 250, 500, 1000, 2000, 5000 or more nucleic acid molecules are attached to the substrate.
- the nucleic acid molecules can be coupled to a label, e.g., a fluorescent label, e.g., YOYO1, or other fluorescent label described herein, or to a quantum dot.
- a label e.g., a fluorescent label, e.g., YOYO1, or other fluorescent label described herein, or to a quantum dot.
- the invention features an array that includes a substrate, a lipid bilayer disposed on the substrate, and nucleic acid molecules attached to the lipid bilayer by a linkage.
- a polypeptide e.g., neutravidin
- a cognate polypeptide e.g., biotin
- the nucleic acid molecules are attached to the lipid bilayer by a linkage between the neutravidin and the biotin.
- the nucleic acid molecules are attached at one end. In some embodiments, the nucleic acid molecules are attached at both ends.
- the substrate further includes a diffusion barrier, e.g., a non-linear mechanical, chemical, or protein barrier, that prevents lipid diffusion.
- the diffusion barrier is a non-linear, geometric diffusion barrier, wherein the non-linear geometric barrier comprises a repetitive triangular wave producing a sawtooth pattern that repeats at nanometer-scale intervals, or a repetitive series of angles of varying degrees.
- the non-linear diffusion barrier can also comprise turns, bends, curves, or interruptions.
- the barrier is non-linear over its entire length.
- the barrier comprises at least one angle.
- the barrier comprises at least one angle less than about 180°.
- the barrier comprises at least one angle of varying degrees.
- the barrier comprises multiple angles of varying degrees.
- the diffusion barrier is a non-linear, nanoscale barrier.
- a non-linear, mechanical barrier can be, e.g., a rough scratch or etch on the substrate, for example, wherein the scratch or etch is not linear.
- Protein barriers include, e.g., fibronectin. Protein barriers can be deposited onto a substrate, e.g., a substrate described herein, in well-defined patterns. Protein barriers can have a thickness of, e.g., 2, 3, 4, 5, 6, 7, 8, 9, 10, 15, 20 or more ⁇ m thick.
- the barrier materials comprising a chemical barrier can comprise metals, such as chromium, aluminum, gold, titanium, platinum, osmium, or nickel.
- the barrier materials can comprise metal oxides, such as aluminum oxide, or titanium oxide.
- the solid support comprises a geometric barrier, wherein the barrier is non-linear and comprises a repetitive triangular wave according to claim 1.
- the barrier forms a nanowell by connecting vertices of the non-linear, geometric barrier according to claim 1, while in some embodiments, the nanowell comprises a nanopore for entry of nucleic acids.
- the non-linear, geometric barrier according to claim 1 controls the lateral displacement of the nucleic acid molecule(s).
- the non-linear, geometric barrier according to claim 1 can be generated by nanofabrication, for example, comprising electron-beam lithography or photolithographic techniques.
- nanofabrication techniques that can lay down thin, 100 nm barriers of a metal, such as chromium, can be used.
- the invention features an array that includes a substrate, a diffusion barrier described herein, a lipid bilayer disposed on the substrate, and nucleic acid molecules attached to the diffusion barrier by a linkage.
- the diffusion barrier is coupled to a protein, e.g., biotin.
- a cognate protein, e.g., neutravidin is then bound directly to the biotinylated diffusion barriers, and biotinylated nucleic acid molecules are attached to the diffusion barriers by binding to the cognate protein, e.g., neutravidin.
- the nucleic acid molecules are attached at one end. In some embodiments, the nucleic acid molecules are attached at both ends.
- the invention features a microfluidic flowcell, that includes an array according to claim 1.
- the flowcell can be configured to allow a fluid to interact with the lipid bilayer, e.g., to flow over the lipid bilayer.
- a substrate described herein further includes two openings, e.g., an inlet port and an outlet port.
- the flowcell includes the substrate, and a cover, e.g., a glass cover, e.g., a glass coverslip, adhesively attached at its perimeter to the substrate, creating a chamber between the substrate and the cover.
- the inlet port and the outlet port open into the chamber, allowing the application of a hydrodynamic force into the chamber and over the lipid bilayer deposited on the substrate.
- a buffer can be forced through the inlet port into the chamber such that the buffer flows over the lipid bilayer and exits the chamber through the outlet port.
- the flowcell further comprises a staging area, a bifurcated nanochannel, at least one pair of parallel channels, at least one pore, or a combination thereof.
- the nucleic acid molecule of the invention is aligned along the non-linear, geometric barrier according to claim 1 through application of a hydrodynamic force, an electrophoretic force, or a combination of the two forces.
- the nucleic acid molecules of the array according to claim 1 are positioned into a desired orientation by application of a hydrodynamic force, an electrophoretic force, or combination of either, to the microfluidic flowcell.
- a hydrodynamic force to the microfluidic flowcell, e.g., introduction of a buffer as described herein, the nucleic acid molecules are aligned in the direction of the hydrodynamic force.
- the hydrodynamic force results in the extension of the nonattached ends of the nucleic acid molecules in the direction of the flow of the hydrodynamic force.
- the nucleic acid molecules will flow in the direction of the hydrodynamic force until the lipid head encounters a non-linear, geometric diffusion barrier, resulting in the extension of the nucleic acid molecule at a desired position in a desired orientation.
- the disclosure provides a method for isolating a length-specific nucleic acid from a plurality of nucleic acids.
- the method comprises a) providing the microfluidic cell of the invention, wherein the attached nucleic acid molecule is a DNA molecule coupled to a fluorescent label that permits visualization of the DNA molecule; b) applying a first hydrodynamic or electrophoretic force perpendicular to the surface of the support to localize the attached DNA molecules to the nanowell; c) applying a second hydrodynamic or electrophoretic force tangential to the surface of the support to align the attached DNA molecules in a desired orientation within the pair of parallel channels; and d) visualizing the DNA molecule.
- the method can optionally comprise applying continuously the second hydrodynamic or electrophoretic force tangential to the surface of the support.
- the disclosure features a method for visualizing individual nucleic acid molecules.
- the method includes attaching nucleic acid molecules (coupled to a fluorescent label) to a substrate, to a lipid bilayer, or to a non-linear, geometric diffusion barrier, as described herein, to form an array.
- the array is then included in a flowcell, and the nucleic acid molecules are aligned in a desired orientation, as described herein.
- the arrays are then excited with a light source, e.g., a laser, at the excitation wavelength of the particular fluorescent label and the resulting fluorescence at the emission wavelength is detected. Detection of the fluorescence signal utilizes a microscope, e.g., a fluorescent microscope.
- excitation and detection is mediated by Total Internal Reflection Fluorescence Microscopy (TIRFM), as described herein.
- TRFM Total Internal Reflection Fluorescence Microscopy
- the disclosure features methods for analyzing the interactions between a nucleic acid and a polypeptide.
- the method includes, e.g., providing an array within a flowcell as described herein.
- the nucleic acid molecules can be aligned in a desired orientation by application of a hydrodynamic force, and the nucleic acid molecules can be visualized as described herein.
- a target polypeptide is then added to the flowcell, e.g., by being added to the buffer that mediates the hydrodynamic force across the array.
- the target polypeptide is coupled to a fluorescent label that is different than the fluorescent label coupled to the nucleic acid molecule.
- the localization of the target polypeptide to the nucleic acid molecule can be visualized, and such localization is indicative of interaction between the target polypeptide and the nucleic acid molecule.
- the signals from the array are collected serially over time, allowing the movement of the target polypeptides on the nucleic acid molecules to be determined.
- the length of the nucleic acid molecules is determined before and after the addition of the polypeptide, wherein if the polypeptide causes the nucleic acid molecule to change length, e.g., shorten or lengthen, this indicates that the polypeptide causes a structural change in the nucleic acid molecule.
- the disclosure features methods for identifying a nucleic acid sequence, e.g., a mutation in a nucleic acid sequence, that disrupts an interaction between a nucleic acid molecule and a polypeptide.
- the method includes providing a first array within a first flowcell as described herein.
- the first array contains a first population of identical nucleic acid molecules that are coupled to a first fluorescent label.
- the method also includes providing a second array within a second flowcell as described herein.
- the second array contains a second population of identical nucleic acid molecules that are coupled to a first fluorescent label.
- the nucleotide sequence of the second population of nucleic acid molecules differs from the nucleotide sequence of the first population of nucleic acid molecules by at least one nucleotide.
- a polypeptide is then added to the flowcells, e.g., by being added to the buffer that mediates the hydrodynamic force across the arrays.
- the polypeptide is coupled to a second fluorescent label, e.g., one that is different from the fluorescent label coupled to the nucleic acid molecules.
- the localization of the polypeptide to the nucleic acid molecules on the arrays can be visualized, and the localization of the polypeptide to the nucleic acid molecules of the first array, but not of the second array, is indicative that the nucleic acid molecules of the second array contain a nucleic acid sequence, e.g., a mutation, that disrupts the interaction between the nucleic acid molecules of the first array and the polypeptide.
- a nucleic acid sequence e.g., a mutation
- the disclosure features methods for identifying an agent that disrupts the interaction of a polypeptide and a nucleic acid.
- the method includes, e.g., providing an array within a flowcell as described herein.
- the nucleic acid molecules (coupled to a first fluorescent label) can be aligned in a desired orientation by application of a hydrodynamic force, and the nucleic acid molecules can be visualized as described herein.
- a polypeptide is then added to the flowcell, e.g., by being added to the buffer that mediates the hydrodynamic force across the array.
- the polypeptide is coupled to a fluorescent label that is different than the fluorescent label coupled to the nucleic acid molecule.
- the polypeptide is a polypeptide that is known to bind to the nucleic acid molecules.
- the localization of the polypeptide to the nucleic acid molecule can be visualized.
- a candidate agent e.g., a compound or drug, is then added to the flowcell, e.g., by being added to the buffer and whether the localization of the polypeptide can be visualized.
- An agent that causes loss of localization of the polypeptide anywhere along the length of the nucleic acid molecule is indicative of an agent that disrupts the interaction between the nucleic acid molecule and the polypeptide.
- the disclosure features methods for sequencing a nucleic acid molecule.
- the method includes, e.g., providing a single stranded nucleic acid molecule, e.g., a single stranded DNA molecule.
- the single stranded nucleic acid molecule is mixed with DNA polymerase and a mix of fluorescently labeled nucleotide analogs, e.g., fluorescently labeled dNTPs.
- each dNTP e.g., dATP, dCTP, dGTP and dTTP, is coupled to a different fluorescent label.
- the mixture is reacted under conditions that allow the addition of the nucleotide analogs to the single stranded nucleotide molecules.
- the reacted nucleic acid molecules are then added to an array as described herein.
- the nucleic acid molecules can be aligned in a desired orientation by application of a hydrodynamic force, and the nucleic acid molecules can be visualized as described herein.
- the nucleic acid molecules are identical, and the sequence can be determined by parallel lines of color representing particular nucleotides across the array. In one embodiment of the disclosure, the nucleic acid molecules are different.
- the disclosure features methods for high-throughput physical mapping of single DNA molecules, for example using restriction enzymes, hybridization with fluorescent proteins, or fluorescence in situ hybridization.
- the method for mapping a nucleic acid molecule comprises (a) providing an array of the invention described herein, wherein the array comprises a plurality of heterogeneous nucleic acid molecules, and wherein the nucleic acid molecules are DNA molecules coupled to a first fluorescent label that permits visualization of the DNA molecules; (b) contacting a plurality of DNA probes to the DNA molecules, wherein each DNA probe is coupled to a fluorescent label that is not the first fluorescent label; (c) applying a hydrodynamic force or an electrophoretic force tangential to the surface of the support to align the DNA molecule in a desired orientation; and (d) visualizing the locations of binding of the DNA probes.
- the plurality of nucleic acid molecules comprises heterogeneous nucleic acid molecules. In other embodiments of the disclosure, the plurality of nucleic acid molecules comprises identical (e.g., homogeneous) nucleic acid molecules. In further embodiments of the disclosure, the method further comprises: (e) contacting a restriction enzyme to the DNA molecule; (f) collecting the digested DNA molecule of interest; and (g) determining the changes in the length of the DNA molecule following the contacting step. The method can optionally comprise reversibly attaching the nucleic acid molecule along its contour to the lipid bilayer, for example by exposing the DNA molecules to a flowcell buffer contain an effective concentration of calcium.
- the calcium concentration is at least about 0.5 mM, at least about 1 mM, at least about 1.5 mM, at least about 2 mM, at least about 2.5 mM, at least about 3 mM, at least about 3.5 mM, at least about 4 mM, at least about 4.5 mM, at least about 5 mM, at least about 5.5 mM, at least about 6 mM, at least about 6.5 mM, at least about 7 mM, at least about 7.5 mM, at least about 8 mM, at least about 8.5 mM, at least about 9 mM, at least about 9.5 mM, at least about 10 mM, or at least about 10.5 mM.
- the invention features a plurality of micro fluidic flowcells described herein arranged in parallel.
- the plurality of flowcells can be used in parallel in any method described herein.
- the disclosure features a diagnostic method that uses the arrays described herein for detecting a mutation in a nucleic acid. Detection can be achieved in a variety of ways including but not limited either through sequencing of the nucleic acids, or hybridization methods.
- One aspect of the invention features methods for reversibly attaching a nucleic acid molecule along its contour to a lipid bilayer.
- the method comprises: (a) providing the array of claim 1, wherein the nucleic acid is a DNA molecule coupled to a first fluorescent label that permits visualization of the DNA molecule; (b) applying a hydrodynamic force or an electrophoretic force tangential to the surface of the support to align the DNA molecule in a desired orientation; (c) adding an effective concentration of Ca 2+ to the buffer flow; and (d) optionally washing away the Ca 2+ from the buffer.
- the calcium concentration is at least about 0.5 mM, at least about 1 mM, at least about 1.5 mM, at least about 2 mM, at least about 2.5 mM, at least about 3 mM, at least about 3.5 mM, at least about 4 mM, at least about 4.5 mM, at least about 5 mM, at least about 5.5 mM, at least about 6 mM, at least about 6.5 mM, at least about 7 mM, at least about 7.5 mM, at least about 8 mM, at least about 8.5 mM, at least about 9 mM, at least about 9.5 mM, at least about 10 mM, or at least about 10.5 mM.
- the present invention is based in part on the discovery that nucleic acid molecules can be disposed on a substrate and positionally aligned along a non-linear, geometric diffusion barrier according to claim 1, e.g., a non-linear, geometric nanobarrier, to allow analysis of individual nucleic acid molecules.
- the methods and compositions described herein include a substrate, a lipid bilayer, and nucleic acid molecules attached directly to the substrate, attached to the substrate via a linkage, or attached to the lipid layer via a linkage.
- the nucleic acids are capable of interacting with their specific targets while attached to the substrate, and by appropriate labeling of the nucleic acid molecules and the targets, the sites of the interactions between the targets and the nucleic acid molecules can be derived.
- nucleic acid molecules are positionally defined, the sites of the interactions will define the specificity of each interaction. As a result, a map of the patterns of interactions with nucleic acid molecules on the substrate is convertible into information on specific interactions between nucleic acid molecules and targets.
- the invention is based in part on technologies useful for "high-throughput" single molecule research, which can be applied to a variety of systems involving protein-DNA interactions.
- fluorescent nucleosomes have been reconstituted and it has been shown in the Examples below that DNA curtains can be used to define intrinsic energy landscapes.
- the invention is also based in part on assays that allow for directly visualization of 1-dimensional diffusion of proteins on DNA.
- proteins involved in mismatch repair such as Msh2-Msh6 and Mlh1-Pms1 both diffuse on DNA, but have different characteristics, suggesting that they travel along DNA via distinct mechanisms (see Examples discussed herein).
- the non-linear, geometric diffusion barrier can comprise a repetitive series of angles of varying degrees.
- the non-linear, geometric diffusion barrier can also comprise turns, bends, curves, or interruptions.
- the non-linear, geometric diffusion barrier is non-linear over its entire length.
- the non-linear, geometric diffusion barrier comprises at least one angle.
- the barrier comprises at least one angle less than 180°.
- the non-linear, geometric diffusion barrier comprises at least one angle of varying degrees.
- the non-linear, geometric diffusion barrier comprises multiple angles of varying degrees.
- the non-linear, geometric barriers comprise a repetitive triangular wave producing a sawtooth pattern, that repeats at nanometer-scale intervals (e.g., the interval is at least about 5 nm, at least about, 10 nm, at least about 20 nm, at least about 25 nm, at least about 30 nm, at least about 40 nm, 50 nm, at least about 100 nm, at least about 150 nm, at least about 200 nm, at least about 250 nm, at least about 300 nm, at least about 350 nm, at least about 400 nm, at least about 450, at least about 500 nm, at least about 600 nm, at least about 700 nm, at least about 750 nm, at least about 800 nm, at least about 900 nm, at least about 1000 nm, at least about 1500 nm, or at least about 2000 nm
- the vertex of each adjacent triangle of the repetitive triangular wave can form a nanoscale well within the non-linear, geometric barrier. This well can be referred to as a "geometric nanowell.”
- the vertex of each adjacent triangle of the repetitive triangular wave can have peak-to-peak distances of at least about 50 nm, at least about 100 nm, at least about 150 nm, at least about 200 nm, at least about 250 nm, at least about 300 nm, at least about 350 nm, at least about 400 nm, at least about 450, at least about 500 nm, at least about 600 nm, at least about 700 nm, at least about 750 nm, at least about 800 nm, at least about 900 nm, at least about 1000 nm, at least about 1500 nm, or at least about 2000 nm.
- any conceivable substrate can be employed in the compositions and methods described herein.
- the substrate can be biological, nonbiological, organic, inorganic, or a combination of any of these, existing, e.g., as particles, strands, precipitates, gels, sheets, tubing, spheres, containers, capillaries, pads, slices, films, plates, or slides.
- the substrate can have any convenient shape, such as, e.g., a disc, square, sphere or circle.
- the substrate and its surface can form a rigid support on which to carry out the reactions described herein.
- the substrate can be, e.g., a polymerized Langmuir Blodgett film, functionalized glass, Si, Ge, GaAs, GaP, SiO 2 SiN 4 , modified silicon, or any one of a wide variety of gels or polymers such as (poly)tetrafluoroethylene, (poly)vinylidenedifluoride, polystyrene, polycarbonate, or combinations thereof.
- a polymerized Langmuir Blodgett film functionalized glass
- Si Ge, GaAs, GaP, SiO 2 SiN 4
- modified silicon or any one of a wide variety of gels or polymers such as (poly)tetrafluoroethylene, (poly)vinylidenedifluoride, polystyrene, polycarbonate, or combinations thereof.
- Other substrate materials will be readily apparent to those of skill in is the art upon review of this disclosure.
- the substrate is a made of SiO 2 and is flat.
- the substrate is coated with a linker to which the nucleic acid molecules attach.
- linkers can be, e.g., chemical or protein linkers.
- the substrate can be coated with a protein such as neutravidin or an antibody.
- the substrate comprises a diffusion barrier, e.g., a mechanical, chemical barrier, or protein barrier.
- Diffusion barriers can be prepared by applying barrier materials onto the substrate prior to deposition of the lipid bilayer; the bilayer then forms around the barriers.
- a mechanical barrier can be, e.g., a scratch or etch on the substrate, which physically prevents lipid diffusion.
- a chemical barrier can comprise a metal, a metal oxide, or a combination thereof.
- the metal comprises chromium, aluminum, gold, or titanium.
- the metal oxide comprises chromium oxide, aluminum oxide, or titanium oxide.
- Barrier materials can be made that are similar to the thickness of the bilayer itself (e.g., 6-8 nm), or thinner than the bilayer.
- Protein barriers can be deposited onto substrates, e.g., SiO 2 substrates, by a variety of methods.
- protein barriers can be deposited in well-defined patterns by a process called microcontact printing [ Kato et al., (2000). Journal of Human Genetics. 45:133-137 ; Davies, et al., (2001) Molecular Cell. 7: 273-282 ].
- Microcontact printing uses a PDMS (poly[dimethylsiloxane]) template as a stamp for generating specific patterns on substrates.
- PDMS stamps can transfer proteins to a SiO 2 substrate in patterns with features as small as 1 ⁇ m, and thicknesses on the order of 5-10 nm [ Kato et al., (2000).
- the PDMS stamps used for microcontact printing can be made, e.g., by soft-lithography as described in Davies, et al., (2001) Molecular Cell. 7: 273-282 .
- the PDMS can be incubated with a solution of protein, dried, and then placed into contact with the substrate, e.g., SiO 2 resulting in transfer of the protein "ink” from the PDMS stamp to the substrate and yielding a pattern defined by the stamp design.
- protein barriers can be made from fibronectin.
- electron-beam lithography can be used to engineer chromium barriers to lipid diffusion with nanometer (nm) scale features in order to make molecular curtains of DNA suspended above an inert bilayer.
- the shape of the barriers and the fluidity of the bilayer are used to direct the organization of the DNA into well-defined patterns in which all of the molecules are arranged in the same orientation and aligned with respect to one another.
- These barriers are simple and robust, they do not interfere with optical imaging of the fluorescent DNA molecules, and they can be precisely constructed at predefined locations on the surface of a microfluidic sample chamber.
- the barriers can be generated as depicted in FIG. 46 .
- the material is one that renders the substrate inert.
- the material is lipid bilayers.
- the layer is made of zwitterionic lipids.
- a lipid bilayer can be deposited onto the substrate by applying liposomes to the substrate. Liposomes can be produced by known methods from, e.g., 1,2-dioleoyl-sn-glycero-3-phosphocholine (DOPC) or 0.5% biotin-phosphatidylethanolamine (biotin-PE) plus 99.5% DOPC (Avanti Polar Lipids, Alabaster, AL).
- DOPC 1,2-dioleoyl-sn-glycero-3-phosphocholine
- biotin-PE biotin-phosphatidylethanolamine
- DOPC adji Polar Lipids, Alabaster, AL
- the lipid bilayer can include polyethylene glycol (PEG).
- PEG can be included in the lipid bilayer.
- PEG can also be included to make the surface of the bilayer inert to reagents added to the array.
- the nucleic acid molecules can be attached to the substrate, to the lipid bilayer, or to the non-linear, geometric diffusion barrier, to form an array.
- the nucleic acid molecules can be attached by a linkage either at one end of the nucleic acid molecule or at both ends.
- the nucleic acid molecule can be linked to a cognate protein that binds to the protein coated on the substrate.
- the substrate is coated with neutravidin and the nucleic acid molecule linker is biotin. Linkers can be added to the nucleic acid molecules using standard molecular biology techniques known to those of ordinary skill in the art.
- the nucleic acid molecule can be linked to the lipid bilayer.
- the lipid bilayer is deposited onto the substrate and a protein, e.g., neutravidin, is linked to the lipid head groups. Biotinylated nucleic acid molecules are then introduced, linking the nucleic acid molecules to the lipid bilayer.
- the nucleic acid molecules can be linked to the non-linear, geometric diffusion barriers.
- the diffusion barrier is a protein, e.g., biotinylated bovine serum albumin (BSA), deposited on the substrate. Neutravidin is then bound directly to the biotinylated BSA protein barriers, and biotinylated nucleic acid molecules are linked to the biotinylated BSA protein barriers.
- BSA biotinylated bovine serum albumin
- Other known protein-cognate protein pairs can be used in the methods described herein.
- antibodies e.g., anti-digoxigenin antibodies, can be used as protein barriers and the cognate antigen, e.g., digoxigenin, linked to the nucleic acid molecule.
- one end of the nucleic acid molecule is attached by a linkage, for example to the substrate or to a non-linear, geometric diffusion barrier.
- both ends of the nucleic acid molecule are attached by linkages, for example, to the substrate, to a non-linear, geometric diffusion barrier, or to a combination of the two surfaces.
- Double-tethered DNA substrates can be used for visualizing 1D diffusion
- DNA molecules can be biotinylated at both ends. While a constant, moderate hydrodynamic flow force is applied, DNA is suspended above an inert lipid bilayer. The only interaction between the DNA and the surface is through the biotinylated ends of the molecule. For example, 80% extension of the DNA molecule corresponds to ⁇ 5e -13 N ( ⁇ 0.5 pN) of force (e.g., where the DNA is not distorted).
- attaching both ends of a nucleic acid molecule to the barriers, inert substrate, or a combination thereof can generate a "rack," for example a DNA rack, as shown in FIGS. 13 , 18 , and 21 .
- the "rack" can be generated by reversibly anchoring the entire contour length of the nucleic acid molecule (e.g., a DNA molecule) to the lipid bilayer of an array described herein by exposing the nucleic acid molecules to an effective calcium concentration (for example, see FIG. 43C ).
- the calcium concentration is at least about 0.5 mM, at least about 1 mM, at least about 1.5 mM, at least about 2 mM, at least about 2.5 mM, at least about 3 mM, at least about 3.5 mM, at least about 4 mM, at least about 4.5 mM, at least about 5 mM, at least about 5.5 mM, at least about 6 mM, at least about 6.5 mM, at least about 7 mM, at least about 7.5 mM, at least about 8 mM, at least about 8.5 mM, at least about 9 mM, at least about 9.5 mM, at least about 10 mM, or at least about 10.5 mM.
- the attached nucleic acid molecules and/or the interacting nucleic acid molecules or polypeptides are visualized by detecting one or more labels attached to the nucleic acid molecules or polypeptides.
- the labels can be incorporated by any of a number of means well known to those of skill in the art.
- the nucleic acid molecules on the array can be coupled to a nonspecific label, e.g., a dye, e.g., a fluorescent dye, e.g., YOYO1 (Molecular Probe, Eugene, OR), TOTO1, TO-PRO, acridine orange, DAPI and ethidium bromide, that labels the entire length of the nucleic acid molecule.
- the nucleic acid molecules can also be labeled with Quantum dots, as described herein.
- the nucleic acid molecules e.g., the nucleic acid molecules on the array or target nucleic acid molecules
- the label can be incorporated during an amplification step in the preparation of the sample nucleic acids.
- PCR polymerase chain reaction
- the nucleic acid molecule is amplified in the presence of labeled deoxynucleotide triphosphates (dNTPs).
- a label can be added directly to the nucleic acid molecule or to an amplification product after an amplification is completed.
- Means of attaching labels to nucleic acids include, for example, nick translation or end-labeling (e.g. with a labeled RNA) by kinasing of the nucleic acid and subsequent attachment (ligation) of a nucleic acid linker joining the sample nucleic acid to a label (e.g., a fluorophore).
- Detectable labels suitable for use in the methods and compositions described herein include any composition detectable by spectroscopic, photochemical, biochemical, immunochemical, electrical, optical or chemical means.
- Useful labels include biotin for staining with labeled streptavidin conjugate, magnetic beads (e.g., Dynabeads TM), fluorescent dyes (e.g., fluorescein, Texas red, rhodamine, green fluorescent protein, and the like, see, e.g., Molecular Probes, Eugene, OR), radiolabels (e.g., 3 H, 125 I, 35 S, 14 C, or 32 P), enzymes (e.g., horse radish peroxidase, alkaline phosphatase and others commonly used in an ELISA), and colorimetric labels such as colloidal gold (e.g., gold particles in the 40-80 nm diameter size range scatter green light with high efficiency) or colored glass or plastic (e.g., polystyrene, polypropylene
- Patents teaching the use of such labels include U.S. Pat. Nos. 3,817,837 ; 3,850,752 ; 3,939,350 ; 3,996,345 ; 4,277,437 ; 4,275,149 ; and 4,366,241 .
- fluorescent labels are used.
- the nucleic acid molecules can all be labeled with a single label, e.g., a single fluorescent label.
- different nucleic acid molecules have different labels.
- one nucleic acid molecule can have a green fluorescent label and a second nucleic acid molecule can have a red fluorescent label.
- Suitable chromogens which can be employed include those molecules and compounds that absorb light in a distinctive range of wavelengths so that a color can be observed or, alternatively, which emit light when irradiated with radiation of a particular wave length or wave length range, e.g., fluorescers.
- Suitable dyes are available, being primary chosen to provide an intense color with minimal absorption by their surroundings.
- Illustrative dye types include quinoline dyes, triarylmethane dyes, acridine dyes, alizarine dyes, phthaleins, insect dyes, azo dyes, anthraquinoid dyes, cyanine dyes, phenazathionium dyes, and phenazoxonium dyes.
- Fluorescers of interest fall into a variety of categories having certain primary functionalities. These primary functionalities include 1- and 2-aminonaphthalene, p,p'-diaminostilbenes, pyrenes, quaternary phenanthridine salts, 9-aminoacridines, p,p'-diaminobenzophenone imines, anthracenes.
- Individual fluorescent compounds that have functionalities for linking or that can be modified to incorporate such functionalities include, e.g., dansyl chloride; fluoresceins such as 3,6-dihydroxy-9-phenylxanthhydrol; rhodamineisothiocyanate; N-phenyl 1-amino-8-sulfon-atonaphthalene; N-phenyl 2-amino-6-sulfonatonaphthalene: 4-acetamido-4-isothiocyanato-stilbene-2,2'-disulfonic acid; pyrene-3-sulfonic acid; 2-toluidinonaphthalene-6-sulfonate; N-phenyl, N-methyl 2-aminoaphthalene-6-sulfonate; ethidium bromide; stebrine; auromine-0,2-(9'-anthroyl)palmitate; dansyl phosphatidylethanolamine; N,N'-dioc
- the label can be a "direct label", i.e., a detectable label that is directly attached to or incorporated into the nucleic acid molecule.
- the label can be an "indirect label", i.e., a label joined to the nucleic acid molecule after attachment to the substrate.
- the indirect label can be attached to a binding moiety that has been attached to the nucleic acid molecule prior to attachment to the substrate.
- Polypeptides can be visualized by coupling them to, e.g., fluorescent labels described herein, using known methods.
- fluorescent labels e.g., fluorescent labels described herein
- other labels such as Quantum dots (Invitrogen) can be used, as described herein.
- a fluorescent label is an embodiment of the invention.
- Standard procedures are used to determine the positions of the nucleic acid molecules and/or a target, e.g., a second nucleic acid molecule or a polypeptide.
- the position of a nucleic acid molecule on an array described herein can be detected by the signal emitted by the label.
- the locations of both the nucleic acid molecules on the array and the target will exhibit significant signal.
- the array is excited with a light source at the excitation wavelength of the particular fluorescent label and the resulting fluorescence at the emission wavelength is detected.
- the excitation light source is a laser appropriate for the excitation of the fluorescent label.
- Detection of the fluorescence signal can utilize a microscope, e.g., a fluorescent microscope.
- the microscope can be equipped with a phototransducer (e.g., a photomultiplier, a solid state array, or a ccd camera) attached to an automated data acquisition system to automatically record the fluorescence signal produced by the nucleic acid molecules and/or targets on the array.
- a phototransducer e.g., a photomultiplier, a solid state array, or a ccd camera
- Such automated systems are known in the art.
- Use of laser illumination in conjunction with automated confocal microscopy for signal detection permits detection at a resolution of better than about 100 ⁇ m, better than about 50 ⁇ m, and better than about 25 ⁇ m.
- the detection method can also incorporate some signal processing to determine whether the signal at a particular position on the array is a true positive or can be a spurious signal. For example, a signal from a region that has actual positive signal can tend to spread over and provide a positive signal in an adjacent region that actually should not have one. This can occur, e.g., where the scanning system is not properly discriminating with sufficiently high resolution in its pixel density to separate the two regions. Thus, the signal over the spatial region can be evaluated pixel by pixel to determine the locations and the actual extent of positive signal.
- a true positive signal should, in theory, show a uniform signal at each pixel location. Thus, processing by plotting number of pixels with actual signal intensity should have a clearly uniform signal intensity. Regions where the signal intensities show a fairly wide dispersion, can be suspect and the scanning system can be programmed to more carefully scan those positions.
- Total internal reflection fluorescence microscopy is used to detect the nucleic acid molecules and polypeptides described herein.
- TIRFM Total internal reflection fluorescence microscopy
- the evanescent wave This is called the evanescent wave, and its intensity decays exponentially away from the surface [ Axelrod, D., (1989) Methods Cell Biol. 30:245 - 70 ; Forkey et al., (2000) Progress in Biophysics & Molecular Biology. 74:1-35 .].
- the evanescent wave penetrates approximately 100 nm into the aqueous medium. This geometry reduces the background signal by several orders of magnitude compared to conventional fluorescence microscopy and readily allows the detection of single fluorescent molecules, because contaminants and bulk molecules in solution are not illuminated and do not contribute to the detected signal. [ Forkey et al., (2000) Progress in Biophysics & Molecular Biology. 74:1-35 ].
- TIRFM to visualize the arrays described herein, it is possible to simultaneously monitor hundreds of aligned DNA molecules within a single field-of-view.
- micro fluidic flowcells composed of substrates that are rendered inert by deposition of a lipid bilayer as described herein.
- DNA molecules can be suspended above an inert lipid bilayer.
- a hydrodynamic force can be used to organize DNA molecules along the leading edge of a nanoscale diffusion barrier, for example a non-linear, geometric diffusion barrier.
- an electrophoretic force can be used to organize DNA molecules along the edge of a barrier. Thousands of DNA molecules can be visualized in a single experiment using an array described herein. All molecules are physically aligned with one another.
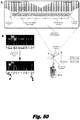
- a micro fluidic flowcell that can be used in the methods described herein is depicted in FIG. 20 .
- a substrate described herein is overlaid with a coverslip, e.g., a glass coverslip, to form a sample chamber, and the substrate contains an inlet port and an outlet port, through which a hydrodynamic force is applied.
- the hydrodynamic force can be mediated by, e.g., a buffer solution that flows over the lipid bilayer described herein.
- An exemplary micro fluidic flowcell can be constructed from 76.2 x 25.4 x 1 mm (L x W x H) fused silica slides (ESCO Products, Oak Ridge, NJ).
- Inlet and outlet holes can be drilled through the slides using, e.g., a diamond-coated bit (1.4 mm O.D.; Eurotool, Grandview, MO).
- a sample chamber can be prepared from a borosilicate glass coverslip (Fisher Scientific, USA) and, e.g., double-sided tape (-25 ⁇ m thick, 3M, USA) or a polyethylene gasket.
- Inlet and outlet ports can be attached using preformed adhesive rings (Upchurch Scientific, Oak Harbor, WA), and cured at 120°C under vacuum for 2 hours.
- the dimensions of the exemplary sample chamber are 3.5 x 0.45 x 0.0025 cm (L x W x H).
- the total volume of the exemplary flowcell is ⁇ 4 ⁇ l.
- a syringe pump (Kd Scientific, Holliston, MA) is used to control buffer delivery to the sample chamber. This exemplary apparatus is not meant to be limiting, and one of skill in the art would appreciate modifications that could be made.
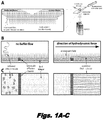
- FIG. IE A total internal reflection fluorescence microscope is depicted in FIG. IE.
- An exemplary microscope is a modified Nikon TE2000U inverted microscope. [ Groves, et al., (1998) Langmuir 14: 3347-3350 ]
- D MSD/4t; where MSD (the mean square displacement) is the square of the average step size measured over time interval t (0.124 sec) [ Kelman, Z., (1997) Oncogene 14:629-640 .].
- the arrays described herein can be used to detect individual nucleic acid molecules, e.g., nucleic acid molecules coupled to a label.
- an array can be constructed as part of a microfluidic flowcell described herein.
- the nucleic acid molecules, e.g., labeled nucleic acid molecules can be attached to a substrate, to a lipid bilayer, or to a non-linear, geometric diffusion barrier, as described herein.
- hydrodynamic force e.g., introduction of a buffer as described herein
- the nucleic acid molecules are aligned in direction of the hydrodynamic force, with the nonattached ends of the nucleic acid molecules extending in the direction of the flow of the hydrodynamic force.
- Individual nucleic acid molecules on the array can be visualized before and/or after the application of the hydrodynamic force using, e.g., TIRFM as described herein.
- the interactions of nucleic acid molecules on the arrays with target polypeptides are determined.
- the nucleic acid molecules can be visualized before and/or after the application of a hydrodynamic force, as described herein.
- the polypeptides can be coupled to a label and introduced into the array, e.g., a microfluidic cell including the array, as a component of the buffer that mediates the hydrodynamic force.
- Individual nucleic acid molecules and individual target polypeptides can be visualized, e.g., by TIRFM as described herein, and interactions can be determined by co localization of the signals from the nucleic acid molecules and the polypeptides. Such interactions can be further analyzed by collecting signals over a period of time.
- Such methods can be used to visualize, e.g., the movement of polypeptides along the length of individual nucleic acid molecules, as described herein.
- an array can be constructed as part of a microfluidic flowcell described herein.
- the nucleic acid molecules e.g., labeled nucleic acid molecules
- the polypeptides can be coupled to a label and introduced into the array, e.g., a microfluidic cell including the array, as a component of the buffer that mediates the hydrodynamic force.
- the polypeptides are known to interact with the nucleic acid molecules, and the interactions are visualized as described herein.
- the polypeptides can be proteins involved in DNA replication, recombination and/or repair.
- Candidate compounds can then be added to the array, e.g., as a component of the buffer that mediates the hydrodynamic force, and the effect of the compound on the interactions between individual nucleic acid molecules and the polypeptides can be visualized. Compounds that disrupt the interactions can be visually identified. Such methods can be automated.
- the methods described herein can be used to screen for therapeutic compounds to treat cancer, e.g., cancer of the breast, prostate, lung, bronchus, colon, rectum, urinary bladder, kidney, pancreas, oral cavity, pharynx, ovary, skin, thyroid, stomach, brain, esophagus, liver, cervix, larynx, soft tissue, testis, small intestine, anus, anal canal, anorectum, vulva, gallbladder, bones, joints, hypopharynx, eye, nose, nasal cavity, ureter, gastrointestinal tract; non-Hodgkin lymphoma, Multiple Myeloma, Acute Myeloid Leukemia, Chronic Lymphocytic Leukemia, Hodgkin Lymphoma, Chronic Myeloid Leukemia and Acute Lymphocytic Leukemia.
- cancer e.g., cancer of the breast, prostate, lung, bronchus, colon, rectum, urinary bladder, kidney, pancre
- the methods and compositions described herein can be used to sequence nucleic acid molecules.
- the arrays described herein can be constructed with identical nucleic acid molecules, e.g., single stranded DNA molecules, or with different nucleic acid molecules, e.g., single stranded DNA molecules.
- an oligonucleotide primer is annealed to the DNA molecules.
- Polymerase is then added along with the fluorescent dNTP mix.
- Fluorescent nucleotide analogs that do not terminate extension of the DNA strand are used.
- the DNA molecules are then attached to the substrate and the array is visualized as described herein.
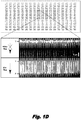
- the color of the nucleotide incorporated into the growing chain reveals the sequence of the DNA molecules. If all of the DNA molecules within the array are identical, then the incorporation of the first nucleotide during polymerization will yield a fluorescent line extending horizontally across the array. Subsequent nucleotide addition will also yield horizontal lines and the color of each line will correspond the DNA sequence. When sequencing different DNA molecules, the differences in DNA sequences are revealed as the incorporation of different fluorescent nucleotides across the array, rather than the lines of identical color seen when sequencing identical DNA molecules. In some embodiments of the disclosure, these methods are automated.
- EXAMPLE 1 DNA curtains and nanoscale curtain rods: high-throughput tools for single molecule imaging.
- Single molecule visualization of protein-DNA complexes can reveal details of reaction mechanisms and macromolecular dynamics inaccessible to traditional biochemical assays.
- these techniques are often limited by the inherent difficulty of collecting statistically relevant information from experiments explicitly designed to look at single events.
- New approaches that increase throughput capacity of single molecule methods have the potential for making these techniques more readily applicable to a variety of biological questions involving different types of DNA transactions.
- the individual molecules that make up the DNA curtains are visualized by total internal reflection fluorescence (TIRFM) allowing simultaneous imaging of thousands of perfectly aligned molecules.
- TRFM total internal reflection fluorescence
- one common problem of many single molecule techniques is the requirement for the macromolecules under investigation be anchored to a solid support surface, which is unlike anything encountered within a cellular environment. It is essential to minimize nonspecific interactions with the surface that can perturb their biological properties.
- Traditional approaches for passivating surfaces have included nonspecific blocking agents (e.g. BSA or casein) or covalent modification with polyethylene glycol (PEG) (A1, A2).
- Nonspecific blocking proteins often do not work well enough to prevent surface adsorption of other molecules (A3).
- PEGylated surfaces are efficient at preventing nonspecific interactions between proteins or nucleic acids and the underlying surface, but PEG alone can not be sufficient in all cases.
- Vesicle encapsulated reactions have been used in single molecule analysis (A4, A5).
- Vesicle encapsulation is a very promising approach that makes use of the native environment provided by lipid membranes, but has limited potential for biochemical experiments involving macromolecules that can not be confined within vesicles or those requiring successive addition of high-molecular weight components.
- Combed DNA is anchored to a hydrophobic glass slide, and aligned with a receding air-water meniscus, yielding molecules adhered to the glass by multiple contact points and stretched ⁇ 150 percent beyond the length of normal B-DNA.
- the hydrophobic surfaces required for combing and the resulting distortion of the DNA can not be compatible with many proteins.
- the combed DNA molecules are aligned along a common direction their ends are not aligned relative to one another nor is the orientation of the DNA defined with respect to its sequence.
- Kabata and colleagues reported that "belts" of ⁇ -DNA could be stretched between two aluminum electrodes by dielectrophoresis, which they used to visualize the motion of RNAP and EcoRI by fluorescence microscopy (A8, A9).
- Kim et al. reported a similar approach, in which they anchored molecules of ⁇ -DNA to a PEGylated surface and stretched the DNA with buffer flow (A13). In each of these examples they concurrently detect ⁇ 100-200 molecules, but required 10x magnification to expand the field-of-view, thus the overall density of the anchored DNA remained quite low (A13). Finally, Schwartz and co-workers have pioneered single DNA molecule optical mapping techniques (A14, A15), but these approaches may not be applicable for real time biochemical analysis of protein-DNA interactions.
- Lipids within the bilayer can not traverse the etched barrier (A18), therefore the lipid-tethered DNA molecules accumulate along the leading edges of these barriers (A16).
- a drawback of this approach is that manual etching greatly limits user control over the dimensions and locations of the microscale diffusion barriers.
- the etched barriers also compromise the quality of the optical surface, leading to problems such as light scattering, uneven alignment of DNA, nonspecific protein adsorption, inefficient coverage of the viewing area, and a high failure rate. Together these problems can undermine the use of DNA curtains for single-molecule biological research.
- Nanoscale barriers to lipid diffusion The use of mechanical or chemical barriers to corral lipids within supported bilayers has been pioneered by S.G. Boxer and colleagues (A20). Inspired by these studies, we demonstrated that mechanical barriers to lipid diffusion can also be used to organize DNA molecules into curtains at defined locations on a fused silica surface (A16). We have shown that these curtains serve as a highly effective experimental platform for the study of protein-DNA interactions at the single molecule level (A21-23). The general principles behind this approach are outlined in FIG. 1 . To make the curtains, DNA is first anchored by one end to a supported lipid bilayer coating the surface of the sample chamber ( FIGS. 1B and 1C ).
- the molecules are randomly distributed on the surface, but lie outside of the detection volume defined by the penetration depth of the evanescent field ( ⁇ 150-200 nm) (A24).
- Application of flow pushes the DNA through the sample chamber with one end anchored to the bilayer.
- the barriers are oriented perpendicular to the direction of flow at strategic locations in the path of the DNA ( FIGS. 1B and 1C ); this halts the movement of the molecules causing them to accumulate at the edges of the barriers where they are extended parallel to the surface, enabling visualization along their full contour length by TIRFM (A16).
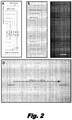
- FIG. 2A shows a cartoon representation of a desired surface pattern comprised of an interlocking series of bracket-shaped barriers, and the important features of the design are indicated.
- Guide channels oriented parallel to the direction of flow ensure efficient capture of approaching DNA molecules tethered to the bilayer.
- Perpendicular barriers form the "curtain rods" against which the DNA molecules are aligned.
- the parallel barriers of the guide channels also prevent the molecules from sliding off the edges of the perpendicular barriers when buffer flow is transiently paused (see below).
- FIG. 2B An optical image of a chromium barrier pattern with the afore-mentioned design elements prepared by direct-write electron beam (E-beam) lithography is shown in FIG. 2B .
- FIG. 2D shows a section of fused silica surface with a 2 x 3 series of chromium barrier sets.
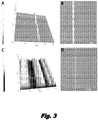
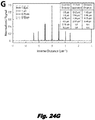
- FIG. 3A shows an atomic force microscopy (AFM) image illustrating a representative single barrier that is 31 nm tall, and we have also made functional patterns with barriers ranging from 20.5 nm up to 173 nm. The height of the barriers is dictated by the amount of chromium evaporated onto the surface and can be accurately controlled as required for specific experimental needs.
- FIG. 3B shows a scanning electron microscopy (SEM) image of a parallel chromium barrier revealing a width 100 ⁇ 9 nm.
- FIGS. 3C-D show AFM and SEM images of manually etched barriers, respectively.
- the width of the etched barriers can be on the order of ⁇ 5-10 ⁇ m and they also have highly irregular topology, as previously reported (A18).
- the DNA molecules themselves are retained within the barrier set because flow is not stopped long enough to allow them to diffuse out of the guide channel openings. Flow can then be resumed to assess the distribution of the DNA, and if necessary this process is repeated at short intervals to achieve even disbursement of the DNA along the barrier edges (see Materials and Methods).
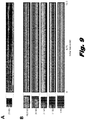
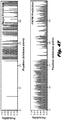
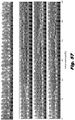
- FIG. 4A shows an image with YOYO1 stained ⁇ -DNA (48,502 bp) organized into curtains within a five-tiered barrier set.
- ⁇ -DNA 48,502 bp
- FIG. 4B shows an image with YOYO1 stained ⁇ -DNA (48,502 bp) organized into curtains within a five-tiered barrier set.
- -805 individual, molecules of ⁇ -DNA in this field-of-view.
- the DNA molecules diffuse up away from the surface and out of the evanescent field ( FIG. 4B ).
- This is a control used to verify that the DNA molecules are anchored by only one end to the sample chamber surface. Any molecules nonspecifically adsorbed to the surface will remain extended when flow is transiently paused and, if necessary, these molecules can be excluded from any further analysis.
- the anchored DNA molecules When flow is stopped for longer than a few seconds the anchored DNA molecules also begin to move away from the barrier edges, showing that they are not irreversibly anchored to the strips of chromium or otherwise immobilized to the surface ( FIG. 4C ). When flow is resumed the DNA molecules are pushed back into the diffusion barriers ( FIG. 4D ). If continuous buffer flow is maintained the ⁇ -DNA molecules do not diffuse laterally, but rather remain in a single location along the barrier edge, ensuring that individual molecules can be readily tracked over time. However, shorter DNA fragments exhibit lateral diffusion when pushed against the barriers under the same flow conditions used for ⁇ -DNA (see below).
- FIGS. 4E-G show a 2 x 3 array of six-tiered barrier patterns containing ⁇ -DNA curtains viewed at 10x magnification.
- the amount of DNA applied to the surface, the fraction of biotinylated lipid, the spacing between barrier sets, the number of barriers, and the width of the guide channel openings all dictate the total amount of DNA aligned at any given barrier. Any of these variables can be controlled to adjust the number of DNA molecules as needed.
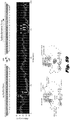
- Orientation specificity and optical restriction mapping of DNA curtains The design of the curtains should yield DNA molecules all aligned with the same sequence orientation based upon the location of the biotin tag. If some fraction of the DNA is bound to the bilayer via its unlabeled end, then this second population of DNA will have reversed sequence orientation with respect to those molecules anchored via the biotin tag. Verifying the alignment is critical for future experiments meant to probe the sequence-dependent behavior of DNA bound proteins.
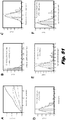
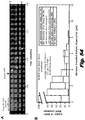
- ⁇ -DNA has five EcoRI restriction sites located 21,226 bp, 26,106 bp, 31,747 bp, 39,168 bp and 44,972 bp from the left end of the molecules.
- Optical restriction mapping has evolved into a powerful technique for the physical analysis of large DNA molecules (A14, A15, A25), and because the DNA curtains are organized with all of the molecules in a defined orientation they provide a very simple platform for mapping the locations of specific restriction sites.
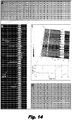
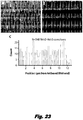
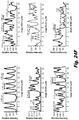
- FIG. 5E different combinations of single restriction sites can be easily mapped within the DNA curtain by successive introduction of the desired enzymes into the flowcell.
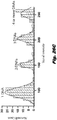
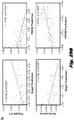
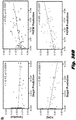
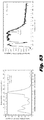
- the curtain was sequentially cut with NheI, XhoI, EcoRI, NcoI, PvuI, and SphI, and the observed lengths ( ⁇ m) of the resulting DNA fragments were measured and plotted as a histogram to illustrate the location of the cleavage sites.
- the DNA fragment lengths reported above are indicated in microns, and represent an apparent, observed value rather than a direct measure of the actual contour length.
- the mean extension (x)/L of the DNA molecules examined in this study was approximately 0.80, corresponding to ⁇ 6e -13 N ( ⁇ 0.6 pN) of tension.
- a plot of all the different measured DNA fragment contour lengths in ⁇ m versus the known length of fully extended DNA fragments based on their size in either microns or base pairs can be used as a calibration curve to estimate the actual size of the DNA fragments.
- nanolithography to engineer arrays of diffusion barriers, which are used to organize curtains of DNA on a surface coated with a supported lipid bilayer.
- these tools we can visualize thousands of individual, perfectly aligned DNA molecules, all arranged in the exact same orientation, in real time using TIRFM.
- These nanofabricated DNA curtains offer numerous advantages that overcome some current limitations of single molecule DNA imaging.
- the method is simple and robust, the flowcells are reusable, the barriers themselves are highly uniform, and they do not compromise the optical quality of the fused silica or interfere with signal detection.
- the bilayer provides an inert environment closely resembling a cell membrane and is compatible with many biological macromolecules, ensuring that the DNA curtains can be used for imaging a range of biochemical systems (A17, A20).
- Direct-write electron-beam lithography for nanofabricating barrier patterns offers tremendous reproducibility, accuracy, design flexibility, and is advantageous for prototyping devices.
- the key elements of the barrier design (barrier height, barrier width, barrier shape, barrier material, separation distance between adjacent barriers, guide channel shape or width, etc.) can all be adjusted to accommodate any desired substrate and/or experimental need with virtually no limitations on the overall pattern other than those spatial constraints imposed by the use of lithographic techniques.
- the shapes and dimensions of the barriers presented here were specifically constructed for visualizing ⁇ -DNA molecules. For example, the parallel barriers within these sets are separated from one another by a distance of 16 ⁇ m to allow maximal surface coverage.
- the DNA curtains offer a myriad of other potential applications. For example, they enable rapid generation of physical maps of long DNA molecules, and we have demonstrated this with a series of optical mapping assays based on restriction endonuclease cleavage. Because these reactions are performed within a microfluidic sample chamber and DNA is only anchored by one end, collection of the liberated fragments in sufficient quantities for cloning and further analysis should prove straightforward. Similarly, these curtains can also be used to generate maps of binding sites for any DNA-binding protein of interest as long as it can be tagged with a fluorescent label. Finally, the perfect alignment of the DNA molecules within the curtains greatly facilitates data evaluation, and offers the future potential for automated image analysis.
- Patterns were written by E-beam lithography using an FEI Sirion scanning electron microscope equipped with a pattern generator and lithography control system (J. C. Nabity, Inc.). After the pattern was written the Aquasave was washed off with deionized water and the sample dried with N 2 . Resist was developed using a 3:1 solution of isopropanol to methyl isobutyl ketone (MIBK) for 1 minute with ultrasonic agitation at 5 °C. The substrate was then rinsed in isopropanol and dried with N 2 . A thin layer of chromium was deposited using a Semicore electron beam evaporator.
- MIBK isopropanol to methyl isobutyl ketone
- the coated substrate was submerged in a 65°C acetone bath for 30 minutes, and then gently sonicated. Following lift-off, samples were rinsed with acetone to remove stray chromium flakes and dried with N 2 . Barriers were imaged using a Hitachi 4700 scanning electron microscope and a PSIA XE-100 Scanning Probe Microscope in noncontact mode. Optical images of the barriers were taken with a Nikon Eclipse ME600 at either 10x or 20x magnification (as indicated).
- Lipid bilayers and DNA curtains were constructed as previously described (A16). All lipids were purchased from Avanti Polar Lipids and liposomes were prepared as previously described. In brief, a mixture of DOPC (1,2-dioleoyl- sn -glycero-phosphocholine), 0.5% biotinylated-DPPE (1,2-dipalmitoyl- sn- glycero-3-phosphoethanolamine-N-(cap biotinyl)), and 8% mPEG 550-DOPE (1,2-dioleoyl- sn -glycero-3-phosphoethanolamine-N-[methoxy(polyethylene glycol)-550]).
- DOPC 1,2-dioleoyl- sn -glycero-phosphocholine
- biotinylated-DPPE 1,2-dipalmitoyl- sn- glycero-3-phosphoethanolamine-N-(cap biotinyl)
- Liposomes were applied to the sample chamber for 30 minutes. Excess liposomes were flushed away with buffer containing 10 mM Tris-HCl (pH 7.8) and 100 mM NaCl. The flowcell was then rinsed with buffer A (40 mM Tris-HCl (pH 7.8), 1 mM DTT, 1 mM MgCl 2 , and 0.2 mg/ml BSA) and incubated for 15 minutes. Neutravidin (660 nM) in buffer A was then injected into the sample chamber and incubated for 10 minutes.
- buffer A 40 mM Tris-HCl (pH 7.8), 1 mM DTT, 1 mM MgCl 2 , and 0.2 mg/ml BSA
- biotinylated ⁇ -DNA (-10 pM) pre-stained with YOYO1 (1 dye per 600 base pairs) was injected into the sample chamber, incubated for 10 minutes, and unbound DNA was removed by flushing with buffer at 0.1 ml/min.
- the buffers also contained 100 pM YOYO1 along with an oxygen scavenging system comprised of 1% (w/v) glucose, 60 mM ⁇ -mercaptoethanol, glucose oxidase (100 units/ml) and catalase (1,560 units/ml).
- an oxygen scavenging system comprised of 1% (w/v) glucose, 60 mM ⁇ -mercaptoethanol, glucose oxidase (100 units/ml) and catalase (1,560 units/ml).
- Application of buffer flow caused the lipid-tethered DNA molecules to align along the leading edges of the diffusion barriers.
- the flow was stopped for 5 minutes allowing the DNA to diffuse towards the center of the
- TIRFM TIRFM.
- the basic design of the microscope used in this study has been previously described (A19).
- the beam intensity at the face of the prism was ⁇ 10-15 mW.
- Images were detected with a back-illuminated EMCCD detector (Photometrics, Cascade 512B).
- TIRFM images were collected using a 60x water immersion objective lens (Nikon, 1.2 NA, Plan Apo) or a 10x objective (Nikon, 0.45 NA, Plan Apo), as indicated.
- Restriction Enzymes For complete digests, 700 ⁇ l of the desired restriction enzyme in reaction buffer A (40 mM Tris-HCl (pH 7.8), 1 mM MgCl 2 , 1 mM DTT, and 0.2 mg/ml BSA) plus 50 mM NaCl and 10 mM MgCl 2 was injected at 0.2 ml/min. All restriction enzymes were purchased from NEB and the amounts of enzymes used were as follows: NheI (100 units/ml); XhoI (100 units/ml); EcoRI (100 units/ml); NcoI (50 units/ml); PvuI (50 units/ml); and SphI (50 units/ml). Images of the DNA molecules were collected before the restriction enzyme injection and after all of the enzyme solution had flown through. For partial digests, the amount of EcoRI was reduced to 20 units/ml and 700 ⁇ l was injected at 0.4 ml/min.
- E-beam lithography was used to create chromium nanoscale barriers in a defined pattern on a fused silica slide.
- ⁇ -DNA stained with YOYO1 was then assembled into curtains along the edges of the nanoscale barriers. Images were collected at 60x magnification at an acquisition rate of 10 frames per second and a time stamp is shown in the lower right corner. The movie begins with buffer flow on and the DNA extended. The flow is stopped showing that all of the DNA molecules diffuse away from the surface and the barrier edges. In the absence of flow the full length of the DNA can not be seen because it resides outside the excitation volume defined by the penetration depth of the evanescent field. Finally flow is resumed to re-extend the DNA.
- Imaging YOYO1-stained DNA curtains at lower magnification Images were captured at 10x magnification and the full field-of-view shows a 2 x 3 array of barrier sets from the surface of a slide that had a 4 x 6 array of barriers (24 identical barrier patterns in total).
- the movie was collected at 10 frames per second and a time stamp is indicated in the lower right hand corner. The movie begins with buffer flow on and the DNA extended, then flow is stopped showing that the DNA diffuses away from the surface and the barrier edges, and finally flow is resumed to re-extend the DNA.
- EXAMPLE 2 Parallel arrays of geometric nanowells for assembling DNA curtains with controlled lateral dispersion.
- the individual molecules making up the DNA curtain can be separated from one another by a user-defined distance dictated by the dimensions of the nanowells.
- a real time restriction assay that we refer to as dynamic optical restriction mapping, which can be used to rapidly identify entire sets of cleavage sites within a large DNA molecule.
- the minimal separation distance between each of the DNA molecules within the curtain is defined by the distance between the adjacent nanowells within the non-linear, geometric barrier pattern, and the total number of DNA molecules within in each well is controlled by the amount of DNA applied to the surface.
- DNA curtains made with these non-linear, geometric barrier patterns have a multitude of other potential applications.
- Resist was developed using a 3:1 solution of isopropanol to methyl isobutyl ketone (MIBK) for 2 minutes with ultrasonic agitation at 5 °C.
- MIBK isopropanol
- the substrate was then rinsed in isopropanol and dried with N 2 .
- a thin layer of chromium was deposited using a Semicore electron beam evaporator. To effect lift-off, the coated substrate was submerged in a 75°C acetone bath for 30 minutes, and then gently sonicated. Following lift-off, samples were rinsed with acetone to remove stray chromium flakes and dried with N 2 .
- Barriers were imaged using a Hitachi 4700 scanning electron microscope and a PSIA XE-100 Scanning Probe Microscope in noncontact mode. Optical images of the barriers were taken with a Nikon Eclipse ME600 at either 10x or 20x magnification (as indicated).
- the flowcells were assembled from fused silica slides (G. Finkenbeiner, Inc.) with chromium nanoscale diffusion barriers. Inlet and outlet ports were made by boring through the slide with a high-speed precision drill press equipped with a diamond-tipped bit (1.4 mm O.D.; Kassoy). The slides were cleaned by successive immersion in 2% (v/v) Hellmanex, 1 M NaOH, and 100% MeOH. The slides were rinsed with filtered sterile water between each wash and stored in 100% MeOH until use. Prior to assembly, the slides were dried under a stream of nitrogen and baked in a vacuum oven for at least 1 hour.
- a sample chamber was prepared from a borosilicate glass coverslip (Fisher Scientific) and double-sided tape ( ⁇ 25 ⁇ m thick, 3M). Inlet and outlet ports (Upchurch Scientific) were attached with hot-melt adhesive (SureBonder glue sticks, FPC Corporation). The total volume of the sample chambers was ⁇ 4 ⁇ l.
- a syringe pump (Kd Scientific) and actuated injection valves (Upchurch Scientific) were used to control sample delivery, buffer selection and flow rate.
- the flowcell and prism were mounted in a custom-built heater with computer-controlled feedback regulation to control the temperature of the sample from between 25-37°C ( ⁇ 0.1 °C), as necessary.
- DNA curtains were constructed as described (B7). All lipids were purchased from Avanti Polar Lipids and liposomes were prepared as previously described. In brief, a mixture of DOPC (1,2-dioleoyl- sn -glycero-phosphocholine), 0.5% biotinylated-DPPE (1,2-dipalmitoyl- sn -glycero-3-phosphoethanolamine-N-(cap biotinyl)), and 8% mPEG 550-DOPE (1,2-dioleoyl- sn -glycero-3-phosphoethanolamine-N-[methoxy(polyethylene glycol)-550]). Liposomes were applied to the sample chamber for 30 minutes.
- DOPC 1,2-dioleoyl- sn -glycero-phosphocholine
- biotinylated-DPPE 1,2-dipalmitoyl- sn -glycero-3-phosphoethanolamine-N-(cap biotiny
- biotinylated ⁇ -DNA (10 pM) pre-stained with 1-2 nM YOYO1 was injected into the sample chamber, incubated for 10 minutes, and unbound DNA was removed by flushing with buffer at 0.1 ml/min.
- Application of buffer flow caused the lipid-tethered DNA molecules to align along the leading edges of the diffusion barriers.
- the flow was stopped for 5 minutes allowing the DNA to diffuse towards the center of the barriers.
- the flow was started at 0.1 ml/min for 30 seconds and the flow on-off cycle was repeated 3-5 times until DNA curtains of even density formed along the diffusion barriers.
- TIRFM Imaging The basic design of the microscope used in this study has been previously described (B11). Briefly, the system is built around a Nikon TE2000U inverted microscope with a custom-made illumination system. A 488 nm, 200 mW diode-pumped solid-state laser (Coherent, Sapphire-CDHR) was used as the excitation source. The laser was attenuated as necessary with a neutral density filter and centered over the DNA curtain by means of a remotely operated mirror (New Focus). The beam intensity at the face of the prism was ⁇ 10-15 mW. Images were detected with a back-illuminated EMCCD detector (Photometrics, Cascade 512B). TIRFM images were collected using a 60x water immersion objective lens (Nikon, 1.2 NA Plan Apo), unless otherwise indicated.
- DNA molecules are first anchored by one end to a supported lipid bilayer coating the surface of the sample chamber and application of hydrodynamic force is used to push the lipid-tethered DNA molecules towards lipid diffusion barriers. Lipids within supported bilayers cannot traverse these mechanical barriers (B13-15). As a consequence, the barriers (curtain rods) also halt the forward movement of the DNA molecules, causing them to accumulate at the barrier edges where they extend into the evanescent field. As we have previously shown, molecules of ⁇ -DNA (48.5 kb) can be assembled into curtains along these barrier edges and the molecules remain at fixed lateral locations (B6).
- the peak-to-peak distance of the adjacent triangles within the patterns should dictate the minimal lateral separation of the DNA molecules that make up the curtain.
- non-linear, geometric patterns that repeat at 500 nm intervals should yield DNA molecules separated from one another by 500 nm. The separation will be greater than 500 nm if some of the wells are not occupied, yet even in this case the distances should occur in defined increments divisible by 500 nm (i.e. 500, 1000, 1500, 2000 nm, etc.). If this were true, then these non-linear, geometric barrier patterns would confer precise control over the positioning of each individual DNA making up the curtain.
- FIG. 7 Examples of the non-linear, geometric barrier patterns tested here are shown in FIG. 7 .
- E-beam electron-beam
- FIG. 7A shows an optical image of a pair of barrier sets and once assembled into a flowcell the chromium barriers will be oriented perpendicular to the hydrodynamic force with the apex of each triangle pointing in the same direction that the buffer is flowing (as indicated in FIG. 6 ).
- FIG. 7A shows an optical image of a pair of barrier sets and once assembled into a flowcell the chromium barriers will be oriented perpendicular to the hydrodynamic force with the apex of each triangle pointing in the same direction that the buffer is flowing (as indicated in FIG. 6 ).
- FIG. 7B shows an AFM image of a non-linear, geometric barrier pattern with 1 ⁇ m peak-to-peak spacing and reveals a height of just 20 nm.
- Examples of SEM images of non-linear, geometric barriers with peak-to-peak distances of 2000, 1000, 750, 500, 350, and 200 nm are shown in FIG. 7C . These images demonstrate that we can use standard lithographic techniques to construct chromium barriers with precise non-linear, geometric patterns having nanometer scale features of our desired designs.
- FIG. 9 shows examples of DNA curtains made with non-linear, geometric barrier patterns with 2000, 1000, 750, 500, 350, and 200 nm separation between adjacent nanowells ( FIG. 9A , left panels). As indicated above, these curtains are comprised of the 20 kb DNA that is fluorescently stained with the intercalating dye YOYO1.
- the number of DNA molecules that make up the curtains can be varied by modulating several different parameters, the simplest of which is the amount of DNA injected into the sample chamber (B6, B7).
- the amount of DNA injected into the sample chamber B6, B7.
- these non-linear, geometric diffusion barrier patterns if too much DNA is present, then multiple molecules of DNA will accumulate within each geometric nanowell.
- these experiments were conducted with a relatively small amount of DNA, such that less than one DNA molecule should be found per nanowell. In other words, some of the nanowells will remain unoccupied, many of the wells will have a single DNA molecule, and some of the wells will have two (or more) molecules of DNA.
- FIG. 9B shows a histogram of total integrated intensity per DNA molecule, revealing a prominent peak, and a less prominent peak.
- DNA molecules are retained within the geometric nanowells. As indicated above, DNA molecules aligned along smooth, linear chromium barriers can slip laterally along the barrier edges, and this effect can be very pronounced with shorter molecules of DNA. To illustrate this problem, a 20 kb PCR DNA fragment derived from the ⁇ DNA was labeled with YOYO1 ((B16), and see Materials and Methods). These molecules were aligned along the edge of a smooth barrier and viewed over the course of 13.5 minutes. A kymogram illustrating the lateral locations of the DNA molecules over time was then generated from a cross-section of the curtain. As shown in FIG.
- Dynamic optical restriction mapping Using these non-linear, geometric barrier patterns permits studies of even relatively small DNA fragments by eliminating their lateral mobility along the barrier edges when maintained by a constant flow force.
- the design of the curtains also yields DNA molecules that are all aligned with the same sequence orientation based upon the location of the biotin tag at a specific end of the DNA (B6).
- restriction digest of the DNA molecules within the curtain yields identical, tethered fragments whose lengths correspond to the furthest upstream cleavage site (B6).
- Complete digests can not be used to identify multiple sites cleaved by the same restriction enzyme because the downstream DNA is flushed from the sample chamber as soon as the DNA is cleaved.
- partial restriction digests can be used to generate mixed populations of DNA molecules whose lengths reflect the distribution of cleavage sites throughout the DNA.
- a complete restriction digest of the DNA can also reveal all of the fragments corresponding to each of these intermediate lengths, but only if the digest is viewed in real time and the cleavage rate is slower than the data acquisition frequency.
- the downstream fragment will be immediately flushed from the sample chamber by buffer flow, leaving behind the intact biotinylated fragment whose shortened length would correspond to the location of the cleavage site. This can happen repeatedly on the same DNA until that particular molecule is cleaved at the furthest upstream site relative to the anchored end of the DNA.
- FIG. 10 shows the DNA before the digest and FIG. 10C shows the DNA after the digest was completed, which demonstrates that all of the DNA were eventually trimmed (corresponding to the 21 kb fragment) and confirming that all of the molecules were in the identical orientation.
- FIG. 10B shows the DNA before the digest
- FIG. 10C shows the DNA after the digest was completed, which demonstrates that all of the DNA were eventually trimmed (corresponding to the 21 kb fragment) and confirming that all of the molecules were in the identical orientation.
- FIG. 10C shows examples of kymograms made from individual DNA molecules during the digestion reaction. These kymograms were selected because they provide examples where each of the five EcoRI sites can be identified. The total time required for this digest was just 30 seconds, and we anticipate that this time can be reduced significantly with further optimization. The length of the resulting fragments observed at the intermediate time points was measured and their distribution plotted as a histogram in FIG. 10D , which reveals all five of the EcoRI cuts sites in the ⁇ phage genome.
- This assay is not possible with smooth, linear barrier designs because the DNA molecules start to rapidly slip back and forth as the fragment lengths become shorter and shorter, thus interfering with measurements of the same DNA molecule over time. Thus this real time dynamic optical restriction mapping assay is greatly facilitated when used in combination with the non-linear, geometric barrier patterns because the nanowells prevent the DNA molecules from moving as they get shorter and shorter during the digest.
- DNA curtains are advantageous for analysis of protein-DNA interactions, in particular with systems that involve lateral movement of proteins along DNA (B8, B9).
- One complication of these experiments is that it is not always possible to irrefutably rule out the possibility that a protein under observation is interacting with two (or more) DNA molecules that are closely juxtaposed.
- the density of the DNA curtains can be decreased to help mitigate this issue, it still is not always possible to demonstrate that a specific protein under observation is bound to a particular DNA molecule.
- our DNA curtain assays have a demonstrated capability to enable massively parallel data acquisition, evaluation of the resulting data remains a challenge because automated image analysis programs can not readily distinguish two or more identical objects if they overlap to any significant extent.
- the non-linear, geometric barrier patterns With the advent of the non-linear, geometric barrier patterns, these problems are eliminated, because the DNA molecules are maintained at fixed distances from one another and we can verify that only one molecule is loaded in a particular well based on the fluorescence intensity of the labeled DNA.
- the non-linear, geometric patterns used here are extremely simple, yet highly effective at directing DNA molecules to defined locations on a surface.
- the ability to load and retain individual DNAs into geometric nanowells portends the future possibility of individually handling or isolating these single molecules, and we envision that the flexibility afforded by nanolithography will enable construction of intricate barrier patterns that can be used for even more complex manipulations of lipid anchored DNA molecules.
- DNA curtains and geometric nanowells have numerous potential applications pertaining to physical analysis of large DNA molecules.
- a major aspect of genome research remains characterization of large DNA fragments, and numerous approaches have been developed for manipulating, analyzing and isolating these molecules (B17-21).
- DNA curtains made up of these non-linear, geometric patterns can be used to generate optical restriction maps of the tethered DNA molecules, and because these assays are performed in the context of a microfluidic system the cleaved DNA fragments can easily be isolated for further analysis.
- EXAMPLE 3 Diffusion Gated Nanowells for Trapping and Aligning Surface Anchored DNA Molecules.
- RNA polymerase bound to a promoter and a transcription factor bound to a distal enhancer element we have developed a technology for aligning curtains of DNA wherein the constituent molecules are trapped at defined locations. This is accomplished using barriers patterns that contain long, narrow entry pores, which are used to guide single DNA molecules into individual geometric nanowells. In the absence of buffer flow the DNA molecules diffuse away from the lipid coated surface, but they can not escape the geometric nanowells over time scales ranging up to tens of minutes. These barrier designs are ideal for studying any protein-DNA interaction that involves the association of distal components bound along the same DNA chain.
- FIG. 11A illustrates the response of a surface tethered DNA molecule (shown in green throughout) to changes in applied buffer flow.
- the DNA molecule When flow is maintained the DNA molecule can be stretched parallel to the surface and is maintained within the detection volume defined by the penetration depth of the evanescent field.
- the DNA diffuses up out of the field, permitting and long distance interactions (i.e. DNA looping) between distal locations along the contour length of the molecule.
- the molecule can again be viewed along its full contour, allowing the assessment of any effects brought about by the DNA looping.
- 11B - C show the consequences of transiently terminating buffer flow with a DNA curtain assembled at a normal linear diffusion barrier (barriers are shown in black) compared to a non-linear, geometric barrier comprised of gated nanopores.
- a normal linear barrier edge as shown in FIG. 11B , termination of flow allows DNA molecules to diffuse away from the surface, as described in FIG. 11A , but the DNA also diffuses away from the edge of the barrier itself.
- the individual DNA molecules are numbered to emphasize that the order changes.
- FIG. 11C highlights the details of the gated nanowells, including the guide channels used to direct the DNA into the nanopore entry channel, and the geometric nanowell residing at the end of the nanopore.
- EXAMPLE 4 Nanofabricated Racks for Aligning Curtains of Double-Tethered DNA Molecules.
- non-linear, geometric barrier elements include a nanopore-gated staging area, which is used to irreversibly capture linear DNA molecules that are anchored by both ends to the bilayer and pushed into the staging area using hydrodynamic force. Once captured, the DNA molecules are driven in the perpendicular direction using tangentially applied force generated either using buffer flow or an electric field.
- EXAMPLE 5 Nanofabricated racks of aligned and anchored DNA molecules for imaging individual protein-DNA interactions.
- Linear barriers to lipid diffusion are used to align the DNA, and antibody coated pentagons provide solid anchor points for the free ends of the molecules.
- These double-tethered curtains of anchored DNA can be visualized using total internal reflection fluorescent microscopy under conditions that do not require the use of continuous buffer flow to stretch the DNA. This offers the potential for data acquisition without perturbing the behavior of the proteins under investigation through the application of an externally applied hydrodynamic force.
- We provide a proof-of principle demonstration that these DNA racks can be used in a 1D diffusion assay that monitors the motion of the mismatch repair protein complex Msh2-Msh6 along DNA.
- lipid-tethered DNA molecules are assembled into molecular curtains by pushing them to the leading edge of either micro- or nanoscale lipid diffusion barriers (for example, linear or non-linear, geometric barriers) through the application of a hydrodynamic force.
- microscale barriers to lipid diffusion made by manually etching a fused silica surface with a diamond-tipped scribe could be used to align hundreds of lipid-tethered DNA molecules (C3).
- C1, C2 More recently we have established methods for fabricating barriers with nanoscale dimensions that allow for much more precise control over both the location and lateral distribution of the DNA molecules
- nanofabricated DNA curtains permit simultaneous visualization of thousands of individual DNA molecules that are perfectly aligned with respect to one another, and can be used for massively parallel data acquisition from thousands of individual protein-DNA complexes in real time using a robust experimental platform that is amenable to a wide variety of biological applications.
- buffer flow is not problematic for many types of measurements, however, it can potentially impact the behavior of bound proteins or protein complexes, and the magnitude of this impact can scale in proportion to the hydrodynamic radius of the molecules under observation.
- the influence of buffer flow is especially apparent during measurements involving proteins that slide on DNA by one-dimensional diffusion, because an applied flow force can strongly bias the direction that the sliding proteins travel along the DNA.
- the arrayed pentagons serve as solid anchor points positioned at a defined distance downstream from the linear barriers and are coated with antibodies directed against either digoxigenin or bromodeoxyuridine, which are covalently attached to the free ends of the DNA molecules.
- digoxigenin or bromodeoxyuridine which are covalently attached to the free ends of the DNA molecules.
- Nanofabrication Fused silica slides were cleaned in NanoStrip solution (CyanTek Corp, Fremont, CA) for 20 minutes, then rinsed with acetone and isopropanol and dried with N 2 .
- the slides were spin-coated with a bilayer of polymethylmethacrylate (PMMA), molecular weight 25K, 3% in anisole and 495K, 1.5% in anisole (MicroChem, Newton, MA), followed by a layer of Aquasave conducting polymer (Mitsubishi Rayon). Each layer was spun at 4,000 rpm for 45 seconds using a ramp rate of 300 rpm/s.
- PMMA polymethylmethacrylate
- anisole Molecular weight
- anisole MocroChem, Newton, MA
- Aquasave conducting polymer Mitsubishi Rayon
- Polygon patterns for non-linear, geometric barriers and linear barriers were written by Ebeam lithography using an FEI Sirion scanning electron microscope equipped with a pattern generator and lithography control system (J. C. Nabity, Inc., Bozeman, MT). After patterning, Aquasave was rinsed off with deionized water. Resist was developed using a 3:1 solution of isopropanol to methyl isobutyl ketone (MIBK) for 1 minute with ultrasonic agitation at 5°C. The substrate was then rinsed in isopropanol and dried with N 2 .
- MIBK isopropanol to methyl isobutyl ketone
- a 15-20 nm layer of gold atop a 3-5 nm adhesion layer of either chromium or titanium was deposited using a Semicore electron beam evaporator. Liftoff was effected at 80°C in a 9:1 ratio of methylene chloride to acetone. Alternatively, barriers were made out of just a 15-20 nm layer of chromium, as previously described. Following liftoff, samples were rinsed with acetone to remove stray chromium flakes and dried with N 2 . Barriers were imaged using a Hitachi 4700 scanning electron microscope and a PSIA XE-100 Scanning Probe Microscope in noncontact mode. Optical images of the barriers were taken with a Nikon Eclipse ME600 at either 50x or 100x magnification (as indicated).
- the flowcells were assembled from fused silica slides (G. Finkenbeiner, Inc.) with chromium nanoscale diffusion barriers. Inlet and outlet ports were made by boring through the slide with a high-speed precision drill press equipped with a diamond-tipped bit (1.4 mm O.D.; Kassoy). The slides were cleaned by successive immersion in 2% (v/v) Hellmanex, 1 M NaOH, and 100% MeOH. The slides were rinsed with filtered sterile water between each wash and stored in 100% MeOH until use. Prior to assembly, the slides were dried under a stream of nitrogen and baked in a vacuum oven for at least 1 hour.
- a sample chamber was prepared from a borosilicate glass coverslip (Fisher Scientific) and double-sided tape ( ⁇ 25 ⁇ m thick, 3M). Inlet and outlet ports (Upchurch Scientific) were attached with hot-melt adhesive (SureBonder glue sticks, FPC Corporation). The total volume of the sample chambers was ⁇ 4 ⁇ l.
- a syringe pump (Kd Scientific) and actuated injection valves (Upchurch Scientific) were used to control sample delivery, buffer selection and flow rate.
- the flowcell and prism were mounted in a custom-built heater with computer-controlled feedback regulation to control the temperature of the sample from between 25-37°C ( ⁇ 0.1 °C), as necessary.
- DNA curtains were constructed as described. All lipids were purchased from Avanti Polar Lipids and liposomes were prepared as previously described. In brief, a mixture of DOPC (1,2-dioleoyl- sn -glycero-phosphocholine), 0.5% biotinylated-DPPE (1,2-dipalmitoyl- sn -glycero-3-phosphoethanolamine-N-(cap biotinyl)), and 8-10% mPEG 550-PE (1,2-dioleoyl- sn -glycero-3-phosphoethanolamine-N-[methoxy(polyethylene glycol)-550]).
- DOPC 1,2-dioleoyl- sn -glycero-phosphocholine
- biotinylated-DPPE 1,2-dipalmitoyl- sn -glycero-3-phosphoethanolamine-N-(cap biotinyl)
- 8-10% mPEG 550-PE 1,2-
- the mPEG is does not affect bilayer formation or assembly of the DNA curtains, but rather serves to further passivated the surface against nonspecific adsorption of quantum dots (which we use in our studies of protein-DNA interactions).
- Liposomes were applied to the sample chamber in three injections of 200 ⁇ l followed by 5 minute incubations. Excess liposomes were flushed away with 1 ml of buffer A, which contained 10 mM Tris-HCl (pH 7.8) plus 100 mM NaCl, and the bilayer was incubated for an addition 30 minutes. Buffer A plus 25 ⁇ g/ml anti-DIG Fab (Roche) or anti-BrdU IgG (Sigma) was then injected into the sample chamber and incubated for 30 minutes.
- the sample chamber was then flushed with 1 ml of buffer B, which contained 40 mM Tris-HCl (pH 7.8), 1 mM DTT, 1 mM MgCl 2 , and 0.2 mg/ml BSA, and incubated for an additional 5 minutes.
- 1 ml of buffer A containing Neutravidin (330 nM) was then injected into the sample chamber and incubated for 20 minutes.
- the flowcell was then rinsed with 3 ml of buffer B to remove any unbound Neutravidin.
- ⁇ -DNA (20 pM) labeled at one end with biotin and at the other end with digoxigenin (see below) and pre-stained with 1-2 nM YOYO1 was injected into the sample chamber in five 200 ⁇ l aliquots, with a 2-3 minute incubation period following each injection.
- the DNA was then aligned at the linear barriers using a flow rate of 0.02 ml/min, and this rate was then increased to 2-3 ml/min to anchor the second end of the DNA molecules.
- DNA substrates were made by ligating oligonucleotides to the 12 nucleotide overhangs at the end of the ⁇ phage genome (48.5 kb).
- Ligation mixes (1 ml total volume) contained 4 nM ⁇ DNA (Invitrogen), 1 ⁇ M biotinylated oligonucleotiode (5'-pAGG TCG CCG CCC [BioTEG]-3' [SEQ ID NO: 1]), 1 ⁇ M BrdU labeled oligonulceotide (or DIG labeled oligonucleotide; 5'-pGGG CGG CGA CCT [BrdU]-3' [SEQ ID NO: 2] or 5'-pGGG CGG CGA CCT [DIG]-3' [SEQ ID NO: 3]), and 1X ligase buffer (NEB).
- reaction mix was warmed to 65°C for 10 minutes and then cooled slowly to room temperature. After cooling, ligase was added (T4 DNA ligase (400U/ ⁇ l) or Taq ligase (40U/ ⁇ l); NEB) and the mixture was incubated overnight at 42°C. Reactions performed with T4 ligase were then heat inactivated at 65°C for 10 minutes, and the ligated DNA products were purified over a Sephacryl S200HR column (GE Healthcare) run in 10 mM Tris-HCl (pH 7.8), 1 mM EDTA, plus 150 mM NaCl. The purified DNA was stored at -20°C.
- oligonucleotide For inserting an oligonucleotide at only position 33,779-33,791 on ⁇ 500ul DNA (200 pM; labeled at the ends with biotin and BrdU) was incubated for 2 h with the nicking enzyme Nt.BstNBI (50 U; NEB) at 55°C in buffer containing 10mM Tris-HCl (pH 7.8), 10 mM MgCl 2 , 150 mM NaCl. The enzyme was heat denatured by incubation at 80°C for 20 min.
- oligonucleotide 5'-pTTC AGA GTC TGA CTT TT[DIG]-3' [SEQ ID NO: 5]
- ATP was then added to a final concentration of 1 mM along with 2,000 units of T4 ligase, and the reaction was incubated at room temp. for 90 min.
- the ligase was then heat denatured by incubation at 65°C for 20 min.
- TIRFM and ID diffusion assays The microscope used in this study has been previously described (C3).
- C3 The microscope used in this study has been previously described (C3).
- the system is built around a Nikon TE2000U inverted microscope with a custom-made illumination system.
- the laser was attenuated as necessary with a neutral density filter and centered over the DNA curtain by means of a remotely operated mirror (New Focus).
- the beam intensity at the face of the prism ways ⁇ 10-15 mW. Images were detected with a back-illuminated EMCCD detector (Photometrics, Cascade 512B).
- TIRFM images were collected using a 60x water immersion objective lens (Nikon, 1.2 NA Plan Apo), unless otherwise indicated.
- one end of the DNA is first anchored via a biotin-neutravidin interaction to a supported lipid bilayer coating the surface of the sample chamber ( FIG. 13B and FIG. 13C ).
- the molecules are randomly distributed on the surface, but lie primarily outside of the detection volume defined by the penetration depth of the evanescent field (-150-200 nm).
- Application of flow pushes the DNA through the sample chamber with one end remaining anchored to the bilayer.
- the first pattern elements are linear barriers to lipid diffusion, which are oriented perpendicular to the direction of flow at strategic locations in the path of the DNA ( FIG. 13B and FIG. 13C ); these linear barriers are designed to halt the movement of the lipid-tethered DNA molecules causing them to accumulate at leading edge of the barriers where they then extend parallel to the surface.
- the second elements of the pattern are a series of arrayed pentagons (for example, a non-linear, geometric barrier) positioned behind the linear barriers and separated from one another by small nanochannels.
- the non-linear, geometric shape of the pentagons is intended to act as a funnel and direct any lipid-tethered DNA molecules through the nanochannels so that they do not accumulate at the leading edge of the pentagons, but rather are pushed along the surface until they encounter the next successive linear barrier in the pattern.
- the distance between the linear barriers and the pentagons is optimized for the length of the DNA to be used for the experiments.
- the pentagons themselves present a large surface that can be coated with antibodies directed against digoxigenin (DIG), which is covalently linked to the ends of the DNA opposite the ends bearing the biotin tag.
- DIG digoxigenin
- the distance between each of the successive linear barriers should influence the density of aligned DNA because the total number of molecules anchored to the bilayer is directly proportional to the area encompassed by the bilayer upstream from each barrier.
- Varying the total distance between adjacent barrier sets on the flowcell surface should yield double-tethered DNA curtains of varying density, enabling the user to scan the surface for regions with an appropriate number of molecules for an experiment. Therefore the patterns were designed with separation distances of either 0.1, 0.2, 0.3, 0.4, or 0.5 ⁇ m between the adjacent sets of barriers ( FIG. 13D ).
- FIGS. 14 and 19 show the characterization of a DNA rack made by Ebeam lithography and highlights specific features of the pattern geometry deemed critical for its function.
- FIG. 14A shows a low magnification optical image of the overall pattern design, indicating the variable spacing between the barrier sets within the pattern. A higher magnification optical image including the dimensions of critical pattern parameters is presented in FIG. 14B.
- FIG. 14C shows measurements of these parameters using atomic force microscopy (AFM).
- FIG. 14D shows characterization of the patterns with scanning electron microscopy (SEM).
- the height of the patterns elements was on the order of 20-25 nm
- the width of the nanochannels was 500 nm
- the distance between the leading edge of the linear barriers and the center of the pentagon array was either 12 or 13 ⁇ m, as specified.
- This distance was specifically selected for use with ⁇ -DNA, which is 48,502 base pairs with a fully extended contour length of approximately 16.5 ⁇ m, thus 11 to 13 ⁇ m would correspond to a mean extended length of ⁇ 70% to 80% that of the full contour length, respectively.
- the antibodies could potentially bind both the linear barriers as well as the pentagons, but the very small surface area of the linear barriers should ensure selective adsorption of more antibody to the much larger pentagons.
- the free Fab was rinsed from the flowcell and replaced with buffer containing 0.2 mg/ml BSA, which served as a nonspecific blocking agent to passivate any remaining exposed surfaces.
- DNA stained with the fluorescent intercalating dye YOYO1 was then injected into the sample chamber, incubated briefly without buffer flow, and then buffer flow was applied to push the anchored molecules into the linear barriers. Buffer flow was then terminated and the anchored DNA molecules imaged by TIRFM.
- this procedure yielded curtains of DNA molecules that remained fully extended and visible even though no buffer was flowing through the sample chamber. Any DNA molecules that failed to become anchored by the DIG labeled end remained near the linear barriers, but only the ends of the molecules could be observed rather than their full contour lengths. These single-tethered DNA molecules gradually diffused away from the barrier edges and could also be pushed away from the barrier edge simply by reversing the direction of buffer flow ( FIG. 15 ), but the double-tethered DNA molecules remained anchored to their original locations, providing additional conformation that the molecules making up the curtain are anchored in the desired configuration. The number of DNA molecules at each of the different barrier locations was proportional to the distance between the adjacent linear barriers.
- DNA molecules anchored between the barriers was nonspecifically adhered to the sample chamber surface along its contour length, rather than suspended above the inert bilayer, then introduction of a double-stranded break should not cause the molecules to retract from the surface.
- the DNA were only anchored by the biotin and DIG-tagged ends as designed and suspended above the bilayer, then a double strand break in the strands should cause the molecules to retract away from the surface.
- DNA molecules randomly break they can immediately retract from the surface as they diffuse out of the evanescent field and disappear from view. DNA molecules can only interact with the sample chamber surface through their anchored ends, and cannot interact nonspecifically with the lipid bilayer.
- orientation of the DNA The differential chemistries used to anchor the two ends of the DNA was predicted to define the orientation of the DNA molecules within the curtains. Specifically, the biotinylated end should be anchored at the edge of the linear barrier and the other end should be at the pentagons, and based on this design all of the molecules should be in the exact same orientation. If the DNA molecules were aligned as expected, then a fluorophore located at a single specific site within the DNA and offset from its center should appear as a fluorescent "line" spanning the DNA curtain. The line should be oriented perpendicular to the long axis of the extended DNA molecules and should coincide precisely with the know location of the fluorescent tag.
- the fluorescent tags should appear as two lines demarking each of the two possible orientations of the DNA.
- the molecules were labeled at the free ends with BrdU, and labeled at a specific internal position with DIG.
- the internal labels were made using an oligonucleotide replacement strategy wherein (see Materials and Methods). Experiments with DNA curtains anchored by a single end confirmed that the fluorescent tags were present at a single location within the DNA molecules as dictated by the sequences of the oligonucleotides.
- the double-tethered curtains were then assembled using pentagons coated with anti-BrdU antibodies, and after assembly the DIG tags with labeled with anti-DIG coated Qdots. As shown in FIG. 16 , the anti-DIG Qdots were all aligned with one another, confirming the orientation of the DNA molecules.
- Msh2-Msh6 can diffuse in one-dimension along duplex DNA (C6) (see also FIGS. 50 , 51 , 52 , 53 , 54 , and 55 ).
- Msh2-Msh6 is an essential component of the post-replicative mismatch repair machinery and is responsible for locating and initiating repair of biosynthetic DNA replication errors.
- Our initial studies with Msh2-Msh6 relied upon DNA molecules that were tethered by either end to neutravidin nonspecifically absorbed to a fused silica surface that was otherwise coated with a lipid bilayer.
- mismatch repair protein complex Mlh1-Pms1 For these experiments we used the mismatch repair protein complex Mlh1-Pms1, and it was labeled with a single quantum dot via a FLAG epitope tag that was engineered into the Mlh1 subunit.
- the labeled proteins were injected into a flowcell containing a curtain of double tethered DNA molecules and videos were collected over a 60-second period.
- FIG. 17A we could readily detect binding of Mlh1-PMs1 to the DNA molecules that were aligned and anchored on the surface. There were approximately 100 DNA molecules and 250 DNA-bound proteins observed in this single field of view, illustrating the improvement of this approach compared to our previous technique for making double tethered DNA molecules.
- the proteins bound to the DNA rapidly diffused along the DNA molecules, and this motion was revealed in kymograms made from representative examples of molecules within the DNA curtains ( FIG. 17B ). As with the naked DNA molecules, the protein-bound DNA molecules also retracted from view when the DNA strands were broken, verifying that there were no nonspecific interactions with the surface.
- FIGS. 56 , 57 , 58 , 59 , 60 , 61 and 62 See also FIGS. 56 , 57 , 58 , 59 , 60 , 61 and 62 for additional studies pertaining to double tethered curtains used to visualize Mlh1 diffusion as well as the diffusion of the Mlh1-Pms1 complex.
- EXAMPLE 6 Assessing mechanisms of Msh2-Msh6 and Mlh1-Pms1 mobility along arrays of intersecting DNA molecules
- MMR postreplicative mismatch repair
- an assay that enables us to determine whether Msh2-Msh6 and/or Mlh1-Pms1 can travel along DNA while employing one or more of these alternative mechanisms.
- This new assay relies upon nanofabricated metallic structures for arranging individual DNA molecules into crisscrossed patterns suspended above the surface of a microfluidic sample chamber otherwise coated with a lipid bilayer. We used these substrates to determine whether or not Msh2-Msh6 and/or Mlh1-Pms1 could transfer directly from one strand of DNA to another as the proteins slid past the junctions between intersecting DNA molecules.
- MMR is conserved from bacteria to man. MMR involves various proteins, such as MutS ⁇ (which comprises Msh2-Msh6), MutL ⁇ (which comprises Mlh1-Pms1), ExoI, RPA, PCNA, pol ⁇ , of which MutS ⁇ and MutL ⁇ will be discussed herein. Defects in this process result in 100-1000X increase in mutation frequency. For example, defects in MMR is associated with a cancer-prone syndrome, hereditary nonpolyposis colorectal cancer (HNPCC). Up to 90% of HNPCC cases are due to mutations in MSH2 or MLH1.
- HNPCC hereditary nonpolyposis colorectal cancer
- MMR Postreplicative mismatch repair
- MMR In eukaryotes, MMR involves up to eleven different proteins, including Msh2-Msh6 (MutS ⁇ ) and Mlh1-Pms1 (MutL ⁇ ), both of which are necessary for the initial stages of the repair reaction. Cancer-associated mutations can be mapped to the MSH and MLH genes, indicating the importance of these proteins in genome maintenance. Msh2-Msh6 in a heterodimer comprised of two MutS homologs, and is necessary for initial mismatch recognition and binding. Mlh1-Pms1 interacts with Msh2-Msh6 after mismatch recognition and is thought to coordinate downstream steps in the repair pathway.
- Mlh1-Pms1 ATP-binding and hydrolysis can provoke conformational changes in Mlh1-Pms1 necessary to regulate these protein-protein interactions.
- Homologs of MutH are not found in eukaryotes, but Mlh1-Pms1 itself is a latent endonuclease that is activated in the presence of Msh2-Msh6, PCNA, RFC, mismatched DNA, and ATP. This endonuclease activity is necessary for processing the daughter DNA strand during repair. How the daughter stand is identified remains unclear because the strand discrimination signals in eukaryotes are unknown.
- MMR proteins It is necessary for the MMR proteins to communicate information between the lesion and the distal strand discrimination signal. The mechanism by which this communication occurs has been the subject of intensive investigation. Accumulating evidence supports the idea that 1D diffusion is an integral aspect of MMR protein function (see FIG. 49 ). In support of this, we have visualized Msh2-Msh6 at the single molecule level using total internal reflection fluorescence microscopy (TIRFM) and demonstrated that the protein can rapidly diffuse in one dimension along DNA. We have also demonstrated that Mlh1-Pms1 can also diffuse on DNA, and it travels an order of magnitude faster that Msh2-Msh6.
- TRFM total internal reflection fluorescence microscopy
- the approach for making arrays of intersecting DNA molecules relied upon a combination of hydrodynamic force and diffusion barriers (such as non-linear, geometric nanoscale diffusion barriers) to control the organization of DNA molecules anchored by one end to a lipid bilayer via a biotin-neutravidin connection.
- hydrodynamic force and diffusion barriers such as non-linear, geometric nanoscale diffusion barriers
- diffusion barriers such as non-linear, geometric nanoscale diffusion barriers
- a key feature of the current design is that the different pattern elements are organized into squares wherein two adjacent sides are comprised of linear barriers, and the other two sides are non-linear, geometric barriers made up of arrayed pentagons.
- the patterns are placed at the center of a four-channel flowcell such that each of the linear barriers is oriented perpendicular to one of the two buffer inlet channels.
- the linear elements serve as diffusion barriers, which cannot be traversed by the lipids within the bilayer.
- Arrays of pentagons are positioned downstream from the linear barriers and serve as solid attachment points for the other end of the DNA.
- the pentagons are nonspecifically coated with antibodies directed against digoxigenin, which is covalently attached to the free ends of the DNA.
- digoxigenin which is covalently attached to the free ends of the DNA.
- the triangular faces of the pentagons are designed to funnel DNA into the channels between each adjacent pentagon to minimize accumulation of DNA molecules within the interior of the square patterns.
- FIGS. 21 B-E show examples of SEM (scanning electron microscopy), optical, and AFM (atomic force microscopy), images of patterns made with thin layers of gold (Au) deposited on a fused silica surface by Ebeam lithography. The dimensions of critical pattern parameters are indicated.
- the linear barrier elements were about 100 nm wide.
- the pentagons were 2 ⁇ m in length and 1 ⁇ m in width, and each pentagon was separated from its nearest neighbors by channels that were 400 nm in width.
- the height of the different metallic elements was about 20-25 nm, and the distance between the leading edge of the linear barrier elements and the center of the arrayed pentagons was 12 ⁇ m.
- This distance was specifically selected for use with ⁇ -DNA (48,502 bp, 16.5 ⁇ m), such that the anchored molecules would be extended to ⁇ 70-80% of their full length, depending upon where the ends were anchored within the pentagons. This distance was chosen so as not to stretch the DNA beyond its natural length and avoid deformation of the B-form geometry. Moreover, we have previously conducted 1D diffusion experiments with both Msh2-Msh6 and Mlh1-Pms1 using DNA stretched to the same extent.
- Assembly of the crisscrossed DNA curtains involved the sequential addition of different components to achieve the desired substrate configuration.
- the surfaces of the flowcell were first coated with a lipid bilayer containing a small fraction (0.5%) of biotinylated lipid.
- the inert bilayer covers the exposed fused silica, but can not form over the gold surface patterns, leaving the metallic surfaces exposed to solution.
- Anti-DIG Fab fragments were then injected into the sample chamber, and incubated for a brief period, allowing them to adhere to any surfaces not protected by the lipid bilayer.
- the large surface area of the pentagons relative to the much smaller linear barriers ensures that the pentagons are selectively coated with more antibodies.
- FIG. 22 shows examples of YOYO1 stained DNA molecules that were aligned and anchored to the metallic racks.
- One end of the DNA was linked to the lipid bilayer through a biotin-neutravidin connection, and the other end of the DNA was labeled with digoxigenin (DIG) and coupled to the pentagons via nonspecifically adsorbed anti-DIG Fab fragments.
- DIG digoxigenin
- No buffer was flowing during image acquisition, confirming that the DNA molecules were anchored by both the biotinylated and digoxigenin labeled ends.
- the anchored DNA molecules are oriented at 90° relative to one another ensuring that they are in close physically proximity only at the intersecting points.
- Msh2-Msh6 can travel along DNA by 1D diffusion and that the observed motion is consistent with a mechanism involving a rotational component wherein the proteins continually track the phosphate backbone.
- this motion appears to involve continuous contact between Msh2-Msh6 and the phosphate backbone with no obvious evidence that the linear motion included any hops or jumps along the DNA.
- Mlh1-Pms1 can (or cannot) directly transfer between crossed DNA molecules.
- Mlh1-Pms1 can also slide along DNA, but travels roughly an order of magnitude more rapidly than Msh2-Msh6, suggesting that these two protein complexes move via fundamentally distinct mechanisms.
- Msh2-Msh6 is a compact heterodimeric complex that engages DNA through close contact with the phosphate backbone.
- Mlh1-Pms1 has N- and C-terminal domains separated by long linker arms that are thought to encircle DNA.
- bulk biochemical experiments have revealed that Mlh1-Pms1 binds tightly and nonspecifically to DNA, with a strong preference for circular substrates, and does not dissociate over time scales spanning several minutes.
- Mlh1-Pms1 can transfer to a competitor DNA in solution, suggesting that the addition of excess competitor DNA provokes dissociation from the initial bound substrate.
- HA-tagged Msh2-Msh6 and FLAG-tagged Mlh1-Pms1 were purified from S. cerevisiae as previously described.
- the protein complexes were labeled with quantum dots (Invitrogen) conjugated to either anti-HA or anti-FLAG, as appropriate.
- Quant dots Invitrogen conjugated to either anti-HA or anti-FLAG, as appropriate.
- the epitope-tagged proteins are fully functional for MMR in vivo, and the labeled proteins retained wild-type DNA binding activities in gel shift and filter-binding assays, as previously described.
- Nanofabrication Fused silica slides were cleaned in NanoStrip solution (CyanTek Corp, Fremont, CA) for 20 minutes, then rinsed with acetone and isopropanol and dried with N 2 .
- the slides were spin-coated with a bilayer of polymethylmethacrylate (PMMA), molecular weight 25K, 3% in anisole and 495K, 1.5% in anisole (MicroChem, Newton, MA), followed by a layer of Aquasave conducting polymer (Mitsubishi Rayon). Each layer was spun at 4,000 rpm for 45 seconds using a ramp rate of 300 rpm/s.
- PMMA polymethylmethacrylate
- anisole Molecular weight
- anisole MocroChem, Newton, MA
- Aquasave conducting polymer Mitsubishi Rayon
- a 15-20 nm layer of gold atop a 3-5 nm adhesion layer of either chromium or titanium was deposited using a Semicore electron beam evaporator. Liftoff was effected at 80°C in a 9:1 ratio of methylene chloride to acetone. Following liftoff, slides were rinsed with acetone and dried with N 2 . Barriers were imaged using a Hitachi 4700 scanning electron microscope and a PSIA XE-100 Scanning Probe Microscope in noncontact mode. Optical images of the barriers were collected with a Nikon Eclipse ME600.
- the flowcells were assembled from fused silica slides (G. Finkenbeiner, Inc.) with chromium nanoscale diffusion barriers. Inlet and outlet ports were made by boring through the slide with a high-speed precision drill press equipped with a diamond-tipped bit (1.4 mm O.D.; Kassoy). The slides were cleaned by successive immersion in 2% (v/v) Hellmanex, 1 M NaOH, and 100% MeOH. The slides were rinsed with filtered sterile water between each wash and stored in 100% MeOH until use. Prior to assembly, the slides were dried under a stream of nitrogen and baked in a vacuum oven for at least 1 hour.
- a sample chamber was prepared from a borosilicate glass coverslip (Fisher Scientific) and double-sided tape ( ⁇ 25 ⁇ m thick, 3M). Inlet and outlet ports (Upchurch Scientific) were attached with hot-melt adhesive (SureBonder glue sticks, FPC Corporation). The total volume of the sample chambers was ⁇ 4 ⁇ l.
- a syringe pump (Kd Scientific) and actuated injection valves (Upchurch Scientific) were used to control sample delivery, buffer selection and flow rate.
- the flowcell and prism were mounted in a custom-built heater with computer-controlled feedback regulation to control the temperature of the sample from between 25-37°C ( ⁇ 0.1 °C), as necessary.
- DNA curtains were constructed as described. All lipids were purchased from Avanti Polar Lipids and liposomes were prepared as previously described. In brief, a mixture of DOPC (1,2-dioleoyl- sn -glycero-phosphocholine), 0.5% biotinylated-DPPE (1,2-dipalmitoyl- sn -glycero-3-phosphoethanolamine-N-(cap biotinyl)), and 8% mPEG 550-DOPE (1,2-dioleoyl- sn -glycero-3-phosphoethanolamine-N-[methoxy(polyethylene glycol)-550]).
- DOPC 1,2-dioleoyl- sn -glycero-phosphocholine
- biotinylated-DPPE 1,2-dipalmitoyl- sn -glycero-3-phosphoethanolamine-N-(cap biotinyl)
- mPEG 550-DOPE 1,2-di
- the mPEG is does not affect bilayer formation or assembly of the DNA curtains, but rather serves to further passivated the surface against nonspecific adsorption of quantum dots (which we use in our studies of protein-DNA interactions).
- Liposomes were applied to the sample chamber for 30 minutes. Excess liposomes were flushed away with buffer containing 10 mM Tris-HCl (pH 7.8) and 100 mM NaCl. The flowcell was then rinsed with buffer A (40 mM Tris-HCl (pH 7.8), 1 mM DTT, and 1 mM MgCl 2 ) and incubated for 15 minutes.
- Buffer A plus 30 ⁇ g/ml anti-DIG Fab (Roche) was then injected into the sample chamber and incubated for 20 minutes.
- the sample chamber was then flushed with buffer A plus and 0.2 mg/ml BSA for 5 minutes.
- Neutravidin (330 nM) in buffer A was then injected into the sample chamber and incubated for 20 minutes.
- ⁇ -DNA (15-20 pM) labeled at one end with biotin and at the other end with digoxigenin and pre-stained with 1-2 nM YOYO1 was injected into the sample chamber, incubated for 10 minutes, and unbound DNA was removed by flushing with buffer at 0.1 ml/min.
- buffer flow caused the lipid-tethered DNA molecules to align along the leading edges of the diffusion barriers.
- TIRFM and data analysis The basic design of the microscope used in this study has been previously described. In brief, the system is built around a Nikon TE2000U inverted microscope with a custom-made illumination system. For this study, a 488 nm, 200 mW diode-pumped solid-state laser (Coherent, Sapphire-CDHR) was used as the excitation source. The laser was attenuated as necessary and centered over the DNA curtain by means of a remotely operated mirror (New Focus). The beam intensity at the face of the prism was ⁇ 10-15 mW. Images were detected with a back-illuminated EMCCD detector (Photometrics, Cascade 512B). TIRFM images were collected using a 60x water immersion objective lens (Nikon, 1.2 NA Plan Apo), unless otherwise indicated.
- Msh2-Msh3 was purified as described in Surtees, J. A.; Alani, E. J. Mol. Biol. 2006, 360, 523-536 and TIRFM experiments with Msh2-Msh3 were performed essentially as described for our previously published experiments with Msh2-Msh6 ( Gorman, J.et al.. Mol. Cell 2007, 28, 359-370 ).
- HA tagged Msh2-Msh3 was incubated with anti-HA antibody conjugated quantum dots at 1:2 protein:quantum dot ratio for 15 min in Buffer A plus 50 mM NaCl. 50 ⁇ L of 1.5 nM quantum dot tagged Msh2-Msh3 was then injected at 0.1 mL/min to allow efficient binding.
- This transient pause in buffer flow is used as a control to verify that the observed proteins are bound only to the DNA and are not bound to the flowcell surface (compare FIG. 23 , panels A and B).
- Msh2-Msh3 bound to the curtains of ⁇ -DNA, but did not display any favored regions or sites for undamaged, homoduplex DNA substrates.
- FIG. 24A - D shows representative examples of YOYO1-stained DNA curtains assembled at a non-linear, geometric diffusion barrier pattern with either 1000 nm spacing ( FIG. 24A - B ) or 1900 nm spacing ( FIG. 24C-D ) between the adjacent geometric nanowells.
- FIG. 24A - B shows representative examples of YOYO1-stained DNA curtains assembled at a non-linear, geometric diffusion barrier pattern with either 1000 nm spacing ( FIG. 24A - B ) or 1900 nm spacing ( FIG. 24C-D ) between the adjacent geometric nanowells.
- FIG. 24A and FIG. 24C show representative examples of YOYO1-stained DNA curtains assembled at a non-linear, geometric diffusion barrier pattern with either 1000 nm spacing ( FIG. 24A - B ) or 1900 nm spacing ( FIG. 24C-D ) between the adjacent geometric nanowells.
- FIG. 24A and FIG. 24C shows representative examples of YOYO1-s
- FIG. 24E highlights examples of DNA curtains made with non-linear, geometric barrier patterns with 1900, 1000, 750, 500, 350, and 200 nm separation between adjacent nanowells. These curtains are comprised of the 23 kb DNA that is fluorescently stained with the intercalating dye YOYO1. To verify that this design pattern yielded DNA molecules with the desired spacing we plotted signal intensity of the stained DNA versus its lateral location along the barrier edge, and these plots confirmed peak-to-peak distances consistent with values from designs of the non-linear, geometric barrier patterns ( FIG. 24F ). The 1900, 1000, 750, 500, 350, and 200 nm barriers yielded separation distances corresponding to the pattern designs.
- DNA molecules aligned along smooth, linear chromium barriers can slip laterally along the barrier edges, and this effect becomes more pronounced with shorter molecules of DNA.
- YOYO1 see Materials and Methods in Example 2
- Kymograms illustrating the lateral locations of the DNA molecules over a period of 13.5 s were then generated from a cross-section of the curtain. As shown in FIG. 25 , the fluorescently labeled molecules exhibited movement consistent with lateral slippage of the DNA along the barrier edge even over periods spanning just a few seconds.
- FIG. 26A shows sections of YOYO1-stained DNA curtains with differing amounts of DNA assembled at barriers with 1900 nm spacing between the adjacent geometric nanowells. These three images were collected from a single barrier set, as the design of the barriers themselves effectively provides a gradient of differing DNA concentrations. This occurs because the guide channel openings that direct the tethered DNA molecules to the nanowell-containing barriers are all similar widths, whereas the different tiers within the barrier set get incrementally wider. Fluorescence cross-sections of the DNA molecules are shown in FIG. 26B and the relative signal intensity corresponding to the different numbers of DNA molecules are indicated by the horizontal bars. Single DNA molecules were readily identified because they exhibited the lowest observed relative signal intensity (compare the upper, middle and lower panels in FIG.
- FIG. 26A-B shows a histogram of the number of DNA molecules per nanowell, demonstrating that under the conditions used for assembling the DNA curtains most of the nanowells (44%) contained only one molecule of DNA, whereas 8% had no DNA, 13% had 2 DNA molecules, 18% had 3 DNA molecules, and 17% had 4 or more molecules of DNA.
- the DNA molecules were partially digested in real time with very low concentrations of the restriction endonuclease AVaI ( FIG. 26D-E , and see below). If just one DNA molecule is present in a nanowell, then stochastic cleavage events will coincide with the complete and near instantaneous loss of any DNA downstream from the corresponding cleavage site because the YOYO1-stained DNA fragment liberated by the AVaI cut will be washed away by buffer flow.
- the downstream fragment will be immediately flushed from the sample chamber by buffer flow, leaving behind the intact biotinylated fragment whose shortened length would correspond to the location of the cleavage site. This can happen repeatedly on the same DNA until that particular molecule is cleaved at the furthest upstream site relative to the anchored end of the DNA.
- the large number of DNA molecules that can be viewed with these DNA curtains makes it possible to detect all of the potential sites within the DNA, and the geometric nanowells prevent the DNA molecules from slipping back and forth after they are cleaved. Eventually all of the DNA molecules will be cut to a final length corresponding to the furthest upstream restriction site.
- this real time digest is dynamic optical restriction mapping and an example of such an assay is shown in FIG. 27A-B , using the restriction enzymes Eco RI and Bam HI, respectively. These kymograms were selected because they provide examples where each of the five Eco RI sites or five Bam HI sites can be identified. The total time required for this digest was just under 120 s.
- This assay is not possible with smooth barrier designs because the DNA molecules start to rapidly slip back and forth as the fragment lengths become shorter and shorter, thus interfering with measurements of the same DNA molecule over time.
- this real time dynamic optical restriction mapping assay is greatly facilitated when used in combination with barrier patterns comprised of the geometric nanowells.
- Nucleosomes are the fundamental unit of organization in eukaryotic chromatin and contribute to all aspects of DNA metabolism. The importance of chromatin structure has driven efforts to establish computational methods for predicting genome-wide nucleosome distributions based on intrinsic sequence preferences. Here we use high-throughput single-molecule imaging of nanofabricated DNA curtains to directly determine intrinsic energy landscapes for nucleosome deposition on model substrates. We then ask whether in silico predictions accurately reflect course-grain features of the experimentally derived intrinsic energy landscapes. Our results show that nucleosome distribution patterns were anticorrelated with predictions from the widely cited model of Segal et al D1 , but were strongly correlated with the more recent model of Field et al D2 .
- nucleosomes consist of ⁇ 147-base pairs (bp) of DNA wrapped in ⁇ 1.7 turns around an octamer containing two of each histone H2A, H2B, H3, and H4 D5, D6 .
- exclusion signals such as poly(dA-dT)
- D5-10 nucleosome distribution D5
- D8-10 nucleosome distribution D8-10
- FKFM Field, Kaplan & Fondufe-Mittendorf
- thermodynamically favorable distributions D5, D12 , and nucleosomes were labeled in situ with anti-FLAG quantum dots (QDs; FIG. 28B ).
- Transient termination of hydrodynamic force provoked entropic collapse of the curtains, causing the DNA and nucleosomes to drift outside the detection volume defined by the evanescent field, verifying the molecules were anchored only via the biotin tag ( FIG. 28B-D ).
- conditions were selected to yield ⁇ 5 nucleosomes per DNA, equivalent to ⁇ 1.5% coverage of the 48.5-kb substrate, and time courses confirmed the nucleosomes did not move or dissociate during the experiments ( FIG. 28B-D ).
- Histone H2AZ is a conserved lineage of H2A that influences gene regulation D13-18 .
- CenH3 (Cse4 in yeast) is an H3-variant that serves as a centromere-specific epigenetic marker D19-21 .
- Cse4 can replace CenH3 in human centromeres, indicating a high degree of functional conservation D22 .
- In vivo deposition of H2AZ and CenH3 requires extrinsic factors D4, D21 , D23 , but it remains unclear whether variants are subject to the same energetic landscapes that dictate favorable binding by canonical nucleosomes.
- Nucleosomes bearing H2AZ displayed the same distribution trends as canonical nucleosomes, demonstrating that H2AZ does not alter thermodynamic sequence preferences ( FIG. 29 , and FIGS. 37 -38 ).
- the intrinsic landscape is intriguing for Cse4, which binds poly(dA-dT)-rich CEN DNA in vivo, and forms an unusual hexasome wherein H2A/H2B is replaced with the non-histone protein Scm3 D21 . If centromeric nucleosomes obey the same principles as canonical nucleosomes with respect to site preferences, then the in vitro distributions should be similar.
- centromeric nucleosomes do not obey the same thermodynamic principles, then they should exhibit distinct distribution patterns.
- Cse4 did cause ⁇ 7% of the total nucleosomes to redistribution away from the left 10-kb of the ⁇ -DNA ( FIG. 30A ), reflecting a subtle perturbation of the intrinsic landscape.
- every peak within the intrinsic landscape coincided with regulatory sequences, including the promoter-proximal regions of the Ay- and ⁇ -globin genes, and the non-coding ⁇ -globin gene.
- An additional peak in the intrinsic landscape encompassed an intergenic developmental stage-specific promoter ⁇ 2.6-kb upstream from the ⁇ -globin gene within a region containing binding sites for the repressor BCL11A, which is necessary for silencing the fetal ⁇ -globin genes during globin gene switching and is deleted in patients with Corfu ⁇ -thalassemia ( FIG. 31A-B ) D24-26 .
- Histones were expressed in E. coli, purified from inclusion bodies and reconstituted as described ( FIG. 33 ) D30 .
- H2AZ was cloned into pET-100/D-TOPO and purified using the same procedure ( FIG. 37 ) D30 .
- Cse4 was purified and reconstituted as described ( FIG. 37 ) D21 .
- Scm3 was purified on Ni-NTA agarose in urea buffer, eluted with 200 mM imidazole, and dialysed against 10 mM Tris-HCl [pH 7.8] plus 5 mM ⁇ -mercaptoethanol, followed by 10 mM Tris -HCl [pH 7.8], then lyophilized and stored at -20°C. Nucleosomes were deposited onto DNA by salt dialysis ( FIG. 33 , FIG. 37 ), and the DNA was assembled into curtains as described D11 . Nucleosomes were labeled with 2 nM QDs (Invitrogen, 705 nm emission) conjugated to anti-FLAG antibodies (Sigma).
- Illumination was by a 488-nm laser (Coherent, Sapphire-CDHR), images were collected using a water immersion objective (Nikon, 1.2 NA Plan Apo, 60x). YOYO1 and QD emissions were separated using a dichroic mirror (630 nm DCXR, Chroma Technologies) and recorded with an EMCCD (Photometrics, Cascade 512B). Images for position analysis were acquired at a flow rate of 0.4 ml/min in 40 mM Tris-HCl [pH 7.8], 1 mM DTT, and 0.2 mg/ml BSA. Flow was transiently paused to exclude non-specifically bound QDs from analysis. Only full-length DNA molecules well resolved from adjacent neighboring molecules were used for distribution measurements. Nucleosome position measurements and statistical analysis were performed using Igor Pro. All correlation trends were cross-validated on a random subset comprised of half the experimental data.
- Nanofabricated DNA curtains Electron-beam lithography was used to nanofabricate chromium diffusion barriers on the fused silica surface of a microfluidic sample chamber. ⁇ -DNA molecules stained with YOYO1 (green) were then anchored via a biotin-neutravidin linkage to a fluid lipid bilayer deposited on the surface of the slide.
- Application of buffer flow aligns the DNA molecules along the leading edges of the nanofabricated barriers and extends the DNA parallel to the sample chamber surface, confining the molecules within the excitation volume defined by the penetration depth of the evanescent field.
- buffer flow is transiently paused the DNA molecules collapse due to entropic forces and move away from the surface of the sample chamber demonstrating that the molecules do not interact nonspecifically with the lipid bilayer.
- a YOYO1-stained DNA curtain (green) was assembled as described, with the exception that the DNA was pre-bound by nucleosomes deposited through salt dialysis. The nucleosomes were labeled in situ using fluorescent quantum dots (magenta). When buffer flow is transiently paused, the nucleosome-bound DNA molecules collapse due to entropic forces and move away from the surface of the sample chamber demonstrating that the molecules do not interact nonspecifically with the lipid bilayer and verifying that the nucleosomes are bound to DNA.
- EXAMPLE 11 Nanofabricated racks of aligned and anchored DNA molecules for imaging individual protein-DNA interactions
- artificial membranes is that they can be partitioned with chemical or mechanical barriers E12, E16, E17 , and the distributions of molecules anchored to lipids can also be manipulated using photochemical modulation, electrical fields, or hydrodynamic force E18-21 .
- the aforementioned features suggested the potential for controlling the organization of molecules anchored to lipid membranes, and accordingly we have demonstrated that mechanical barriers that disrupt the continuity of lipid bilayers can be used to control the two-dimensional organization of DNA molecules anchored to a surface E8-10 .
- This controlled organization is accomplished by first coating a sample chamber surface with a bilayer containing a small fraction of biotinylated head groups, and DNA molecules are anchored by one end to the bilayer via a biotin-neutravidin linkage E8-10 .
- the lipid-tethered DNA molecules are assembled into molecular curtains by pushing them to the leading edge of either micro- or nano-scale lipid diffusion barriers through the application of a hydrodynamic force.
- microscale barriers to lipid diffusion made by manually etching a fused silica surface with a diamond-tipped scribe could be used to align hundreds of lipid-tethered DNA molecules, and we refer to these as DNA curtains E10, E22-25 .
- the DNA molecules are first anchored by one end to a fluid lipid bilayer via a biotin-neutravidin interaction, and initially aligned with one another by using hydrodynamic force to push them into the linear barriers.
- the arrayed pentagons serve as solid anchor points positioned at a defined distance downstream from the linear barriers and are coated with antibodies directed against either digoxigenin or bromodeoxyuridine, which are covalently attached to the free ends of the DNA molecules.
- the DNA molecules are maintained in an extended state suspended above an inert lipid bilayer and remain confined within the detection volume defined by the penetration depth of the evanescent field, allowing for continuous observation along their full contour length, even in the absence of an applied hydrodynamic force.
- Electron beam lithography Fused silica slides were cleaned in NanoStrip solution (CyanTek Corp, Fremont, CA) for 20 minutes, then rinsed with acetone and isopropanol and dried with N 2 .
- the slides were spin-coated with a bilayer of polymethylmethacrylate (PMMA), molecular weight 25K, 3% in anisole and 495K, 1.5% in anisole (MicroChem, Newton, MA), followed by a layer of Aquasave conducting polymer (Mitsubishi Rayon). Each layer was spun at 4,000 rpm for 45 seconds using a ramp rate of 300 rpm/s.
- Liftoff was effected at 80°C in a 9:1 ratio of methylene chloride to acetone.
- barriers were made out of just a 15-20 nm layer of chromium, as previously described E8, E9 .
- samples were rinsed with acetone to remove stray chromium flakes and dried with N 2 .
- Barriers were imaged using a Hitachi 4700 scanning electron microscope and a PSIA XE-100 Scanning Probe Microscope in noncontact mode. Optical images of the barriers were taken with a Nikon Eclipse ME600.
- Nanoimprint lithography Nanoimprint masters were fabricated using electron beam lithography, liftoff, and inductively-coupled plasma etching. Briefly, a bilayer of polymethyl methacrylate (PMMA, 25K and 495K) was spun onto a silicon wafer with a thin coating of silicon dioxide. Patterns were written by an FEI Sirion SEM outfitted with a Nabity Nanopattern Generation System, then developed in a mixture of isopropanol: methyl isobutyl ketone (3:1) at 5°C in a bath sonicator. Samples were rinsed with isopropanol and dried with N 2 . A Semicore Ebeam evaporator was used to evaporate 20 nm Cr onto the masters.
- PMMA polymethyl methacrylate
- Nanoimprint masters were coated with a fluorinated self-assembled monolayer (Nanonex, Princeton, NJ) to prevent adhesion between the master and resist.
- PMMA 35K (Microresist Technologies, Germany) was spin-coated on a fused silica microscope slide and baked on a hotplate for 5 min. at 180°C. Nanoimprint was performed in two stages: a 2-min. pre-imprint phase with a pressure of 827.37 kPA (120-psi) and pre-temp. of 120°C, followed by a 5-min. imprint phase with a pressure of 3309.48 kPa (480-psi) and temp. of 190°C. This heated PMMA well above its glass transition temp. and allowed it to conform to the mold. After imprinting, a descum process was done to remove ⁇ 10 nm of residual PMMA.
- De-scum was done in an inductively coupled plasma under CHF 3 :O 2 (1:1) and a power of 200 W for 40 seconds total (two iterations of 20 seconds). After descum, 15-20 nm of Cr was evaporated on the samples and liftoff was performed in acetone at 65°C for several hours, followed by bath sonication to remove stray metal flakes. Nanopatterned slides were then rinsed in acetone and dried with N 2 .
- the flowcells were assembled from fused silica slides (G. Finkenbeiner, Inc.) with chromium nanoscale diffusion barriers. Inlet and outlet ports were made by boring through the slide with a high-speed precision drill press equipped with a diamond-tipped bit (1.4 mm O.D.; Kassoy). The slides were cleaned by successive immersion in 2% (v/v) Hellmanex, 1 M NaOH, and 100% MeOH. The slides were rinsed with filtered sterile water between each wash and stored in 100% MeOH until use. Prior to assembly, the slides were dried under a stream of nitrogen and baked in a vacuum oven for at least 1 hour.
- a sample chamber was prepared from a borosilicate glass coverslip (Fisher Scientific) and double-sided tape ( ⁇ 25 ⁇ m thick, 3M). Inlet and outlet ports (Upchurch Scientific) were attached with hot-melt adhesive (SureBonder glue sticks, FPC Corporation). The total volume of the sample chambers was ⁇ 4 ⁇ l.
- a syringe pump (Kd Scientific) and actuated injection valves (Upchurch Scientific) were used to control sample delivery, buffer selection and flow rate.
- the flowcell and prism were mounted in a custom-built heater with computer-controlled feedback regulation to control the temperature of the sample from between 25-37°C ( ⁇ 0.1 °C), as necessary.
- DNA curtains were constructed as described E8, E9 , with the exception of additional steps necessary for anchoring the second end of the DNA. All lipids were purchased from Avanti Polar Lipids and liposomes were prepared as previously described. In brief, a mixture of DOPC (1,2-dioleoyl- sn -glycero-phosphocholine), 0.5% biotinylated-DPPE (1,2-dipalmitoyl- sn -glycero-3-phosphoethanolamine-N-(cap biotinyl)), and 8-10% mPEG 550-PE (1,2-dioleoyl- sn -glycero-3-phosphoethanolamine-N-[methoxy(polyethylene glycol)-550]).
- DOPC 1,2-dioleoyl- sn -glycero-phosphocholine
- biotinylated-DPPE 1,2-dipalmitoyl- sn -glycero-3-phosphoethanolamine-N-(
- the mPEG is does not affect bilayer formation or assembly of the DNA curtains, but rather serves to further passivated the surface against nonspecific adsorption of quantum dots (which we use in our studies of protein-DNA interactions).
- Liposomes were applied to the sample chamber in three injections of 200 ⁇ l followed by 5 minute incubations. Excess liposomes were flushed away with 1 ml of buffer A , which contained 10 mM Tris-HCl (pH 7.8) plus 100 mM NaCl, and the bilayer was incubated for an addition 30 minutes.
- Buffer A plus 25 ⁇ g/ml anti-DIG Fab (Roche), anti-fluorescein (Sigma), or anti-BrdU IgG (Sigma) was then injected into the sample chamber and incubated for 30 minutes.
- the sample chamber was then flushed with 1 ml of buffer B, which contained 40 mM Tris-HCl (pH 7.8), 1 mM DTT, 1 mM MgCl 2 , and 0.2 mg/ml BSA, and incubated for an additional 5 minutes.
- 1 ml of buffer A containing Neutravidin (330 nM) was then injected into the sample chamber and incubated for 20 minutes.
- the flowcell was then rinsed with 3 ml of buffer B to remove any unbound Neutravidin.
- 1 ml of ⁇ -DNA (20 pM) labeled at one end with biotin and at the other end with either digoxigenin, fluorescein or bromodeoxyuridine (as indicated) and pre-stained with 1-2 nM YOYO1 was injected into the sample chamber in five 200- ⁇ l aliquots, with a 2-3 minute incubation period following each injection.
- the DNA was then aligned at the linear barriers using a flow rate of 0.02 ml/min, and this rate was then increased to 2-3 ml/min to anchor the second end of the DNA molecules.
- DNA substrates were made by ligating oligonucleotides to the 12 nucleotide overhangs at the end of the ⁇ phage genome (48.5 kb).
- Ligation mixes (1 ml total volume) contained 4 nM ⁇ DNA (Invitrogen), 1 ⁇ M biotinylated oligonucleotiode (5'-pAGG TCG CCG CCC [BioTEG]-3' (SEQ ID NO: 1)), 1 ⁇ M fluorescein labeled oligonulceotide (or DIG labeled oligonucleotide; 5'-pGGG CGG CGA CCT [fluor]-3' (SEQ ID NO: 6) or 5'-pGGG CGG CGA CCT [DIG]-3' (SEQ ID NO: 3)), and 1X ligase buffer (NEB).
- reaction mix was warmed to 65°C for 10 minutes and then cooled slowly to room temperature. After cooling, ligase was added (T4 DNA ligase (400U/ ⁇ l) or Taq ligase (40U/ ⁇ l); NEB) and the mixture was incubated overnight at 42°C. Reactions performed with T4 ligase were then heat inactivated at 65°C for 10 minutes, and the ligated DNA products were purified over a Sephacryl S200HR column (GE Healthcare) run in 10 mM Tris-HCl (pH 7.8), 1 mM EDTA, plus 150 mM NaCl. The purified DNA was stored at -20°C.
- a DIG labeled oligonucleotide complementary to position 26,151-26,166 on ⁇ 500ul of DNA 200pM; labeled at the ends with biotin and fluorescein (as described above) was incubated for 2 hours with the nicking enzymes Nb.BsmI and Nt.BstNBI (50 units each; NEB) at 55°C in buffer containing 10 mM Tris-HCl (pH 7.8), 10 mM MgCl 2 , 150 mM NaCl.
- oligonucleotide (5'-pCAT TCT TGA GTC CAA TTT TT[DIG]-3'(SEQ ID NO: 4)) was added to the solution along with 10 mM EDTA and the mixture was incubated at 55°C for 20 minutes and then allowed to slowly cool to room temperature over the course of an hour.
- ATP was added to a final concentration of 1 mM along with 2,000 units of T4 ligase and an additional 10 mM MgCl 2 .
- the reaction was then incubated at room temp. for 90 min.
- oligonucleotide For inserting an oligonucleotide at position 33,779-33,791 on ⁇ 500 ⁇ l DNA (200pM; labeled at the ends with biotin and fuorescein (as described above)) was incubated for 2 hours with the nicking enzyme Nt.BstNBI (50 units; NEB) at 55°C in buffer containing 10mM Tris-HCl (pH 7.8), 10 mM MgCl 2 , 150 mM NaCl. The enzyme was heat denatured by incubation at 80°C for 20 minutes.
- Nt.BstNBI 50 units; NEB
- oligonucleotide 5'-pTTC AGA GTC TGA CTT TT[DIG]-3' (SEQ ID NO: 5) was added to the solution and the mixture was incubated at 55° C for 20 minutes then cooled slowly to room temperature over the course of 1 hr. ATP was then added to a final concentration of 1 mM along with 2,000 units of T4 ligase, and the reaction was incubated at room temperature for 90 min. The ligase was then heat denatured by incubation at 65°C for 20 minutes.
- TIRFM and 1D diffusion assays The basic design of the microscope used in this study has been previously described E10 .
- the system is built around a Nikon TE2000U inverted microscope with a custom-made illumination system.
- a 488 nm, 200 mW diode-pumped solid-state laser (Coherent, Sapphire-CDHR) was used as the excitation source.
- the laser was attentuated as necessary with a neutral density filter and centered over the DNA curtain by means of a remotely operated mirror (New Focus).
- the beam intensity at the face of the prism ways ⁇ 10-15 mW. Images were detected with a back-illuminated EMCCD detector (Photometrics, Cascade 512B).
- TIRFM images were collected using a 60x water immersion objective lens (Nikon, 1.2 NA Plan Apo), unless otherwise indicated.
- FIG. 18 Design elements of the DNA rack.
- DNA racks that can be used to make DNA curtains in which both ends of the molecules are anchored to the flowcell surface.
- An overview of the general design is presented in FIG. 18 and utilizes a combination of two distinct pattern elements, as described below.
- one end of the DNA is first anchored via a biotin-neutravidin interaction to a supported lipid bilayer coating the surface of the sample chamber ( FIG. 18B-C ).
- the molecules are randomly distributed on the surface, but lie primarily outside of the detection volume defined by the penetration depth of the evanescent field ( ⁇ 150-200 nm).
- the first pattern elements are linear barriers to lipid diffusion, which are oriented perpendicular to the direction of flow at strategic locations in the path of the DNA ( FIG . 18B-C ); these linear barriers are designed to halt the movement of the lipid-tethered DNA molecules causing them to accumulate at leading edge of the barriers where they then extend parallel to the surface.
- the second elements of the pattern are a series of arrayed pentagons positioned behind the linear barriers and separated from one another by small channels.
- the non-linear, geometric shape of the pentagons is intended to act as a funnel and direct any lipid-tethered DNA molecules through the channels so that they do not accumulate at the leading edge of the pentagons, but rather are pushed along the surface until they encounter the next successive linear barrier in the pattern.
- the distance between the linear barriers and the pentagons is optimized for the length of the DNA to be used for the experiments.
- the pentagons themselves present a large surface that can be coated with antibodies directed against digoxigenin (DIG), which is covalently linked to the ends of the DNA opposite the ends bearing the biotin tag. When the DIG-coupled DNA end encounters the antibody-coated pentagons they should become immobilized, and the DNA should remain stretched parallel to the surface even when no buffer is being pushed through the sample chamber.
- DIG digoxigenin
- FIG. 39 shows the characterization of a DNA rack made by Ebeam lithography and highlights specific features of the pattern geometry deemed critical for its function.
- FIG. 39A shows an optical image of the overall pattern design, including the dimensions of critical pattern parameters.
- FIG. 39B shows measurements of these parameters using atomic force microscopy (AFM).
- FIG. 39C shows characterization of the patterns with scanning electron microscopy (SEM).
- the height of the patterns elements was on the order of 20 nm
- the width of the channels was 500 nm
- the optimal distance between the leading edge of the linear barriers and the back of the pentagon array was ⁇ 13 ⁇ m (see below).
- This distance was specifically selected for use with ⁇ -DNA, which is 48,502 base pairs with a fully extended contour length of approximately 16.5 ⁇ m, thus 11-13 ⁇ m would correspond to a mean extended length of ⁇ 65-79% that of the full contour length, respectively.
- each pentagon has a surface area of 1.55 ⁇ m 2 and for each 260 ⁇ m long linear barrier there are 167 pentagons. This corresponds to a total surface area of 372 ⁇ m 2 for the pentagons compared to just 36 ⁇ m 2 for the entire linear barrier.
- the smaller total surface area of the linear barriers should ensure adsorption of more antibody to the much larger area encompassed by the pentagons.
- the surface of the flowcell was first coated with a lipid bilayer, as previously described E8,E9 , with the exception that BSA was omitted from all buffers used prior to deposition of the antibody.
- BSA was omitted from all buffers used prior to deposition of the antibody.
- anti-DIG Fab fragments or anti-fluorescein IgG was injected into the sample chamber where they were allowed to adhere nonspecifically to the exposed metal barriers.
- the free antibody was rinsed from the flowcell and replaced with buffer containing 0.2 mg/ml BSA, which served as a nonspecific blocking agent to passivate any remaining exposed surfaces.
- DNA stained with the fluorescent intercalating dye YOYO1 was then injected into the sample chamber, incubated briefly without buffer flow, and then buffer flow was applied to push the anchored molecules into the linear barriers. Buffer flow was then terminated and the anchored DNA molecules imaged by TIRFM. As shown in FIG. 40 , this procedure yielded curtains of DNA molecules that remained fully extended and visible even though no buffer was flowing through the sample chamber. Any DNA molecules that failed to become anchored by the DIG-labeled end remained near the linear barriers, but only the ends of the molecules could be observed rather than their full contour lengths. These single-tethered DNA molecules gradually diffused away from the barrier edges and could also be pushed away from the barrier edge by reversing the direction of buffer flow ( FIG. 40 ), but the double-tethered DNA molecules remained anchored to their original locations, providing additional conformation that the molecules making up the curtain are anchored in the desired configuration.
- the number of DNA molecules at each of the different barrier locations was proportional to the distance between the adjacent linear barriers.
- the number of double tethered DNA molecules decreased slowly over time, with a half-life of >1 hour for the DIG-labeled molecules.
- control experiments verified that the presence of both the DIG labeled and the Fab fragments were necessary for efficiently anchoring the two ends of the DNA.
- Approximately 70% of the anchored DNA could be attributed to specific antibody:hapten interactions, with the remaining 30% due to nonspecific anchoring of the DNA ends to the antibody-coated pentagons.
- Similar double-tethered DNA curtains could be made using substrates that were end-labeled with either a single bromodeoxyuridine (BrdU) or fluorescein moiety, and pentagons coated with anti-BrdU or anti-fluorescein antibodies (see below), respectively.
- the half-life of the fluorescein-anchored DNA was comparable to that of the DIG-anchored DNA.
- the BrdU-anchored DNA molecules had a greater tendency to dissociate from the pentagons, displaying a half-life on the order of just a few minutes.
- orientation of the DNA The differential chemistries used to anchor the two ends of the DNA were predicted to define the orientation of the molecules within the curtains. Specifically, the biotinylated end should be anchored at the edge of the linear barrier and the other end should be at the pentagons, and based on this design all of the molecules should be in the exact same orientation. If the DNA molecules were aligned as expected, then a fluorophore located at a single specific site within the DNA and offset from its center should appear as a fluorescent "line" spanning the DNA curtain. The line should be oriented perpendicular to the long axis of the extended DNA molecules and should coincide precisely with the know location of the fluorescent tag.
- the fluorescent tags should appear as two lines demarking each of the two possible orientations of the DNA.
- the molecules were labeled at the free ends with fluorescein, and labeled at a specific internal position with DIG.
- the internal labels were made using an oligonucleotide replacement strategy wherein the DNA was nicked at specific sites with a nicking endonuclease and short ssDNA fragments flanked by the resulting nicks were replaced with a DIG-tagged oligonucleotide (see Materials and Methods).
- Msh2-Msh6 can diffuse in one-dimension along duplex DNA E22 .
- Msh2-Msh6 is an essential component of the post-replicative mismatch repair machinery and is responsible for locating and initiating repair of biosynthetic DNA replication errors.
- Our initial studies with Msh2-Msh6 relied upon DNA molecules that were tethered by either end to neutravidin nonspecifically absorbed to a fused silica surface that was otherwise coated with a lipid bilayer.
- protein bound molecules were nonspecifically linked to the sample chamber surface along its contour length, rather than suspended above the inert bilayer, then they should remain in view even if the DNA breaks or otherwise detaches from one of its anchor points. In contrast, if the proteins only interacted with the DNA, then detachment of the DNA should cause the molecules to retract away from the surface and disappear from view. As shown in FIG. 42C , when the DNA molecules randomly detached from the surface the proteins immediately disappeared from view as they drifted outside the detection volume define by the penetration depth of the evanescent field. This data demonstrates that the fluorescently tagged proteins were bound to the DNA, the DNA molecules only interacted with the sample chamber surface through their anchored ends, and neither the quantum dot-tagged protein nor the DNA interacted nonspecifically with the lipid bilayer.
- Lipid bilayers, DNA curtains, and DNA substrates were prepared as described in the Examples above.
- DNA is attached to lipid bilayer as shown in FIG. 43A .
- DNA is then aligned at the diffusion barrier edge (for example, a linear diffusion barrier or a non-linear, geometric diffusion barrier) using either a hydrodynamic force or and electric field ( FIG. 43B ).
- a calcium solution of about 1 mM is then injected into the flow cell.
- the DNA becomes reversibly anchored to the lipid bilayer throughout the DNA's entire contour length ( FIG . 43C ).
- the following calcium concentration can also be used, for example, a calcium concentration of at least about 0.5 mM, at least about 1 mM, at least about 1.5 mM, at least about 2 mM, at least about 2.5 mM, at least about 3 mM, at least about 3.5 mM, at least about 4 mM, at least about 4.5 mM, at least about 5 mM, at least about 5.5 mM, at least about 6 mM, at least about 6.5 mM, at least about 7 mM, at least about 7.5 mM, at least about 8 mM, at least about 8.5 mM, at least about 9 mM, at least about 9.5 mM, at least about 10 mM, or at least about 10.5 mM.
- Lipid bilayers, DNA curtains, and DNA substrates were prepared as described in the Examples above.
- FIG. 44A A sample of homogeneous DNA molecules is attached to lipid bilayer as shown in FIG. 44A .
- Fluorescently tagged oligonucleotides or PNAs (protein-nucleic acids) directed against specific target sequences can be hybridized to DNA molecules aligned at the edge of a diffusion barrier (for example a linear diffusion barrier or a non-linear, geometric diffusion barrier) using either a hydrodynamic force or and electric field ( FIG. 44B ).
- a diffusion barrier for example a linear diffusion barrier or a non-linear, geometric diffusion barrier
- FIG. 44B An advantage of using this system includes course mapping of DNA for genomics applications which can be carried out without the requirement for cutting the DNA. This type of mapping technology is being used by others, but not in the context of a DNA curtain.
- the DNA curtain design top view, FIG.
- 44B offers two potential benefits over what is being practiced: (1) easier data analysis because DNA molecules are aligned; and (2) the DNA can be collected after analysis by cleaving it with a restriction enzyme. For example, one could design a single, specific cut site right at the point of attachment. No other single molecule DNA mapping technique allows the user to harvest the DNA after analysis.
- a sample of heterogeneous DNA molecules (for example, a heterogeneous preparation of genomic DNA) can be attached to lipid bilayer as shown in FIG. 45A .
- Fluorescently tagged oligonucleotides or PNAs (protein-nucleic acids) directed against specific target sequences can be hybridized to DNA molecules aligned at the edge of a diffusion barrier (for example a linear diffusion barrier or a non-linear, geometric diffusion barrier) using either a hydrodynamic force or and electric field ( FIG. 45B ).
- Individual DNA molecules can then be designated or numbered, and from the organization scheme of these DNA molecules, a DNA map can be generated based on overlapping signals ( FIG. 45B , top view).
- An example of a DNA map is seen in FIG. 45C .
- An advantage of using this system includes course mapping of DNA for genomics applications which can be carried out without the requirement for cutting the DNA.
- this system allows the mapping of more complex mixtures of genomic DNA.
Description
- Recent years have witnessed a dramatic increase in the use of technologies that allow the detailed interrogation of individual biological macromolecules in aqueous environments under near-native conditions. Chan et al. (PNAS, 2007, vol. 104, no. 48) for example describe the kinetics of DNA-mediated docking reactions between vesicles tethered to supported lipid bilayers and Granéli et al. (Langmuir 2006, 22, 292-299) describe organized arrays of individual DNA molecules tethered to supported lipid bilayers. Nanostepper/sensor systems and methods for analyzing a polymer are provided in
US 2006/0057585 . Furthermore, Fazio et al. (Langmuir 2008, 24, 10524-10531) describe high-throughput tools for single molecule imaging and microdevices for screening biomolecules are described inUS 2003/0138973 . Additionally, Visnapuu et al. (Langmuir 2008, 24, 11293-11299) describe parallel arrays of geometric nanowells for assembling of curtains of DNA with controlled lateral dispersion, single molecule detection sensors are described inWO 2006/088425 and microfluidic cells with parallel arrays of individual DNA molecules are described inWO 2007/041340 . This increase can be attributed to the development and availability of highly sensitive experimental tools, such as atomic force microscopy (AFM), laser and magnetic tweezers, and fluorescence-based optical detection, all of which have all been used to study biological phenomena such as protein folding and unfolding, DNA dynamics, and protein-nucleic acid interaction. - The invention is based, in part, on the discovery that nucleic acid molecules can be disposed on a substrate and positionally aligned to allow analysis of individual nucleic acid molecules. Accordingly, in one aspect, the invention features an array that includes a substrate and nucleic acid molecules attached to the substrate. The nucleic acid molecules can be attached to the substrate by means of a linkage, e.g., a linkage between cognate binding proteins, e.g., neutravidin and biotin, or an antibody and antigen (e.g., anti-digoxigenin antibody and digoxigenin); or a crosslinking linkage, e.g., disulfide linkage or coupling between primary amines using gluteraldehyde. In some embodiments, the nucleic acid molecules are attached at one end. In some embodiments, the nucleic acid molecules are attached at both ends. In some embodiment, the nucleic acid molecule is reversibly attached to the lipid bilayer along its contour.
- The array further includes a coating material, e.g., lipids, e.g., a lipid layer, e.g., a lipid bilayer, deposited onto the substrate. In one embodiment, the lipids are zwitterionic lipids. In one embodiment, polyethylene glycol (PEG) is added to the lipid bilayer. For example, 1%, 2%, 3%, 4%, 5%, 6%, 7%, 8%, 9%, 10%, 12% (w/w) or more of PEG can be included in the lipid bilayer.
- The substrate can be, e.g., glass, fused silica (SiO2) quartz, borosilicate glass, polydimethylsiloxane, polymerized Langmuir Blodgett film, functionalized glass, Si, Ge, GaAs, GaP, SiO2 SiN4, modified silicon, or a polymer (e.g., (poly)tetrafluoroethylene, (poly)vinylidenedifluoride, polystyrene, or polycarbonate). In one embodiment, the substrate is fused silica. The substrate can be, e.g., a disc, square, rectangle, sphere or circle. The substrate can be a suitable to be used in the methods described herein. In one embodiment, the substrate is a slide used for fluorescent microscopy.
- The nucleic acid molecules can be, e.g., single stranded DNA, double stranded DNA, or RNA. The nucleic acid molecules can be about 10, 20, 30, 40, 50, 100, 150, 200, 500, 1000, 2000, 5000, 10000, 50000, 100000, 200000, or more nucleotides in length. The number of nucleic acid molecules that can be attached to the substrate can be determined by the size of the substrate and by the design of the array. In some embodiments, about 50, 100, 250, 500, 1000, 2000, 5000 or more nucleic acid molecules are attached to the substrate.
- The nucleic acid molecules can be coupled to a label, e.g., a fluorescent label, e.g., YOYO1, or other fluorescent label described herein, or to a quantum dot.
- The invention features an array that includes a substrate, a lipid bilayer disposed on the substrate, and nucleic acid molecules attached to the lipid bilayer by a linkage. In one embodiment, a polypeptide, e.g., neutravidin, is linked to the lipid head groups and a cognate polypeptide, e.g., biotin, is linked to the nucleic acid molecules. The nucleic acid molecules are attached to the lipid bilayer by a linkage between the neutravidin and the biotin. In some embodiments, the nucleic acid molecules are attached at one end. In some embodiments, the nucleic acid molecules are attached at both ends.
- The substrate further includes a diffusion barrier, e.g., a non-linear mechanical, chemical, or protein barrier, that prevents lipid diffusion. The diffusion barrier is a non-linear, geometric diffusion barrier, wherein the non-linear geometric barrier comprises a repetitive triangular wave producing a sawtooth pattern that repeats at nanometer-scale intervals, or a repetitive series of angles of varying degrees. The non-linear diffusion barrier can also comprise turns, bends, curves, or interruptions. In one embodiment, the barrier is non-linear over its entire length. In another embodiment, the barrier comprises at least one angle. In a further embodiment, the barrier comprises at least one angle less than about 180°. In another embodiment, the barrier comprises at least one angle of varying degrees. In some embodiments, the barrier comprises multiple angles of varying degrees. In another embodiment, the diffusion barrier is a non-linear, nanoscale barrier. A non-linear, mechanical barrier can be, e.g., a rough scratch or etch on the substrate, for example, wherein the scratch or etch is not linear. Protein barriers include, e.g., fibronectin. Protein barriers can be deposited onto a substrate, e.g., a substrate described herein, in well-defined patterns. Protein barriers can have a thickness of, e.g., 2, 3, 4, 5, 6, 7, 8, 9, 10, 15, 20 or more µm thick. In one embodiment, the barrier materials comprising a chemical barrier can comprise metals, such as chromium, aluminum, gold, titanium, platinum, osmium, or nickel. In another embodiment, the barrier materials can comprise metal oxides, such as aluminum oxide, or titanium oxide. The solid support comprises a geometric barrier, wherein the barrier is non-linear and comprises a repetitive triangular wave according to
claim 1. In other embodiments, the barrier forms a nanowell by connecting vertices of the non-linear, geometric barrier according toclaim 1, while in some embodiments, the nanowell comprises a nanopore for entry of nucleic acids. In some embodiments, the non-linear, geometric barrier according to claim 1 controls the lateral displacement of the nucleic acid molecule(s). The non-linear, geometric barrier according toclaim 1 can be generated by nanofabrication, for example, comprising electron-beam lithography or photolithographic techniques. For example, nanofabrication techniques that can lay down thin, 100 nm barriers of a metal, such as chromium, can be used. - The invention features an array that includes a substrate, a diffusion barrier described herein, a lipid bilayer disposed on the substrate, and nucleic acid molecules attached to the diffusion barrier by a linkage. In one embodiment, the diffusion barrier is coupled to a protein, e.g., biotin. A cognate protein, e.g., neutravidin, is then bound directly to the biotinylated diffusion barriers, and biotinylated nucleic acid molecules are attached to the diffusion barriers by binding to the cognate protein, e.g., neutravidin. In some embodiments, the nucleic acid molecules are attached at one end. In some embodiments, the nucleic acid molecules are attached at both ends.
- In another aspect, the invention features a microfluidic flowcell, that includes an array according to
claim 1. The flowcell can be configured to allow a fluid to interact with the lipid bilayer, e.g., to flow over the lipid bilayer. In some embodiments, a substrate described herein further includes two openings, e.g., an inlet port and an outlet port. The flowcell, includes the substrate, and a cover, e.g., a glass cover, e.g., a glass coverslip, adhesively attached at its perimeter to the substrate, creating a chamber between the substrate and the cover. The inlet port and the outlet port open into the chamber, allowing the application of a hydrodynamic force into the chamber and over the lipid bilayer deposited on the substrate. For example, a buffer can be forced through the inlet port into the chamber such that the buffer flows over the lipid bilayer and exits the chamber through the outlet port. In one embodiment, the flowcell further comprises a staging area, a bifurcated nanochannel, at least one pair of parallel channels, at least one pore, or a combination thereof. In another embodiment, the nucleic acid molecule of the invention is aligned along the non-linear, geometric barrier according toclaim 1 through application of a hydrodynamic force, an electrophoretic force, or a combination of the two forces. - In one embodiment, the nucleic acid molecules of the array according to
claim 1 are positioned into a desired orientation by application of a hydrodynamic force, an electrophoretic force, or combination of either, to the microfluidic flowcell. For example, upon application of a hydrodynamic force to the microfluidic flowcell, e.g., introduction of a buffer as described herein, the nucleic acid molecules are aligned in the direction of the hydrodynamic force. In embodiments in which the nucleic acid molecules are attached at one end, the hydrodynamic force results in the extension of the nonattached ends of the nucleic acid molecules in the direction of the flow of the hydrodynamic force. In embodiments in which the nucleic acid molecules are attached to the lipid heads of the lipid bilayer, the nucleic acid molecules will flow in the direction of the hydrodynamic force until the lipid head encounters a non-linear, geometric diffusion barrier, resulting in the extension of the nucleic acid molecule at a desired position in a desired orientation. - In one aspect, the disclosure provides a method for isolating a length-specific nucleic acid from a plurality of nucleic acids. The method comprises a) providing the microfluidic cell of the invention, wherein the attached nucleic acid molecule is a DNA molecule coupled to a fluorescent label that permits visualization of the DNA molecule; b) applying a first hydrodynamic or electrophoretic force perpendicular to the surface of the support to localize the attached DNA molecules to the nanowell; c) applying a second hydrodynamic or electrophoretic force tangential to the surface of the support to align the attached DNA molecules in a desired orientation within the pair of parallel channels; and d) visualizing the DNA molecule. In one embodiment of the disclosure, the method can optionally comprise applying continuously the second hydrodynamic or electrophoretic force tangential to the surface of the support.
- In another aspect, the disclosure features a method for visualizing individual nucleic acid molecules. The method includes attaching nucleic acid molecules (coupled to a fluorescent label) to a substrate, to a lipid bilayer, or to a non-linear, geometric diffusion barrier, as described herein, to form an array. The array is then included in a flowcell, and the nucleic acid molecules are aligned in a desired orientation, as described herein. The arrays are then excited with a light source, e.g., a laser, at the excitation wavelength of the particular fluorescent label and the resulting fluorescence at the emission wavelength is detected. Detection of the fluorescence signal utilizes a microscope, e.g., a fluorescent microscope. In another embodiment of the disclosure, excitation and detection is mediated by Total Internal Reflection Fluorescence Microscopy (TIRFM), as described herein.
- In another aspect, the disclosure features methods for analyzing the interactions between a nucleic acid and a polypeptide. The method includes, e.g., providing an array within a flowcell as described herein. The nucleic acid molecules can be aligned in a desired orientation by application of a hydrodynamic force, and the nucleic acid molecules can be visualized as described herein. A target polypeptide is then added to the flowcell, e.g., by being added to the buffer that mediates the hydrodynamic force across the array. In one embodiment of the disclosure, the target polypeptide is coupled to a fluorescent label that is different than the fluorescent label coupled to the nucleic acid molecule. The localization of the target polypeptide to the nucleic acid molecule can be visualized, and such localization is indicative of interaction between the target polypeptide and the nucleic acid molecule.
- In one embodiment of the disclosure, the signals from the array are collected serially over time, allowing the movement of the target polypeptides on the nucleic acid molecules to be determined.
- In one embodiment of the disclosure, the length of the nucleic acid molecules is determined before and after the addition of the polypeptide, wherein if the polypeptide causes the nucleic acid molecule to change length, e.g., shorten or lengthen, this indicates that the polypeptide causes a structural change in the nucleic acid molecule.
- In another aspect, the disclosure features methods for identifying a nucleic acid sequence, e.g., a mutation in a nucleic acid sequence, that disrupts an interaction between a nucleic acid molecule and a polypeptide. The method includes providing a first array within a first flowcell as described herein. The first array contains a first population of identical nucleic acid molecules that are coupled to a first fluorescent label. The method also includes providing a second array within a second flowcell as described herein. The second array contains a second population of identical nucleic acid molecules that are coupled to a first fluorescent label. In another embodiment of the disclosure, the nucleotide sequence of the second population of nucleic acid molecules differs from the nucleotide sequence of the first population of nucleic acid molecules by at least one nucleotide. A polypeptide is then added to the flowcells, e.g., by being added to the buffer that mediates the hydrodynamic force across the arrays. In an embodiment of the disclosure, the polypeptide is coupled to a second fluorescent label, e.g., one that is different from the fluorescent label coupled to the nucleic acid molecules. The localization of the polypeptide to the nucleic acid molecules on the arrays can be visualized, and the localization of the polypeptide to the nucleic acid molecules of the first array, but not of the second array, is indicative that the nucleic acid molecules of the second array contain a nucleic acid sequence, e.g., a mutation, that disrupts the interaction between the nucleic acid molecules of the first array and the polypeptide.
- In another aspect, the disclosure features methods for identifying an agent that disrupts the interaction of a polypeptide and a nucleic acid. The method includes, e.g., providing an array within a flowcell as described herein. The nucleic acid molecules (coupled to a first fluorescent label) can be aligned in a desired orientation by application of a hydrodynamic force, and the nucleic acid molecules can be visualized as described herein. A polypeptide is then added to the flowcell, e.g., by being added to the buffer that mediates the hydrodynamic force across the array. In another embodiment of the disclosure, the polypeptide is coupled to a fluorescent label that is different than the fluorescent label coupled to the nucleic acid molecule. In another embodiment of the disclosure, the polypeptide is a polypeptide that is known to bind to the nucleic acid molecules. The localization of the polypeptide to the nucleic acid molecule can be visualized. A candidate agent, e.g., a compound or drug, is then added to the flowcell, e.g., by being added to the buffer and whether the localization of the polypeptide can be visualized. An agent that causes loss of localization of the polypeptide anywhere along the length of the nucleic acid molecule is indicative of an agent that disrupts the interaction between the nucleic acid molecule and the polypeptide.
- In another aspect, the disclosure features methods for sequencing a nucleic acid molecule. The method includes, e.g., providing a single stranded nucleic acid molecule, e.g., a single stranded DNA molecule. The single stranded nucleic acid molecule is mixed with DNA polymerase and a mix of fluorescently labeled nucleotide analogs, e.g., fluorescently labeled dNTPs. In another embodiment of the disclosure, each dNTP, e.g., dATP, dCTP, dGTP and dTTP, is coupled to a different fluorescent label. The mixture is reacted under conditions that allow the addition of the nucleotide analogs to the single stranded nucleotide molecules. The reacted nucleic acid molecules are then added to an array as described herein. The nucleic acid molecules can be aligned in a desired orientation by application of a hydrodynamic force, and the nucleic acid molecules can be visualized as described herein.
- In one embodiment of the disclosure, the nucleic acid molecules are identical, and the sequence can be determined by parallel lines of color representing particular nucleotides across the array. In one embodiment of the disclosure, the nucleic acid molecules are different.
- In another aspect, the disclosure features methods for high-throughput physical mapping of single DNA molecules, for example using restriction enzymes, hybridization with fluorescent proteins, or fluorescence in situ hybridization. In one embodiment of the disclosure, the method for mapping a nucleic acid molecule comprises (a) providing an array of the invention described herein, wherein the array comprises a plurality of heterogeneous nucleic acid molecules, and wherein the nucleic acid molecules are DNA molecules coupled to a first fluorescent label that permits visualization of the DNA molecules; (b) contacting a plurality of DNA probes to the DNA molecules, wherein each DNA probe is coupled to a fluorescent label that is not the first fluorescent label; (c) applying a hydrodynamic force or an electrophoretic force tangential to the surface of the support to align the DNA molecule in a desired orientation; and (d) visualizing the locations of binding of the DNA probes. In some embodiments of the disclosure, the plurality of nucleic acid molecules comprises heterogeneous nucleic acid molecules. In other embodiments of the disclosure, the plurality of nucleic acid molecules comprises identical (e.g., homogeneous) nucleic acid molecules. In further embodiments of the disclosure, the method further comprises: (e) contacting a restriction enzyme to the DNA molecule; (f) collecting the digested DNA molecule of interest; and (g) determining the changes in the length of the DNA molecule following the contacting step. The method can optionally comprise reversibly attaching the nucleic acid molecule along its contour to the lipid bilayer, for example by exposing the DNA molecules to a flowcell buffer contain an effective concentration of calcium. The DNA molecule can unattach itself from the lipid bilayer upon washing away the calcium present in the buffer. In one embodiment of the disclosure, the calcium concentration is at least about 0.5 mM, at least about 1 mM, at least about 1.5 mM, at least about 2 mM, at least about 2.5 mM, at least about 3 mM, at least about 3.5 mM, at least about 4 mM, at least about 4.5 mM, at least about 5 mM, at least about 5.5 mM, at least about 6 mM, at least about 6.5 mM, at least about 7 mM, at least about 7.5 mM, at least about 8 mM, at least about 8.5 mM, at least about 9 mM, at least about 9.5 mM, at least about 10 mM, or at least about 10.5 mM.
- In another aspect, the invention features a plurality of micro fluidic flowcells described herein arranged in parallel. The plurality of flowcells can be used in parallel in any method described herein.
- In another aspect, the disclosure features a diagnostic method that uses the arrays described herein for detecting a mutation in a nucleic acid. Detection can be achieved in a variety of ways including but not limited either through sequencing of the nucleic acids, or hybridization methods.
- One aspect of the invention features methods for reversibly attaching a nucleic acid molecule along its contour to a lipid bilayer. The method comprises: (a) providing the array of
claim 1, wherein the nucleic acid is a DNA molecule coupled to a first fluorescent label that permits visualization of the DNA molecule; (b) applying a hydrodynamic force or an electrophoretic force tangential to the surface of the support to align the DNA molecule in a desired orientation; (c) adding an effective concentration of Ca2+ to the buffer flow; and (d) optionally washing away the Ca2+ from the buffer. In one embodiment, the calcium concentration is at least about 0.5 mM, at least about 1 mM, at least about 1.5 mM, at least about 2 mM, at least about 2.5 mM, at least about 3 mM, at least about 3.5 mM, at least about 4 mM, at least about 4.5 mM, at least about 5 mM, at least about 5.5 mM, at least about 6 mM, at least about 6.5 mM, at least about 7 mM, at least about 7.5 mM, at least about 8 mM, at least about 8.5 mM, at least about 9 mM, at least about 9.5 mM, at least about 10 mM, or at least about 10.5 mM. - Unless otherwise defined, all technical and scientific terms used herein have the same meaning as commonly understood by one of ordinary skill in the art to which this invention belongs. Although methods and materials similar or equivalent to those described herein can be used in the practice or testing of the present invention, suitable methods and materials are described below. In case of conflict, the present specification, including definitions, will control. In addition, the materials, methods, and examples are illustrative only and not intended to be limiting. Other features and advantages of the invention will be apparent from the following detailed description, and from the claims.
-
-
FIGS. 1A-C is a diagram of lipid tethered DNA molecules aligned at a diffusion barrier.FIG. 1A shows a diagram of the total internal reflection fluorescence microscope (TIRFM) used to image single molecules of DNA. For imaging by TIRFM the long DNA molecules (48 kb) used in these studies must be extended parallel to the surface of the sample chamber in order to remain confined within the evanescent field.FIG. 1B-C depict the bilayer on the surface of a fused silica slide along with a barrier and the response of tethered DNA molecules to the application of a hydrodynamic force. The upper and lower panels inFIG. 1B-C depict views from the side and above, respectively. In the absence of buffer flow (FIG. 1B ) the DNA molecules are tethered to the surface, but are not confined within the evanescent field, nor are they aligned at the barrier. As depictedFIG. 1C , when flow is applied, the DNA molecules are dragged through the bilayer until they encounter the diffusion barrier, at which point they will align with respect to one another and form a curtain of DNA molecules. -
FIG. 1D is a schematic of a slide showing thousands of DNA molecules (upper panel) where in the presence of hydrodynamic force, DNA molecules are organized along the leading edge of a diffusion barrier. -
FIG. 1E is a schematic of an overview of a Total Internal Reflection Fluorescence Microscope (TIRFM). -
FIG. 2 is an image of patterned chromium diffusion barriers. The overall design of the desired barrier patterns is shown inFIG. 2A and the key features of the barriers are indicated. A magnified optical image of a single barrier set is shown inFIG. 2B and a composite fluorescence image of a barrier set after deposition of a bilayer containing 0.5% rhodamine-DHPE is shown inFIG. 2C. FIG. 2D shows an optical image at 10x magnification of a 2 x 3 series of barrier sets made of chromium deposited onto fused silica. The upstream and downstream areas are indicated and the arrow shows the direction that buffer would be flowing relative to the barrier patterns. -
FIG. 3 are higher-magnification images for barrier characterization.FIG. 3A shows an AFM image of a 10.5 x 10.5 µm area of fused silica with a 31 nm tall chromium barrier on the surface. An SEM image of a chromium barrier viewed from above is shown inFIG. 3B . The scale bars inFIG. 3B are divided into 100 nm increments. For comparisonFIG. 3C-D show AFM and SEM images, respectively, of barriers made by manually etching the surface. The scale bars inFIG. 3D are divided into 5 µm increments. Note that the width of the manually etched barriers is comparable to the actual length of the λ-DNA molecules. -
FIG. 4 are images of YOYO1-stained λ-DNA curtains assembled at the nano-scale diffusion barriers.FIG. 4A shows the DNA molecules imaged at 60x magnification after they have been aligned at the barriers. The direction of buffer flow is from top to bottom and the dashed lines are to emphasize that this image comes from a surface with multiple barrier sets. There are approximately 805 DNA molecules in this single image (-150, 185, 185, 155, and 130 molecules in the 1st, 2nd, 3rd, 4th, and 5th tiers, respectively).FIG. 4B shows the response of the DNA molecules immediately after stopping buffer flow. This shows that the molecules rapidly retract from the surface, leaving only their tethered ends within the evanescent field. InFIG. 4C , the DNA molecules have begun to diffuse away from the chromium barrier andFIG. 4D shows the same field of view immediately after buffer flow was resumed, causing the DNA molecules to realign at the barriers.FIGS. 4E-G show a 2 x 3 series of barrier sets viewed at 10x magnification with buffer flow on, without buffer flow, and then after resumed flow, respectively. The uneven fluorescence signal in the 10x image is due to heterogeneity in the evanescent field. -
FIG. 5 depicts a physical mapping of a λ-DNA curtain. A curtain of λ-DNA tethered by the left ends of the molecules is shown before (FIG. 5A ) and after (FIG. 5B ) complete digestion with EcoRI, which yields a ∼21 kb tethered product.FIGS. 5C-D show λ-DNA tethered by the right ends before and after digestion with EcoRI, which should yield a 3.5 kb tethered product. The images and histograms inFIG. 5E show the length distributions (measured from the barrier edge to the end of the DNA) of uncut λ-DNA tethered via the left end following a series of successive digests with Nhe I, Xho I, EcoRI, Nco I, Pvu I, and Sph I. The histograms inFIGS. 5F-G show the results of partial EcoRI digests with λ-DNA tethered by either the left or right ends, respectively. Fragments outside the peak values were due to either laser induced double-stranded breaks of the YOYO1 stained DNA or uncut DNA molecules. -
FIG. 6 represents a design strategy for geometric nanowells.FIG. 6A shows a simplified schematic of the TIRFM microscope and the illumination geometry used to generate the evanescent field. To make DNA curtains, the surface of a fused silica sample chamber is coated with a supported lipid bilayer and DNA molecules are anchored by one end to lipids within the bilayer.FIG. 6B shows an illustration of the surface viewed from the side in the presence and absence of buffer flow (right and left panels, respectively). Barriers engineered on the surface disrupt the bilayer and the DNA molecules accumulate against their edges when flow is applied. The pattern of the non-linear, geometric barrier is revealed when view from aboveFIG. 6C , and the DNA molecules load into the vertices of the adjacent triangles. -
FIG. 7 are images of diffusion barriers with geometric nanowells.FIG. 7A shows an image of two barrier patterns in which parallel barriers are made in a sawtooth pattern to form geometric nanowells. This image was collected at 10x magnification after deposition of a supported lipid bilayer containing 0.1% rhodamine-DHPE (shown in red) and the barriers themselves appear black because they are not covered by lipids.FIG. 7B shows an AFM image of a 10 x 10 µm area of fused silica with a 20 nm tall chromium barrier with a representative non-linear, geometric pattern that repeats at 1-µm intervals. SEM images of chromium barriers viewed from above are shown inFIGS. 7C-H . The peak-to-peak distances of these patterns are 2000, 1000, 750, 500, 350, and 200 nm, forFIGS. 7C-H , respectively; SEM images are shown at the same magnification and a 200 nm scale bar is indicated in each for reference. -
FIG. 8 represents DNA curtains with different separation distances. The different panels show examples of sections from YOYO1-stained DNA curtains prepared using non-linear, geometric barrier patterns with spacings of 2000, 1000, 750, 500, 350, and 200 nm, as indicated. Fluorescence cross-sections of the same curtains can be obtained. Intensity histograms from cross-section measurements can be generated. -
FIG. 9 shows that DNA slippage is eliminated with non-linear, geometric barrier patterns. The left panel inFIG. 9A shows a single 100-millisecond image of a section from a DNA curtain assembled at a smooth, linear barrier edge. The DNA molecules are comprised of a 20 kb PCR product stained with YOYO1. The right panel inFIG. 9A shows the kymogram spanning 13.5 seconds of a cross-section of the curtain (as indicated), which illustrates the lateral slippage of the DNA molecules. The left panels inFIG. 9B shows DNA curtains assembled at a non-linear, geometric barrier with 1-µm spacing. The lengths of the DNA molecules were 48.5, 34, 21, 11, and 5 kb, as indicated, and the fragments smaller than the 48.5 kb λ-DNA were generated by restriction digest of λ using W, X, Y, and Z. The right panels inFIG. 9B show 13.5 second kymograms demonstrating that the lateral motion of these DNA is eliminated with the non-linear, geometric barrier patterns. -
FIG. 10 are images of dynamic optical restriction mapping with EcoRI and BamHI. Kymograms shown inFIG. 10A-B show representative examples of real time restriction digests using either EcoRI alone or BamHI alone. The histograms below each set of kymograms represent the measured lengths of the DNA fragments observed during the course of each digest. -
FIGS. 11A-D is a schematic of gated nanowells in the absence and presence of flow (F). Note that the drawings are not to scale, the dimensions of the barriers can be altered to accommodate specific experimental requirements, and the designs rely on nanofabrication techniques (such as electron-beam lithography). -
FIG. 12A is a schematic of the DNA rack for making curtains of double-tethered DNA. The diagram shows the overall design of the barriers elements that comprise the DNA rack. The guide channels are used to direct lipid-anchored molecules of DNA through a gated nanopore and into a staging area. Hundreds or thousands of DNA molecules will be loaded into the staging area, and once loaded these molecules will be pushed through a bifurcated nanochannel into the rack area. The tension-based filter/exit ports reside at the ends of these channels. -
FIG. 12B is a schematic that shows how the rack is loaded with DNA. First, DNA molecules are anchored by both ends to a lipid bilayer coating the surface of the microfluidic sample chamber. Buffer flow is then used to push these molecules into the staging area, and once the staging area is loading with a sufficient number of DNA molecules buffer flow can be terminated. The DNA molecules are retained within the staging area because they can not readily diffuse back out through the gated nanopore. At this stage, a tangential force is applied (either buffer flow or electrophoretic) which pushes the DNA molecules though the bifurcated nanochannel (towards the right hand side in the drawing). DNA molecules will be passed through the exit ports and discarded in they are either (i) broken, (ii) too long, (iii) anchored by only one end, or (iv) have both anchored ends pass through the same side of the bifurcation. In contrast, DNA molecules will be retained within the rack if they are anchored to the bilayer by both ends, the ends of the individual molecules pass through separate sides of the bifurcation, and the DNA is longer then the distance separating the interior edges of the rack, but shorter than the length designated by the dimensions of the tension-based filter/exit ports. The dimension of the overall design can be adjusted to accommodate any desired DNA substrate -
FIG. 13 is a schematic of a DNA rack design of lipid-tethered DNA molecules aligned at a diffusion barrier.FIG. 13A shows a diagram of the total internal reflection fluorescence microscope (TIRFM) used to image single molecules of DNA. For imaging by TIRFM the long DNA molecules (48 kb) used in these studies must be extended parallel to the surface of the sample chamber in order to remain confined within the evanescent field.FIGS. 13B-C depict a cartoon illustration of the bilayer on the surface of a fused silica slide, and a single barrier set comprised of a linear barrier and a series of aligned pentagons separated by nanochannels. Also depicted is the response of tethered DNA molecules to the application of a hydrodynamic force. The magenta circles are the biotinylated ends and the red squares are the digoxigenin labeled ends of the DNA, respectively. The upper and lower panels inFIGS. 13B-C depict views from the side and above, respectively. In the absence of buffer flow (FIG. 13B ) the DNA molecules are tethered to the surface, but are not confined within the evanescent field, nor are they aligned at the barrier. As depicted inFIG. 13C , when flow is applied, the DNA molecules are dragged through the bilayer until they encounter the linear diffusion barrier, at which point they will align with respect to one another and the DIG labeled ends become anchored to the antibody coated pentagons. DNA located between the linear barriers and the pentagons passes through the nanochannels and goes to the next available linear barrier in the pattern. The schematic inFIG. 13D highlights the variable spacing used between adjacent barrier sets within the overall pattern. -
FIG. 14 depicts nanofabrication and characterization of the DNA rack elements.FIG. 14A shows a low magnification (20X) optical image from a section of a surface pattern with variable spacing between the different barrier sets. The distance between the first and second patterns was 100 µm, and the distance between the second and third patterns was 200 µm. A higher resolution optical image of a single barrier set collected at 100X magnification is shown inFIG. 14B and relevant pattern dimensions are indicated. An AFM image is show inFIG. 14C highlighting the height of the linear barriers and the pentagons, as well as the distance between these two barrier elements. An SEM image of a pattern with a single linear barrier and the arrayed pentagons is shown inFIG. 14D . -
FIG. 15 depicts curtains of double-tethered DNA.FIG. 15A shows an example of a double tethered curtain. The DNA molecules were stained with YOYO1 and anchored by one end to the lipid bilayer through a neutravidin-biotin interaction and anchored by the other end via an antibody-hapten linkage. Each vertical line in the region labeled "Double tethered DNA" corresponds to a single fluorescent DNA molecule.FIGS. 15B-C show examples with TIRFM images of DNA curtains aligned at the leading edge of a linear barrier before (upper panel) and after (lower panel) anchoring the second end of the molecules to the antibody coated pentagons through the brief application of a higher flow force. The flow rate used for initial alignment was 20 µl/min, and the flow rate used to anchor the second end of the DNA was 2-3 ml/min (as indicated). All images were taken in the absence of buffer flow. The experiments shown inFIGS. 15A-B used barriers and pentagons made with Ti-Au, DIG labeled DNA molecules and anti-DIG coated pentagons, whereas those shown inFIG. 15C used Cr barriers and pentagons, BrdU labeled DNA molecules, and anti-BrdU coated pentagons (as indicated). In all images, the locations of the linear barriers (L) and pentagons (P) are highlighted. The bright fluorescence signal located above the linear barriers comes from DNA molecules that are only anchored by the biotinylated end to the bilayer. -
FIG. 16 shows the defined orientation of DNA molecules. This figure shows an example of two single tethered DNA curtains with a single DIG-Qdot tag marking the center of the DNA. This needs to be repeated with a double tethered curtain to provide verification that the molecules are all in the same orientation. -
FIG. 17 depicts use of DNA racks to visualize 1D protein diffusion.FIG. 17A shows an example of a double-tethered DNA curtain bound by QD labeled Mlh1-Pms1. The DNA is shown in green and the proteins are magenta. This image represents a single 100-millisecond image taken from a 1-minute video.FIG. 17B shows five representative kymograms made from individual DNA molecules from withinFIG. 17A , as indicated with lower case letters and corresponding arrowheads. -
FIG. 18 is a schematic of a DNA rack design. Conceptual diagram of lipid-tethered DNA molecules aligned at a diffusion barrier.FIG. 18A shows a diagram of the total internal reflection fluorescence microscope (TIRFM) used to image single molecules of DNA. For imaging by TIRFM the long DNA molecules (48 kb) used in these studies must be extended parallel to the surface of the sample chamber in order to remain confined within the evanescent field.FIGS. 18B-C depict a cartoon illustration of the bilayer on the surface of a fused silica slide, and a single barrier set comprised of a linear barrier and a series of aligned pentagons separated by nanochannels. Also depicted is the response of tethered DNA molecules to the application of a hydrodynamic force. The magenta circles are the biotinylated ends and the red squares are the digoxigenin labeled ends of the DNA, respectively. The upper and lower panels inFIGS. 18B-C depict views from the side and above, respectively. In the absence of buffer flow the DNA molecules are tethered to the surface, but are not confined within the evanescent field, nor are they aligned at the barrier. As depicted inFIG. 18C , when flow is applied, the DNA molecules are dragged through the bilayer until they encounter the linear diffusion barrier, at which point they will align with respect to one another and the DIG labeled ends become anchored to the antibody coated pentagons. DNA located between the linear barriers and the pentagons passes through the nanochannels and goes to the next available linear barrier in the pattern. -
FIGS. 19A-D are images that show double tethered curtains of DNA. -
FIGS. 20A-B depicts designs for flowcells. -
FIG. 21 depicts the design and fabrication of DNA racks. A flowcell with two orthogonal channels is shown inFIG. 21A and color-coded arrowheads indicate the two inlet ports along with the corresponding outlet ports. A low magnification (10X) optical image showing the 5 x 5 arrayed patterns of racks on the slide surface is shown inFIG. 21B . The patterns were located at the junction of the intersection buffer channels, as indicated. There were 25 of the 5 x 5 arrays on each slide, for a total of 625 individual DNA racks encompassing a surface area of 2 mm2.FIG. 21C shows a low magnification SEM image with a section of an arrayed pattern of rack elements.FIG. 21D shows a high magnification SEM image of a single rack pattern. A high magnification (100X) optical image of a single rack pattern is shown inFIG. 21E , and the linear barriers, pentagonal anchors, and channels between adjacent pentagons are all indicated. Also shown are color-coded arrowheads highlighting the orientation of the barriers relative to the direction of buffer flow from each of the two separate inlet channels.FIG. 21F shows an AFM image from the section a single rack along with a line profile illustrating the height of the metallic patterns. -
FIG. 22 depicts crisscrossed patterns of DNA. This image contains examples of crisscrossed DNA molecules. The DNA (green) is stained with YOYO1 and the junction points between the DNA molecules are marked with red arrowheads. -
FIG. 23 depicts protein binding distributions measured with nanofabricated DNA curtains.FIGS. 23A-B show an example of fluorescently tagged Msh2-Msh3 bound to curtains of DNA, before and after transiently pausing buffer flow, respectively. Proteins are shown in magenta and the DNA molecules in green.FIG. 23C shows a kymogram of Msh2-Msh3 binding distribution, and the positions of the proteins were measured as described. -
FIG. 24A-D are photographic images that show DNA curtains with different separation distances. PanelsFIGS. 24A-B show examples of DNA curtains assembled at barriers with 1000 nm spacing, in the presence of buffer flow and immediately after pausing flow, respectively. The molecules are 48.5 kb λ DNA stained with YOYO1.FIG. 24C-D show DNA curtains assembled at barriers with 1900 nm spacing, in the presence of buffer flow and immediately after pausing flow, respectively. -
FIG. 24E is a series of photographic images that show DNA curtains with different separation distances. These show examples of sections from YOYO1-stained DNA curtains prepared using non-linear, geometric barrier patterns with spacings of 1900, 1000, 750, 500, 350, and 200 nm, as indicated. The DNA molecules used here are 23kb PCR products derived from the human β-globin locus. -
FIG. 24F shows graphs of fluorescence cross-sections of the same curtains described inFIGS. 24A-E and the distances between some representative examples of adjacent DNA peaks are indicated in micrometers. These images were collected from single flow cells containing different sets of nanowell barriers with the indicated spacing. -
FIG. 24G is a graph that shows a normalized power spectrum of Fourier Transforms from cross-sections of DNA curtains made using non-linear, geometric barrier patterns with spacings of 1900, 1000, 750, and 500 nm. Note that the optical resolution was insufficient to perform this analysis on the 350 and 200 nm barrier patterns. Values for a given distance based on the barrier design, the peak separation found by the FT analysis, and the corresponding observed separation distance are all indicated (inset). -
FIG. 25 is a photographic image that shows single 100-ms images of a section from different DNA curtains assembled at a smooth barrier edge. The YOYO1 stained molecules are comprised of either 48.5 kb λ DNA or a 23 kb PCR product, as indicated. The right panels show kymograms of cross-sections from the same images spanning a duration of 13.5 s, illustrating the lateral slippage of the DNA molecules along the barrier edges. DNA slippage is eliminated with non-linear, geometric barrier patterns, as shown inFIG. 9B . -
FIG. 26A provides photographic images that show examples of DNA curtains assembled with different DNA densities at barriers with 1.9 µm spacing between the nanowells. Fluorescence cross-sections of the same images are shown inFIG. 26B and the colored bars highlight the relative fluorescence signal intensity (in arbitrary units) observed for different numbers of DNA loaded per nanowell, either 1, 2, 3, and >3 DNAs as indicated. This summarizes the loading of single DNA molecules into the nanowells. -
FIG. 26C is a histogram that shows the distribution of DNA occupancy within the nanowells. Under the conditions used here, 44% of the nanowells were loaded with a single DNA molecule. -
FIG. 26D is a photographic image that shows a real time AVaI restriction digest of a single DNA molecule loaded into a geometric nanowell, along with the corresponding graph of signal intensity taken from the indicated cross-section of the kymogram. The injection of AVaI is indicated with a green arrow and the individual DNA cleavage events are indicated with white arrows. Note that there are three AVaI cut sites in the 23kb DNA, but only a subset are cut here because of the low concentration of enzyme injected.FIG. 26E is a photographic image that shows the results of the same AVaI digest when two DNA molecules are loaded into a single nanowell. Here the first cleavage event causes reduction, but not complete loss of the downstream YOYO1 signal. -
FIG. 27 shows photographic images of dynamic optical restriction mapping with EcoRI and BamHI. Kymograms inFIGS. 27A-B show representative examples of real time restriction digests of the λ phage genome using either EcoRI or BamHI. A schematic of X is shown at the left; the tethered end of the DNA is indicated as are the predicted cleavage sites in kilobases (kb) and the observed fragment lengths in micrometers (µm). -
FIG. 28 depicts the visualization of fluorescently tagged recombinant nucleosomes on DNA curtains.FIG. 28A depicts the experimental design; full details of the nanofabrication and DNA curtain assembly can be found in Fazio et al (Langmuir. 24, 10524 - 10531 (2008)). YOYO1-stained DNA curtains (green) bound by QD-tagged nucleosomes are shown inFIG. 28B . The tethered end of each curtain is indicated as T1-T4, and arrows indicate the direction of flow. A kymogram illustrating five nucleosomes on one DNA molecule is shown inFIG. 28C . The nucleosomes disappear when flow is temporarily interrupted (red arrowheads), and reappear when flow is resumed (green arrowheads), verifying they are bound to the DNA and do not interact with the lipid bilayer. A longer kymogram collected without YOYO1 to avoid laser-induced photocleavage of the DNA is shown inFIG. 28D . Insets highlight 30-second windows where flow was transiently paused. Other signal gaps result from QD blinking. During a 25-minute observation 0.9% of the nucleosomes (5 of 580) moved and/or dissociated from the DNA, and the remaining 99.1 % were stationary. -
FIG. 29A shows graphs depicting the predicted and observed nucleosome distribution patterns on bacteriophage λ-DNA. The nucleosome distributions predicted by the Segal (magenta) and FKFM (green) models for λ-DNA are shown. The AT-content of the λ is shown (blue line; calculated with a 100-bp window) superimposed with the distribution of poly(dA-dT) tracts ≥5-mers (gray bars), which are asymmetrically distributed and comprise 3.2% of the phage genome. The observed nucleosome distribution is shown in the lower panel, and is comprised of data from both canonical nucleosomes and nucleosomes bearing H2AZ (FIG. 38A-B ). The theoretical data is shown at 1-bp resolution, and the observed data is compiled into 758-bp bins.FIG. 31 shows examples where the predicted locations are binned to the same resolution as the experimental data. -
FIG. 29B are graphs showing Pearson correlation analysis of the poly(dA-dT) distribution and the observed nucleosome distribution compared to the Segal and FKFM predictions. -
FIG. 30A represents thermodynamic landscapes for centromeric nucleosomes. Photographic images are shown in the presence and absence of buffer flow (1st row); population distribution histograms are depicted in the 2nd row; graphs of overlays with the canonical/H2AZ distributions are shown in the 3rd row; and graphs showing a correlation analysis for nucleosomes bearing Cse4 are shown in the 4th row. -
FIG. 30B represents thermodynamic landscapes for centromeric nucleosomes. Photographic images are shown in the presence and absence of buffer flow (1st row); population distribution histograms are depicted in the 2nd row; graphs of overlays with the canonical/H2AZ and Cse4 distributions are shown in the 3rd and 4th rows, respectively; and graphs showing a correlation analysis for nucleosomes bearing Cse4/Scm3 are shown in the 5th row. -
FIG. 31 shows the predicted and observed nucleosome distribution patterns on human β-globin DNA.FIG. 31A shows an overview of the 82-kb human β-globin locus, highlighting details of the 23-kb fragment (chr11 5,205,941-5,229,259) used in this study. Also shown are the in vivo nucleosome positions (purple) from Schones et al.(Cell. 132, 887 - 898 (2008)), and the ∼7.2-kb deletion spanning most of the δ-globin gene and ∼6-kb of upstream sequence found in Corfu δβ-thalassemia patients. Major ticks are at 1-kb intervals, and minor ticks are in 200-bp subdivisions. The nucleosome distribution patterns predicted by the Segal (magenta) and FKFM (green) models for the 23-kb fragment are shown inFIG. 31B , along with the observed patterns of nucleosome deposition determined by single-molecule imaging (blue).FIG. 31C are graphs that shows Pearson correlation analysis of the observed data for the β-globin locus compared results from the Segal (left panel) and FKFM models (right panel). -
FIG. 32 represents determining target site distribution patterns with single molecule population measurements of DNA curtains.FIG. 32A shows examples of DNA that were labeled at the end or at an internal location with a single fluorescent QD. The DNA was stained with YOYO1 and is shown in green, and the QDs are shown in magenta. The top panels show images acquired during application of buffer flow to stretch the DNA, and the bottom panels show control images taken after transiently terminating buffer flow to verify that neither the DNA molecules nor the QDs were nonspecifically bound to the surface. End-labeled DNA substrates were made by annealing digoxigenin (DIG)-labeled oligonucleotides to the 12-nucleotide overhang at the right end of the λ-DNA. Internally labeled DNA substrates were constructed by treating biotinylated λ-DNA with the nicking enzymes Nb.BsmI and Nt.BstNBI (NEB) to generate nicks flanking a 16-bp region from 26,151-26,166 bps. A DIG-tagged oligonucleotide complementary the 16-bp gap was added to final concentration of 500 nM and incubated at 55°C for 30 min to allow exchange. The reaction was cooled to room temperature followed by the addition of T4 DNA ligase. The DIG-tagged DNA substrates were assembled into DNA curtains, stained with YOYO1 and labeled with anti-DIG QDs. A histogram illustrating the locations of the engineered tags is shown inFIG. 32B . The data was collected under conditions identical to those of nucleosome position assay, and the positions of the tags were measured as described in the Methods. The internal tag was localized to within 37-bp of its actual position, and the end tag was localized to within 153-bp of its know position. -
FIG. 33A-C are photographic images of blots representing the characterization of recombinant nucleosomes.FIG. 33A shows a Coomassie-stained SDS-PAGE of the purified histone octamer made with FLAG-H2B. For single molecule assays nucleosomes were assembled by 48.5-kb λ-DNA or 23-kb PCR fragment of the human β-globin locus made using the Expand 20kb PLUS PCR system (Roche). The nucleosomes were assembled using salt dialysis (see below). The ratio of DNA to histone octamer was varied, and micrococcal nuclease assays were used to verify nucleosome assembly (FIG. 33B). FIG. 33C shows gel shift assays and antibody specificity controls using a smaller PCR fragment. The 280-bp DNA substrate containing a copy of the 601 nucleosome positioning sequence was prepared by PCR. Nucleosome assembly reactions contained 3 µg of DNA and 1.5 to 2-fold molar excess of histone octamer in 1.5 M NaCl, 10 mM Tris-Cl [pH 7.8], 1 mM EDTA. The reactions were dialyzed against a step-wise salt gradient (2h at 1 M NaCl, 2h at 0.8 M NaCl, 2h at 0.6 M NaCl, 2h at 0.4 M NaCl, and 12h at 0.2 M NaCl) and nucleosome formation was verified by gel shift on 4% polyacrylamide. Antibody binding and specificity was also verified by gel shift after incubating 0.5-1 µg of nucleosomes with either anti-FLAG and anti-HA antibodies at 1:1 ratio for 15 minutes at 4°C. -
FIG. 33D-E are graphs corresponding to the reconstitution of nucleosomes for single molecule imaging. -
FIG. 34A demonstrates predicted distributions at differing nucleosome concentrations. The Segal algorithm contains concentration parameters for adjusting the nucleosome density on the DNA (see http://genie.weizmann.ac.il/software/nucleo_ prediction.html).FIG. 34A contains predictions for λ-DNA at a range of concentration parameters as indicated at the top left corner of each panel. The prediction data set used for correlation measurements with experimental data is indicated with an asterisk (*). -
FIG. 34B demonstrates the predicted distributions at differing nucleosome concentrations. The FKFM algorithm contains concentration parameters for adjusting the nucleosome density on the DNA (see http://genie.weizmann.ac.il/software/nucleo_ prediction.html).FIG. 34B contains predictions for λ-DNA at a range of concentration parameters as indicated at the top left corner of each panel. The prediction data set used for correlation measurements with experimental data is indicated with an asterisk (*). -
FIG. 34C-D demonstrates the predicted distributions at differing nucleosome concentrations. The Segal and FKFM algorithms contain concentration parameters for adjusting the nucleosome density on the DNA (see http://genie.weizmann.ac.il/software/ nucleo_prediction.html).FIG. 34C-D contains predictions for the β-globin DNA for each of the models at a range of concentration parameters as indicated at the top left corner of each panel. The prediction data sets used for correlation measurements with experimental data is indicated with an asterisk (*). -
FIG. 35 shows graphs of the predicted distribution analysis and observed data binned at same resolution.FIG. 35A-B show the Segal and FKFM predictions and the observed nucleosome positions divided into 758-bp bins for λ-DNA and the human β-globin DNA fragment, respectively. -
FIG. 36 shows graphs of the anticorrelation of the predictive algorithms. Correlation analysis of the Segal and FKMK predictions relative to one another for λ-DNA (FIG. 36A ) and the human β-globin DNA fragment (FIG. 36B ). -
FIG. 37 shows photographic images of blots used in the characterization of nucleosomes harboring the histone variants.FIG. 37A shows Coomassie-stained SDS PAGE of the reconstituted and purified histone octomers made with either H2AZ, Cse4, or Cse4/Scm3 (hexasomes), as indicated. Gel shift assays and antibody specificity controls using the 280-bp 601 PCR fragment are shown inFIG. 37B . Micrococcal nuclease footprint assays were used to verify nucleosome formation on λ-DNAFIG. 37C . -
FIG. 38A shows graphs of a comparison of canonical and H2AZ nucleosomes. The graphs depict the Segal and FKFM predictions for λ-DNA along with the distribution histograms for canonical and H2AZ-containing nucleosomes, and the overlaid data sets. -
FIG. 38B shows graphs of a comparison of canonical and H2AZ nucleosomes. The graphs demonstrate the correlation between the observed distributions and the theoretical predictions from the two models. -
FIG. 39 represents the nanofabrication and characterization of the DNA rack elements.FIG. 39A shows a low magnification (20X) optical image from a section of a surface pattern with variable spacing between the different barrier sets. The distance between the first and second patterns was 100 µm, and the distance between the second and third patterns was 200 µm. A higher resolution optical image of a single barrier set collected at 100X magnification is shown inFIG. 39B and relevant pattern dimensions are indicated. An AFM image is show inFIG. 39C highlighting the height of the linear barriers and the pentagons, as well as the distance between these two barrier elements. An SEM image of a pattern with a single linear barrier (FIG. 39D ) and the arrayed pentagons (FIG. 39E ) is shown. -
FIG. 40 represents curtains of double-tethered DNA. Curtains of double-tethered DNA.FIG. 40A shows an example of a single tethered curtain, in the absence (upper panel) and presence (lower panel) of buffer flow.FIG. 40B shows an example of a double-tethered DNA curtain in the absence of any buffer flow, illustrating that the DNA molecules remain extended even in the absence of continual hydrodynamic force.FIG. 40C shows the relative anchoring efficiency of the second DNA end as a function of the separation distance between the linear barrier and the polygon array, revealing a peak tethering efficiency corresponding to 13 µm, which is approximately equal to 80% extension of the DNA relative to its full contour length.FIG. 40D shows the percent of digoxigenin-labeled DNA that remains anchored after defined time intervals. -
FIG. 41 is a schematic representation depicting a defined orientation of DNA molecules. This figure shows an example of two single tethered DNA curtains with a single DIG-Qdot tag marking the center of the DNA.FIG. 41A shows a schematic diagram of DNA substrates labeled with anti-DIG tagged quantum dots at two distinct positions.Substrate # 1 is labeled at position 26,166 bp, andsubstrate # 2 is labeled at position 33,791 bp. The ends of the DNA molecules are labeled with biotin and fluorescein, as indicated.FIG. 41B shows examples of single tethered DNA curtains made using eithersubstrate # 1 orsubstrate # 2, and the locations of the biotin tag, the free DNA end, and the quantum dot tag are indicated. The lower panels show the measured distributions of the quantum dots tags for the two different substrates, highlighting the distinct locations.FIG. 41C shows the same type of analysis except that the DNA molecules are anchored to the surface via both ends: the biotin tagged end is coupled to the bilayer and aligned along the barriers, and the fluorescein tagged end is anchored to the antibody-coated polygons. As with the single tethered DNA, the locations of the quantum dots are mapped in the lower panels. -
FIG. 42 demonstrates using DNA racks to visualize 1D protein diffusion.FIG. 42A shows an example of a double-tethered DNA curtain bound by QD labeled Mlh1. The DNA is shown in green and the proteins are magenta. This image represents a single 100-millisecond image taken from a 1-minute video.FIG. 42B shows representative kymograms made from individual DNA molecules from withinFIG. 42A , as indicated with lower case letters and corresponding arrowheads.FIG. 42C shows examples of DNA molecules that broke during the course of DNA collection, demonstrating that both the DNA and the bound proteins diffuse rapidly away from the surface. -
FIGS. 43A-C are schematics that show reversible anchoring of DNA along its contour to a sample chamber surface. -
FIGS. 44A-B are schematics that show non-destructive mapping of homogeneous DNA molecules. -
FIGS. 45A-C are schematics that show non-destructive mapping of heterogeneous DNA molecules. -
FIG. 46 is a schematic that shows formation of barriers either by etching methods (FIG. 46A ) or by lithography techniques (FIG. 46B-C ). -
FIG. 47 are graphs that represent theoretical nucleosome distributions as reported by Segal et al. Nature. 442, 772 - 778 (2006) and Field et al. PLoS Comput Biol. 4, e1000216 (2008). -
FIG. 48 is a schematic representing an overview of post-replicative mismatch repair. -
FIG. 49 is a schematic representing how Msh2-Msh6 survey DNA molecules. -
FIG. 50 represents a TIRFM-based experimental design for probing the dynamics of protein-DNA interactions at the single molecule level.FIG. 50A shows that biotinylated λ-DNA (48,502 bp) was tethered by both ends to solid anchor points on a microfluidic sample chamber surface otherwise coated with a lipid bilayer. Msh2-Msh6 was labeled with quantum dots (QDs) and injected into the sample chamber.FIG. 50B shows images of a YOYO1-stained DNA (green) bound by Msh2-Msh6 (magenta). When the DNA is broken, both it and the bound proteins diffuse away from the sample chamber surface. -
FIG. 51 shows graphs representing general Characteristics of Msh2-Msh6 diffusion.FIG. 51A is a graph that shows representative MSD plots for four different Msh2-Msh6 complexes.FIG. 51B is a histogram of the diffusion coefficients calculated from the tracked proteins. This graph presents the cumulative information derived from 125 tracked complexes of Msh2-Msh6 in buffer containing 50 mM NaCl and either 1 mM ADP (N = 97; shown in red) or 1 mM ATP (N = 28; shown in blue).FIG. 51C shows a plot of the net displacement of Msh2-Msh6 from the origin after a 120 s period.FIG. 51D shows the range spanned by Msh2-Msh6 as it travels back and forth along the DNA over a 120 s period.FIG. 51E is a histogram of the apparent cumulative distance traversed by Msh2-Msh6 in 120 s.FIG. 51F is a histogram showing the average apparent velocities of the proteins calculated from the cumulative distance traveled divided by total time. The means and standard deviations for all plots were determined from Gaussian fits to the binned data. -
FIG. 52 is a schematic representing mechanisms for activation of cleavage. -
FIG. 53 shows graphs representing High-throughput single-molecule analysis of Msh2-Msh6. -
FIG. 54 shows ADP/ATP exchange-mediated dissociation can occur from internal locations and from DNA ends.FIG. 54A shows an example of a kymogram showing one DNA molecule and the bound Msh2-Msh6. Arrowheads highlight the dissociation of Msh2-Msh6.FIG. 54B summarizes the behavior of 510 total Msh2-Msh6 complexes (from three separate experiments) after the injection of ATP into the sample chamber. "Distance traveled before dissociation" (x-axis) corresponds to the distance that Msh2-Msh6 moved prior to falling off the DNA. Dissociation events that occurred from internal positions on the DNA are colored red (N = 149), and those that occurred at the end of the DNA molecules are colored blue (N = 88). -
FIG. 55 depicts a model for DNA scanning by Msh2-Msh6. The biophysical model depicts interactions between Msh2-Msh6 (magenta) and DNA substrates (cyan). Below the DNA is an energy landscape describing its bending propensity (Vlahovicek et al., 2003), wherein the minima in the landscape correlate with regions that are either intrinsically bent or highly flexible. Positions corresponding to deep depressions in the landscape (e.g., lesions or nicks) will interact favorably with the diffusing protein, and the depth of the energy minima will dictate how long the protein remains at any given site. Proteins that locate deep traps can escape in a reaction driven by the exchange of ADP for ATP. -
FIG. 56 shows a photographic image of an example of a double DNA tethered curtain used to visualize the diffusion of Mlh1-Pms1. -
FIG. 57 shows a photographic image of an example of a double DNA tethered curtain used to visualize the diffusion of Mlh1. -
FIGS. 58A-B show graphs representing that Mlh1-Pms1 diffuses on DNA and travels faster than Msh2-Msh6. -
FIG. 59 is an illustration and photographic image that show that Mlh1-Pms1 does not dissociate from blocked DNA ends. -
FIG. 60 is an illustration and photographic image that show that Mlh1-Pms1 does dissociate from free DNA ends. -
FIG. 61 is an illustration and photographic images that show that Mlh1-Pms1 complexes can bypass each other. -
FIG. 62 is a schematic representation showing how an Msh2-Msh6 complex can scan the genome. - The present invention is based in part on the discovery that nucleic acid molecules can be disposed on a substrate and positionally aligned along a non-linear, geometric diffusion barrier according to
claim 1, e.g., a non-linear, geometric nanobarrier, to allow analysis of individual nucleic acid molecules. The methods and compositions described herein include a substrate, a lipid bilayer, and nucleic acid molecules attached directly to the substrate, attached to the substrate via a linkage, or attached to the lipid layer via a linkage. The nucleic acids are capable of interacting with their specific targets while attached to the substrate, and by appropriate labeling of the nucleic acid molecules and the targets, the sites of the interactions between the targets and the nucleic acid molecules can be derived. Because the nucleic acid molecules are positionally defined, the sites of the interactions will define the specificity of each interaction. As a result, a map of the patterns of interactions with nucleic acid molecules on the substrate is convertible into information on specific interactions between nucleic acid molecules and targets. - The invention is based in part on technologies useful for "high-throughput" single molecule research, which can be applied to a variety of systems involving protein-DNA interactions. For example, fluorescent nucleosomes have been reconstituted and it has been shown in the Examples below that DNA curtains can be used to define intrinsic energy landscapes. The invention is also based in part on assays that allow for directly visualization of 1-dimensional diffusion of proteins on DNA. For example, proteins involved in mismatch repair, such as Msh2-Msh6 and Mlh1-Pms1, both diffuse on DNA, but have different characteristics, suggesting that they travel along DNA via distinct mechanisms (see Examples discussed herein).
- As used herein, "geometric diffusion barriers", "geometric barriers", and "geometric barrier patterns" are non-linear, non-smooth diffusion barriers. For example, the non-linear, geometric diffusion barrier can comprise a repetitive series of angles of varying degrees. The non-linear, geometric diffusion barrier can also comprise turns, bends, curves, or interruptions. In one embodiment, the non-linear, geometric diffusion barrier is non-linear over its entire length. In another embodiment, the non-linear, geometric diffusion barrier comprises at least one angle. In a further embodiment, the barrier comprises at least one angle less than 180°. In another embodiment, the non-linear, geometric diffusion barrier comprises at least one angle of varying degrees. In some embodiments, the non-linear, geometric diffusion barrier comprises multiple angles of varying degrees. The non-linear, geometric barriers comprise a repetitive triangular wave producing a sawtooth pattern, that repeats at nanometer-scale intervals (e.g., the interval is at least about 5 nm, at least about, 10 nm, at least about 20 nm, at least about 25 nm, at least about 30 nm, at least about 40 nm, 50 nm, at least about 100 nm, at least about 150 nm, at least about 200 nm, at least about 250 nm, at least about 300 nm, at least about 350 nm, at least about 400 nm, at least about 450, at least about 500 nm, at least about 600 nm, at least about 700 nm, at least about 750 nm, at least about 800 nm, at least about 900 nm, at least about 1000 nm, at least about 1500 nm, or at least about 2000 nm intervals). The vertex of each adjacent triangle of the repetitive triangular wave can form a nanoscale well within the non-linear, geometric barrier. This well can be referred to as a "geometric nanowell." The vertex of each adjacent triangle of the repetitive triangular wave can have peak-to-peak distances of at least about 50 nm, at least about 100 nm, at least about 150 nm, at least about 200 nm, at least about 250 nm, at least about 300 nm, at least about 350 nm, at least about 400 nm, at least about 450, at least about 500 nm, at least about 600 nm, at least about 700 nm, at least about 750 nm, at least about 800 nm, at least about 900 nm, at least about 1000 nm, at least about 1500 nm, or at least about 2000 nm.
- Essentially, any conceivable substrate can be employed in the compositions and methods described herein. The substrate can be biological, nonbiological, organic, inorganic, or a combination of any of these, existing, e.g., as particles, strands, precipitates, gels, sheets, tubing, spheres, containers, capillaries, pads, slices, films, plates, or slides. The substrate can have any convenient shape, such as, e.g., a disc, square, sphere or circle. The substrate and its surface can form a rigid support on which to carry out the reactions described herein. The substrate can be, e.g., a polymerized Langmuir Blodgett film, functionalized glass, Si, Ge, GaAs, GaP, SiO2 SiN4, modified silicon, or any one of a wide variety of gels or polymers such as (poly)tetrafluoroethylene, (poly)vinylidenedifluoride, polystyrene, polycarbonate, or combinations thereof. Other substrate materials will be readily apparent to those of skill in is the art upon review of this disclosure. In some embodiments, the substrate is a made of SiO2 and is flat.
- In some embodiments, the substrate is coated with a linker to which the nucleic acid molecules attach. Such linkers can be, e.g., chemical or protein linkers. For example, the substrate can be coated with a protein such as neutravidin or an antibody.
- The substrate comprises a diffusion barrier, e.g., a mechanical, chemical barrier, or protein barrier. Diffusion barriers can be prepared by applying barrier materials onto the substrate prior to deposition of the lipid bilayer; the bilayer then forms around the barriers. A mechanical barrier can be, e.g., a scratch or etch on the substrate, which physically prevents lipid diffusion.
- In the case of a chemical barrier, the chemical nature of the barrier, and not its surface topography, is the primary factor in preventing lipid diffusion [Powell et al., (2002) Molecular Cell. 10: 1262-1263]. For example, a chemical barrier can comprise a metal, a metal oxide, or a combination thereof. In one embodiment, the metal comprises chromium, aluminum, gold, or titanium. In another embodiment, the metal oxide comprises chromium oxide, aluminum oxide, or titanium oxide. Barrier materials can be made that are similar to the thickness of the bilayer itself (e.g., 6-8 nm), or thinner than the bilayer.
- Protein barriers can be deposited onto substrates, e.g., SiO2 substrates, by a variety of methods. For example, protein barriers can be deposited in well-defined patterns by a process called microcontact printing [Kato et al., (2000). Journal of Human Genetics. 45:133-137; Davies, et al., (2001) Molecular Cell. 7: 273-282]. Microcontact printing uses a PDMS (poly[dimethylsiloxane]) template as a stamp for generating specific patterns on substrates. PDMS stamps can transfer proteins to a SiO2 substrate in patterns with features as small as 1 µm, and thicknesses on the order of 5-10 nm [Kato et al., (2000). Journal of Human Genetics. 45:133-137; Davies, et al., (2001) Molecular Cell. 7: 273-282]. The PDMS stamps used for microcontact printing can be made, e.g., by soft-lithography as described in Davies, et al., (2001) Molecular Cell. 7: 273-282. Once made, the PDMS can be incubated with a solution of protein, dried, and then placed into contact with the substrate, e.g., SiO2 resulting in transfer of the protein "ink" from the PDMS stamp to the substrate and yielding a pattern defined by the stamp design. For example, protein barriers can be made from fibronectin.
- In one embodiment, electron-beam lithography can be used to engineer chromium barriers to lipid diffusion with nanometer (nm) scale features in order to make molecular curtains of DNA suspended above an inert bilayer. The shape of the barriers and the fluidity of the bilayer are used to direct the organization of the DNA into well-defined patterns in which all of the molecules are arranged in the same orientation and aligned with respect to one another. These barriers are simple and robust, they do not interfere with optical imaging of the fluorescent DNA molecules, and they can be precisely constructed at predefined locations on the surface of a microfluidic sample chamber. In another embodiment, the barriers can be generated as depicted in
FIG. 46 . - To the substrate is then attached a layer of a material. The material is one that renders the substrate inert. The material is lipid bilayers. In one embodiment, the layer is made of zwitterionic lipids. A lipid bilayer can be deposited onto the substrate by applying liposomes to the substrate. Liposomes can be produced by known methods from, e.g., 1,2-dioleoyl-sn-glycero-3-phosphocholine (DOPC) or 0.5% biotin-phosphatidylethanolamine (biotin-PE) plus 99.5% DOPC (Avanti Polar Lipids, Alabaster, AL). In some embodiments, the lipid bilayer can include polyethylene glycol (PEG). For example, in embodiments where quantum dots are used to label nucleic acid molecules and/or polypeptides, PEG can be included in the lipid bilayer. PEG can also be included to make the surface of the bilayer inert to reagents added to the array.
- As described herein, the nucleic acid molecules can be attached to the substrate, to the lipid bilayer, or to the non-linear, geometric diffusion barrier, to form an array. The nucleic acid molecules can be attached by a linkage either at one end of the nucleic acid molecule or at both ends. For example, when a protein is coated on the substrate prior to the deposition of the lipid bilayer, the nucleic acid molecule can be linked to a cognate protein that binds to the protein coated on the substrate. In one embodiment, the substrate is coated with neutravidin and the nucleic acid molecule linker is biotin. Linkers can be added to the nucleic acid molecules using standard molecular biology techniques known to those of ordinary skill in the art.
- Alternatively, the nucleic acid molecule can be linked to the lipid bilayer. In one embodiment, the lipid bilayer is deposited onto the substrate and a protein, e.g., neutravidin, is linked to the lipid head groups. Biotinylated nucleic acid molecules are then introduced, linking the nucleic acid molecules to the lipid bilayer.
- In other embodiments, the nucleic acid molecules can be linked to the non-linear, geometric diffusion barriers. In one embodiment, the diffusion barrier is a protein, e.g., biotinylated bovine serum albumin (BSA), deposited on the substrate. Neutravidin is then bound directly to the biotinylated BSA protein barriers, and biotinylated nucleic acid molecules are linked to the biotinylated BSA protein barriers. Other known protein-cognate protein pairs can be used in the methods described herein. For example, antibodies, e.g., anti-digoxigenin antibodies, can be used as protein barriers and the cognate antigen, e.g., digoxigenin, linked to the nucleic acid molecule. In another embodiment, one end of the nucleic acid molecule is attached by a linkage, for example to the substrate or to a non-linear, geometric diffusion barrier. In a further embodiment, both ends of the nucleic acid molecule are attached by linkages, for example, to the substrate, to a non-linear, geometric diffusion barrier, or to a combination of the two surfaces. Double-tethered DNA substrates can be used for visualizing 1D diffusion For example, DNA molecules can be biotinylated at both ends. While a constant, moderate hydrodynamic flow force is applied, DNA is suspended above an inert lipid bilayer. The only interaction between the DNA and the surface is through the biotinylated ends of the molecule. For example, 80% extension of the DNA molecule corresponds to ∼5e-13 N (∼0.5 pN) of force (e.g., where the DNA is not distorted).
- In some embodiments, attaching both ends of a nucleic acid molecule to the barriers, inert substrate, or a combination thereof, can generate a "rack," for example a DNA rack, as shown in
FIGS. 13 ,18 , and21 . In some embodiments, the "rack" can be generated by reversibly anchoring the entire contour length of the nucleic acid molecule (e.g., a DNA molecule) to the lipid bilayer of an array described herein by exposing the nucleic acid molecules to an effective calcium concentration (for example, seeFIG. 43C ). In one embodiment, the calcium concentration is at least about 0.5 mM, at least about 1 mM, at least about 1.5 mM, at least about 2 mM, at least about 2.5 mM, at least about 3 mM, at least about 3.5 mM, at least about 4 mM, at least about 4.5 mM, at least about 5 mM, at least about 5.5 mM, at least about 6 mM, at least about 6.5 mM, at least about 7 mM, at least about 7.5 mM, at least about 8 mM, at least about 8.5 mM, at least about 9 mM, at least about 9.5 mM, at least about 10 mM, or at least about 10.5 mM. - In another embodiment, the attached nucleic acid molecules and/or the interacting nucleic acid molecules or polypeptides are visualized by detecting one or more labels attached to the nucleic acid molecules or polypeptides. The labels can be incorporated by any of a number of means well known to those of skill in the art. The nucleic acid molecules on the array can be coupled to a nonspecific label, e.g., a dye, e.g., a fluorescent dye, e.g., YOYO1 (Molecular Probe, Eugene, OR), TOTO1, TO-PRO, acridine orange, DAPI and ethidium bromide, that labels the entire length of the nucleic acid molecule. The nucleic acid molecules can also be labeled with Quantum dots, as described herein.
- In another embodiment, the nucleic acid molecules, e.g., the nucleic acid molecules on the array or target nucleic acid molecules, can be coupled to a label at defined locations using known methods. The label can be incorporated during an amplification step in the preparation of the sample nucleic acids. For example, polymerase chain reaction (PCR) with labeled primers or labeled nucleotides will provide a labeled amplification product. The nucleic acid molecule is amplified in the presence of labeled deoxynucleotide triphosphates (dNTPs).
- Alternatively, a label can be added directly to the nucleic acid molecule or to an amplification product after an amplification is completed. Means of attaching labels to nucleic acids include, for example, nick translation or end-labeling (e.g. with a labeled RNA) by kinasing of the nucleic acid and subsequent attachment (ligation) of a nucleic acid linker joining the sample nucleic acid to a label (e.g., a fluorophore).
- Detectable labels suitable for use in the methods and compositions described herein include any composition detectable by spectroscopic, photochemical, biochemical, immunochemical, electrical, optical or chemical means. Useful labels include biotin for staining with labeled streptavidin conjugate, magnetic beads (e.g., Dynabeads ™), fluorescent dyes (e.g., fluorescein, Texas red, rhodamine, green fluorescent protein, and the like, see, e.g., Molecular Probes, Eugene, OR), radiolabels (e.g., 3H, 125I, 35S, 14C, or 32P), enzymes (e.g., horse radish peroxidase, alkaline phosphatase and others commonly used in an ELISA), and colorimetric labels such as colloidal gold (e.g., gold particles in the 40-80 nm diameter size range scatter green light with high efficiency) or colored glass or plastic (e.g., polystyrene, polypropylene, latex) beads. Patents teaching the use of such labels include
U.S. Pat. Nos. 3,817,837 ;3,850,752 ;3,939,350 ;3,996,345 ;4,277,437 ;4,275,149 ; and4,366,241 . - In some embodiments, fluorescent labels are used. The nucleic acid molecules can all be labeled with a single label, e.g., a single fluorescent label. Alternatively, different nucleic acid molecules have different labels. For example, one nucleic acid molecule can have a green fluorescent label and a second nucleic acid molecule can have a red fluorescent label. Suitable chromogens which can be employed include those molecules and compounds that absorb light in a distinctive range of wavelengths so that a color can be observed or, alternatively, which emit light when irradiated with radiation of a particular wave length or wave length range, e.g., fluorescers.
- A wide variety of suitable dyes are available, being primary chosen to provide an intense color with minimal absorption by their surroundings. Illustrative dye types include quinoline dyes, triarylmethane dyes, acridine dyes, alizarine dyes, phthaleins, insect dyes, azo dyes, anthraquinoid dyes, cyanine dyes, phenazathionium dyes, and phenazoxonium dyes.
- A wide variety of fluorescers can be employed either by alone or, alternatively, in conjunction with quencher molecules. Fluorescers of interest fall into a variety of categories having certain primary functionalities. These primary functionalities include 1- and 2-aminonaphthalene, p,p'-diaminostilbenes, pyrenes, quaternary phenanthridine salts, 9-aminoacridines, p,p'-diaminobenzophenone imines, anthracenes. oxacarbocyanine, marocyanine, 3-aminoequilenin, perylene, bisbenzoxazole, bis-p-oxazolyl benzene, 1,2-benzophenazin, retinol, bis-3-aminopyridinium salts, hellebrigenin, tetracycline, sterophenol, benzimidzaolylphenylamine, 2-oxo-3 -chromen, indole, xanthen, 7-hydroxycoumarin, phenoxazine, salicylate, strophanthidin, porphyrins, triarylmethanes and flavin. Individual fluorescent compounds that have functionalities for linking or that can be modified to incorporate such functionalities include, e.g., dansyl chloride; fluoresceins such as 3,6-dihydroxy-9-phenylxanthhydrol; rhodamineisothiocyanate; N-phenyl 1-amino-8-sulfon-atonaphthalene; N-phenyl 2-amino-6-sulfonatonaphthalene: 4-acetamido-4-isothiocyanato-stilbene-2,2'-disulfonic acid; pyrene-3-sulfonic acid; 2-toluidinonaphthalene-6-sulfonate; N-phenyl, N-methyl 2-aminoaphthalene-6-sulfonate; ethidium bromide; stebrine; auromine-0,2-(9'-anthroyl)palmitate; dansyl phosphatidylethanolamine; N,N'-dioctadecyl oxacarbocyanine; N,N'-dihexyl oxacarbocyanine; merocyanine, 4(3'pyrenyl)butyrate; d-3-aminodesoxy-equilenin; 12-(9'anthroyl)stearate; 2-methylanthracene; 9-vinylanthracene; 2,2'(vinylene-p-phenylene)bisbenzoxazole; p-bis[2-(4-methyl-5-phenyl-oxazolyl)]benzene; 6-dimethylamino-1,2-benzophenazin; retinol; bis(3'-aminopyridinium) 1,10-decandiyl diiodide; sulfona-phthylhydrazone of hellibrienin; chlorotetracycline; N(7-dimethylamino-4-methyl-2-oxo-3-chromenyl)maleimide; N-[p-(2-benzimidazolyl)-phenyl]maleimide; N-(4-fluoranthyl)-maleimide; bis(homovanillic acid); resazarin; 4-chloro-7-nitro-2,1,3benzooxadiazole; merocyanine 540; resorufin; rose bengal; and 2,4-diphenyl-3(2H)-furanone.
- The label can be a "direct label", i.e., a detectable label that is directly attached to or incorporated into the nucleic acid molecule. Alternatively, the label can be an "indirect label", i.e., a label joined to the nucleic acid molecule after attachment to the substrate. The indirect label can be attached to a binding moiety that has been attached to the nucleic acid molecule prior to attachment to the substrate. For a detailed review of methods of labeling nucleic acids and detecting labeled hybridized nucleic acids see M. Anderson's Nucleic Acid Hybridization, Springer Verlag, N.Y., (1999)) and Sambrook and Russell, Molecular Cloning A Laboratory Manual, Cold Spring Harbor Laboratory Press, NY (3rd edition, 2001).
- Polypeptides can be visualized by coupling them to, e.g., fluorescent labels described herein, using known methods. Alternatively, other labels, such as Quantum dots (Invitrogen) can be used, as described herein.
- As discussed above, the use of a fluorescent label is an embodiment of the invention. Standard procedures are used to determine the positions of the nucleic acid molecules and/or a target, e.g., a second nucleic acid molecule or a polypeptide. For example, the position of a nucleic acid molecule on an array described herein can be detected by the signal emitted by the label. In other examples, when a nucleic acid molecule on the array and a target nucleic acid molecule or polypeptide are labeled, the locations of both the nucleic acid molecules on the array and the target will exhibit significant signal. In addition to using a label, other methods can be used to scan the matrix to determine where an interaction, e.g., between a nucleic acid molecule on an array described herein and a target, takes place. The spectrum of interactions can, of course, be determined in a temporal manner by repeated scans of interactions that occur at each of a multiplicity of conditions. However, instead of testing each individual interaction separately, a multiplicity of interactions can be simultaneously determined on an array, e.g., an array described herein.
- In certain embodiments, the array is excited with a light source at the excitation wavelength of the particular fluorescent label and the resulting fluorescence at the emission wavelength is detected. In certain embodiments, the excitation light source is a laser appropriate for the excitation of the fluorescent label.
- Detection of the fluorescence signal can utilize a microscope, e.g., a fluorescent microscope. The microscope can be equipped with a phototransducer (e.g., a photomultiplier, a solid state array, or a ccd camera) attached to an automated data acquisition system to automatically record the fluorescence signal produced by the nucleic acid molecules and/or targets on the array. Such automated systems are known in the art. Use of laser illumination in conjunction with automated confocal microscopy for signal detection permits detection at a resolution of better than about 100 µm, better than about 50 µm, and better than about 25 µm.
- The detection method can also incorporate some signal processing to determine whether the signal at a particular position on the array is a true positive or can be a spurious signal. For example, a signal from a region that has actual positive signal can tend to spread over and provide a positive signal in an adjacent region that actually should not have one. This can occur, e.g., where the scanning system is not properly discriminating with sufficiently high resolution in its pixel density to separate the two regions. Thus, the signal over the spatial region can be evaluated pixel by pixel to determine the locations and the actual extent of positive signal. A true positive signal should, in theory, show a uniform signal at each pixel location. Thus, processing by plotting number of pixels with actual signal intensity should have a clearly uniform signal intensity. Regions where the signal intensities show a fairly wide dispersion, can be suspect and the scanning system can be programmed to more carefully scan those positions.
- Total internal reflection fluorescence microscopy (TIRFM) is used to detect the nucleic acid molecules and polypeptides described herein. For TIRFM, a laser beam is directed through a microscope slide and reflected off the interface between the slide and a buffer containing the fluorescent sample. If the angle of incidence is greater than the critical angle [θc=sin-1(n2/n1); where n1 and n2 are the refractive indexes of the slide and aqueous samples, respectively], then all of the incident light is reflected away from the interface. However, an illuminated area is present on the sample side of the slide. This is called the evanescent wave, and its intensity decays exponentially away from the surface [Axelrod, D., (1989) Methods Cell Biol. 30:245 - 70; Forkey et al., (2000) Progress in Biophysics & Molecular Biology. 74:1-35.]. For most applications the evanescent wave penetrates approximately 100 nm into the aqueous medium. This geometry reduces the background signal by several orders of magnitude compared to conventional fluorescence microscopy and readily allows the detection of single fluorescent molecules, because contaminants and bulk molecules in solution are not illuminated and do not contribute to the detected signal. [Forkey et al., (2000) Progress in Biophysics & Molecular Biology. 74:1-35]. By using TIRFM to visualize the arrays described herein, it is possible to simultaneously monitor hundreds of aligned DNA molecules within a single field-of-view.
- The methods described herein use micro fluidic flowcells composed of substrates that are rendered inert by deposition of a lipid bilayer as described herein. For example, DNA molecules can be suspended above an inert lipid bilayer. By applying a hydrodynamic force to the arrays described herein, the attached nucleic acid molecules are aligned in a desired orientation that is optimal for detection by, e.g., TIRFM. In one embodiment, a hydrodynamic force can be used to organize DNA molecules along the leading edge of a nanoscale diffusion barrier, for example a non-linear, geometric diffusion barrier. In another embodiment, an electrophoretic force can be used to organize DNA molecules along the edge of a barrier. Thousands of DNA molecules can be visualized in a single experiment using an array described herein. All molecules are physically aligned with one another.
- A micro fluidic flowcell that can be used in the methods described herein is depicted in
FIG. 20 . Generally, a substrate described herein is overlaid with a coverslip, e.g., a glass coverslip, to form a sample chamber, and the substrate contains an inlet port and an outlet port, through which a hydrodynamic force is applied. The hydrodynamic force can be mediated by, e.g., a buffer solution that flows over the lipid bilayer described herein. An exemplary micro fluidic flowcell can be constructed from 76.2 x 25.4 x 1 mm (L x W x H) fused silica slides (ESCO Products, Oak Ridge, NJ). Inlet and outlet holes can be drilled through the slides using, e.g., a diamond-coated bit (1.4 mm O.D.; Eurotool, Grandview, MO). A sample chamber can be prepared from a borosilicate glass coverslip (Fisher Scientific, USA) and, e.g., double-sided tape (-25 µm thick, 3M, USA) or a polyethylene gasket. Inlet and outlet ports can be attached using preformed adhesive rings (Upchurch Scientific, Oak Harbor, WA), and cured at 120°C under vacuum for 2 hours. The dimensions of the exemplary sample chamber are 3.5 x 0.45 x 0.0025 cm (L x W x H). The total volume of the exemplary flowcell is ∼ 4 µl. A syringe pump (Kd Scientific, Holliston, MA) is used to control buffer delivery to the sample chamber. This exemplary apparatus is not meant to be limiting, and one of skill in the art would appreciate modifications that could be made. - A total internal reflection fluorescence microscope is depicted in FIG. IE. An exemplary microscope is a modified Nikon TE2000U inverted microscope. [Groves, et al., (1998) Langmuir 14: 3347-3350] A 488 nm laser (Coherent Inc., Santa Clara, CA) and a 532 nm laser (CrystaLaser, Reno, NV) were focused through a pinhole (10 µm) using an achromatic objective lens (25x; Melles Griot, Marlow Heights, MD), then collimated with another achromatic lens (f = 200 mm). The beam was directed to a focusing lens (f = 500 mm) and passed through a custom-made fused silica prism (J.R. Cumberland, Inc) placed on top of the flowcell. Fluorescence images were collected through an objective lens (100 x Plan Apo, NA 1.4, Nikon), passed through a notch filter (Semrock, Rochester, NY), and captured with a back-thinned EMCCD (Cascade 512B, Photometrics, Tucson, AZ). Image acquisition and data analysis were performed with Metamorph software (Universal Imaging Corp., Downington, PA). All DNA length measurements were performed by calculating the difference in y-coordinates from the beginning to the end of the fluorescent molecules. Diffusion estimates for the lipid-tethered DNA substrates were performed by manually tracking the tethered ends of four different molecules, and diffusion coefficients were calculated using: D = MSD/4t; where MSD (the mean square displacement) is the square of the average step size measured over time interval t (0.124 sec) [Kelman, Z., (1997) Oncogene 14:629-640.].
- The arrays described herein can be used to detect individual nucleic acid molecules, e.g., nucleic acid molecules coupled to a label. For example, an array can be constructed as part of a microfluidic flowcell described herein. The nucleic acid molecules, e.g., labeled nucleic acid molecules, can be attached to a substrate, to a lipid bilayer, or to a non-linear, geometric diffusion barrier, as described herein. Upon the application of hydrodynamic force, e.g., introduction of a buffer as described herein, the nucleic acid molecules are aligned in direction of the hydrodynamic force, with the nonattached ends of the nucleic acid molecules extending in the direction of the flow of the hydrodynamic force. Individual nucleic acid molecules on the array can be visualized before and/or after the application of the hydrodynamic force using, e.g., TIRFM as described herein.
- In some embodiments, the interactions of nucleic acid molecules on the arrays with target polypeptides are determined. The nucleic acid molecules can be visualized before and/or after the application of a hydrodynamic force, as described herein. To visualize the interactions with target polypeptides, the polypeptides can be coupled to a label and introduced into the array, e.g., a microfluidic cell including the array, as a component of the buffer that mediates the hydrodynamic force. Individual nucleic acid molecules and individual target polypeptides can be visualized, e.g., by TIRFM as described herein, and interactions can be determined by co localization of the signals from the nucleic acid molecules and the polypeptides. Such interactions can be further analyzed by collecting signals over a period of time. Such methods can be used to visualize, e.g., the movement of polypeptides along the length of individual nucleic acid molecules, as described herein.
- The methods and compositions described herein can be used to screen for compounds, e.g., drug compounds, that affect, e.g., disrupt, the interactions between nucleic acid molecules and polypeptides. For example, an array can be constructed as part of a microfluidic flowcell described herein. The nucleic acid molecules, e.g., labeled nucleic acid molecules, can be attached to a substrate, to a lipid bilayer, or to a non-linear, geometric diffusion barrier, as described herein. To visualize the interactions with target polypeptides, the polypeptides can be coupled to a label and introduced into the array, e.g., a microfluidic cell including the array, as a component of the buffer that mediates the hydrodynamic force. In some embodiments, the polypeptides are known to interact with the nucleic acid molecules, and the interactions are visualized as described herein. For example, the polypeptides can be proteins involved in DNA replication, recombination and/or repair. Candidate compounds can then be added to the array, e.g., as a component of the buffer that mediates the hydrodynamic force, and the effect of the compound on the interactions between individual nucleic acid molecules and the polypeptides can be visualized. Compounds that disrupt the interactions can be visually identified. Such methods can be automated.
- For example, the methods described herein can be used to screen for therapeutic compounds to treat cancer, e.g., cancer of the breast, prostate, lung, bronchus, colon, rectum, urinary bladder, kidney, pancreas, oral cavity, pharynx, ovary, skin, thyroid, stomach, brain, esophagus, liver, cervix, larynx, soft tissue, testis, small intestine, anus, anal canal, anorectum, vulva, gallbladder, bones, joints, hypopharynx, eye, nose, nasal cavity, ureter, gastrointestinal tract; non-Hodgkin lymphoma, Multiple Myeloma, Acute Myeloid Leukemia, Chronic Lymphocytic Leukemia, Hodgkin Lymphoma, Chronic Myeloid Leukemia and Acute Lymphocytic Leukemia.
- The methods and compositions described herein can be used to sequence nucleic acid molecules. The arrays described herein can be constructed with identical nucleic acid molecules, e.g., single stranded DNA molecules, or with different nucleic acid molecules, e.g., single stranded DNA molecules. Before attaching the DNA molecules to the substrate, an oligonucleotide primer is annealed to the DNA molecules. Polymerase is then added along with the fluorescent dNTP mix. Such methods are known in the art. Fluorescent nucleotide analogs that do not terminate extension of the DNA strand are used. The DNA molecules are then attached to the substrate and the array is visualized as described herein. The color of the nucleotide incorporated into the growing chain reveals the sequence of the DNA molecules. If all of the DNA molecules within the array are identical, then the incorporation of the first nucleotide during polymerization will yield a fluorescent line extending horizontally across the array. Subsequent nucleotide addition will also yield horizontal lines and the color of each line will correspond the DNA sequence. When sequencing different DNA molecules, the differences in DNA sequences are revealed as the incorporation of different fluorescent nucleotides across the array, rather than the lines of identical color seen when sequencing identical DNA molecules. In some embodiments of the disclosure, these methods are automated.
- Examples are provided below to facilitate a more complete understanding of the present invention. The following examples illustrate the exemplary modes of making and practicing the present invention. However, the scope of the invention is not limited to specific embodiments disclosed in these Examples, which are for purposes of illustration only.
- Single molecule visualization of protein-DNA complexes can reveal details of reaction mechanisms and macromolecular dynamics inaccessible to traditional biochemical assays. However, these techniques are often limited by the inherent difficulty of collecting statistically relevant information from experiments explicitly designed to look at single events. New approaches that increase throughput capacity of single molecule methods have the potential for making these techniques more readily applicable to a variety of biological questions involving different types of DNA transactions. Here we present a method for organizing DNA molecules into curtains along the leading edges of nanofabricated chromium barriers, which are located at strategic positions on a fused silica slide otherwise coated with a supported lipid bilayer. The individual molecules that make up the DNA curtains are visualized by total internal reflection fluorescence (TIRFM) allowing simultaneous imaging of thousands of perfectly aligned molecules. These DNA curtains present a robust and powerful experimental platform portending massively parallel data acquisition of individual protein-DNA interactions in real time.
- Single-molecule techniques have revealed many insights into previously inaccessible aspects of biology and this field is now poised to profoundly impact the way that all biological macromolecules can be studied. However, many single-molecule methods suffer from disadvantages that limit their broader application, and meeting the oncoming challenges will require the development of more robust, user-friendly, high-throughput experimental platforms that can be readily applied to a broad range of biochemical systems.
- For example, one common problem of many single molecule techniques is the requirement for the macromolecules under investigation be anchored to a solid support surface, which is unlike anything encountered within a cellular environment. It is essential to minimize nonspecific interactions with the surface that can perturb their biological properties. Traditional approaches for passivating surfaces have included nonspecific blocking agents (e.g. BSA or casein) or covalent modification with polyethylene glycol (PEG) (A1, A2). Nonspecific blocking proteins often do not work well enough to prevent surface adsorption of other molecules (A3). PEGylated surfaces are efficient at preventing nonspecific interactions between proteins or nucleic acids and the underlying surface, but PEG alone can not be sufficient in all cases. More recently, vesicle encapsulated reactions have been used in single molecule analysis (A4, A5). Vesicle encapsulation is a very promising approach that makes use of the native environment provided by lipid membranes, but has limited potential for biochemical experiments involving macromolecules that can not be confined within vesicles or those requiring successive addition of high-molecular weight components.
- Single molecule techniques are also impeded by the difficulty of collecting statistically relevant information using procedures designed to image just one or at best a few molecules at any given time. This can be problematic when the reactions under investigation require the use of long DNA substrates, especially when the reactions themselves are inefficient and/or involve rare intermediates. Procedures for anchoring numerous, long DNA molecules to surfaces are present in the literature, and each has great potential for specific situations, but they also suffer from specific drawbacks with respect to biochemical applications. For example Bensimon et al., developed "DNA combing" (A6), which has evolved into a powerful tool (reviewed in (A7)). Combed DNA is anchored to a hydrophobic glass slide, and aligned with a receding air-water meniscus, yielding molecules adhered to the glass by multiple contact points and stretched ∼150 percent beyond the length of normal B-DNA. The hydrophobic surfaces required for combing and the resulting distortion of the DNA can not be compatible with many proteins. In addition, while the combed DNA molecules are aligned along a common direction their ends are not aligned relative to one another nor is the orientation of the DNA defined with respect to its sequence. In another elegant approach, Kabata and colleagues reported that "belts" of λ-DNA could be stretched between two aluminum electrodes by dielectrophoresis, which they used to visualize the motion of RNAP and EcoRI by fluorescence microscopy (A8, A9). However the molecules in these belts are not oriented in the same direction with respect to their sequence, it remains unclear how the DNA links to the aluminum, and broader use of this technique has not been realized (A10). Recently, Guan and Lee have demonstrated that highly ordered arrays of DNA molecules can be stamped onto PDMS (polydimethyl siloxane) with an intriguing method based on molecular combing (A11). This technology is promising, but protein adsorption to unmodified PDMS can present a limitation for biochemical applications. Prentiss and colleagues have used an approach in which magnetic beads were linked to the free ends of DNA molecules anchored to a glass surface (A12). Kim et al., reported a similar approach, in which they anchored molecules of λ-DNA to a PEGylated surface and stretched the DNA with buffer flow (A13). In each of these examples they concurrently detect ∼100-200 molecules, but required 10x magnification to expand the field-of-view, thus the overall density of the anchored DNA remained quite low (A13). Finally, Schwartz and co-workers have pioneered single DNA molecule optical mapping techniques (A14, A15), but these approaches may not be applicable for real time biochemical analysis of protein-DNA interactions.
- To address these challenges we have developed "DNA curtains", which allow simultaneous imaging of on the order of one hundred individual DNA molecules within a single field-of-view (A16). Curtains are assembled by anchoring one end of a biotinylated DNA molecule to a lipid bilayer, which provides an inert environment compatible with a wide range of biological molecules (A17). The bilayer also permits long-range two-dimensional motion of the lipid-tethered DNA molecules. We have taken advantage of this mobility by using hydrodynamic force to organize the DNA molecules at microscale diffusion barriers, which are manually etched into the surface of the flowcell and oriented perpendicular to the direction of buffer flow. Lipids within the bilayer can not traverse the etched barrier (A18), therefore the lipid-tethered DNA molecules accumulate along the leading edges of these barriers (A16). A drawback of this approach is that manual etching greatly limits user control over the dimensions and locations of the microscale diffusion barriers. The etched barriers also compromise the quality of the optical surface, leading to problems such as light scattering, uneven alignment of DNA, nonspecific protein adsorption, inefficient coverage of the viewing area, and a high failure rate. Together these problems can undermine the use of DNA curtains for single-molecule biological research.
- In this work, we use electron-beam lithography to engineer chromium barriers to lipid diffusion with nanometer (nm) scale features in order to make molecular curtains of DNA suspended above an inert bilayer. The shape of the barriers and the fluidity of the bilayer are used to direct the organization of the DNA into well-defined patterns in which all of the molecules are arranged in the same orientation and aligned with respect to one another. These barriers are simple and robust, they do not interfere with optical imaging of the fluorescent DNA molecules, and they can be precisely constructed at predefined locations on the surface of a microfluidic sample chamber. Using these nanoscale barriers we can concurrently image several hundred and even several thousand aligned DNA molecules in a single field-of-view. These uniform patterns of DNA provide a unique and powerful experimental platform enabling massively parallel data acquisition from thousands of individual molecules and offer a myriad of potential applications.
- Nanoscale barriers to lipid diffusion. The use of mechanical or chemical barriers to corral lipids within supported bilayers has been pioneered by S.G. Boxer and colleagues (A20). Inspired by these studies, we demonstrated that mechanical barriers to lipid diffusion can also be used to organize DNA molecules into curtains at defined locations on a fused silica surface (A16). We have shown that these curtains serve as a highly effective experimental platform for the study of protein-DNA interactions at the single molecule level (A21-23). The general principles behind this approach are outlined in
FIG. 1 . To make the curtains, DNA is first anchored by one end to a supported lipid bilayer coating the surface of the sample chamber (FIGS. 1B and 1C ). In the absence of a hydrodynamic force the molecules are randomly distributed on the surface, but lie outside of the detection volume defined by the penetration depth of the evanescent field (∼150-200 nm) (A24). Application of flow pushes the DNA through the sample chamber with one end anchored to the bilayer. The barriers are oriented perpendicular to the direction of flow at strategic locations in the path of the DNA (FIGS. 1B and 1C ); this halts the movement of the molecules causing them to accumulate at the edges of the barriers where they are extended parallel to the surface, enabling visualization along their full contour length by TIRFM (A16). - In the past we used micrometer-scale diffusion barriers prepared by manually scoring the surface with a diamond-tipped scribe (A16, A19, A21-23). Manual etching is simple, yet inherently problematic because it is difficult to control. As an alternative we sought to apply lithographic techniques for generating precisely nanoscale patterned barriers that could be used to organize DNA molecules into curtains, making the most efficient use of available surface area.
FIG. 2A shows a cartoon representation of a desired surface pattern comprised of an interlocking series of bracket-shaped barriers, and the important features of the design are indicated. Guide channels oriented parallel to the direction of flow ensure efficient capture of approaching DNA molecules tethered to the bilayer. Perpendicular barriers form the "curtain rods" against which the DNA molecules are aligned. The parallel barriers of the guide channels also prevent the molecules from sliding off the edges of the perpendicular barriers when buffer flow is transiently paused (see below). Collectively, these features can organize the tethered DNA molecules into curtains wherein all of the constituent molecules are aligned in the same orientation. - An optical image of a chromium barrier pattern with the afore-mentioned design elements prepared by direct-write electron beam (E-beam) lithography is shown in
FIG. 2B . Fluorescence images of the same type of barrier collected at 60x magnification after deposition of a supported bilayer containing fluorescent lipids (0.5% rhodamine-DHPE), confirm that the lipids coat the fused silica, but that they do not cover the chromium barriers (FIG. 2C ) (A20). The image inFIG. 2D shows a section of fused silica surface with a 2 x 3 series of chromium barrier sets.FIG. 3A shows an atomic force microscopy (AFM) image illustrating a representative single barrier that is 31 nm tall, and we have also made functional patterns with barriers ranging from 20.5 nm up to 173 nm. The height of the barriers is dictated by the amount of chromium evaporated onto the surface and can be accurately controlled as required for specific experimental needs.FIG. 3B shows a scanning electron microscopy (SEM) image of a parallel chromium barrier revealing awidth 100 ± 9 nm. As a point of comparison,FIGS. 3C-D show AFM and SEM images of manually etched barriers, respectively. In contrast to the highly uniform chromium barriers, the width of the etched barriers can be on the order of ∼5-10 µm and they also have highly irregular topology, as previously reported (A18). - Assembly of DNA curtains at nanoscale curtain rods. To assemble DNA curtains, biotinylated λ-DNA is tethered to the bilayer through tetravalent neutravidin that is in turn attached to a subset of lipids that have biotinylated head groups. The DNA molecules are pushed in the direction of the diffusion barriers through the application of a flow force. The initial application of buffer flow pushes the DNA into the barrier patterns where they accumulate at the ends of the guide channels. Once all of the molecules have accumulated within the barriers, flow is briefly terminated, allowing the molecules to diffuse freely within the bilayer. This step permits the DNA molecules to diffuse laterally within the bilayer so that they become evenly distributed along each of the barriers. The DNA molecules themselves are retained within the barrier set because flow is not stopped long enough to allow them to diffuse out of the guide channel openings. Flow can then be resumed to assess the distribution of the DNA, and if necessary this process is repeated at short intervals to achieve even disbursement of the DNA along the barrier edges (see Materials and Methods).
-
FIG. 4A shows an image with YOYO1 stained λ-DNA (48,502 bp) organized into curtains within a five-tiered barrier set. There are -805 individual, molecules of λ-DNA in this field-of-view. When flow is transiently terminated, the DNA molecules diffuse up away from the surface and out of the evanescent field (FIG. 4B ). This is a control used to verify that the DNA molecules are anchored by only one end to the sample chamber surface. Any molecules nonspecifically adsorbed to the surface will remain extended when flow is transiently paused and, if necessary, these molecules can be excluded from any further analysis. When flow is stopped for longer than a few seconds the anchored DNA molecules also begin to move away from the barrier edges, showing that they are not irreversibly anchored to the strips of chromium or otherwise immobilized to the surface (FIG. 4C ). When flow is resumed the DNA molecules are pushed back into the diffusion barriers (FIG. 4D ). If continuous buffer flow is maintained the λ-DNA molecules do not diffuse laterally, but rather remain in a single location along the barrier edge, ensuring that individual molecules can be readily tracked over time. However, shorter DNA fragments exhibit lateral diffusion when pushed against the barriers under the same flow conditions used for λ-DNA (see below). -
FIGS. 4E-G show a 2 x 3 array of six-tiered barrier patterns containing λ-DNA curtains viewed at 10x magnification. There are roughly 1,000 of these 48.5 kb DNA molecules per barrier set and 6 sets of barriers, corresponding to a total content of at least 6,000 individual DNA molecules in this single field-of-view. The amount of DNA applied to the surface, the fraction of biotinylated lipid, the spacing between barrier sets, the number of barriers, and the width of the guide channel openings all dictate the total amount of DNA aligned at any given barrier. Any of these variables can be controlled to adjust the number of DNA molecules as needed. - Orientation specificity and optical restriction mapping of DNA curtains. The design of the curtains should yield DNA molecules all aligned with the same sequence orientation based upon the location of the biotin tag. If some fraction of the DNA is bound to the bilayer via its unlabeled end, then this second population of DNA will have reversed sequence orientation with respect to those molecules anchored via the biotin tag. Verifying the alignment is critical for future experiments meant to probe the sequence-dependent behavior of DNA bound proteins. λ-DNA has five EcoRI restriction sites located 21,226 bp, 26,106 bp, 31,747 bp, 39,168 bp and 44,972 bp from the left end of the molecules. If the molecules are in a given orientation, then complete EcoRI digestion of λ-DNA anchored by its left end will yield a tethered fragment of approximately 21 kb, and all of the downstream fragments will be washed from the sample chamber. Similarly, an EcoRI digestion of a curtain comprised of λ-DNA biotinylated at the right end should yield much smaller fragments corresponding to a final length of 3.5 kb.
FIGS. 4A-D confirm these predictions, proving that all of the DNA molecules making up the curtain are tethered in the same orientation. - Optical restriction mapping has evolved into a powerful technique for the physical analysis of large DNA molecules (A14, A15, A25), and because the DNA curtains are organized with all of the molecules in a defined orientation they provide a very simple platform for mapping the locations of specific restriction sites. As shown in
FIG. 5E , different combinations of single restriction sites can be easily mapped within the DNA curtain by successive introduction of the desired enzymes into the flowcell. In this example, the curtain was sequentially cut with NheI, XhoI, EcoRI, NcoI, PvuI, and SphI, and the observed lengths (µm) of the resulting DNA fragments were measured and plotted as a histogram to illustrate the location of the cleavage sites. As shown here, complete restriction digests leave behind tethered DNA fragments whose lengths correspond to the cleavage site closest to the biotinylated ends of the DNA, and any other downstream fragments are washed away. Complete restriction digests can only reveal single cleavage sites, and can not be used to map multiple, identical restriction sites throughout the DNA molecules. In contrast, a partial digest with one or more restriction enzymes should yield a population of discrete fragments whose lengths correspond to each of the restriction sites present in the DNA molecules. To verify this prediction, we preformed a partial EcoRI digest of curtains made with DNA molecules that were tethered by either the right or the left ends. The apparent lengths of the resulting DNA fragments were then measured and their distributions plotted as histograms (FIGS. 5F-G ). This partial digest strategy was sufficient to identify all five EcoRI sites within the phage λ genome. Together these experiments demonstrate that the locations of restriction sites within large molecules can be rapidly identified via optical mapping of the DNA curtains. - The DNA fragment lengths reported above are indicated in microns, and represent an apparent, observed value rather than a direct measure of the actual contour length. To estimate the actual size of any DNA fragment in either microns or base pairs the observed contour length of the DNA in microns must be corrected for the fact that the molecules are not fully extended. The mean extension (x)/L of the DNA molecules examined in this study was approximately 0.80, corresponding to ≈6e-13 N (≈0.6 pN) of tension. A plot of all the different measured DNA fragment contour lengths in µm versus the known length of fully extended DNA fragments based on their size in either microns or base pairs can be used as a calibration curve to estimate the actual size of the DNA fragments. Although sufficient for estimating the number of base pairs in relatively large tethered DNA fragments, we note that this empirical relationship breaks down with shorter DNA molecules (<9kb), because the tension experienced by the DNA (and therefore the mean extended length) decreases as the molecules get shorter. For example, the SphI -2.2 kb fragments described above were too short to measure. In addition, smaller DNA fragments tend to diffuse laterally along the barrier edges, making it difficult count them directly. As consequence of these two effects, the observed lengths for the shorter fragments are just an approximation and the total number observed was based on the initial number of uncut DNA molecules. While measurements of these smaller fragment lengths is beyond the scope of this study, it should nevertheless be possible by including a rigorous analysis of signal intensity data and/or accommodating for effects of shear flow on extended polymers, and it can also be possible to restrict their lateral motion with alternative barrier designs.
- Here we apply nanolithography to engineer arrays of diffusion barriers, which are used to organize curtains of DNA on a surface coated with a supported lipid bilayer. With these tools we can visualize thousands of individual, perfectly aligned DNA molecules, all arranged in the exact same orientation, in real time using TIRFM. These nanofabricated DNA curtains offer numerous advantages that overcome some current limitations of single molecule DNA imaging. The method is simple and robust, the flowcells are reusable, the barriers themselves are highly uniform, and they do not compromise the optical quality of the fused silica or interfere with signal detection. In addition, the bilayer provides an inert environment closely resembling a cell membrane and is compatible with many biological macromolecules, ensuring that the DNA curtains can be used for imaging a range of biochemical systems (A17, A20).
- Direct-write electron-beam lithography for nanofabricating barrier patterns offers tremendous reproducibility, accuracy, design flexibility, and is advantageous for prototyping devices. The key elements of the barrier design (barrier height, barrier width, barrier shape, barrier material, separation distance between adjacent barriers, guide channel shape or width, etc.) can all be adjusted to accommodate any desired substrate and/or experimental need with virtually no limitations on the overall pattern other than those spatial constraints imposed by the use of lithographic techniques. The shapes and dimensions of the barriers presented here were specifically constructed for visualizing λ-DNA molecules. For example, the parallel barriers within these sets are separated from one another by a distance of 16 µm to allow maximal surface coverage. Moreover, the design flexibility conferred by the use of nanolithography beckons the development of much more complex barrier elements to accommodate and/or manipulate any desired substrate.
- Our primary intent was to generate new tools that facilitate massively parallel data collection for single molecule analysis of protein-DNA interactions, yet it is also apparent that the DNA curtains offer a myriad of other potential applications. For example, they enable rapid generation of physical maps of long DNA molecules, and we have demonstrated this with a series of optical mapping assays based on restriction endonuclease cleavage. Because these reactions are performed within a microfluidic sample chamber and DNA is only anchored by one end, collection of the liberated fragments in sufficient quantities for cloning and further analysis should prove straightforward. Similarly, these curtains can also be used to generate maps of binding sites for any DNA-binding protein of interest as long as it can be tagged with a fluorescent label. Finally, the perfect alignment of the DNA molecules within the curtains greatly facilitates data evaluation, and offers the future potential for automated image analysis.
- Barrier construction by E-beam lithography. Fused silica slides were cleaned in NanoStrip solution (CyanTek Corp.) for 20 minutes, then rinsed with acetone and isopropanol and dried with N2. The slides were spin-coated with a bilayer of polymethylmethacrylate (PMMA),
molecular weight 25K plus 3% anisole, and 495K plus 1.5% in anisole (MicroChem), followed by a layer of Aquasave conducting polymer (Mitsubishi Rayon). Each layer was spun at 4000 rpm for 45 seconds using a ramp rate of 300 rpm/s. Patterns were written by E-beam lithography using an FEI Sirion scanning electron microscope equipped with a pattern generator and lithography control system (J. C. Nabity, Inc.). After the pattern was written the Aquasave was washed off with deionized water and the sample dried with N2. Resist was developed using a 3:1 solution of isopropanol to methyl isobutyl ketone (MIBK) for 1 minute with ultrasonic agitation at 5 °C. The substrate was then rinsed in isopropanol and dried with N2. A thin layer of chromium was deposited using a Semicore electron beam evaporator. To effect lift-off, the coated substrate was submerged in a 65°C acetone bath for 30 minutes, and then gently sonicated. Following lift-off, samples were rinsed with acetone to remove stray chromium flakes and dried with N2. Barriers were imaged using a Hitachi 4700 scanning electron microscope and a PSIA XE-100 Scanning Probe Microscope in noncontact mode. Optical images of the barriers were taken with a Nikon Eclipse ME600 at either 10x or 20x magnification (as indicated). - Lipid bilayers and DNA curtains. Flowcells and DNA curtains were constructed as previously described (A16). All lipids were purchased from Avanti Polar Lipids and liposomes were prepared as previously described. In brief, a mixture of DOPC (1,2-dioleoyl-sn-glycero-phosphocholine), 0.5% biotinylated-DPPE (1,2-dipalmitoyl-sn-glycero-3-phosphoethanolamine-N-(cap biotinyl)), and 8% mPEG 550-DOPE (1,2-dioleoyl-sn-glycero-3-phosphoethanolamine-N-[methoxy(polyethylene glycol)-550]). Liposomes were applied to the sample chamber for 30 minutes. Excess liposomes were flushed away with buffer containing 10 mM Tris-HCl (pH 7.8) and 100 mM NaCl. The flowcell was then rinsed with buffer A (40 mM Tris-HCl (pH 7.8), 1 mM DTT, 1 mM MgCl2, and 0.2 mg/ml BSA) and incubated for 15 minutes. Neutravidin (660 nM) in buffer A was then injected into the sample chamber and incubated for 10 minutes. After rinsing thoroughly with additional buffer A, biotinylated λ-DNA (-10 pM) pre-stained with YOYO1 (1 dye per 600 base pairs) was injected into the sample chamber, incubated for 10 minutes, and unbound DNA was removed by flushing with buffer at 0.1 ml/min. For imaging, the buffers also contained 100 pM YOYO1 along with an oxygen scavenging system comprised of 1% (w/v) glucose, 60 mM β-mercaptoethanol, glucose oxidase (100 units/ml) and catalase (1,560 units/ml). Application of buffer flow caused the lipid-tethered DNA molecules to align along the leading edges of the diffusion barriers. The flow was stopped for 5 minutes allowing the DNA to diffuse towards the center of the barriers. The flow was started at 0.1 ml/min for 30 seconds and the flow on-off cycle was repeated 3-5 times until DNA curtains of even density formed along the diffusion barriers.
- TIRFM. The basic design of the microscope used in this study has been previously described (A19). The beam intensity at the face of the prism was ∼10-15 mW. Images were detected with a back-illuminated EMCCD detector (Photometrics, Cascade 512B). TIRFM images were collected using a 60x water immersion objective lens (Nikon, 1.2 NA, Plan Apo) or a 10x objective (Nikon, 0.45 NA, Plan Apo), as indicated.
- Restriction Enzymes. For complete digests, 700 µl of the desired restriction enzyme in reaction buffer A (40 mM Tris-HCl (pH 7.8), 1 mM MgCl2, 1 mM DTT, and 0.2 mg/ml BSA) plus 50 mM NaCl and 10 mM MgCl2 was injected at 0.2 ml/min. All restriction enzymes were purchased from NEB and the amounts of enzymes used were as follows: NheI (100 units/ml); XhoI (100 units/ml); EcoRI (100 units/ml); NcoI (50 units/ml); PvuI (50 units/ml); and SphI (50 units/ml). Images of the DNA molecules were collected before the restriction enzyme injection and after all of the enzyme solution had flown through. For partial digests, the amount of EcoRI was reduced to 20 units/ml and 700 µl was injected at 0.4 ml/min.
-
- A1. Ha, T., Rasnik, I., Cheng, W., Babcock, H. P., Gauss, G. H., Lohman, T. M., & Chu, S. (2002) Initiation and re-initiation of DNA unwinding by the Escherichia coli Rep helicase. Nature 419, 638-641.
- A2. Heyes, C. D., Groll, J., Möller, M., & Neienhaus, G. U. (2007) Synthesis, patterning and applications of star-shaped poly(ethylene glycol) biofunctionalized surfaces. .
- A3. Rasnik, I., Myong, S., Cheng, W., Lohman, T. M., & Ha, T. (2004) DNA-binding orientation and domain conformation of the E. coli rep helicase monomer bound to a partial duplex junction: single-molecule studies of fluorescently labeled enzymes. J Mol Biol 336, 395 - 408.
- A4. Rhoades, E., Gussakovsky, E., & Haran, G. (2003) Watching proteins fold one molecule at a time. Proc Natl .
- A5. Cisse, I., Okumus, B., Joo, C., & Ha, T. (2007) Fueling protein-DNA interactions inside porous nanocontainers. Proc Natl .
- A6. Bensimon, A., Simon, A., Chiffaudel, A., Croquette, V., Heslot, F., & Bensimon, D. (1994) Alignment and sensitive detection of DNA by a moving interface. Science 265, 2096-2098.
- A7. Lebofsky, R. & Bensimon, A. (2003) Single DNA molecule analysis: applications of molecular combing. Briefings in functional genomics and .
- A8. Kabata, H., Kurosawa, O., Arai, I., Washizu, M., Margarson, S. A., Glass, R. E., & Shimamoto, N. (1993) Visualization of single molecules of RNA polymerase sliding along DNA. Science 262, 1561-1563.
- A9. Kabata, H., Okada, W., & Washizu, M. (2000) Single-molecule dynamics of the EcoRI enzyme using strecthed DNA: its application to in situ sliding assay and optical DNA mapping. Jpn. J. Appl. Phys. 39, 7164-7171.
- A10. Washizu, M., Kurosawa, O., Arai, I., Suzuki, S., & Shimamoto, N. (1995) Application of electrostatic stretch-and-position of DNA. IEEE Trans. Ind. Appl. 31, 447-456.
- A11. Guan, J. & Lee, L. J. (2005) Generating highly ordered DNA nanostrand arrays. Proceedings of the National Academy of Sciences, .
- A12. Assi, F., Jenks, R., Yang, J., Love, C., & Prentiss, M. (2002) Massively parallel adhesion and reactivity measurements using simple and inexpensive magnetic tweezers. Journal of Applied Physics 92, 5584-5586.
- A13. Kim, S., Blainey, P. C., Schroeder, C. M., & Xie, S. X. (2007) Multiplexed single-molecule assay for enzymatic activity on flow-stretched DNA. .
- A14. Dimalanta, E. T., Lim, A., Runnheim, R., Lamers, C., Churas, C., Forrest, D. K., de Pablo, J. J., Graham, M. D., Coppersmith, S. N., Goldstein, S., et al. (2004) A microfluidic system for large DNA molecule arrays. Analytical Chemistry 76, 5293-5301.
- A15. Lin, J., Qi, R., Aston, C., Jing, J., Anantharaman, T. S., Mishra, B., White, O., Daly, M. J., Minton, K. W., Venter, J. C., et al. (1999) Whole-genome shotgun optical mapping of Deinococcus radiodurans. Science 285, 1558-1562.
- A16. Granéli, A., Yeykal, C., Prasad, T. K., & Greene, E. C. (2006) Organized arrays of individual DNA molecules tethered to supported lipid bilayers. Langmuir 22, 292-299.
- A17. Sackmann, E. (1996) Supported membranes: scientific and practical applications. Science 271, 43-48.
- A18. Cremer, P. S. & Boxer, S. G. (1999) Formation and spreading of lipid bilayers on planar glass supports. J. Phys. Chem. B 103, 2554-2559.
- A19. Granéli, A., Yeykal, C., Robertson, R. B., & Greene, E. C. (2006) Long-distance lateral diffusion of human Rad51 on double-stranded DNA. Proceedings of the National Academy of Sciences, USA 103, 1221-1226.
- A20. Groves, J. & Boxer, S. (2002 Mar) Micropattern formation in supported lipid membranes. .
- A21. Gorman, J., Chowdhury, A., Surtees, J. A., Shimada, J., Reichman, D. R., Alani, E., & Greene, E. C. (2007) Dynamic basis for one-dimensional DNA scanning by the mismatch repair complex Msh2-Msh6. .
- A22. Prasad, T. K., Robertson, R. B., Visnapuu, M. L., Chi, P., Sung, P., & Greene, E. C. (2007) A DNA-translocating Snf2 molecular motor: Saccharomyces cerevisiae Rdh54 displays processive translocation and extrudes DNA loops. J Mol Biol 369, 940 - 953.
- A23. Prasad, T. K., Yeykal, C., & Greene, E. C. (2006) Visualizing the assembly of human Rad51 filaments on double-stranded DNA. Journal of Molecular Biology 363, 713-728.
- A24. Axelrod, D. (1989) Total internal reflection fluorescence microscopy. .
- A25. Schwartz, D. C., Li, X., Hernandez, L. I., Ramnarain, S. P., Huff, E. J., & Wang, Y. K. (1993) Ordered restriction maps of Saccharomyces cerevisiae chromosomes constructed by optical mapping. Science 262, 110 - 114.
- DNA curtains stained with YOYO1. E-beam lithography was used to create chromium nanoscale barriers in a defined pattern on a fused silica slide. λ-DNA stained with YOYO1 was then assembled into curtains along the edges of the nanoscale barriers. Images were collected at 60x magnification at an acquisition rate of 10 frames per second and a time stamp is shown in the lower right corner. The movie begins with buffer flow on and the DNA extended. The flow is stopped showing that all of the DNA molecules diffuse away from the surface and the barrier edges. In the absence of flow the full length of the DNA can not be seen because it resides outside the excitation volume defined by the penetration depth of the evanescent field. Finally flow is resumed to re-extend the DNA.
- Imaging YOYO1-stained DNA curtains at lower magnification. Images were captured at 10x magnification and the full field-of-view shows a 2 x 3 array of barrier sets from the surface of a slide that had a 4 x 6 array of barriers (24 identical barrier patterns in total). The movie was collected at 10 frames per second and a time stamp is indicated in the lower right hand corner. The movie begins with buffer flow on and the DNA extended, then flow is stopped showing that the DNA diffuses away from the surface and the barrier edges, and finally flow is resumed to re-extend the DNA.
- The analysis of individual molecules is evolving into an important tool for biological research, and presents conceptually new ways of approaching experimental design strategies. However, more robust methods are required if these technologies are to be made broadly available within the biological research community. To help achieve this goal we have combined nanofabrication techniques with single-molecule optical microscopy for assembling and visualizing curtains comprised of thousands of individual DNA molecules organized at engineered diffusion barriers on lipid bilayer-coated surface. Here we present an important extension of this technology that implements non-linear, geometric barrier patterns comprised of thousands of nanoscale wells that can be loaded with single molecules of DNA. We show that these geometric nanowells can be used to precisely control the lateral distribution of the individual DNA molecules within curtains assembled along the edges of the engineered barrier patterns. The individual molecules making up the DNA curtain can be separated from one another by a user-defined distance dictated by the dimensions of the nanowells. We demonstrate the broader utility of these patterned DNA curtains in a real time restriction assay that we refer to as dynamic optical restriction mapping, which can be used to rapidly identify entire sets of cleavage sites within a large DNA molecule.
- Advances in biology are often made possible only through the concurrent establishment of new technologies that bring together different scientific disciplines to achieve a common goal. This maxim has proven especially true for single-molecule research, where aspects of physics, chemistry, and biology have all provided invaluable contributions, which have led to the development of highly sensitive detection optics, robust fluorescent tags, and chemistries for anchoring individual molecules to surfaces. Taken together, these technological achievements have enabled new approaches for isolating, viewing and manipulating individual macromolecules while at the same time addressing important biological questions, and have opened new avenues of research, which have already revealed a wealth of new information. Nowhere is this more evident that in the study of nucleic acids and protein-nucleic acid interactions (B1-5). Yet even as these approaches are revealing more and more details of specific reaction mechanisms, broader implementation of the techniques remains hindered by their low throughput capacity and challenging technical nature; as a consequence most studies have been restricted to relatively simple model systems conducted in a handful of specialized laboratories.
- In an effort to help make these techniques more broadly accessible we have integrated nanoscale engineering, microfluidics, and inert lipid bilayer-coated surfaces with optical microscopy to develop high-throughput methods for making curtains of DNA molecules that can be used for massively parallel data acquisition from thousands of individual protein-DNA complexes in real time using a robust experimental platform that is amenable to a wide variety of biological applications (B6, B7). These DNA curtains permit concurrent visualization of thousands of individual DNA molecules that are perfectly aligned with respect to one another and also enable real time detection of fluorescent proteins bound to the DNA (B8-11). However, a remaining limitation of this approach is the lack of control over the lateral separation between each of the molecules making up the DNA curtains. This can potentially present a problem, especially in instances where either implementation of the desired experiments or the subsequent data analysis is confounded by the presence of overlapping molecules within the curtain. In addition, while relatively large λ-DNA (48,502 bp) substrates remain at fixed lateral locations along the smooth chromium barriers as long as constant buffer flow is maintained, smaller DNA fragments exhibit significant lateral movement along the barriers. The lipid bilayers remain fluid at the edges of the chromium barriers (B12), and the observed mobility of the shorter DNA arises from slippage of the lipid anchors along the smooth barrier edges. This is especially problematic for single molecule data analysis because molecules targeted for investigation will inevitably slip along the barrier edge and collide with and/or bypass one another, making it extremely difficult to distinguish similar looking molecules from one another over periods longer than just a few seconds. Taken together, these complications can place significant design constraints on the experiments that can be conducted with DNA curtains, especially when using DNA substrates shorter in length than the phage λ genome.
- In an effort to solve these problems we sought to develop new barrier designs that could control the positions of the molecules within the DNA curtain. Here we take advantage of the fact that lipid-tethered DNA molecules can slide along the barrier edges by demonstrating that simple non-linear, geometric barrier patterns made by nanolithography can be used to construct aligned DNA curtains with precisely controlled lateral displacement between the DNA molecules. These barriers consist of a repetitive triangular wave (sawtooth pattern) with nanometer-scale features, where the vertex of each adjacent triangle forms a tiny well, which we will refer to as geometric nanowells. We show that single molecules of DNA can be loaded into the nanowells and retained indefinitely for continued observation and analysis, so long as continuous buffer flow is maintained. The minimal separation distance between each of the DNA molecules within the curtain is defined by the distance between the adjacent nanowells within the non-linear, geometric barrier pattern, and the total number of DNA molecules within in each well is controlled by the amount of DNA applied to the surface. Although designed explicitly for single-molecule biochemical studies of protein-DNA interactions, DNA curtains made with these non-linear, geometric barrier patterns have a multitude of other potential applications. As an example of their broader utility, we use the DNA curtains made with geometric nanowells in a dynamic optical restriction mapping assay, which uses real time data collection to identify an entire set of specific cleavage sites within the phage λ genome in a reaction that takes under 2 minutes.
- Barrier construction by E-beam lithography. Fused silica slides were cleaned in NanoStrip solution (CyanTek Corp, Fremont, CA) for 20 minutes, then rinsed with acetone and isopropanol and dried with N2. The slides were spin-coated with a bilayer of polymethylmethacrylate (PMMA),
molecular weight - Lipid bilayers and DNA curtains. The flowcells were assembled from fused silica slides (G. Finkenbeiner, Inc.) with chromium nanoscale diffusion barriers. Inlet and outlet ports were made by boring through the slide with a high-speed precision drill press equipped with a diamond-tipped bit (1.4 mm O.D.; Kassoy). The slides were cleaned by successive immersion in 2% (v/v) Hellmanex, 1 M NaOH, and 100% MeOH. The slides were rinsed with filtered sterile water between each wash and stored in 100% MeOH until use. Prior to assembly, the slides were dried under a stream of nitrogen and baked in a vacuum oven for at least 1 hour. A sample chamber was prepared from a borosilicate glass coverslip (Fisher Scientific) and double-sided tape (∼25 µm thick, 3M). Inlet and outlet ports (Upchurch Scientific) were attached with hot-melt adhesive (SureBonder glue sticks, FPC Corporation). The total volume of the sample chambers was ∼4 µl. A syringe pump (Kd Scientific) and actuated injection valves (Upchurch Scientific) were used to control sample delivery, buffer selection and flow rate. The flowcell and prism were mounted in a custom-built heater with computer-controlled feedback regulation to control the temperature of the sample from between 25-37°C (±0.1 °C), as necessary.
- DNA curtains were constructed as described (B7). All lipids were purchased from Avanti Polar Lipids and liposomes were prepared as previously described. In brief, a mixture of DOPC (1,2-dioleoyl-sn-glycero-phosphocholine), 0.5% biotinylated-DPPE (1,2-dipalmitoyl-sn-glycero-3-phosphoethanolamine-N-(cap biotinyl)), and 8% mPEG 550-DOPE (1,2-dioleoyl-sn-glycero-3-phosphoethanolamine-N-[methoxy(polyethylene glycol)-550]). Liposomes were applied to the sample chamber for 30 minutes. Excess liposomes were flushed away with buffer containing 10 mM Tris-HCl (pH 7.8) and 100 mM NaCl. The flowcell was then rinsed with buffer A (40 mM Tris-HCl (pH 7.8), 1 mM DTT, 1 mM MgCl2, and 0.2 mg/ml BSA) and incubated for 15 minutes. Neutravidin (660 nM) in buffer A was then injected into the sample chamber and incubated for 10 minutes. After rinsing thoroughly with additional buffer A, biotinylated λ-DNA (10 pM) pre-stained with 1-2 nM YOYO1 was injected into the sample chamber, incubated for 10 minutes, and unbound DNA was removed by flushing with buffer at 0.1 ml/min. Application of buffer flow caused the lipid-tethered DNA molecules to align along the leading edges of the diffusion barriers. The flow was stopped for 5 minutes allowing the DNA to diffuse towards the center of the barriers. The flow was started at 0.1 ml/min for 30 seconds and the flow on-off cycle was repeated 3-5 times until DNA curtains of even density formed along the diffusion barriers.
- TIRFM Imaging. The basic design of the microscope used in this study has been previously described (B11). Briefly, the system is built around a Nikon TE2000U inverted microscope with a custom-made illumination system. A 488 nm, 200 mW diode-pumped solid-state laser (Coherent, Sapphire-CDHR) was used as the excitation source. The laser was attenuated as necessary with a neutral density filter and centered over the DNA curtain by means of a remotely operated mirror (New Focus). The beam intensity at the face of the prism was ∼10-15 mW. Images were detected with a back-illuminated EMCCD detector (Photometrics, Cascade 512B). TIRFM images were collected using a 60x water immersion objective lens (Nikon, 1.2 NA Plan Apo), unless otherwise indicated.
- Design strategy . We have shown that mechanical barriers to lipid diffusion can be used to organize DNA molecules into curtains that serve as a unique and effective experimental platform for the study protein-DNA interactions at the single molecule level (B6-11). The overall strategy for making DNA curtains is shown in
FIG. 6 . DNA molecules are first anchored by one end to a supported lipid bilayer coating the surface of the sample chamber and application of hydrodynamic force is used to push the lipid-tethered DNA molecules towards lipid diffusion barriers. Lipids within supported bilayers cannot traverse these mechanical barriers (B13-15). As a consequence, the barriers (curtain rods) also halt the forward movement of the DNA molecules, causing them to accumulate at the barrier edges where they extend into the evanescent field. As we have previously shown, molecules of λ-DNA (48.5 kb) can be assembled into curtains along these barrier edges and the molecules remain at fixed lateral locations (B6). - In contrast to the full-length λ phage genome, smaller DNA fragments diffuse laterally along the smooth barrier edges (see below). This is because the lipid bilayers remain fluid even at the barrier edges (B12), and the tension exerted on the shorter DNAs by the hydrodynamic force is insufficient to overcome the tendency of the molecules to slide along the barriers. In addition, these chromium barriers are designed to be oriented exactly perpendicular to the flow force, and if they are misaligned by just a few degrees relative to the direction flow, then the smaller DNA molecules slip rapidly along the barrier edges. In light of these potential design flaws when used for smaller DNA substrates, we sought a new barrier design that could eliminate slippage of the molecules along the barrier edges. We reasoned that the locations of the DNA molecules along the barrier edges could be passively controlled by altering the shape of the barriers themselves. For example, because the DNA molecules can move along the smooth edges, then non-linear, geometric barrier patterns comprised of a simple, repetitive triangular wave would limit the mobility (
FIG. 6B and FIG. 6C ). This is because the hydrodynamic force exerted by the flowing buffer should push the DNA molecules into the vertex of each triangle with sufficient force to overcome any tendency of the molecules to move laterally within the bilayer (FIG. 6B ). We refer to these triangular features as geometric nanowells (conceptually similar to the wells of a sequencing gel) because the DNA molecules loaded within each well would not be free to move laterally along the barrier, as long as a continuous flow force is maintained. In addition to eliminating lateral slippage, the peak-to-peak distance of the adjacent triangles within the patterns should dictate the minimal lateral separation of the DNA molecules that make up the curtain. For example, non-linear, geometric patterns that repeat at 500 nm intervals should yield DNA molecules separated from one another by 500 nm. The separation will be greater than 500 nm if some of the wells are not occupied, yet even in this case the distances should occur in defined increments divisible by 500 nm (i.e. 500, 1000, 1500, 2000 nm, etc.). If this were true, then these non-linear, geometric barrier patterns would confer precise control over the positioning of each individual DNA making up the curtain. - Examples of the non-linear, geometric barrier patterns tested here are shown in
FIG. 7 . We used electron-beam (E-beam) lithography to achieve these desired design features by engineering chromium barriers that were 100 nm wide and 30 nm tall arranged in a sawtooth pattern on a fused silica slide.FIG. 7A shows an optical image of a pair of barrier sets and once assembled into a flowcell the chromium barriers will be oriented perpendicular to the hydrodynamic force with the apex of each triangle pointing in the same direction that the buffer is flowing (as indicated inFIG. 6 ).FIG. 7B shows an AFM image of a non-linear, geometric barrier pattern with 1 µm peak-to-peak spacing and reveals a height of just 20 nm. Examples of SEM images of non-linear, geometric barriers with peak-to-peak distances of 2000, 1000, 750, 500, 350, and 200 nm are shown inFIG. 7C . These images demonstrate that we can use standard lithographic techniques to construct chromium barriers with precise non-linear, geometric patterns having nanometer scale features of our desired designs. - DNA curtains with defined lateral separation between molecules. If the DNA molecules within the curtains were in fact retained within the geometric nanowells, as we predicted, then the distance between the adjacent vertices of triangles within the pattern design should be reflected in the separation distance between the individual DNA molecules.
FIG. 9 shows examples of DNA curtains made with non-linear, geometric barrier patterns with 2000, 1000, 750, 500, 350, and 200 nm separation between adjacent nanowells (FIG. 9A , left panels). As indicated above, these curtains are comprised of the 20 kb DNA that is fluorescently stained with the intercalating dye YOYO1. To verify that this design pattern yielded DNA molecules with the desired spacing we plotted signal intensity of the stained DNA versus its lateral location along the barrier edge, and these plots revealed peak-to-peak frequencies consistent with values from designs of the non-linear, geometric barrier patterns (FIG. 9A , middle panels). The 2000, 1000, 750, 500, 350, and 200 nm barriers yielded mean separation distances corresponding to the pattern designs. This data demonstrates that the non-linear, geometric barrier patterns prevent slippage of the DNA molecules along the non-linear, geometric diffusion barriers and also confirms that the distance between adjacent nanowells dictates the extent of lateral separation between individual molecules that make up the DNA curtain. - The number of DNA molecules that make up the curtains can be varied by modulating several different parameters, the simplest of which is the amount of DNA injected into the sample chamber (B6, B7). With these non-linear, geometric diffusion barrier patterns, if too much DNA is present, then multiple molecules of DNA will accumulate within each geometric nanowell. To avoid this problem these experiments were conducted with a relatively small amount of DNA, such that less than one DNA molecule should be found per nanowell. In other words, some of the nanowells will remain unoccupied, many of the wells will have a single DNA molecule, and some of the wells will have two (or more) molecules of DNA. This can be confirmed by measuring the fluorescence intensity of the DNA in each well, and those nanowells harboring two molecules will be twice as bright as those harboring just one, therefore allowing easy discrimination.
FIG. 9B shows a histogram of total integrated intensity per DNA molecule, revealing a prominent peak, and a less prominent peak. In addition, a tally of the total number of geometric nanowells and the total number of DNA molecules within a barrier set. These values are also reflected in the fluorescence cross-sections shown inFIG. 9A , which provides further evidence that the number of DNA molecules loaded per nanowell can be controlled, and that any nanowells having more than one DNA can be readily identified based on signal intensity and discarded from further analysis if necessary. - DNA molecules are retained within the geometric nanowells. As indicated above, DNA molecules aligned along smooth, linear chromium barriers can slip laterally along the barrier edges, and this effect can be very pronounced with shorter molecules of DNA. To illustrate this problem, a 20 kb PCR DNA fragment derived from the λ DNA was labeled with YOYO1 ((B16), and see Materials and Methods). These molecules were aligned along the edge of a smooth barrier and viewed over the course of 13.5 minutes. A kymogram illustrating the lateral locations of the DNA molecules over time was then generated from a cross-section of the curtain. As shown in
FIG. 9A , the labeled ends of the molecules exhibited large movements consistent with lateral slippage of the DNA along the barrier edge even over periods spanning just a few seconds. DNA curtains made with non-linear, geometric barrier patterns are shown inFIG. 9B , along with the corresponding kymograms. In contrast to the movement observed with the smooth, linear barriers, the DNA molecules aligned at the non-linear, geometric patterns displayed absolutely no evidence of lateral slippage. Similar experiments with DNA molecules of sequentially shorter lengths revealed that the lateral movement of 34, 21, 11, and 5 kb DNA fragments was also eliminated with the non-linear, geometric barrier patterns (FIG. 9B ). This data provided evidence indicating that the non-linear, geometric barrier patterns were highly effective at restricting movement of the DNA molecules along the barrier edges, further indicating that the molecules themselves were loaded into the geometric nanowells. - Dynamic optical restriction mapping. Using these non-linear, geometric barrier patterns permits studies of even relatively small DNA fragments by eliminating their lateral mobility along the barrier edges when maintained by a constant flow force. As we have previously shown, the design of the curtains also yields DNA molecules that are all aligned with the same sequence orientation based upon the location of the biotin tag at a specific end of the DNA (B6). As a consequence of this perfect alignment, restriction digest of the DNA molecules within the curtain yields identical, tethered fragments whose lengths correspond to the furthest upstream cleavage site (B6). Complete digests can not be used to identify multiple sites cleaved by the same restriction enzyme because the downstream DNA is flushed from the sample chamber as soon as the DNA is cleaved. However, partial restriction digests can be used to generate mixed populations of DNA molecules whose lengths reflect the distribution of cleavage sites throughout the DNA.
- In principle, a complete restriction digest of the DNA can also reveal all of the fragments corresponding to each of these intermediate lengths, but only if the digest is viewed in real time and the cleavage rate is slower than the data acquisition frequency. In this case, following each individual cleavage event, the downstream fragment will be immediately flushed from the sample chamber by buffer flow, leaving behind the intact biotinylated fragment whose shortened length would correspond to the location of the cleavage site. This can happen repeatedly on the same DNA until that particular molecule is cleaved at the furthest upstream site relative to the anchored end of the DNA. The large number of DNA molecules that can be viewed with these DNA curtains makes it possible to detect all of the potential sites within the DNA, and the geometric nanowells prevent the DNA molecules from slipping back and forth after they are cleaved. Eventually all of the DNA molecules will be cut to a final length corresponding to the furthest upstream restriction site. We refer to this real time digest as dynamic optical restriction mapping and an example of such an assay is shown in
FIG. 10 . Here the DNA was digested with EcoRI and the digest was observed in real time.FIG. 10B shows the DNA before the digest andFIG. 10C shows the DNA after the digest was completed, which demonstrates that all of the DNA were eventually trimmed (corresponding to the 21 kb fragment) and confirming that all of the molecules were in the identical orientation.FIG. 10C shows examples of kymograms made from individual DNA molecules during the digestion reaction. These kymograms were selected because they provide examples where each of the five EcoRI sites can be identified. The total time required for this digest was just 30 seconds, and we anticipate that this time can be reduced significantly with further optimization. The length of the resulting fragments observed at the intermediate time points was measured and their distribution plotted as a histogram inFIG. 10D , which reveals all five of the EcoRI cuts sites in the λ phage genome. This assay is not possible with smooth, linear barrier designs because the DNA molecules start to rapidly slip back and forth as the fragment lengths become shorter and shorter, thus interfering with measurements of the same DNA molecule over time. Thus this real time dynamic optical restriction mapping assay is greatly facilitated when used in combination with the non-linear, geometric barrier patterns because the nanowells prevent the DNA molecules from moving as they get shorter and shorter during the digest. - High-throughput approaches to single-molecule biochemistry have the potential to reveal numerous new details of reaction mechanisms and macromolecular dynamics, which were previously inaccessible to traditional ensemble approaches. In an effort to make these techniques more broadly applicable we have used nanoscale engineering to establish a high-throughput approach that we call DNA curtains, which facilitates massively parallel data acquisition from thousands of individual molecules viewed in real time. Here we have shown that non-linear, geometric barrier patterns can also be used to align curtains of DNA molecules tethered to a fluid lipid bilayer and that the geometry of the barriers dictates the lateral distance between the individual molecules that make up the curtains. We demonstrate that single molecules of DNA can be loaded into the geometric nanowells where they can be retained for further analysis and experimentation. This work brings the power of nanofabrication to bear on single-molecule biology by providing a very simple and robust means of controlling the lateral dispersion of DNA molecules assembled into a molecular curtain.
- In our previous studies we demonstrated that DNA curtains are advantageous for analysis of protein-DNA interactions, in particular with systems that involve lateral movement of proteins along DNA (B8, B9). One complication of these experiments is that it is not always possible to irrefutably rule out the possibility that a protein under observation is interacting with two (or more) DNA molecules that are closely juxtaposed. Although the density of the DNA curtains can be decreased to help mitigate this issue, it still is not always possible to demonstrate that a specific protein under observation is bound to a particular DNA molecule. Moreover, while our DNA curtain assays have a demonstrated capability to enable massively parallel data acquisition, evaluation of the resulting data remains a challenge because automated image analysis programs can not readily distinguish two or more identical objects if they overlap to any significant extent. With the advent of the non-linear, geometric barrier patterns, these problems are eliminated, because the DNA molecules are maintained at fixed distances from one another and we can verify that only one molecule is loaded in a particular well based on the fluorescence intensity of the labeled DNA. Moreover, the non-linear, geometric patterns used here are extremely simple, yet highly effective at directing DNA molecules to defined locations on a surface. The ability to load and retain individual DNAs into geometric nanowells portends the future possibility of individually handling or isolating these single molecules, and we envision that the flexibility afforded by nanolithography will enable construction of intricate barrier patterns that can be used for even more complex manipulations of lipid anchored DNA molecules. While the primary motivation for this work remains development of robust, high-throughput tools for single-molecule optical detection of protein-DNA interactions, we envision that the DNA curtains and geometric nanowells have numerous potential applications pertaining to physical analysis of large DNA molecules. For example, a major aspect of genome research remains characterization of large DNA fragments, and numerous approaches have been developed for manipulating, analyzing and isolating these molecules (B17-21). We have shown that DNA curtains made up of these non-linear, geometric patterns can be used to generate optical restriction maps of the tethered DNA molecules, and because these assays are performed in the context of a microfluidic system the cleaved DNA fragments can easily be isolated for further analysis. This type of real time restriction digest imaging can be used for rapidly mapping the DNA molecules and the large numbers of molecules aligned in the curtains ensures acquisition of statistically relevant data from just a single run; we refer to this as dynamic optical restriction mapping. Finally, these perfectly ordered DNA substrates now offer the future potential for applying rigorous machine vision techniques for fully automated data analysis with little or no user intervention.
-
- B1. Bustamante, C., Bryant, Z., & Smith, S. B. (2003) Nature 421, 423 - 427.
- B2. Cairns, B. R. (2007) Nat Struck .
- B3. Ha, T. (2001) Curr .
- B4. Zlatanova, J. & van Holde, K. (2006) .
- B5. van Oijen, A. M. (2007) Biopolymers 85, 144 - 153.
- B6. Fazio, T., Visnapuu, M.-L., Wind, S., & Greene, E. C. (2008) (submitted ).
- B7. Granéli, A., Yeykal, C., Prasad, T. K., & Greene, E. C. (2006) Langmuir 22, 292-299.
- B8. Gorman, J., Chowdhury, A., Surtees, J. A., Shimada, J., Reichman, D. R., Alani, E., & Greene, E. C. (2007) .
- B9. Prasad, T. K., Robertson, R. B., Visnapuu, M. L., Chi, P., Sung, P., & Greene, E. C. (2007) Mol Biol 369, 940 - 953.
- B10. Prasad, T. K., Yeykal, C., & Greene, E. C. (2006) Journal of Molecular Biology 363, 713-728.
- B11. Granéli, A., Yeykal, C., Robertson, R. B., & Greene, E. C. (2006) Proceedings of the National Academy of Sciences, USA 103, 1221-1226.
- B12. Tsai, J., Sun, E., Gao, Y., Hone, J. C., & Kam, L. C. (2008) .
- B13. Boxer, S. G. (2000) Curr .
- B14. Cremer, P. S. & Boxer, S. G. (1999) J. Phys. Chem. B 103, 2554-2559.
- B15. Groves, J. & Boxer, S. (2002 Mar) .
- B16. Robertson, R. B., Prasad, T. K., Moses, D., Chowdhury, A., & Greene, E. C. (2008) (submitted ).
- B17. Bensimon, A., Simon, A., Chiffaudel, A., Croquette, V., Heslot, F., & Bensimon, D. (1994) Science 265, 2096-2098.
- B18. Dimalanta, E. T., Lim, A., Runnheim, R., Lamers, C., Churas, C., Forrest, D. K., de Pablo, J. J., Graham, M. D., Coppersmith, S. N., Goldstein, S., et al. (2004) Analytical Chemistry 76, 5293-5301.
- B19. Lebofsky, R. & Bensimon, A. (2003) Briefings in functional genomics and .
- B20. Lin, J., Qi, R., Aston, C., Jing, J., Anantharaman, T. S., Mishra, B., White, O., Daly, M. J., Minton, K. W., Venter, J. C., et al. (1999) Science 285, 1558-1562.
- B21. Riehn, R., Lu, M. C., Wang, Y. M., Lim, S. F., Cox, E. C., & Austin, R. H. (2005) Proceedings of the National Academy of .
- We have previously demonstrated that we can use nanofabricated barriers to control lipid diffusion to align molecular curtains of DNA, which can be visualized by TIRF microscopy and used for physical analysis of the DNA molecules themselves or can serve as a tool for probing protein-DNA interactions. The advantages of this technology is that it permits these studies to be conducted at the single molecule level, but in a high throughput format that permits massively parallel data acquisition. However, one drawback of these prior barrier patterns is that they require the continuous application of a hydrodynamic (or electrophoretic) force to confine the mobility of the aligned DNA molecules. In the absence of this force the DNA molecules diffuse away from the barrier edge and making it difficult to probe biochemical interactions that involve the formation of DNA loops (e.g. the interactions between RNA polymerase bound to a promoter and a transcription factor bound to a distal enhancer element). To overcome this problem here we have developed a technology for aligning curtains of DNA wherein the constituent molecules are trapped at defined locations. This is accomplished using barriers patterns that contain long, narrow entry pores, which are used to guide single DNA molecules into individual geometric nanowells. In the absence of buffer flow the DNA molecules diffuse away from the lipid coated surface, but they can not escape the geometric nanowells over time scales ranging up to tens of minutes. These barrier designs are ideal for studying any protein-DNA interaction that involves the association of distal components bound along the same DNA chain.
-
FIG. 11A illustrates the response of a surface tethered DNA molecule (shown in green throughout) to changes in applied buffer flow. When flow is maintained the DNA molecule can be stretched parallel to the surface and is maintained within the detection volume defined by the penetration depth of the evanescent field. When flow is paused the DNA diffuses up out of the field, permitting and long distance interactions (i.e. DNA looping) between distal locations along the contour length of the molecule. When flow is resumed the molecule can again be viewed along its full contour, allowing the assessment of any effects brought about by the DNA looping.FIGS. 11B-C show the consequences of transiently terminating buffer flow with a DNA curtain assembled at a normal linear diffusion barrier (barriers are shown in black) compared to a non-linear, geometric barrier comprised of gated nanopores. With a normal linear barrier edge, as shown inFIG. 11B , termination of flow allows DNA molecules to diffuse away from the surface, as described inFIG. 11A , but the DNA also diffuses away from the edge of the barrier itself. As a result, when flow is resumed the order of the DNA molecules along the edge is different compared to the order that existed before terminating buffer flow. In this example, the individual DNA molecules are numbered to emphasize that the order changes. This makes it extremely difficult or impossible to distinguish the molecules from one another before and after flow is transiently paused (i.e. if the molecules are all sequences, then one can not distinguishmolecule # 1 from any of the other four DNA molecules). In contrast, DNA molecules trapped and aligned with the gated geometric nanowells inFIG. 11C do not diffuse out of the individual nanowells when flow is terminated. This is because diffusion of the tethered DNA out of the nanowells comprising the non-linear, geometric barrier is inhibited by the long, narrow geometry of the nanopores.FIG. 11D highlights the details of the gated nanowells, including the guide channels used to direct the DNA into the nanopore entry channel, and the geometric nanowell residing at the end of the nanopore. - Uses: Trapping DNA for continuous analysis involving steps that necessitate the absence of buffer flow; Physical analysis of DNA looping; Analysis of protein-protein interactions that require DNA looping; and Will enable selective manipulation and isolation of single DNA molecules from within a more complex mixed population.
- Here we present a combination of different non-linear, geometric barrier patterns that enable complex manipulation of DNA molecules that are anchored to a fluid lipid bilayer on the surface of a microfluidic sample chamber (see
FIGS. 12A-B ). The non-linear, geometric barrier elements include a nanopore-gated staging area, which is used to irreversibly capture linear DNA molecules that are anchored by both ends to the bilayer and pushed into the staging area using hydrodynamic force. Once captured, the DNA molecules are driven in the perpendicular direction using tangentially applied force generated either using buffer flow or an electric field. This pushed the DNA molecules to one side of the staging area where they encounter a bifurcated nanochannel that directs each end of the same DNA molecules down a pair of parallel channels (the DNA rack), which are separated by a user defined distance designed to stretch the double-tethered DNA molecules to a desired length. The exit ports at the ends of each channel are designed to retain any DNA using a tension-based selection while at the same time filtering out any broken molecules. Once the molecules are aligned within the rack they are maintained in a stretched configuration and can be visualized by TIRFM in the absence of either a flow or electrophoretic force. These aligned arrays of double-tethered DNA curtains offer an ideal high-throughput format for analyzing DNA molecules or protein-DNA interactions in the absence of a perturbing hydrodynamic force. - Uses: Any biochemical/biophysical studies of DNA or protein-DNA interactions that must be conducted in the absence of a perturbing hydrodynamic or electrophoretic force (for example, promoter-enhance interactions during transcription); Studies of one-dimensional diffusion and target site binding by proteins (i.e. visualizing where and how transcription factors or DNA repair proteins bind DNA); and Size selective fractionation of single DNA molecules (the rack elements can be designed to accommodate any desired DNA or even a range of different sized DNA molecules).
- Here we develop new strategies to construct curtains of DNA in which the substrates themselves are aligned with respect to one another and maintained in an extended configuration with both ends anchored to the surface of a microfluidic sample chamber that is otherwise coated with an inert lipid bilayer. This is accomplished through the use of nanofabricated racks of metallic barrier patterns with different functional elements, which together enable alignment and anchoring of hundreds of individual DNA molecules. Linear barriers to lipid diffusion are used to align the DNA, and antibody-coated pentagons provide solid anchor points for the free ends of the molecules. These double-tethered curtains of anchored DNA can be visualized using total internal reflection fluorescent microscopy under conditions that do not require the use of continuous buffer flow to stretch the DNA. This offers the potential for data acquisition without perturbing the behavior of the proteins under investigation through the application of an externally applied hydrodynamic force. We provide a proof-of-principle demonstration that these DNA racks can be used in a 1D diffusion assay that monitors the motion of the mismatch repair proteins along DNA.
- Linear barriers to lipid diffusion are used to align the DNA, and antibody coated pentagons provide solid anchor points for the free ends of the molecules. These double-tethered curtains of anchored DNA can be visualized using total internal reflection fluorescent microscopy under conditions that do not require the use of continuous buffer flow to stretch the DNA. This offers the potential for data acquisition without perturbing the behavior of the proteins under investigation through the application of an externally applied hydrodynamic force. We provide a proof-of principle demonstration that these DNA racks can be used in a 1D diffusion assay that monitors the motion of the mismatch repair protein complex Msh2-Msh6 along DNA.
- Dynamic interactions between proteins and DNA underlie many biological processes, and as such are the subject of intense investigation. Many laboratories are now tackling these problems using new experimental methods that enable the visualization of protein-DNA complexes at the single molecule level in real time, and the information garnered from these experiments is being used to build detailed mechanistic models of many different types of reactions. However, one major drawback of many single molecule techniques is that they are inherently designed to probe individual reactions, and as a consequence it can be challenging to gather statistically relevant data. This difficulty is often compounded by the fact that these experiments are often technically demanding. Therefore it is highly advantageous to establish new approaches that can increase throughput capacity of single molecule methods, and make these approaches both easier and more readily applicable to biological reactions involving different types of DNA transactions.
- In an effort to help make these techniques more accessible we have integrated nanoscale engineering, microfluidics, and lipid bilayer-coated surfaces with single molecule optical microscopy to develop high-throughput methods for making molecular curtains comprised of thousands of individual DNA molecules (C1-3). A key aspect of these experimental platforms is that they take advantage of the fluid nature of lipid bilayers to control the organization of DNA molecules tethered to individual lipids (C4, C5). This is accomplished by first coating a sample chamber surface with a bilayer containing a small fraction of biotinylated head groups, and DNA molecules are then anchored by one end to the bilayer via a biotin-neutravidin linkage. These lipid-tethered DNA molecules are assembled into molecular curtains by pushing them to the leading edge of either micro- or nanoscale lipid diffusion barriers (for example, linear or non-linear, geometric barriers) through the application of a hydrodynamic force. In our initial studies we demonstrated that microscale barriers to lipid diffusion made by manually etching a fused silica surface with a diamond-tipped scribe could be used to align hundreds of lipid-tethered DNA molecules (C3). More recently we have established methods for fabricating barriers with nanoscale dimensions that allow for much more precise control over both the location and lateral distribution of the DNA molecules (C1, C2). These nanofabricated DNA curtains permit simultaneous visualization of thousands of individual DNA molecules that are perfectly aligned with respect to one another, and can be used for massively parallel data acquisition from thousands of individual protein-DNA complexes in real time using a robust experimental platform that is amenable to a wide variety of biological applications.
- We have also shown that these DNA curtains are highly advantageous for studying protein-DNA interactions at the single molecule level, and we have applied these tools to biological systems such as chromatin remodeling, homologous DNA recombination, and post-replicative mismatch repair (C6-9). This experimental platform is especially applicable to the real time detection of fluorescent proteins bound to the DNA. However, these previous DNA curtains require the continuous application of a hydrodynamic force during data collection because just one end of the DNA is anchored to the lipid bilayer. If buffer flow is terminated the DNA does not remain stretched, and as a consequence it can not be visualized along its full contour length because it drifts outside of the detection volume defined by the penetration depth of the evanescent field. The need for buffer flow is not problematic for many types of measurements, however, it can potentially impact the behavior of bound proteins or protein complexes, and the magnitude of this impact can scale in proportion to the hydrodynamic radius of the molecules under observation. The influence of buffer flow is especially apparent during measurements involving proteins that slide on DNA by one-dimensional diffusion, because an applied flow force can strongly bias the direction that the sliding proteins travel along the DNA.
- The need for buffer flow is not problematic for many types of measurements, however, it can potentially impact the behavior of bound proteins or protein complexes, and the magnitude of this impact can scale in proportion to the hydrodynamic radius of the molecules under observation. The influence of buffer flow is especially apparent during measurements involving proteins that slide on DNA by one-dimensional diffusion, because an applied flow force can strongly bias the direction that the sliding proteins travel along the DNA.
- Here we sought to develop new procedures for making curtains of aligned DNA molecules that were held in an extended configuration anchored by both ends to the surface of a microfluidic sample chamber and suspended above an inert bilayer. To accomplish this we have developed new patterns of metallic barriers with distinctive functional elements. These metallic patterns incorporate both linear barriers to lipid diffusion and non-linear, geometric barriers comprising arrayed pentagons, and together these elements function to align and tether long molecules of DNA. The DNA molecules are first anchored by one end to a fluid lipid bilayer via a biotin-neutravidin interaction, and initially aligned with one another by using hydrodynamic force to push them into the linear barriers. The arrayed pentagons serve as solid anchor points positioned at a defined distance downstream from the linear barriers and are coated with antibodies directed against either digoxigenin or bromodeoxyuridine, which are covalently attached to the free ends of the DNA molecules. Importantly, once linked to the surface the DNA molecules are maintained in an extended state and confined within the detection volume defined by the penetration depth of the evanescent field, allowing for continuous observation along their full contour length, even in the absence of an applied hydrodynamic force.
- Nanofabrication . Fused silica slides were cleaned in NanoStrip solution (CyanTek Corp, Fremont, CA) for 20 minutes, then rinsed with acetone and isopropanol and dried with N2. The slides were spin-coated with a bilayer of polymethylmethacrylate (PMMA),
molecular weight - Lipid bilayers and DNA curtains. The flowcells were assembled from fused silica slides (G. Finkenbeiner, Inc.) with chromium nanoscale diffusion barriers. Inlet and outlet ports were made by boring through the slide with a high-speed precision drill press equipped with a diamond-tipped bit (1.4 mm O.D.; Kassoy). The slides were cleaned by successive immersion in 2% (v/v) Hellmanex, 1 M NaOH, and 100% MeOH. The slides were rinsed with filtered sterile water between each wash and stored in 100% MeOH until use. Prior to assembly, the slides were dried under a stream of nitrogen and baked in a vacuum oven for at least 1 hour. A sample chamber was prepared from a borosilicate glass coverslip (Fisher Scientific) and double-sided tape (∼25 µm thick, 3M). Inlet and outlet ports (Upchurch Scientific) were attached with hot-melt adhesive (SureBonder glue sticks, FPC Corporation). The total volume of the sample chambers was ∼4 µl. A syringe pump (Kd Scientific) and actuated injection valves (Upchurch Scientific) were used to control sample delivery, buffer selection and flow rate. The flowcell and prism were mounted in a custom-built heater with computer-controlled feedback regulation to control the temperature of the sample from between 25-37°C (±0.1 °C), as necessary. After each use, the slides were soaked in MeOH to remove the ports and tape, rinsed with water, washed briefly (15-20 minutes) with Nanostrip, and finally rinsed with water. This procedure was sufficient to clean the slide surfaces for reuse, and each slide could be used multiple times degrading the quality of the optical surface or the metallic patterns.
- DNA curtains were constructed as described. All lipids were purchased from Avanti Polar Lipids and liposomes were prepared as previously described. In brief, a mixture of DOPC (1,2-dioleoyl-sn-glycero-phosphocholine), 0.5% biotinylated-DPPE (1,2-dipalmitoyl-sn-glycero-3-phosphoethanolamine-N-(cap biotinyl)), and 8-10% mPEG 550-PE (1,2-dioleoyl-sn-glycero-3-phosphoethanolamine-N-[methoxy(polyethylene glycol)-550]). The mPEG is does not affect bilayer formation or assembly of the DNA curtains, but rather serves to further passivated the surface against nonspecific adsorption of quantum dots (which we use in our studies of protein-DNA interactions). Liposomes were applied to the sample chamber in three injections of 200 µl followed by 5 minute incubations. Excess liposomes were flushed away with 1 ml of buffer A, which contained 10 mM Tris-HCl (pH 7.8) plus 100 mM NaCl, and the bilayer was incubated for an
addition 30 minutes. Buffer A plus 25 µg/ml anti-DIG Fab (Roche) or anti-BrdU IgG (Sigma) was then injected into the sample chamber and incubated for 30 minutes. The sample chamber was then flushed with 1 ml of buffer B, which contained 40 mM Tris-HCl (pH 7.8), 1 mM DTT, 1 mM MgCl2, and 0.2 mg/ml BSA, and incubated for an additional 5 minutes. 1 ml of buffer A containing Neutravidin (330 nM) was then injected into the sample chamber and incubated for 20 minutes. The flowcell was then rinsed with 3 ml of buffer B to remove any unbound Neutravidin. 1 ml of λ-DNA (20 pM) labeled at one end with biotin and at the other end with digoxigenin (see below) and pre-stained with 1-2 nM YOYO1 was injected into the sample chamber in five 200 µl aliquots, with a 2-3 minute incubation period following each injection. The DNA was then aligned at the linear barriers using a flow rate of 0.02 ml/min, and this rate was then increased to 2-3 ml/min to anchor the second end of the DNA molecules. - DNA substrates. The DNA substrates were made by ligating oligonucleotides to the 12 nucleotide overhangs at the end of the λ phage genome (48.5 kb). Ligation mixes (1 ml total volume) contained 4 nM λ DNA (Invitrogen), 1 µM biotinylated oligonucleotiode (5'-pAGG TCG CCG CCC [BioTEG]-3' [SEQ ID NO: 1]), 1 µM BrdU labeled oligonulceotide (or DIG labeled oligonucleotide; 5'-pGGG CGG CGA CCT [BrdU]-3' [SEQ ID NO: 2] or 5'-pGGG CGG CGA CCT [DIG]-3' [SEQ ID NO: 3]), and 1X ligase buffer (NEB). The reaction mix was warmed to 65°C for 10 minutes and then cooled slowly to room temperature. After cooling, ligase was added (T4 DNA ligase (400U/µl) or Taq ligase (40U/µl); NEB) and the mixture was incubated overnight at 42°C. Reactions performed with T4 ligase were then heat inactivated at 65°C for 10 minutes, and the ligated DNA products were purified over a Sephacryl S200HR column (GE Healthcare) run in 10 mM Tris-HCl (pH 7.8), 1 mM EDTA, plus 150 mM NaCl. The purified DNA was stored at -20°C.
- For inserting a DIG labeled oligonucleotide complementary to position 26,151-26,166 on λ 500ul of DNA (200 pM; labeled at the ends with biotin and BrdU (as described above)) was incubated for 2 h with the nicking enzymes Nb.BsmI and Nt.BstNBI (50 U each; NEB) at 55°C in buffer containing 10 mM Tris-HCl (pH 7.8), 10 mM MgCl2, 150 mM NaCl. 1uM of oligonucleotide (5'-pCAT TCT TGA GTC CAA TTT TT[DIG]-3' (SEQ ID NO: 4)) was then added to the solution along with 10 mM EDTA and the mixture was incubated at 55° C for 20 minutes and then allowed to slowly cool to room temperature over the course of an hour. ATP was added to a final concentration of 1 mM along with 2,000 units of T4 ligase and an additional 10 mM MgCl2. The reaction was then incubated at room temp. for 90 min. Additional EDTA (Cf=20 mM) was added to the solution and the nicking enzymes and ligase were heat denatured at 80°C for 20 minutes. This procedure was also used for concurrently inserting oligonucleotides at 26,151-26,166 and 33,779-33,791 in the same DNA.
- For inserting an oligonucleotide at only position 33,779-33,791 on λ 500ul DNA (200 pM; labeled at the ends with biotin and BrdU) was incubated for 2 h with the nicking enzyme Nt.BstNBI (50 U; NEB) at 55°C in buffer containing 10mM Tris-HCl (pH 7.8), 10 mM MgCl2, 150 mM NaCl. The enzyme was heat denatured by incubation at 80°C for 20 min. 1 µM of oligonucleotide (5'-pTTC AGA GTC TGA CTT TT[DIG]-3' [SEQ ID NO: 5]) was added to the solution and the mixture was incubated at 55°C for 20 min., then cooled slowly to room temp. over the course of 1 h. ATP was then added to a final concentration of 1 mM along with 2,000 units of T4 ligase, and the reaction was incubated at room temp. for 90 min. The ligase was then heat denatured by incubation at 65°C for 20 min.
- TIRFM and ID diffusion assays. The microscope used in this study has been previously described (C3). In brief, the system is built around a Nikon TE2000U inverted microscope with a custom-made illumination system. A 488 nm, 200 mW diode-pumped solid-state laser (Coherent, Sapphire-CDHR) was used as the excitation source. The laser was attenuated as necessary with a neutral density filter and centered over the DNA curtain by means of a remotely operated mirror (New Focus). The beam intensity at the face of the prism ways ∼10-15 mW. Images were detected with a back-illuminated EMCCD detector (Photometrics, Cascade 512B). TIRFM images were collected using a 60x water immersion objective lens (Nikon, 1.2 NA Plan Apo), unless otherwise indicated.
- Design elements of the DNA rack. We have previously demonstrated that mechanical barriers that disrupt the continuity of lipid bilayers can be used to construct molecular curtains of aligned DNA molecules (C1-3). We have also shown that these DNA curtains provide a unique and advantageous tool for studying protein-DNA interactions at the single molecule level when visualized by TIRFM. Here we expand on our previous work and demonstrate the development of new barrier elements, which we call DNA "racks", that can be used to make DNA curtains in which both ends of the molecules are anchored to the flowcell surface. An overview of the general design is presented in
FIG. 13 and18 and utilizes a combination of two distinct pattern elements, as described below. To make the curtains, one end of the DNA is first anchored via a biotin-neutravidin interaction to a supported lipid bilayer coating the surface of the sample chamber (FIG. 13B and FIG. 13C ). In the absence of a hydrodynamic force the molecules are randomly distributed on the surface, but lie primarily outside of the detection volume defined by the penetration depth of the evanescent field (-150-200 nm). Application of flow pushes the DNA through the sample chamber with one end remaining anchored to the bilayer. The first pattern elements are linear barriers to lipid diffusion, which are oriented perpendicular to the direction of flow at strategic locations in the path of the DNA (FIG. 13B and FIG. 13C ); these linear barriers are designed to halt the movement of the lipid-tethered DNA molecules causing them to accumulate at leading edge of the barriers where they then extend parallel to the surface. - The second elements of the pattern are a series of arrayed pentagons (for example, a non-linear, geometric barrier) positioned behind the linear barriers and separated from one another by small nanochannels. The non-linear, geometric shape of the pentagons is intended to act as a funnel and direct any lipid-tethered DNA molecules through the nanochannels so that they do not accumulate at the leading edge of the pentagons, but rather are pushed along the surface until they encounter the next successive linear barrier in the pattern. The distance between the linear barriers and the pentagons is optimized for the length of the DNA to be used for the experiments. The pentagons themselves present a large surface that can be coated with antibodies directed against digoxigenin (DIG), which is covalently linked to the ends of the DNA opposite the ends bearing the biotin tag. When the DIG-coupled DNA end encounters the antibody-coated pentagons they should become immobilized, and the DNA should remain stretched parallel to the surface even when no buffer is being pushed through the sample chamber. The distance between each of the successive linear barriers should influence the density of aligned DNA because the total number of molecules anchored to the bilayer is directly proportional to the area encompassed by the bilayer upstream from each barrier. Varying the total distance between adjacent barrier sets on the flowcell surface should yield double-tethered DNA curtains of varying density, enabling the user to scan the surface for regions with an appropriate number of molecules for an experiment. Therefore the patterns were designed with separation distances of either 0.1, 0.2, 0.3, 0.4, or 0.5 µm between the adjacent sets of barriers (
FIG. 13D ). -
FIGS. 14 and19 show the characterization of a DNA rack made by Ebeam lithography and highlights specific features of the pattern geometry deemed critical for its function.FIG. 14A shows a low magnification optical image of the overall pattern design, indicating the variable spacing between the barrier sets within the pattern. A higher magnification optical image including the dimensions of critical pattern parameters is presented inFIG. 14B. FIG. 14C shows measurements of these parameters using atomic force microscopy (AFM).FIG. 14D shows characterization of the patterns with scanning electron microscopy (SEM). As demonstrated from these images, the height of the patterns elements was on the order of 20-25 nm, the width of the nanochannels was 500 nm, and the distance between the leading edge of the linear barriers and the center of the pentagon array was either 12 or 13 µm, as specified. This distance was specifically selected for use with λ-DNA, which is 48,502 base pairs with a fully extended contour length of approximately 16.5 µm, thus 11 to 13 µm would correspond to a mean extended length of ∼70% to 80% that of the full contour length, respectively. - Assembly and characterization of double-tethered DNA curtains. The overall design relies upon the selective, but nonspecific adsorption of antibodies to the exposed surface of the metallic pentagons, but the antibodies should not interact with the inert lipid bilayer. To assemble the DNA curtains, the surface of the flowcell was first coated with a lipid bilayer, as previously described, with the exception that BSA was omitted from all buffers used prior to deposition of the antibody. Once the bilayer was assembled on the surface, anti-DIG Fab fragments or anti-BrdU IgG was injected into the sample chamber where they were allowed to adhere nonspecifically to the exposed metal barriers. The antibodies could potentially bind both the linear barriers as well as the pentagons, but the very small surface area of the linear barriers should ensure selective adsorption of more antibody to the much larger pentagons. Following a brief incubation, the free Fab was rinsed from the flowcell and replaced with buffer containing 0.2 mg/ml BSA, which served as a nonspecific blocking agent to passivate any remaining exposed surfaces. DNA stained with the fluorescent intercalating dye YOYO1 was then injected into the sample chamber, incubated briefly without buffer flow, and then buffer flow was applied to push the anchored molecules into the linear barriers. Buffer flow was then terminated and the anchored DNA molecules imaged by TIRFM.
- As shown in
FIG. 15A , this procedure yielded curtains of DNA molecules that remained fully extended and visible even though no buffer was flowing through the sample chamber. Any DNA molecules that failed to become anchored by the DIG labeled end remained near the linear barriers, but only the ends of the molecules could be observed rather than their full contour lengths. These single-tethered DNA molecules gradually diffused away from the barrier edges and could also be pushed away from the barrier edge simply by reversing the direction of buffer flow (FIG. 15 ), but the double-tethered DNA molecules remained anchored to their original locations, providing additional conformation that the molecules making up the curtain are anchored in the desired configuration. The number of DNA molecules at each of the different barrier locations was proportional to the distance between the adjacent linear barriers. Similar results were obtained with DNA that was end-labeled with a single bromodeoxyuridine (BrdU) and pentagons coated with anti-BrdU antibodies (see below), although the BrdU anchored DNA ends had a greater tendency to dissociate from the pentagons. Finally, control experiments verified that the presence of both the DIG labeled and the Fab fragments were necessary for efficiently anchoring both ends of the DNA. - If the DNA anchored between the barriers was nonspecifically adhered to the sample chamber surface along its contour length, rather than suspended above the inert bilayer, then introduction of a double-stranded break should not cause the molecules to retract from the surface. In contrast, if the DNA were only anchored by the biotin and DIG-tagged ends as designed and suspended above the bilayer, then a double strand break in the strands should cause the molecules to retract away from the surface. When DNA molecules randomly break they can immediately retract from the surface as they diffuse out of the evanescent field and disappear from view. DNA molecules can only interact with the sample chamber surface through their anchored ends, and cannot interact nonspecifically with the lipid bilayer.
- Defined orientation of the DNA. The differential chemistries used to anchor the two ends of the DNA was predicted to define the orientation of the DNA molecules within the curtains. Specifically, the biotinylated end should be anchored at the edge of the linear barrier and the other end should be at the pentagons, and based on this design all of the molecules should be in the exact same orientation. If the DNA molecules were aligned as expected, then a fluorophore located at a single specific site within the DNA and offset from its center should appear as a fluorescent "line" spanning the DNA curtain. The line should be oriented perpendicular to the long axis of the extended DNA molecules and should coincide precisely with the know location of the fluorescent tag. In contrast, if the DNA molecules were randomly oriented, then the fluorescent tags should appear as two lines demarking each of the two possible orientations of the DNA. To confirm that the DNA was oriented correctly, the molecules were labeled at the free ends with BrdU, and labeled at a specific internal position with DIG. The internal labels were made using an oligonucleotide replacement strategy wherein (see Materials and Methods). Experiments with DNA curtains anchored by a single end confirmed that the fluorescent tags were present at a single location within the DNA molecules as dictated by the sequences of the oligonucleotides. The double-tethered curtains were then assembled using pentagons coated with anti-BrdU antibodies, and after assembly the DIG tags with labeled with anti-DIG coated Qdots. As shown in
FIG. 16 , the anti-DIG Qdots were all aligned with one another, confirming the orientation of the DNA molecules. - Imaging proteins sliding on the DNA. The primary motivation for development of these double-tethered DNA curtains was for use in experiments designed to visualize motion of proteins along DNA. We have previously demonstrated that the protein complex Msh2-Msh6 can diffuse in one-dimension along duplex DNA (C6) (see also
FIGS. 50 ,51 ,52 ,53 ,54 , and55 ). Msh2-Msh6 is an essential component of the post-replicative mismatch repair machinery and is responsible for locating and initiating repair of biosynthetic DNA replication errors. Our initial studies with Msh2-Msh6 relied upon DNA molecules that were tethered by either end to neutravidin nonspecifically absorbed to a fused silica surface that was otherwise coated with a lipid bilayer. - With this approach we would obtain only 10-30 DNA molecules per flowcell that were suitable for making diffusion measurements. These double tethered DNA molecules were randomly distributed and had to be manually located before use by visually scanning the entire surface, making these 1D-diffusion measurements technically demanding. As shown above, using the engineered surfaces we can now visualize thousands of molecules per flowcell. Here we demonstrate that these anchored curtains of DNA are suitable for visualizing protein-DNA interactions.
- For these experiments we used the mismatch repair protein complex Mlh1-Pms1, and it was labeled with a single quantum dot via a FLAG epitope tag that was engineered into the Mlh1 subunit. The labeled proteins were injected into a flowcell containing a curtain of double tethered DNA molecules and videos were collected over a 60-second period. As shown in
FIG. 17A , we could readily detect binding of Mlh1-PMs1 to the DNA molecules that were aligned and anchored on the surface. There were approximately 100 DNA molecules and 250 DNA-bound proteins observed in this single field of view, illustrating the improvement of this approach compared to our previous technique for making double tethered DNA molecules. The proteins bound to the DNA rapidly diffused along the DNA molecules, and this motion was revealed in kymograms made from representative examples of molecules within the DNA curtains (FIG. 17B ). As with the naked DNA molecules, the protein-bound DNA molecules also retracted from view when the DNA strands were broken, verifying that there were no nonspecific interactions with the surface. - See also
FIGS. 56 ,57 ,58 ,59 ,60 ,61 and62 for additional studies pertaining to double tethered curtains used to visualize Mlh1 diffusion as well as the diffusion of the Mlh1-Pms1 complex. - Here we used direct-write Ebeam lithography to nanofabricate arrays of diffusion barriers followed by pentagonal anchor points, which together utilize different functional features to anchor curtains of DNA by both ends on the surface of a microfluidic sample chamber. We refer to these patterned surfaces as DNA "racks" because the DNA is stretched out and anchored to the flowcell surface where they can be viewed by TIRFM. An important aspect of these devices is that the fused silica surface is coated with a supported lipid bilayer, and the DNA molecules are suspended above this bilayer, ensuring that they are maintained within an inert microenvironment compatible with a range of biological molecules. We have demonstrated that these tools can be used along with wide-field TIRF microscopy to visualize hundreds of individual, perfectly aligned DNA molecules, all of which are arranged in the same orientation and anchored by both ends to the sample chamber surface. As with our previous nanofabricated devices, this new approach is simple and robust, the flowcells are reusable, the barriers themselves are uniform, and they do not compromise the optical quality of the fused silica or interfere with signal detection.
- As a first conceptual demonstration of the utility of these DNA racks we show here that they can be used to image 1D-diffusion of DNA binding proteins. Our previous approach to these experiments relied upon DNA that was randomly anchored to a surface via biotin-neutravidin interactions, which yielded no more than 1-3 molecules of DNA per field-of-view, and there were just ∼10-30 double-tethered DNA molecules present over the entire surface of the flowcell. Moreover, in our prior studies, the orientation of the DNA could not be defined because the molecules were anchored with a biotin located at either end of the DNA. Therefore the molecules were randomly oriented on the flowcell surface, making it difficult to locate and compare different DNA molecules to one another in order to dissect sequence specific events. While this original approached proved useful for our initial studies, it was tedious and remained challenging to collect sufficient data for thorough analysis. As demonstrated here, we are now able to visualize on the order of one hundred DNA molecules per field-of-view, thousands of molecules are present on the surface of a flowcell, and all of these DNA molecules are aligned in the exact same orientation, which will make 1D diffusion measurements and molecule-to-molecule comparisons straightforward for future work.
- References:
- C1. Fazio, T., Visnapuu, M. L., Wind, S., & Greene, E. C. (2008) DNA curtains and nanoscale curtain rods: high-throughput tools for single molecule imaging. .
- C2. Visnapuu, M. L., Fazio, T., Wind, S., & Greene, E. C. (2008) Parallel arrays of geometric nanowells for assembling curtains of DNA with controlled lateral dispersion. .
- C3. Granéli, A., Yeykal, C., Prasad, T. K., & Greene, E. C. (2006). Langmuir 22, 292-299.
- C4. Sackmann, E. (1996) Supported membranes: scientific and practical applications. Science 271, 43-48.
- C5. Groves, J. & Boxer, S. (2002 Mar) Micropattern formation in supported lipid membranes. .
- C6. Gorman, J., Chowdhury, A., Surtees, J. A., Shimada, J., Reichman, D. R., Alani, E., & Greene, E. C. (2007) Dynamic basis for one-dimensional DNA scanning by the mismatch repair complex Msh2-Msh6. .
- C7. Granéli, A., Yeykal, C., Robertson, R. B., & Greene, E. C. (2006) Long-distance lateral diffusion of human Rand51 on double-stranded DNA. Proceedings of the National Academy of Sciences, USA 103, 1221-1226.
- C8. Prasad, T. K., Robertson, R. B., Visnapuu, M. L., Chi, P., Sung, P., & Greene, E. C. (2007) A DNA-translocating Snf2 molecular motor: Saccharomyces cerevisiae Rdh54 displays processive translocation and extrudes DNA loops. J Mol Biol 369, 940 - 953.
- C9. Prasad, T. K., Yeykal, C., & Greene, E. C. (2006). Journal of Molecular Biology 363, 713-728.
- During postreplicative mismatch repair (MMR), proteins must communicate information over long distances along the DNA helix. Without being bound by theory, evidence from bulk biochemical studies deminstrates this communication occurs predominantly through mechanisms involving motion of proteins along DNA. Consistent with this, we have used single molecule optical microscopy to demonstrate that the MMR proteins Msh2-Msh6 and Mlh1-Pms1 can both travel along DNA via a mechanism most consistent with sliding. Neither the bulk biochemical studies nor our single molecule observations could completely rule out other mechanisms, such as hopping, jumping and/or intersegmental transfer. Here we have devised an assay that enables us to determine whether Msh2-Msh6 and/or Mlh1-Pms1 can travel along DNA while employing one or more of these alternative mechanisms. This new assay relies upon nanofabricated metallic structures for arranging individual DNA molecules into crisscrossed patterns suspended above the surface of a microfluidic sample chamber otherwise coated with a lipid bilayer. We used these substrates to determine whether or not Msh2-Msh6 and/or Mlh1-Pms1 could transfer directly from one strand of DNA to another as the proteins slid past the junctions between intersecting DNA molecules.
- MMR is conserved from bacteria to man. MMR involves various proteins, such as MutSα (which comprises Msh2-Msh6), MutLα (which comprises Mlh1-Pms1), ExoI, RPA, PCNA, pol δ, of which MutSα and MutLα will be discussed herein. Defects in this process result in 100-1000X increase in mutation frequency. For example, defects in MMR is associated with a cancer-prone syndrome, hereditary nonpolyposis colorectal cancer (HNPCC). Up to 90% of HNPCC cases are due to mutations in MSH2 or MLH1.
- Biochemical reactions involving genomic transactions often require proteins to communicate regulatory information over long distances along a DNA strand. Postreplicative mismatch repair (MMR) is an evolutionarily biochemical pathway requiring protein-mediated signaling over long distances of DNA during the repair of replication errors (see for example,
FIG. 48 ). MMR has been most studied in E. coli where the proteins MutS, MutL, and MutH promote the initiation of strand-specific repair by taking advantage of the transiently unmethylated state of the newly synthesized daughter DNA. MutS binds mismatched DNA and together with MutL activates the MutH nicking endonuclease. This leads to cleavage of the daughter strand at the nearest hemi-methylated dGATC, which serves as a strand discrimination signal enabling distinction between the parental DNA and the error-containing daughter strand. The nick generated by MutH provides an entry point for other proteins that complete downstream steps of the pathway. The stand discrimination signals can be located up to ∼2 kb away from the mismatch and still elicit repair in reconstituted in vitro systems. Moreover, once removal of the daughter strand ensues, the excision machinery stops only after it has bypassed the original location of the mispaired base. These findings highlight that communication along the DNA helix is necessary to coordinate mismatch binding with events at the distal strand discrimination signal, and the proteins involved must keep track of which strand is which throughout the entire process. - In eukaryotes, MMR involves up to eleven different proteins, including Msh2-Msh6 (MutSα) and Mlh1-Pms1 (MutLα), both of which are necessary for the initial stages of the repair reaction. Cancer-associated mutations can be mapped to the MSH and MLH genes, indicating the importance of these proteins in genome maintenance. Msh2-Msh6 in a heterodimer comprised of two MutS homologs, and is necessary for initial mismatch recognition and binding. Mlh1-Pms1 interacts with Msh2-Msh6 after mismatch recognition and is thought to coordinate downstream steps in the repair pathway. ATP-binding and hydrolysis can provoke conformational changes in Mlh1-Pms1 necessary to regulate these protein-protein interactions. Homologs of MutH are not found in eukaryotes, but Mlh1-Pms1 itself is a latent endonuclease that is activated in the presence of Msh2-Msh6, PCNA, RFC, mismatched DNA, and ATP. This endonuclease activity is necessary for processing the daughter DNA strand during repair. How the daughter stand is identified remains unclear because the strand discrimination signals in eukaryotes are unknown. Pre-existing nicks between adjacent Okazaki fragments in the lagging strand or the 3' hydroxyl present on the leading strand of replication-restart intermediates can participate in strand discrimination, again highlighting the need for long distance communication along the DNA helix. Structures of MutL family members can be found in Guarné et al. ((2004) EMBO J. 23: 4134-4135) and in Kosinski et al. ((2005) Journal of Molecular Biology. 351: 895-909).
- It is necessary for the MMR proteins to communicate information between the lesion and the distal strand discrimination signal. The mechanism by which this communication occurs has been the subject of intensive investigation. Accumulating evidence supports the idea that 1D diffusion is an integral aspect of MMR protein function (see
FIG. 49 ). In support of this, we have visualized Msh2-Msh6 at the single molecule level using total internal reflection fluorescence microscopy (TIRFM) and demonstrated that the protein can rapidly diffuse in one dimension along DNA. We have also demonstrated that Mlh1-Pms1 can also diffuse on DNA, and it travels an order of magnitude faster that Msh2-Msh6. Lateral movement of these proteins can contribute to lesion recognition, post-recognition steps necessary for locating strand discrimination signals, and/or processing of the daughter DNA strand. From a mechanistic perspective the diffusion appears to occur via a sliding mechanism wherein the proteins travel while remaining engaged with bound DNA strand. However, we could not unambiguously rule out jumping, hopping, and/or intersegmental transfer, all of which potential mechanisms enabling a protein to passively travel along DNA without need for a high-energy cofactor. A common aspect of these mechanisms is that they each must invoke an intermediate state in which the proteins are either partially or fully disengaged from the DNA substrate, and therefore capable of establishing interactions with a second DNA site. Consequently hopping, jumping, and/or intersegmental transfer can allow direct transfer of a protein from one DNA strand another. In contrast, a protein traveling along DNA purely via a sliding mechanism would be incapable of directly transferring from one DNA to the next because the protein must by definition remain engaged with the substrate as it is moving. - To determine whether Msh2-Msh6 and Mlh1-Pms1 traveled along DNA via sliding or whether hopping, jumping, and/or intersegmental transfer contributed to the observed motion we sought to directly visualize proteins on two intersecting DNA molecules to ask whether the proteins could transfer directly from one strand to the next. This was accomplished using nanofabricated patterns of crisscrossed DNA molecules that were suspended above an inert lipid bilayer and anchored to the surface of a microfluidic sample chamber. We then used single molecule optical microscopy to visualize the movements of individual fluorescent proteins as they traversed the intersecting DNA molecules. We reasoned that any events involving direct transfer of proteins between DNA molecules would be apparent as abrupt 90° turns in the protein motion coinciding with the intersecting junctions of the DNA. The existence of such events would provide an unambiguous readout arguing that mechanism of protein movement involved a 3D component wherein the originally bound DNA was released. In contrast, the absence of protein transfer between crossed DNA strands at the junction points would argue strongly that the observed lateral motion was a pure sliding mechanism wherein the proteins remained in continuous, uninterrupted contact with the DNA.
- Design and fabrication of crisscrossed DNA patterns. Experiments using catenated plasmids have been used to probe protein-mediated communication between distal DNA sites, and elegant examples of these studies have included promoter-enhancer interactions, restriction endonucleases, and site-specific recombination. We sought to devise an experiment using intersecting molecules of DNA in a format compatible with single molecule imaging. The design strategy for engineering crisscrossed patterns of DNA suspended above an inert lipid bilayer is illustrated in
FIG. 21 . The approach for making arrays of intersecting DNA molecules relied upon a combination of hydrodynamic force and diffusion barriers (such as non-linear, geometric nanoscale diffusion barriers) to control the organization of DNA molecules anchored by one end to a lipid bilayer via a biotin-neutravidin connection. A key feature of the current design is that the different pattern elements are organized into squares wherein two adjacent sides are comprised of linear barriers, and the other two sides are non-linear, geometric barriers made up of arrayed pentagons. The patterns are placed at the center of a four-channel flowcell such that each of the linear barriers is oriented perpendicular to one of the two buffer inlet channels. The linear elements serve as diffusion barriers, which cannot be traversed by the lipids within the bilayer. Arrays of pentagons are positioned downstream from the linear barriers and serve as solid attachment points for the other end of the DNA. The pentagons are nonspecifically coated with antibodies directed against digoxigenin, which is covalently attached to the free ends of the DNA. When the lipid-tethered DNA molecules are pushed into the linear diffusion barriers, they extend parallel to the surface and the DIG-labeled free end of the DNA then binds the antibodies adsorbed to the exposed pentagon surfaces. The triangular faces of the pentagons are designed to funnel DNA into the channels between each adjacent pentagon to minimize accumulation of DNA molecules within the interior of the square patterns. -
FIGS. 21 B-E show examples of SEM (scanning electron microscopy), optical, and AFM (atomic force microscopy), images of patterns made with thin layers of gold (Au) deposited on a fused silica surface by Ebeam lithography. The dimensions of critical pattern parameters are indicated. The linear barrier elements were about 100 nm wide. The pentagons were 2 µm in length and 1 µm in width, and each pentagon was separated from its nearest neighbors by channels that were 400 nm in width. The height of the different metallic elements was about 20-25 nm, and the distance between the leading edge of the linear barrier elements and the center of the arrayed pentagons was 12 µm. This distance was specifically selected for use with λ-DNA (48,502 bp, 16.5 µm), such that the anchored molecules would be extended to ∼70-80% of their full length, depending upon where the ends were anchored within the pentagons. This distance was chosen so as not to stretch the DNA beyond its natural length and avoid deformation of the B-form geometry. Moreover, we have previously conducted 1D diffusion experiments with both Msh2-Msh6 and Mlh1-Pms1 using DNA stretched to the same extent. - Assembly of the crisscrossed DNA curtains involved the sequential addition of different components to achieve the desired substrate configuration. First, the surfaces of the flowcell were first coated with a lipid bilayer containing a small fraction (0.5%) of biotinylated lipid. The inert bilayer covers the exposed fused silica, but can not form over the gold surface patterns, leaving the metallic surfaces exposed to solution. Anti-DIG Fab fragments were then injected into the sample chamber, and incubated for a brief period, allowing them to adhere to any surfaces not protected by the lipid bilayer. The large surface area of the pentagons relative to the much smaller linear barriers ensures that the pentagons are selectively coated with more antibodies. The sample chamber surface was then blocked with buffer containing BSA, and neutravidin was coupled to the bilayer to provide a mobile attachment point for the DNA. Finally λ-DNA labeled at one end with biotin and at the other end with digoxigenin was injected into the sample chamber and pushed into the linear barrier elements. Once the molecules encounter the linear barriers, they stretch out and the free ends adhered to the pentagons.
FIG. 22 shows examples of YOYO1 stained DNA molecules that were aligned and anchored to the metallic racks. One end of the DNA was linked to the lipid bilayer through a biotin-neutravidin connection, and the other end of the DNA was labeled with digoxigenin (DIG) and coupled to the pentagons via nonspecifically adsorbed anti-DIG Fab fragments. No buffer was flowing during image acquisition, confirming that the DNA molecules were anchored by both the biotinylated and digoxigenin labeled ends. As shown here, the anchored DNA molecules are oriented at 90° relative to one another ensuring that they are in close physically proximity only at the intersecting points. - We have previously shown that Msh2-Msh6 can travel along DNA by 1D diffusion and that the observed motion is consistent with a mechanism involving a rotational component wherein the proteins continually track the phosphate backbone. In addition, we have demonstrated that this motion appears to involve continuous contact between Msh2-Msh6 and the phosphate backbone with no obvious evidence that the linear motion included any hops or jumps along the DNA.
- Our previous work has shown that Mlh1-Pms1 can also slide along DNA, but travels roughly an order of magnitude more rapidly than Msh2-Msh6, suggesting that these two protein complexes move via fundamentally distinct mechanisms. The structures of these two protein complexes is also strikingly different. Msh2-Msh6 is a compact heterodimeric complex that engages DNA through close contact with the phosphate backbone. Mlh1-Pms1 has N- and C-terminal domains separated by long linker arms that are thought to encircle DNA. Interestingly, bulk biochemical experiments have revealed that Mlh1-Pms1 binds tightly and nonspecifically to DNA, with a strong preference for circular substrates, and does not dissociate over time scales spanning several minutes. However, despite the apparent tight binding affinity, Mlh1-Pms1 can transfer to a competitor DNA in solution, suggesting that the addition of excess competitor DNA provokes dissociation from the initial bound substrate.
- Proteins . HA-tagged Msh2-Msh6 and FLAG-tagged Mlh1-Pms1 were purified from S. cerevisiae as previously described. The protein complexes were labeled with quantum dots (Invitrogen) conjugated to either anti-HA or anti-FLAG, as appropriate. The epitope-tagged proteins are fully functional for MMR in vivo, and the labeled proteins retained wild-type DNA binding activities in gel shift and filter-binding assays, as previously described.
- Nanofabrication . Fused silica slides were cleaned in NanoStrip solution (CyanTek Corp, Fremont, CA) for 20 minutes, then rinsed with acetone and isopropanol and dried with N2. The slides were spin-coated with a bilayer of polymethylmethacrylate (PMMA),
molecular weight - Assembly of crisscrossed DNA. The flowcells were assembled from fused silica slides (G. Finkenbeiner, Inc.) with chromium nanoscale diffusion barriers. Inlet and outlet ports were made by boring through the slide with a high-speed precision drill press equipped with a diamond-tipped bit (1.4 mm O.D.; Kassoy). The slides were cleaned by successive immersion in 2% (v/v) Hellmanex, 1 M NaOH, and 100% MeOH. The slides were rinsed with filtered sterile water between each wash and stored in 100% MeOH until use. Prior to assembly, the slides were dried under a stream of nitrogen and baked in a vacuum oven for at least 1 hour. A sample chamber was prepared from a borosilicate glass coverslip (Fisher Scientific) and double-sided tape (∼25 µm thick, 3M). Inlet and outlet ports (Upchurch Scientific) were attached with hot-melt adhesive (SureBonder glue sticks, FPC Corporation). The total volume of the sample chambers was ∼4 µl. A syringe pump (Kd Scientific) and actuated injection valves (Upchurch Scientific) were used to control sample delivery, buffer selection and flow rate. The flowcell and prism were mounted in a custom-built heater with computer-controlled feedback regulation to control the temperature of the sample from between 25-37°C (±0.1 °C), as necessary. After each use, the slides were soaked in MeOH to remove the ports and tape, rinsed with water, washed briefly (15-20 minutes) with Nanostrip, and finally rinsed with water. This procedure was sufficient to clean the slide surfaces for reuse, and each slide could be used multiple times degrading the quality of the optical surface or the metallic patterns.
- DNA curtains were constructed as described. All lipids were purchased from Avanti Polar Lipids and liposomes were prepared as previously described. In brief, a mixture of DOPC (1,2-dioleoyl-sn-glycero-phosphocholine), 0.5% biotinylated-DPPE (1,2-dipalmitoyl-sn-glycero-3-phosphoethanolamine-N-(cap biotinyl)), and 8% mPEG 550-DOPE (1,2-dioleoyl-sn-glycero-3-phosphoethanolamine-N-[methoxy(polyethylene glycol)-550]). The mPEG is does not affect bilayer formation or assembly of the DNA curtains, but rather serves to further passivated the surface against nonspecific adsorption of quantum dots (which we use in our studies of protein-DNA interactions). Liposomes were applied to the sample chamber for 30 minutes. Excess liposomes were flushed away with buffer containing 10 mM Tris-HCl (pH 7.8) and 100 mM NaCl. The flowcell was then rinsed with buffer A (40 mM Tris-HCl (pH 7.8), 1 mM DTT, and 1 mM MgCl2) and incubated for 15 minutes. Buffer A plus 30 µg/ml anti-DIG Fab (Roche) was then injected into the sample chamber and incubated for 20 minutes. The sample chamber was then flushed with buffer A plus and 0.2 mg/ml BSA for 5 minutes. Neutravidin (330 nM) in buffer A was then injected into the sample chamber and incubated for 20 minutes. After rinsing thoroughly with additional buffer A plus 0.2 mg/ml BSA, λ-DNA (15-20 pM) labeled at one end with biotin and at the other end with digoxigenin and pre-stained with 1-2 nM YOYO1 was injected into the sample chamber, incubated for 10 minutes, and unbound DNA was removed by flushing with buffer at 0.1 ml/min. Application of buffer flow caused the lipid-tethered DNA molecules to align along the leading edges of the diffusion barriers.
- TIRFM and data analysis . The basic design of the microscope used in this study has been previously described. In brief, the system is built around a Nikon TE2000U inverted microscope with a custom-made illumination system. For this study, a 488 nm, 200 mW diode-pumped solid-state laser (Coherent, Sapphire-CDHR) was used as the excitation source. The laser was attenuated as necessary and centered over the DNA curtain by means of a remotely operated mirror (New Focus). The beam intensity at the face of the prism was ∼10-15 mW. Images were detected with a back-illuminated EMCCD detector (Photometrics, Cascade 512B). TIRFM images were collected using a 60x water immersion objective lens (Nikon, 1.2 NA Plan Apo), unless otherwise indicated.
- Restriction Enzymes and Msh2 - Msh3 . For complete digests, 700 µL of the desired restriction enzyme in reaction buffer A (40 mM Tris-HCl (pH 7.8), 1 mM MgCl2, 1 mM DTT, and 0.2 mg/ml BSA) plus 50 mM NaCl and 10 mM MgCl2 was injected at 0.2 mL/min. All restriction enzymes were purchased from NEB and the amounts of enzymes used were as follows: NheI (100 units/ml); XhoI (100 units/ml); EcoRI (100 units/ml); NcoI (50 units/ml); PvuI (50 units/ml); and SphI (50 units/ml). Images of the DNA molecules were collected before the restriction enzyme injection and after all of the enzyme solution had flown through. For partial digests, the amount of EcoRI was reduced to 20 units/ml and 700 µL was injected at 0.4 mL/min.
- Msh2-Msh3 was purified as described in Surtees, J. A.; Alani, E. J. Mol. Biol. 2006, 360, 523-536 and TIRFM experiments with Msh2-Msh3 were performed essentially as described for our previously published experiments with Msh2-Msh6 (Gorman, J.et al.. Mol. ). In brief, HA tagged Msh2-Msh3 was incubated with anti-HA antibody conjugated quantum dots at 1:2 protein:quantum dot ratio for 15 min in Buffer A plus 50 mM NaCl. 50 µL of 1.5 nM quantum dot tagged Msh2-Msh3 was then injected at 0.1 mL/min to allow efficient binding. The flow rate was increased to 0.4 mL/min for data collection, and the binding distributions were quantitated as described (Prasad, T. K.; Robertson, R. B.; Visnapuu, M. L.; Chi, P.; Sung, P.; Greene, E. C. J. Mol. Biol. 2007, 369, 940-953).
- These DNA curtains are useful for analysis of protein-DNA interactions at the level of individual molecules, and are capable of providing statistically relevant information in a single experimental run. To demonstrate this utility, we examined the binding distribution of Msh2-Msh3, a protein complex that is involved in postreplicative mismatch repair of small insertion/deletion loops and DNA processing during genetic recombination (Surtees, J. A.; Alani, E. J. Mol. Biol. 2006, 360, 523-536; Langston, L. D.; Symington, L. S. EMBO J. 2005, 24, 2214-2223) For this experiment recombinant Msh2-Msh3 bearing an HA epitope tag on Msh2 was labeled with anti-HA tagged quantum dots (Gorman, J.; Chowdhury, A.; Surtees, J. A.; Shimada, J.; Reichman, D. R.; Alani, E.; Greene, E. C. Mol. ). The tagged proteins were then injected into a sample chamber containing DNA curtains, and the unbound proteins were removed by buffer flow. The DNA molecules and remaining bound proteins were then viewed in the presence and absence of buffer flow (
FIG. 23A and FIG. 23B ). This transient pause in buffer flow is used as a control to verify that the observed proteins are bound only to the DNA and are not bound to the flowcell surface (compareFIG. 23 , panels A and B). As shown inFIG. 23A and FIG. 23C , Msh2-Msh3 bound to the curtains of λ-DNA, but did not display any favored regions or sites for undamaged, homoduplex DNA substrates. There are 226 individual DNA molecules and 548 complexes of Msh2-Msh3 in this single field-of-view collected at 60× magnification, highlighting the statistical power of this approach for viewing single protein-DNA complexes. -
FIG. 24A-D shows representative examples of YOYO1-stained DNA curtains assembled at a non-linear, geometric diffusion barrier pattern with either 1000 nm spacing (FIG. 24A-B ) or 1900 nm spacing (FIG. 24C-D ) between the adjacent geometric nanowells. In the presence of buffer flow the DNA molecules are extended along the surface, but when flow is terminated they diffuse out of view, verifying that they are not nonspecifically adsorbed to the bilayer. These images demonstrate that the non-linear, geometric barriers patterns can be used to prepare DNA curtains, and also shows that the distance between the DNA molecules is influenced by the spacing constraints of the nanowells (compareFIG. 24A and FIG. 24C ). If the DNA molecules within the curtains were in fact retained within the geometric nanowells, as we predicted, then the distance between the adjacent vertices of triangles within the pattern design should be reflected in the separation distance between the individual DNA molecules. -
FIG. 24E highlights examples of DNA curtains made with non-linear, geometric barrier patterns with 1900, 1000, 750, 500, 350, and 200 nm separation between adjacent nanowells. These curtains are comprised of the 23 kb DNA that is fluorescently stained with the intercalating dye YOYO1. To verify that this design pattern yielded DNA molecules with the desired spacing we plotted signal intensity of the stained DNA versus its lateral location along the barrier edge, and these plots confirmed peak-to-peak distances consistent with values from designs of the non-linear, geometric barrier patterns (FIG. 24F ). The 1900, 1000, 750, 500, 350, and 200 nm barriers yielded separation distances corresponding to the pattern designs. For the geometric nanowells with 1900, 1000, 750, 500, and 350 nm spacing, we could resolve the distances between DNA molecules loaded into adjacent wells. For the 200 nm nanowells spacing it was not possible to resolve DNA molecules loaded into adjacent wells because the closely spaced molecules led to overlapping fluorescence signal. However, at lower concentrations of DNA, we were able to confirm that the observed spacing between the DNA molecules occurred in intervals divisible by 200 nm (FIG. 24F , lower panel), indicating that the 200 nm nanowells were functioning. Similarly, we used Fourier transform (FT) analysis to verify the distribution patterns of the DNA within the curtains. As shown inFIG. 24G , the peak-to-peak separation of the power spectrum from the FT correlated to within 5% of the expected values based on the designs of the non-linear, geometric barrier patterns. Taken together, these data demonstrate that the distance between adjacent nanowells dictates lateral separation between individual molecules that make up the DNA curtain. - As indicated above, DNA molecules aligned along smooth, linear chromium barriers can slip laterally along the barrier edges, and this effect becomes more pronounced with shorter molecules of DNA. To illustrate this problem, either 48.5 kb λ DNA or a 23 kb PCR DNA fragment derived from the human β-globin locus was labeled with YOYO1 (see Materials and Methods in Example 2) and these molecules were aligned along the edge of a smooth barrier. Kymograms illustrating the lateral locations of the DNA molecules over a period of 13.5 s were then generated from a cross-section of the curtain. As shown in
FIG. 25 , the fluorescently labeled molecules exhibited movement consistent with lateral slippage of the DNA along the barrier edge even over periods spanning just a few seconds. In addition, quantification of the lateral motion (position variance divided by time) of the DNA molecules aligned along the smooth barrier edges yielded a broad range of values with a mean of 1.6 × 10⁻³ z2.1 × 10-3 µm2/s. DNA curtains made using non-linear, geometric barrier patterns with 500 nm spacing are shown inFIG. 9B , along with the corresponding kymograms. In contrast to the movement observed with the smooth barriers, the λ DNA molecules aligned at the non-linear, geometric patterns displayed absolutely no evidence of lateral slippage over the same 13.5 s period. Similar experiments with DNA molecules of sequentially shorter lengths revealed that the lateral movement of 34, 21, 11, and 5 kb DNA fragments was also eliminated with the non-linear, geometric barrier patterns (FIG. 9B ). Quantification of the lateral motion of these DNA molecules yielded values of just 2.00 × 10⁻⁶ (1.73 × 10⁻⁶ µm2/s, demonstrating that the DNA was effectively immobilized. These DNA molecules remained stationary even over much longer periods spanning tens of minutes and this was true for each of the different barrier dimensions. This data provides evidence indicating that the non-linear, geometric barrier patterns effectively restricted lateral movement of the DNA molecules along the barrier edges. -
FIG. 26A shows sections of YOYO1-stained DNA curtains with differing amounts of DNA assembled at barriers with 1900 nm spacing between the adjacent geometric nanowells. These three images were collected from a single barrier set, as the design of the barriers themselves effectively provides a gradient of differing DNA concentrations. This occurs because the guide channel openings that direct the tethered DNA molecules to the nanowell-containing barriers are all similar widths, whereas the different tiers within the barrier set get incrementally wider. Fluorescence cross-sections of the DNA molecules are shown inFIG. 26B and the relative signal intensity corresponding to the different numbers of DNA molecules are indicated by the horizontal bars. Single DNA molecules were readily identified because they exhibited the lowest observed relative signal intensity (compare the upper, middle and lower panels inFIG. 26A-B ). Nanowells with multiple DNA molecules were also readily identified because they exhibited a clear incremental increase in the relative signal intensity consistent with 1 or more additional DNA molecules (compare the upper, middle, and lower panels inFIG. 26B ).FIG. 26C shows a histogram of the number of DNA molecules per nanowell, demonstrating that under the conditions used for assembling the DNA curtains most of the nanowells (44%) contained only one molecule of DNA, whereas 8% had no DNA, 13% had 2 DNA molecules, 18% had 3 DNA molecules, and 17% had 4 or more molecules of DNA. - To further confirm the assignment of the lowest relative signal intensity as arising from just one DNA, the DNA molecules were partially digested in real time with very low concentrations of the restriction endonuclease AVaI (
FIG. 26D-E , and see below). If just one DNA molecule is present in a nanowell, then stochastic cleavage events will coincide with the complete and near instantaneous loss of any DNA downstream from the corresponding cleavage site because the YOYO1-stained DNA fragment liberated by the AVaI cut will be washed away by buffer flow. In contrast, if multiple DNA molecule are present in a single nanowell, then a single stochastic cleavage event by AVaI will not yield instantaneous loss of all downstream signal, but rather will result in a decease in signal intensity downstream of the cleavage site corresponding to loss of just one DNA molecule. As shown inFIG. 26D , when a single DNA is loaded in the nanowell cleavage by the restriction enzyme leads to immediate loss of the corresponding downstream DNA fragment. In contrast, when multiple DNA molecules are present in a nanowell (FIG. 26E ; in this example there are two molecules in the nanowell), cleavage by the restriction enzyme results in an incremental decrease in the downstream signal because just one of the DNA molecules is cut over the course of the digest. The results from these partial restriction digests confirmed that the lowest YOYO1 fluorescence signal corresponds to just one molecule of DNA. - As shown above, these non-linear, geometric barrier patterns permit studies of even relatively small DNA fragments by eliminating their lateral mobility along the barrier edges. We have also demonstrated that we can load the geometric nanowells with single DNA molecules. In previous work we have shown that the design of the curtains also yields DNA molecules that are all aligned with the same sequence orientation based upon the location of the biotin tag at a specific end of the DNA. As a consequence of this consistent alignment, complete restriction digest of the DNA molecules within the curtain yields identical, tethered fragments whose lengths correspond to the furthest upstream cleavage site. Complete digests at high concentrations of restriction enzyme cannot be used to identify multiple sites cleaved by the same restriction enzyme because the downstream DNA is flushed from the sample chamber as soon as the DNA is cleaved. As shown above, restriction digests done at low concentrations of enzyme can reveal stochastic cleavage events, which could be used to reveal all of the fragments corresponding to each of these intermediate lengths. However, this is only true if the digest is viewed in real time, and sufficient numbers of molecules are observed to detect all sites, and the cleavage rate is slower than the data acquisition frequency. If these criteria are met, then following each individual cleavage event, the downstream fragment will be immediately flushed from the sample chamber by buffer flow, leaving behind the intact biotinylated fragment whose shortened length would correspond to the location of the cleavage site. This can happen repeatedly on the same DNA until that particular molecule is cleaved at the furthest upstream site relative to the anchored end of the DNA. The large number of DNA molecules that can be viewed with these DNA curtains makes it possible to detect all of the potential sites within the DNA, and the geometric nanowells prevent the DNA molecules from slipping back and forth after they are cleaved. Eventually all of the DNA molecules will be cut to a final length corresponding to the furthest upstream restriction site. We refer to this real time digest as dynamic optical restriction mapping and an example of such an assay is shown in
FIG. 27A-B , using the restriction enzymes EcoRI and BamHI, respectively. These kymograms were selected because they provide examples where each of the five EcoRI sites or five BamHI sites can be identified. The total time required for this digest was just under 120 s. This assay is not possible with smooth barrier designs because the DNA molecules start to rapidly slip back and forth as the fragment lengths become shorter and shorter, thus interfering with measurements of the same DNA molecule over time. Thus this real time dynamic optical restriction mapping assay is greatly facilitated when used in combination with barrier patterns comprised of the geometric nanowells. - Nucleosomes are the fundamental unit of organization in eukaryotic chromatin and contribute to all aspects of DNA metabolism. The importance of chromatin structure has driven efforts to establish computational methods for predicting genome-wide nucleosome distributions based on intrinsic sequence preferences. Here we use high-throughput single-molecule imaging of nanofabricated DNA curtains to directly determine intrinsic energy landscapes for nucleosome deposition on model substrates. We then ask whether in silico predictions accurately reflect course-grain features of the experimentally derived intrinsic energy landscapes. Our results show that nucleosome distribution patterns were anticorrelated with predictions from the widely cited model of Segal et al D1, but were strongly correlated with the more recent model of Field et al D2 . Without being bound by theory, these findings reinforce that DNA contains intrinsic positioning information necessary for dictating distributions of canonical nucleosomes, and indicate that exclusionary sequences play a dominant role in this process. We also demonstrate that intrinsic landscapes are largely independent of constituent histone identity, and nucleosomes containing variant histones H2AZ or CenH3 are well correlated with patterns observed for canonical nucleosomes, indicating they are subject to similar thermodynamic principles despite disparate in vivo distributions. However, the non-histone protein Scm3 drastically alters the intrinsic landscape, enabling centromeric nucleosomes to overcome exclusionary effects of poly(dA-dT)-rich sequences. Finally, we show that cis-regulatory sequences in human DNA coincide with peaks in the intrinsic landscape, whereas valleys correspond to non-regulatory regions, and we present evidence arguing that patterns of nucleosome deposition in vertebrate genomes are influenced by both extrinsic factors and possible intrinsic sequence elements not yet accounted for by current theory.
- The distribution of nucleosomes throughout the genome has profound consequences for DNA transcription, repair, and chromosome segregationD3-5. Nucleosomes consist of ∼147-base pairs (bp) of DNA wrapped in ∼ 1.7 turns around an octamer containing two of each histone H2A, H2B, H3, and H4D5, D6. There has been tremendous interest in developing in silico models of genome-wide nucleosome positions, the first of which came from Segal et al., D1 and calculated probabilistic nucleosome distributions based upon the universal preference of nucleosomes for bendable DNA containing AA/TT/AT dinucleotides with 10-bp periodicities in counter-phase with GC dinucleotidesD3, D7 (see also
FIG. 47 ). Without being bound by theory, this supported the idea of a "second genetic code", which asserts that genomes intrinsically encode information dictating nucleosome distributions, and posits that extrinsic factors, such as chromatin remodeling proteins, play a limited role in establishing steady-state positions. However, without being bound by theory, accumulating evidence demonstrates exclusion signals, such as poly(dA-dT), also influence nucleosome distributionD5, D8-10, yet these sequences were unaccounted for in the original Segal predictions. A more recent model from Segal and colleagues, which shall be referred to as the Field, Kaplan & Fondufe-Mittendorf (FKFM) model, used ∼2000-fold more sequence information from isolated nucleosomes to train the pattern matching algorithm and also included exclusion effects from motifs enriched in linker DNAD2 (see alsoFIG. 47 ). - The relative performance of these models as general tools for predicting intrinsic landscapes has yet to be thoroughly explored, prompting us to ask whether we could verify the predictions by high-throughput single-molecule imaging with total internal reflection fluorescence microscopy. For this assay, DNA is anchored to a lipid bilayer on the surface of a microfluidic chamber and hydrodynamic force is used to align thousands of molecules into curtains along nanofabricated barriers where they are viewed in real-time (
FIG. 28A andFIG. 32 ) D11. To make curtains with nucleosomes, recombinant S. cerevisiae octamers containing FLAG-H2B were deposited onto biotinylated λ-DNA by salt dialysis (FIG. 33 ), which recapitulates thermodynamically favorable distributionsD5, D12, and nucleosomes were labeled in situ with anti-FLAG quantum dots (QDs;FIG. 28B ). Transient termination of hydrodynamic force provoked entropic collapse of the curtains, causing the DNA and nucleosomes to drift outside the detection volume defined by the evanescent field, verifying the molecules were anchored only via the biotin tag (FIG. 28B-D ). For distribution analysis, conditions were selected to yield ∼5 nucleosomes per DNA, equivalent to ∼1.5% coverage of the 48.5-kb substrate, and time courses confirmed the nucleosomes did not move or dissociate during the experiments (FIG. 28B-D ). - λ-DNA is not subject to evolutionary pressure to position nucleosomes, but analysis of the phage genome revealed an advantage for its use as a model substrate: the Segal and FKFM models yielded strikingly dissimilar predictions for the nucleosome distribution patterns (
FIG. 29A ,FIG. 34A-B , andFIG. 35A ). Pearson correlation analysis revealed these predictions were actually anticorrelated (r=0.76, p<0.0001;FIG. 36 ). The contrasting predictions are attributed to exclusionary sequences, as evidenced by the observation that the Segal model was correlated with poly(dA-dT) tracts (r=0.60, p<0.0001), whereas the FKFM model was anticorrelated with these same features (r=0.68, p<0.0001;FIG. 29B ). The different distributions generated by the two models provided a means for evaluating their relative performance. To test the predictions we measured the locations of 1,248 canonical nucleosomes and 1,210 nucleosomes containing the histone variant H2AZ (N=2,458 total;FIG. 29 , andFIGS. 37 -38); a histogram of these positions represents a course-grained profile of the thermodynamically favored intrinsic energy landscape for nucleosome deposition (FIG. 29A ). The observed nucleosome distribution was anticorrelated with both the Segal prediction (r=-0.55, p<0.0001;FIG. 29B ) and the poly(dA-dT) distribution (r=0.32, p<0.01), but bore a remarkable resemblance to the FKFM prediction (r=0.63, p<0.0001;FIG. 29A-B , andFIG. 35 ). These results highlight limitations of the original Segal model, but support the refined FKFM model as a general means for predicting intrinsic energy landscapes of nucleosome binding sites. The fact that an algorithm trained with sequences derived from S. cerevisiae could predict the intrinsic landscape of λ-DNA further demonstrates that steady-state nucleosome positions in yeast are dictated primarily through intrinsic sequence effects. - Information within eukaryotic genomes is enriched through targeted deposition of histone variants. Histone H2AZ is a conserved lineage of H2A that influences gene regulationD13-18. CenH3 (Cse4 in yeast) is an H3-variant that serves as a centromere-specific epigenetic markerD19-21. Cse4 can replace CenH3 in human centromeres, indicating a high degree of functional conservationD22. In vivo deposition of H2AZ and CenH3 requires extrinsic factorsD4, D21, D23, but it remains unclear whether variants are subject to the same energetic landscapes that dictate favorable binding by canonical nucleosomes. Nucleosomes bearing H2AZ displayed the same distribution trends as canonical nucleosomes, demonstrating that H2AZ does not alter thermodynamic sequence preferences (
FIG. 29 , andFIGS. 37 -38). The intrinsic landscape is intriguing for Cse4, which binds poly(dA-dT)-rich CEN DNA in vivo, and forms an unusual hexasome wherein H2A/H2B is replaced with the non-histone protein Scm3D21. If centromeric nucleosomes obey the same principles as canonical nucleosomes with respect to site preferences, then the in vitro distributions should be similar. - Alternatively, if centromeric nucleosomes do not obey the same thermodynamic principles, then they should exhibit distinct distribution patterns. As shown in
FIG. 30A , Cse4 did cause ∼7% of the total nucleosomes to redistribution away from the left 10-kb of the λ-DNA (FIG. 30A ), reflecting a subtle perturbation of the intrinsic landscape. However, the overall distribution of Cse4-nucleosomes (N=2,033) was still correlated with that of the canonical nucleosomes (r=0.58, p<0.0001), was correlated with the FKFM prediction (r=0.59, p<0.0001), and was anticorrelated with the Segal prediction (r=-0.55, p<0.0001). These findings demonstrate that Cse4 alone does not drastically alter the intrinsic landscape, which is reasonable from a physical perspective given that ∼1.7 turns of DNA still wrap around octamers harboring the centromeric H3-variant (FIG. 37C ). In contrast, nucleosomes containing both Cse4 and Scm3 displayed an altered landscape, which was not significantly correlated with either theoretical model (FIG. 30B ), or with the canonical/H2AZ distribution (r=0.30, p=0.016;FIG. 30B ). Nor was the Cse4/Scm3 distribution significantly correlated with the Cse4-octamer distribution (r=0.31, p=0.013) or the poly(dA-dT) tracts (r=0.11, p=0.387). All other nucleosomes displayed reduced occupancy within the poly(dA-dT)-rich center of λ-DNA (FIG. 29A andFIG. 30A ), but this aversion was relieved by Scm3 (FIG. 30B ), suggesting that Scm3 alters the mechanism of DNA binding. This conclusion is supported by the finding that nucleosomes bearing Scm3 display an altered MNase footprint (FIG. 37 ). Without being bound by theory, these findings support the idea that poly(dA-dT)-rich CEN sequences in S. cerevisiae have evolved in part to exclude normal octameric nucleosomes, while Scm3 abrogates this inhibition, thus ensuring a unique centromeric landmark for kinetocore assembly. - All of the work described above utilized phage λ DNA as a simple model substrate. To determine the intrinsic landscape of a more complex eukaryotic substrate we tested a 23-kb fragment from the human β-globin locus (
FIG. 31A ). Comparison of the two theoretical distributions for this substrate revealed they were again anticorrelated (r=-0.74, p<0.0001;FIG. 31A ;FIG. 36 ). While β-globin DNA lacks the fortuitous asymmetry of λ-phage, the FKFM model still predicts four prominent clusters of positioned nucleosomes that should be discernable in the course-grained landscape obtained from the in vitro data (FIG. 31A ,FIG. 35B ). As shown inFIG. 31C , the distribution of nucleosomes (N=1,063) bound to the β-globin substrate was weakly anticorrelated with the Segal prediction (r=-0.37, p=0.04), but was correlated with the FKFM prediction (r=0.65, p<0.0001). The agreement between our data and the theoretical prediction was good along the left half of the molecule, suggesting nucleosomes obey similar thermodynamic rules, as defined by the FKFM model, regardless of the origin of the DNA. The intrinsic profile along the right half of the β-globin DNA was somewhat broader (FIG. 35 ), which implies the existence of additional features in human DNA unaccounted for by current theory. Notably, every peak within the intrinsic landscape coincided with regulatory sequences, including the promoter-proximal regions of the Ay- and δ-globin genes, and the non-coding ψβ-globin gene. An additional peak in the intrinsic landscape encompassed an intergenic developmental stage-specific promoter ∼2.6-kb upstream from the δ-globin gene within a region containing binding sites for the repressor BCL11A, which is necessary for silencing the fetal γ-globin genes during globin gene switching and is deleted in patients with Corfu δβ-thalassemia (FIG. 31A-B ) D24-26. - In contrast, valleys within the intrinsic landscape corresponded to non-transcribed and non-regulatory DNA. This data reveals that cis-regulatory regions within the human β-globin locus are poised with thermodynamically favored nucleosome-binding sites. Without being bound by theory, this evolutionarily-driven architecture has arisen because precise nucleosome positioning within regulatory sequences can be much more critical compared to other areas of the genome D13, D27, D28. It remains to be determined whether this organizational relationship is a general trend defining the intrinsic landscape of eukaryotic DNA. Interestingly, the locations of nucleosomes across the β-globin locus have been mapped in CD4+ T cells D29, but there was no obvious correlation between these positions and the theoretical FKFM prediction (
FIG. 31A-B ). The in vivo nucleosome distribution also did not fully coincide with the course-grain features of the experimentally observed intrinsic landscape, although the promoter proximal regions of the ψβ- and δ-globin genes were occupied by positioned nucleosomes based on the intrinsic landscape (FIG. 31A-B ). However, the in vivo data were paradoxically dissimilar with the experimentally defined intrinsic landscape in the region encompassing the Aγ-globin gene, illustrating that thermodynamically favored sequences alone can not predict nucleosome occupancy within the human genome. Therefore extrinsic factors must play a more prevalent role for establishing in vivo nucleosome distribution patterns in the human genome. - Histones were expressed in E. coli, purified from inclusion bodies and reconstituted as described (
FIG. 33 ) D30. H2AZ was cloned into pET-100/D-TOPO and purified using the same procedure (FIG. 37 ) D30. Cse4 was purified and reconstituted as described (FIG. 37 ) D21. Scm3 remained soluble after cell lysis and was ammonium sulfate precipitated (45% saturation), resuspended in unfolding buffer (7 M guanidinium-HCl, 1 M NaCl, 50 mM Tris-HCl [pH 7.8], 1 mM EDTA, 1 mM DTT) and dialyzed against urea buffer (7 M urea, 1 M NaCl, 10 mM Tris-HCl [pH 7.8], 1 mM EDTA, 5 mM β-mercaptoethanol). Scm3 was purified on Ni-NTA agarose in urea buffer, eluted with 200 mM imidazole, and dialysed against 10 mM Tris-HCl [pH 7.8] plus 5 mM β-mercaptoethanol, followed by 10 mM Tris -HCl [pH 7.8], then lyophilized and stored at -20°C. Nucleosomes were deposited onto DNA by salt dialysis (FIG. 33 ,FIG. 37 ), and the DNA was assembled into curtains as describedD11. Nucleosomes were labeled with 2 nM QDs (Invitrogen, 705 nm emission) conjugated to anti-FLAG antibodies (Sigma). Illumination was by a 488-nm laser (Coherent, Sapphire-CDHR), images were collected using a water immersion objective (Nikon, 1.2 NA Plan Apo, 60x). YOYO1 and QD emissions were separated using a dichroic mirror (630 nm DCXR, Chroma Technologies) and recorded with an EMCCD (Photometrics, Cascade 512B). Images for position analysis were acquired at a flow rate of 0.4 ml/min in 40 mM Tris-HCl [pH 7.8], 1 mM DTT, and 0.2 mg/ml BSA. Flow was transiently paused to exclude non-specifically bound QDs from analysis. Only full-length DNA molecules well resolved from adjacent neighboring molecules were used for distribution measurements. Nucleosome position measurements and statistical analysis were performed using Igor Pro. All correlation trends were cross-validated on a random subset comprised of half the experimental data. - Nanofabricated DNA curtains. Electron-beam lithography was used to nanofabricate chromium diffusion barriers on the fused silica surface of a microfluidic sample chamber. λ-DNA molecules stained with YOYO1 (green) were then anchored via a biotin-neutravidin linkage to a fluid lipid bilayer deposited on the surface of the slide. Application of buffer flow aligns the DNA molecules along the leading edges of the nanofabricated barriers and extends the DNA parallel to the sample chamber surface, confining the molecules within the excitation volume defined by the penetration depth of the evanescent field. When buffer flow is transiently paused the DNA molecules collapse due to entropic forces and move away from the surface of the sample chamber demonstrating that the molecules do not interact nonspecifically with the lipid bilayer.
- Visualizing DNA curtains and fluorescent nucleosomes. A YOYO1-stained DNA curtain (green) was assembled as described, with the exception that the DNA was pre-bound by nucleosomes deposited through salt dialysis. The nucleosomes were labeled in situ using fluorescent quantum dots (magenta). When buffer flow is transiently paused, the nucleosome-bound DNA molecules collapse due to entropic forces and move away from the surface of the sample chamber demonstrating that the molecules do not interact nonspecifically with the lipid bilayer and verifying that the nucleosomes are bound to DNA.
-
- D1 E. Segal, Y. Fondufe-Mittendorf, L. Chen et al., A genomic code for nucleosome positioning. Nature. 442, 772 - 778 (2006).
- D2 Y. Field, N. Kaplan, Y. Fondufe-Mittendorf et al., Distinct modes of regulation by chromatin encoded through nucleosome positioning signals. PLoS Comput Biol. 4, e1000216 (2008).
- D3 O.J. Rando and K. Ahmad, Rules and regulation in the primary structure of chromatin. Curr Opin Cell Biol. 19, 250 - 256 (2007).
- D4 C. A. Morris and D. Moazed, Centromere assembly and propagation. Cell. 128, 647 - 650 (2007).
- D5 J. Widom, Structure, dynamics, and function of chromatin in vitro. Annu Rev Biophys Biomol Struct. 27, 285 - 327 (1998).
- D6 K. Luger, A. W. Mäder, R. K. Richmond et al., Crystal structure of the nucleosome core particle at 2.8 A resolution. Nature. 389, 251 - 260 (1997).
- D7 S. C. Satchwell, H. R. Drew, and A. A. Travers, Sequence periodicities in chicken nucleosome core DNA. J Mol Biol. 191, 659 - 675 (1986).
- D8 K. Struhl, Naturally occurring poly(dA-dT) sequences are upstream promoter elements for constitutive transcription in yeast. Proc Natl Acad Sci USA. 82, 8419 - 8423 (1985).
- D9 G. C. Yuan, Y. J. Liu, M. F. Dion et al., Genome-scale identification of nucleosome positions in S. cerevisiae. Science. 309, 626 - 630 (2005).
- D10 W. Lee, D. Tillo, N. Bray et al., A high-resolution atlas of nucleosome occupancy in yeast. Nat Genet. 39, 1235 - 1244 (2007).
- D11 T. Fazio, M. L. Visnapuu, S. Wind et al., DNA curtains and nanoscale curtain rods: high-throughput tools for single molecule imaging. Langmuir. 24, 10524 - 10531 (2008).
- D12 E. A. Sekinger, Z. Moqtaderi, and K. Struhl, Intrinsic histone-DNA interactions and low nucleosome density are important for preferential accessibility of promoter regions in yeast. Mol Cell. 18, 735 - 748 (2005).
- D13 I. Albert, T. N. Mavrich, L. P. Tomsho et al., Translational and rotational settings of H2A.Z nucleosomes across the Saccharomyces cerevisiae genome. Nature. 446, 572 - 576 (2007).
- D14 M. P. Creyghton, S. Markoulaki, S. S. Levine et al., H2AZ is enriched at polycomb complex target genes in ES cells and is necessary for lineage commitment. Cell. 135, 649 - 661 (2008).
- D15 M. D. Meneghini, M. Wu, and H. D. Madhani, Conserved histone variant H2A.Z protects euchromatin from the ectopic spread of silent heterochromatin. Cell. 112, 725 - 736 (2003).
- D16 R. M. Raisner, P. D. Hartley, M. D. Meneghini et al., Histone variant H2A.Z marks the 5' ends of both active and inactive genes in euchromatin. Cell. 123, 233 - 248 (2005).
- D17 H. Zhang, D. N. Roberts, and B. R. Cairns, Genome-wide dynamics of Htz1, a histone H2A variant that poises repressed/basal promoters for activation through histone loss. Cell. 123, 219 - 231 (2005).
- D18 D. Zilberman, D. Coleman-Derr, T. Ballinger et al., Histone H2A.Z and DNA methylation are mutually antagonistic chromatin marks. Nature. 456, 125 - 129 (2008).
- D19 B. E. Black, D. R. Foltz, S. Chakravarthy et al., Structural determinants for generating centromeric chromatin. Nature. 430, 578 - 582 (2004).
- D20 P. B. Meluh, P. Yang, L. Glowczewski et al., Cse4p is a component of the core centromere of Saccharomyces cerevisiae. Cell. 94, 607 - 613 (1998).
- D21 G. Mizuguchi, H. Xiao, J. Wisniewski et al., Nonhistone Scm3 and histones CenH3-H4 assemble the core of centromere-specific nucleosomes. Cell. 129, 1153 - 1164 (2007).
- D22 G. Wieland, S. Orthaus, S. Ohndorf et al., Functional complementation of human centromere protein A (CENP-A) by Cse4p from Saccharomyces cerevisiae. Mol Cell Biol. 24, 6620 - 6630 (2004).
- D23 G. Mizuguchi, X. Shen, J. Landry et al., ATP-driven exchange of histone H2AZ variant catalyzed by SWR1 chromatin remodeling complex. Science. 303, 343 - 348 (2004).
- D24 J. Gribnau, K. Diderich, S. Pruzina et al., Intergenic transcription and developmental remodeling of chromatin subdomains in the human beta-globin locus. Mol Cell. 5, 377 - 386 (2000).
- D25 A. Bank, Regulation of human fetal hemoglobin: new players, new complexities. Blood. 107, 435 - 443 (2006).
- D26 V. G. Sankaran, T. F. Menne, J. Xu et al., Human fetal hemoglobin expression is regulated by the developmental stage-specific repressor BCL11A. Science. 322, 1839 - 1842 (2008).
- D27 M. G. Guenther, S. S. Levine, L. A. Boyer et al., A chromatin landmark and transcription initiation at most promoters in human cells. Cell. 130, 77 - 88 (2007).
- D28 T. N. Mavrich, C. Jiang, I. P. Ioshikhes et al., Nucleosome organization in the Drosophila genome. Nature. 453, 358 - 362 (2008).
- D29 D. E. Schones, K. Cui, S. Cuddapah et al., Dynamic regulation of nucleosome positioning in the human genome. Cell. 132, 887 - 898 (2008).
- D30 J. Wittmeyer, A. Saha, and B. Cairns, DNA translocation and nucleosome remodeling assays by the RSC chromatin remodeling complex. Methods Enzymol. 377, 322 - 343 (2004).
- Single molecule studies of biological macromolecules can benefit from new approaches that facilitate experimental design and data acquisition. Here we develop new strategies to construct molecular curtains of DNA in which the substrates are aligned with respect to one another and maintained in an extended configuration. Importantly, both ends of the DNA are anchored to the surface of a microfluidic sample chamber that is otherwise coated with an inert lipid bilayer. This is accomplished through the use of nanofabricated racks of metallic barrier patterns with two distinct functional elements. Linear barriers to lipid diffusion are first used to align the DNA. Pentagons coated with antibodies then provide solid anchor points for the free ends of the aligned DNA molecules. These devices enable the alignment and anchoring of hundreds of individual DNA molecules, which can then be visualized using total internal reflection fluorescent microscopy under conditions that do not require continuous application of buffer flow to stretch the DNA. This offers the potential for imaging and data acquisition without perturbing the behavior of the proteins under investigation by eliminating the need for an externally applied hydrodynamic force. We provide a demonstration that these DNA racks can be used in a 1D diffusion assay that monitors the motion of quantum dot tagged proteins along DNA.
- Dynamic interactions between proteins and DNA underlie many biological processes, and as such are the subject of intense investigation. Many laboratories are now tackling these problems using new experimental methods that enable the visualization of DNA molecules or protein-DNA complexes at the single-molecule level in real time, and the information garnered from these experiments is being used to build detailed mechanistic models of many different types of reactions E1-4. Similarly, micro- and nanoscale devices are becoming increasingly powerful tools for the manipulation and analysis of individual DNA molecules E5-7. However, one major drawback of many single-molecule techniques is that they are inherently designed to probe individual reactions, and as a consequence it can be challenging to gather statistically relevant data. This difficulty is often compounded by the fact that these experiments are technically demanding. Therefore it is advantageous to establish new approaches that can increase throughput capacity of single-molecule methods, while at the same time making these approaches both easier and more readily applicable to biological reactions involving different types of DNA transactions.
- In an effort to help make single-molecule imaging techniques more accessible we have integrated nanoscale engineering, micro fluidics, and lipid bilayer-coated surfaces with single molecule optical microscopy to develop high-throughput methods for making molecular curtains comprised of thousands of individual DNA molecules E8-10. A key aspect of these experimental platforms is that they utilize inert lipid bilayers to passivate the fused silica surface of a microfluidic sample chamber. Artificial lipid membranes deposited on solid supports have proven useful for many types of biochemical studies E13-15. An important aspect of artificial membranes is that the chemical characteristics of the bilayer can be readily controlled through careful selection of the constituent lipidsE11,E13. In addition, artificial membranes is that they can be partitioned with chemical or mechanical barriers E12, E16, E17, and the distributions of molecules anchored to lipids can also be manipulated using photochemical modulation, electrical fields, or hydrodynamic force E18-21. Taken together, the aforementioned features suggested the potential for controlling the organization of molecules anchored to lipid membranes, and accordingly we have demonstrated that mechanical barriers that disrupt the continuity of lipid bilayers can be used to control the two-dimensional organization of DNA molecules anchored to a surface E8-10. This controlled organization is accomplished by first coating a sample chamber surface with a bilayer containing a small fraction of biotinylated head groups, and DNA molecules are anchored by one end to the bilayer via a biotin-neutravidin linkage E8-10. The lipid-tethered DNA molecules are assembled into molecular curtains by pushing them to the leading edge of either micro- or nano-scale lipid diffusion barriers through the application of a hydrodynamic force. We have demonstrated that microscale barriers to lipid diffusion made by manually etching a fused silica surface with a diamond-tipped scribe could be used to align hundreds of lipid-tethered DNA molecules, and we refer to these as DNA curtains E10, E22-25. More recently we have we have employed electron-beam (ebeam) lithography to fabricate barriers with nanoscale dimensions, which allows for much more precise control over both the location and lateral distribution of the DNA molecules within the curtains E8, E9. These nanofabricated DNA curtains permit simultaneous visualization of thousands of individual DNA molecules that are perfectly aligned with respect to one another, and can be used for massively parallel data acquisition from thousands of individual protein-DNA complexes in real time using a robust experimental platform that is amenable to a wide variety of biological applications. We have also shown that these DNA curtains are advantageous for studying protein-DNA interactions at the single molecule level, and we have applied these tools to biological systems such as nucleosomes and chromatin remodeling, homologous DNA recombination, and post-replicative mismatch repair E22-26.
- Our previous DNA curtain designs required continuous application of a hydrodynamic force during data collection because just one end of the DNA is anchored to the lipid bilayer. If buffer flow is terminated the DNA does not remain stretched, and as a consequence it can not be visualized along its full contour length because it drifts outside of the detection volume defined by the penetration depth of the evanescent field. The need for buffer flow is not problematic for many types of measurements, however, it can potentially impact the behavior of bound proteins or protein complexes, and the magnitude of this impact can scale in proportion to the hydrodynamic radius of the molecules under observation E27, E28. The influence of buffer flow is especially apparent during measurements involving proteins that slide on DNA by one-dimensional diffusion, because an applied flow force can strongly bias the direction that the sliding proteins travel along the DNA E27.
- Here we sought to develop new procedures for making curtains of aligned DNA molecules that were held in an extended configuration anchored by both ends to the surface of a microfluidic sample chamber and suspended above an inert bilayer. These double-tethered curtains of DNA are specifically intended for use in experiments designed to look at passive protein motion along DNA molecules. To achieve this design this we have developed new patterns of metallic barriers with made using either electron-beam or nanoimprint lithography. These metallic patterns incorporate both linear barriers to lipid diffusion and arrayed pentagons, and together these distinct functional elements serve to align and tether long molecules of DNA. The DNA molecules are first anchored by one end to a fluid lipid bilayer via a biotin-neutravidin interaction, and initially aligned with one another by using hydrodynamic force to push them into the linear barriers. The arrayed pentagons serve as solid anchor points positioned at a defined distance downstream from the linear barriers and are coated with antibodies directed against either digoxigenin or bromodeoxyuridine, which are covalently attached to the free ends of the DNA molecules. Importantly, once linked to the surface, the DNA molecules are maintained in an extended state suspended above an inert lipid bilayer and remain confined within the detection volume defined by the penetration depth of the evanescent field, allowing for continuous observation along their full contour length, even in the absence of an applied hydrodynamic force.
- Electron beam lithography. Fused silica slides were cleaned in NanoStrip solution (CyanTek Corp, Fremont, CA) for 20 minutes, then rinsed with acetone and isopropanol and dried with N2. The slides were spin-coated with a bilayer of polymethylmethacrylate (PMMA),
molecular weight - Nanoimprint lithography. Nanoimprint masters were fabricated using electron beam lithography, liftoff, and inductively-coupled plasma etching. Briefly, a bilayer of polymethyl methacrylate (PMMA, 25K and 495K) was spun onto a silicon wafer with a thin coating of silicon dioxide. Patterns were written by an FEI Sirion SEM outfitted with a Nabity Nanopattern Generation System, then developed in a mixture of isopropanol: methyl isobutyl ketone (3:1) at 5°C in a bath sonicator. Samples were rinsed with isopropanol and dried with N2. A Semicore Ebeam evaporator was used to evaporate 20 nm Cr onto the masters. Liftoff was performed in acetone at 65°C. The patterned masters were plasma-etched to a depth of 100 nm in a mixture of C4F8:O2 (9:1) for 90 seconds at a power of 300 W using an Oxford ICP etch tool. Nanoimprint masters were coated with a fluorinated self-assembled monolayer (Nanonex, Princeton, NJ) to prevent adhesion between the master and resist.
- To make nanoimprinted barriers,
PMMA 35K (Microresist Technologies, Germany) was spin-coated on a fused silica microscope slide and baked on a hotplate for 5 min. at 180°C. Nanoimprint was performed in two stages: a 2-min. pre-imprint phase with a pressure of 827.37 kPA (120-psi) and pre-temp. of 120°C, followed by a 5-min. imprint phase with a pressure of 3309.48 kPa (480-psi) and temp. of 190°C. This heated PMMA well above its glass transition temp. and allowed it to conform to the mold. After imprinting, a descum process was done to remove ∼10 nm of residual PMMA. De-scum was done in an inductively coupled plasma under CHF3:O2 (1:1) and a power of 200 W for 40 seconds total (two iterations of 20 seconds). After descum, 15-20 nm of Cr was evaporated on the samples and liftoff was performed in acetone at 65°C for several hours, followed by bath sonication to remove stray metal flakes. Nanopatterned slides were then rinsed in acetone and dried with N2. - Lipid bilayers and DNA curtains. The flowcells were assembled from fused silica slides (G. Finkenbeiner, Inc.) with chromium nanoscale diffusion barriers. Inlet and outlet ports were made by boring through the slide with a high-speed precision drill press equipped with a diamond-tipped bit (1.4 mm O.D.; Kassoy). The slides were cleaned by successive immersion in 2% (v/v) Hellmanex, 1 M NaOH, and 100% MeOH. The slides were rinsed with filtered sterile water between each wash and stored in 100% MeOH until use. Prior to assembly, the slides were dried under a stream of nitrogen and baked in a vacuum oven for at least 1 hour. A sample chamber was prepared from a borosilicate glass coverslip (Fisher Scientific) and double-sided tape (∼25 µm thick, 3M). Inlet and outlet ports (Upchurch Scientific) were attached with hot-melt adhesive (SureBonder glue sticks, FPC Corporation). The total volume of the sample chambers was ∼4 µl. A syringe pump (Kd Scientific) and actuated injection valves (Upchurch Scientific) were used to control sample delivery, buffer selection and flow rate. The flowcell and prism were mounted in a custom-built heater with computer-controlled feedback regulation to control the temperature of the sample from between 25-37°C (±0.1 °C), as necessary. After each use, the slides were soaked in MeOH to remove the ports and tape, rinsed with water, washed briefly (15-20 minutes) with Nanostrip, and rinsed with water. This procedure was sufficient to clean the slide surfaces for reuse, and each slide could be used multiple times without degrading the quality of the optical surface or the metallic patterns.
- DNA curtains were constructed as described E8, E9, with the exception of additional steps necessary for anchoring the second end of the DNA. All lipids were purchased from Avanti Polar Lipids and liposomes were prepared as previously described. In brief, a mixture of DOPC (1,2-dioleoyl-sn-glycero-phosphocholine), 0.5% biotinylated-DPPE (1,2-dipalmitoyl-sn-glycero-3-phosphoethanolamine-N-(cap biotinyl)), and 8-10% mPEG 550-PE (1,2-dioleoyl-sn-glycero-3-phosphoethanolamine-N-[methoxy(polyethylene glycol)-550]). The mPEG is does not affect bilayer formation or assembly of the DNA curtains, but rather serves to further passivated the surface against nonspecific adsorption of quantum dots (which we use in our studies of protein-DNA interactions). Liposomes were applied to the sample chamber in three injections of 200 µl followed by 5 minute incubations. Excess liposomes were flushed away with 1 ml of buffer A , which contained 10 mM Tris-HCl (pH 7.8) plus 100 mM NaCl, and the bilayer was incubated for an
addition 30 minutes. Buffer A plus 25 µg/ml anti-DIG Fab (Roche), anti-fluorescein (Sigma), or anti-BrdU IgG (Sigma) was then injected into the sample chamber and incubated for 30 minutes. The sample chamber was then flushed with 1 ml of buffer B, which contained 40 mM Tris-HCl (pH 7.8), 1 mM DTT, 1 mM MgCl2, and 0.2 mg/ml BSA, and incubated for an additional 5 minutes. 1 ml of buffer A containing Neutravidin (330 nM) was then injected into the sample chamber and incubated for 20 minutes. The flowcell was then rinsed with 3 ml of buffer B to remove any unbound Neutravidin. 1 ml of λ-DNA (20 pM) labeled at one end with biotin and at the other end with either digoxigenin, fluorescein or bromodeoxyuridine (as indicated) and pre-stained with 1-2 nM YOYO1 was injected into the sample chamber in five 200-µl aliquots, with a 2-3 minute incubation period following each injection. The DNA was then aligned at the linear barriers using a flow rate of 0.02 ml/min, and this rate was then increased to 2-3 ml/min to anchor the second end of the DNA molecules. - DNA substrates. The DNA substrates were made by ligating oligonucleotides to the 12 nucleotide overhangs at the end of the λ phage genome (48.5 kb). Ligation mixes (1 ml total volume) contained 4 nM λ DNA (Invitrogen), 1 µM biotinylated oligonucleotiode (5'-pAGG TCG CCG CCC [BioTEG]-3' (SEQ ID NO: 1)), 1 µM fluorescein labeled oligonulceotide (or DIG labeled oligonucleotide; 5'-pGGG CGG CGA CCT [fluor]-3' (SEQ ID NO: 6) or 5'-pGGG CGG CGA CCT [DIG]-3' (SEQ ID NO: 3)), and 1X ligase buffer (NEB). The reaction mix was warmed to 65°C for 10 minutes and then cooled slowly to room temperature. After cooling, ligase was added (T4 DNA ligase (400U/µl) or Taq ligase (40U/µl); NEB) and the mixture was incubated overnight at 42°C. Reactions performed with T4 ligase were then heat inactivated at 65°C for 10 minutes, and the ligated DNA products were purified over a Sephacryl S200HR column (GE Healthcare) run in 10 mM Tris-HCl (pH 7.8), 1 mM EDTA, plus 150 mM NaCl. The purified DNA was stored at -20°C.
- For inserting a DIG labeled oligonucleotide complementary to position 26,151-26,166 on λ 500ul of DNA (200pM; labeled at the ends with biotin and fluorescein (as described above)) was incubated for 2 hours with the nicking enzymes Nb.BsmI and Nt.BstNBI (50 units each; NEB) at 55°C in buffer containing 10 mM Tris-HCl (pH 7.8), 10 mM MgCl2, 150 mM NaCl. Subsequently, 1 µM of oligonucleotide (5'-pCAT TCT TGA GTC CAA TTT TT[DIG]-3'(SEQ ID NO: 4)) was added to the solution along with 10 mM EDTA and the mixture was incubated at 55°C for 20 minutes and then allowed to slowly cool to room temperature over the course of an hour. ATP was added to a final concentration of 1 mM along with 2,000 units of T4 ligase and an additional 10 mM MgCl2. The reaction was then incubated at room temp. for 90 min. Additional EDTA (Cf=20 mM) was added to the solution and the nicking enzymes and ligase were heat denatured at 80°C for 20 min.
- For inserting an oligonucleotide at position 33,779-33,791 on
λ 500 µl DNA (200pM; labeled at the ends with biotin and fuorescein (as described above)) was incubated for 2 hours with the nicking enzyme Nt.BstNBI (50 units; NEB) at 55°C in buffer containing 10mM Tris-HCl (pH 7.8), 10 mM MgCl2, 150 mM NaCl. The enzyme was heat denatured by incubation at 80°C for 20 minutes. 1 µM of oligonucleotide (5'-pTTC AGA GTC TGA CTT TT[DIG]-3' (SEQ ID NO: 5)) was added to the solution and the mixture was incubated at 55° C for 20 minutes then cooled slowly to room temperature over the course of 1 hr. ATP was then added to a final concentration of 1 mM along with 2,000 units of T4 ligase, and the reaction was incubated at room temperature for 90 min. The ligase was then heat denatured by incubation at 65°C for 20 minutes. - TIRFM and 1D diffusion assays. The basic design of the microscope used in this study has been previously describedE10. In brief, the system is built around a Nikon TE2000U inverted microscope with a custom-made illumination system. For this study, a 488 nm, 200 mW diode-pumped solid-state laser (Coherent, Sapphire-CDHR) was used as the excitation source. The laser was attentuated as necessary with a neutral density filter and centered over the DNA curtain by means of a remotely operated mirror (New Focus). The beam intensity at the face of the prism ways ∼10-15 mW. Images were detected with a back-illuminated EMCCD detector (Photometrics, Cascade 512B). TIRFM images were collected using a 60x water immersion objective lens (Nikon, 1.2 NA Plan Apo), unless otherwise indicated.
- Design elements of the DNA rack. Here we expand on our previous work and demonstrate the development of new barrier patterns, which we call DNA "racks", that can be used to make DNA curtains in which both ends of the molecules are anchored to the flowcell surface. An overview of the general design is presented in
FIG. 18 and utilizes a combination of two distinct pattern elements, as described below. In principle, one end of the DNA is first anchored via a biotin-neutravidin interaction to a supported lipid bilayer coating the surface of the sample chamber (FIG. 18B-C ). In the absence of a hydrodynamic force the molecules are randomly distributed on the surface, but lie primarily outside of the detection volume defined by the penetration depth of the evanescent field (∼150-200 nm). Application of flow pushes the DNA through the sample chamber with one end remaining anchored to the bilayer. The first pattern elements are linear barriers to lipid diffusion, which are oriented perpendicular to the direction of flow at strategic locations in the path of the DNA (FIG. 18B-C ); these linear barriers are designed to halt the movement of the lipid-tethered DNA molecules causing them to accumulate at leading edge of the barriers where they then extend parallel to the surface. The second elements of the pattern are a series of arrayed pentagons positioned behind the linear barriers and separated from one another by small channels. The non-linear, geometric shape of the pentagons is intended to act as a funnel and direct any lipid-tethered DNA molecules through the channels so that they do not accumulate at the leading edge of the pentagons, but rather are pushed along the surface until they encounter the next successive linear barrier in the pattern. The distance between the linear barriers and the pentagons is optimized for the length of the DNA to be used for the experiments. The pentagons themselves present a large surface that can be coated with antibodies directed against digoxigenin (DIG), which is covalently linked to the ends of the DNA opposite the ends bearing the biotin tag. When the DIG-coupled DNA end encounters the antibody-coated pentagons they should become immobilized, and the DNA should remain stretched parallel to the surface even when no buffer is being pushed through the sample chamber. - The barrier patterns necessary to achieve the desired design features were made by either Ebeam lithography as previously described E8,E9, or by nanoimprint lithography E29, E30.
FIG. 39 shows the characterization of a DNA rack made by Ebeam lithography and highlights specific features of the pattern geometry deemed critical for its function.FIG. 39A shows an optical image of the overall pattern design, including the dimensions of critical pattern parameters.FIG. 39B shows measurements of these parameters using atomic force microscopy (AFM).FIG. 39C shows characterization of the patterns with scanning electron microscopy (SEM). As demonstrated from these images, the height of the patterns elements was on the order of 20 nm, the width of the channels was 500 nm, and the optimal distance between the leading edge of the linear barriers and the back of the pentagon array was ∼13 µm (see below). This distance was specifically selected for use with λ-DNA, which is 48,502 base pairs with a fully extended contour length of approximately 16.5 µm, thus 11-13 µm would correspond to a mean extended length of ∼65-79% that of the full contour length, respectively. - Assembly and characterization of double-tethered DNA curtains. The overall design of the DNA rack relies upon the selective, but nonspecific adsorption of antibodies to the relatively large exposed surface of the metallic pentagons, and the antibodies should not interact with the inert lipid bilayer. All nanofabricated elements of the pattern are made of the same material, therefore the antibodies could potentially bind both the linear barriers as well as the pentagons. However, each pentagon has a surface area of 1.55 µm2 and for each 260 µm long linear barrier there are 167 pentagons. This corresponds to a total surface area of 372 µm2 for the pentagons compared to just 36 µm2 for the entire linear barrier. The smaller total surface area of the linear barriers should ensure adsorption of more antibody to the much larger area encompassed by the pentagons.
- To assemble the DNA curtains, the surface of the flowcell was first coated with a lipid bilayer, as previously described E8,E9, with the exception that BSA was omitted from all buffers used prior to deposition of the antibody. Once the bilayer was assembled on the surface, anti-DIG Fab fragments or anti-fluorescein IgG was injected into the sample chamber where they were allowed to adhere nonspecifically to the exposed metal barriers. Following a brief incubation, the free antibody was rinsed from the flowcell and replaced with buffer containing 0.2 mg/ml BSA, which served as a nonspecific blocking agent to passivate any remaining exposed surfaces. DNA stained with the fluorescent intercalating dye YOYO1 was then injected into the sample chamber, incubated briefly without buffer flow, and then buffer flow was applied to push the anchored molecules into the linear barriers. Buffer flow was then terminated and the anchored DNA molecules imaged by TIRFM. As shown in
FIG. 40 , this procedure yielded curtains of DNA molecules that remained fully extended and visible even though no buffer was flowing through the sample chamber. Any DNA molecules that failed to become anchored by the DIG-labeled end remained near the linear barriers, but only the ends of the molecules could be observed rather than their full contour lengths. These single-tethered DNA molecules gradually diffused away from the barrier edges and could also be pushed away from the barrier edge by reversing the direction of buffer flow (FIG. 40 ), but the double-tethered DNA molecules remained anchored to their original locations, providing additional conformation that the molecules making up the curtain are anchored in the desired configuration. - The number of DNA molecules at each of the different barrier locations was proportional to the distance between the adjacent linear barriers. The number of double tethered DNA molecules decreased slowly over time, with a half-life of >1 hour for the DIG-labeled molecules. Finally, control experiments verified that the presence of both the DIG labeled and the Fab fragments were necessary for efficiently anchoring the two ends of the DNA. Approximately 70% of the anchored DNA could be attributed to specific antibody:hapten interactions, with the remaining 30% due to nonspecific anchoring of the DNA ends to the antibody-coated pentagons. Similar double-tethered DNA curtains could be made using substrates that were end-labeled with either a single bromodeoxyuridine (BrdU) or fluorescein moiety, and pentagons coated with anti-BrdU or anti-fluorescein antibodies (see below), respectively. The half-life of the fluorescein-anchored DNA was comparable to that of the DIG-anchored DNA. However, the BrdU-anchored DNA molecules had a greater tendency to dissociate from the pentagons, displaying a half-life on the order of just a few minutes.
- Defined orientation of the DNA. The differential chemistries used to anchor the two ends of the DNA were predicted to define the orientation of the molecules within the curtains. Specifically, the biotinylated end should be anchored at the edge of the linear barrier and the other end should be at the pentagons, and based on this design all of the molecules should be in the exact same orientation. If the DNA molecules were aligned as expected, then a fluorophore located at a single specific site within the DNA and offset from its center should appear as a fluorescent "line" spanning the DNA curtain. The line should be oriented perpendicular to the long axis of the extended DNA molecules and should coincide precisely with the know location of the fluorescent tag. In contrast, if the DNA molecules were randomly oriented, then the fluorescent tags should appear as two lines demarking each of the two possible orientations of the DNA. To confirm that the DNA was oriented correctly, the molecules were labeled at the free ends with fluorescein, and labeled at a specific internal position with DIG. The internal labels were made using an oligonucleotide replacement strategy wherein the DNA was nicked at specific sites with a nicking endonuclease and short ssDNA fragments flanked by the resulting nicks were replaced with a DIG-tagged oligonucleotide (see Materials and Methods). Experiments with DNA curtains anchored by a single end confirmed that the fluorescent tags were present at a single location within the DNA molecules as dictated by the sequences of the oligonucleotides (
FIG. 41A ). The double-tethered curtains were then assembled using pentagons coated with anti-BrdU antibodies, and after assembly the DIG tags with labeled with anti-DIG coated Qdots. As shown inFIG. 41B , the anti-DIG Qdots were all aligned with one another, confirming the orientation of the DNA molecules. These results demonstrate that the DNA molecules anchored to the surface via the rack elements were all in the same orientation, as defined by the distinct function groups at the opposing ends of the DNA. - Imaging proteins sliding on the DNA. Many biological reactions are dependent upon protein motion along DNA, and these processes often involve passive diffusion E27. The primary motivation for development of these double-tethered DNA curtains was for use in experiments designed to visualize motion of proteins along DNA. We have previously demonstrated that the protein complex Msh2-Msh6 can diffuse in one-dimension along duplex DNAE22. Msh2-Msh6 is an essential component of the post-replicative mismatch repair machinery and is responsible for locating and initiating repair of biosynthetic DNA replication errors. Our initial studies with Msh2-Msh6 relied upon DNA molecules that were tethered by either end to neutravidin nonspecifically absorbed to a fused silica surface that was otherwise coated with a lipid bilayer. With this approach we would obtain only 10-30 DNA molecules per flowcell that were suitable for making diffusion measurements. These double tethered DNA molecules were randomly distributed and had to be manually located before use by visually scanning the entire surface, making these 1D-diffusion measurements technically demanding and time consuming. As shown above, using the engineered surfaces we can now visualize thousands of molecules per flowcell. Here we demonstrate that these anchored curtains of DNA are suitable for visualizing protein-DNA interactions.
- To determine whether the DNA racks could be used to study 1D-diffusion of proteins along DNA we used the mismatch repair protein Mlh1, and it was labeled with a single quantum dot via a FLAG epitope tag; complete analysis of quantum dot-tagged Mlh1 will be presented elsewhere. The labeled proteins were injected into a flowcell containing a curtain of double tethered DNA molecules and videos were collected over a 60-second period. As shown in
FIG. 42A , we could readily detect binding of Mlh1 to the DNA molecules that were aligned and anchored on the surface. There were 79 DNA molecules and 235 DNA-bound proteins observed in this single field-of-view, illustrating the dramatic improvement of this approach compared to our previous technique for making double-tethered DNA molecules E22,E23. The proteins bound to the DNA rapidly diffused along the DNA molecules, and this motion was revealed in kymograms made from representative examples of molecules within the DNA curtains (FIG. 42B ). - If protein bound molecules were nonspecifically linked to the sample chamber surface along its contour length, rather than suspended above the inert bilayer, then they should remain in view even if the DNA breaks or otherwise detaches from one of its anchor points. In contrast, if the proteins only interacted with the DNA, then detachment of the DNA should cause the molecules to retract away from the surface and disappear from view. As shown in
FIG. 42C , when the DNA molecules randomly detached from the surface the proteins immediately disappeared from view as they drifted outside the detection volume define by the penetration depth of the evanescent field. This data demonstrates that the fluorescently tagged proteins were bound to the DNA, the DNA molecules only interacted with the sample chamber surface through their anchored ends, and neither the quantum dot-tagged protein nor the DNA interacted nonspecifically with the lipid bilayer. - Single molecule studies offer many unique opportunities to probe biological reactions in ways not possible through conventional biochemical or biophysical approaches. We are developing new techniques for controlling the spatial organization of surface anchored DNA molecules within the confines of a microfluidic sample chamber. Procedures for anchoring numerous, long DNA molecules to surfaces are present in the literature E31-36. However, none of these methods offers the ability to patterns hundreds of DNA molecules all aligned in the same orientation using an experimental platform that is both compatible with protein biochemistry and single-molecule fluorescence imaging. Our unique approaches are based upon surface engineering techniques that enable us to control the distribution of DNA substrates with micro- and nanoscale precision. Here we build upon our previous work by using direct-write Ebeam or nanoimprint lithography to fabricate arrays of diffusion barriers followed by pentagonal anchor points, which together utilize different functional features to anchor curtains of DNA by both ends on the surface of a microfluidic sample chamber. We refer to these patterned surfaces as DNA "racks" because the DNA is stretched out and anchored to the flowcell surface where they can be viewed by TIRFM. An important aspect of these devices is that the fused silica surface is coated with a supported lipid bilayer, and the DNA molecules are suspended above this bilayer, ensuring that they are maintained within an inert microenvironment compatible with a range of biological molecules. We have demonstrated that these tools can be used along with wide-field TIRF microscopy to visualize hundreds of individual, perfectly aligned DNA molecules, all of which are arranged in the same orientation and anchored by both ends to the sample chamber surface. As with our previous nanofabricated devices, this new approach is simple and robust, the flowcells are reusable, the barriers themselves are uniform, and they do not compromise the optical quality of the fused silica or interfere with signal detection.
- As a first conceptual demonstration, we show here that the curtains of double-tethered DNA can be used to image 1D-diffusion of DNA-binding proteins. Our previous approach to these experiments relied upon DNA that was randomly anchored to a surface via biotin-neutravidin interactions, which yielded no more than 1-3 molecules of DNA per field-of-view, and there were jut ∼10-30 double-tethered DNA molecules present over the entire surface of the flowcell. Moreover, the prior studies showed that the orientation of DNA could not be defined because the molecules were anchored with biotin located at either end of the DNA. Therefore, the molecules were randomly oriented on the flowcell surface, making it difficult to locate and compare different DNA molecules to one another in order to dissect sequence specific events. While this original approached proved useful for our initial studies, it was tedious and remained challenging to collect sufficient data for thorough analysis. As demonstrated here, we are now able to visualize on the order of one hundred DNA molecules per field-of-view, thousands of molecules are present on the surface of a flowcell, and all the DNA molecules are aligned in the exact same orientation, which will make 1D diffusion measurements and molecule-to-molecule comparisons straightforward for future work.
-
- E1. Bustamante, C.; Bryant, Z.; Smith, S. B., Nature 2003, 421, 423 - 7.
- E2. Cairns, B. R., Nat .
- E3. Zlatanova, J.; van Holde, K., .
- E4. van Oijen, A. M., Biopolymers 2007, 85, 144 - 53.
- E5. Riehn, R.; Austin, R. H.; Sturm, J. C., .
- E6. Riehn, R.; Lu, M.; Wang, Y. M.; Lim, S. F.; Cox, E. C.; Austin, R. H., Proc Natl .
- E7. Tegenfeldt, J. O.; Prinz, C.; Cao, H.; Huang, R. L.; Austin, R. H.; Chou, S. Y.; Cox, E. C.; Sturm, J. C., Anal Bioanal Chem 2004, 378, 1678 - 92.
- E8. Fazio, T.; Visnapuu, M. L.; Wind, S.; Greene, E. C., .
- E9. Visnapuu, M. L.; Fazio, T.; Wind, S.; Greene, E. C., .
- E10. Granéli, A.; Yeykal, C.; Prasad, T. K.; Greene, E. C., Langmuir 2006, 22, 292-299.
- E11. Sackmann, E., Science 1996, 271, 43-48.
- E12. Groves, J.; Boxer, S., Acc Chem Res 2002 Mar, 35, 149 - 57.
- E13. Chan, Y. H.; Boxer, S. G., Curr .
- E14. Perez, T. D.; Nelson, W. J.; Boxer, S. G.; Kam, L., .
- E15. Floyd, D. L.; Ragains, J. R.; Skehel, J. J.; Harrison, S. C.; van Oijen, A. M., Proc Natl Acad Sci U S A 2008, 105, 15382 - 7.
- E16. Cremer, P. S.; Boxer, S. G., J. Phys. Chem. B 1999, 103, 2554-2559.
- E17. Groves, J. T.; Boxer, S. G., .
- E18. Tanaka, M.; Hermann, J.; Haase, I.; Fischer, M.; Boxer, S. G., .
- E19. Groves, J. T.; Boxer, S. G.; McConnell, H. M., Proc Natl Acad Sci U S A 1997, 94, 13390 - 5.
- E20. Jackson, B. L.; Nye, J. A.; Groves, J. T., .
- E21. Groves, J. T.; Ulman, N.; Boxer, S. G., Science 1997, 275, 651 - 3.
- E22. Gorman, J.; Chowdhury, A.; Surtees, J. A.; Shimada, J.; Reichman, D. R.; Alani, E.; Greene, E. C., .
- E23. Granéli, A.; Yeykal, C.; Robertson, R. B.; Greene, E. C., Proceedings of the National Academy of Sciences, USA 2006, 103, 1221-1226.
- E24. Prasad, T. K.; Robertson, R. B.; Visnapuu, M. L.; Chi, P.; Sung, P.; Greene, E. C., J Mol Biol 2007, 369, 940 - 53.
- E25. Prasad, T. K.; Yeykal, C.; Greene, E. C., Journal of Molecular Biology 2006, 363, 713-728.
- E26. Visnapuu, M. L.; Greene, E. C., Submitted 2009.
- E27. Gorman, J.; Greene, E. C., Nat .
- E28. Tafvizi, A.; Huang, F.; Leith, J. S.; Fersht, A. R.; Mirny, L. A.; van Oijen, A. M., Biophys J 2008, 95, L01 - 3.
- E29. Chou, S. Y.; Krauss, P. R.; Renstrom, P. J., Science 1996, 272, 85-87.
- E30. Gao, H.; Tan, H.; Zhang, W.; Morton, K.; Chou, S. Y.,
Nano Lett 2006, 6, 2438 - 41. - E31. Lebofsky, R.; Bensimon, A., Briefings in functional genomics and .
- E32. Kabata, H.; Kurosawa, O.; Arai, I.; Washizu, M.; Margarson, S. A.; Glass, R. E.; Shimamoto, N., Science 1993, 262, 1561-1563.
- E33. Guan, J.; Lee, L. J., Proceedings of the National Academy of Sciences, .
- E34. Kim, S.; Blainey, P. C.; Schroeder, C. M.; Xie, S. X., .
- E35. Assi, F.; Jenks, R.; Yang, J.; Love, C.; Prentiss, M., Journal of Applied Physics 2002, 92, 5584-5586.
- E36. Lin, J.; Qi, R.; Aston, C.; Jing, J.; Anantharaman, T. S.; Mishra, B.; White, O.; Daly, M. J.; Minton, K. W.; Venter, J. C.; Schwartz, D. C., Science 1999, 285, 1558-1562.
- E37. Washizu, M.; Kurosawa, O.; Arai, L.; Suzuki, S.; Shimamoto, N., IEEE Trans. Ind. Appl. 1995,31,447-456.
- E38. Dimalanta, E. T.; Lim, A.; Runnheim, R.; Lamers, C.; Churas, C.; Forrest, D. K.; de Pablo, J. J.; Graham, M. D.; Coppersmith, S. N.; Goldstein, S.; Schwartz, D. C., Analytical Chemistry 2004, 76, 5293-5301.
- Lipid bilayers, DNA curtains, and DNA substrates were prepared as described in the Examples above.
- DNA is attached to lipid bilayer as shown in
FIG. 43A . DNA is then aligned at the diffusion barrier edge (for example, a linear diffusion barrier or a non-linear, geometric diffusion barrier) using either a hydrodynamic force or and electric field (FIG. 43B ). A calcium solution of about 1 mM is then injected into the flow cell. The DNA becomes reversibly anchored to the lipid bilayer throughout the DNA's entire contour length (FIG. 43C ). The following calcium concentration can also be used, for example, a calcium concentration of at least about 0.5 mM, at least about 1 mM, at least about 1.5 mM, at least about 2 mM, at least about 2.5 mM, at least about 3 mM, at least about 3.5 mM, at least about 4 mM, at least about 4.5 mM, at least about 5 mM, at least about 5.5 mM, at least about 6 mM, at least about 6.5 mM, at least about 7 mM, at least about 7.5 mM, at least about 8 mM, at least about 8.5 mM, at least about 9 mM, at least about 9.5 mM, at least about 10 mM, or at least about 10.5 mM. - Some advantages of using this system are as follows: the need for a second barrier surface for anchoring DNA molecule is eliminated; the DNA remains anchored when flow is reduced or eliminated; Anchoring of DNA is completely reversible upon washing the flowcell with buffer lacking calcium; and the system would enable manipulation and/or collections of fragment after cleavage with a restriction enzyme.
- Lipid bilayers, DNA curtains, and DNA substrates were prepared as described in the Examples above.
- A sample of homogeneous DNA molecules is attached to lipid bilayer as shown in
FIG. 44A . Fluorescently tagged oligonucleotides or PNAs (protein-nucleic acids) directed against specific target sequences can be hybridized to DNA molecules aligned at the edge of a diffusion barrier (for example a linear diffusion barrier or a non-linear, geometric diffusion barrier) using either a hydrodynamic force or and electric field (FIG. 44B ). An advantage of using this system includes course mapping of DNA for genomics applications which can be carried out without the requirement for cutting the DNA. This type of mapping technology is being used by others, but not in the context of a DNA curtain. The DNA curtain design (top view,FIG. 44B ) offers two potential benefits over what is being practiced: (1) easier data analysis because DNA molecules are aligned; and (2) the DNA can be collected after analysis by cleaving it with a restriction enzyme. For example, one could design a single, specific cut site right at the point of attachment. No other single molecule DNA mapping technique allows the user to harvest the DNA after analysis. - A sample of heterogeneous DNA molecules (for example, a heterogeneous preparation of genomic DNA) can be attached to lipid bilayer as shown in
FIG. 45A . Fluorescently tagged oligonucleotides or PNAs (protein-nucleic acids) directed against specific target sequences can be hybridized to DNA molecules aligned at the edge of a diffusion barrier (for example a linear diffusion barrier or a non-linear, geometric diffusion barrier) using either a hydrodynamic force or and electric field (FIG. 45B ). Individual DNA molecules can then be designated or numbered, and from the organization scheme of these DNA molecules, a DNA map can be generated based on overlapping signals (FIG. 45B , top view). An example of a DNA map is seen inFIG. 45C . An advantage of using this system includes course mapping of DNA for genomics applications which can be carried out without the requirement for cutting the DNA. Specifically, this system allows the mapping of more complex mixtures of genomic DNA. One would need to prepare clean samples of genomic DNA comprised of fragments that could range in size from ∼10-300 kb. One would also have to ensure that the DNA is labeled at ONE end (not both ends) with a tag (such as biotin or another tag used in the art). This would allow for the DNA molecule to be anchored to the surface, and is not trivial for heterogeneous DNA samples have different ends sequences. -
- <110> THE TRUSTEES OF COLUMBIA UNIVERSITY IN THE CITY OF NEW YORK
- <120> GEOMETRIC PATTERNS AND LIPID BILAYERS FOR DNA MOLECULE ORGANIZATION AND USES THEREOF
- <130> 19240-524.WO2
- <140>
PCT/US2009/041434
<141> 2009-04-22 - <150>
61/116,815
<151> 2008-11-21 - <150>
61/047,657
<151> 2008-04-24 - <160> 6
- <170> PatentIn version 3.5
- <210> 1
<211> 12
<212> DNA
<213> Artificial Sequence - <220>
<223> Description of Artificial sequence: synthetic oligonucleotide - <220>
<221> modified_base
<222> (1)..(1)
<223> phospho-A - <220>
<221> modified_base
<222> (12)..(12)
<223> C-Biotin triethylene glycol - <400> 1
aggtcgccgc cc 12 - <210> 2
<211> 13
<212> DNA
<213> Artificial Sequence - <220>
<223> Description of combined DNA/RNA Molecule: synthetic oligonucleotide - <220>
<223> Description of Artificial Sequence: Synthetic oligonucleotide - <220>
<221> modified_base
<222> (1)..(1)
<223> phospho-G - <220>
<221> modified_base
<222> (13)..(13)
<223> Bromodeoxyuridine - <400> 2
gggcggcgac ctn 13 - <210> 3
<211> 12
<212> DNA
<213> Artificial Sequence - <220>
<223> Description of Artificial sequence: synthetic oligonucleotide - <220>
<221> modified_base
<222> (1)..(1)
<223> phospho-G - <220>
<221> modified_base
<222> (12)..(12)
<223> T-Digoxigenin - <400> 3
gggcggcgac ct 12 - <210> 4
<211> 20
<212> DNA
<213> Artificial Sequence - <220>
<223> Description of Artificial sequence: synthetic oligonucleotide - <220>
<221> modified_base
<222> (4)..(4)
<223> phospho-C - <220>
<221> modified_base
<222> (20)..(20)
<223> T-Digoxigenin - <400> 4
cattcttgag tccaattttt 20 - <210> 5
<211> 17
<212> DNA
<213> Artificial Sequence - <220>
<223> Description of Artificial Sequence: synthetic oligonucleotide - <220>
<221> modified_base
<222> (1)..(1)
<223> phospho-T - <220>
<221> modified_base
<222> (17)..(17)
<223> T-Digoxigenin - <400> 5
ttcagagtct gactttt 17 - <210> 6
<211> 12
<212> DNA
<213> Artificial sequence - <220>
<223> Description of Artificial sequence: synthetic oligonucleotide - <220>
<221> modified_base
<222> (1)..(1)
<223> phospho-G - <220>
<221> modified_base
<222> (12)..(12)
<223> T-fluorescein - <400> 6
gggcggcgac ct 12
Claims (5)
- An array comprising:a) a solid support, wherein the solid support comprises a non-linear geometric barrier and wherein the non-linear geometric barrier comprises a repetitive triangular wave producing a sawtooth pattern;b) a fluid lipid bilayer disposed on the solid support;c) at least one nucleic acid molecule; andd) a linkage for attaching the nucleic acid molecule to the lipid bilayer.
- The array of claim 1, wherein the non-linear geometric barrier comprises a mechanical barrier, a chemical barrier, a protein barrier, or a combination thereof.
- The array of claim 2,
wherein the mechanical barrier is a scratch on the solid support, or wherein the chemical barrier comprises a metal, a metal oxide, or a combination thereof, and optionally wherein the metal comprises chromium, aluminium, gold, or titanium, or wherein the metal oxide comprises chromium oxide, aluminium oxide, or titanium oxide. - The array of claim 1,
wherein the non-linear geometric barrier forms a nanowell by connecting vertices of the geometric barrier, and optionally wherein the nanowell comprises a nanopore for entry of nucleic acids; and/or
wherein the linkage is formed between neutravidin and biotin; and/or
wherein the nucleic acid molecule is aligned along the non-linear geometric barrier through application of a hydrodynamic force, an electrophoretic force, or a combination thereof; and/or
wherein the non-linear geometric barrier controls the lateral displacement of the nucleic acid molecule(s); and/or wherein the non-linear geometric barrier is generated by nanofabrication; and optionally wherein nano fabrication comprises electron-beam lithography; and/or
wherein one end of the nucleic acid molecule is attached by a linkage,
and optionally wherein the nucleic acid molecule is reversibly attached to the lipid bilayer along its contour; and/or
wherein both ends of the nucleic acid molecule are attached by a linkage, and optionally wherein the ends of the nucleic acid molecule are each attached by different linkages; and/or
wherein the nucleic acid molecule is a DNA molecule, and optionally wherein the DNA molecule comprises from about 20 to about 100,000 basepairs; and/or
wherein the nucleic acid molecule is coupled to a label, such as a fluorescent label; and/or
wherein the solid support comprises Si02; and/or
wherein the lipid bilayer comprises zwitterionic lipids. - A microfluidic flowcell comprising the array of claim 1.
Applications Claiming Priority (3)
| Application Number | Priority Date | Filing Date | Title |
|---|---|---|---|
| US4765708P | 2008-04-24 | 2008-04-24 | |
| US11681508P | 2008-11-21 | 2008-11-21 | |
| PCT/US2009/041434 WO2009132124A2 (en) | 2008-04-24 | 2009-04-22 | Geometric patterns and lipid bilayers for dna molecule organization and uses thereof |
Publications (3)
| Publication Number | Publication Date |
|---|---|
| EP2281062A2 EP2281062A2 (en) | 2011-02-09 |
| EP2281062A4 EP2281062A4 (en) | 2014-05-07 |
| EP2281062B1 true EP2281062B1 (en) | 2017-11-29 |
Family
ID=41217409
Family Applications (1)
| Application Number | Title | Priority Date | Filing Date |
|---|---|---|---|
| EP09734195.2A Not-in-force EP2281062B1 (en) | 2008-04-24 | 2009-04-22 | Geometric patterns and lipid bilayers for dna molecule organization |
Country Status (5)
| Country | Link |
|---|---|
| US (1) | US9255289B2 (en) |
| EP (1) | EP2281062B1 (en) |
| JP (1) | JP2012500620A (en) |
| CN (1) | CN102066579A (en) |
| WO (1) | WO2009132124A2 (en) |
Families Citing this family (29)
| Publication number | Priority date | Publication date | Assignee | Title |
|---|---|---|---|---|
| US9434990B2 (en) | 2012-04-02 | 2016-09-06 | Lux Bio Group, Inc. | Apparatus and method for molecular separation, purification, and sensing |
| US7638034B2 (en) | 2006-09-21 | 2009-12-29 | Los Alamos National Security, Llc | Electrochemical detection of single molecules using abiotic nanopores having electrically tunable dimensions |
| KR101797773B1 (en) | 2009-01-30 | 2017-11-15 | 옥스포드 나노포어 테크놀로지즈 리미티드 | Adaptors for nucleic acid constructs in transmembrane sequencing |
| EP2444808A1 (en) | 2010-10-21 | 2012-04-25 | Fredrik Höök | Method for fusion of lipid bilayers |
| DE102011010307A1 (en) * | 2011-02-03 | 2012-08-09 | Albert-Ludwigs-Universität Freiburg | Apparatus and method for producing protein microarrays |
| KR101963918B1 (en) * | 2011-05-27 | 2019-03-29 | 옥스포드 나노포어 테크놀로지즈 리미티드 | Coupling method |
| WO2013014451A1 (en) | 2011-07-25 | 2013-01-31 | Oxford Nanopore Technologies Limited | Hairpin loop method for double strand polynucleotide sequencing using transmembrane pores |
| US9732384B2 (en) | 2012-04-02 | 2017-08-15 | Lux Bio Group, Inc. | Apparatus and method for molecular separation, purification, and sensing |
| WO2014013259A1 (en) | 2012-07-19 | 2014-01-23 | Oxford Nanopore Technologies Limited | Ssb method |
| US9670526B2 (en) | 2012-11-09 | 2017-06-06 | Stratos Genomics, Inc. | Concentrating a target molecule for sensing by a nanopore |
| WO2014100822A1 (en) * | 2012-12-21 | 2014-06-26 | The Trustees Of Columbia University In The City Of New York | Actin molecule organization and uses thereof |
| US8945404B2 (en) * | 2013-01-10 | 2015-02-03 | International Business Machines Corporation | Self-formed nanometer channel at wafer scale |
| GB201314695D0 (en) | 2013-08-16 | 2013-10-02 | Oxford Nanopore Tech Ltd | Method |
| US10221450B2 (en) | 2013-03-08 | 2019-03-05 | Oxford Nanopore Technologies Ltd. | Enzyme stalling method |
| GB201406155D0 (en) | 2014-04-04 | 2014-05-21 | Oxford Nanopore Tech Ltd | Method |
| AU2015208919B9 (en) | 2014-01-22 | 2021-04-01 | Oxford Nanopore Technologies Limited | Method for attaching one or more polynucleotide binding proteins to a target polynucleotide |
| GB201403096D0 (en) | 2014-02-21 | 2014-04-09 | Oxford Nanopore Tech Ltd | Sample preparation method |
| US10337060B2 (en) | 2014-04-04 | 2019-07-02 | Oxford Nanopore Technologies Ltd. | Method for characterising a double stranded nucleic acid using a nano-pore and anchor molecules at both ends of said nucleic acid |
| GB201418159D0 (en) | 2014-10-14 | 2014-11-26 | Oxford Nanopore Tech Ltd | Method |
| GB201418469D0 (en) | 2014-10-17 | 2014-12-03 | Oxford Nanopore Tech Ltd | Method |
| FR3035512A1 (en) * | 2015-04-23 | 2016-10-28 | Univ Paris Diderot Paris 7 | INTERACTION ANALYSIS SYSTEM BETWEEN A NUCLEIC ACID AND A PROTEIN |
| WO2017034970A1 (en) * | 2015-08-21 | 2017-03-02 | The General Hospital Corporation | Combinatorial single molecule analysis of chromatin |
| GB201609220D0 (en) | 2016-05-25 | 2016-07-06 | Oxford Nanopore Tech Ltd | Method |
| CN107832583B (en) * | 2017-11-08 | 2021-04-16 | 武汉大学 | Cross-species biological pathway discovery method based on graph matching |
| US11080864B2 (en) * | 2018-01-08 | 2021-08-03 | Intel Corporation | Feature detection, sorting, and tracking in images using a circular buffer |
| NL2020622B1 (en) * | 2018-01-24 | 2019-07-30 | Lllumina Cambridge Ltd | Reduced dimensionality structured illumination microscopy with patterned arrays of nanowells |
| GB201807793D0 (en) | 2018-05-14 | 2018-06-27 | Oxford Nanopore Tech Ltd | Method |
| WO2020150140A1 (en) * | 2019-01-16 | 2020-07-23 | Armonica Technologies, Inc. | Manipulating the translation of dna strands across and through nanopore sequencing systems using raman signatures to identify dna bases and methods |
| KR102430546B1 (en) * | 2020-04-03 | 2022-08-08 | 울산과학기술원 | Single molecule array including nano trench structures for imaging |
Family Cites Families (15)
| Publication number | Priority date | Publication date | Assignee | Title |
|---|---|---|---|---|
| US399645A (en) * | 1889-03-19 | Windmill | ||
| NL154598B (en) | 1970-11-10 | 1977-09-15 | Organon Nv | PROCEDURE FOR DETERMINING AND DETERMINING LOW MOLECULAR COMPOUNDS AND PROTEINS THAT CAN SPECIFICALLY BIND THESE COMPOUNDS AND TEST PACKAGING. |
| US3817837A (en) | 1971-05-14 | 1974-06-18 | Syva Corp | Enzyme amplification assay |
| US3939350A (en) | 1974-04-29 | 1976-02-17 | Board Of Trustees Of The Leland Stanford Junior University | Fluorescent immunoassay employing total reflection for activation |
| US3996345A (en) | 1974-08-12 | 1976-12-07 | Syva Company | Fluorescence quenching with immunological pairs in immunoassays |
| US4275149A (en) | 1978-11-24 | 1981-06-23 | Syva Company | Macromolecular environment control in specific receptor assays |
| US4277437A (en) | 1978-04-05 | 1981-07-07 | Syva Company | Kit for carrying out chemically induced fluorescence immunoassay |
| US4366241A (en) | 1980-08-07 | 1982-12-28 | Syva Company | Concentrating zone method in heterogeneous immunoassays |
| US5851769A (en) * | 1995-09-27 | 1998-12-22 | The Regents Of The University Of California | Quantitative DNA fiber mapping |
| DE69735601T2 (en) * | 1996-11-29 | 2007-10-18 | The Board Of Trustees Of The Leland Stanford Junior University, Stanford | ARRANGEMENTS OF INDEPENDENTLY AFFILIATED, SUPPORTED LIQUID BILAYER MEMBRANES AND ITS USE METHOD |
| US20030138973A1 (en) * | 1998-07-14 | 2003-07-24 | Peter Wagner | Microdevices for screening biomolecules |
| US6399303B1 (en) * | 1999-04-07 | 2002-06-04 | Integrated Nano-Technologies, Llc | High resolution DNA detection methods and devices |
| US20060057585A1 (en) * | 2004-09-10 | 2006-03-16 | Mcallister William H | Nanostepper/sensor systems and methods of use thereof |
| WO2006088425A1 (en) | 2005-02-18 | 2006-08-24 | Midorion Ab | Sensor for detection of single molecules |
| WO2007041340A2 (en) * | 2005-09-30 | 2007-04-12 | The Trustees Of Columbia University In The City Of New York | Microfluidic cells with parallel arrays of individual dna molecules |
-
2009
- 2009-04-22 JP JP2011506430A patent/JP2012500620A/en active Pending
- 2009-04-22 EP EP09734195.2A patent/EP2281062B1/en not_active Not-in-force
- 2009-04-22 CN CN2009801236108A patent/CN102066579A/en active Pending
- 2009-04-22 WO PCT/US2009/041434 patent/WO2009132124A2/en active Application Filing
-
2010
- 2010-10-25 US US12/911,528 patent/US9255289B2/en active Active
Also Published As
| Publication number | Publication date |
|---|---|
| US9255289B2 (en) | 2016-02-09 |
| WO2009132124A2 (en) | 2009-10-29 |
| WO2009132124A3 (en) | 2010-01-07 |
| EP2281062A4 (en) | 2014-05-07 |
| US20110136676A1 (en) | 2011-06-09 |
| JP2012500620A (en) | 2012-01-12 |
| EP2281062A2 (en) | 2011-02-09 |
| CN102066579A (en) | 2011-05-18 |
Similar Documents
| Publication | Publication Date | Title |
|---|---|---|
| EP2281062B1 (en) | Geometric patterns and lipid bilayers for dna molecule organization | |
| US20220333192A1 (en) | Methods and devices for spatial assessment of rna quality | |
| US9993794B2 (en) | Single molecule loading methods and compositions | |
| EP1105529B2 (en) | Arrayed biomolecules and their use in sequencing | |
| US20190284552A1 (en) | Arrays for Single Molecule Detection and Uses Thereof | |
| US20090018028A1 (en) | Self-Assembled Nucleic Acid Nanoarrays and Uses Therefor | |
| US20050221333A1 (en) | Microfluidic apparatus, systems, and methods for performing molecular reactions | |
| WO2005078130A1 (en) | Arrayed polynucleotides | |
| WO2005068656A1 (en) | Nucleic acid characterisation | |
| EP3009520B1 (en) | Site-specific immobilization of DNA origami structures on solid substrates | |
| US11162192B2 (en) | Materials and methods relating to single molecule arrays | |
| Tutkus et al. | Fixed DNA molecule arrays for high-throughput single DNA–protein interaction studies | |
| US20240110239A1 (en) | Devices and methods for multi-dimensional genome analysis | |
| US20230235379A1 (en) | Devices and methods for macromolecular manipulation | |
| US20200102591A1 (en) | Methods for the Imaging of Nucleic Acid Sequences | |
| Class et al. | Patent application title: GEOMETRIC PATTERNS AND LIPID BILAYERS FOR DNA MOLECULE ORGANIZATION AND USES THEREOF Inventors: Eric C. Greene (New York, NY, US) | |
| US20100130368A1 (en) | Method and system for sequencing polynucleotides | |
| WO2024006826A1 (en) | Compositions and methods for generating molecular arrays using oligonucleotide printing and photolithography | |
| Krerowicz | Restructuring of Large, Double-stranded DNA Molecules Through Self-assembly to Form Microscale Objects | |
| WO2024013218A1 (en) | Method for spatial tracing and sequencing of cells or organelles | |
| JP2010193897A (en) | Method for analyzing gene in subject | |
| Ali | The development of a microbead array for the detection and amplification of nucleic acids | |
| Situma | Fabrication of DNA microarrays on Poly (methylmethacrylate) substrates for biomolecular reporting |
Legal Events
| Date | Code | Title | Description |
|---|---|---|---|
| PUAI | Public reference made under article 153(3) epc to a published international application that has entered the european phase |
Free format text: ORIGINAL CODE: 0009012 |
|
| 17P | Request for examination filed |
Effective date: 20101123 |
|
| AK | Designated contracting states |
Kind code of ref document: A2 Designated state(s): AT BE BG CH CY CZ DE DK EE ES FI FR GB GR HR HU IE IS IT LI LT LU LV MC MK MT NL NO PL PT RO SE SI SK TR |
|
| AX | Request for extension of the european patent |
Extension state: AL BA RS |
|
| DAX | Request for extension of the european patent (deleted) | ||
| A4 | Supplementary search report drawn up and despatched |
Effective date: 20140404 |
|
| RIC1 | Information provided on ipc code assigned before grant |
Ipc: B01L 3/00 20060101ALI20140331BHEP Ipc: B01J 19/00 20060101ALI20140331BHEP Ipc: C12Q 1/68 20060101AFI20140331BHEP |
|
| 17Q | First examination report despatched |
Effective date: 20160704 |
|
| STAA | Information on the status of an ep patent application or granted ep patent |
Free format text: STATUS: EXAMINATION IS IN PROGRESS |
|
| GRAP | Despatch of communication of intention to grant a patent |
Free format text: ORIGINAL CODE: EPIDOSNIGR1 |
|
| STAA | Information on the status of an ep patent application or granted ep patent |
Free format text: STATUS: GRANT OF PATENT IS INTENDED |
|
| INTG | Intention to grant announced |
Effective date: 20170622 |
|
| GRAS | Grant fee paid |
Free format text: ORIGINAL CODE: EPIDOSNIGR3 |
|
| GRAA | (expected) grant |
Free format text: ORIGINAL CODE: 0009210 |
|
| STAA | Information on the status of an ep patent application or granted ep patent |
Free format text: STATUS: THE PATENT HAS BEEN GRANTED |
|
| AK | Designated contracting states |
Kind code of ref document: B1 Designated state(s): AT BE BG CH CY CZ DE DK EE ES FI FR GB GR HR HU IE IS IT LI LT LU LV MC MK MT NL NO PL PT RO SE SI SK TR |
|
| REG | Reference to a national code |
Ref country code: GB Ref legal event code: FG4D |
|
| REG | Reference to a national code |
Ref country code: CH Ref legal event code: EP |
|
| REG | Reference to a national code |
Ref country code: AT Ref legal event code: REF Ref document number: 950441 Country of ref document: AT Kind code of ref document: T Effective date: 20171215 |
|
| REG | Reference to a national code |
Ref country code: IE Ref legal event code: FG4D |
|
| REG | Reference to a national code |
Ref country code: DE Ref legal event code: R096 Ref document number: 602009049619 Country of ref document: DE |
|
| REG | Reference to a national code |
Ref country code: NL Ref legal event code: FP |
|
| REG | Reference to a national code |
Ref country code: LT Ref legal event code: MG4D |
|
| REG | Reference to a national code |
Ref country code: AT Ref legal event code: MK05 Ref document number: 950441 Country of ref document: AT Kind code of ref document: T Effective date: 20171129 |
|
| PG25 | Lapsed in a contracting state [announced via postgrant information from national office to epo] |
Ref country code: FI Free format text: LAPSE BECAUSE OF FAILURE TO SUBMIT A TRANSLATION OF THE DESCRIPTION OR TO PAY THE FEE WITHIN THE PRESCRIBED TIME-LIMIT Effective date: 20171129 Ref country code: SE Free format text: LAPSE BECAUSE OF FAILURE TO SUBMIT A TRANSLATION OF THE DESCRIPTION OR TO PAY THE FEE WITHIN THE PRESCRIBED TIME-LIMIT Effective date: 20171129 Ref country code: NO Free format text: LAPSE BECAUSE OF FAILURE TO SUBMIT A TRANSLATION OF THE DESCRIPTION OR TO PAY THE FEE WITHIN THE PRESCRIBED TIME-LIMIT Effective date: 20180228 Ref country code: LT Free format text: LAPSE BECAUSE OF FAILURE TO SUBMIT A TRANSLATION OF THE DESCRIPTION OR TO PAY THE FEE WITHIN THE PRESCRIBED TIME-LIMIT Effective date: 20171129 Ref country code: ES Free format text: LAPSE BECAUSE OF FAILURE TO SUBMIT A TRANSLATION OF THE DESCRIPTION OR TO PAY THE FEE WITHIN THE PRESCRIBED TIME-LIMIT Effective date: 20171129 |
|
| PG25 | Lapsed in a contracting state [announced via postgrant information from national office to epo] |
Ref country code: AT Free format text: LAPSE BECAUSE OF FAILURE TO SUBMIT A TRANSLATION OF THE DESCRIPTION OR TO PAY THE FEE WITHIN THE PRESCRIBED TIME-LIMIT Effective date: 20171129 Ref country code: BG Free format text: LAPSE BECAUSE OF FAILURE TO SUBMIT A TRANSLATION OF THE DESCRIPTION OR TO PAY THE FEE WITHIN THE PRESCRIBED TIME-LIMIT Effective date: 20180228 Ref country code: LV Free format text: LAPSE BECAUSE OF FAILURE TO SUBMIT A TRANSLATION OF THE DESCRIPTION OR TO PAY THE FEE WITHIN THE PRESCRIBED TIME-LIMIT Effective date: 20171129 Ref country code: HR Free format text: LAPSE BECAUSE OF FAILURE TO SUBMIT A TRANSLATION OF THE DESCRIPTION OR TO PAY THE FEE WITHIN THE PRESCRIBED TIME-LIMIT Effective date: 20171129 Ref country code: GR Free format text: LAPSE BECAUSE OF FAILURE TO SUBMIT A TRANSLATION OF THE DESCRIPTION OR TO PAY THE FEE WITHIN THE PRESCRIBED TIME-LIMIT Effective date: 20180301 |
|
| PG25 | Lapsed in a contracting state [announced via postgrant information from national office to epo] |
Ref country code: CZ Free format text: LAPSE BECAUSE OF FAILURE TO SUBMIT A TRANSLATION OF THE DESCRIPTION OR TO PAY THE FEE WITHIN THE PRESCRIBED TIME-LIMIT Effective date: 20171129 Ref country code: DK Free format text: LAPSE BECAUSE OF FAILURE TO SUBMIT A TRANSLATION OF THE DESCRIPTION OR TO PAY THE FEE WITHIN THE PRESCRIBED TIME-LIMIT Effective date: 20171129 Ref country code: CY Free format text: LAPSE BECAUSE OF FAILURE TO SUBMIT A TRANSLATION OF THE DESCRIPTION OR TO PAY THE FEE WITHIN THE PRESCRIBED TIME-LIMIT Effective date: 20171129 Ref country code: EE Free format text: LAPSE BECAUSE OF FAILURE TO SUBMIT A TRANSLATION OF THE DESCRIPTION OR TO PAY THE FEE WITHIN THE PRESCRIBED TIME-LIMIT Effective date: 20171129 Ref country code: SK Free format text: LAPSE BECAUSE OF FAILURE TO SUBMIT A TRANSLATION OF THE DESCRIPTION OR TO PAY THE FEE WITHIN THE PRESCRIBED TIME-LIMIT Effective date: 20171129 |
|
| REG | Reference to a national code |
Ref country code: DE Ref legal event code: R097 Ref document number: 602009049619 Country of ref document: DE |
|
| PG25 | Lapsed in a contracting state [announced via postgrant information from national office to epo] |
Ref country code: RO Free format text: LAPSE BECAUSE OF FAILURE TO SUBMIT A TRANSLATION OF THE DESCRIPTION OR TO PAY THE FEE WITHIN THE PRESCRIBED TIME-LIMIT Effective date: 20171129 Ref country code: IT Free format text: LAPSE BECAUSE OF FAILURE TO SUBMIT A TRANSLATION OF THE DESCRIPTION OR TO PAY THE FEE WITHIN THE PRESCRIBED TIME-LIMIT Effective date: 20171129 Ref country code: PL Free format text: LAPSE BECAUSE OF FAILURE TO SUBMIT A TRANSLATION OF THE DESCRIPTION OR TO PAY THE FEE WITHIN THE PRESCRIBED TIME-LIMIT Effective date: 20171129 |
|
| PLBE | No opposition filed within time limit |
Free format text: ORIGINAL CODE: 0009261 |
|
| STAA | Information on the status of an ep patent application or granted ep patent |
Free format text: STATUS: NO OPPOSITION FILED WITHIN TIME LIMIT |
|
| REG | Reference to a national code |
Ref country code: DE Ref legal event code: R119 Ref document number: 602009049619 Country of ref document: DE |
|
| 26N | No opposition filed |
Effective date: 20180830 |
|
| PG25 | Lapsed in a contracting state [announced via postgrant information from national office to epo] |
Ref country code: MC Free format text: LAPSE BECAUSE OF FAILURE TO SUBMIT A TRANSLATION OF THE DESCRIPTION OR TO PAY THE FEE WITHIN THE PRESCRIBED TIME-LIMIT Effective date: 20171129 Ref country code: SI Free format text: LAPSE BECAUSE OF FAILURE TO SUBMIT A TRANSLATION OF THE DESCRIPTION OR TO PAY THE FEE WITHIN THE PRESCRIBED TIME-LIMIT Effective date: 20171129 |
|
| REG | Reference to a national code |
Ref country code: CH Ref legal event code: PL |
|
| REG | Reference to a national code |
Ref country code: NL Ref legal event code: MM Effective date: 20180501 |
|
| REG | Reference to a national code |
Ref country code: BE Ref legal event code: MM Effective date: 20180430 |
|
| GBPC | Gb: european patent ceased through non-payment of renewal fee |
Effective date: 20180422 |
|
| REG | Reference to a national code |
Ref country code: IE Ref legal event code: MM4A |
|
| PG25 | Lapsed in a contracting state [announced via postgrant information from national office to epo] |
Ref country code: LU Free format text: LAPSE BECAUSE OF NON-PAYMENT OF DUE FEES Effective date: 20180422 Ref country code: DE Free format text: LAPSE BECAUSE OF NON-PAYMENT OF DUE FEES Effective date: 20181101 Ref country code: NL Free format text: LAPSE BECAUSE OF NON-PAYMENT OF DUE FEES Effective date: 20180501 |
|
| PG25 | Lapsed in a contracting state [announced via postgrant information from national office to epo] |
Ref country code: BE Free format text: LAPSE BECAUSE OF NON-PAYMENT OF DUE FEES Effective date: 20180430 Ref country code: LI Free format text: LAPSE BECAUSE OF NON-PAYMENT OF DUE FEES Effective date: 20180430 Ref country code: GB Free format text: LAPSE BECAUSE OF NON-PAYMENT OF DUE FEES Effective date: 20180422 Ref country code: CH Free format text: LAPSE BECAUSE OF NON-PAYMENT OF DUE FEES Effective date: 20180430 |
|
| PG25 | Lapsed in a contracting state [announced via postgrant information from national office to epo] |
Ref country code: FR Free format text: LAPSE BECAUSE OF NON-PAYMENT OF DUE FEES Effective date: 20180430 Ref country code: IE Free format text: LAPSE BECAUSE OF NON-PAYMENT OF DUE FEES Effective date: 20180422 |
|
| PG25 | Lapsed in a contracting state [announced via postgrant information from national office to epo] |
Ref country code: MT Free format text: LAPSE BECAUSE OF NON-PAYMENT OF DUE FEES Effective date: 20180422 |
|
| PG25 | Lapsed in a contracting state [announced via postgrant information from national office to epo] |
Ref country code: TR Free format text: LAPSE BECAUSE OF FAILURE TO SUBMIT A TRANSLATION OF THE DESCRIPTION OR TO PAY THE FEE WITHIN THE PRESCRIBED TIME-LIMIT Effective date: 20171129 |
|
| PG25 | Lapsed in a contracting state [announced via postgrant information from national office to epo] |
Ref country code: PT Free format text: LAPSE BECAUSE OF FAILURE TO SUBMIT A TRANSLATION OF THE DESCRIPTION OR TO PAY THE FEE WITHIN THE PRESCRIBED TIME-LIMIT Effective date: 20171129 Ref country code: HU Free format text: LAPSE BECAUSE OF FAILURE TO SUBMIT A TRANSLATION OF THE DESCRIPTION OR TO PAY THE FEE WITHIN THE PRESCRIBED TIME-LIMIT; INVALID AB INITIO Effective date: 20090422 |
|
| PG25 | Lapsed in a contracting state [announced via postgrant information from national office to epo] |
Ref country code: MK Free format text: LAPSE BECAUSE OF NON-PAYMENT OF DUE FEES Effective date: 20171129 |
|
| PG25 | Lapsed in a contracting state [announced via postgrant information from national office to epo] |
Ref country code: IS Free format text: LAPSE BECAUSE OF FAILURE TO SUBMIT A TRANSLATION OF THE DESCRIPTION OR TO PAY THE FEE WITHIN THE PRESCRIBED TIME-LIMIT Effective date: 20180329 |