EP2275787A2 - Coriolis flowmeter - Google Patents
Coriolis flowmeter Download PDFInfo
- Publication number
- EP2275787A2 EP2275787A2 EP10169322A EP10169322A EP2275787A2 EP 2275787 A2 EP2275787 A2 EP 2275787A2 EP 10169322 A EP10169322 A EP 10169322A EP 10169322 A EP10169322 A EP 10169322A EP 2275787 A2 EP2275787 A2 EP 2275787A2
- Authority
- EP
- European Patent Office
- Prior art keywords
- average
- calculation section
- section
- fluctuations
- calculates
- Prior art date
- Legal status (The legal status is an assumption and is not a legal conclusion. Google has not performed a legal analysis and makes no representation as to the accuracy of the status listed.)
- Granted
Links
Images





Classifications
-
- G—PHYSICS
- G01—MEASURING; TESTING
- G01F—MEASURING VOLUME, VOLUME FLOW, MASS FLOW OR LIQUID LEVEL; METERING BY VOLUME
- G01F1/00—Measuring the volume flow or mass flow of fluid or fluent solid material wherein the fluid passes through a meter in a continuous flow
- G01F1/74—Devices for measuring flow of a fluid or flow of a fluent solid material in suspension in another fluid
-
- G—PHYSICS
- G01—MEASURING; TESTING
- G01F—MEASURING VOLUME, VOLUME FLOW, MASS FLOW OR LIQUID LEVEL; METERING BY VOLUME
- G01F1/00—Measuring the volume flow or mass flow of fluid or fluent solid material wherein the fluid passes through a meter in a continuous flow
- G01F1/76—Devices for measuring mass flow of a fluid or a fluent solid material
- G01F1/78—Direct mass flowmeters
- G01F1/80—Direct mass flowmeters operating by measuring pressure, force, momentum, or frequency of a fluid flow to which a rotational movement has been imparted
- G01F1/84—Coriolis or gyroscopic mass flowmeters
- G01F1/8409—Coriolis or gyroscopic mass flowmeters constructional details
- G01F1/8436—Coriolis or gyroscopic mass flowmeters constructional details signal processing
-
- G—PHYSICS
- G01—MEASURING; TESTING
- G01F—MEASURING VOLUME, VOLUME FLOW, MASS FLOW OR LIQUID LEVEL; METERING BY VOLUME
- G01F1/00—Measuring the volume flow or mass flow of fluid or fluent solid material wherein the fluid passes through a meter in a continuous flow
- G01F1/76—Devices for measuring mass flow of a fluid or a fluent solid material
- G01F1/78—Direct mass flowmeters
- G01F1/80—Direct mass flowmeters operating by measuring pressure, force, momentum, or frequency of a fluid flow to which a rotational movement has been imparted
- G01F1/84—Coriolis or gyroscopic mass flowmeters
- G01F1/845—Coriolis or gyroscopic mass flowmeters arrangements of measuring means, e.g., of measuring conduits
- G01F1/8468—Coriolis or gyroscopic mass flowmeters arrangements of measuring means, e.g., of measuring conduits vibrating measuring conduits
- G01F1/849—Coriolis or gyroscopic mass flowmeters arrangements of measuring means, e.g., of measuring conduits vibrating measuring conduits having straight measuring conduits
Definitions
- the present invention relates to a Coriolis flowmeter and, more particularly, to a Coriolis flowmeter that determines a state of air bubbles in a fluid subject to measurement (hereinafter called a "target fluid").
- a Coriolis flowmeter is used in measuring a flow rate of a target fluid in flow rate control performed in a chemical plant, or the like.
- a configuration of an example Coriolis flowmeter is illustrated in JP-A-8-29229 .
- the Coriolis flowmeter can also detect air bubbles in a target fluid, and a method for detecting air bubbles is described in JP-T-2002-525623 .
- the method for detecting air bubbles is described by reference to Fig. 9.
- Fig. 9 is a view showing a time variation in drive gain of a drive circuit that activates a measurement tube of a Coriolis flowmeter sensor.
- a threshold value for detecting air bubbles is taken as 606. Air bubbles are not mixed in a target fluid during a period from time t0 to time t1, and the drive gain is smaller than the threshold value 606.
- the present invention is directed toward a Coriolis flowmeter and provides a Coriolis flowmeter that accurately determines a state of air bubbles in a fluid subject to measurement regardless of variations in pressure of the fluid.
- a Coriolis flowmeter that vibrates a measurement tube through which a fluid subject to measurement flows, detects vibrations including Coriolis force developed in the fluid from the vibrations, and measures a mass flow rate of the fluid from a detection signal, the Coriolis flowmeter including:
- the Coriolis flowmeter as set forth in the first aspect, wherein the fluctuation calculation section includes:
- the Coriolis flowmeter as set in the second aspect, wherein the reference signal generation section generates a first reference signal and a second reference signal being 90° out of phase with the first reference signal; and wherein the average calculation section calculates a first average that is an average of a product of the detection signal and the first reference signal and calculates a second average which is an average of a product of the detection signal and the second reference signal.
- the Coriolis flowmeter as set forth in the second or third aspect, wherein the average variation calculation section calculates, as the fluctuations, variations in the average based on a current average, a last average, and a last but one average.
- the Coriolis flowmeter as set forth in any one of the first through fourth aspects, wherein the status value calculation section calculates a square mean value, a root mean square value, an average absolute value, or a square root of an average absolute value of the fluctuations.
- the Coriolis flowmeter as set forth in the third aspect, wherein the average variation calculation section calculates, as first fluctuations, variations in the first average based on a current value of the first average, a last value of the first average and a last but one value of the first average and calculates, as second fluctuations, variations in the second average based on a current value of the second average , a last value of the second average, and a last but one value of the second average; and the status value calculation section calculates an average of squares of the first fluctuations and squares of the second fluctuations, a square root of the average, and an average of absolute values of the first fluctuations and absolute values of the second fluctuations or a square root of the average.
- the Coriolis flowmeter as set forth in any one of the first through sixth aspects, wherein the determination section compares the status value with a threshold value to determine a state of the air bubbles.
- the Coriolis flowmeter as set forth in the seventh aspect, further including: a threshold value generation section that generates, as the threshold value, a value based on the status value calculated when the air bubbles are not present.
- the Coriolis flowmeter as set forth in the first aspect, wherein the fluctuation calculation section includes: a first shift section that generates a first shift detection signal which is 90° out of phase with a first detection signal detected by one vibration detection section; an average calculation section that calculates an average based on a first shift detection signal generated by the first shift section, a second detection signal detected by the other vibration detection section, and the first detection signal; and an average variation calculation section that calculates, as the fluctuations, variations in the average calculated by the average calculation section.
- the Coriolis flowmeter as set forth in the first aspect, wherein the fluctuation calculation section includes:
- Fig. 1A is a block diagram of a detection unit SNS of a Coriolis flowmeter
- Fig. 1B is an explanatory operation diagram for describing operation of the detection unit SNS
- Fig. 2 is a block diagram of a Coriolis flowmeter 10 to which the present embodiment applies, and explanations are provided by reference to these drawings.
- a measurement tube may be of another type; for instance, a U-shaped tube type.
- a straight tube type for instance, a straight tube type.
- Reference numeral 1 designates a measurement tube that enables flow of a fluid subject to measurement (hereinafter referred to as a "target fluid"), and the target fluid flows through the tube from left to right. Both ends of the measurement tube 1 are fastened to support members 2 and 3, respectively.
- a vibratory device 4 that mechanically vibrates the measurement tube 1 in the vertical direction is disposed in the vicinity of a center area of the measurement tube 1.
- An upstream sensor 5A (one vibration detection section) and a downstream sensor 5B (the other vibration detection section) that detect vibrations of the measurement tube 1 are fastened in the proximity of areas of the measurement tube 1 supported by the support members 2 and 3.
- a temperature sensor 6 used for compensating for a temperature is disposed in the vicinity of the support member 3.
- the detection unit SNS is constituted of the aforementioned elements.
- Fig. 1B when the target fluid flows into the measurement tube 1 in a state where vibrations are imparted from the vibratory device 4 to the measurement tube 1 in a shape of a primary mode as designated by reference symbols M1 and M2, Coriolis force develops in the target fluid, and the measurement tube 1 vibrates in a shape of a secondary mode as indicated by M3 and M4.
- the Coriolis flowmeter measures a mass flow rate of the target fluid on the basis of a displacement signal SA (a first detection signal) produced as a result of the upstream sensor 5A detecting deformation induced by the vibrations of the measurement tube 1 and a displacement signal SB (a second detection signal) produced as a result of the downstream sensor 5B detecting deformation induced by the same.
- SA a first detection signal
- SB a displacement signal
- a characteristic of the Coriolis flowmeter 10 to which the present embodiment applies lies in inclusion of fluctuation calculation section 50 having a reference signal generation section 51, average calculation section 52, and an average variation calculation section 53; status value calculation section 60; determination section 70; and threshold value generation section 80.
- the reference signal generation section 51 receives the displacement signal SA and outputs a reference signal DR to the average calculation section 52.
- the average calculation section 52 receives the reference signal DR from the reference signal generation section 51, an output signal DA3 from a low-pass filter (LPF) 20, and outputs an average to the average variation calculation section 53.
- the average variation calculation section 53 receives an average from the average calculation section 52 and outputs a fluctuation F to the status value calculation section 60.
- the status value calculation section 60 receives the fluctuation F from the average variation calculation section 53 and outputs a status value DS to the determination section 70.
- the determination section 70 receives the status value DS from the status value calculation section 60 and a threshold value from the threshold value generation section 80, thereby determining a state of air bubbles.
- T&H track-and-hold
- A/D analogue-to-digital converters
- LPF low-pass filters
- a clock signal oscillator 17 generates a timing signal TC having a predetermined sampling period regardless of the vibrations of the measurement tube 1.
- the displacement signal SA is input in the form of; for instance, Axsin( ⁇ A ⁇ t+ ⁇ A ), to the track-and-hold circuit 18, where the signal is sequentially sampled and held by the timing signal TC that determines a sampling time point.
- the track-and-hold circuit 18 outputs Axsin( ⁇ A ⁇ t(i)+ ⁇ A ) to the analogue-to-digital converter 19.
- Reference symbol A denotes a voltage amplitude (V) of the displacement signal SA; ⁇ A denotes angular velocity (rad/s) of the displacement signal SA; a variable “i” denotes a consecutive number (an integer) assigned to a sampling time point in time sequence; and t (i) denotes a time (s) of the sampling time point "i.” Further, reference symbol ⁇ A denotes a phase difference (rad) between the displacement signal SA and a reference signal DR1 (a sinusoidal wave sin ( ⁇ t)) tobe described later.
- the held displacement signal SA is input to the analogue-to-digital converter 19, where the signal is sequentially converted into a digital signal DA2.
- the digital signal DA2 is output to the low-pass filter 20 where processing is performed in a digital format.
- the low-pass filter 20 eliminates frequency components that are higher than frequencies of vibrations of the measurement tube and outputs a digital signal DA3 to the average calculation section 52.
- the low-pass filter 20 employs an FIR (Finite Impulse Response) filter that is one type of a digital filter.
- FIR Finite Impulse Response
- the displacement signal SB is input in the form of; for instance, Bxsin ( ⁇ B ⁇ t+ ⁇ B ) to the track-and-hold circuit 24, where the displacement signal is sequentially sampled/held by the timing signal TC that determines a sampling time point.
- the track-and-hold circuit 24 outputs a Bxsin( ⁇ B ⁇ t(i)+ ⁇ B ) to the analogue-to-digital converter 25.
- Reference symbol B denotes a voltage amplitude (V) of the displacement signal SB; ⁇ B denotes angular velocity (rad/s) of the displacement signal SB; a variable “i” denotes a consecutive number (an integer) assigned to a sampling time point in time sequence; and t (i) denotesatime (s) of the sampling time point "i.” Further, reference symbol ⁇ B denotes a phase difference (rad) between the displacement signal SB and a reference signal DR1 (a sinusoidal wave sin ( ⁇ t)) to be described later.
- the held displacement signal SB is input to the analogue-to-digital converter 25, where the signal is sequentially converted into a digital signal DB2.
- the digital signal DB2 is output to the low-pass filter (LPF) 26 where processing is performed in a digital format.
- LPF low-pass filter
- the low-pass filter 26 has the same configuration as that of the low-pass filter 20; eliminates frequency components that are higher than the frequencies of vibrations of the measurement tube; and outputs a digital signal DB3 to the average calculation section 52.
- the low-pass filters 20 and 26 are FIR filters, a gain characteristic, a group delay frequency characteristic, and the like, of the filters are also commonly selected in advance.
- the displacement signal SA is input to an excitation circuit 32, and an excitation voltage commensurate with the displacement signal SA is output to the vibratory device 4.
- the vibratory device 4 is activated so as to assume the shape of; for instance, a sinusoidal waveform.
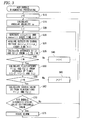
- FIG. 3 is an operation flowchart of air bubble diagnostic processing.
- Air bubble diagnostic processing is described by use of the displacement signal SA; however, the displacement signal SB may also be used instead.
- step S10 shown in Fig. 3 the reference signal generation section 51 sets one on "j" (a variable).
- Reference symbol "j" denotes a consecutive number (an integer) assigned to each of averages S1 and S2 and each of time-series values of the fluctuations F1 and F2.
- step S15 the reference signal generation section 51 calculates angular velocity ⁇ (rad/s) of the displacement signal SA and sets one on the variable "i" in step S20.
- the angular velocity ⁇ can be calculated by use of the predetermined period of time and the count value.
- step S25 every time t(i) the reference signal generation section 51 generates, by use of the angular velocity ⁇ , a reference signal DR1 sin ( ⁇ t(i)) (a sinusoidal waveform: a first reference signal) and a reference signal DR2 cos ( ⁇ t(i) ) (a cosine waveform: a second reference signal) that is 90° out of phase with the reference signal DR1.
- the reference signals DR1 and DR2 are output to the average calculation section 52.
- step S30 the average calculation section 52 receives from the low-pass filter 20 a signal (DA3) generated through digital conversion of a signal Axsin( ⁇ A ⁇ t(i)+ ⁇ A).
- step S35 the average calculation section 52 calculates an average S1(j) (a first average) determined by dividing the product of the signal DA3 and the reference signal DR1 by M, through use of Equation (1) provided below. Further, the average calculation section also calculates an average S2(j) (a second average) of M products of the signal DA3 and the referencesignalDR2, throughuse of Equation (2) providedbelow.
- step S40 When the variable "i" is smaller than M (a first predetermined number) (No in step S40), processing proceeds to step S45, where one is added to the variable "i," and processing returns to step S25, where processing pertaining to the respective steps is iterated, whereby numerators of Equations (1) and (2) are integrated to M in connection with the averages S1(j) and S2(j).
- the integrated value is divided by M, thereby determining the averages.
- the averages S1 (j) and S2 (j) may also be calculated from moving averages.
- step S50 the average variation calculation section 53 calculates variations in the averages S1(j) and S2(j) from averages S1(j), S1(j-1), Si(j-2), S2(j), S2(j-1), and S2(j-2) at times t(j), t(j-1), and t(j-2).
- the variations are taken as fluctuations F1(j) (a first fluctuation) and F2(j) (a second fluctuation).
- a current value calculated during a current operation period is taken as S1(j)
- a last value calculated during a last operation period is taken as S1 (j-1)
- a last but one value calculated during a last but one operation period is taken as S1(j-2).
- the fluctuation F1(j) is then calculated by means of two difference mode of operation represented by Equation (3) provided below.
- step S55 After calculation of the fluctuations F1(j) and F2(j), processing proceeds to step S55.
- step S55 when the variable "j" is smaller than N (a second predetermined number) (No is selected in step S55), processing proceeds to step S60. After one has been added to the variable "j , " processing returns to step S15. Thus, processing pertaining to the respective steps is iterated.
- step S55 When the variable "j" has become N or more (Yes is selected in step S55), processing proceeds to step S65.
- step S65 after having received the fluctuations F1 (3) to F1(N) and F2 (3) to F2(N) from the average variation calculation section 53, the status value calculation section 60 calculates from the values a status value DS showing a state of air bubbles.
- the status value DS is calculated as an average determined by dividing a square of the fluctuation F1(j) and a square of the fluctuation F2(j) by (N-3), as represented by Equation (5) provided below.
- a square root of a value calculated by Equation (5) may also be taken as the status value DS.
- the status value DS is calculated as an average determined by dividing an absolute value of the fluctuation F1 (j) and an absolute value of the fluctuation F2 (j) by (N-3), as represented by Expression (6) provided below.
- a square root of a value calculated by Equation (6) may also be taken as the status value DS.
- step S70 the determination section 70 receives the status value DS from the status value calculation section 60 and compares the thus-received status value DS with a threshold value, to thus determine a state of air bubbles.
- step S70 When the status value DS is equal to or larger than the threshold value (Yes is selected in step S70), the amount of air bubbles is large, and hence processing proceeds to step S75. Further, an alarm is output because the air bubbles are mixed in the target fluid or the amount of air bubbles is large. Subsequently, processing returns to step S10, and the air bubble diagnostic processing is iterated.
- step S70 when the status value DS is equal to or smaller than the threshold value (No is selected in step S70), no alarm is output because the air bubbles are not mixed in the target fluid or the amount of air bubbles is small. Processing then returns to step S10, and the air bubble diagnostic processing is iterated.
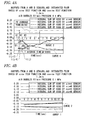
- Fig. 4A is a graph showing time variations in the averages S1(j) and S2(j) achieved in a state where air bubbles are mixed in the target fluid (the amount of air bubbles: 5 litters/min.).
- a curve 1 designates a graph of the average S1(j)
- a curve 2 designates a graph of the average S2(j). Since the air bubbles are mixed in the target fluid, fluctuations arise on the order of seconds.
- the average S1(j) is first described.
- An average time T is a value determined by multiplying a sampling period by M.
- Outlined circle A1 achieved at time t(j-2) on the curve 1 represents an average S1 (j -2) of M values calculated through use of Expression (1).
- outlined circle A2 achieved at a time t(j-1) on the curve 1 represents an average S1(j-1) of the M values.
- outlined circle A3 achieved at a time t (j) on the curve 1 represents an average S1(j) of the M values.
- outlined circles B1 through B3 on the curve 2 represent averages S2 (j-2), S2(j-1), and S2(j) of the M values calculated through use of Expression (2).
- an average time T is 100 milliseconds.
- the averages S1(j) and S2 (j) are calculated every 100 milliseconds.
- the fluctuation F1 (j) is then calculated from the averages S1(j-2), S1(j-1), and S1(j) represented by the three outlined circles A1 to A3, through use of Equation (3).
- the fluctuation F2(j) is then calculated from the averages S2(j-2), S2(j-1), and S2(j) represented by the three outlined circles B1 to B3, through use of Equation (4).
- An average time FT is a value determined by multiplying the average time T by N.
- the status value DS is calculated from the fluctuations F1 (j) and F2 (j) determined during a period of the average time FT, through use of Expression (5) or (6).
- the average time FT is 5 seconds.
- the status value DS is calculated every five seconds.
- the fluctuation calculation section 50 calculates the fluctuations F1 and F2 based on the displacement signal SA or SB; the status value calculation section 60 calculates the status value DS showing the state of air bubbles from the fluctuations F1 and F2; and the determination section 70 determines the state of air bubbles from the status value DS. It is thereby possible to accurately determine the state of air bubbles in the target fluid regardless of the level of pressure of the target fluid.
- the high frequency fluctuations are imposed on the low frequency fluctuations caused by air bubbles, whereby it often becomes impossible to accurately determine the state of air bubbles. Accordingly, it is possible to eliminate or lessen influence of the high frequency fluctuations.
- the averages S1(j) and S2(j) are averages of the M values.
- a value of M is now set so as to assume an average number such that the high frequency fluctuations are eliminated but low frequency fluctuations are not eliminated. Thus, only the low frequency fluctuations caused by air bubbles are calculated, and it becomes possible to accurately determine the state of air bubbles.
- the average time T is 100 milliseconds.
- the high frequency fluctuations having a frequency of; for instance, 50 Hz or more
- low frequency fluctuations having a frequency of; for instance, two to three hertz or less
- a value of M can be changeably set to an appropriate value according to a frequency (a low frequency) of fluctuations caused by air bubbles and a frequency (a high frequency) of fluctuations caused by a reason other than the air bubbles.
- the status value DS is an average of (N-3) values. Average processing is used for making determination accuracy of the state of air bubbles superior.
- the status value DS is calculated by square values or absolute values of the fluctuations F1(j) and F2(j), whereby the following advantages are yielded.
- the averages S1(j) and S2(j) and the fluctuations F1(j) and F2(j) can assume positive or negative values. For this reason, when the fluctuations F1 (j) and F2 (j) are used, as they are, rather than square values or absolute values, values of the fluctuations F1(j) and F2(j) cancel each other by means of averaging operation, whereby the status value DS often comes near zero. In this case, the status value DS becomes the threshold value or less, the air bubbles are determined not to be present, so that the state of the air bubbles cannot be accurately diagnosed.
- the status value DS comes to a positive value.
- the status value DS becomes greater than the threshold value, so that the state of air bubbles can be accurately diagnosed.
- Fig. 4B is a graph showing time variations in the averages S1(j) and S2(j) achieved when no air bubbles are mixed.
- a curve 1 designates a graph of the average S1(j)
- a curve 2 designates a graph of the average S2(j).
- the curves 1 and 2 include little fluctuations.
- the curve 1 decreases at a given gradient, and the curve 2 increases at a given gradient.
- the threshold value generation section 80 shown in Fig. 2 is now described.
- the threshold value generation section 80 generates a threshold value to be used by the determination section 70.
- a threshold value to be generated is calculated as follows.
- the target fluid does not include any air bubbles.
- the air bubble diagnostic processing shown in Fig. 3 is performed in this state, whereby the status value DS is calculated.
- the threshold value generation section 80 calculates, as a threshold value, a value determined by multiplying the no-air-bubble status value by a predetermine coefficient or a value determined by adding a predetermined value (an offset value) to the no-air-bubble status value.
- a calculation result is forwarded as a threshold value to the determination section 70.
- the user can determine the predetermined coefficient and the predetermined value by means of an allowable amount of air bubbles mixed.
- phase difference calculation section 31 receives the values represented by the numerators of Expressions (1) and (2) from the fluctuation calculation section 50 and calculates a tangent (tan ⁇ A ) of a phase ⁇ A of the displacement signal SA by means of Expression (7).
- the phase difference calculation section 31 calculates an inverse tangent (tan -1 ⁇ A ) of tan ⁇ A , thereby determining the phase ⁇ A and calculates an inverse tangent (tan -1 ⁇ B ) of tan ⁇ B , thereby determining the phase ⁇ B .
- the phase ⁇ B is subtracted from the phase ⁇ A , thereby calculating a phase difference ⁇ (ascribable to Coriolis force) between the displacement signal SA and the displacement signal SB.
- the temperature sensor 6 outputs a temperature signal ST1 to the track-and-hold circuit 33.
- a plurality of temperature signals held by the timing signal TC that determines a sampling time point are converted by the analogue-to-digital converter 34 into digital signals.
- the thus-converted digital signals are output to an averaging circuit 35, where the signals are averaged and output as a temperature signal ST2.
- the displacement signal SA detected by the upstream sensor 5A is input to frequency measurement section 7, where a signal frequency fA is measured.
- the signal frequency fA and the temperature signal ST2 are input to density calculation section 40, and a density D of the target fluid is calculated from them.
- the density D, the signal frequency fA, the phase difference ⁇ , and the temperature signal ST2 are input to the mass flow rate calculation section 41, and a mass flow rate QM is calculated from them.
- Fig. 5 is a block diagram of a Coriolis flowmeter 100 to which the present embodiment applies, and explanations are provided with reference to the drawing.
- the Coriolis flowmeter shown in Fig. 5 differs from its counterpart shown in Fig. 2 in terms of addition of first shift section 110, deletion of the reference signal generation section 51 shown in Fig. 2 , and average calculation processing of average calculation section 121 in fluctuation calculation section 120.
- the first shift section 110 receives the output signal DA3 from the low-pass filter 20 and generates a signal DA4 (a first shift detection signal) that is 90° out of phase with the signal DA3 through Hilbert transform processing, or the like and outputs the thus-generated signal to the average calculation section 121.
- a signal DA4 a first shift detection signal
- the average calculation section 121 receives the signals DA3, DA4, and DB3 , calculates the averages S1(j) and S2(j) by means of process ing to be described later (described by reference to Fig. 6 ), and outputs the averages to the average variation calculation section 53.
- the signal DA3 corresponds to Axsin ( ⁇ ' ⁇ t (1)); the signal DA4 corresponds to Axcos( ⁇ ' ⁇ t(i)); and the signal DB3 corresponds to Bxsin( ⁇ ' ⁇ t(i)+ ⁇ ).
- ⁇ ' denotes angular velocity (rad/s) of the displacement signals SA and SB
- ⁇ denotes a phase difference (rad) (ascribable to Coriolis force) between the displacement signals SA and SB.
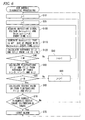
- FIG. 6 is an operation flowchart of air bubble diagnostic processing. Those elements that are the same as their counterparts shown in Fig. 3 are assigned the same reference numerals, and descriptions are primarily given to differences between the first and second embodiments.
- step S10 one is set on the variable "j" (step S10), and one is set on the variable "i" (step S20).
- step S100 shown in Fig. 6 the average calculation section 121 receives the signals DA3 and DB3.
- step S110 the first shift section 110 generates the signal DA4 and forwards the signal to the average calculation section 121.
- step S120 the average calculation section 121 calculates, through use of Equation (9) provided below, an average S1(j) (the first average) of M products of the signal DA3 and the signal DB3. Further, the average calculation section also calculates, through use of Equation (10) provided below, an average S2(j) (the second average)of M products of the signal DA4 and the signal DB3.
- step S40 When the variable "i" is smaller than M (the first predetermined number) (No in step S40), processing proceeds to step S45, where one is added to the variable "i", and processing returns to step S100, where processing pertaining to the respective steps is iterated, whereby numerators of Equations (9) and (10) are integrated to M in connection with the averages S1(j) and S2(j).
- the integrated value is divided by M, thereby determining the averages.
- the averages S1(j) and S2(j) may also be calculated from moving averages.
- step S50 Processing subsequent to step S50 is analogous to that shown in Fig. 3 .
- the fluctuation calculation section 120 calculates the fluctuations F1 and F2 based on the displacement signals SA, SB and the first shift detection signal DA4 as in the first embodiment.
- the status value calculation section 60 calculates the status value DS showing a state of the air bubbles from the fluctuations F1 and F2, and the determination section 70 determines the state of the air bubbles from the status value DS. It thereby becomes possible to determine the state of the air bubbles in the target flow with accuracy regardless of the level of pressure of the target fluid.
- Fig. 7 is a block diagram of a Coriolis flowmeter 200 to which the present embodiment applies, and explanations are provided with reference to the drawing.
- the Coriolis flowmeter shown in Fig. 7 differs from its counterpart shown in Fig. 2 in terms of addition of the first shift section 110 and second shift section 210, deletion of the reference signal generation section 51 shown in Fig. 2 , and average calculation processing of average calculation section 221 in fluctuation calculation section 220.
- the first shift section 110 receives the output signal DA3 from the low-pass filter 20 and generates a signal DA4 (the first shift detection signal) that is 90° out of phase with the signal DA3 through Hilbert transform processing, or the like and outputs the thus-generated signal to the average calculation section 221.
- a signal DA4 the first shift detection signal
- the second shift section 210 receives the output signal DB3 from the low-pass filter 26 and generates a signal DB4 (a second shift detection signal) that is 90° out of phase with the signal DB3 through Hilbert transform processing, or the like and outputs the thus-generated signal to the average calculation section 221.
- a signal DB4 a second shift detection signal
- the average calculation section 221 receives the signals DA3, DA4, DB3, and DB4 and calculates the averages S1(j) and S2(j) by means of processing to be described later (described by reference to Fig. 8 ), and outputs the averages to the average variation calculation section 53.
- the signal DA3 corresponds to A ⁇ sin( ⁇ ' ⁇ t(i)); the signal DA4 corresponds to Axcos( ⁇ ' ⁇ t(i)); the signal DB3 corresponds to Bxsin( ⁇ ' ⁇ t(i)+ ⁇ ); and the signal DB4 corresponds to Bxcos( ⁇ ' ⁇ t(i)+ ⁇ ).
- ⁇ ' denotes angular velocity (rad/s) of the displacement signals SA and SB
- ⁇ denotes a phase difference (rad) (ascribable to Coriolis force) between the displacement signals SA and SB.
- FIG. 8 is an operation flowchart of air bubble diagnostic processing. Those elements that are the same as their counterparts shown in Fig. 3 are assigned the same reference numerals, and descriptions are primarily given to differences between the first and third embodiments.
- Fig. 8 one is set on the variable "j" (step S10), and one is set on the variable "i" (step S20). Calculation of the angular velocity ⁇ pertaining to step S15 shown in Fig. 3 , and generation of the reference signal pertaining to step S25 are not performed.
- step S200 shown in Fig. 8 the average calculation section 221 receives the signals DA3 and DB3.
- step S210 the first shift section 110 generates the signal DA4 and forwards the signal to the average calculation section 221.
- the second shift section 210 generates the signal DB4 and forwards the signal to the average calculation section 221.
- step S220 the average calculation section 221 calculates, through use of Equation (11) provided below, an average S1(j) (the first average) of results of M subtractions of a product (Z2) of the signal DA4 and the signal DB3 from a product of the signal DA3 and the DB4 (Z1). Further, the average calculation section also calculates, through use of Equation (12) provided below, an average S2(j) (the second average) of results of M additions of a product (Z4) of the signal DA3 and the signal DB3 to a product (Z3) of the signal DA4 and the signal DB4.
- Equation (11) provided below, an average S1(j) (the first average) of results of M subtractions of a product (Z2) of the signal DA4 and the signal DB3 from a product of the signal DA3 and the DB4 (Z1). Further, the average calculation section also calculates, through use of Equation (12) provided below, an average S2(j) (the second average) of results of M
- step S40 processing proceeds to step 45, where one is added to the variable "i, " and processing returns to step S200, where processing pertaining to the respective steps is iterated, whereby numerators of Equations (11) and (12) are integrated to M in connection with the averages S1(j) and S2(j).
- the integrated value is divided by M, to thus determine the averages.
- the averages S1(j) and S2(j) may also be calculated from moving averages.
- step S50 Processing subsequent to step S50 is analogous to that shown in Fig. 3 .
- the fluctuation calculation section 220 calculates the fluctuations F1 and F2 based on the displacement signals SA, SB, the first detection signal DA4, and the second shift detection signal DB4, as in the first embodiment.
- the status value calculation section 60 calculates the status value DS showing a state of the air bubbles from the fluctuations F1 and F2, and the determination section 70 determines the state of the air bubbles from the status value DS. It thereby becomes possible to determine the state of the air bubbles in the target flow with accuracy regardless of the level of pressure of the target fluid.
- the fluctuation calculation section 50, 120, 220, the status value calculation section 60, the determination section 70, the threshold value generation section 80, the first shift section 110, and the second shift section 210 may also be executed by a processor according to a predetermined program or implemented by a logic circuit.
- a Coriolis flowmeter calculates fluctuations based on a detection signal, calculates a status value showing a state of air bubbles from the fluctuations, and determines a state of air bubbles from the status value. Regardless of a level of pressure of a fluid subject to measurement, it thereby becomes possible to accurately determine a state of air bubbles in the fluid subject to measurement.
- the present invention is not limited to the embodiments and encompasses a larger number of modifications and alterations without departing the entity of the invention.
- the present invention can encompass combinations other than the last combinations of the section.
Landscapes
- Physics & Mathematics (AREA)
- Fluid Mechanics (AREA)
- General Physics & Mathematics (AREA)
- Engineering & Computer Science (AREA)
- Signal Processing (AREA)
- Measuring Volume Flow (AREA)
Abstract

Description
- This application is based on and claims priority under 35 U.S.C. §119 from Japanese Patent Application No.
2009-167684 filed on July 16, 2009 - The present invention relates to a Coriolis flowmeter and, more particularly, to a Coriolis flowmeter that determines a state of air bubbles in a fluid subject to measurement (hereinafter called a "target fluid").
- A Coriolis flowmeter is used in measuring a flow rate of a target fluid in flow rate control performed in a chemical plant, or the like. A configuration of an example Coriolis flowmeter is illustrated in
JP-A-8-29229 - In addition to being able to measure a flow rate, the Coriolis flowmeter can also detect air bubbles in a target fluid, and a method for detecting air bubbles is described in
JP-T-2002-525623 Fig. 9. Fig. 9 is a view showing a time variation in drive gain of a drive circuit that activates a measurement tube of a Coriolis flowmeter sensor. - When air bubbles have got into a target fluid, a loss in drive energy of the measurement tube increases, so that a vibration amplitude of the measurement tube becomes smaller. In this case, in order to hold a predetermined vibration, the drive gain of the drive circuit and a drive voltage output from the drive circuit increase. When the drive gain exceeds a threshold value, mixing of air bubbles is detected.
- In
Fig. 9 , a threshold value for detecting air bubbles is taken as 606. Air bubbles are not mixed in a target fluid during a period from time t0 to time t1, and the drive gain is smaller than thethreshold value 606. - Air bubbles begin to get into the target fluid from time t1 and are mixed in the target fluid during a period of
time 600. Consequently, the drive gain exceeds thethreshold value 606 during this period, and mixing of the air bubbles is detected. - However, when a pressure of the target fluid is high, diameters of air bubbles become smaller than those achieved when the pressure is low. Therefore, a loss in drive energy becomes smaller, and the drive gain decreases during a period of
time 600 shown inFig. 9 . - When an average drive gain achieved during the period of
time 600 becomes slightly larger than thethreshold value 606, the drive gain goes up and down relative to thethreshold value 606 because the drive gain is fluctuating. Fluctuation of the drive gain leads to a problem of repeated presence and absence of air bubbles occurring during the period oftime 600, which in turn makes it impossible to accurately detect air bubbles. - The present invention is directed toward a Coriolis flowmeter and provides a Coriolis flowmeter that accurately determines a state of air bubbles in a fluid subject to measurement regardless of variations in pressure of the fluid.
- In order to accomplish the objective, according to a first aspect of the invention, there is provided a Coriolis flowmeter that vibrates a measurement tube through which a fluid subject to measurement flows, detects vibrations including Coriolis force developed in the fluid from the vibrations, and measures a mass flow rate of the fluid from a detection signal, the Coriolis flowmeter including:
- a fluctuation calculation section that calculates fluctuations based on the detection signal;
- a status value calculation section that calculates a status value showing a state of air bubbles in the fluid from the fluctuations calculated by the fluctuation calculation section; and
- a determination section that determines a state of air bubbles from the status value calculated by the status value calculation section.
- According to a second aspect of the invention, there is provided the Coriolis flowmeter as set forth in the first aspect,
wherein the fluctuation calculation section includes: - a reference signal generation section that generates a reference signal through use of a frequency or angular velocity calculated based on the detection signal;
- an average calculation section that calculates an average based on the reference signal generated by the reference signal generation section and on the detection signal; and
- an average variation calculation section that calculates variations in the average calculated by the average calculation section as the fluctuations.
- According to a third aspect of the invention, there is provided the Coriolis flowmeter as set in the second aspect,
wherein the reference signal generation section generates a first reference signal and a second reference signal being 90° out of phase with the first reference signal; and
wherein the average calculation section calculates a first average that is an average of a product of the detection signal and the first reference signal and calculates a second average which is an average of a product of the detection signal and the second reference signal. - According to a fourth aspect of the invention, there is provided the Coriolis flowmeter as set forth in the second or third aspect,
wherein the average variation calculation section calculates, as the fluctuations, variations in the average based on a current average, a last average, and a last but one average. - According to a fifth aspect of the invention, there is provided the Coriolis flowmeter as set forth in any one of the first through fourth aspects,
wherein the status value calculation section calculates a square mean value, a root mean square value, an average absolute value, or a square root of an average absolute value of the fluctuations. - According to a sixth aspect of the invention, there is provided the Coriolis flowmeter as set forth in the third aspect,
wherein the average variation calculation section calculates, as first fluctuations, variations in the first average based on a current value of the first average, a last value of the first average and a last but one value of the first average and calculates, as second fluctuations, variations in the second average based on a current value of the second average , a last value of the second average, and a last but one value of the second average; and
the status value calculation section calculates an average of squares of the first fluctuations and squares of the second fluctuations, a square root of the average, and an average of absolute values of the first fluctuations and absolute values of the second fluctuations or a square root of the average. - According to a seventh aspect of the invention, there is provided the Coriolis flowmeter as set forth in any one of the first through sixth aspects,
wherein the determination section compares the status value with a threshold value to determine a state of the air bubbles. - According to an eighth aspect of the invention, there is provided the Coriolis flowmeter as set forth in the seventh aspect, further including:
a threshold value generation section that generates, as the threshold value, a value based on the status value calculated when the air bubbles are not present. - According to a ninth aspect of the invention, there is provided the Coriolis flowmeter as set forth in the first aspect,
wherein the fluctuation calculation section includes:
a first shift section that generates a first shift detection signal which is 90° out of phase with a first detection signal detected by one vibration detection section;
an average calculation section that calculates an average based on a first shift detection signal generated by the first shift section, a second detection signal detected by the other vibration detection section, and the first detection signal; and
an average variation calculation section that calculates, as the fluctuations, variations in the average calculated by the average calculation section. - According to a tenth aspect of the invention, there is provided the Coriolis flowmeter as set forth in the first aspect,
wherein the fluctuation calculation section includes: - a first shift section that generates a first shift detection signal which is 90° out of phase with a first detection signal detected by one vibration detection section;
- a second shift section that generates a second shift detection signal which is 90° out of phase with a second detection signal detected by the other vibration detection section;
- an average calculation section that calculates an average based on a first shift detection signal generated by the first shift section, a second shift detection signal generated by the second shift section, the first detection signal, and the second detection signal; and
- an average variation calculation section that calculates, as the fluctuations, variations in the average calculated by the average calculation section.
- A general architecture that implements the various features of the invention will now be described with reference to the drawings. The drawings and the associated descriptions are provided to illustrate embodiments of the invention and not limited the scope of the invention.
-
-
Figs. 1A and 1B show a detection unit of a Coriolis flowmeter, whereinFig. 1A is an exemplary block diagram andFig. 1B is an exemplary operation diagram; -
Fig. 2 is an exemplary block diagram of the Coriolis flowmeter to which the present invention applies; -
Fig. 3 is an exemplary operation flowchart of air bubble diagnostic processing to which the present invention applies; -
Figs. 4A and 4B are an exemplary graph of averages S1 and S2 achieved when air bubbles are mixed or not mixed; -
Fig. 5 is another exemplary block diagram of the Coriolis flowmeter to which the present invention applies; -
Fig. 6 is another exemplary operation flowchart of air bubble diagnostic processing to which the present invention applies; -
Fig. 7 is another exemplary block diagram of the Coriolis flowmeter to which the present invention applies; -
Fig. 8 is another exemplary operation flowchart of air bubble diagnostic processing to which the present invention applies; and -
Fig. 9 is an exemplary diagram showing a time variation in drive gain of a drive circuit that activates a measurement tube of a Coriolis flowmeter sensor described in connection with the related art. - Various embodiments according to the invention will be described hereinafter with reference to the accompanying drawings.
-
Fig. 1A is a block diagram of a detection unit SNS of a Coriolis flowmeter;Fig. 1B is an explanatory operation diagram for describing operation of the detection unit SNS; andFig. 2 is a block diagram of aCoriolis flowmeter 10 to which the present embodiment applies, and explanations are provided by reference to these drawings. - In
Fig. 1A , a measurement tube may be of another type; for instance, a U-shaped tube type. For the sake of brevity, descriptions are provided by reference to a straight tube type. -
Reference numeral 1 designates a measurement tube that enables flow of a fluid subject to measurement (hereinafter referred to as a "target fluid"), and the target fluid flows through the tube from left to right. Both ends of themeasurement tube 1 are fastened to supportmembers vibratory device 4 that mechanically vibrates themeasurement tube 1 in the vertical direction is disposed in the vicinity of a center area of themeasurement tube 1. - An
upstream sensor 5A (one vibration detection section) and adownstream sensor 5B (the other vibration detection section) that detect vibrations of themeasurement tube 1 are fastened in the proximity of areas of themeasurement tube 1 supported by thesupport members temperature sensor 6 used for compensating for a temperature is disposed in the vicinity of thesupport member 3. The detection unit SNS is constituted of the aforementioned elements. - In
Fig. 1B , when the target fluid flows into themeasurement tube 1 in a state where vibrations are imparted from thevibratory device 4 to themeasurement tube 1 in a shape of a primary mode as designated by reference symbols M1 and M2, Coriolis force develops in the target fluid, and themeasurement tube 1 vibrates in a shape of a secondary mode as indicated by M3 and M4. - In reality, the
measurement tube 1 undergoes vibrations while these two types of vibration patterns are superimposed. The Coriolis flowmeter measures a mass flow rate of the target fluid on the basis of a displacement signal SA (a first detection signal) produced as a result of theupstream sensor 5A detecting deformation induced by the vibrations of themeasurement tube 1 and a displacement signal SB (a second detection signal) produced as a result of thedownstream sensor 5B detecting deformation induced by the same. - In
Fig. 2 , a characteristic of theCoriolis flowmeter 10 to which the present embodiment applies lies in inclusion offluctuation calculation section 50 having a referencesignal generation section 51,average calculation section 52, and an averagevariation calculation section 53; statusvalue calculation section 60;determination section 70; and thresholdvalue generation section 80. - The reference
signal generation section 51 receives the displacement signal SA and outputs a reference signal DR to theaverage calculation section 52. Theaverage calculation section 52 receives the reference signal DR from the referencesignal generation section 51, an output signal DA3 from a low-pass filter (LPF) 20, and outputs an average to the averagevariation calculation section 53. The averagevariation calculation section 53 receives an average from theaverage calculation section 52 and outputs a fluctuation F to the statusvalue calculation section 60. - The status
value calculation section 60 receives the fluctuation F from the averagevariation calculation section 53 and outputs a status value DS to thedetermination section 70. Thedetermination section 70 receives the status value DS from the statusvalue calculation section 60 and a threshold value from the thresholdvalue generation section 80, thereby determining a state of air bubbles. - Operation of track-and-hold (T&H)
circuits - A
clock signal oscillator 17 generates a timing signal TC having a predetermined sampling period regardless of the vibrations of themeasurement tube 1. - The displacement signal SA is input in the form of; for instance, Axsin(ωA×t+ΦA), to the track-and-
hold circuit 18, where the signal is sequentially sampled and held by the timing signal TC that determines a sampling time point. The track-and-hold circuit 18 outputs Axsin(ωA×t(i)+ΦA) to the analogue-to-digital converter 19. - Reference symbol A denotes a voltage amplitude (V) of the displacement signal SA; ωA denotes angular velocity (rad/s) of the displacement signal SA; a variable "i" denotes a consecutive number (an integer) assigned to a sampling time point in time sequence; and t (i) denotes a time (s) of the sampling time point "i." Further, reference symbol ΦA denotes a phase difference (rad) between the displacement signal SA and a reference signal DR1 (a sinusoidal wave sin (ω×t)) tobe described later.
- The held displacement signal SA is input to the analogue-to-
digital converter 19, where the signal is sequentially converted into a digital signal DA2. The digital signal DA2 is output to the low-pass filter 20 where processing is performed in a digital format. - The low-
pass filter 20 eliminates frequency components that are higher than frequencies of vibrations of the measurement tube and outputs a digital signal DA3 to theaverage calculation section 52. For instance, the low-pass filter 20 employs an FIR (Finite Impulse Response) filter that is one type of a digital filter. - In the meantime, the displacement signal SB is input in the form of; for instance, Bxsin (ωB×t+ΦB) to the track-and-
hold circuit 24, where the displacement signal is sequentially sampled/held by the timing signal TC that determines a sampling time point. The track-and-hold circuit 24 outputs a Bxsin(ωB×t(i)+ΦB) to the analogue-to-digital converter 25. - Reference symbol B denotes a voltage amplitude (V) of the displacement signal SB; ωB denotes angular velocity (rad/s) of the displacement signal SB; a variable "i" denotes a consecutive number (an integer) assigned to a sampling time point in time sequence; and t (i) denotesatime (s) of the sampling time point "i." Further, reference symbol ΦB denotes a phase difference (rad) between the displacement signal SB and a reference signal DR1 (a sinusoidal wave sin (ω×t)) to be described later.
- The held displacement signal SB is input to the analogue-to-
digital converter 25, where the signal is sequentially converted into a digital signal DB2. The digital signal DB2 is output to the low-pass filter (LPF) 26 where processing is performed in a digital format. - The low-
pass filter 26 has the same configuration as that of the low-pass filter 20; eliminates frequency components that are higher than the frequencies of vibrations of the measurement tube; and outputs a digital signal DB3 to theaverage calculation section 52. When the low-pass filters - The displacement signal SA is input to an
excitation circuit 32, and an excitation voltage commensurate with the displacement signal SA is output to thevibratory device 4. Thevibratory device 4 is activated so as to assume the shape of; for instance, a sinusoidal waveform. - With further reference to
Fig. 3 , there is now described air bubble diagnostic processing performed by use of the referencesignal generation section 51, theaverage calculation section 52, and the averagevariation calculation section 53 that are provided in thefluctuation calculation section 50; the statusvalue calculation section 60; thedetermination section 70; and thethresholdvalue generation section 80.Fig. 3 is an operation flowchart of air bubble diagnostic processing. - Air bubble diagnostic processing is described by use of the displacement signal SA; however, the displacement signal SB may also be used instead.
- In step S10 shown in
Fig. 3 , the referencesignal generation section 51 sets one on "j" (a variable). Reference symbol "j" denotes a consecutive number (an integer) assigned to each of averages S1 and S2 and each of time-series values of the fluctuations F1 and F2. - In step S15, the reference
signal generation section 51 calculates angular velocity ω (rad/s) of the displacement signal SA and sets one on the variable "i" in step S20. - For instance, there is counted the number of times the voltage of the displacement signal SA comes to zero within a predetermined period of time, and the angular velocity ω can be calculated by use of the predetermined period of time and the count value. Alternatively, a frequency "f" (Hz) of the displacement signal SA is calculated in place of the angular velocity ω, and the angular velocity ω may be calculated by use of the frequency "f" (ω=2×π×f ("π" is a circle ratio)).
- In step S25, every time t(i) the reference
signal generation section 51 generates, by use of the angular velocity ω, a reference signal DR1 sin (ω×t(i)) (a sinusoidal waveform: a first reference signal) and a reference signal DR2 cos (ω×t(i) ) (a cosine waveform: a second reference signal) that is 90° out of phase with the reference signal DR1. The reference signals DR1 and DR2 are output to theaverage calculation section 52. - In step S30, the
average calculation section 52 receives from the low-pass filter 20 a signal (DA3) generated through digital conversion of a signal Axsin(ωA×t(i)+ΦA). - In step S35, the
average calculation section 52 calculates an average S1(j) (a first average) determined by dividing the product of the signal DA3 and the reference signal DR1 by M, through use of Equation (1) provided below. Further, the average calculation section also calculates an average S2(j) (a second average) of M products of the signal DA3 and the referencesignalDR2, throughuse of Equation (2) providedbelow.[

- When the variable "i" is smaller than M (a first predetermined number) (No in step S40), processing proceeds to step S45, where one is added to the variable "i," and processing returns to step S25, where processing pertaining to the respective steps is iterated, whereby numerators of Equations (1) and (2) are integrated to M in connection with the averages S1(j) and S2(j). When the variable "i" has come to M (Yes is selected in step S40), the integrated value is divided by M, thereby determining the averages. The averages S1 (j) and S2 (j) may also be calculated from moving averages.
- When the variable "i" has come to M or more, processing proceeds to step S50. In step S50, the average
variation calculation section 53 calculates variations in the averages S1(j) and S2(j) from averages S1(j), S1(j-1), Si(j-2), S2(j), S2(j-1), and S2(j-2) at times t(j), t(j-1), and t(j-2). The variations are taken as fluctuations F1(j) (a first fluctuation) and F2(j) (a second fluctuation). - Of the averages, a current value calculated during a current operation period is taken as S1(j), a last value calculated during a last operation period is taken as S1 (j-1), and a last but one value calculated during a last but one operation period is taken as S1(j-2). The fluctuation F1(j) is then calculated by means of two difference mode of operation represented by Equation (3) provided below.

- Likewise, of the averages, a current value calculated during a current operation period is taken as S2(j), a last value calculated during a last operation period is taken as S2 (j-1), and a last but one value calculated during a last but one operationperiod is taken as S2 (j -2). The fluctuation F2 (j) is then calculated by means of two difference mode of operation represented by Equation (4) provided below.

- In the case of; for instance, j=3, we have F1(3) = S1(3)-2×S1(2)+S1(1) and F2(3) = S2(3)-2×2(2)+S2(1).
- In the case of; for instance, j=50, we have F1(50) = S1(50)-2×S1(49)+S1(48) and F2(50) = S2(50)-2×S2(49)+S2(48).
- After calculation of the fluctuations F1(j) and F2(j), processing proceeds to step S55. In step S55, when the variable "j" is smaller than N (a second predetermined number) (No is selected in step S55), processing proceeds to step S60. After one has been added to the variable "j , " processing returns to step S15. Thus, processing pertaining to the respective steps is iterated.
- When the variable "j" has become N or more (Yes is selected in step S55), processing proceeds to step S65. In step S65, after having received the fluctuations F1 (3) to F1(N) and F2 (3) to F2(N) from the average
variation calculation section 53, the statusvalue calculation section 60 calculates from the values a status value DS showing a state of air bubbles. - When there are no air bubbles or little air bubbles, fluctuations are small; hence, the status value DS becomes smaller. The fluctuations become greater as an amount of air bubble becomes greater, and the status value DS also becomes greater correspondingly.
- The status value DS is calculated as an average determined by dividing a square of the fluctuation F1(j) and a square of the fluctuation F2(j) by (N-3), as represented by Equation (5) provided below.

- A square root of a value calculated by Equation (5) may also be taken as the status value DS.
- Bywayof another example, the status value DS is calculated as an average determined by dividing an absolute value of the fluctuation F1 (j) and an absolute value of the fluctuation F2 (j) by (N-3), as represented by Expression (6) provided below.

- A square root of a value calculated by Equation (6) may also be taken as the status value DS.
- After calculation of the status value DS, processing proceeds to step S70. In step S70, the
determination section 70 receives the status value DS from the statusvalue calculation section 60 and compares the thus-received status value DS with a threshold value, to thus determine a state of air bubbles. - When the status value DS is equal to or larger than the threshold value (Yes is selected in step S70), the amount of air bubbles is large, and hence processing proceeds to step S75. Further, an alarm is output because the air bubbles are mixed in the target fluid or the amount of air bubbles is large. Subsequently, processing returns to step S10, and the air bubble diagnostic processing is iterated.
- In the meantime, when the status value DS is equal to or smaller than the threshold value (No is selected in step S70), no alarm is output because the air bubbles are not mixed in the target fluid or the amount of air bubbles is small. Processing then returns to step S10, and the air bubble diagnostic processing is iterated.
-
Fig. 4A is now described.Fig. 4A is a graph showing time variations in the averages S1(j) and S2(j) achieved in a state where air bubbles are mixed in the target fluid (the amount of air bubbles: 5 litters/min.). Acurve 1 designates a graph of the average S1(j), and acurve 2 designates a graph of the average S2(j). Since the air bubbles are mixed in the target fluid, fluctuations arise on the order of seconds. - With reference to
Fig. 4A , the averages S1 (j) and S2 (j), the fluctuations F1(j) and F2(j), and the status value DS calculated by reference toFig. 3 are now described. - The average S1(j) is first described. An average time T is a value determined by multiplying a sampling period by M. Outlined circle A1 achieved at time t(j-2) on the
curve 1 represents an average S1 (j -2) of M values calculated through use of Expression (1). - Likewise, outlined circle A2 achieved at a time t(j-1) on the
curve 1 represents an average S1(j-1) of the M values. Further, outlined circle A3 achieved at a time t (j) on thecurve 1 represents an average S1(j) of the M values. - Similarly, outlined circles B1 through B3 on the
curve 2 represent averages S2 (j-2), S2(j-1), and S2(j) of the M values calculated through use of Expression (2). - For instance, given that the sampling period is 0.1 millisecond and that M is 1000, an average time T is 100 milliseconds. Specifically, the averages S1(j) and S2 (j) are calculated every 100 milliseconds.
- The fluctuation F1 (j) is then calculated from the averages S1(j-2), S1(j-1), and S1(j) represented by the three outlined circles A1 to A3, through use of Equation (3).
- Likewise, the fluctuation F2(j) is then calculated from the averages S2(j-2), S2(j-1), and S2(j) represented by the three outlined circles B1 to B3, through use of Equation (4).
- An average time FT is a value determined by multiplying the average time T by N. The status value DS is calculated from the fluctuations F1 (j) and F2 (j) determined during a period of the average time FT, through use of Expression (5) or (6).
- For instance, given that the average time T is 100 milliseconds and that N is 50, the average time FT is 5 seconds. Specifically, the status value DS is calculated every five seconds.
- As mentioned above, during air bubble diagnostic processing of the present embodiment, the
fluctuation calculation section 50 calculates the fluctuations F1 and F2 based on the displacement signal SA or SB; the statusvalue calculation section 60 calculates the status value DS showing the state of air bubbles from the fluctuations F1 and F2; and thedetermination section 70 determines the state of air bubbles from the status value DS. It is thereby possible to accurately determine the state of air bubbles in the target fluid regardless of the level of pressure of the target fluid. - Although air bubbles induce fluctuations having a low frequency of the order of hertz or less, the fluctuations may also be caused for a reason other than the air bubbles. For instance, fluctuations having a high frequency of the order of about 50 Hz ormore are sometimes caused by vibrations stemming from a pump attached to the measurement tube.
- The high frequency fluctuations are imposed on the low frequency fluctuations caused by air bubbles, whereby it often becomes impossible to accurately determine the state of air bubbles. Accordingly, it is possible to eliminate or lessen influence of the high frequency fluctuations.
- As represented by Expressions (1) and (2), the averages S1(j) and S2(j) are averages of the M values. A value of M is now set so as to assume an average number such that the high frequency fluctuations are eliminated but low frequency fluctuations are not eliminated. Thus, only the low frequency fluctuations caused by air bubbles are calculated, and it becomes possible to accurately determine the state of air bubbles.
- For instance, as described by reference to
Fig. 4A , given that the sampling period is 0.1 millisecond and that M is 1000, the average time T is 100 milliseconds. The high frequency fluctuations (having a frequency of; for instance, 50 Hz or more) are thereby eliminated, and low frequency fluctuations (having a frequency of; for instance, two to three hertz or less) can be calculated without being eliminated. - A value of M can be changeably set to an appropriate value according to a frequency (a low frequency) of fluctuations caused by air bubbles and a frequency (a high frequency) of fluctuations caused by a reason other than the air bubbles.
- As represented by Expressions (5) and (6), the status value DS is an average of (N-3) values. Average processing is used for making determination accuracy of the state of air bubbles superior.
- As represented by Expressions (5) and (6), the status value DS is calculated by square values or absolute values of the fluctuations F1(j) and F2(j), whereby the following advantages are yielded.
- The averages S1(j) and S2(j) and the fluctuations F1(j) and F2(j) can assume positive or negative values. For this reason, when the fluctuations F1 (j) and F2 (j) are used, as they are, rather than square values or absolute values, values of the fluctuations F1(j) and F2(j) cancel each other by means of averaging operation, whereby the status value DS often comes near zero. In this case, the status value DS becomes the threshold value or less, the air bubbles are determined not to be present, so that the state of the air bubbles cannot be accurately diagnosed.
- Meanwhile, when the square values or absolute values of the fluctuations F1(j) and F2(j) are used, the status value DS comes to a positive value. When air bubbles get into the target fluid, the status value DS becomes greater than the threshold value, so that the state of air bubbles can be accurately diagnosed.
- The fluctuations F1(j) and F2(j) are calculated by use of the two difference mode of operation as shown by Expressions (3) and (4), whereby the following advantages are yielded.
-
Fig. 4B is a graph showing time variations in the averages S1(j) and S2(j) achieved when no air bubbles are mixed. Acurve 1 designates a graph of the average S1(j), and acurve 2 designates a graph of the average S2(j). - Since there are not any air bubbles, the
curves curve 1 decreases at a given gradient, and thecurve 2 increases at a given gradient. When the fluctuations F1(j) and F2(j) are calculated by use of a one difference mode of operation in this state; namely, when the fluctuations are calculated by means of F1(j) =S1(j) -S1(j-1) and F2(j)=S2(j)-S2(j-1), F1(j) and F2(j) assume values increased or decreased at the given gradient. - When the gradient is large, the fluctuations F1(j) and F2(j) become greater. Hence, the status value DS calculated by Expression (5) or (6) becomes great to exceed the threshold value. As a result, air bubbles are sometimes erroneously determined to be mixed in spite of absence of air bubbles.
- In the meantime, when the two difference mode of operation is used for the fluctuations F1 (j) and F2(j), the fluctuations F1(j) and F2(j) substantially come to zero in the state shown in
Fig. 4B . Hence, the status value DS comes nearly zero and becomes lower than the threshold value, so that air bubbles are determined to be absent. Hence, it is possible to prevent making of an erroneous determination. - The threshold
value generation section 80 shown inFig. 2 is now described. The thresholdvalue generation section 80 generates a threshold value to be used by thedetermination section 70. A threshold value to be generated is calculated as follows. - There is first achieved a state in which the target fluid does not include any air bubbles. The air bubble diagnostic processing shown in
Fig. 3 is performed in this state, whereby the status value DS is calculated. Provided that the status value is a no-air-bubble status value, the thresholdvalue generation section 80 calculates, as a threshold value, a value determined by multiplying the no-air-bubble status value by a predetermine coefficient or a value determined by adding a predetermined value (an offset value) to the no-air-bubble status value. A calculation result is forwarded as a threshold value to thedetermination section 70. - The user can determine the predetermined coefficient and the predetermined value by means of an allowable amount of air bubbles mixed.
- It is thereby possible for the user, or the like, to generate a threshold value according to the state of air bubbles in the target fluid or the allowable amount of air bubbles mixed, so that more appropriate diagnosis of the state of air bubbles can be carried out.
- Processing for calculating a mass flow rate of the target fluid is now described.
- In
Fig. 2 , phasedifference calculation section 31 receives the values represented by the numerators of Expressions (1) and (2) from thefluctuation calculation section 50 and calculates a tangent (tanΦA) of a phase ΦA of the displacement signal SA by means of Expression (7). -

- Likewise, a tangent (tanΦB) of a phase ΦB of the displacement signal SB is calculated by means of Expression (8).
-

- The phase
difference calculation section 31 calculates an inverse tangent (tan-1ΦA) of tanΦA, thereby determining the phase ΦA and calculates an inverse tangent (tan-1ΦB) of tanΦB, thereby determining the phase ΦB. The phase ΦB is subtracted from the phase ΦA, thereby calculating a phase difference ΔΦ (ascribable to Coriolis force) between the displacement signal SA and the displacement signal SB. - The
temperature sensor 6 outputs a temperature signal ST1 to the track-and-hold circuit 33. A plurality of temperature signals held by the timing signal TC that determines a sampling time point are converted by the analogue-to-digital converter 34 into digital signals. The thus-converted digital signals are output to an averagingcircuit 35, where the signals are averaged and output as a temperature signal ST2. - The displacement signal SA detected by the
upstream sensor 5A is input tofrequency measurement section 7, where a signal frequency fA is measured. - The signal frequency fA and the temperature signal ST2 are input to
density calculation section 40, and a density D of the target fluid is calculated from them. - The density D, the signal frequency fA, the phase difference ΔΦ, and the temperature signal ST2 are input to the mass flow
rate calculation section 41, and a mass flow rate QM is calculated from them. -
Fig. 5 is a block diagram of aCoriolis flowmeter 100 to which the present embodiment applies, and explanations are provided with reference to the drawing. The Coriolis flowmeter shown inFig. 5 differs from its counterpart shown inFig. 2 in terms of addition offirst shift section 110, deletion of the referencesignal generation section 51 shown inFig. 2 , and average calculation processing ofaverage calculation section 121 influctuation calculation section 120. - In the following descriptions, elements that are identical with their counterparts shown in
Fig. 2 are assigned the same reference numerals, and their repeated explanations are omitted. Explanations are provided to differences between the first embodiment and the second embodiment. - In
Fig. 5 , thefirst shift section 110 receives the output signal DA3 from the low-pass filter 20 and generates a signal DA4 (a first shift detection signal) that is 90° out of phase with the signal DA3 through Hilbert transform processing, or the like and outputs the thus-generated signal to theaverage calculation section 121. - The
average calculation section 121 receives the signals DA3, DA4, and DB3 , calculates the averages S1(j) and S2(j) by means of process ing to be described later (described by reference toFig. 6 ), and outputs the averages to the averagevariation calculation section 53. - The signal DA3 corresponds to Axsin (ω'×t (1)); the signal DA4 corresponds to Axcos(ω'×t(i)); and the signal DB3 corresponds to Bxsin(ω'×t(i)+ΔΦ).
- Reference symbol ω' denotes angular velocity (rad/s) of the displacement signals SA and SB, and ΔΦ denotes a phase difference (rad) (ascribable to Coriolis force) between the displacement signals SA and SB.
- With further reference to
Fig. 6 , air bubble diagnostic processing is now described.Fig. 6 is an operation flowchart of air bubble diagnostic processing. Those elements that are the same as their counterparts shown inFig. 3 are assigned the same reference numerals, and descriptions are primarily given to differences between the first and second embodiments. - In
Fig. 6 , one is set on the variable "j" (step S10), and one is set on the variable "i" (step S20). Calculation of the angular velocity ω pertaining to step S15 shown inFig. 3 , and generation of the reference signal pertaining to step S25 are not performed. - In step S100 shown in
Fig. 6 , theaverage calculation section 121 receives the signals DA3 and DB3. In step S110, thefirst shift section 110 generates the signal DA4 and forwards the signal to theaverage calculation section 121. - In step S120, the
average calculation section 121 calculates, through use of Equation (9) provided below, an average S1(j) (the first average) of M products of the signal DA3 and the signal DB3. Further, the average calculation section also calculates, through use of Equation (10) provided below, an average S2(j) (the second average)of M products of the signal DA4 and the signal DB3.

- When the variable "i" is smaller than M (the first predetermined number) (No in step S40), processing proceeds to step S45, where one is added to the variable "i", and processing returns to step S100, where processing pertaining to the respective steps is iterated, whereby numerators of Equations (9) and (10) are integrated to M in connection with the averages S1(j) and S2(j). When the variable "i" has come to M (Yes is selected in step S40), the integrated value is divided by M, thereby determining the averages. The averages S1(j) and S2(j) may also be calculated from moving averages.
- When the variable "i" has come to M or more, processing proceeds to step S50. Processing subsequent to step S50 is analogous to that shown in
Fig. 3 . - As mentioned above, during the air bubble diagnostic processing of the present embodiment, the
fluctuation calculation section 120 calculates the fluctuations F1 and F2 based on the displacement signals SA, SB and the first shift detection signal DA4 as in the first embodiment. The statusvalue calculation section 60 calculates the status value DS showing a state of the air bubbles from the fluctuations F1 and F2, and thedetermination section 70 determines the state of the air bubbles from the status value DS. It thereby becomes possible to determine the state of the air bubbles in the target flow with accuracy regardless of the level of pressure of the target fluid. -
Fig. 7 is a block diagram of aCoriolis flowmeter 200 to which the present embodiment applies, and explanations are provided with reference to the drawing. The Coriolis flowmeter shown inFig. 7 differs from its counterpart shown inFig. 2 in terms of addition of thefirst shift section 110 andsecond shift section 210, deletion of the referencesignal generation section 51 shown inFig. 2 , and average calculation processing ofaverage calculation section 221 influctuation calculation section 220. - In the following descriptions, elements that are identical with their counterparts shown in
Fig. 2 are assigned the same reference numerals, and their repeated explanations are omitted. Explanations are given to differences between the first embodiment and the third embodiment. - In
Fig. 7 , thefirst shift section 110 receives the output signal DA3 from the low-pass filter 20 and generates a signal DA4 (the first shift detection signal) that is 90° out of phase with the signal DA3 through Hilbert transform processing, or the like and outputs the thus-generated signal to theaverage calculation section 221. - The
second shift section 210 receives the output signal DB3 from the low-pass filter 26 and generates a signal DB4 (a second shift detection signal) that is 90° out of phase with the signal DB3 through Hilbert transform processing, or the like and outputs the thus-generated signal to theaverage calculation section 221. - The
average calculation section 221 receives the signals DA3, DA4, DB3, and DB4 and calculates the averages S1(j) and S2(j) by means of processing to be described later (described by reference toFig. 8 ), and outputs the averages to the averagevariation calculation section 53. - The signal DA3 corresponds to A×sin(ω'×t(i)); the signal DA4 corresponds to Axcos(ω'×t(i)); the signal DB3 corresponds to Bxsin(ω'×t(i)+ΔΦ); and the signal DB4 corresponds to Bxcos(ω'×t(i)+ΔΦ).
- Reference symbol ω' denotes angular velocity (rad/s) of the displacement signals SA and SB, and ΔΦ denotes a phase difference (rad) (ascribable to Coriolis force) between the displacement signals SA and SB.
- With further reference to
Fig. 8 , air bubble diagnostic processing is now described.Fig. 8 is an operation flowchart of air bubble diagnostic processing. Those elements that are the same as their counterparts shown inFig. 3 are assigned the same reference numerals, and descriptions are primarily given to differences between the first and third embodiments. - In
Fig. 8 , one is set on the variable "j" (step S10), and one is set on the variable "i" (step S20). Calculation of the angular velocity ω pertaining to step S15 shown inFig. 3 , and generation of the reference signal pertaining to step S25 are not performed. - In step S200 shown in
Fig. 8 , theaverage calculation section 221 receives the signals DA3 and DB3. In step S210, thefirst shift section 110 generates the signal DA4 and forwards the signal to theaverage calculation section 221. Thesecond shift section 210 generates the signal DB4 and forwards the signal to theaverage calculation section 221. - In step S220, the
average calculation section 221 calculates, through use of Equation (11) provided below, an average S1(j) (the first average) of results of M subtractions of a product (Z2) of the signal DA4 and the signal DB3 from a product of the signal DA3 and the DB4 (Z1). Further, the average calculation section also calculates, through use of Equation (12) provided below, an average S2(j) (the second average) of results of M additions of a product (Z4) of the signal DA3 and the signal DB3 to a product (Z3) of the signal DA4 and the signal DB4. -

- Reference symbol Z1 of
Mathematical Expression 11 is represented by Expression (1la) provided below, and Z2 is represented by Expression (11b) provided below. -


-

- Reference symbol Z3 of
Mathematical Expression 12 is represented by Expression (12a) provided below, and Z4 is represented by Expression (12b) provided below. -


- When the variable "i" is smaller than M (the first predetermined number) (No in step S40), processing proceeds to step 45, where one is added to the variable "i, " and processing returns to step S200, where processing pertaining to the respective steps is iterated, whereby numerators of Equations (11) and (12) are integrated to M in connection with the averages S1(j) and S2(j). When the variable "i" has come to M (Yes is selected in step S40), the integrated value is divided by M, to thus determine the averages. The averages S1(j) and S2(j) may also be calculated from moving averages.
- When the variable "i" has come to M or more, processing proceeds to step S50. Processing subsequent to step S50 is analogous to that shown in
Fig. 3 . - As mentioned above, during the air bubble diagnostic processing of the present embodiment, the
fluctuation calculation section 220 calculates the fluctuations F1 and F2 based on the displacement signals SA, SB, the first detection signal DA4, and the second shift detection signal DB4, as in the first embodiment. The statusvalue calculation section 60 calculates the status value DS showing a state of the air bubbles from the fluctuations F1 and F2, and thedetermination section 70 determines the state of the air bubbles from the status value DS. It thereby becomes possible to determine the state of the air bubbles in the target flow with accuracy regardless of the level of pressure of the target fluid. - The
fluctuation calculation section value calculation section 60, thedetermination section 70, the thresholdvalue generation section 80, thefirst shift section 110, and thesecond shift section 210 may also be executed by a processor according to a predetermined program or implemented by a logic circuit. - According to the present invention, a Coriolis flowmeter calculates fluctuations based on a detection signal, calculates a status value showing a state of air bubbles from the fluctuations, and determines a state of air bubbles from the status value. Regardless of a level of pressure of a fluid subject to measurement, it thereby becomes possible to accurately determine a state of air bubbles in the fluid subject to measurement.
- The present invention is not limited to the embodiments and encompasses a larger number of modifications and alterations without departing the entity of the invention. The present invention can encompass combinations other than the last combinations of the section.
Claims (10)
- A Coriolis flowmeter that vibrates a measurement tube through which a fluid subject to measurement flows, detects vibrations including Coriolis force developed in the fluid from the vibrations, and measures a mass flow rate of the fluid from a detection signal,
the Coriolis flowmeter comprising:a fluctuation calculation section that calculates fluctuations based on the detection signal;a status value calculation section that calculates a status value showing a state of air bubbles in the fluid from the fluctuations calculated by the fluctuation calculation section; anda determination section that determines a state of air bubbles from the status value calculated by the status value calculation section. - The Coriolis flowmeter as set forth in claim 1,
wherein the fluctuation calculation section comprises:a reference signal generation section that generates a reference signal through use of a frequency or angular velocity calculated based on the detection signal;an average calculation section that calculates an average based on the reference signal generated by the reference signal generation section and on the detection signal; andan average variation calculation section that calculates variations in the average calculated by the average calculation section as the fluctuations. - The Coriolis flowmeter as set in claim 2,
wherein the reference signal generation section generates a first reference signal and a second reference signal being 90° out of phase with the first reference signal; and
wherein the average calculation section calculates a first average that is an average of a product of the detection signal and the first reference signal and calculates a second average which is an average of a product of the detection signal and the second reference signal. - The Coriolis flowmeter as set forth in claim 2,
wherein the average variation calculation section calculates, as the fluctuations, variations in the average based on a current average, a last average, and a last but one average. - The Coriolis flowmeter as set forth in claim 1,
wherein the status value calculation section calculates a square mean value, a root mean square value, an average absolute value, or a square root of an average absolute value of the fluctuations. - The Coriolis flowmeter as set forth in claim 3,
wherein the average variation calculation section calculates, as first fluctuations, variations in the first average based on a current value of the first average, a last value of the first average and a last but one value of the first average and calculates, as second fluctuations, variations in the second average based on a current value of the second average, a last value of the second average, and a last but one value of the second average; and
the status value calculation section calculates an average of squares of the first fluctuations and squares of the second fluctuations, a square root of the average, and an average of absolute values of the first fluctuations and absolute values of the second fluctuations or a square root of the average. - The Coriolis flowmeter as set forth in claim 1,
wherein the determination section compares the status value with a threshold value to determine a state of the air bubbles. - The Coriolis flowmeter as set forth in claim 7, further comprising:a threshold value generation section that generates, as the threshold value, a value based on the status value calculated when the air bubbles are not present.
- The Coriolis flowmeter as set forth in claim 1,
wherein the fluctuation calculation section comprises:a first shift section that generates a first shift detection signal which is 90° out of phase with a first detection signal detected by one vibration detection section;an average calculation section that calculates an average based on a first shift detection signal generated by the first shift section, a second detection signal detected by the other vibration detection section, and the first detection signal; andan average variation calculation section that calculates, as the fluctuations, variations in the average calculated by the average calculation section. - The Coriolis flowmeter as set forth in claim 1,
wherein the fluctuation calculation section comprises:a first shift section that generates a first shift detection signal which is 90° out of phase with a first detection signal detected by one vibration detection section;a second shift section that generates a second shift detection signal which is 90° out of phase with a second detection signal detected by the other vibration detection section;an average calculation section that calculates an average based on a first shift detection signal generated by the first
shift section, a second shift detection signal generated by the second shift section, the first detection signal, and the second detection signal; andan average variation calculation section that calculates, as the fluctuations, variations in the average calculated by the average calculation section.
Applications Claiming Priority (1)
| Application Number | Priority Date | Filing Date | Title |
|---|---|---|---|
| JP2009167684A JP4962804B2 (en) | 2009-07-16 | 2009-07-16 | Coriolis flow meter |
Publications (3)
| Publication Number | Publication Date |
|---|---|
| EP2275787A2 true EP2275787A2 (en) | 2011-01-19 |
| EP2275787A3 EP2275787A3 (en) | 2014-02-19 |
| EP2275787B1 EP2275787B1 (en) | 2019-09-18 |
Family
ID=42992403
Family Applications (1)
| Application Number | Title | Priority Date | Filing Date |
|---|---|---|---|
| EP10169322.4A Active EP2275787B1 (en) | 2009-07-16 | 2010-07-13 | Coriolis flowmeter |
Country Status (4)
| Country | Link |
|---|---|
| US (1) | US8151653B2 (en) |
| EP (1) | EP2275787B1 (en) |
| JP (1) | JP4962804B2 (en) |
| CN (1) | CN101957222B (en) |
Cited By (3)
| Publication number | Priority date | Publication date | Assignee | Title |
|---|---|---|---|---|
| WO2015073013A1 (en) * | 2013-11-14 | 2015-05-21 | Micro Motion, Inc. | Coriolis direct wellhead measurement devices and methods |
| WO2016140734A1 (en) * | 2015-03-04 | 2016-09-09 | Micro Motion, Inc. | Coriolis threshold determination devices and methods |
| WO2020244855A1 (en) * | 2019-06-05 | 2020-12-10 | Endress+Hauser Flowtec Ag | Measuring device for determining the density, the mass flow and/or the viscosity of a gas-charged liquid, processing system having such a measuring device, and method for monitoring a gas-charged liquid |
Families Citing this family (9)
| Publication number | Priority date | Publication date | Assignee | Title |
|---|---|---|---|---|
| SG11201400423WA (en) | 2011-09-19 | 2014-04-28 | Micro Motion Inc | Vibratory flowmeter and method for average flow rate |
| AU2014254365B2 (en) * | 2013-04-18 | 2017-06-15 | Micro Motion, Inc. | Verification of a meter sensor for a vibratory meter |
| JP6367649B2 (en) * | 2014-08-21 | 2018-08-01 | ヤマシンフィルタ株式会社 | measuring device |
| JP6504594B2 (en) * | 2014-11-10 | 2019-04-24 | 横河電機株式会社 | Coriolis mass flowmeter |
| US10275985B2 (en) * | 2015-12-11 | 2019-04-30 | Igt Canada Solutions Ulc | Enhanced electronic gaming machine with gaze-based dynamic advertising |
| JP6419296B2 (en) * | 2017-12-05 | 2018-11-07 | マイクロ モーション インコーポレイテッド | Coriolis type device for directly measuring the source and method for measuring the source directly |
| AU2018409822B2 (en) * | 2018-02-23 | 2021-09-09 | Micro Motion, Inc. | Dissolution monitoring method and apparatus |
| DE102019003075A1 (en) | 2019-04-30 | 2020-11-05 | Endress+Hauser Flowtec Ag | Measuring device for characterizing an inhomogeneous, flowable medium |
| US12313435B2 (en) * | 2020-03-31 | 2025-05-27 | Endress+Hauser Flowtec Ag | Method for operating a Coriolis measurement device |
Citations (2)
| Publication number | Priority date | Publication date | Assignee | Title |
|---|---|---|---|---|
| JPH0829229A (en) | 1994-07-11 | 1996-02-02 | Yokogawa Electric Corp | Coriolis mass flow meter |
| JP2002525623A (en) | 1998-09-30 | 2002-08-13 | マイクロ・モーション・インコーポレーテッド | Dealing with transient air bubbles in Coriolis flowmeters |
Family Cites Families (11)
| Publication number | Priority date | Publication date | Assignee | Title |
|---|---|---|---|---|
| JPH02221818A (en) * | 1989-02-21 | 1990-09-04 | Tokico Ltd | mass flow meter |
| US7404336B2 (en) * | 2000-03-23 | 2008-07-29 | Invensys Systems, Inc. | Correcting for two-phase flow in a digital flowmeter |
| MY124536A (en) * | 2000-03-14 | 2006-06-30 | Micro Motion Inc | Initialization algorithm for drive control in a coriolis flowmeter |
| JP2002062167A (en) * | 2000-08-21 | 2002-02-28 | Nitto Seiko Co Ltd | Flow measurement system |
| EP1889010B1 (en) * | 2005-05-20 | 2016-12-28 | Micro Motion, Inc. | Meter electronics and methods for rapidly determinig a mass fraction of a multi-phase fluid from a coriolis flow meter signal |
| KR101650317B1 (en) * | 2005-05-27 | 2016-08-24 | 마이크로 모우션, 인코포레이티드 | Methods and meter electronics for rapidly detecting a non-uniformity of a material flowing through a coriolis flowmeter |
| US7313488B2 (en) * | 2005-07-11 | 2007-12-25 | Invensys Systems, Inc. | Coriolis mode processing techniques |
| KR101206377B1 (en) | 2005-09-20 | 2012-11-29 | 마이크로 모우션, 인코포레이티드 | Meter electronics and methods for generating a drive signal for a vibratory flowmeter |
| US7779688B2 (en) * | 2006-12-20 | 2010-08-24 | Epson Toyocom Corporation | Vibration gyro sensor |
| US8448491B2 (en) * | 2007-05-03 | 2013-05-28 | Micro Motion, Inc. | Vibratory flow meter and method for correcting for an entrained phase in a two-phase flow of a flow material |
| BRPI0721690A2 (en) * | 2007-05-25 | 2013-01-15 | Micro Motion Inc | vibration flow meter, and gas correction method dragged on a fluid material in a vibration flow meter |
-
2009
- 2009-07-16 JP JP2009167684A patent/JP4962804B2/en not_active Expired - Fee Related
-
2010
- 2010-07-13 EP EP10169322.4A patent/EP2275787B1/en active Active
- 2010-07-14 US US12/836,098 patent/US8151653B2/en not_active Expired - Fee Related
- 2010-07-16 CN CN2010102325550A patent/CN101957222B/en not_active Expired - Fee Related
Patent Citations (2)
| Publication number | Priority date | Publication date | Assignee | Title |
|---|---|---|---|---|
| JPH0829229A (en) | 1994-07-11 | 1996-02-02 | Yokogawa Electric Corp | Coriolis mass flow meter |
| JP2002525623A (en) | 1998-09-30 | 2002-08-13 | マイクロ・モーション・インコーポレーテッド | Dealing with transient air bubbles in Coriolis flowmeters |
Cited By (11)
| Publication number | Priority date | Publication date | Assignee | Title |
|---|---|---|---|---|
| WO2015073013A1 (en) * | 2013-11-14 | 2015-05-21 | Micro Motion, Inc. | Coriolis direct wellhead measurement devices and methods |
| AU2013405149B2 (en) * | 2013-11-14 | 2017-03-09 | Micro Motion, Inc. | Coriolis direct wellhead measurement devices and methods |
| US10900348B2 (en) | 2013-11-14 | 2021-01-26 | Micro Motion, Inc. | Coriolis direct wellhead measurement devices and methods |
| WO2016140734A1 (en) * | 2015-03-04 | 2016-09-09 | Micro Motion, Inc. | Coriolis threshold determination devices and methods |
| CN107278266A (en) * | 2015-03-04 | 2017-10-20 | 高准公司 | Coriolis threshold determination apparatus and method |
| AU2016226588B2 (en) * | 2015-03-04 | 2018-03-22 | Micro Motion, Inc. | Coriolis threshold determination devices and methods |
| RU2664777C1 (en) * | 2015-03-04 | 2018-08-22 | Майкро Моушн, Инк. | Devices and methods for determining the coriolis threshold |
| CN107278266B (en) * | 2015-03-04 | 2019-12-17 | 高准公司 | Coriolis threshold determination apparatus and method |
| US10620027B2 (en) | 2015-03-04 | 2020-04-14 | Micro Motion, Inc. | Coriolis threshold determination devices and methods |
| WO2020244855A1 (en) * | 2019-06-05 | 2020-12-10 | Endress+Hauser Flowtec Ag | Measuring device for determining the density, the mass flow and/or the viscosity of a gas-charged liquid, processing system having such a measuring device, and method for monitoring a gas-charged liquid |
| US11933807B2 (en) | 2019-06-05 | 2024-03-19 | Endress+Hauser Flowtec Ag | Measuring device for determining the density, the mass flow and/or the viscosity of a gas-charged liquid, processing system having such a measuring device, and method for monitoring a gas-charged liquid |
Also Published As
| Publication number | Publication date |
|---|---|
| JP4962804B2 (en) | 2012-06-27 |
| EP2275787A3 (en) | 2014-02-19 |
| US8151653B2 (en) | 2012-04-10 |
| CN101957222B (en) | 2013-04-03 |
| JP2011022020A (en) | 2011-02-03 |
| CN101957222A (en) | 2011-01-26 |
| EP2275787B1 (en) | 2019-09-18 |
| US20110011186A1 (en) | 2011-01-20 |
Similar Documents
| Publication | Publication Date | Title |
|---|---|---|
| EP2275787B1 (en) | Coriolis flowmeter | |
| EP1051597B1 (en) | System for validating calibration of a coriolis flowmeter | |
| JP5497117B2 (en) | Method and instrument electronics for high-speed detection of non-uniformity of substances flowing in a Coriolis flow meter | |
| EP1568972B1 (en) | Flow rate processor for use in a doppler ultrasonic flowmeter | |
| JP4904289B2 (en) | Ultrasonic flow sensor using modulo 2pi residue tracking | |
| JP3219122B2 (en) | Coriolis mass flowmeter | |
| EP2362191B1 (en) | Signal processing method and signal processing apparatus for a vibration type density meter | |
| EP2287572B1 (en) | Signal processing method, signal processing device, and coriolis flowmeter | |
| US11788875B2 (en) | Measurement pickup for determining the mass flow rate of a liquid | |
| EP2597434A2 (en) | Signal processing method, signal processing apparatus, and Coriolis flowmeter | |
| EP2287571A1 (en) | Signal processing method, signal processing device, and coriolis flowmeter | |
| JP2008525818A (en) | Fast frequency and phase estimation for flowmeters | |
| RU2515129C1 (en) | Vortex flow meter | |
| JP2016090516A (en) | Coriolis mass flowmeter | |
| EP3351908B1 (en) | Field device and field device management system | |
| JP5482492B2 (en) | Coriolis mass flow meter | |
| JPH10260067A (en) | Vortex flow meter | |
| JP2004354280A (en) | Impulse line blockage detector and differential / pressure transmitter incorporating it |
Legal Events
| Date | Code | Title | Description |
|---|---|---|---|
| PUAI | Public reference made under article 153(3) epc to a published international application that has entered the european phase |
Free format text: ORIGINAL CODE: 0009012 |
|
| AK | Designated contracting states |
Kind code of ref document: A2 Designated state(s): AL AT BE BG CH CY CZ DE DK EE ES FI FR GB GR HR HU IE IS IT LI LT LU LV MC MK MT NL NO PL PT RO SE SI SK SM TR |
|
| AX | Request for extension of the european patent |
Extension state: BA ME RS |
|
| PUAL | Search report despatched |
Free format text: ORIGINAL CODE: 0009013 |
|
| AK | Designated contracting states |
Kind code of ref document: A3 Designated state(s): AL AT BE BG CH CY CZ DE DK EE ES FI FR GB GR HR HU IE IS IT LI LT LU LV MC MK MT NL NO PL PT RO SE SI SK SM TR |
|
| AX | Request for extension of the european patent |
Extension state: BA ME RS |
|
| RIC1 | Information provided on ipc code assigned before grant |
Ipc: G01F 1/74 20060101ALI20140114BHEP Ipc: G01F 1/84 20060101AFI20140114BHEP |
|
| 17P | Request for examination filed |
Effective date: 20140807 |
|
| RBV | Designated contracting states (corrected) |
Designated state(s): AL AT BE BG CH CY CZ DE DK EE ES FI FR GB GR HR HU IE IS IT LI LT LU LV MC MK MT NL NO PL PT RO SE SI SK SM TR |
|
| STAA | Information on the status of an ep patent application or granted ep patent |
Free format text: STATUS: EXAMINATION IS IN PROGRESS |
|
| 17Q | First examination report despatched |
Effective date: 20170310 |
|
| GRAP | Despatch of communication of intention to grant a patent |
Free format text: ORIGINAL CODE: EPIDOSNIGR1 |
|
| STAA | Information on the status of an ep patent application or granted ep patent |
Free format text: STATUS: GRANT OF PATENT IS INTENDED |
|
| INTG | Intention to grant announced |
Effective date: 20190411 |
|
| GRAS | Grant fee paid |
Free format text: ORIGINAL CODE: EPIDOSNIGR3 |
|
| GRAA | (expected) grant |
Free format text: ORIGINAL CODE: 0009210 |
|
| STAA | Information on the status of an ep patent application or granted ep patent |
Free format text: STATUS: THE PATENT HAS BEEN GRANTED |
|
| AK | Designated contracting states |
Kind code of ref document: B1 Designated state(s): AL AT BE BG CH CY CZ DE DK EE ES FI FR GB GR HR HU IE IS IT LI LT LU LV MC MK MT NL NO PL PT RO SE SI SK SM TR |
|
| REG | Reference to a national code |
Ref country code: GB Ref legal event code: FG4D |
|
| REG | Reference to a national code |
Ref country code: CH Ref legal event code: EP |
|
| REG | Reference to a national code |
Ref country code: DE Ref legal event code: R096 Ref document number: 602010061076 Country of ref document: DE |
|
| REG | Reference to a national code |
Ref country code: AT Ref legal event code: REF Ref document number: 1181881 Country of ref document: AT Kind code of ref document: T Effective date: 20191015 |
|
| REG | Reference to a national code |
Ref country code: IE Ref legal event code: FG4D |
|
| REG | Reference to a national code |
Ref country code: NL Ref legal event code: MP Effective date: 20190918 |
|
| PG25 | Lapsed in a contracting state [announced via postgrant information from national office to epo] |
Ref country code: FI Free format text: LAPSE BECAUSE OF FAILURE TO SUBMIT A TRANSLATION OF THE DESCRIPTION OR TO PAY THE FEE WITHIN THE PRESCRIBED TIME-LIMIT Effective date: 20190918 Ref country code: LT Free format text: LAPSE BECAUSE OF FAILURE TO SUBMIT A TRANSLATION OF THE DESCRIPTION OR TO PAY THE FEE WITHIN THE PRESCRIBED TIME-LIMIT Effective date: 20190918 Ref country code: BG Free format text: LAPSE BECAUSE OF FAILURE TO SUBMIT A TRANSLATION OF THE DESCRIPTION OR TO PAY THE FEE WITHIN THE PRESCRIBED TIME-LIMIT Effective date: 20191218 Ref country code: NO Free format text: LAPSE BECAUSE OF FAILURE TO SUBMIT A TRANSLATION OF THE DESCRIPTION OR TO PAY THE FEE WITHIN THE PRESCRIBED TIME-LIMIT Effective date: 20191218 Ref country code: HR Free format text: LAPSE BECAUSE OF FAILURE TO SUBMIT A TRANSLATION OF THE DESCRIPTION OR TO PAY THE FEE WITHIN THE PRESCRIBED TIME-LIMIT Effective date: 20190918 Ref country code: SE Free format text: LAPSE BECAUSE OF FAILURE TO SUBMIT A TRANSLATION OF THE DESCRIPTION OR TO PAY THE FEE WITHIN THE PRESCRIBED TIME-LIMIT Effective date: 20190918 |
|
| REG | Reference to a national code |
Ref country code: LT Ref legal event code: MG4D |
|
| PG25 | Lapsed in a contracting state [announced via postgrant information from national office to epo] |
Ref country code: AL Free format text: LAPSE BECAUSE OF FAILURE TO SUBMIT A TRANSLATION OF THE DESCRIPTION OR TO PAY THE FEE WITHIN THE PRESCRIBED TIME-LIMIT Effective date: 20190918 Ref country code: GR Free format text: LAPSE BECAUSE OF FAILURE TO SUBMIT A TRANSLATION OF THE DESCRIPTION OR TO PAY THE FEE WITHIN THE PRESCRIBED TIME-LIMIT Effective date: 20191219 Ref country code: LV Free format text: LAPSE BECAUSE OF FAILURE TO SUBMIT A TRANSLATION OF THE DESCRIPTION OR TO PAY THE FEE WITHIN THE PRESCRIBED TIME-LIMIT Effective date: 20190918 |
|
| REG | Reference to a national code |
Ref country code: AT Ref legal event code: MK05 Ref document number: 1181881 Country of ref document: AT Kind code of ref document: T Effective date: 20190918 |
|
| PG25 | Lapsed in a contracting state [announced via postgrant information from national office to epo] |
Ref country code: PL Free format text: LAPSE BECAUSE OF FAILURE TO SUBMIT A TRANSLATION OF THE DESCRIPTION OR TO PAY THE FEE WITHIN THE PRESCRIBED TIME-LIMIT Effective date: 20190918 Ref country code: EE Free format text: LAPSE BECAUSE OF FAILURE TO SUBMIT A TRANSLATION OF THE DESCRIPTION OR TO PAY THE FEE WITHIN THE PRESCRIBED TIME-LIMIT Effective date: 20190918 Ref country code: IT Free format text: LAPSE BECAUSE OF FAILURE TO SUBMIT A TRANSLATION OF THE DESCRIPTION OR TO PAY THE FEE WITHIN THE PRESCRIBED TIME-LIMIT Effective date: 20190918 Ref country code: AT Free format text: LAPSE BECAUSE OF FAILURE TO SUBMIT A TRANSLATION OF THE DESCRIPTION OR TO PAY THE FEE WITHIN THE PRESCRIBED TIME-LIMIT Effective date: 20190918 Ref country code: PT Free format text: LAPSE BECAUSE OF FAILURE TO SUBMIT A TRANSLATION OF THE DESCRIPTION OR TO PAY THE FEE WITHIN THE PRESCRIBED TIME-LIMIT Effective date: 20200120 Ref country code: RO Free format text: LAPSE BECAUSE OF FAILURE TO SUBMIT A TRANSLATION OF THE DESCRIPTION OR TO PAY THE FEE WITHIN THE PRESCRIBED TIME-LIMIT Effective date: 20190918 Ref country code: NL Free format text: LAPSE BECAUSE OF FAILURE TO SUBMIT A TRANSLATION OF THE DESCRIPTION OR TO PAY THE FEE WITHIN THE PRESCRIBED TIME-LIMIT Effective date: 20190918 Ref country code: ES Free format text: LAPSE BECAUSE OF FAILURE TO SUBMIT A TRANSLATION OF THE DESCRIPTION OR TO PAY THE FEE WITHIN THE PRESCRIBED TIME-LIMIT Effective date: 20190918 |
|
| PG25 | Lapsed in a contracting state [announced via postgrant information from national office to epo] |
Ref country code: SK Free format text: LAPSE BECAUSE OF FAILURE TO SUBMIT A TRANSLATION OF THE DESCRIPTION OR TO PAY THE FEE WITHIN THE PRESCRIBED TIME-LIMIT Effective date: 20190918 Ref country code: CZ Free format text: LAPSE BECAUSE OF FAILURE TO SUBMIT A TRANSLATION OF THE DESCRIPTION OR TO PAY THE FEE WITHIN THE PRESCRIBED TIME-LIMIT Effective date: 20190918 Ref country code: IS Free format text: LAPSE BECAUSE OF FAILURE TO SUBMIT A TRANSLATION OF THE DESCRIPTION OR TO PAY THE FEE WITHIN THE PRESCRIBED TIME-LIMIT Effective date: 20200224 Ref country code: SM Free format text: LAPSE BECAUSE OF FAILURE TO SUBMIT A TRANSLATION OF THE DESCRIPTION OR TO PAY THE FEE WITHIN THE PRESCRIBED TIME-LIMIT Effective date: 20190918 |
|
| REG | Reference to a national code |
Ref country code: DE Ref legal event code: R097 Ref document number: 602010061076 Country of ref document: DE |
|
| PLBE | No opposition filed within time limit |
Free format text: ORIGINAL CODE: 0009261 |
|
| STAA | Information on the status of an ep patent application or granted ep patent |
Free format text: STATUS: NO OPPOSITION FILED WITHIN TIME LIMIT |
|
| PG2D | Information on lapse in contracting state deleted |
Ref country code: IS |
|
| PG25 | Lapsed in a contracting state [announced via postgrant information from national office to epo] |
Ref country code: DK Free format text: LAPSE BECAUSE OF FAILURE TO SUBMIT A TRANSLATION OF THE DESCRIPTION OR TO PAY THE FEE WITHIN THE PRESCRIBED TIME-LIMIT Effective date: 20190918 Ref country code: IS Free format text: LAPSE BECAUSE OF FAILURE TO SUBMIT A TRANSLATION OF THE DESCRIPTION OR TO PAY THE FEE WITHIN THE PRESCRIBED TIME-LIMIT Effective date: 20200119 |
|
| 26N | No opposition filed |
Effective date: 20200619 |
|
| PG25 | Lapsed in a contracting state [announced via postgrant information from national office to epo] |
Ref country code: SI Free format text: LAPSE BECAUSE OF FAILURE TO SUBMIT A TRANSLATION OF THE DESCRIPTION OR TO PAY THE FEE WITHIN THE PRESCRIBED TIME-LIMIT Effective date: 20190918 |
|
| PG25 | Lapsed in a contracting state [announced via postgrant information from national office to epo] |
Ref country code: MC Free format text: LAPSE BECAUSE OF FAILURE TO SUBMIT A TRANSLATION OF THE DESCRIPTION OR TO PAY THE FEE WITHIN THE PRESCRIBED TIME-LIMIT Effective date: 20190918 |
|
| REG | Reference to a national code |
Ref country code: CH Ref legal event code: PL |
|
| GBPC | Gb: european patent ceased through non-payment of renewal fee |
Effective date: 20200713 |
|
| REG | Reference to a national code |
Ref country code: BE Ref legal event code: MM Effective date: 20200731 |
|
| PG25 | Lapsed in a contracting state [announced via postgrant information from national office to epo] |
Ref country code: LU Free format text: LAPSE BECAUSE OF NON-PAYMENT OF DUE FEES Effective date: 20200713 Ref country code: GB Free format text: LAPSE BECAUSE OF NON-PAYMENT OF DUE FEES Effective date: 20200713 Ref country code: FR Free format text: LAPSE BECAUSE OF NON-PAYMENT OF DUE FEES Effective date: 20200731 Ref country code: CH Free format text: LAPSE BECAUSE OF NON-PAYMENT OF DUE FEES Effective date: 20200731 Ref country code: LI Free format text: LAPSE BECAUSE OF NON-PAYMENT OF DUE FEES Effective date: 20200731 |
|
| PG25 | Lapsed in a contracting state [announced via postgrant information from national office to epo] |
Ref country code: BE Free format text: LAPSE BECAUSE OF NON-PAYMENT OF DUE FEES Effective date: 20200731 |
|
| PG25 | Lapsed in a contracting state [announced via postgrant information from national office to epo] |
Ref country code: IE Free format text: LAPSE BECAUSE OF NON-PAYMENT OF DUE FEES Effective date: 20200713 |
|
| PG25 | Lapsed in a contracting state [announced via postgrant information from national office to epo] |
Ref country code: TR Free format text: LAPSE BECAUSE OF FAILURE TO SUBMIT A TRANSLATION OF THE DESCRIPTION OR TO PAY THE FEE WITHIN THE PRESCRIBED TIME-LIMIT Effective date: 20190918 Ref country code: MT Free format text: LAPSE BECAUSE OF FAILURE TO SUBMIT A TRANSLATION OF THE DESCRIPTION OR TO PAY THE FEE WITHIN THE PRESCRIBED TIME-LIMIT Effective date: 20190918 Ref country code: CY Free format text: LAPSE BECAUSE OF FAILURE TO SUBMIT A TRANSLATION OF THE DESCRIPTION OR TO PAY THE FEE WITHIN THE PRESCRIBED TIME-LIMIT Effective date: 20190918 |
|
| PG25 | Lapsed in a contracting state [announced via postgrant information from national office to epo] |
Ref country code: MK Free format text: LAPSE BECAUSE OF FAILURE TO SUBMIT A TRANSLATION OF THE DESCRIPTION OR TO PAY THE FEE WITHIN THE PRESCRIBED TIME-LIMIT Effective date: 20190918 |
|
| P01 | Opt-out of the competence of the unified patent court (upc) registered |
Effective date: 20230603 |
|
| PGFP | Annual fee paid to national office [announced via postgrant information from national office to epo] |
Ref country code: DE Payment date: 20250620 Year of fee payment: 16 |