EP2267459A1 - Method for determining the susceptibility of a cell strain to drugs - Google Patents
Method for determining the susceptibility of a cell strain to drugs Download PDFInfo
- Publication number
- EP2267459A1 EP2267459A1 EP09305601A EP09305601A EP2267459A1 EP 2267459 A1 EP2267459 A1 EP 2267459A1 EP 09305601 A EP09305601 A EP 09305601A EP 09305601 A EP09305601 A EP 09305601A EP 2267459 A1 EP2267459 A1 EP 2267459A1
- Authority
- EP
- European Patent Office
- Prior art keywords
- strain
- compound
- cell strain
- candida
- mass spectrometry
- Prior art date
- Legal status (The legal status is an assumption and is not a legal conclusion. Google has not performed a legal analysis and makes no representation as to the accuracy of the status listed.)
- Withdrawn
Links
Images

Classifications
-
- G—PHYSICS
- G01—MEASURING; TESTING
- G01N—INVESTIGATING OR ANALYSING MATERIALS BY DETERMINING THEIR CHEMICAL OR PHYSICAL PROPERTIES
- G01N33/00—Investigating or analysing materials by specific methods not covered by groups G01N1/00 - G01N31/00
- G01N33/48—Biological material, e.g. blood, urine; Haemocytometers
- G01N33/50—Chemical analysis of biological material, e.g. blood, urine; Testing involving biospecific ligand binding methods; Immunological testing
- G01N33/68—Chemical analysis of biological material, e.g. blood, urine; Testing involving biospecific ligand binding methods; Immunological testing involving proteins, peptides or amino acids
- G01N33/6803—General methods of protein analysis not limited to specific proteins or families of proteins
- G01N33/6848—Methods of protein analysis involving mass spectrometry
-
- C—CHEMISTRY; METALLURGY
- C12—BIOCHEMISTRY; BEER; SPIRITS; WINE; VINEGAR; MICROBIOLOGY; ENZYMOLOGY; MUTATION OR GENETIC ENGINEERING
- C12Q—MEASURING OR TESTING PROCESSES INVOLVING ENZYMES, NUCLEIC ACIDS OR MICROORGANISMS; COMPOSITIONS OR TEST PAPERS THEREFOR; PROCESSES OF PREPARING SUCH COMPOSITIONS; CONDITION-RESPONSIVE CONTROL IN MICROBIOLOGICAL OR ENZYMOLOGICAL PROCESSES
- C12Q1/00—Measuring or testing processes involving enzymes, nucleic acids or microorganisms; Compositions therefor; Processes of preparing such compositions
- C12Q1/02—Measuring or testing processes involving enzymes, nucleic acids or microorganisms; Compositions therefor; Processes of preparing such compositions involving viable microorganisms
- C12Q1/025—Measuring or testing processes involving enzymes, nucleic acids or microorganisms; Compositions therefor; Processes of preparing such compositions involving viable microorganisms for testing or evaluating the effect of chemical or biological compounds, e.g. drugs, cosmetics
-
- G—PHYSICS
- G01—MEASURING; TESTING
- G01N—INVESTIGATING OR ANALYSING MATERIALS BY DETERMINING THEIR CHEMICAL OR PHYSICAL PROPERTIES
- G01N33/00—Investigating or analysing materials by specific methods not covered by groups G01N1/00 - G01N31/00
- G01N33/48—Biological material, e.g. blood, urine; Haemocytometers
- G01N33/50—Chemical analysis of biological material, e.g. blood, urine; Testing involving biospecific ligand binding methods; Immunological testing
- G01N33/5005—Chemical analysis of biological material, e.g. blood, urine; Testing involving biospecific ligand binding methods; Immunological testing involving human or animal cells
- G01N33/5008—Chemical analysis of biological material, e.g. blood, urine; Testing involving biospecific ligand binding methods; Immunological testing involving human or animal cells for testing or evaluating the effect of chemical or biological compounds, e.g. drugs, cosmetics
-
- G—PHYSICS
- G01—MEASURING; TESTING
- G01N—INVESTIGATING OR ANALYSING MATERIALS BY DETERMINING THEIR CHEMICAL OR PHYSICAL PROPERTIES
- G01N2560/00—Chemical aspects of mass spectrometric analysis of biological material
Definitions
- the present invention relates to a method for determining the susceptibility of a cell strain to a compound intended for controlling the growth of said cell strain.
- Candida albicans is the leading cause of invasive candidiasis, a major hospital-acquired infection.
- Fluconazole an azole derivative agent, is one of the main first-line therapy alternatives. Azole resistant strains have emerged, possibly as a consequence of the use of azole-based antifungal agents in iterative and long-term therapies.
- In vitro susceptibility testing is essential both for epidemiologic surveillance, e.g . to detect the emergence of resistant-microorganisms, and to adapt therapy for a given patient.
- Susceptibility of cell strains to drugs is usually determined following the well-known broth microdilution methods as gold standards tests. These methods are based on growth inhibition and involve the determination of the Minimal Inhibitory Concentration (MIC). Such methods are notably recommended by the European Committee on Antibiotic Susceptibility Testing (EUCAST) and the Clinical Laboratory Standards Institute (CLSI) ( Rodriguez-Tudela. et al. J Clin Microbiol 45, 109-111 (2007 ); Espinel-Ingroff et al. J Clin Microbiol 43, 3884-3889 (2005 )).
- EUCAST European Committee on Antibiotic Susceptibility Testing
- CLSI Clinical Laboratory Standards Institute
- the MIC endpoint is determined as the drug concentration inducing a 50% growth inhibition (IC 50 ) with respect to the control as measured after 24h of growth with a spectrophotometer.
- IC 50 50% growth inhibition
- CLSI CLSI
- MIC endpoints are defined visually as the point at which there is prominent reduction in growth in the sample as compared to the control, after 48 h of incubation. This visual end-point correlates with 50% growth inhibition ( Rex et al. Clin Microbiol Rev 14, 643-658 (2001 )).
- the present invention arises from the unexpected finding, by the inventors, that the protein composition of a C. albicans strain changes reproducibly in response to a particular drug concentration to which it is subjected, and that this variation in protein composition can be evidenced by mass spectrometry. Besides, the inventors have also shown that the values obtained for the minimal concentration of drug inducing a detectable change in mass spectrometry spectra of a protein extract of C . albicans with respect to that determined for C. albicans.
- the present invention thus relates to a method for determining the susceptibility of a cell strain to a compound intended for controlling the growth of said cell strain, comprising:
- the expression "cell strain” relates to any kind of eukaryotic or prokaryotic cell strain.
- the cell strain is an eukaryotic cell strain it can be from a pluricellular or an unicellular organism.
- the unicellular organism can notably such that it develops into a pluricellular organism.
- the cell strain is a tumour cell strain or a microorganism strain.
- the cell strain is a microorganism strain selected from the group constituted of a bacterial strain, a fungus strain, such as a filamentous fungus, in particular of the Ascomycota ( e.g.
- the cell strain is a yeast strain, in particular selected from group consisting of a Candida strain, a Saccharomyces strain, a Debaryomyces strain, a Pichia strain, a Geotrichum strain, a Cryptococcus strain, a Fisiobasidiella strain, and a Trichosporon strain.
- the cell strain is a Candida strain.
- the cell strain is a Candida strain selected from a Candida albicans strain, a Candida glabrata strain, a Candida tropicalis strain, a Candida parapsilosis strain, a Candida kefyr strain, a Candida krusei strain, a Candida dubliniensis strain, a Candida guillermondii strain and a Candida lusitaniae strain, and particularly preferred that the cell strain is a Candida albicans strain.
- the term "compound for controlling the growth of said cell strain” relates to a compound liable to kill cells of the cell strain or to inhibit, partially or totally, the growth of cells of the cell strain.
- the compound may notably be an anti-tumour compound, an antibiotic or antibacterial compound, or an antifungal compound.
- the compound is an antifungal compound selected from an azole compound, an echinochandin compound, such as caspofungin, micafungin, or anidulafungin, a polyene compound, such as amphotericin B or nystatin, and anti-metabolites, such as flucytosine.
- the antifungal compound is an azole compound selected from the group constituted of fluconazole, voriconazole, posaconazole, isavuconazole, ravuconazole, ketoconazole, and itraconazole. Most preferably the compound is fluconazole.
- determining the susceptibility of a cell strain relates to determining whether, and within what measure, the compound as defined above kills or inhibits the growth of cells of the cell strain.
- determining the susceptibility of a cell strain relates to determining the minimal concentration of the compound which yields a detectable difference in the mass spectrometry spectra.
- mass spectrometry relates to any method enabling determining the m/z ratio of one or more molecules, such as proteins, within a sample, such as a protein extract as defined above, wherein m represents the mass and z the charge of said molecules.
- Mass spectrometry as defined above can be carried out by any one of the numerous mass spectrometry methods known in the art, such as Matrix-Assisted Laser Desorption/Ionisation Time-Of-Flight (MALDI-TOF) mass spectrometry, or Surface-Enhanced Laser Desorption/lonisation Time-Of-Flight (SELDI-TOF).
- MALDI-TOF Matrix-Assisted Laser Desorption/Ionisation Time-Of-Flight
- SELDI-TOF Surface-Enhanced Laser Desorption/lonisation Time-Of-Flight
- mass spectrometry spectra relate to recordings of the m/z ratios and optionally the quantities of the various molecules, in particular proteins, contained in the protein extracts submitted to mass spectrometry.
- mass spectrometry spectra are graphs representing signal intensity (corresponding to the quantity of molecule) as a function of the m/z ratio. The association of signal intensity to an m/z ratio defines a peak.
- a mass spectrometry spectrum as intended herein can be either obtained from one recording or be the mean of a plurality of recordings.
- mass spectrometry spectra are detectably different" in particular if a detectable difference in intensity of m/z ratio can be established.
- the man skilled in the art knows how to establish that two spectra present detectable differences, in particular using exact permutation tests based on Spearman rank correlation coefficients, such as described in " Design and Analysis of DNA Microarray Investigations", RM Simon et al, SPRINGER, 2003, in particular on pages 68 and 123 .
- the protein extract is obtained by an ethanol treatment of grown cells followed by a treatment with a mixture of formic acid and acetonitrile, in particular where the cell strain is a yeast strain, more particularly a Candida strain.
- the expression "culture medium” relates to any medium liable to sustain the growth of cells of the cell strain.
- the culture medium as defined above is a minimum medium.
- the medium is a liquid medium.
- the composition of the compound-free culture medium and the culture medium comprising the compound at a test concentration should preferably identical except for said compound.
- the cell strain can be grown for any amount of time provided it is sufficient for the compound to induce significant changes in the protein content of the cell strain. However, so that the method is carried out as quickly as possible, it is preferred that the amount of time for growing the cells is the minimal time for the compound to induce significant changes in the protein content of the cell strain. Thus, the cell strain is grown during less than 24 hours, more preferably during less than 20 hours, and most preferably during about 15 hours.
- the cell strain is grown in several culture media with increasing test concentrations of the compound, and the minimal concentration of the compound yielding a mass-spectrometry spectrum detectably different from the mass-spectrometry spectrum obtained from the cell-extract of the microorganism strain grown in the compound-free culture medium is determined.
- the "minimal concentration of the compound yielding a mass-spectrometry spectrum significantly different from the mass-spectrometry spectrum obtained from the cell-extract of the microorganism strain grown in the compound-free culture medium” is also called the minimal profile (i.e. mass spectrometry spectrum) change concentration (MPCC).
- MPCC mass spectrometry spectrum change concentration
- determining the minimal concentration comprises:
- Determining that a mass spectrometry spectrum presents more similarity, or shares more resemblance, with a first spectrum than with a second spectrum can be routinely determined by one of skill in the art, in particular using a similarity measure based on Spearman rank correlation coefficients, and more particularly as described in the following Examples.
- Fluconazole (FCZ) pure powder (Sigma Chemical CO., Saint-Louis, MO, USA) was dissolved in pure water. Serial dilutions of drug (concentration ranged from 256 to 0.25 ⁇ g/ml), made into RPMI 1640 medium (with glutamine and without bicarbonate, Invitrogen) buffered with MOPS (0.165M) (Sigma Chemical CO., Saint-Louis, MO, USA) and adjusted to pH 7 with sodium hydroxide (5N), were dispensed in 600 ⁇ l aliquots into sterile 24-well flat-bottomed microtiter plates.
- yeasts cells were transferred into RPMI 1640 medium (with glutamine but without bicarbonate, Invitrogen) buffered with MOPS (0.165M) (Sigma Chemical CO., Saint-Louis, MO, USA), and adjusted to pH 7 with sodium hydroxide (5N). Then, 600 ⁇ l of RPMI with yeast (2.106 yeasts/ml) were added to 600 ⁇ l of RPMI with FCZ into microtiter plates (final FCZ concentration ranged from 128 to 0.125 ⁇ g/ml), or in RPMI alone as negative control. Culture was performed in a 30°C incubator for 15 hours, with continuous agitation. Yeast extraction was performed as follows:
- the supernatant was distributed (0.5 ⁇ l droplet) in duplicate on a MALDI AnchorChip sample slide (Bruker-Daltonics, Bremen, Germany), then air-dried.
- the ⁇ -cyano-4-hydroxycinnamic acid (CHCA) matrix (Bruker-Daltonics), prepared at a concentration of 50 mg/ml in 50% acetonitrile and 50% water with 0.1% TFA, was sonicated for 5 min before being spotted (0.5 ⁇ l) over the dried sample.
- a DH5a Escherichia coli protein extract (Bruker-Daltonics) was deposited on the calibration spot of the Anchorchip for external calibration.
- MALDI analysis were performed on a Bruker Autoflex I MALDI TOF mass spectrometer with a nitrogen laser (337 nm) operating in linear mode with delayed extraction (260 ns) at 20 kV accelerating voltage. Each spectrum was automatically collected in the positive ion mode as an average of 500 laser shots (50 laser shots at 10 different spot positions). Laser energy was set just above the threshold for ion production. Mass range between 3,000 and 20,000 m/z (ratio mass/charge) was selected to collect the signals with the AutoXecute tool of flexControl acquisition software (Version 2.4; Bruker-Daltonics). Only peaks with a signal/noise ratio >3 were considered. Spectra were eligible for further analysis when the peaks had a resolution better than 600. For each cultivation condition, we collected mass spectra from 3 biological replicates and 2 technical replicates.
- the mean spectrum of the 72 spots was computed, a simple peak detection algorithm was run on the mean spectrum, and a selection of the final peak locations was based on the mean intensity of the peak. For each spectrum, the peaks corresponding to the final peak locations were retained for the statistical analysis. An error of 0.05 % of the mass/charge ratio was allowed in the two last steps.
- the test criterion is the ratio InterRCCM/IntraRCCM Under the null hypothesis of no difference between class memberships, the criterion's expected value is 1. When class memberships are informative, interRCCM is lower than intraRCCM, and expected criterion values are lower than 1.
- the permutation test is achieved by computing the distribution of the criterion for all the permutations of the class memberships, and the exact p-value is the proportion of criteria lower or equal to the one corresponding to the observed criterion value.
- the aim of the next step is to find the minimal concentration at which a particular spectrum starts to differ significantly from the null control spectrum one. This is achieved by computing for each concentration, the corresponding spectrum similarity with each from the two extreme concentrations, and by classifying it as "near of the null concentration” or "near of the maximum concentration” according to the similarity values.
- the similarity function used is the mean inter-class rank correlation coefficient (InterRCCM).
- the minimal profile change concentration (MPCC) is defined as the minimum concentration that is more similar to the maximum concentration than to the null one.
- FCZ cardiac dilution from 128 to 0.125 ⁇ g/ml
- the spectra deviate from the control in a detectable and quantifiable manner (through gain or loss of spectra) in the cultures exposed to 4 ⁇ g/ml and upwards ( Fig. 2 and 3 ).
- MPCC minimal profile change concentration
- Methods which is based on the mass and intensity of each peak in the fingerprints.
- the discrepancies between the mass spectra at the two extreme conditions (128 ⁇ g/ml FCZ and no FCZ) are first defined.
- the similarity to each of the two "extreme” spectra is statistically evaluated for the spectrum recorded at each of the different intermediate FCZ concentrations, to yield a classification of "nearer to the 128 ⁇ g/ml" or "nearer to the FCZ negative" spectrum.
- Eight are known to have low-MICs (range 0.125 to 8 ⁇ g/ml) and the other eight have high-MICs (range 16 to 128 ⁇ g/ml) to FCZ, these MICs having been determined by the CLSI standard method.
- the FCZ-resistant strains tested are representative of the different resistance mechanisms, mating types and clades15 that are found in C. albicans (Table 1) .
- the MPCC determinations were concordant and accurate irrespective of the type of drug resistance mechanism ( ERG11 mutations, TAC mutation, CDR1 / 2 or MDR hyper-expression), the mating type, or the clade to which the different strains tested belonged.
- the running costs for each sample analyzed by the method presented here is slightly less than 1 Euro, which compares quite favourably with the higher costs of all other methods.
- the diagnostic profile shift observed for FCZ does not vary with either the genetic background of the strain tested, nor the level or mechanism of the resistance to FCZ. Accordingly, it is likely that a characteristic profile would be associated with each of the different classes of drugs known to inhibit a given pathogen (e.g . triazoles echinocandins, polyene, and antimetabolites for C. albicans ).
- the present methodology appears to be suitable for monitoring the emergence of resistance to drugs used against pathogenic organisms, including bacteria and eukaryotic cancer cells or pathogens such as Cryptosporidium and Plasmodium.
Landscapes
- Health & Medical Sciences (AREA)
- Life Sciences & Earth Sciences (AREA)
- Engineering & Computer Science (AREA)
- Chemical & Material Sciences (AREA)
- Molecular Biology (AREA)
- Immunology (AREA)
- Bioinformatics & Cheminformatics (AREA)
- Biomedical Technology (AREA)
- Physics & Mathematics (AREA)
- Urology & Nephrology (AREA)
- Hematology (AREA)
- Medicinal Chemistry (AREA)
- Biotechnology (AREA)
- Microbiology (AREA)
- Proteomics, Peptides & Aminoacids (AREA)
- Organic Chemistry (AREA)
- Analytical Chemistry (AREA)
- General Health & Medical Sciences (AREA)
- Biochemistry (AREA)
- Wood Science & Technology (AREA)
- Pathology (AREA)
- Bioinformatics & Computational Biology (AREA)
- Zoology (AREA)
- General Physics & Mathematics (AREA)
- Cell Biology (AREA)
- Biophysics (AREA)
- Toxicology (AREA)
- Food Science & Technology (AREA)
- Tropical Medicine & Parasitology (AREA)
- General Engineering & Computer Science (AREA)
- Genetics & Genomics (AREA)
- Spectroscopy & Molecular Physics (AREA)
- Other Investigation Or Analysis Of Materials By Electrical Means (AREA)
- Measuring Or Testing Involving Enzymes Or Micro-Organisms (AREA)
Abstract
The present invention relates to a method for determining the susceptibility of a cell strain to a compound intended for controlling the growth of said cell strain, comprising:
- growing the cell strain in a first compound-free culture medium and in at least a second culture medium comprising the compound at a test concentration;
- obtaining mass-spectrometry spectra for a protein extract of the cell strain grown in the first culture medium and for a protein extract of the cell strain grown in the second culture medium;
- comparing the mass spectrometry spectra;
- deducing that the cell strain is sensitive to the compound at the test concentration if the mass spectrometry spectra are significantly different.
- growing the cell strain in a first compound-free culture medium and in at least a second culture medium comprising the compound at a test concentration;
- obtaining mass-spectrometry spectra for a protein extract of the cell strain grown in the first culture medium and for a protein extract of the cell strain grown in the second culture medium;
- comparing the mass spectrometry spectra;
- deducing that the cell strain is sensitive to the compound at the test concentration if the mass spectrometry spectra are significantly different.
Description
- The present invention relates to a method for determining the susceptibility of a cell strain to a compound intended for controlling the growth of said cell strain.
- Testing the susceptibility of cell strains, such as tumour cell strains or microorganism strains, to drugs is a crude challenge, in particular in view of the increasing prevalence of drug resistance.
- Indeed, besides cancer cells, resistances to drugs have notably been evidenced in bacteria, protozoan parasites, and fungi, such as yeasts and filamentous fungi. This has notably been evidenced in the case of the determination of the susceptibility of Candida albicans to fluconazole (FCZ). Candida albicans is the leading cause of invasive candidiasis, a major hospital-acquired infection. Fluconazole, an azole derivative agent, is one of the main first-line therapy alternatives. Azole resistant strains have emerged, possibly as a consequence of the use of azole-based antifungal agents in iterative and long-term therapies.
- In vitro susceptibility testing is essential both for epidemiologic surveillance, e.g. to detect the emergence of resistant-microorganisms, and to adapt therapy for a given patient.
- Susceptibility of cell strains to drugs is usually determined following the well-known broth microdilution methods as gold standards tests. These methods are based on growth inhibition and involve the determination of the Minimal Inhibitory Concentration (MIC). Such methods are notably recommended by the European Committee on Antibiotic Susceptibility Testing (EUCAST) and the Clinical Laboratory Standards Institute (CLSI) (Rodriguez-Tudela. et al. J Clin Microbiol 45, 109-111 (2007); Espinel-Ingroff et al. J Clin Microbiol 43, 3884-3889 (2005)).
- For the EUCAST methodology, the MIC endpoint is determined as the drug concentration inducing a 50% growth inhibition (IC50) with respect to the control as measured after 24h of growth with a spectrophotometer. For the CLSI methodology, MIC endpoints are defined visually as the point at which there is prominent reduction in growth in the sample as compared to the control, after 48 h of incubation. This visual end-point correlates with 50% growth inhibition (Rex et al. Clin Microbiol Rev 14, 643-658 (2001)).
- Both reference methods are robust and reliable, though they remain time-consuming and thus inadequate for routine determination in an hospital context (Revankar et al. J Clin Microbiol 36, 153-156 (1998) ; Lass-Florl et al. Antimicrob Agents Chemother 52, 3637-3641 (2008)).
- Thus, to circumvent this drawback, some commercial assays such as the E-Test (AB-Biodisk) or YeastOne Panel (Trek Diagnostic) have been proposed that can be used widely and easily in clinical microbiology labs. They have been favourably compared with the reference methods. However, they still remain quite long to carry out and reading of the assays may be particularly difficult. This is particularly the case when testing C. albicans isolates against fluconazole, since it frequently leads to a trailing phenomenon, defined by a paradoxical low-level growing of the isolates even over increasing concentrations of the drug. More recently, this so-called paradoxical effect has also been described for some Candida isolates when tested against ecchinocandin drugs.
- Given these limitations, there is a clear need for the development of an equally robust method, with faster turn-around times and where endpoints determination is objective.
- It is therefore an object of the present invention to provide such a method.
- The present invention arises from the unexpected finding, by the inventors, that the protein composition of a C. albicans strain changes reproducibly in response to a particular drug concentration to which it is subjected, and that this variation in protein composition can be evidenced by mass spectrometry. Besides, the inventors have also shown that the values obtained for the minimal concentration of drug inducing a detectable change in mass spectrometry spectra of a protein extract of C. albicans with respect to that determined for C. albicans.
- The present invention thus relates to a method for determining the susceptibility of a cell strain to a compound intended for controlling the growth of said cell strain, comprising:
- growing the cell strain in a first compound-free culture medium and in at least a second culture medium comprising the compound at a test concentration;
- obtaining mass-spectrometry spectra for a protein extract of the cell strain grown in the first culture medium and for a protein extract of the cell strain grown in the second culture medium;
- comparing the mass spectrometry spectra;
- deducing that the cell strain is sensitive to the compound at the test concentration if the mass spectrometry spectra are detectably different.
- As intended herein, the expression "cell strain" relates to any kind of eukaryotic or prokaryotic cell strain. In particular, where the cell strain is an eukaryotic cell strain it can be from a pluricellular or an unicellular organism. As will be clear to one of skill in the art, the unicellular organism can notably such that it develops into a pluricellular organism. Preferably, the cell strain is a tumour cell strain or a microorganism strain. Preferably, the cell strain is a microorganism strain selected from the group constituted of a bacterial strain, a fungus strain, such as a filamentous fungus, in particular of the Ascomycota (e.g. of the Aspergillus or Fusarium genus) and Zygomycota phyla, or a yeast strain, in particular of the Ascomycota and Basiodiomycota phyla, a protozoan strain, and an algae strain. More preferably, the cell strain is a yeast strain, in particular selected from group consisting of a Candida strain, a Saccharomyces strain, a Debaryomyces strain, a Pichia strain, a Geotrichum strain, a Cryptococcus strain, a Fisiobasidiella strain, and a Trichosporon strain. Most preferably the cell strain is a Candida strain. Besides, among yeasts of the Candida genus, it is preferred that the cell strain is a Candida strain selected from a Candida albicans strain, a Candida glabrata strain, a Candida tropicalis strain, a Candida parapsilosis strain, a Candida kefyr strain, a Candida krusei strain, a Candida dubliniensis strain, a Candida guillermondii strain and a Candida lusitaniae strain, and particularly preferred that the cell strain is a Candida albicans strain.
- As intended herein, the term "compound for controlling the growth of said cell strain" relates to a compound liable to kill cells of the cell strain or to inhibit, partially or totally, the growth of cells of the cell strain. Thus, the compound may notably be an anti-tumour compound, an antibiotic or antibacterial compound, or an antifungal compound. However, it is preferred that the compound is an antifungal compound selected from an azole compound, an echinochandin compound, such as caspofungin, micafungin, or anidulafungin, a polyene compound, such as amphotericin B or nystatin, and anti-metabolites, such as flucytosine. Preferably, the antifungal compound is an azole compound selected from the group constituted of fluconazole, voriconazole, posaconazole, isavuconazole, ravuconazole, ketoconazole, and itraconazole. Most preferably the compound is fluconazole.
- As intended herein the expression "determining the susceptibility of a cell strain" relates to determining whether, and within what measure, the compound as defined above kills or inhibits the growth of cells of the cell strain. In particular, "determining the susceptibility of a cell strain" relates to determining the minimal concentration of the compound which yields a detectable difference in the mass spectrometry spectra.
- As intended herein, "mass spectrometry" relates to any method enabling determining the m/z ratio of one or more molecules, such as proteins, within a sample, such as a protein extract as defined above, wherein m represents the mass and z the charge of said molecules. Mass spectrometry as defined above can be carried out by any one of the numerous mass spectrometry methods known in the art, such as Matrix-Assisted Laser Desorption/Ionisation Time-Of-Flight (MALDI-TOF) mass spectrometry, or Surface-Enhanced Laser Desorption/lonisation Time-Of-Flight (SELDI-TOF). However, it preferred that mass spectrometry as defined above is carried out by MALDI-TOF.
- The expression "mass spectrometry spectra" relate to recordings of the m/z ratios and optionally the quantities of the various molecules, in particular proteins, contained in the protein extracts submitted to mass spectrometry. Usually, mass spectrometry spectra are graphs representing signal intensity (corresponding to the quantity of molecule) as a function of the m/z ratio. The association of signal intensity to an m/z ratio defines a peak. As will be clear to one of skill in the art "a mass spectrometry spectrum" as intended herein can be either obtained from one recording or be the mean of a plurality of recordings.
- As intended herein, "mass spectrometry spectra are detectably different" in particular if a detectable difference in intensity of m/z ratio can be established. The man skilled in the art knows how to establish that two spectra present detectable differences, in particular using exact permutation tests based on Spearman rank correlation coefficients, such as described in "Design and Analysis of DNA Microarray Investigations", RM Simon et al, SPRINGER, 2003, in particular on pages 68 and 123.
- Numerous procedures are known in the art for extracting proteins from cells and one of skill in the art knows how to adapt them depending on the type of cell strain. Accordingly, any one of these extraction methods can be used in the method of the invention. However, it is preferred, within the frame of the method according to the invention, that the protein extract is obtained by an ethanol treatment of grown cells followed by a treatment with a mixture of formic acid and acetonitrile, in particular where the cell strain is a yeast strain, more particularly a Candida strain.
- As intended herein, the expression "culture medium" relates to any medium liable to sustain the growth of cells of the cell strain. Preferably, the culture medium as defined above is a minimum medium. Preferably also, the medium is a liquid medium. As will be clear to one of skill in the art, the composition of the compound-free culture medium and the culture medium comprising the compound at a test concentration should preferably identical except for said compound.
- The cell strain can be grown for any amount of time provided it is sufficient for the compound to induce significant changes in the protein content of the cell strain. However, so that the method is carried out as quickly as possible, it is preferred that the amount of time for growing the cells is the minimal time for the compound to induce significant changes in the protein content of the cell strain. Thus, the cell strain is grown during less than 24 hours, more preferably during less than 20 hours, and most preferably during about 15 hours.
- In an embodiment of the above-defined method, the cell strain is grown in several culture media with increasing test concentrations of the compound, and the minimal concentration of the compound yielding a mass-spectrometry spectrum detectably different from the mass-spectrometry spectrum obtained from the cell-extract of the microorganism strain grown in the compound-free culture medium is determined.
- As intended herein the "minimal concentration of the compound yielding a mass-spectrometry spectrum significantly different from the mass-spectrometry spectrum obtained from the cell-extract of the microorganism strain grown in the compound-free culture medium" is also called the minimal profile (i.e. mass spectrometry spectrum) change concentration (MPCC). Advantageously, the inventors have shown that for a given cell strain and compound the MPCC and the MIC are correlated.
- Preferably, determining the minimal concentration comprises:
- obtaining a mass spectrometry spectrum from a protein extract of the cell strain grown in the culture medium having the highest test concentration of the several culture media;
- comparing the mass spectrometry spectra obtained from protein extracts of the several culture media to (i) the mass spectrometry spectrum from a protein extract of the cell strain grown in the culture medium having the highest test concentration and (ii) the mass spectrometry spectrum from the compound-free culture medium;
- selecting the mass spectrometry spectrum obtained from a protein extract of the several culture media with the lowest compound concentration and which presents more similarity with the mass spectrometry spectrum (i) than with the mass spectrometry spectrum (ii);
- Determining that a mass spectrometry spectrum presents more similarity, or shares more resemblance, with a first spectrum than with a second spectrum can be routinely determined by one of skill in the art, in particular using a similarity measure based on Spearman rank correlation coefficients, and more particularly as described in the following Examples.
- The invention will be further described by the following non-limiting figures and Examples.
-
-
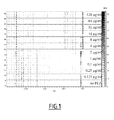
Figure 1 represents alterations in the mass spectra of the DSY2260 C. albicans strain exposed to increasing fluconazole (FCZ) concentrations (virtual gel). The x-axis represents m/z value, on the left the y-axis shows running spectrum number, while on the right peak intensity is expressed in a grey colour scale with arbitrary units (a.u.). Briefly, 106 yeasts/ml were cultured for 15h, with three biological replicates for each FCZ concentration (from 128 to 0.125 µg/ml) and for unexposed yeasts. Acidic extracts were analysed in duplicate by MALDI-TOF MS. -
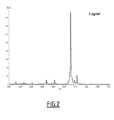
Figures 2 and3 represent the average mass spectra of the 6 replicate spectra of DSY2260 C. albicans exposed to 2 µg/ml of FCZ (figure 2 ) and4 µg/ml of FCZ (figure 3 ) (mass range 5800-7600 m/z). -
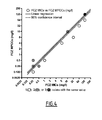
Figure 4 represents the correlation between MICs evaluated by the CLSI methodology and MPCCs determined by a MALDI-TOF MS method according to the invention (regression line). - All experiments were performed using sequential Candida albicans clinical isolates. Eight groups of sequential related isolates (groups A to K) were characterized. All strains were isolated from HIV-positive patients with oropharyngeal candidasis that were treated mainly with FCZ. Each group contains one azole susceptible strain (FCZ MIC ranged from 0.125 to 8 µg/ml) and its related-sequential strains with higher FCZ MICs (ranging from 16 to 128 µg/ml) within the same MLST genotype. For each clinical isolate, MICs according to CLSI broth-microdilution methodology1, and presence of ERG11 and TAC mutations, and/or CDR1/2 and MDR hyperexpression were determined previously2 (Table 1). The ATCC 90028 C. albicans strain (MIC=0.25 µg/ml) was added as a reference strain.
- Fluconazole (FCZ) pure powder (Sigma Chemical CO., Saint-Louis, MO, USA) was dissolved in pure water. Serial dilutions of drug (concentration ranged from 256 to 0.25 µg/ml), made into RPMI 1640 medium (with glutamine and without bicarbonate, Invitrogen) buffered with MOPS (0.165M) (Sigma Chemical CO., Saint-Louis, MO, USA) and adjusted to pH 7 with sodium hydroxide (5N), were dispensed in 600 µl aliquots into sterile 24-well flat-bottomed microtiter plates.
- After cultivation during 48h at 37°C on Sabouraud agar medium, yeasts cells were transferred into RPMI 1640 medium (with glutamine but without bicarbonate, Invitrogen) buffered with MOPS (0.165M) (Sigma Chemical CO., Saint-Louis, MO, USA), and adjusted to pH 7 with sodium hydroxide (5N). Then, 600 µl of RPMI with yeast (2.106 yeasts/ml) were added to 600 µl of RPMI with FCZ into microtiter plates (final FCZ concentration ranged from 128 to 0.125 µg/ml), or in RPMI alone as negative control. Culture was performed in a 30°C incubator for 15 hours, with continuous agitation. Yeast extraction was performed as follows:
- (1) samples were centrifuged and the supernatant removed before the pellet was washed twice in pure water;
- (2) the pellet was then resuspended in 300 µL of pure water, and 900 µL of ethanol were then added;
- (3) after another round of centrifugation, 50 µL of 70% formic acid and 50 µL pure acetonitrile were added to the residual pellet and subsequent solution was repeatedly and thoroughly vortexed before a final centrifugation.
- The supernatant was distributed (0.5 µl droplet) in duplicate on a MALDI AnchorChip sample slide (Bruker-Daltonics, Bremen, Germany), then air-dried. The α-cyano-4-hydroxycinnamic acid (CHCA) matrix (Bruker-Daltonics), prepared at a concentration of 50 mg/ml in 50% acetonitrile and 50% water with 0.1% TFA, was sonicated for 5 min before being spotted (0.5 µl) over the dried sample. A DH5a Escherichia coli protein extract (Bruker-Daltonics) was deposited on the calibration spot of the Anchorchip for external calibration. MALDI analysis were performed on a Bruker Autoflex I MALDI TOF mass spectrometer with a nitrogen laser (337 nm) operating in linear mode with delayed extraction (260 ns) at 20 kV accelerating voltage. Each spectrum was automatically collected in the positive ion mode as an average of 500 laser shots (50 laser shots at 10 different spot positions). Laser energy was set just above the threshold for ion production. Mass range between 3,000 and 20,000 m/z (ratio mass/charge) was selected to collect the signals with the AutoXecute tool of flexControl acquisition software (Version 2.4; Bruker-Daltonics). Only peaks with a signal/noise ratio >3 were considered. Spectra were eligible for further analysis when the peaks had a resolution better than 600. For each cultivation condition, we collected mass spectra from 3 biological replicates and 2 technical replicates.
- Data obtained from the flex control acquisition software were a set of lists of mass/charge peaks and corresponding intensities, one list for each spectrum. For each FCZ concentration (11 FCZ concentrations and without FCZ), 6 spectra, obtained from 3 biological replicates tested in duplicate, were collected, so the whole initial set of data consisted of 72 spectra.
- Alignment was performed using a method based on the mean spectrum, using an approach similar to that recommended by Coombes et al. (Coombes KR, Baggerly KA, and Morris JS: Pre-Processing Mass Spectrometry Data. Fundamentals of Data Mining in Genomics and Proteomics, W Dubitzky, M Granzow, and D Berrar, eds. Kluwer, Boston, 79-99 (2007)).
- The mean spectrum of the 72 spots was computed, a simple peak detection algorithm was run on the mean spectrum, and a selection of the final peak locations was based on the mean intensity of the peak. For each spectrum, the peaks corresponding to the final peak locations were retained for the statistical analysis. An error of 0.05 % of the mass/charge ratio was allowed in the two last steps.
- At this stage, data consisted of 12 ordered subsets of 6 spectra, each subset corresponding to a concentration value, from 0 to 128 µg/ml. The first step of statistical analysis was aimed at testing whether there was a difference between the extreme concentration spectra.
- An exact permutation test using Spearman rank correlation coefficient as a similar measure, based on the following computations, has been carried out:
- in a first step, all the rank correlation coefficients between the 12 spectra were computed;
- in a second step, the mean of the intra-class rank correlations coefficients (IntraRCCM) and the mean of the inter-class rank correlation coefficients (InterRCCM) were computed.
- The test criterion is the ratio InterRCCM/IntraRCCM Under the null hypothesis of no difference between class memberships, the criterion's expected value is 1. When class memberships are informative, interRCCM is lower than intraRCCM, and expected criterion values are lower than 1. The permutation test is achieved by computing the distribution of the criterion for all the permutations of the class memberships, and the exact p-value is the proportion of criteria lower or equal to the one corresponding to the observed criterion value.
- Once the difference between extreme concentrations has been statistically proved, the aim of the next step is to find the minimal concentration at which a particular spectrum starts to differ significantly from the null control spectrum one. This is achieved by computing for each concentration, the corresponding spectrum similarity with each from the two extreme concentrations, and by classifying it as "near of the null concentration" or "near of the maximum concentration" according to the similarity values. The similarity function used is the mean inter-class rank correlation coefficient (InterRCCM). The minimal profile change concentration (MPCC) is defined as the minimum concentration that is more similar to the maximum concentration than to the null one.
- In order to obtain standardized fingerprints, the inventors first optimized the protocols. All experiments were carried out using the C. albicans susceptible reference strain, ATCC 90028 (Methods). The influence of starting inoculum, the concentration of yeast cells in the sample to be analyzed and thus the minimum culturing time required, on the quality and reproducibility of the fingerprint reproducibility were assessed. This allowed establishing that optimal results are obtained from cultures initiated with 106 yeasts/ml.
- The inventors then determined the effect that varying concentrations of FCZ (serial dilution from 128 to 0.125 µg/ml) would have on C. albicans mass spectrometry fingerprint patterns (Methods).
- The yeast cell pellets obtained from cultures grown for 15 h were subjected to acid extraction and the supernatants analyzed by MALDI-TOF MS. A typical result is presented in
Fig. 1 where the mass spectrometry spectra of the DSY2260 clinical C. albicans strain (FCZ MIC = 8 µg/ml) from cultures exposed to serial FCZ dilutions are shown. For this strain, the mass spectrometry spectra from cultures exposed up to 2 µg/ml FCZ are indistinguishable from those observed for the control culture. Conversely, the spectra deviate from the control in a detectable and quantifiable manner (through gain or loss of spectra) in the cultures exposed to 4 µg/ml and upwards (Fig. 2 and3 ). - Accordingly, these observations led the inventors to formulate a new endpoint, namely the minimal profile change concentration (MPCC), a value defined as the lowest drug (FCZ in the experiment above) concentration at which a mass spectrum profile change can be detected.
- Besides, the inventors have further devised a novel statistical approach to calculate this value objectively (Methods), which is based on the mass and intensity of each peak in the fingerprints. In this statistical analysis, the discrepancies between the mass spectra at the two extreme conditions (128 µg/ml FCZ and no FCZ) are first defined. Then, the similarity to each of the two "extreme" spectra is statistically evaluated for the spectrum recorded at each of the different intermediate FCZ concentrations, to yield a classification of "nearer to the 128 µg/ml" or "nearer to the FCZ negative" spectrum.
- The validity of the new methodology above was established as follows. The MPCC of the reference strain (C. albicans ATCC 90028, MIC = 0.25 µg/ml) was determined, as well as that of sixteen C. albicans isolates with distinct drug resistance profiles. Eight are known to have low-MICs (range 0.125 to 8 µg/ml) and the other eight have high-MICs (
range 16 to 128 µg/ml) to FCZ, these MICs having been determined by the CLSI standard method. In addition, the FCZ-resistant strains tested are representative of the different resistance mechanisms, mating types and clades15 that are found in C. albicans (Table 1). - Comparison of MPCCs with the MICs for the 17 strains above (
Fig. 4 and Table 1) revealed a very high degree of concordance, with full agreement for 94% and 100% of the strains, depending on whether concordance was scored as +/-1 or within +/- 2 drug dilution values, respectively. A cut-off set at +/- 2 drug dilution values is the maximum accepted discrepancy for agreement in comparison conducted between antifungal susceptibility testing methods (Espinel-Ingroff et al. J. Clin Microbiol 43, 3884-3889 (2005)). - Importantly, the MPCC determinations were concordant and accurate irrespective of the type of drug resistance mechanism (ERG11 mutations, TAC mutation, CDR1/2 or MDR hyper-expression), the mating type, or the clade to which the different strains tested belonged. These results not only validate the new methodology, but also offer strong indication of the robustness of the methodology present in the face of C. albicans strains with diverse genetic backgrounds.
- As it stands, where a mass spectrometer is already available, the running costs for each sample analyzed by the method presented here is slightly less than 1 Euro, which compares quite favourably with the higher costs of all other methods. The diagnostic profile shift observed for FCZ does not vary with either the genetic background of the strain tested, nor the level or mechanism of the resistance to FCZ. Accordingly, it is likely that a characteristic profile would be associated with each of the different classes of drugs known to inhibit a given pathogen (e.g. triazoles echinocandins, polyene, and antimetabolites for C. albicans). The present methodology appears to be suitable for monitoring the emergence of resistance to drugs used against pathogenic organisms, including bacteria and eukaryotic cancer cells or pathogens such as Cryptosporidium and Plasmodium.

Claims (16)
- A method for determining the susceptibility of a cell strain to a compound intended for controlling the growth of said cell strain, comprising:- growing the cell strain in a first compound-free culture medium and in at least a second culture medium comprising the compound at a test concentration;- obtaining mass-spectrometry spectra for a protein extract of the cell strain grown in the first culture medium and for a protein extract of the cell strain grown in the second culture medium;- comparing the mass spectrometry spectra;- deducing that the cell strain is susceptible to the compound at the test concentration if the mass spectrometry spectra are significantly different.
- The method according to claim 1, wherein the cell strain is a tumour cell strain or a microorganism strain.
- The method according to claim 1 or 2, wherein the cell strain is a microorganism strain selected from the group constituted of a bacterial strain, a fungus strain, a protozoan strain, and an algae strain.
- The method according to any of claims 1 to 3, wherein the cell strain is a yeast strain.
- The method according to any of claims 1 to 4, wherein the cell strain is a Candida strain.
- The method according to any of claims 1 to 5, wherein the cell strain is a Candida strain selected from a Candida albicans strain, a Candida glabrata strain, a Candida tropicalis strain, a Candida parapsilosis strain, a Candida kefyr strain, a Candida krusei strain, a Candida dubliniensis strain, a Candida guillermondii strain and a Candida lusitaniae strain.
- The method according to claim 1 to 6, wherein the cell strain is a Candida albicans strain.
- The method according to any of claims 1 to 7, wherein the compound is an antifungal compound.
- The method according to any of claims 1 to 8, wherein the compound is an antifungal azole compound selected from the group constituted of fluconazole, ketoconazole, itraconazole, voriconazole, posaconazole, isavuconazole, and ravuconazole.
- The method according to any of claims 1 to 9, wherein the compound is fluconazole.
- The method according to any of claims 1 to 10, wherein mass spectrometry is carried out by MALDI-TOF.
- The method according to any of claims 1 to 11, wherein the protein extract is obtained by an ethanol treatment of grown cells followed by a treatment with a mixture of formic acid and acetonitrile.
- The method according to any of claims 1 to 12, wherein the culture medium is a minimum medium.
- The method according to any of claims 1 to 13, wherein the cell strain is grown during 16 hours.
- The method according to any of claims 1 to 14, wherein the cell strain is grown in several culture media with increasing test concentrations of the compound, and the minimal concentration of the compound yielding a mass-spectrometry spectrum detectably different from the mass-spectrometry spectrum obtained from the cell-extract of the microorganism strain grown in the compound free culture medium is determined.
- The method according to claim 15, wherein determining the minimal concentration comprises:- obtaining a mass spectrometry spectrum from a protein extract of the cell strain grown in the culture medium having the highest test concentration of the several culture media;- comparing the mass spectrometry spectra obtained from protein extracts of the several culture media to (i) the mass spectrometry spectrum from a protein extract of the cell strain grown in the culture medium having the highest test concentration and (ii) the mass spectrometry spectrum from the compound-free culture medium;- selecting the mass spectrometry spectrum obtained from a protein extract of the several culture media with the lowest compound concentration and which presents more similarity with the mass spectrometry spectrum (i) than with the mass spectrometry spectrum (ii);
the lowest compound concentration being the minimal concentration to be determined.
Priority Applications (4)
| Application Number | Priority Date | Filing Date | Title |
|---|---|---|---|
| EP09305601A EP2267459A1 (en) | 2009-06-25 | 2009-06-25 | Method for determining the susceptibility of a cell strain to drugs |
| PCT/EP2010/059101 WO2010149784A1 (en) | 2009-06-25 | 2010-06-25 | Method for determining the susceptibility of a cell strain to drugs |
| US13/380,796 US20120276577A1 (en) | 2009-06-25 | 2010-06-25 | Method for Determining the Susceptibility of a Cell Strain to Drugs |
| EP10726119A EP2446273A1 (en) | 2009-06-25 | 2010-06-25 | Method for determining the susceptibility of a cell strain to drugs |
Applications Claiming Priority (1)
| Application Number | Priority Date | Filing Date | Title |
|---|---|---|---|
| EP09305601A EP2267459A1 (en) | 2009-06-25 | 2009-06-25 | Method for determining the susceptibility of a cell strain to drugs |
Publications (1)
| Publication Number | Publication Date |
|---|---|
| EP2267459A1 true EP2267459A1 (en) | 2010-12-29 |
Family
ID=41059543
Family Applications (2)
| Application Number | Title | Priority Date | Filing Date |
|---|---|---|---|
| EP09305601A Withdrawn EP2267459A1 (en) | 2009-06-25 | 2009-06-25 | Method for determining the susceptibility of a cell strain to drugs |
| EP10726119A Withdrawn EP2446273A1 (en) | 2009-06-25 | 2010-06-25 | Method for determining the susceptibility of a cell strain to drugs |
Family Applications After (1)
| Application Number | Title | Priority Date | Filing Date |
|---|---|---|---|
| EP10726119A Withdrawn EP2446273A1 (en) | 2009-06-25 | 2010-06-25 | Method for determining the susceptibility of a cell strain to drugs |
Country Status (3)
| Country | Link |
|---|---|
| US (1) | US20120276577A1 (en) |
| EP (2) | EP2267459A1 (en) |
| WO (1) | WO2010149784A1 (en) |
Cited By (1)
| Publication number | Priority date | Publication date | Assignee | Title |
|---|---|---|---|---|
| WO2013182647A3 (en) * | 2012-06-06 | 2014-04-10 | Idmic Sa | Method for detecting susceptibility of microorganisms to chemical agents |
Families Citing this family (4)
| Publication number | Priority date | Publication date | Assignee | Title |
|---|---|---|---|---|
| AU2013267976B2 (en) * | 2012-05-29 | 2016-06-02 | Biodesix, Inc. | Deep-MALDI TOF mass spectrometry of complex biological samples, e.g., serum, and uses thereof |
| WO2020083486A1 (en) * | 2018-10-24 | 2020-04-30 | Universität Heidelberg | Phenotypic profiling by mass spectrometry and machine learning |
| CN114933972B (en) * | 2021-12-21 | 2024-01-30 | 中国医学科学院皮肤病医院(中国医学科学院皮肤病研究所) | Candida otophylla and application thereof in construction of fluconazole single drug resistance model |
| CN115044478B (en) * | 2021-12-21 | 2024-01-09 | 中国医学科学院皮肤病医院(中国医学科学院皮肤病研究所) | Candida otophylla capable of being used for constructing fluconazole single-drug resistance model and application of candida otophylla in construction of fluconazole single-drug resistance model |
Citations (1)
| Publication number | Priority date | Publication date | Assignee | Title |
|---|---|---|---|---|
| US20080009029A1 (en) * | 2006-05-09 | 2008-01-10 | Bruker Daltonik Gmbh | Mass spectrometric measurement of microbial resistances |
Family Cites Families (1)
| Publication number | Priority date | Publication date | Assignee | Title |
|---|---|---|---|---|
| AR052559A1 (en) * | 2005-01-21 | 2007-03-21 | Astex Therapeutics Ltd | PIRAZOL DERIVATIVES TO INHIBIT CDK'S AND GSK'S |
-
2009
- 2009-06-25 EP EP09305601A patent/EP2267459A1/en not_active Withdrawn
-
2010
- 2010-06-25 EP EP10726119A patent/EP2446273A1/en not_active Withdrawn
- 2010-06-25 WO PCT/EP2010/059101 patent/WO2010149784A1/en not_active Ceased
- 2010-06-25 US US13/380,796 patent/US20120276577A1/en not_active Abandoned
Patent Citations (1)
| Publication number | Priority date | Publication date | Assignee | Title |
|---|---|---|---|---|
| US20080009029A1 (en) * | 2006-05-09 | 2008-01-10 | Bruker Daltonik Gmbh | Mass spectrometric measurement of microbial resistances |
Non-Patent Citations (14)
| Title |
|---|
| COOMBES KR; BAGGERLY KA; MORRIS JS: "Fundamentals of Data Mining in Genomics and Proteomics", 2007, KLUWER, article "Pre-Processing Mass Spectrometry Data", pages: 79 - 99 |
| ESPINEL-INGROFF ET AL., J CLIN MICROBIOL, vol. 43, 2005, pages 3884 - 3889 |
| ESPINEL-INGROFF ET AL., J. CLIN MICROBIOL, vol. 43, 2005, pages 3884 - 3889 |
| LASS-FLORL ET AL., ANTIMICROB AGENTS CHEMOTHER, vol. 52, 2008, pages 3637 - 3641 |
| MARINACH C: "MALDI_TOF MS- based drug susceptibility testing of pathogens: the example of Candida albicans and fluconazole", PROTEOMICS, 11 September 2009 (2009-09-11), XP002546915, Retrieved from the Internet <URL:http://www3.interscience.wiley.com/cgi-bin/fulltext/122596015/PDFSTART> [retrieved on 20090922] * |
| MILLI A; CECCONI D; CAMPOSTRINI N; TIMPERIO A M; ZOLLA L; RIGHETTI S C; ZUNINO F; PEREGO P; BENEDETTI V; GATTI L; ODREMAN F; VINDI: "A proteomic approach for evaluating the cell response to a novel histone deacetylase inhibitor in colon cancer cells", BIOCHIMICA ET BIOPHYSICA ACTA (BBA) - PROTEINS & PROTEOMICS, ELSEVIER, vol. 1784, no. 11, 1 November 2008 (2008-11-01), pages 1702 - 1710, XP025573583, ISSN: 1570-9639, [retrieved on 20080504] * |
| NIIMI M; NAGAI Y; NIIMI K; WADA S-I; CANNON R D; UEHARA Y; MONK B C: "Identification of two proteins induced by exposure of the pathogenic fungus Candida glabrata to fluconazole", JOURNAL OF CHROMATOGRAPHY B: BIOMEDICAL SCIENCES & APPLICATIONS, ELSEVIER, AMSTERDAM, NL, vol. 782, no. 1-2, 25 December 2002 (2002-12-25), pages 245 - 252, XP004394229, ISSN: 1570-0232 * |
| OSTROSKY-ZEICHNER L; REX J H; PAPPAS P G; HAMILL R J; LARSEN R A; HOROWITZ H W; POWDERLY W G; HYSLOP N; KAUFFMAN C A; CLEARY J; MA: "Antifungal susceptibility survey of 2,000 bloodstream Candida isolates in the United States", ANTIMICROBIAL AGENTS AND CHEMOTHERAPY 20031001 US, vol. 47, no. 10, 1 October 2003 (2003-10-01), pages 3149 - 3154, XP002546914, ISSN: 0066-4804 * |
| PFALLER M A; DIEKEMA D J; SHEEHAN D J: "Interpretive breakpoints for fluconazole and Candida revisited: a blueprint for the future of antifungal susceptibility testing", CLINICAL MICROBIOLOGY REVIEWS, vol. 19, no. 2, April 2006 (2006-04-01), pages 435 - 447,CP3,CP, XP002546913, ISSN: 0893-8512 * |
| REVANKAR ET AL., J CLIN MICROBIOL, vol. 36, 1998, pages 153 - 156 |
| REX ET AL., LIN MICROBIOL REV, vol. 14, 2001, pages 643 - 658 |
| RM SIMON ET AL.: "Design and Analysis of DNA Microarray Investigations", 2003, SPRINGER, pages: 68 |
| RODRIGUEZ-TUDELA. ET AL., J CLIN MICROBIOL, vol. 45, 2007, pages 109 - 111 |
| TONG AIPING; ZHANG HAIYUAN; LI ZHENGYU; GOU LANTU; WANG ZHI; WEI HAIYAN; TANG MINGHAI; LIANG SHUFANG; CHEN LIJUAN; HUANG CANHUA; W: "Proteomic analysis of liver cancer cells treated with suberonylanilide hydroxamic acid.", CANCER CHEMOTHERAPY AND PHARMACOLOGY APR 2008, vol. 61, no. 5, April 2008 (2008-04-01), pages 791 - 802, XP002546917, ISSN: 0344-5704 * |
Cited By (3)
| Publication number | Priority date | Publication date | Assignee | Title |
|---|---|---|---|---|
| WO2013182647A3 (en) * | 2012-06-06 | 2014-04-10 | Idmic Sa | Method for detecting susceptibility of microorganisms to chemical agents |
| US9376705B2 (en) | 2012-06-06 | 2016-06-28 | Idmic Sa | Method for detecting susceptibility of microorganisms to chemical agents |
| EA028467B1 (en) * | 2012-06-06 | 2017-11-30 | Идмик Са | Method for detecting susceptibility of microorganisms to chemical agents |
Also Published As
| Publication number | Publication date |
|---|---|
| WO2010149784A1 (en) | 2010-12-29 |
| EP2446273A1 (en) | 2012-05-02 |
| US20120276577A1 (en) | 2012-11-01 |
Similar Documents
| Publication | Publication Date | Title |
|---|---|---|
| Panda et al. | MALDI-TOF mass spectrometry for rapid identification of clinical fungal isolates based on ribosomal protein biomarkers | |
| US20220412988A1 (en) | Mass spectrometric identification of microorganisms in complex samples | |
| Kordalewska et al. | Identification of drug resistant Candida auris | |
| Prakash et al. | Evidence of genotypic diversity among Candida auris isolates by multilocus sequence typing, matrix-assisted laser desorption ionization time-of-flight mass spectrometry and amplified fragment length polymorphism | |
| Marinach‐Patrice et al. | Use of mass spectrometry to identify clinical Fusarium isolates | |
| Bader | MALDI‐TOF‐MS‐based species identification and typing approaches in medical mycology | |
| De Carolis et al. | Application of MALDI-TOF mass spectrometry in clinical diagnostic microbiology | |
| Šedo et al. | Improvement of MALDI-TOF MS profiling for the differentiation of species within the Acinetobacter calcoaceticus—Acinetobacter baumannii complex | |
| Welker et al. | Applications of whole-cell matrix-assisted laser-desorption/ionization time-of-flight mass spectrometry in systematic microbiology | |
| Yaman et al. | Evaluation of the MALDI TOF-MS method for identification of Candida strains isolated from blood cultures | |
| Rosenvinge et al. | Performance of matrix‐assisted laser desorption‐time of flight mass spectrometry for identification of clinical yeast isolates | |
| EP2354796B1 (en) | Multi-stage search for microbe mass spectra in reference libraries | |
| Bao et al. | Rapid, accurate identification of Candida auris by using a novel matrix-assisted laser desorption ionization–time of flight mass spectrometry (MALDI-TOF MS) database (library) | |
| Usbeck et al. | Optimization of experimental and modelling parameters for the differentiation of beverage spoiling yeasts by Matrix-Assisted-Laser-Desorption/Ionization–Time-of-Flight Mass Spectrometry (MALDI–TOF MS) in response to varying growth conditions | |
| Stübiger et al. | Characterization of yeasts and filamentous fungi using MALDI lipid phenotyping | |
| Touchard et al. | Elucidation of the unexplored biodiversity of ant venom peptidomes via MALDI–TOF mass spectrometry and its application for chemotaxonomy | |
| de Almeida Júnior et al. | Usefulness of matrix‐assisted laser desorption ionisation–time‐of‐flight mass spectrometry for identifying clinical T richosporon isolates | |
| US20120276577A1 (en) | Method for Determining the Susceptibility of a Cell Strain to Drugs | |
| US11053533B2 (en) | Identification of methicillin resistant Staphylococcus aureus (MRSA) | |
| WO2014187517A1 (en) | Mass-spectrometric resistance determination by growth measurement | |
| Böhme et al. | Comparative analysis of protein extraction methods for the identification of seafood-borne pathogenic and spoilage bacteria by MALDI-TOF mass spectrometry | |
| Gutiérrez et al. | Wine yeasts identification by MALDI-TOF MS: Optimization of the preanalytical steps and development of an extensible open-source platform for processing and analysis of an in-house MS database | |
| Santos et al. | MALDI mass spectrometry imaging and in situ microproteomics of Listeria monocytogenes biofilms | |
| Mclean et al. | Rapid and robust analytical protocol for E. coli STEC bacteria subspecies differentiation using whole cell MALDI mass spectrometry | |
| Feng et al. | Effective discrimination of Yersinia pestis and Yersinia pseudotuberculosis by MALDI-TOF MS using multivariate analysis |
Legal Events
| Date | Code | Title | Description |
|---|---|---|---|
| PUAI | Public reference made under article 153(3) epc to a published international application that has entered the european phase |
Free format text: ORIGINAL CODE: 0009012 |
|
| AK | Designated contracting states |
Kind code of ref document: A1 Designated state(s): AT BE BG CH CY CZ DE DK EE ES FI FR GB GR HR HU IE IS IT LI LT LU LV MC MK MT NL NO PL PT RO SE SI SK TR |
|
| AX | Request for extension of the european patent |
Extension state: AL BA RS |
|
| 17P | Request for examination filed |
Effective date: 20110620 |
|
| 17Q | First examination report despatched |
Effective date: 20110722 |
|
| STAA | Information on the status of an ep patent application or granted ep patent |
Free format text: STATUS: THE APPLICATION IS DEEMED TO BE WITHDRAWN |
|
| 18D | Application deemed to be withdrawn |
Effective date: 20120103 |